Embed Size (px)
Citation preview
Department of Entrepreneurship, Supply Chain, Transport,
Tourism and Logistics Management
University of South Africa
Pretoria
Compiler: Ms A Badenhorst
Revised by Mrs S L Jansen van Rensburg
© 2016 University of South Africa
All rights reserved
Printed and published by the University of South Africa Muckleneuk, Pretoria
TRL2604/MO001/4/2017
70498539
iii
page
vi
1
Study unit
PREFACE
PART 1: CONCEPTUAL FRAMEWORK FOR LOGISTICS
1 BASIC CONCEPTS AND GOAL OF LOGISTICS 2
2
3
4
6
6
7
9
10
11
1.1 INTRODUCTION
1.2 LOGISTICS AND THE SUPPLY CHAIN
1.3 LOGISTICS
1.4 LOGISTICAL COMPETENCY
1.5 THE LOGISTICAL MISSION
1.6 LOGISTICAL TRADE-OFFS
1.7 SUMMARY
1.8 SELF-ASSESSMENT QUESTIONS
PART 2: INTERNAL LOGISTICS INTEGRATION
2 BASIC LOGISTICS ACTIVITIES (NETWORK DESIGN, INFORMATION AND TRANSPORT) 12
12
12
1819
27
2.1 INTRODUCTION
2.2 NETWORK DESIGN
2.3 INFORMATION
2.4 TRANSPORTATION
2.5 SUMMARY
2.6 SELF-ASSESSMENT QUESTIONS 27
3 BASIC LOGISTICS ACTIVITIES (INVENTORY AND WAREHOUSING) _______________________________29
29
3741
3.1 INVENTORY
3.2 WAREHOUSING, MATERIALS HANDLING AND PACKAGING
3.3 SUMMARY
3.4 SELF-ASSESSMENT QUESTIONS 41
4 FRAMEWORK FOR INTEGRATING LOGISTICS OPERATIONS_____________________________________45
45
48
49
50
4.1 INTEGRATED LOGISTICS
4.2 OPERATIONAL OBJECTIVES
4.3 BARRIERS TO INTERNAL INTEGRATION
4.4 SUMMARY
4.5 SELF-ASSESSMENT QUESTIONS 50
CONTENTS
TRL2604/001/4/2017
iv
5 LOGISTICS PERFORMANCE CYCLES ________________________________________________________51
51
52
54
55
5.1 LOGISTICS PERFORMANCE CYCLES AS A BASIS FOR INTEGRATION
5.2 PERFORMANCE CYCLES WITHIN EACH LOGISTICS COMPONENT
5.3 MANAGING OPERATIONAL UNCERTAINTY
5.4 SUMMARY
5.5 SELF-ASSESSMENT QUESTIONS 55
6 CUSTOMER ACCOMMODATION __________________________________________________________57
57
58
60
61
63
64
6.1 THE LOGISTICS/MARKETING INTERFACE
6.2 CUSTOMER-FOCUSED MARKETING
6.3 CUSTOMER SERVICE
6.4 CUSTOMER SATISFACTION
6.5 CUSTOMER SUCCESS
6.6 SUMMARY
6.7 SELF-ASSESSMENT QUESTIONS 64
7 CUSTOMER SERVICE COSTS AND EFFICIENCY _______________________________________________66
66
67
68
70
71
72
77
7.1 INTRODUCTION
7.2 THE SERVICE LEVEL/COST RELATIONSHIP
7.3 CUSTOMER SERVICE COSTS
7.4 THE COST OF LOST SALES
7.5 TRADE-OFF BETWEEN COSTS AND BENEFITS OF CUSTOMER SERVICE
7.6 CUSTOMER SERVICE EFFICIENCY
7.7 SUMMARY
7.8 SELF-ASSESSMENT QUESTIONS 77
8 LOGISTICS REQUIREMENT PLANNING _____________________________________________________78
78
79
80
81
82
83
83
88
8.1 WHAT IS LOGISTICS REQUIREMENT PLANNING (LRP)?
8.2 DEPENDENT AND INDEPENDENT DEMAND
8.3 THE SCOPE OF LRP
8.4 VARIABLES REQUIRED FOR IMPLEMENTING LRP
8.5 PROCEDURE FOR IMPLEMENTING LRP
8.6 ADVANTAGES OF LRP
8.7 PRACTICAL APPLICATION OF LRP
8.8 SUMMARY
8.9 SELF-ASSESSMENT QUESTIONS 88
PART 3: EXTERNAL LOGISTICS INTEGRATION 89
9 SUPPLY CHAIN INTEGRATION ___________________________________________________________ 90
90 9.1 INTRODUCTION
9.2 SUPPLY CHAIN COMPETITIVENESS 91
v
91
92
93
95
9.3 RISK, POWER AND LEADERSHIP
9.4 SUPPLY CHAIN RELATIONSHIPS
9.5 SUPPLY CHAIN INTEGRATIVE FRAMEWORK
9.6 SUMMARY
9.7 SELF-ASSESSMENT QUESTIONS 95
10 GLOBAL SUPPLY CHAIN INTEGRATION ____________________________________________________96
96
96
97
98 100
10.1 INTRODUCTION
10.2 GLOBAL ECONOMIES
10.3 GLOBAL SUPPLY CHAIN INTEGRATION
10.4 MANAGING THE GLOBAL SUPPLY CHAIN
10.5 SUMMARY
10.6 SELF-ASSESSMENT QUESTIONS 100
11 INTERNATIONAL TRADE TERMS _________________________________________________________101
101
101
102
104
104
11.1 INTRODUCTION
11.2 ORGANISATION OF INCOTERMS 2010
11.3 DESCRIPTION OF INCOTERMS 2010
11.4 NOTES ON INCOTERMS 2010
11.5 SUMMARY
BIBLIOGRAPHY 109
TRL2604/001/4/2017

vii
INTEGRATED LOGISTICS
1 PURPOSE OF THIS MODULE
The purpose of this module is to provide you with the knowledge and skills of logistics. This, in turn, will enable
you to make a positive contribution to the integration of internal processes in a firm and the total supply chain,
thus making it possible to meet customer requirements at the lowest possible total logistics cost.
2 LEARNING OUTCOMES
Learning outcomes are provided at the beginning of each study unit. These outcomes can be summarised in
the following five outcomes:
Outcome
You should be able to explain the theoretical concepts and mission of logistics.
Range
Logistics, supply chain, supply chain management, lowest total costs, logistical competency, trade-offs and
goal of logistics
Outcome
You should be able to contribute to minimising total logistics costs by integrating internal logistics operations
as a result of your understanding of the integration between logistics activities and the coordination of
logistics components.
Range
Interaction between network design, information, transport, inventories and warehousing and coordination of
customer accommodation, manufacturing support and procurement
PREFACE
LEARNING OUTCOME 1
LEARNING OUTCOME 2
TRL2604/001/4/2017
viii
Outcome
You should be able to contribute to minimising total logistics costs by integrating logistics and other functions
and processes in a company.
Range
Integration between logistics and marketing (including customer accommodation) and production (operations)
Outcome
You should be able to contribute to domestic supply chain integration and competitive advantage by making
recommendations about collaboration and supply chain relationships.
Range
Types of arrangements with supply chain participants (suppliers, manufacturers, wholesalers, retailers and
service providers); developing a framework for collaboration; and identifying capabilities and competencies
essential to integrating supply chain logistics
Outcome
You should be able to contribute to international supply chain integration by understanding the logistical
implications of global operations and international trade terms.
Range
Different perspectives (national perspective/stateless enterprise) of globalisation, logistics implications of
these levels of global involvement; managing global supply chains; and Incoterms 2010
3 THE PLACE OF THIS MODULE IN UNDERGRADUATE STUDIES
Undergraduate degrees in the Faculty of Economic and Management Sciences provide graduates with a wide
range of knowledge and skills that will equip them to work in the business community. If you wish to major or
specialise in logistics, you need to learn about all the activities and processes that are required to move and
position inventory in the supply chain. Note that the supply chain is merely an alignment of firms that bring
products or services to the market. As such, the supply chain consists of suppliers, manufacturers, wholesalers,
retailers and logistics service providers. Integrated logistics is about integrating these processes in a way that
minimises total logistics costs, thus enabling a firm or collaborating supply chain to gain a competitive
advantage. This module (TRL2604) provides the basic knowledge and skills for such integration.
This module also lays the foundation for further studies in logistics. Students who have completed this module
will probably continue their studies in Logistics Activities (TRL3707), Logistics Systems (TRL3708) and Logistics
LEARNING OUTCOME 3
LEARNING OUTCOME 4
LEARNING OUTCOME 5
Strategy (TRL3709). Majoring or specialising in logistics also makes it possible for you to engage in
postgraduate studies in logistics (i.e. an honours degree, master’s degree and, ultimately, a doctorate).
This module supports the following outcomes of the generic BCom degree:
Apply general business principles to real-life situations.
Interpret the economic realities of the local community.
Manage organisational resources (financial, human and raw materials).
Manage information appropriately.
Relate knowledge and the contribution of knowledge to the development of different cultures.
Address society’s socioeconomic needs.
The module will also help you to achieve the following critical cross-field outcomes as formulated by SAQA:
Identify and solve problems in a way that demonstrates a responsible decision making ability using
critical and creative thinking.
Work effectively with others as a member of a team, group, organisation or community.
Collect, analyse, organise and critically evaluate information.
Demonstrate an understanding of the world as a set of related systems by recognising that problem
solving contexts do not exist in isolation.
Develop entrepreneurial opportunities.
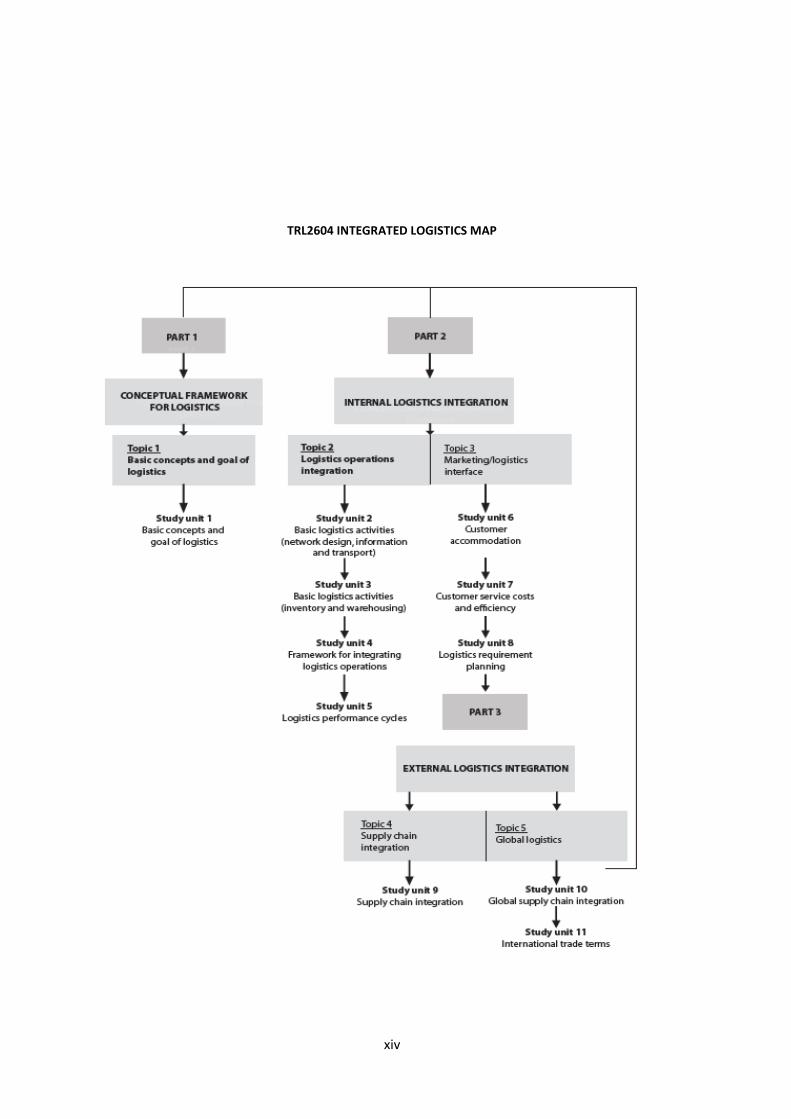
4 STRUCTURE OF THE STUDY GUIDE
The study guide consists of three parts which are divided into topics and study units, as shown in the module
map. Part 1 serves as an introduction in which the conceptual framework for logistics is provided. Part 2 deals
with the integration of activities and management functions in a single enterprise, while part 3 extends the
integration of logistics activities both domestically and internationally, where specialised activities of various
firms are integrated in total supply chain management.
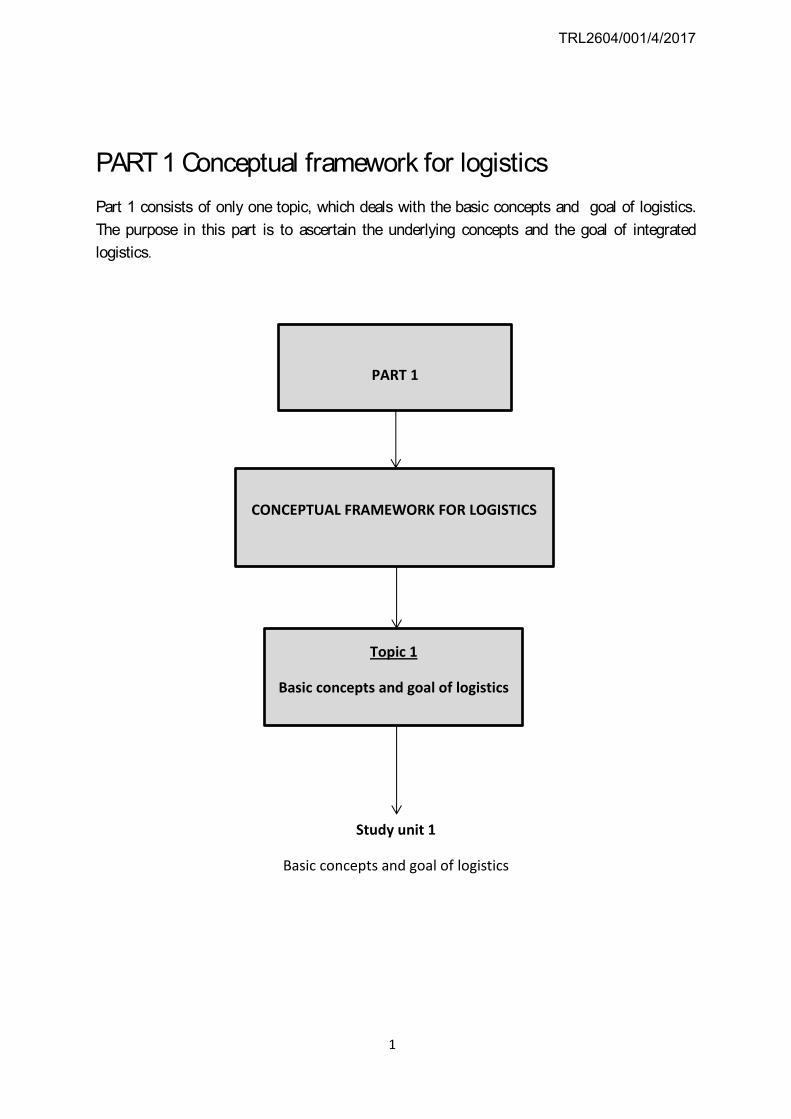
Part 1
Part 1 consists of only one topic, which deals with the basic concepts and goal of logistics. The purpose is to
ascertain the underlying concepts and goal of integrated logistics.
Part 2
The purpose of part 2 is to teach you how logistics integration can be effected through cross-functional
coordination. This is done by focusing, firstly, on the integration of various logistics activities, and secondly, on
the relationship between logistics, marketing and production in a specific firm. Part 2 consists of two topics.
Topic 2, which deals with logistics operations integration, focuses on integrating logistics activities, on the one
hand, and integrating customer accommodation, manufacturing support and procurement in a single
enterprise, on the other. Topic 3, which focuses on the marketing/logistics interface shows that effective and
efficient logistics can serve as a core strategic marketing competency. It emphasises the importance, costs and
benefits of customer service and indicates how logistics costs can be minimised through logistics requirement
planning.
Part 3
The purpose of part 3 is to teach you how logistics integration can be affected externally through effective
channel structures and relationships with other role players in the total supply chain, both domestically and
globally. Part 3 also consists of two topics. Topic 4 deals with the integration of the total supply chain, where
ix
TRL2604/001/4/2017
the various role players (middlemen) and logistics service suppliers are identified and the relationships
between these role players are investigated. Topic 5 explores the extension of integrated logistics operations
to international markets. We will discuss the distinct differences between domestic and international
operations and the implications of these for logistics. The topic ends with a brief summary of the new
international trade terms (Incoterms 2010) used in global logistics operations.
As indicated, a distinction is made between internal integration (topic 2) and external integration (topic 3). As
you will see, however, it is not always possible to clearly separate internal activities from external activities,
because certain concepts apply both to an individual firm and to the total supply chain.
5 RESOURCES YOU WILL NEED
The prescribed material for this module consists of this study guide, Tutorial Letter 101 (which you should have
received when you registered) and the following prescribed book:
Bowersox, DJ., Closs, DJ., Cooper, MB & Bowersox, JC. 2013. Supply chain logistics management. New York:
McGraw-Hill.
Although not compulsory, it might be worthwhile to subscribe to a local logistics magazine or journal such as
Logistics News to gain more insight into the principles studied in this module. Journals also tend to publish
articles on the practical application of logistics principles – this, too, makes them worth reading.
You will also need to visit the myUnisa site for this module at least once a week. This site provides a forum on
which you can discuss module content and questions with fellow students and your lecturer. If you are unable
to go online, we suggest you form a study group in your area where you can do the myUnisa activities
provided in this study guide.
6 GUIDELINES ON STUDYING THIS MODULE
6.1 Time frame for studies
The module for Integrated Logistics consists of three main parts, as indicated in the module map. Each part is
divided into one or two main topics, and each topic is further divided into study units. When we developed this
module, we planned each of the study units in such a way that each study unit contains study material which
you should be able to master in one week of study. This means that you can plan your studies for the semester
by trying to complete one study unit per week. This will leave you sufficient time for revision and to thoroughly
prepare for the examination.
6.2 Learning outcomes
Each study unit begins with a purpose statement and learning outcomes to give you an indication of what you
should be able to do once you have studied the particular study unit.
6.3 Activities
In each study unit, there are a number of activities which you must do. Most of these activities involve
studying the prescribed book and/or interpreting the study material. The activities will help you to master the
study material, and to apply it in practice, thereby enabling you to achieve the outcomes for the study unit.
Many of the questions asked in the activities are similar to the sort of questions you will be asked in the
examination.
x
6.4 Self-assessment questions
Each study unit ends with self-assessment questions which you must be able to answer. These are aimed at
finding out whether you have achieved the purpose for and outcomes for the study unit and are of particular
importance for examination preparation. Also, refer to the section on assessment of the module (see below).
6.5 How to use the study guide and prescribed book
You should regard the study guide as your “tutor” and you should make a point of following the instructions
given in the study guide. This includes instructions on how and what to study in the prescribed book. You
should study the relevant sections in the book only when instructed to do so. You will get lost if you start
studying the book without “listening” to your “tutor”! You will find that certain sections or chapters of the
book do not form part of the compulsory study material. You will also find that you are sometimes instructed
to study material later in the book and then return to previous sections. This is not an error in the study guide;
we have done this deliberately, to make you follow the sequencing of the module content and to help you
achieve the purpose of and outcomes for of each study unit.
6.6 Develop an understanding of the concepts and ideas
To achieve the purpose of and outcomes for this module, you need to develop a deep understanding of
important concepts and learn how to apply them in real-life situations. To develop your understanding, you
have to deliberately process the information you are reading. As you read, you have to try to identify the main
ideas, think about why they are important, think about how these important ideas are interrelated, and think
about the implications of these ideas for people in the work environment. You can also test your
understanding by trying to summarise the ideas, explain them to other people and find examples of these
ideas “in operation” in real-life situations.
7 ASSESSMENT OF THE MODULE CONTENT
There are three types of assessment for this module: self-assessment questions in the study guide, self-
assessment assignments included in Tutorial Letter 101 and an examination.
7.1 Self-assessment questions
As stated above, each study unit ends with self-assessment questions. These questions are typical of the sort
of questions that you can expect in the examination. If you write down your answer to each of these
questions, you will be able to check your answers and reasoning by referring to the prescribed book. This form
of self-assessment is one of the most effective ways of learning the concepts that we want you to learn in this
module.
7.2 Self-assessment assignments
Tutorial Letter 101 contains two self-assessment assignments. These compulsory assignments are designed to
help you learn and to provide you with feedback.
7.3 The examination
The examination is your opportunity to demonstrate that you have achieved the outcomes for this module. An
example of a previous examination paper will be provided on myUnisa. We will provide more information on
the examination in various tutorial letters that you will receive during the course of your studies.
xi
TRL2604/001/4/2017
7.4 Key terms in assessment
When you assess yourself, or when you have to answer examination questions, make sure that you
understand the following meaning of assessment terms:
List: Write single words.
Define: State the meaning of a word or idea and describe its essential qualities.
Discuss: Identify the issues and argue for and/or against particular viewpoints.
Describe: Give details of the characteristics and features.
Explain: Make something clear; describe cause and effect; make the relationship between things evident;
provide details of why and/or how something occurs.
Compare: Show how certain things are similar to each other.
Contrast: Show how certain things are different from each other.
Analyse: Identify components and the relationship between them; bring out and relate the implications of
something.
Evaluate: Make a judgement based on certain criteria; determine the value of something.
xii
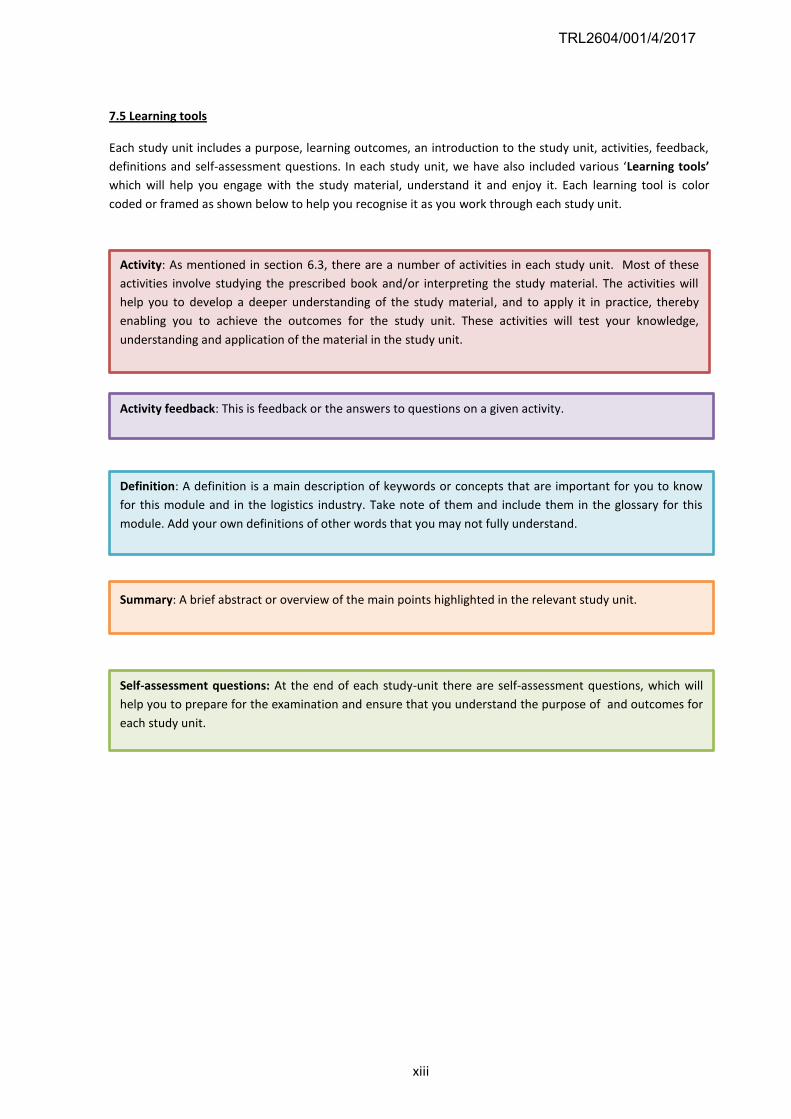
7.5 Learning tools
Each study unit includes a purpose, learning outcomes, an introduction to the study unit, activities, feedback,
definitions and self-assessment questions. In each study unit, we have also included various ‘Learning tools’
which will help you engage with the study material, understand it and enjoy it. Each learning tool is color
coded or framed as shown below to help you recognise it as you work through each study unit.
Activity feedback: This is feedback or the answers to questions on a given activity.
Activity: As mentioned in section 6.3, there are a number of activities in each study unit. Most of these
activities involve studying the prescribed book and/or interpreting the study material. The activities will
help you to develop a deeper understanding of the study material, and to apply it in practice, thereby
enabling you to achieve the outcomes for the study unit. These activities will test your knowledge,
understanding and application of the material in the study unit.
Definition: A definition is a main description of keywords or concepts that are important for you to know
for this module and in the logistics industry. Take note of them and include them in the glossary for this
module. Add your own definitions of other words that you may not fully understand.
Summary: A brief abstract or overview of the main points highlighted in the relevant study unit.
Self-assessment questions: At the end of each study-unit there are self-assessment questions, which will
help you to prepare for the examination and ensure that you understand the purpose of and outcomes for
each study unit.
xiii
TRL2604/001/4/2017
xiv
TRL2604 INTEGRATED LOGISTICS MAP
1
PART 1 Conceptual framework for logistics Part 1 consists of only one topic, which deals with the basic concepts and goal of logistics. The purpose in this part is to ascertain the underlying concepts and the goal of integrated logistics.
Study unit 1
Basic concepts and goal of logistics
PART 1
CONCEPTUAL FRAMEWORK FOR LOGISTICS
Topic 1
Basic concepts and goal of logistics
TRL2604/001/4/2017
2
CONTENTS
1.1 INTRODUCTION
1.2 LOGISTICS AND THE SUPPLY CHAIN
1.3 LOGISTICS
1.4 LOGISTICAL COMPETENCY
1.5 THE LOGISTICAL MISSION
1.6 LOGISTICAL TRADE-OFFS
1.7 SUMMARY
1.8 SELF-ASSESSMENT QUESTIONS
PURPOSE
The purpose of this study unit is to help you understand both the basic concepts underlying integrated logistics
and the purpose of integrated logistics.
OUTCOMES
After working through this study unit, you will be able to
(1) explain the concepts relating to logistics
(2) describe how effective logistics can result in a competitive advantage
(3) discuss how the overall goal of logistics is to achieve a certain level of customer service at the lowest
possible total cost by integrating various functions and activities
1.1 INTRODUCTION
In this study unit we will explain the basic concepts of logistics; these concepts then provide the framework for
the rest of the module. We start by clarifying the relationship between logistics and the supply chain. This is
followed by a comprehensive discussion of the concept of logistics and the goal of integrated logistics. Since
logistics is all about product availability at the lowest total costs, particular attention is given to the concept of
lowest total costs and the trade-offs required to affect the lowest total costs.
STUDY UNIT 1
BASIC CONCEPTS AND GOAL OF LOGISTICS
3
The focus of this module is integrated logistics. However, to study logistics, you must have a basic
understanding of the supply chain and supply chain management. According to the authors of the prescribed
book, Bowersox, Closs, Cooper & Bowersox (2013:4), supply chain management consists of “firms
collaborating to leverage strategic positioning and to improve operating efficiency”.
packaging
ACTIVITY 1.1
Study Bowersox et al (2013:4–7) and then do the following:
(1) Explain to a friend what you understand by the term “supply chain”.
(2) Write a paragraph on the relationship between the supply chain and logistics.
(3) Try to sketch a supply chain model for a sugar manufacturer based on figure 1.1 of Bowersox et al
(2013:7).
DEFINITION
According to the Council of Supply Chain Management Professionals (CSCMP) (2010), supply chain
management “encompasses the planning and management of all activities involved in sourcing and
procurement, conversion, and all logistics management activities. Importantly, it also includes coordination
and collaboration with channel partners, which can be suppliers, intermediaries, third party service
providers, and customers. In essence, supply chain management integrates supply and demand
management within and across companies”.
Stock and Lambert (2001:54) define supply chain as the “alignment of firms that bring products or services
to the market”. The supply chain therefore consists of the key business processes (from original supplier to
end-user) that provide products, services and information which add value for customers and stakeholders
(Stock & Lambert 2001:54).
The CSCMP (2010) defines logistics as follows:
It is the process of planning, implementing and controlling procedures for the efficient and effective
transportation and storage of goods including services, and related information from the point of origin to
the point of consumption for the purpose of conforming to customer requirements. This definition includes
inbound, outbound, internal and external movements.
In a firm’s supply chain management, logistics is the work required to move and geographically position
inventory. Thus logistics is a subset of and occurs within the broader framework of a supply chain. Logistics
is the process that creates value by timing and positioning inventory and it is the combination of a firm’s
order management
inventory
transportation
warehousing
materials handling
packaging
Logistics is therefore concerned with satisfying customer expectations by ensuring that the required
quantity of a particular product (whether in the form of raw materials, semi-finished products or finished
products) is available at the place and time required at the lowest total cost.
1.2 LOGISTICS AND THE SUPPLY CHAIN
TRL2604/001/4/2017
4
It should now be clear that the supply chain consists of various firms and processes involved in the movement
and positioning of goods. These firms and processes are linked in a coordinated unit which functions to ensure
that the goods are available when and where required. Logistics is the actual work required to move and
position inventory throughout a supply chain.
In the case of a sugar manufacturer (the integrated enterprise shown in figure 1.1), the supplier network
would consist of, among other things, farmers (supplying sugar cane), suppliers of other ingredients and
suppliers of packaging material. The distributive network might consist of warehousing and transport
operators and may also include wholesalers and retailers.
Did you notice that efficiency can be improved by effective supply chain management? Supply chain
management involves the collaboration of firms, the aim of which is to exert leverage over strategic
positioning and improve operating efficiency. The integrated supply chain perspective shifts traditional trade
relationships away from groups of independent businesses that buy and sell to each other towards a
managerially coordinated initiative. The purpose of this initiative is to increase overall efficiency and improve
market impact and competitiveness. In part 3 of this module, we will return to supply chain management as it
relates to external logistics integration.
1.3 LOGISTICS
As you know, logistics is about satisfying customer expectations by ensuring that the required quantity of a
particular product (whether in the form of raw materials, semi-finished products or finished products) is
available at the place and time required at the lowest total cost.
Logistics, unlike marketing, operations or human resources management, does not constitute a separate
functional department in a business. Instead, it involves a number of processes or activities that cut across
various functional departments and even other participants in the supply chain.
This brings us to the following key question:
What activities are necessary to move and position inventory throughout a supply chain?
It should now be clear that logistics involves the integration of various activities in order to achieve a particular
level of customer service at the lowest possible total cost.
ACTIVITY 1.2
Before reading any further in this study guide or prescribed book, consider the following:
(1) Do you use sugar in your coffee? Have you ever given any thought to how a packet of sugar ends up in
your house (besides you driving to the shop and buying it)?
(2) List some of the activities you think may have taken place which may have certain cost implications in
order for the sugar to end up in your house. Consider activities such as transporting cane from the farm to a
factory and storing it somewhere so that it is available for the production of sugar.
(3) Now study Bowersox et al (2013:28–29) to obtain greater clarity on what logistics involves.
(4) Check your list of activities in (2) above and add to it if necessary.
FEEDBACK ON ACTIVITY 1.1
5
To return to activity 1.2 in which you considered how a packet of sugar ends up in your home, we could
identify the following activities as the ones most likely to have occurred:
(1) After the cane has been harvested, it has to be stored somewhere by the farmer (inventory and
warehousing).
(2) The cane needs to be transported to the sugar factory (transportation).
(3) It must be stored temporarily at the factory (inventory and warehousing).
(4) Sugar is then produced in the factory (production).
(5) The sugar thus produced has to be packaged, first in individual packets and then in units (cartons and
pallets) for easy handling (packaging).
(6) In the factory, the packages have to be moved from the packaging point to the storage area (materials
handling).
(7) The packaged sugar must be stored while awaiting orders from wholesalers (warehousing and inventory).
(8) Orders have to be placed by wholesalers/retailers and have to be processed by the factory (order
processing based on order information).
(9) Orders have to be made up for specific wholesalers/retailers (order picking and packing).
(10) The consignment has to be transported to the wholesaler/retailer (transportation).
(11) Wholesalers/retailers need to hold stock (warehousing and inventory) and to replenish shelves (materials
handling).
(12) Records have to be kept up to date in order to forecast demand and ensure availability at all points in the
supply chain (information).
During the whole supply process, all role players in the supply chain explained above require information on
how much inventory is required at each particular stage (forecasting based on information).
The relevant costs involved are mainly transport costs, the cost of owning/renting and operating a warehouse,
inventory carrying costs (mostly interest which can be earned if money is not tied up in stock), ordering costs,
the cost of materials handling (the capital costs of equipment as well as human resources costs) and the cost
of information (computers, software, etc).
Perhaps you can now understand why a dairy farmer only receives approximately 50% of the retail price of a
litre of milk!
Bowersox et al (2013:29) formulate the goal of logistics as being “to support procurement, manufacturing and
customer accommodation operational requirements”. Note that the challenge is to coordinate functional
competency into an integrated operation focused on servicing customers. We can therefore conclude that the
overall goal of logistics is to achieve a predetermined or target level of customer service at the lowest total
cost. This goal will be discussed in more detail in section 1.5 below and is emphasised throughout this study
guide. At this stage, however, you should note two important elements of this goal, namely service and cost.
FEEDBACK ON ACTIVITY 1.2
TRL2604/001/4/2017
6
1.4 LOGISTICAL COMPETENCY
Logistics adds value by ensuring that the required quantity of a particular product (whether in the form of raw
materials, semi- finished products or finished products) is available at the place and time required at the
lowest total cost.
In order to gain a competitive advantage, customer value needs to be created. The creation of customer value
depends largely on effective logistics, or, stated differently, logistical competency. Logistical competency is a
relative assessment of the capability of a business to provide superior customer service at the lowest total
cost. Effective logistics requires the integration of various basic work and functional areas, as well as logistical
temporal/spatial integration.
1.5 THE LOGISTICAL MISSION
Earlier we mentioned that service and cost are the major elements of the logistics goal. This brings us to the
following questions:
(1) What do we mean by service?(2) What are lowest total costs?(3) How can lowest total costs be achieved?
To answer these questions, it is necessary to obtain a broader view of the logistical mission.
ACTIVITY 1.3
Study Bowersox et al (2013:29–30) and then do the following:
(1) Write down the meaning of the term “logistical competency”.
(2) Explain to a friend or write down how logistical competency can give a firm a competitive advantage.
FEEDBACK ON ACTIVITY 1.3
ACTIVITY 1.4
Study Bowersox et al (2013:30–33) to obtain an overview of logistics service attributes as well. Then answer
the following questions:
(1) What are the attributes of basic logistics service?
(2) Why, in your opinion, is the total cost concept so important?
DEFINITION
Logistical competency refers to a business’s level of performance with regard to logistics. Superior
logistical performance can be essential for business success, resulting in a competitive advantage.
7
Bowersox et al (2013:30-31) emphasise that basic logistics service defines the level of service a company
provides to all established customers. Particular attention should be given to the customer requirements of
availability, operational performance and service reliability.
The main point to remember about the total cost concept is that the minimisation of costs within each
individual business function or logistics activity can result in a higher total cost than could otherwise be
achieved if the functions or activities were integrated.
It should be clear that the lowest total cost approach requires the integration of various functions and
activities, and that certain trade-offs are necessary. Since the nature of these trade-offs is not clearly spelt out
in your prescribed book, the following section deals with this vital concept.
1.6 LOGISTICAL TRADE-OFFS
1.6.1 The nature of trade-offs
It should be obvious that total cost can be minimised by spending more on packaging which will facilitate
handling. Thus an increase in packaging costs is traded off against a reduction in handling costs in order to
achieve a reduction in total costs.
Although interactivity trade-offs (trade-offs among logistics activities) are the most important and most
obvious form of trade-off, trade-offs can be effected at the following four levels:
(1) interorganisational trade-offs
(2) interfunctional (interdepartmental) trade-offs
(3) interactivity trade-offs
(4) intra-activity trade-offs
FEEDBACK ON ACTIVITY 1.4
DEFINITION
A trade-off is simply a balance between two or more logistics functions to achieve total lowest cost. A
trade-off occurs when an increased cost in one area is more than matched by a cost reduction in other
areas, thus resulting in a lower total cost.
ACTIVITY 1.5
Once again, consider the packet of sugar in your home. What would be cheaper: distributing the packets
of sugar one by one, or packing them into cartons of, say, 25 packets per carton and then consolidating
the cartons into a unit for loading onto pallets? Using the knowledge you have acquired thus far on trade-
offs, justify your answers.
FEEDBACK ON ACTIVITY 1.5
TRL2604/001/4/2017
8
These different levels are discussed below.
1.6.2 Trade-off levels_________________________________________________________________________
1.6.2.1 Interorganisational trade-offs
Interorganisational trade-offs occur mainly when intermediaries are used in the marketing channel. Such
trade-offs involve the selection of wholesalers and retailers in the marketing channel. For example, it may cost
more to make use of various wholesalers, but sales may increase, thus resulting in a better overall position.
Interorganisational trade-offs involve selecting least total cost supply chains. These are mostly chains
comprising different institutions (intermediaries such as wholesalers and retailers or third-party logistics
providers). What is fundamentally important is to use the correct intermediaries.
If no intermediaries were used, there would be
(1) close contact with the marketplace
(2) proper control over key areas such as customer (end-user) service policy
However, the use of intermediaries has the following distinct advantages:
(1) Intermediaries in the channel specialise in particular activities which may result in economies of
specialisation through the division of labour, for example, specialised sales staff.
(2) An intermediary may also achieve economies of scale by means of high volume at high throughput levels.
(Can you imagine what it would cost a sugar producer to sell individual packets of sugar to each household?)
(3) The use of intermediaries results in a reduction in contact costs, which are the costs of the contacts that
need to be made between buyers and sellers in order to distribute a product.
1.6.2.2 Interfunctional (interdepartmental) trade-offs
Interfunctional trade-offs are the trade-offs between different management functions or departments. It may
be necessary for some or all individual functional departments to operate suboptimally in order for the whole
logistics system to minimise total logistics costs.
For example, the marketing manager may have to be prepared to accept a lower level of service or a narrower
product range; the production manager may have to be prepared to schedule shorter runs or to forfeit
economies of scale; and the transport manager may have to be prepared to make more frequent deliveries if
this will contribute to the efficiency of the total logistics system.
1.6.2.3 Interactivity trade-offs
Successful trade-offs among the various logistics activities constitute the most important factor contributing to
the achievement of lowest total cost. The most obvious trade-offs at this level are the following:
a. Warehouse cost/transport cost trade-offs
As an example of such trade-offs, consider a distribution system with ten regional depots. Such a system will
have high warehouse and stockholding costs compared with a system with only one central warehouse, but
the savings on long-haul transport costs and the reduction of stock-outs may more than compensate for the
additional costs involved in the ten-depot system. (Countrywide, delivery costs from one central warehouse to
individual retailers or customers involves transporting many partial loads over long distances. With more
depots, consignments to individual customers can be consolidated for delivery at the depot. Local delivery in
partial loads is then made over shorter distances.) An increase in warehouse and inventory carrying costs is
9
traded off against a reduction in transport and stock-out costs in order to achieve an overall reduction in total
costs.
b. Transport cost/inventory cost trade-offs
The impact of a particular transport mode must be examined from the point of view of its effect upon other
logistics activities. The transport mode decision will affect the level of inventory in the system, because the
more rapid the mode, the less the in-transit inventory will be. Furthermore, rapid replenishment will reduce
the need to hold stock at distant markets. Similarly, the more reliable the transport mode, the smaller the
need will be for high safety stock levels. However, faster and more reliable transport results in higher transport
costs.
1.6.2.4 Intra-activity trade-offs
Intra-activity trade-offs occur within a particular logistics activity. The following intra-activity trade-offs are the
most common:
a. Trade-offs within a warehouse
Materials handling within a warehouse can be done manually or mechanically, or can be automated. The high
capital costs associated with automated warehouses should be traded off against the human resources cost of
manual handling.
b. Inventory trade-offs
The advantages of ordering in large quantities (e.g. discounts on the purchase price and on transport costs)
should be traded off against the costs of carrying stock (e.g. the interest which could be earned on money tied
up in stock and the cost of warehouse space).
c. Trade-offs with regard to transport
A typical example of such trade-offs is the cost of owning and operating your own fleet of vehicles compared
to the freight tariffs charged by professional carriers.
In this study unit we explained the relationship between the supply chain, supply chain management and
logistics. The supply chain consists of the key business processes from original supplier to end-user. As such,
the supply chain provides products, services and information. Logistics, however, is defined as the work
required to move and position inventory throughout a supply chain. The supply chain provides the strategic
framework within which logistical requirements are identified and related operations must be managed.
We also explained that logistics involves all those activities which are necessary to have the right product
available at the right place, at the right time and in the right quantities. Integrated logistics involves integrating
these activities to achieve a particular level of customer service at the lowest possible total cost.
This service/cost relationship is also reflected in the mission of logistics. Logistical service is measured in terms
of availability, operational performance and service reliability, while the lowest total cost can be achieved
through various trade-offs. We have also seen that logistics can be managed as a core competency in order to
gain a competitive advantage.
1.7 SUMMARY
TRL2604/001/4/2017
10
Refer back to the study unit outcomes formulated at the beginning of the study unit and determine whether
you have achieved them by answering the self-assessment questions below.
(1) Define the following concepts in your own words:
(a) supply chain
(b) supply chain management
(c) logistics
(d) logistics competency
(e) logistical value
(f) lowest total logistics cost
(2) Explain the relationship between the supply chain and logistics.
(3) Discuss, in detail, the purpose of logistics.
(4) Briefly explain the term “trade-off” and discuss the four levels at which trade-offs can be effected to
achieve lowest total cost. Give examples.
1.8 SELF – ASSESSMENT QUESTIONS
11
PART 2 Internal logistics integration
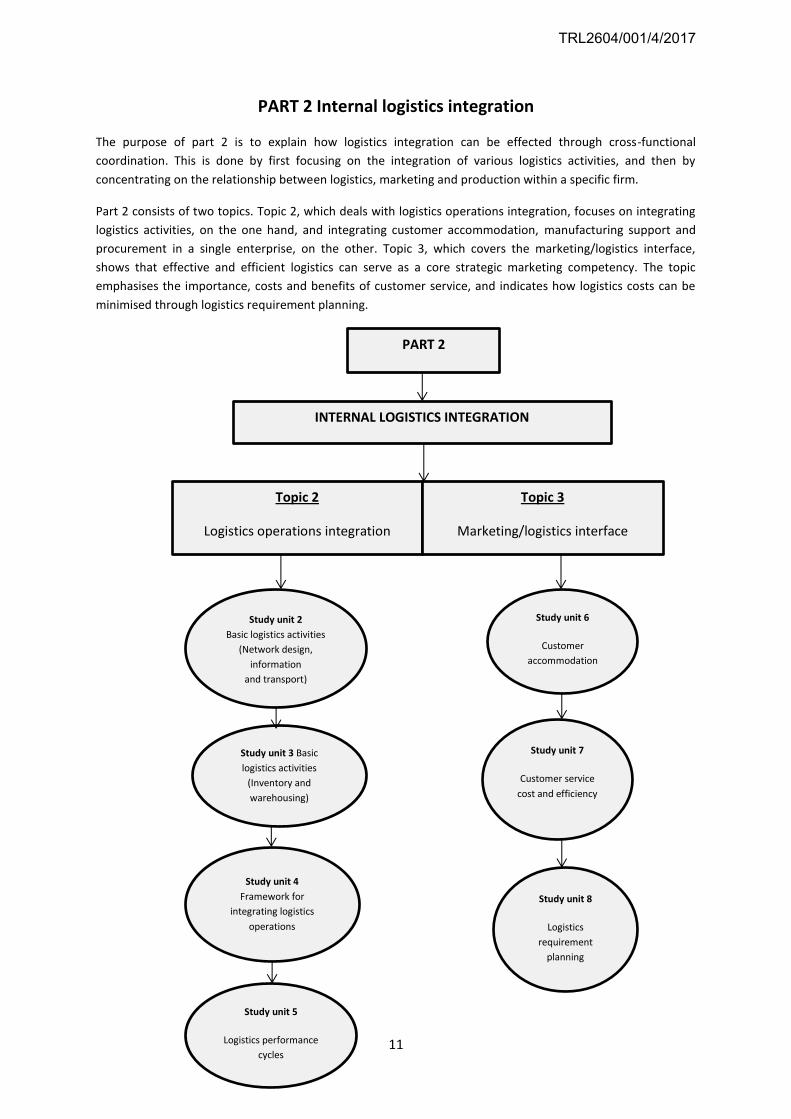
The purpose of part 2 is to explain how logistics integration can be effected through cross-functional
coordination. This is done by first focusing on the integration of various logistics activities, and then by
concentrating on the relationship between logistics, marketing and production within a specific firm.
Part 2 consists of two topics. Topic 2, which deals with logistics operations integration, focuses on integrating
logistics activities, on the one hand, and integrating customer accommodation, manufacturing support and
procurement in a single enterprise, on the other. Topic 3, which covers the marketing/logistics interface,
shows that effective and efficient logistics can serve as a core strategic marketing competency. The topic
emphasises the importance, costs and benefits of customer service, and indicates how logistics costs can be
minimised through logistics requirement planning.
PART 2
INTERNAL LOGISTICS INTEGRATION
Topic 2
Logistics operations integration
Topic 3
Marketing/logistics interface
Study unit 2
Basic logistics activities
(Network design,
information
and transport)
Study unit 3 Basic
logistics activities
(Inventory and
warehousing)
Study unit 4
Framework for
integrating logistics
operations
Study unit 5
Logistics performance
cycles
Study unit 6
Customer
accommodation
Study unit 7
Customer service
cost and efficiency
Study unit 8
Logistics
requirement
planning
TRL2604/001/4/2017
12
CONTENTS
2.1 INTRODUCTION
2.2 NETWORK DESIGN
2.3 INFORMATION
2.4 TRANSPORTATION
2.5 SUMMARY
2.6 SELF-ASSESSMENT QUESTIONS
PURPOSE
The purpose of this study unit is to enable you to minimise the total logistics costs in your business by
understanding the interaction between logistics activities.
OUTCOMES
After working through this study unit, you will be able to
(1) explain the role of optimum network design, information and transport in logistics
(2) indicate how these interact with one another and with other activities in the supply chain to achieve the
logistics goal of a particular level of customer service at the lowest total cost
2.1 INTRODUCTION
In this and the next study unit you will be introduced to the logistics activities (basic work) which must be
performed to fulfil logistics requirements. These areas of basic work comprise network design, information,
transport, inventories, warehousing, materials handling and packaging. This study unit deals with the first
three activities, while the others are discussed in study unit 3. In both study units, the discussion by Bowersox
et al (2013) is supplemented with material from other sources.
The purpose of this study unit is not to provide details of the activities (this will be done in your third year), but
to briefly indicate the role of each activity in logistics and how they all interact in a typical business.
2.2 NETWORK DESIGN
2.2.1 Overview
STUDY UNIT 2
BASIC LOGISTICS ACTIVITIES (NETWORK DESIGN, INFORMATION AND
TRANSPORT)
13
Logistics management is concerned with the flow of inventory and information. Inventory flow requires a
network of facilities which allows stock to be kept and customer orders to be picked and dispatched. The
purpose of facilities or depots is to hold stocks of materials and products to match anticipated demand with
planned supply, to balance flows within the network and to enable the consolidation of customer orders to
take place.
The following are some of the key questions which arise in a logistics network which is required to achieve a
high quality service at the lowest total cost:
(1) What types of facility are needed in the logistics network?
(2) How many depots or warehouses are needed?
(3) What should the size of these be?
(4) Where should they be located?
2.2.2 The nature and role of facilities in the logistics network_________________________________________
The concept of logistics extends beyond the organisation and embraces both suppliers and customers. The
location of suppliers and customers is therefore of fundamental importance to a company’s network of
facilities. An optimum network requires the simultaneous trade-off of a number of relationships existing
between various facilities. The number, size and geographical location of facilities which are necessary for the
performance of logistical operations directly affect the level of customer service and logistics costs. The
network of facilities forms a structure which enables logistical operations to be performed.
Network design involves decisions on the number and location of all types of facilities which are required for
the performance of logistics work. Typical logistics facilities are manufacturing plants, warehouses, depots and
retail stores. Since logistics focuses on the flow of inventory (and information) and not on manufacturing as
such, the emphasis here is on warehouses or depots rather than manufacturing plants.
2.3 The number of facilities___________________________________________________________________
An optimum number of warehouses is needed in a network in order to achieve the lowest total logistics cost.
Decisions about the number of warehouses or depots in a logistics network are not easy to take and usually
involve the use of quantitative models for optimum decision making. Although the use of such models is not
dealt with in this module, it is worth noting some of the trade-off decisions relating to, and some of the factors
influencing, the number of warehouses.
ACTIVITY 2.1
Study Bowersox et al (2013:37–38) to obtain an overview of a logistics network and how it fits in with the
major logistical activities such as warehousing, inventory, transport and information. Did you notice the
interaction between network design, information and transport? This interaction will become more
apparent in the ensuing discussion.
ACTIVITY 2.2
Without reading any further, try to list some of the cost relationships and trade-offs between logistics activities which you think will give an indication of the optimum number of warehouses in a network.
TRL2604/001/4/2017
14
From the discussion by Bowersox et al (2013) it is clear that the number, size and location of facilities are key
factors in the design of a logistics network. Since these issues are not adequately covered in this particular
section of the book, they are discussed briefly below.
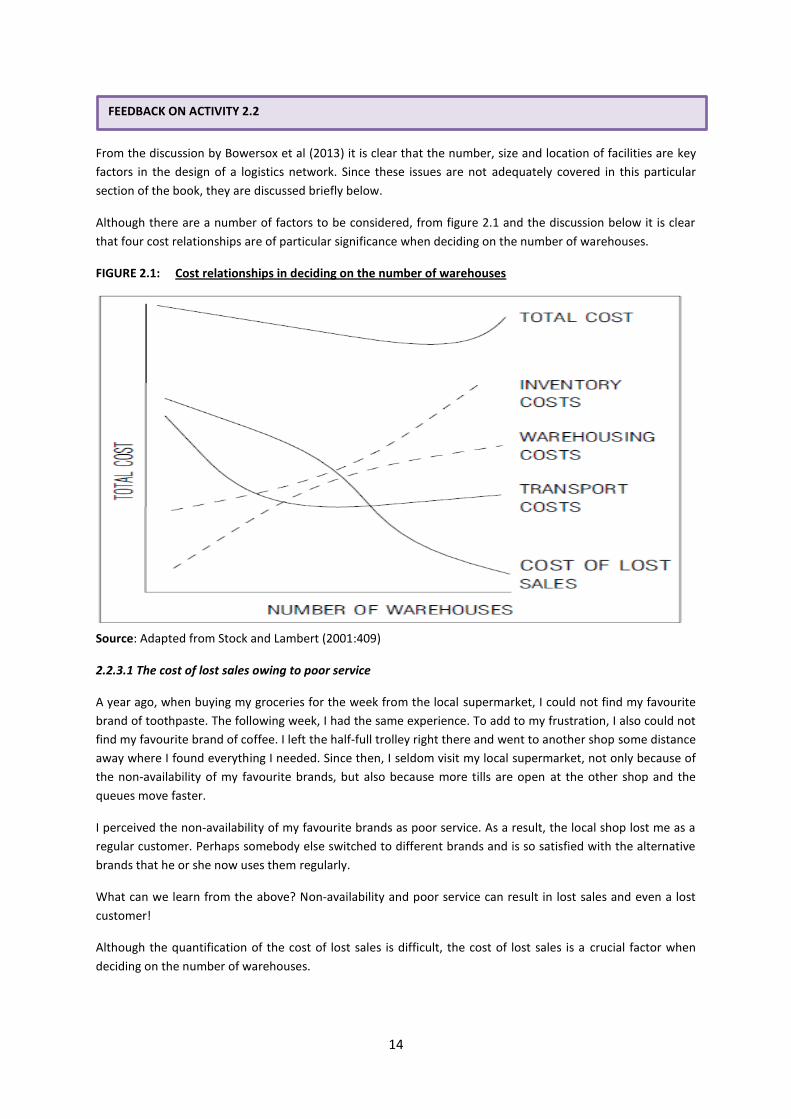
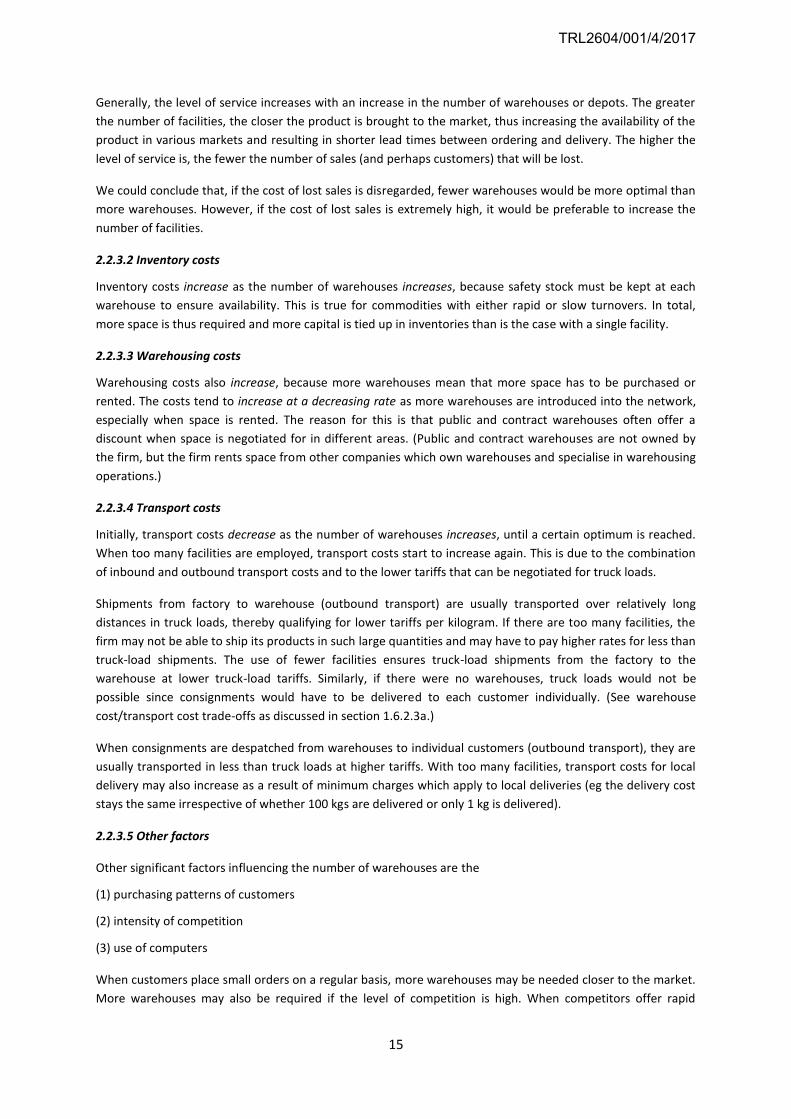
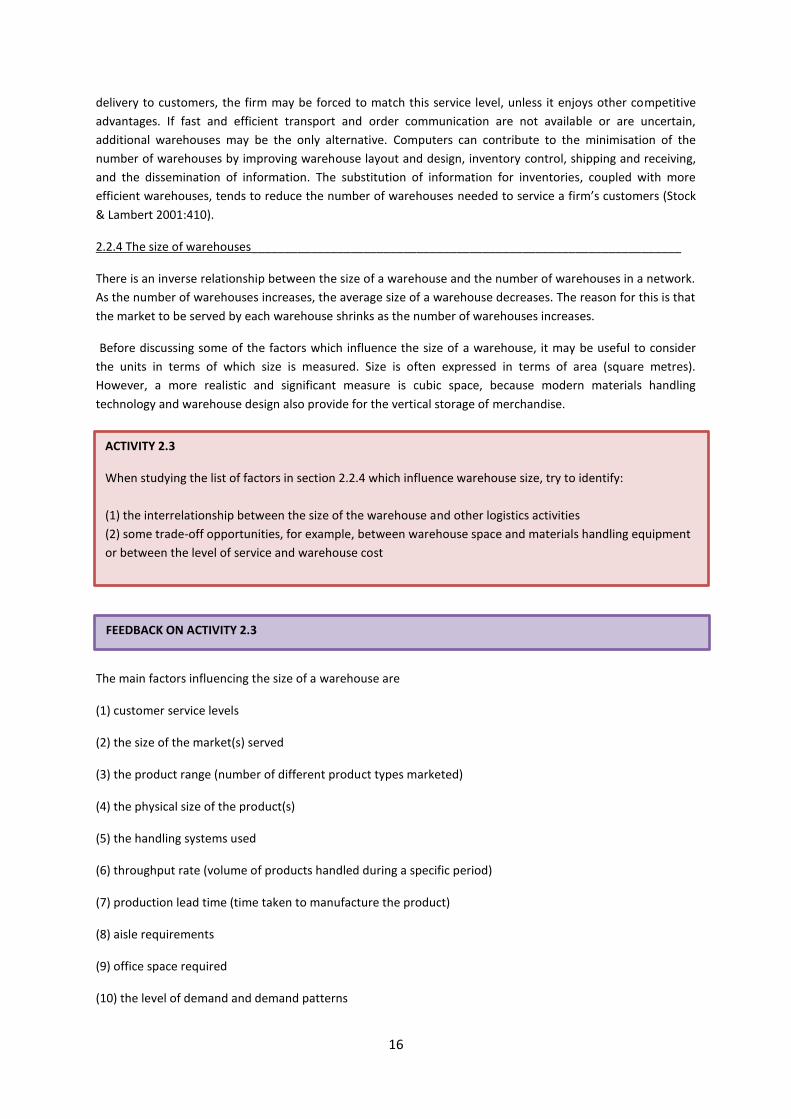
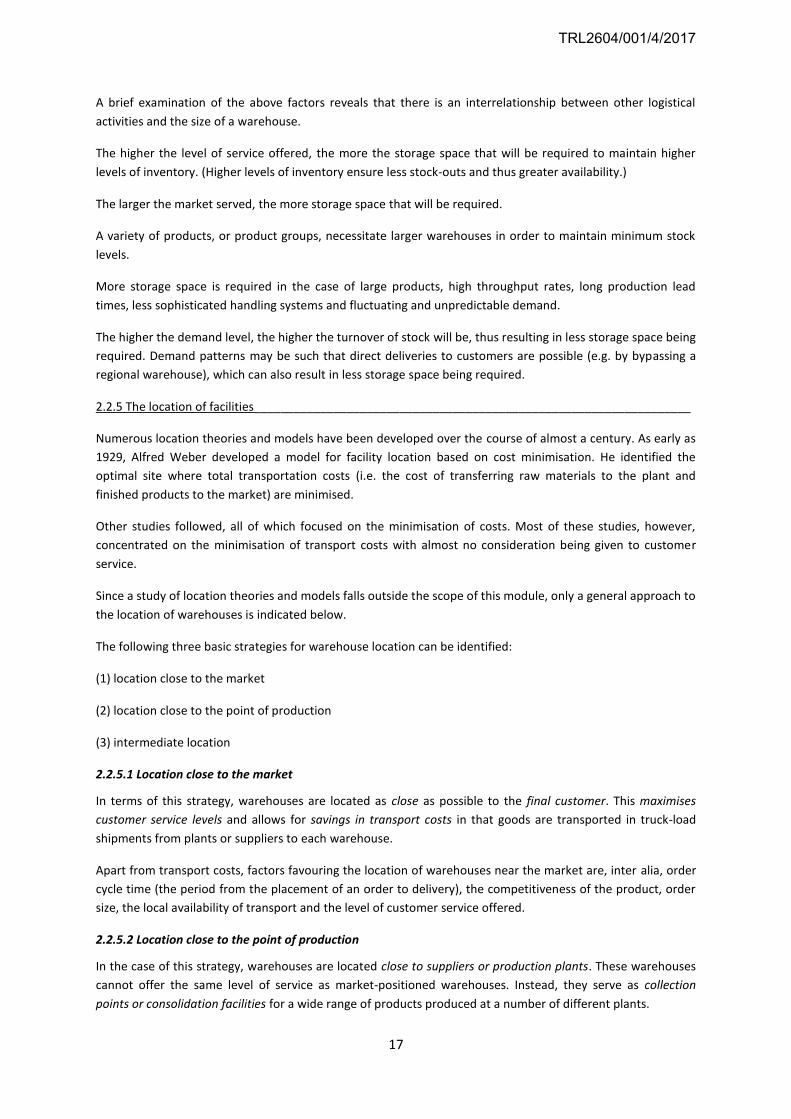
Although there are a number of factors to be considered, from figure 2.1 and the discussion below it is clear
that four cost relationships are of particular significance when deciding on the number of warehouses.
FIGURE 2.1: Cost relationships in deciding on the number of warehouses
Source: Adapted from Stock and Lambert (2001:409)
2.2.3.1 The cost of lost sales owing to poor service
A year ago, when buying my groceries for the week from the local supermarket, I could not find my favourite
brand of toothpaste. The following week, I had the same experience. To add to my frustration, I also could not
find my favourite brand of coffee. I left the half-full trolley right there and went to another shop some distance
away where I found everything I needed. Since then, I seldom visit my local supermarket, not only because of
the non-availability of my favourite brands, but also because more tills are open at the other shop and the
queues move faster.
I perceived the non-availability of my favourite brands as poor service. As a result, the local shop lost me as a
regular customer. Perhaps somebody else switched to different brands and is so satisfied with the alternative
brands that he or she now uses them regularly.
What can we learn from the above? Non-availability and poor service can result in lost sales and even a lost
customer!
Although the quantification of the cost of lost sales is difficult, the cost of lost sales is a crucial factor when
deciding on the number of warehouses.
FEEDBACK ON ACTIVITY 2.2
15
Generally, the level of service increases with an increase in the number of warehouses or depots. The greater
the number of facilities, the closer the product is brought to the market, thus increasing the availability of the
product in various markets and resulting in shorter lead times between ordering and delivery. The higher the
level of service is, the fewer the number of sales (and perhaps customers) that will be lost.
We could conclude that, if the cost of lost sales is disregarded, fewer warehouses would be more optimal than
more warehouses. However, if the cost of lost sales is extremely high, it would be preferable to increase the
number of facilities.
2.2.3.2 Inventory costs
Inventory costs increase as the number of warehouses increases, because safety stock must be kept at each
warehouse to ensure availability. This is true for commodities with either rapid or slow turnovers. In total,
more space is thus required and more capital is tied up in inventories than is the case with a single facility.
2.2.3.3 Warehousing costs
Warehousing costs also increase, because more warehouses mean that more space has to be purchased or
rented. The costs tend to increase at a decreasing rate as more warehouses are introduced into the network,
especially when space is rented. The reason for this is that public and contract warehouses often offer a
discount when space is negotiated for in different areas. (Public and contract warehouses are not owned by
the firm, but the firm rents space from other companies which own warehouses and specialise in warehousing
operations.)
2.2.3.4 Transport costs
Initially, transport costs decrease as the number of warehouses increases, until a certain optimum is reached.
When too many facilities are employed, transport costs start to increase again. This is due to the combination
of inbound and outbound transport costs and to the lower tariffs that can be negotiated for truck loads.
Shipments from factory to warehouse (outbound transport) are usually transported over relatively long
distances in truck loads, thereby qualifying for lower tariffs per kilogram. If there are too many facilities, the
firm may not be able to ship its products in such large quantities and may have to pay higher rates for less than
truck-load shipments. The use of fewer facilities ensures truck-load shipments from the factory to the
warehouse at lower truck-load tariffs. Similarly, if there were no warehouses, truck loads would not be
possible since consignments would have to be delivered to each customer individually. (See warehouse
cost/transport cost trade-offs as discussed in section 1.6.2.3a.)
When consignments are despatched from warehouses to individual customers (outbound transport), they are
usually transported in less than truck loads at higher tariffs. With too many facilities, transport costs for local
delivery may also increase as a result of minimum charges which apply to local deliveries (eg the delivery cost
stays the same irrespective of whether 100 kgs are delivered or only 1 kg is delivered).
2.2.3.5 Other factors
Other significant factors influencing the number of warehouses are the
(1) purchasing patterns of customers
(2) intensity of competition
(3) use of computers
When customers place small orders on a regular basis, more warehouses may be needed closer to the market.
More warehouses may also be required if the level of competition is high. When competitors offer rapid
TRL2604/001/4/2017
16
delivery to customers, the firm may be forced to match this service level, unless it enjoys other competitive
advantages. If fast and efficient transport and order communication are not available or are uncertain,
additional warehouses may be the only alternative. Computers can contribute to the minimisation of the
number of warehouses by improving warehouse layout and design, inventory control, shipping and receiving,
and the dissemination of information. The substitution of information for inventories, coupled with more
efficient warehouses, tends to reduce the number of warehouses needed to service a firm’s customers (Stock
& Lambert 2001:410).
2.2.4 The size of warehouses_________________________________________________________________
There is an inverse relationship between the size of a warehouse and the number of warehouses in a network.
As the number of warehouses increases, the average size of a warehouse decreases. The reason for this is that
the market to be served by each warehouse shrinks as the number of warehouses increases.
Before discussing some of the factors which influence the size of a warehouse, it may be useful to consider
the units in terms of which size is measured. Size is often expressed in terms of area (square metres).
However, a more realistic and significant measure is cubic space, because modern materials handling
technology and warehouse design also provide for the vertical storage of merchandise.
The main factors influencing the size of a warehouse are
(1) customer service levels
(2) the size of the market(s) served
(3) the product range (number of different product types marketed)
(4) the physical size of the product(s)
(5) the handling systems used
(6) throughput rate (volume of products handled during a specific period)
(7) production lead time (time taken to manufacture the product)
(8) aisle requirements
(9) office space required
(10) the level of demand and demand patterns
ACTIVITY 2.3
When studying the list of factors in section 2.2.4 which influence warehouse size, try to identify:
(1) the interrelationship between the size of the warehouse and other logistics activities
(2) some trade-off opportunities, for example, between warehouse space and materials handling equipment
or between the level of service and warehouse cost
FEEDBACK ON ACTIVITY 2.3
17
A brief examination of the above factors reveals that there is an interrelationship between other logistical
activities and the size of a warehouse.
The higher the level of service offered, the more the storage space that will be required to maintain higher
levels of inventory. (Higher levels of inventory ensure less stock-outs and thus greater availability.)
The larger the market served, the more storage space that will be required.
A variety of products, or product groups, necessitate larger warehouses in order to maintain minimum stock
levels.
More storage space is required in the case of large products, high throughput rates, long production lead
times, less sophisticated handling systems and fluctuating and unpredictable demand.
The higher the demand level, the higher the turnover of stock will be, thus resulting in less storage space being
required. Demand patterns may be such that direct deliveries to customers are possible (e.g. by bypassing a
regional warehouse), which can also result in less storage space being required.
2.2.5 The location of facilities__________________________________________________________________
Numerous location theories and models have been developed over the course of almost a century. As early as
1929, Alfred Weber developed a model for facility location based on cost minimisation. He identified the
optimal site where total transportation costs (i.e. the cost of transferring raw materials to the plant and
finished products to the market) are minimised.
Other studies followed, all of which focused on the minimisation of costs. Most of these studies, however,
concentrated on the minimisation of transport costs with almost no consideration being given to customer
service.
Since a study of location theories and models falls outside the scope of this module, only a general approach to
the location of warehouses is indicated below.
The following three basic strategies for warehouse location can be identified:
(1) location close to the market
(2) location close to the point of production
(3) intermediate location
2.2.5.1 Location close to the market
In terms of this strategy, warehouses are located as close as possible to the final customer. This maximises
customer service levels and allows for savings in transport costs in that goods are transported in truck-load
shipments from plants or suppliers to each warehouse.
Apart from transport costs, factors favouring the location of warehouses near the market are, inter alia, order
cycle time (the period from the placement of an order to delivery), the competitiveness of the product, order
size, the local availability of transport and the level of customer service offered.
2.2.5.2 Location close to the point of production
In the case of this strategy, warehouses are located close to suppliers or production plants. These warehouses
cannot offer the same level of service as market-positioned warehouses. Instead, they serve as collection
points or consolidation facilities for a wide range of products produced at a number of different plants.
TRL2604/001/4/2017
18
For multiproduct companies, savings in transport costs can be achieved by consolidating shipments from the
various suppliers or plants into truck-load quantities.
The main factors favouring the location of warehouses close to the point of production are the perishability of
raw materials, the product range offered, the variety of products ordered by customers and truck-load
transport tariffs.
2.2.5.3 Intermediate location
In terms of this strategy, warehouses are located somewhere between the producer and the final customer.
The standard of customer service is typically higher than in the case of production-positioned warehouses, but
is still lower than that of market-positioned warehouses.
Companies that have to maintain a high service level and which provide a variety of products produced at
different plant locations would probably adopt this strategy.
Apart from the general strategies regarding the location of facilities discussed above, the following specific
factors also influence location at a particular point:
(1) the availability, quality and diversity of transport carriers that will serve the site
(2) the quality, quantity and cost of available human resources in the area
(3) the cost and quality of industrial land
(4) the potential for expansion
(5) the tax structure (property tax and possible municipal levies, or possible tax concessions)
(6) building regulations
(7) construction costs
(8) the cost and availability of utility services
2.3 INFORMATION
At the beginning of this study unit we mentioned that logistics management is concerned with the flow of
inventory and information.
ACTIVITY 2.4
Study the comments of Bowersox et al’s (2013:33–34) order processing and then answer the following
question:
1) Is it possible to achieve a saving in total costs by using effective information systems?
Pay particular attention to the relationship between accurate information and substantiate your answer.
(1) inventory levels
(2) forecasting
(3) order management
19
Bowersox et al (2013:34) emphasise the importance of accurate information in forecasting, which, in turn,
influences inventory levels. They explain that forecasting and order management are dependent on
information which is both quickly obtainable and reliable.
Demand forecasts must be based on accurate information. An incorrect forecast may result in a shortage or
excess of inventories, with serious consequences for customer service or logistics costs. Likewise, incorrect
information concerning orders can cause delays and additional logistics costs.
2.4 TRANSPORTATION
In our study of integrated logistics thus far, we have emphasised that transport is of paramount importance in
achieving the logistics mission. Some of the key questions relating to transport which now arise are the
following:
(1) From a logistics point of view, what transport options are available for fulfilling transport requirements?
(2) What qualities should be looked for in selecting suitable transport?
(3) How does transport influence other logistical activities in the pursuit of superior service at the lowest total
cost?
It should now be clear that there are many ways of fulfilling transport requirements, and that the cheapest
way does not necessarily result in the lowest total logistics costs.
Bowersox et al (2013:36) briefly mention private, contract and common carriage as basic ways of fulfilling
transport requirements. However, the transport options that are available to achieve the logistics mission are
much broader. For instance, there are a number of different transport modes with varying costs and qualities
which may be suitable in different circumstances. In section 2.4.1, we discuss the characteristics and relative
merits of each transport mode.
In addition, intermodal transport (i.e. using more than one mode for a single consignment) provides
opportunities for achieving greater logistical efficiency. Furthermore, various intermediaries in the transport
system act as freight consolidators or agents. Section 2.4.2 deals briefly with intermodal transport and section
2.4.3 with intermediaries.
Once you know what modes of transport are available and what their relative merits are, a further question
which arises is: How should the choice of mode be made? Bowersox et al (2013:35) indicate that the least
FEEDBACK ON ACTIVITY 2.4
ACTIVITY 2.5
Study Bowersox et al (2013:35–36) and then answer the following questions:
(1) What are the basic ways of fulfilling transport requirements?
(2) What factors are fundamental to transport performance?
(3) How do the cost and quality of transport influence other logistics activities in striving to achieve the
logistics mission?
FEEDBACK ON ACTIVITY 2.5
TRL2604/001/4/2017
20
expensive form of transportation does not always result in the lowest total cost. They regard speed and
consistency as two of the principal transport quality factors. Other factors which play a role in the quality of
transport are mentioned in the discussion on the relative merits of the different modes. These are, inter alia,
safety, accessibility, completeness and adaptability of capacity.
Apart from the quality features of a transport service, some product- and market-related factors also influence
transport arrangements. These are discussed in section 2.4.4.
2.4.1 The basic modes of transport_____________________________________________________________
The basic modes of transport which are available for logistics purposes are road, rail, air and water transport,
and pipelines. Each mode has different economic and technical characteristics, resulting in different qualities
of service at different costs.
2.4.1.1 Road transport
a) Characteristics
The cost structure of a road carrier is characterised by relatively high variable costs and by relatively low fixed
costs, because no capital has to be invested in roads.
Since little capital is required to start a road transport business, entry into the market is fairly easy. As a result,
the market consists of a large number of relatively small enterprises. Because of the large number of road
carriers, road transport is readily available and highly competitive. Road carriers are therefore willing, and
even eager, to negotiate rates and services.
Road transport is indispensable to any logistics system, since no other mode can provide as complete a service.
Often, no terminals are used and a door-to-door service is provided, resulting in relatively short delivery times.
Indeed, road transport is often used as a complementary mode to convey goods to and from the terminals of
other transport modes, such as railway stations and harbours.
b) Advantages
The major advantage of road transport is its accessibility. It is able to provide a service to virtually any location.
It is not limited to customers situated close to a railway line, airport or harbour.
Since the transport unit (vehicle) used is smaller compared to the other transport modes, less time is lost in the
consolidation of consignments, thus resulting in a relatively short lead time. Moreover, because of its relatively
small carrying capacity, road transport is suitable for smaller consignments which can be despatched fairly
frequently, and this also contributes to shorter lead times. This enables the logistics manager to reduce
inventory carrying costs while still maintaining the desired level of service.
Since there is less friction between the wheels and carrying surface (road), better suspension, less handling
and no shunting, road transport is a safer mode than rail or even water transport. Consequently, less
protective packaging is required.
In industries in which personal service is required, for example, where the driver also has to act as a
salesperson or has to perform certain administrative tasks, road transport is the obvious mode.
c) Disadvantages
The main disadvantage of using road transport is that the freight rates charged are relatively high when
compared with those of rail and water transport. However, this higher cost can be traded off against savings in
the cost of inventories, warehousing, packaging and customer service.
21
Another problem with road transport is that its reliability and consistency (adherence to fixed schedules or
planned consignments) may be hampered by bad weather and traffic congestion.
To summarise, it may be stated that road transport is particularly suitable for transporting high-value,
manufactured goods over relatively short distances.
2.4.1.2 Rail transport
a) Characteristics
Rail transportation requires a relatively high investment in terminals, tracks and equipment. Rail carriers, unlike
road carriers, are responsible for the construction and maintenance of their own permanent way (railroads).
The rail transport market is therefore characterised by a limited number of large carriers. In South Africa, only
one enterprise, Spoornet, provides rail freight services.
In the case of rail transport, it is possible to transport large consignments economically, and this mode is
particularly suitable for conveying low-value, high-density products in large volumes over relatively long
distances. It is especially suitable for transporting forestry, mining and agricultural products.
b) Advantages
Rail transport is fairly freely available in virtually all metropolitan areas and in areas with smaller communities.
c) Disadvantages
Since it is track-bound, the rail network is not as extensive as the road network, and is therefore not as
accessible and flexible as road transport. Thus rail transport, like air and sea transport can provide a service
between terminals only, and road transport is needed to convey goods to and from these terminals.
In order to remain competitive, rail transport enterprises have introduced innovative services, such as the use
of unit trains, express trains and specialised equipment. New developments in integrated services include
piggybacking and containerisation.
2.4.1.3 Air transport
a) Characteristics
The cost structure of air carriers is characterised by high variable costs in relation to fixed costs since, as in the
case of water and road transport, no investment in the way (air) is required. Furthermore, air carriers do not
have to invest in airports.
b) Advantages
The major advantage of air transport is its speed, resulting in short delivery times over long distances. This
mode is most suitable for transporting urgent consignments or highly perishable products. However, the speed
of air transport cannot be compared directly with that of other modes. The total door-to-door delivery time is
decisive for the following reason (Ballou 1985:188):
Surface freight handling and movement are the slowest portions of total door-to-door delivery time, overall
delivery time is reduced to the point that a well-managed truck or rail operation can match, at least over the
shorter distances and in specific cases
c) Disadvantages
A major disadvantage of air transport is its relatively high cost. Only those commodities with a high value:
weight ratio can absorb this high transport cost. In the case of such commodities, transport cost constitutes a
TRL2604/001/4/2017
22
smaller portion of the sales price than the inventory carrying cost, thus justifying air transportation. Inventory
levels, and the accompanying inventory cost, can be reduced in view of the speed of air transport.
A further disadvantage is that the accessibility of air transport is restricted. Shippers have to depend on road
transport to carry freight to and from the airport.
2.4.1.4 Water transport
Since South Africa has no inland waterways, such as the Great Lakes in the United States of America, water
transport is limited to sea transport for international shipments and coastal transportation for local shipments.
a) Characteristics
The cost structure of sea transport is characterised by fairly high variable and low fixed costs in that the way
(the sea) requires no investment and harbours are not owned or operated by the carriers.
The majority of consignments transported by sea have a low value and high density and can be readily handled
by means of mechanical loading equipment. As in the case of rail transport, sea transport is suitable for the
transportation of large quantities over long distances.
The inherent advantages and disadvantages of water transport, and its influence on logistics management, are
summarised by Sampson and Farris (Lambert & Stock 1982:112) as follows:
b) Advantages
From the individual shipper’s viewpoint, the principal advantage of using water transportation for domestic
shipments in preference to land transport is low freight rates. Sometimes, in addition, water carrier facilities
are more suitable for handling (loading and unloading) certain kinds of bulk commodities.
Disadvantages
A principal disadvantage, even for bulk shipments, is the generally slower and less frequent scheduled service
available from water carriers. Goods in transit represent funds tied up in inventories – speed is money to the
shipper. Also, slowness and less frequent departures and arrivals on the part of water carriers virtually
preclude the filling of rush orders and sometimes require shippers to carefully plan their production and
shipping schedules in advance. Then, too, water carriage typically gives pinpoint area coverage.
Where it is available, water carriage generally serves only major points and bypasses many smaller
intermediate communities. Also, delays because of adverse weather conditions must frequently be anticipated.
Unless the shipper and the consignee are located directly adjacent to water facilities, goods must be
transported to and from water by land carriers. This may involve extra handling expenses. That is, goods must
be loaded onto a land carrier, hauled to the water carrier’s dock, and reloaded onto the water carrier’s vessel.
At the destination, the goods must be unloaded from the water carrier, hauled to the consignee’s place of
business, and again handling charges, and terminal fees of various kinds, may also be incurred.
The development of lash vessels and Ro-Ro (roll on-roll off) ships has improved the capability of ships to
handle certain goods, and has in fact improved the handling of shipments.
2.4.1.5 Pipelines
a) Characteristics
The use of pipelines as a mode of transport is limited to the transportation of crude oil and refined petroleum
products. Although certain solids such as coal can be transported by pipeline, in the case of coal, it first has to
23
be processed into a liquid form by suspending it in water. At the destination, it then has to be separated from
the water.
The cost structure of pipelines is similar to that of rail transport, namely high fixed costs compared with
variable costs, as a result of the considerable investment required in infrastructure.
b) Advantages
The main advantage of pipelines is that petroleum products can be transported at a relatively low cost.
Furthermore, pipelines are the most reliable and safest mode of transport for those products for which they
are suitable.
The capability of pipelines to deliver products on time is due primarily to the following factors:
(1) The flow of products within a pipeline is monitored and controlled by computer.
(2) There is minimal risk of loss or damage owing to leaks or breaches in the pipeline.
(3) Climatic conditions have a minimal effect on products being conveyed in pipelines.
(4) Because pipelines are not labour intensive; employee absences or labour unrest have little effect on their
operation.
Disadvantages
Pipelines compare poorly with other modes of transport in so far as accessibility and speed are concerned.
Bear in mind, however, that although the speed at which products are conveyed is slow, there is virtually no
interruption in the flow of products. This reduces the total delivery time.
2.4.2 Intermodal transport___________________________________________________________________
An intermodal transport service involves the use of two or more carriers from different modes in the through
movement of a shipment.
The characteristics and cost of certain transport modes often necessitate the use of more than one mode of
transport to deliver a shipment to its destination. The limited accessibility of air, rail, and water and pipeline
transportation is a typical example. Instead of all goods being handled seperately in the transfer from one
mode to another, goods can be packaged in such a way that the shipment is handled as a whole. This
facilitates intermodal transport.
The most prominent feature of intermodal transport is the ease with which equipment can be interchanged
between transport modes. The repeated handling of cargo, which causes delays and increased transport costs,
is thus eliminated.
There are mainly two types of intermodal transport, namely piggybacking and containerisation, which are
discussed briefly below.
2.4.2.1 Piggybacking
Various combinations of piggyback transport are possible, namely rail-road, rail-water, rail-air, road-air, road-
water and water-air. Rail-road is the most commonly used combination and is often referred to as “trailer on
flat car” (TOFC), which involves transporting truck trailers on railroad flat cars, usually over longer distances
than those over which trucks normally haul goods.
TRL2604/001/4/2017
24
TOFC combines the convenience and flexibility of road transport with the long-haul economies of rail transport.
The cost of TOFC is less than that for road transport alone. Road carriers are able to extend their range
economically. Rail carriers are able to share in conveying certain goods that would normally be moved by road
alone. The shipper benefits from the convenience of door-to-door service over long distances at reasonable
costs.
The major obstacle to piggybacking is the unwillingness of some carriers to participate in this form of
coordination. Carriers are willing, and even eager, to coordinate transport activities in situations where it is
impossible for only one carrier to convey a consignment over the total distance. But where a particular carrier
can transport the consignment over the entire distance, such carrier will be reluctant to share the load with
other carriers.
The most sophisticated form of intermodal service is that in which a transport company provides a variety of
services. The advantage of such a company is that it is able to utilise the most efficient modal service to meet
the shipper’s needs, thus resulting in lower costs to the shipper.
2.4.2.2 Containerisation
In simple terms, a container is a large box into which the commodities to be shipped are placed. After initial
loading, the commodities themselves are not rehandled while in transit until they are unloaded at their
destination. Throughout the entire course of the through movement, the container, and not the commodities,
is handled.
Containerisation is a specialised method of packaging which makes the transportation of loads considerably
easier and results in savings in handling costs in particular. Containerisation allows intermodal, door-to-door
services to be provided, because cargo can be transferred between all modes of transport, with the exception
of pipeline transport. All intermediate handling of commodities as such is eliminated. Goods are handled only
at the point of origin and at the final destination.
The reduction in handling of the commodity reduces handling costs, the cost of damage and theft, and the
time required to complete the modal transfer.
The main advantages of containerisation may be summarised as follows:
(1) Containerisation allows door-to-door, multimodal transport to be provided over long distances.
(2) No intermediate handling at transfer points is necessary. Apart from reducing labour costs, the risk of
damage and theft is also reduced. All these factors contribute to reducing insurance premiums.
(3) Less protective packaging is needed for containerised cargo.
(4) Because delivery times are shorter and more reliable, less stock needs to be carried.
(5) Freight documentation and administration are simplified considerably.
2.4.3 Intermediaries in the transport system_________________________________________________
Some companies act as intermediaries between shippers and carriers. They do not provide transport services
themselves, but act as freight consolidators or agents. Freight forwarders and freight brokers are principal
examples of these intermediaries, and are discussed briefly.
25
2.4.3.1 Freight forwarders
Freight forwarders collect small consignments from shippers, consolidate these consignments, arrange long-
haul transportation and distribute the consignments at the destination. Freight forwarders accept
responsibility for the transportation of cargo from the point of receipt to the point of delivery. They are usually
not carriers themselves, but use the services (in the form of rail, road, air or sea transport) provided by
professional carriers.
The freight forwarder’s income is derived from the difference between the higher tariff paid by the shipper for
less-than-truck-load (LTL) shipments and the lower volume tariff charged by carriers for truck-load (TL)
shipments. Shippers benefit mainly as a result of the reduction in delivery time for LTL shipments.
2.4.3.2 Freight brokers
Freight brokers simultaneously act as sales agents for the carrier and as traffic managers for the shipper. By
representing a variety of carriers, these brokers are able to arrange suitable transport for the shipper. The
logistics manager’s task is facilitated at virtually no cost, because freight brokers are paid a commission by the
carriers.
2.4.4 The selection of suitable transport_________________________________________________________
In studying the relevant section in Bowersox et al (2013:36) you probably noted the importance of transport
cost, speed and consistency in selecting suitable transport. In this section, some product-related and market-
related factors influencing the cost of transport and modal choice are discussed.
The product-related features are shelf life, density, stowability, handling characteristics and value, while the
market-related factors are mainly the rate of sale and sales volume, seasonality, customer size and location,
and market share/competitive status.
These factors are worth considering briefly and individually.
2.4.4.1 Product-related factors
a) Shelf life/perishability
Clearly, rapid and reliable transport is required for short shelf life and perishable products. Often, there are
also specific requirements, such as temperature control or special handling.
b) Density
Density refers to a product’s weight:volume ratio. Items such as steel, canned foods and building materials
have high weight:volume ratios. This means that they are fairly heavy given their size. However, products such
as toilet paper, breakfast cereals, electronics and toys have low weight:volume ratios and are thus fairly light
given their size. Generally, low-density products (those with low weight:volume ratios) tend to cost more to
transport on a per kilo basis than high-density products.
c) Stowability
Stowability refers to the degree to which a product can fill the available space in a transport vehicle. A
product’s stowability depends on its size, shape, fragility and other physical characteristics. For example, grain,
ore and petroleum products conveyed in bulk have excellent stowability because they can completely fill the
vehicle or container (rail car, tank truck, and pipeline) in which they are transported. Other items, such as
furniture, motorcars, machinery and livestock, do not have good stowability or cube utilisation.
TRL2604/001/4/2017
26
d) Value
The value of a product affects modal choice in two ways. Here, two factors are relevant. The higher the
product value, the less the desire of the dealer will be to carry large inventories. Thus rapid stock turnover and
therefore rapid, reliable transport would be required.
In addition, product value will influence security requirements during transit. For example, rapid increases in
coffee prices have caused manufacturers to reappraise their security measures. High-technology goods such as
computers will also require a special service.
In general, the higher the value: weight ratio of the product, the greater the possibility will be of using high-
cost transport modes.
2.4.4.2 Market-related factors
a) Rate of sale and sales volume
Fast-moving products require frequent deliveries (often in large quantities). Thus the mode selected must be
capable of meeting stringent service requirements. Delivery failures may result in drastic sales losses and thus
loss of goodwill with customers.
b) Seasonality
Frozen and canned vegetables are consumed throughout the year, but grow only at certain times. The
problems for transportation are quite clear. At growing time, rapid and frequent service is required to ensure a
minimum time delay between picking and processing. Bulk transport is required for trucking to storage
locations, and from there to customers’ depots prior to despatch to retail outlets. Fresh foods and flowers are
often air freighted from growing areas into markets to ensure freshness and to command high resale prices.
c) Customer size and location
Large customers, densely located, enable large vehicles to convey large loads. However, as the customers
become more dispersed and their sales volumes decrease, problems arise. Deliveries to rural areas become
extremely expensive, and many manufacturers deal with this by first raising the minimum drop requirements
for customers’ orders, and then by seeking alternative modes and enterprises. Such alternatives might be
distribution service companies which, because of consolidation facilities, can offer relatively lower-cost
transportation, cash-and-carry (and conventional) wholesalers, to which bulk deliveries at reasonable costs can
be made, or joint consolidation activities with non-competitive (but complementary) manufacturers.
d) Market share/Competitiveness status
Lower service levels are required for products with a market monopoly compared with products that are sold
in highly competitive markets. This implies that transport considerations and the competitiveness of the
product are closely intertwined.
To summarise, the lowest total cost approach must be emphasised again, that is, the impact of a particular
mode must be examined from the point of view of its effects upon the other elements of the logistics mix. The
transport mode decision will affect the level of inventory in the system, because the faster the mode, the less
the in-transit inventory will be, and rapid replenishment will reduce the need to hold stocks in distant markets.
Similarly, the more reliable the transport mode, the less the need will be for high levels of inventory at
customer locations. Finally, the choice of mode will affect the warehousing requirements of the system and
the possibilities for unitisation. When all of these factors are taken into account, it may well be that the least-
cost form of transport will by no means be the best from a total distribution logistics cost point of view.
27
When logistics activities are performed, due consideration should be given to all the other activities in the
logistics system. Logistical competency can be achieved only by coordinating the various activities. While this
study unit concentrated on network design, information and transportation, the next study unit deals with the
remaining logistics activities, that is, inventory, warehousing, materials handling and packaging.
Refer back to the study unit outcomes formulated at the beginning of the study unit and determine whether
you have achieved them by answering the self-assessment questions below.
(1) With the aid of an appropriate figure, explain four cost relationships which are decisive in determining the
number of warehouses in a logistics network. The interaction between network design and other logistics
activities must be clearly apparent in your explanation
(2) List ten (10) factors which influence the size of a warehouse, and briefly indicate the interrelationship
between the size of a warehouse and other logistics activities.
(3) Briefly discuss three basic strategies in respect of warehouse location, and indicate the relationship
between each strategy and other logistics activities.
(4) Briefly explain the role and importance of information in the logistics system. Indicate how information can
improve coordination between logistics activities and lowest total costs.
(5) Briefly identify the relative merits of each transport mode from a logistics point of view.
(6) Explain what is meant by the term “intermodal transport”, and briefly discuss two types of intermodal
transport.
(7) What is the role of the following intermediaries in the transport system?
(a) freight forwarders
(b) freight brokers
(8) What transport arrangements would you make in the following cases? Give reasons for your answer in each
case, based on your knowledge of the characteristics of the modes of transport and the product- and market-
related factors which influence modal choice.
(a) Twenty thousand tonnes tons of coal need to be transported from Ermelo to Richards Bay on a daily basis.
(Ermelo and Richards Bay are situated approximately 350 km apart and there is a railway linking between the
two towns.)
(b) Fifty bicycles need to be transported from Vereeniging to Johannesburg (distance approximately 70 km).
(c) Fresh, export-quality apples need to be transported from Grabouw in the Eastern Cape to London.
2.5 SUMMARY
2.6 SELF-ASSESSMENT QUESTIONS
TRL2604/001/4/2017
28
(d) Two thousand truck tyres need to be transported from Japan to Johannesburg in order to replenish stock.
(e) Petrol has to be conveyed from Durban to Johannesburg.
(f) An urgently required component for earthmoving equipment needs to be transported from Germany to
Witbank.
29
CONTENTS
3.1 INVENTORY
3.2 WAREHOUSING, MATERIALS HANDLING AND PACKAGING
3.3 SELF-ASSESSMENT QUESTIONS
PURPOSE
The purpose of this study unit is to assist you in minimising total logistics costs by understanding the
interaction between logistics activities.
OUTCOMES
After working through this study unit, you will be able to
(1) describe the role of inventory, warehousing, materials handling and packaging as logistics activities (basic
logistics work) in the total supply chain
(2) explain how each basic logistics activity interacts with other logistics activities in order to achieve the goal
of a particular level of service at lowest total cost
3.1 INVENTORY
Inventory has always been considered a safety factor, serving as the lubricant of the individual parts of the
logistics system which makes the system as a whole function smoothly. Although the basic function of
providing “insurance” cannot be denied, inventories are increasingly being considered a liability.
STUDY UNIT 3
BASIC LOGISTICS ACTIVITIES (INVENTORY AND WAREHOUSING)
ACTIVITY 3.1
Having been a Unisa student for at least a year, I am sure that you have a bookshelf. It is probably stocked
with reading material which is seldom referred to as reference books to which you occasionally refer and
even books which you may read some day. There may also be a stack of old magazines that nobody will ever
look at again. Now, consider the following:
Why is all this reading material on your bookshelf? Could the space not be put to better use?
Are there alternatives to keeping these books and magazines?
FEEDBACK ON ACTIVITY 3.1
TRL2604/001/4/2017
30
Your books and magazines are probably all kept in your bookshelf “just in case”. Perhaps this does no harm,
because the space which they occupy is probably unusable and their resale value is probably low. If, however,
the space could be used more productively, or if the books could be taken out on loan instead of being
purchased, you might more carefully have the luxury of holding them “just in case”. Instead, you would order
specific material from the library for use over a period of a few days.
The same principle applies to inventories in business where “just in case” is replaced by “just in time”.
However, “just in time” does not mean that no inventories are kept at all, but that they are minimised to the
extent that lowest total logistics costs can be achieved.
In this section, the types of inventory, the purpose of inventories, the cost of holding stock and optimum
inventory levels are discussed briefly. Within this general framework, some inventory deployment strategies
are also briefly touched on.
3.1.1 Types of
inventory________________________________________________________________________
Inventory may generally be classified as constituting raw materials, work-in-progress (semi-finished goods) and
finished goods.
Within each of these categories, inventory may also be defined in terms of the stock class as follows:
(1) In-transit inventories of raw materials, semi-finished and finished products are those inventories moving
from one part of the logistics system to another.
(2) Cycle stock (sometimes called working stock or base stock) is inventory that results from the replenishment
process under conditions of certainty, that is, when demand and the performance cycle (replenishment lead
time) can be predicted perfectly.
In simple terms, the cycle stock can be regarded as the minimum inventory required to ensure that demand is
met under conditions of certainty.
(3) Safety or buffer stock allows for variance and uncertainty in demand or the performance cycle (lead time).
(4) Speculative stock is held because of expected changes in the supply of or demand for a product, for
example, as a result of industrial disputes, price rises or shortages.
3.1.2 The purpose of inventory________________________________________________________________
Why should businesses keep stock?
Inventory fulfils various functions, and it is important to note that individual functional or departmental heads
will each emphasise their own objectives. Hence, it is vital that someone acting as logistics manager has an
overview of the whole system in order to minimise total logistics costs.
The functions of inventories are as follows:
(1) They facilitate the provision of good customer service by ensuring availability and preventing the cost of
lost sales.
(2) They ensure a proportionate flow in the production process. Non-availability of raw materials, or a
disproportionate supply of semi-finished products (components), can cause interruptions in the production
process, with considerable cost implications.
31
(3) They provide protection against uncertainties and variability in supply and demand. Uncertainty
necessitates the keeping of safety stock to serve as a buffer for both physical distribution and materials
provision.
(4) Production costs can be saved by holding stock. In an endeavour to keep production costs low, many
manufacturers produce continuously for long periods (long production runs). Products are therefore produced
slightly earlier than the date of expected demand. Savings as a result of longer production runs must of course
be traded off against the cost of holding stock.
(5) Inventories ensure better utilisation of human resources and equipment. By stabilising materials flow,
inventories enable management to plan the capacity utilisation of both human resources and equipment
properly, and to utilise the capacity optimally.
(6) Inventories reduce the cost of purchasing. Ordering goods on a frequent basis involves high administration
and high delivery costs, as well as missed opportunities in the form of bulk discounts and the benefits of
reduced handling costs.
(7) Inventories enable management to negotiate quantity discounts and to acquire merchandise or raw
materials at times when prices are low.
(8) Since truck-load rates are lower than less-than-truck-load rates, transport costs can be saved by holding
inventories.
(9) Inventories can alleviate problems caused by seasonal fluctuations. Some manufacturers experience a
seasonal change in the demand for their products. Instead of products being produced on demand, they are
manufactured all year round and are kept in stock until the season in question arrives, for example, toys for
the Christmas period.
The reasons for keeping inventories may be summarised by highlighting two main consequences of holding too
little stock or no stock at all. Firstly, the costs of procurement increase as goods are reordered frequently and
in small quantities, because these orders do not attract quantity discounts and do not bring about transport
cost savings. Secondly, customer demand will often not be satisfied, resulting in costs of lost sales and in lost
customers.
However, the benefits of holding inventories must be traded off against the costs of doing so. This brings us to
another key question:
What are the costs involved in holding inventories?
3.1.3 Inventory carrying costs________________________________________________________________
Inventory carrying costs increase in relation to the inventory level and the period for which stock is held. The
following are typical examples of inventory carrying costs:
(1) the cost of invested capital (the money that is tied up in stock could have been spent on something else, or
could have been invested in a bank where it could earn interest)
(2) administration costs and the cost of record-keeping
(3) warehousing costs (which consist mainly of the costs involved in purchasing or renting storage space)
(4) handling costs
(5) insurance
TRL2604/001/4/2017
32
(6) depreciation and obsolescence (obsolescence is a financial risk which a company runs of finding that the
products its holding in stock are no longer sellable)
(7) damage and pilferage
When these costs are borne in mind, it is clear why the lowest total cost concept requires inventory levels to
be carefully managed. In this regard, the following key question arises:
How can the need for inventory of some kind be balanced against the cost and associated drawbacks of
holding it?
3.1.4 Optimum inventory levels1________________________________________________________________
In determining the quantity of inventory that should be held in the logistics system, three major types of stock
are distinguished, namely in-transit stock, cycle stock and safety stock.
3.1.4.1 In-transit stock
The level of in-transit stock depends primarily on the transport time and quantity of products sold in a given
period. If it takes long to move stock from one of the logistics system to another, the level of in-transit stock
will be high.
The average in-transit stock can be estimated by applying the formula
I = ST
where
I = total in-transit stock
S = average sales rate per period
T = average transit time
Where, for instance, the average weekly demand for a product amounts to 200 units, and the average delivery
lead time is two weeks, the total in-transit stock for the item will average 400 (I = 200 x 2).
Where, for instance, the average weekly demand for a product amounts to 200 units, and the average delivery
lead time is two weeks, the total in-transit stock for the item will average 400 (I = 200 x 2).
3.1.4.2 Cycle stock
In most logistics systems, items are ordered in quantities which more than meet the immediate requirements,
for example, because of the delay in receiving complete orders, because of quantity discounts on large orders
and because of transport cost savings. There are, however, constraints on the level of inventories in the form
of inventory carrying costs which require a trade-off between the advantages of ordering in large quantities
and the cost of doing so.
This trade-off is expressed in terms of the simple economic order quantity, where the balance between
ordering costs and holding costs in finding an optimum lot size may be ascertained by applying the following
formula:
1 This section is based mainly on Gattorna, Hay and Hargreaves (1991:51–54) and Pienaar and Vogt (2009:223–
233).
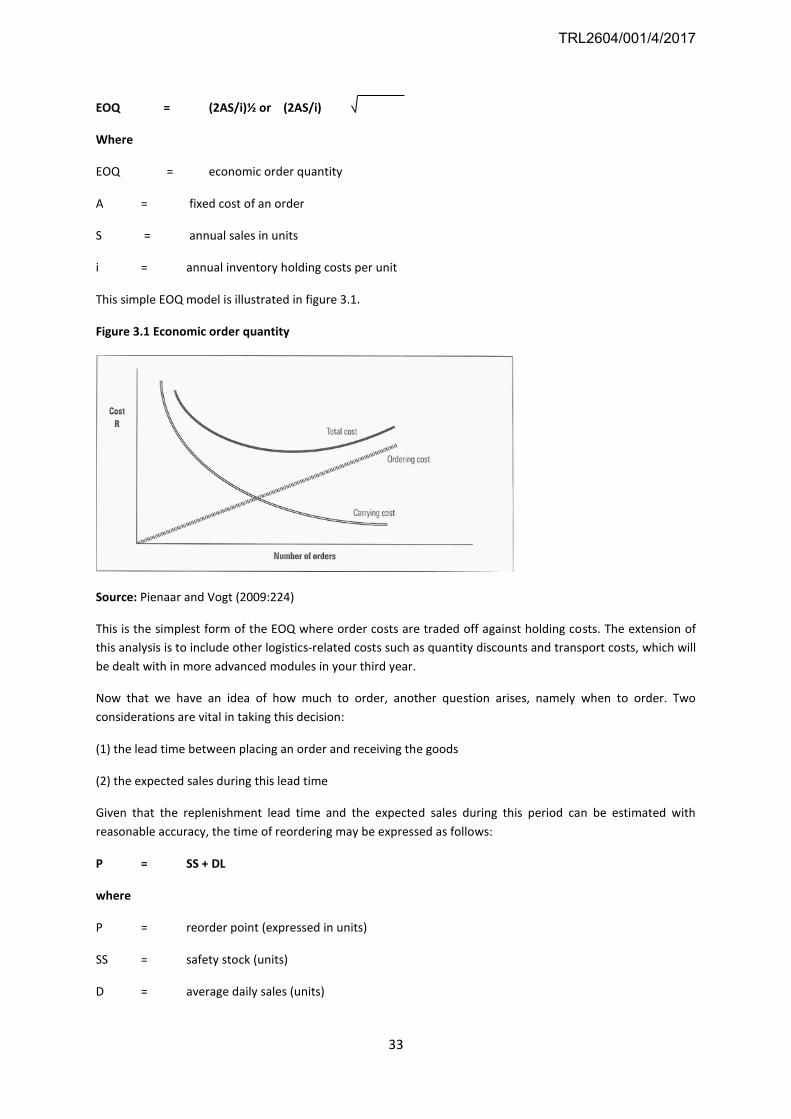
33
EOQ = (2AS/i)½ or (2AS/i)
Where
EOQ = economic order quantity
A = fixed cost of an order
S = annual sales in units
i = annual inventory holding costs per unit
This simple EOQ model is illustrated in figure 3.1.
Figure 3.1 Economic order quantity
Source: Pienaar and Vogt (2009:224)
This is the simplest form of the EOQ where order costs are traded off against holding costs. The extension of
this analysis is to include other logistics-related costs such as quantity discounts and transport costs, which will
be dealt with in more advanced modules in your third year.
Now that we have an idea of how much to order, another question arises, namely when to order. Two
considerations are vital in taking this decision:
(1) the lead time between placing an order and receiving the goods
(2) the expected sales during this lead time
Given that the replenishment lead time and the expected sales during this period can be estimated with
reasonable accuracy, the time of reordering may be expressed as follows:
P = SS + DL
where
P = reorder point (expressed in units)
SS = safety stock (units)
D = average daily sales (units)
TRL2604/001/4/2017
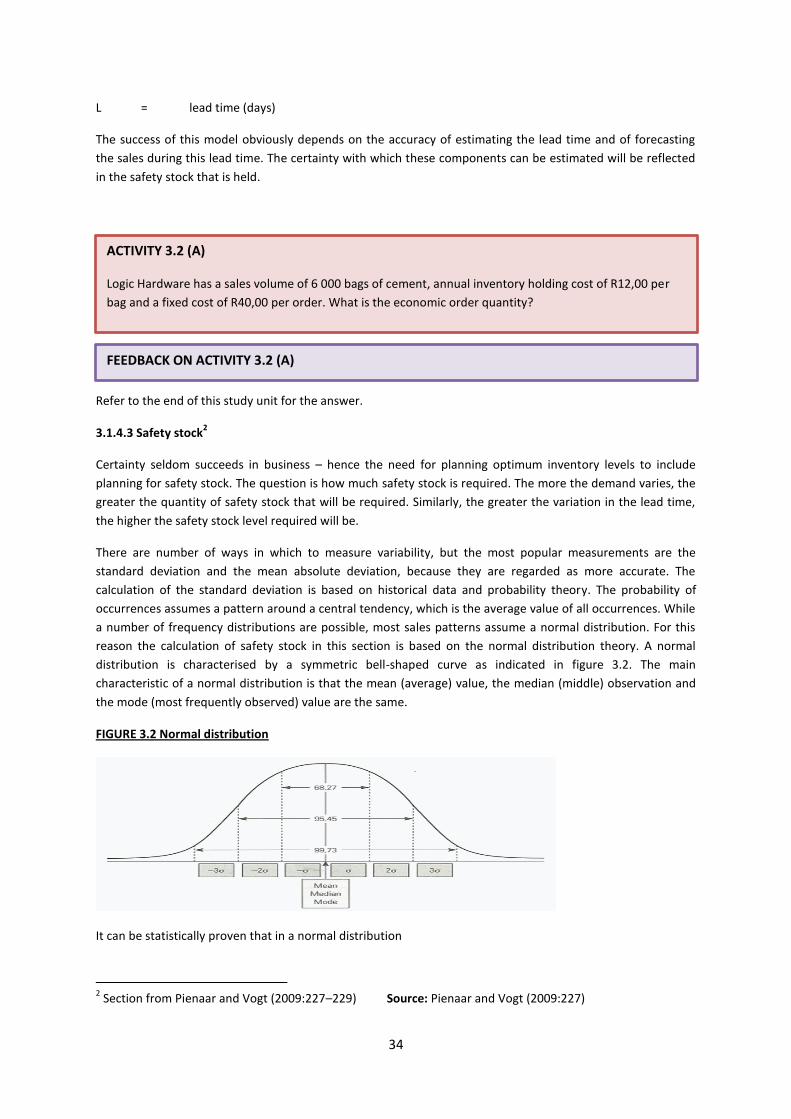
34
L = lead time (days)
The success of this model obviously depends on the accuracy of estimating the lead time and of forecasting
the sales during this lead time. The certainty with which these components can be estimated will be reflected
in the safety stock that is held.
Refer to the end of this study unit for the answer.
3.1.4.3 Safety stock2
Certainty seldom succeeds in business – hence the need for planning optimum inventory levels to include
planning for safety stock. The question is how much safety stock is required. The more the demand varies, the
greater the quantity of safety stock that will be required. Similarly, the greater the variation in the lead time,
the higher the safety stock level required will be.
There are number of ways in which to measure variability, but the most popular measurements are the
standard deviation and the mean absolute deviation, because they are regarded as more accurate. The
calculation of the standard deviation is based on historical data and probability theory. The probability of
occurrences assumes a pattern around a central tendency, which is the average value of all occurrences. While
a number of frequency distributions are possible, most sales patterns assume a normal distribution. For this
reason the calculation of safety stock in this section is based on the normal distribution theory. A normal
distribution is characterised by a symmetric bell-shaped curve as indicated in figure 3.2. The main
characteristic of a normal distribution is that the mean (average) value, the median (middle) observation and
the mode (most frequently observed) value are the same.
FIGURE 3.2 Normal distribution
It can be statistically proven that in a normal distribution
2 Section from Pienaar and Vogt (2009:227–229) Source: Pienaar and Vogt (2009:227)
ACTIVITY 3.2 (A)
Logic Hardware has a sales volume of 6 000 bags of cement, annual inventory holding cost of R12,00 per
bag and a fixed cost of R40,00 per order. What is the economic order quantity?
FEEDBACK ON ACTIVITY 3.2 (A)
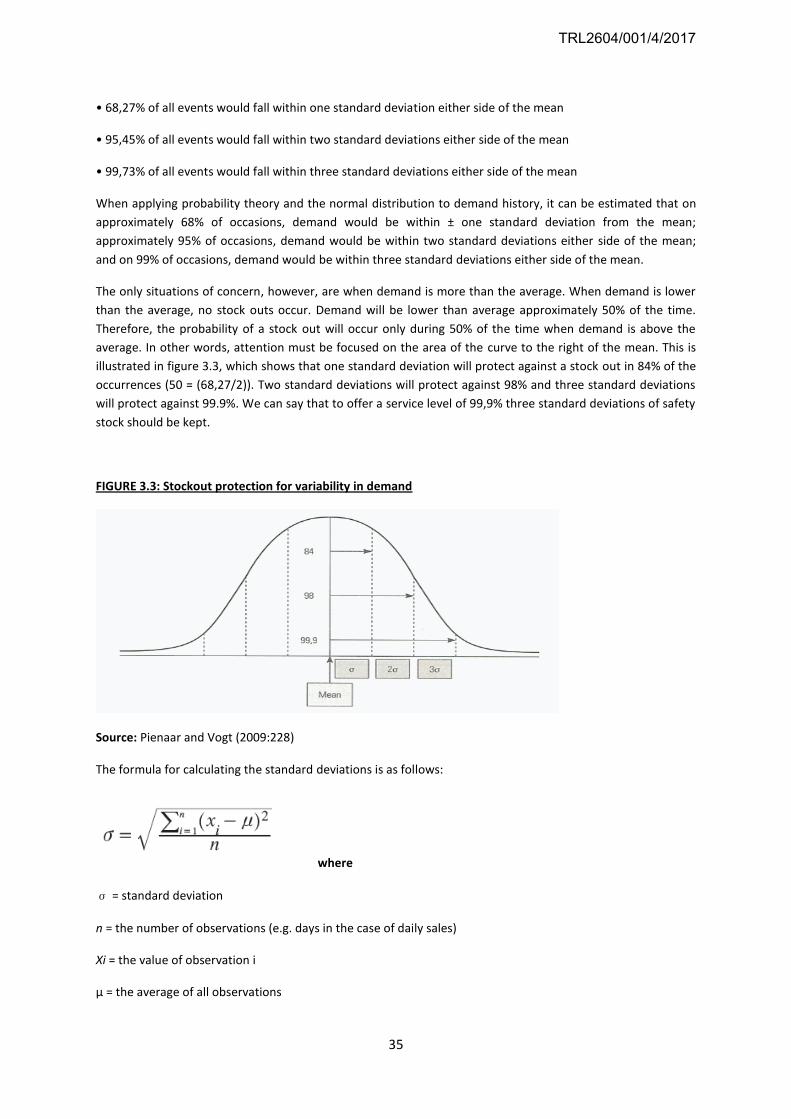
35
• 68,27% of all events would fall within one standard deviation either side of the mean
• 95,45% of all events would fall within two standard deviations either side of the mean
• 99,73% of all events would fall within three standard deviations either side of the mean
When applying probability theory and the normal distribution to demand history, it can be estimated that on
approximately 68% of occasions, demand would be within ± one standard deviation from the mean;
approximately 95% of occasions, demand would be within two standard deviations either side of the mean;
and on 99% of occasions, demand would be within three standard deviations either side of the mean.
The only situations of concern, however, are when demand is more than the average. When demand is lower
than the average, no stock outs occur. Demand will be lower than average approximately 50% of the time.
Therefore, the probability of a stock out will occur only during 50% of the time when demand is above the
average. In other words, attention must be focused on the area of the curve to the right of the mean. This is
illustrated in figure 3.3, which shows that one standard deviation will protect against a stock out in 84% of the
occurrences (50 = (68,27/2)). Two standard deviations will protect against 98% and three standard deviations
will protect against 99.9%. We can say that to offer a service level of 99,9% three standard deviations of safety
stock should be kept.
FIGURE 3.3: Stockout protection for variability in demand
Source: Pienaar and Vogt (2009:228)
The formula for calculating the standard deviations is as follows:
where
σ = standard deviation
n = the number of observations (e.g. days in the case of daily sales)
Xi = the value of observation i
μ = the average of all observations
TRL2604/001/4/2017
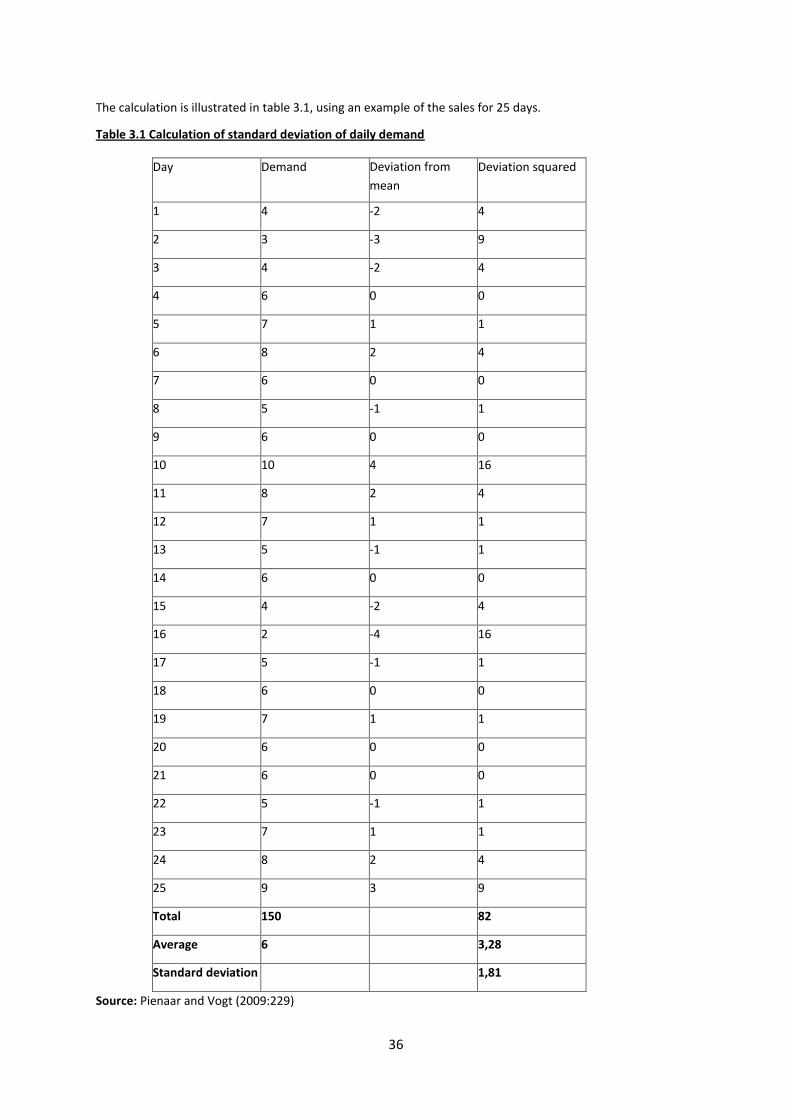
36
The calculation is illustrated in table 3.1, using an example of the sales for 25 days.
Table 3.1 Calculation of standard deviation of daily demand
Day Demand Deviation from
mean
Deviation squared
1
1
4
43
-2
-2
4
4 2
2
3
3
-3
-3
9
9 3
3
4
4
-2
-2
4
4 4
4
6
67
0
0
0
0 5
5
7
7
1
1
1
1 6
6
8
8
2
2
4
4 7
7
6
6
0
0
0
0 8
8
5
5
-1
-1
1
1 9
9
6
6
0
0
0
0 10
10
10
10
4
4
16
16 11
11
8
8
2
2
4
4 12
12
7
7
1
1
1
1 13
13
5
5
-1
-1
1
1 14
14
6
6
0
0
0
0 15
15
4
4
-2
-2
4
4 16
16
2
2
-4
-4
16
16 17
17
5
5
-1
-1
1
1 18
18
6
6
0
0
0
0 19
19
7
7
1
1
1
1 20
20
6
6
0
0
0
0 21
21
6
6
0
0
0
0 22
22
5
5
-1
-1
1
1 23
23
7
7
1
1
1
1 24
24
8
8
2
2
4
4 25
25
9
9
3
3
9
9 Total
Total
150
150
82
82 Average
Average
6
6
3,28
3.28 Standard deviation
Standard deviation
1,81
1.81 Source: Pienaar and Vogt (2009:229)
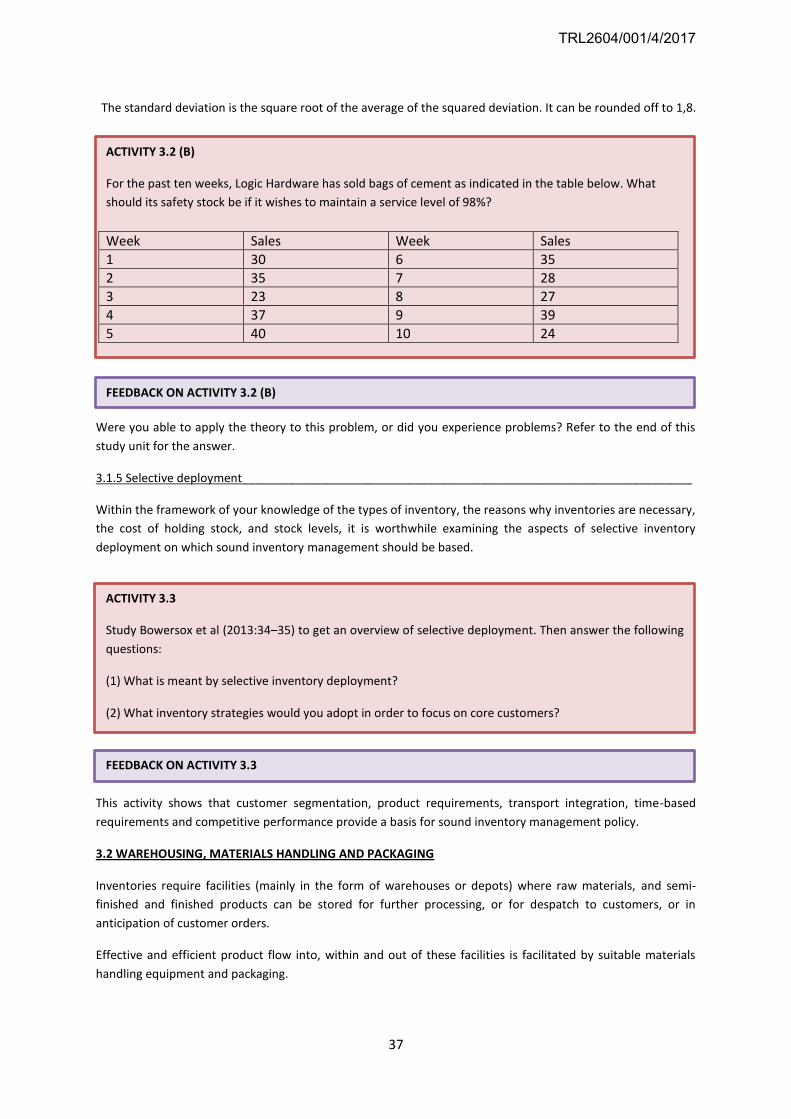
37
The standard deviation is the square root of the average of the squared deviation. It can be rounded off to 1,8.
Were you able to apply the theory to this problem, or did you experience problems? Refer to the end of this
study unit for the answer.
3.1.5 Selective deployment____________________________________________________________________
Within the framework of your knowledge of the types of inventory, the reasons why inventories are necessary,
the cost of holding stock, and stock levels, it is worthwhile examining the aspects of selective inventory
deployment on which sound inventory management should be based.
This activity shows that customer segmentation, product requirements, transport integration, time-based
requirements and competitive performance provide a basis for sound inventory management policy.
3.2 WAREHOUSING, MATERIALS HANDLING AND PACKAGING
Inventories require facilities (mainly in the form of warehouses or depots) where raw materials, and semi-
finished and finished products can be stored for further processing, or for despatch to customers, or in
anticipation of customer orders.
Effective and efficient product flow into, within and out of these facilities is facilitated by suitable materials
handling equipment and packaging.
ACTIVITY 3.2 (B)
For the past ten weeks, Logic Hardware has sold bags of cement as indicated in the table below. What
should its safety stock be if it wishes to maintain a service level of 98%?
Week Sales Week Sales
1 30 6 35
2 35 7 28
3 23 8 27
4 37 9 39
5 40 10 24
FEEDBACK ON ACTIVITY 3.2 (B)
ACTIVITY 3.3
Study Bowersox et al (2013:34–35) to get an overview of selective deployment. Then answer the following
questions:
(1) What is meant by selective inventory deployment?
(2) What inventory strategies would you adopt in order to focus on core customers?
FEEDBACK ON ACTIVITY 3.3
TRL2604/001/4/2017
38
Did you note that Bowersox et al (2013:36–37) regard warehousing, materials handling and packaging as
functions which do not have the same independent status as the other activities (as far as customer service is
concerned), but nevertheless form an integral part of the other logistics areas? The integration of these
activities with one another and with other logistics activities, however, is essential in achieving the logistics
mission.
3.2.1 Warehousing__________________________________________________________________________
Bowersox et al (2013:36–37) refer to the choice between private and specialist warehouse facilities and list a
few warehouse activities. These considerations are discussed in a little more detail in this section.
3.2.1.1 Types of warehouses
In general, there are several warehousing alternatives. Some companies deliver directly and use only a single
warehouse at the point of origin. Examples of these are companies which accept postal or telephonic orders
from the final consumer (direct marketing). Most companies, however, store products at intermediate points
between plants and customers. These companies have three options, namely to make use of public
warehouses, to use contract warehouses or to use private warehouses.
(1) Private warehouses are owned or leased by the company itself, and all warehouse operations are carried
out by staff of the particular company.
(2) Public warehouses provide warehouse facilities and services for profit. They provide professional
warehousing services by storing goods that are suitable for the type of facility they provide. The following five
types of public warehouses may be distinguished:
General-merchandise warehouses are designed for use by manufacturers, distributors and retailers
for storing virtually any type of product.
Refrigerated or cold-storage warehouses provide storage at controlled temperatures and are usually
used for storing perishable foodstuffs, although certain pharmaceutical goods, photographic papers
and films can also be stored in such a warehouse.
Warehouses for domestic goods are used for the storage of personal property rather than
merchandise.
Special-commodity warehouses are used for specific products, usually agricultural products such as
grain, wool or cotton. Normally only one type of product is stored and the warehouse is equipped for
that specific product. Special services are provided for the products concerned.
Bulk-storage warehouses typically store liquids in tanks and dry products such as coal, sand and
chemicals in open or protected spaces. Services provided by these facilities include the mixing of
different types of chemicals to form new compounds.
ACTIVITY 3.4
Study Bowersox et al (2013:36–37) and then answer the following question:
How are warehousing, materials handling and packaging integrated with one another and with other
logistics activities in striving for lowest total costs?
FEEDBACK ON ACTIVITY 3.4
39
(3) In a contract warehouse, storage space, software systems, labour and management are dedicated to a
specific shipper’s logistics system. Resources provided by the contract warehouse firm can be customised to
satisfy a specific client’s requirements.
Many factors need to be considered in deciding on whether to use private, public or contract warehouses.
These, however, fall outside the scope of this module and will be dealt with in your third year.
3.2.1.2 Warehouse operations
The primary objective of a warehouse is to receive and store large quantities of inventory efficiently and
temporarily, and to dispatch specific customer orders. The ideal is to receive and despatch products the same
day. The two main functions of a warehouse are movement and storage, and these are briefly elaborated on
below. Considering the above ideal, it is obvious that movement is more important than storage.
a. Movement
The movement of merchandise involves mainly three handling activities: receiving, internal handling within the
warehouse and shipping (despatching).
Receiving
Receiving involves unloading incoming vehicles. Depending on the nature of the product, this can be done
manually, mechanically or with the aid of automated equipment. When receiving the products, it is advisable
to stack them on pallets or slip sheets to form a unit load, thereby facilitating handling efficiency later on
during the process.
Internal handling
Internal handling consists of all handling activities within the warehouse and can be subdivided into two
categories, that is, transfer and selection. In the case of transfer, merchandise is transferred from the receiving
area to a specific dedicated area where the particular product type is stored. The inbound movement is
handled by forklift trucks in the case of palletised loads, while other mechanical handling systems are used for
larger unit loads. Automatic handling systems are another option.
When products are required to make up a specific customer order (order selection), they are moved from the
storage area to the selection area. This second movement may be omitted in the case of large products such
as stoves and refrigerators.
A third and final transfer activity is necessary to move the assortment of products required for a customer
shipment from the warehouse to the shipping dock.
Selection involves the grouping of different products ordered by a specific customer and is indeed the primary
function of the warehouse. It is typical for one section of a warehouse to be established as a selection area in
order to minimise travel distance.
Shipping
Shipping involves the checking and loading of orders onto outgoing vehicles. The shipping of unit loads is
extremely popular since considerable loading time can be saved. It is necessary to check each consignment to
verify customer orders against the actual consignments. This is to ensure that only products appearing on a
customer order leave the warehouse, and that customer orders are complete.
TRL2604/001/4/2017
40
b. Storage
Storage may be classified into two categories: normal storage and special, or extended, storage.
Normal storage
Normal storage involves inventory which is required for the normal day-to-day activities of the warehouse, and
is based on regular customer orders. The storage duration depends upon the nature of the logistics system in
operation and is based on inventory replenishment cycles.
Extended or special storage
Extended storage is required in certain special situations. Such storage involves the storage of products for
longer periods than in the case of normal storage in order to match supply and demand, which does not occur
simultaneously. The following situations normally give rise to the need for extended storage:
(a) The seasonality of certain products is a consideratoin. Large quantities of a particular product which is
produced all year round may be required for seasonal sales.
(b) Products which are subject to erratic demand fluctuations require a larger safety stock.
(c) Part of the production process is performed in the warehouse, such as the conditioning of bananas.
(d) Large inventories of a particular product are frequently held for speculative purposes, or during a special
promotion campaign.
(e) Special discounts can be negotiated on large or early purchases, resulting in the need for storage.
3.2.2 Materials handling and packaging__________________________________________________________
Unitisation features prominently in materials handling and packaging. Unitisation refers to decisions regarding
the most suitable and economically viable size of units in which a product is packed.
Individual bottles or cans of beer are often combined in packs of six, which are then packed into a case of 24
and are ultimately palletised. These palletised packs may then be transhipped by vehicles capable of carrying a
given number of pallets. In this case, we have four unitisation decisions.
The first, regarding the bottle or can, is based on knowledge about consumer behaviour or consumption
patterns. The second, regarding the six-pack or case, is based on a conveniently manageable number of bottles
or cans for a typical level of demand. The third, regarding palletisation, is based on a view (often standardised)
about realistic weight:volume ratios for manoeuvring in brewery warehouses. The final decision, concerning
the number of pallets per vehicle, is determined by the types of vehicle available, legislation pertaining to
ACTIVITITY 3.5
Consider for a moment how beer is packed. We buy beer in bottles or cans in a bar, or in six packs or cases at
the bottle store. But surely it must be costly and inconvenient to handle beer bottle by bottle or by case by case
in a logistics system? How does the packaging of beer influence handling and other logistics functions?
FEEDBACK ON ACTIVITY 3.5
41
vehicle sizes and load weights, and the despatch and delivery facilities of the brewery, warehouses and
retailers.
From this example it is clear that decisions about the size and form of a unit at one level of the logistics
channel affect unitisation at all other levels of the channel. Two developments which have had a huge impact
on unitisation are containerisation and palletisation.
While the role of the pallet is obvious from the above example, it is worth elaborating briefly on
containerisation.
The container, which is basically a steel-framed box, is a form of bulk unit load for which there has been a
dramatic growth in demand in recent years. The International Standards Organisation has laid down standard
sizes for containers, so that the containers can fit together to form modular loads, and conform to standard
strengths and weight limits, thereby ensuring safe stacking.
Containers have many advantages, the most important of which are the following:
(1) a reduction in pilferage and damage, and thus insurance costs
(2) simpler documentation
(3) savings on transport costs
(4) better utilisation of space
(5) easier handling
This study unit focused on inventory and warehousing, and how each of these basic logistics activities interacts
with other logistics activities in order to achieve the goal of a particular level of service at the lowest total cost.
Refer back to the study unit outcomes formulated at the beginning of the study unit and determine whether
you have achieved them by answering the self-assessment questions below.
(1) Briefly distinguish between the different types of inventory in the logistics system.
(2) Explain why it is necessary for most businesses to hold stock
(3) Briefly indicate how inventory holding can contribute to lowest total logistics costs given the fact that there
are certain costs involved in keeping stock.
(4) “Inventories constitute an important element of the logistics system, but the benefits of holding inventories
must be traded off against the costs of doing so.” Explain this statement by identifying inventory carrying costs
and indicating how the optimum level of inventories can be determined in order to contribute to the logistics
mission of lowest total costs.
(5) For the past 22 weeks, JNC Pub’s sales of a favourite brand of beer have been as indicated in the table
below. Determine the safety stock level for 84% and 98% service levels.
3.4 SELF-ASSESSMENT QUESTIONS
3.3 SUMMARY
TRL2604/001/4/2017
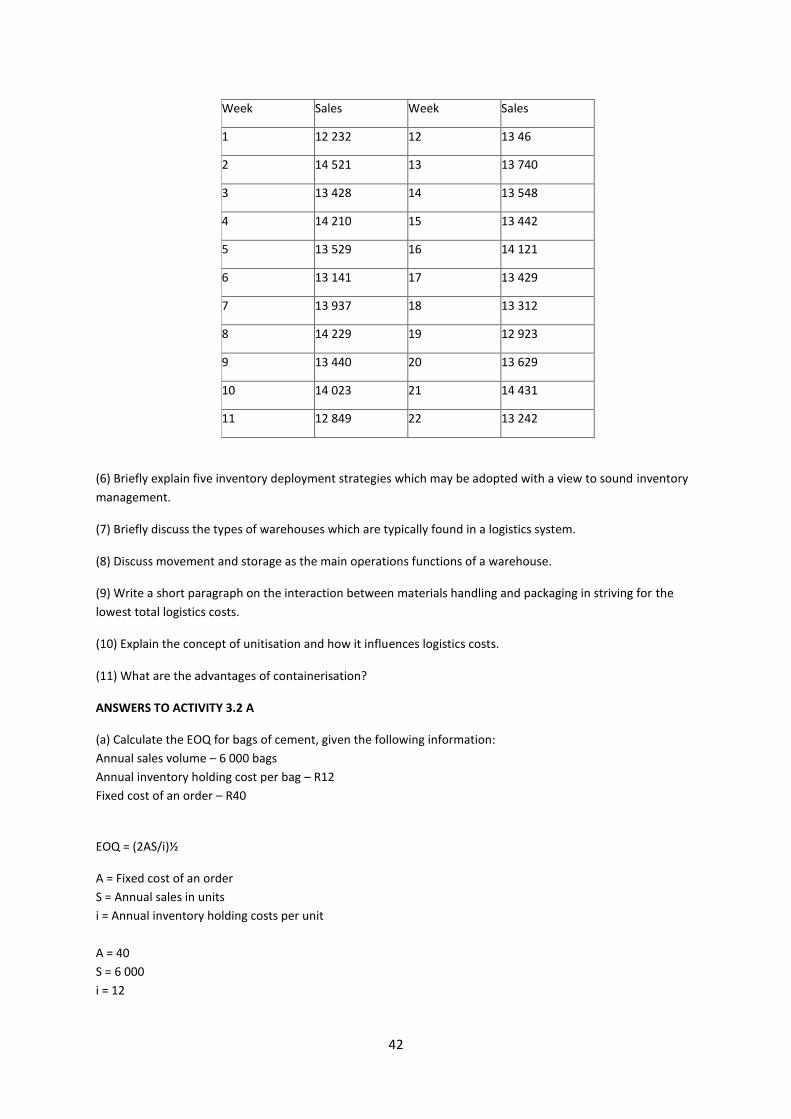
42
Week
Week
Sales
Sales
Week
Week
Sales
Sales1
1
12 232
12 232
12
12
13 46
13 146 2
2
14 521
14 521
13
13
13 740
13 740 3
3
13 428
13 428
14
14
13 548
13 548 4
4
14 210
14 210
15
15
13 442
13 442 5
5
13 529
13 529
16
16
14 121
14 121 6
6
13 141
13 141
17
17
13 429
13 429 7
7
13 937
13 937
18
18
13 312
13 312 8
8
14 229
14 229
19
19
12 923
12 923 9
9
13 440
13 440
20
20
13 629
13 629 10
10
14 023
14 023
21
21
14 431
14 431 11
11
12 849
12 849
22
22
13 242
13 242
(6) Briefly explain five inventory deployment strategies which may be adopted with a view to sound inventory
management.
(7) Briefly discuss the types of warehouses which are typically found in a logistics system.
(8) Discuss movement and storage as the main operations functions of a warehouse.
(9) Write a short paragraph on the interaction between materials handling and packaging in striving for the
lowest total logistics costs.
(10) Explain the concept of unitisation and how it influences logistics costs.
(11) What are the advantages of containerisation?
ANSWERS TO ACTIVITY 3.2 A
(a) Calculate the EOQ for bags of cement, given the following information:
Annual sales volume – 6 000 bags
Annual inventory holding cost per bag – R12
Fixed cost of an order – R40
EOQ = (2AS/i)½
A = Fixed cost of an order
S = Annual sales in units
i = Annual inventory holding costs per unit
A = 40
S = 6 000
i = 12
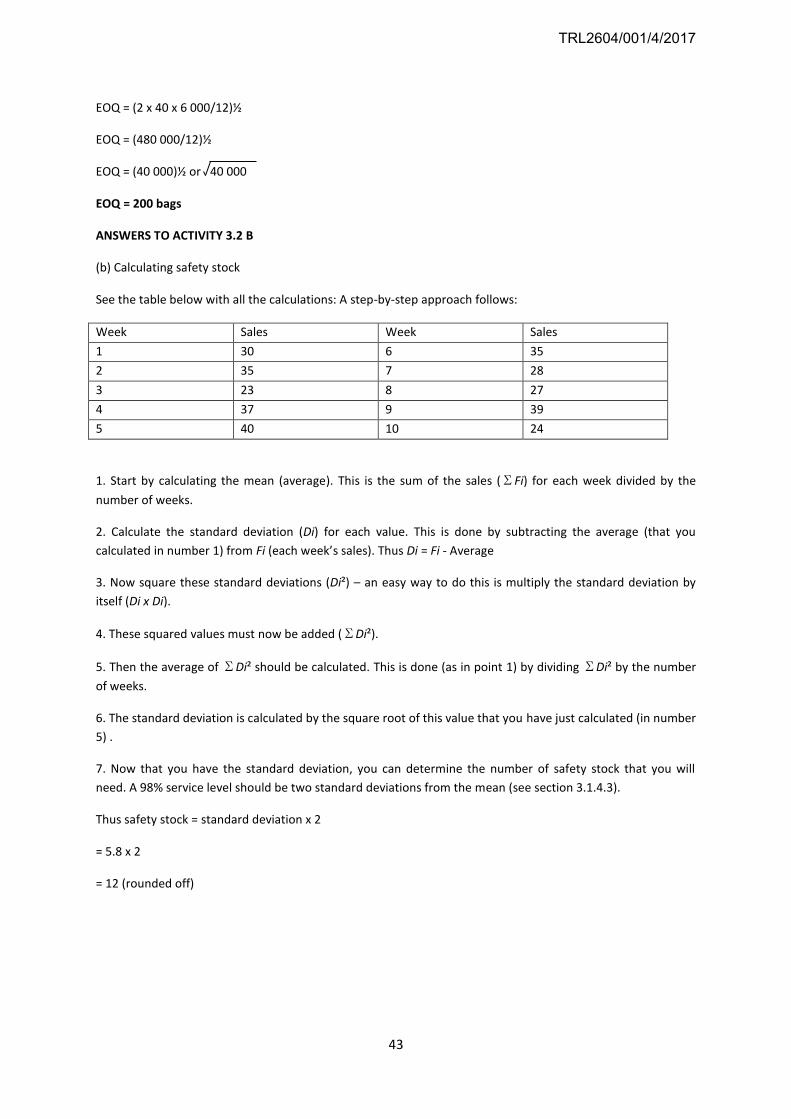
43
EOQ = (2 x 40 x 6 000/12)½
EOQ = (480 000/12)½
EOQ = (40 000)½ or 40 000
EOQ = 200 bags
ANSWERS TO ACTIVITY 3.2 B
(b) Calculating safety stock
See the table below with all the calculations: A step-by-step approach follows:
Week Sales Week Sales
1 30 6 35
2 35 7 28
3 23 8 27
4 37 9 39
5 40 10 24
1. Start by calculating the mean (average). This is the sum of the sales (ΣFi) for each week divided by the
number of weeks.
2. Calculate the standard deviation (Di) for each value. This is done by subtracting the average (that you
calculated in number 1) from Fi (each week’s sales). Thus Di = Fi - Average
3. Now square these standard deviations (Di²) – an easy way to do this is multiply the standard deviation by
itself (Di x Di).
4. These squared values must now be added (ΣDi²).
5. Then the average of ΣDi² should be calculated. This is done (as in point 1) by dividing ΣDi² by the number
of weeks.
6. The standard deviation is calculated by the square root of this value that you have just calculated (in number
5) .
7. Now that you have the standard deviation, you can determine the number of safety stock that you will
need. A 98% service level should be two standard deviations from the mean (see section 3.1.4.3).
Thus safety stock = standard deviation x 2
= 5.8 x 2
= 12 (rounded off)
TRL2604/001/4/2017
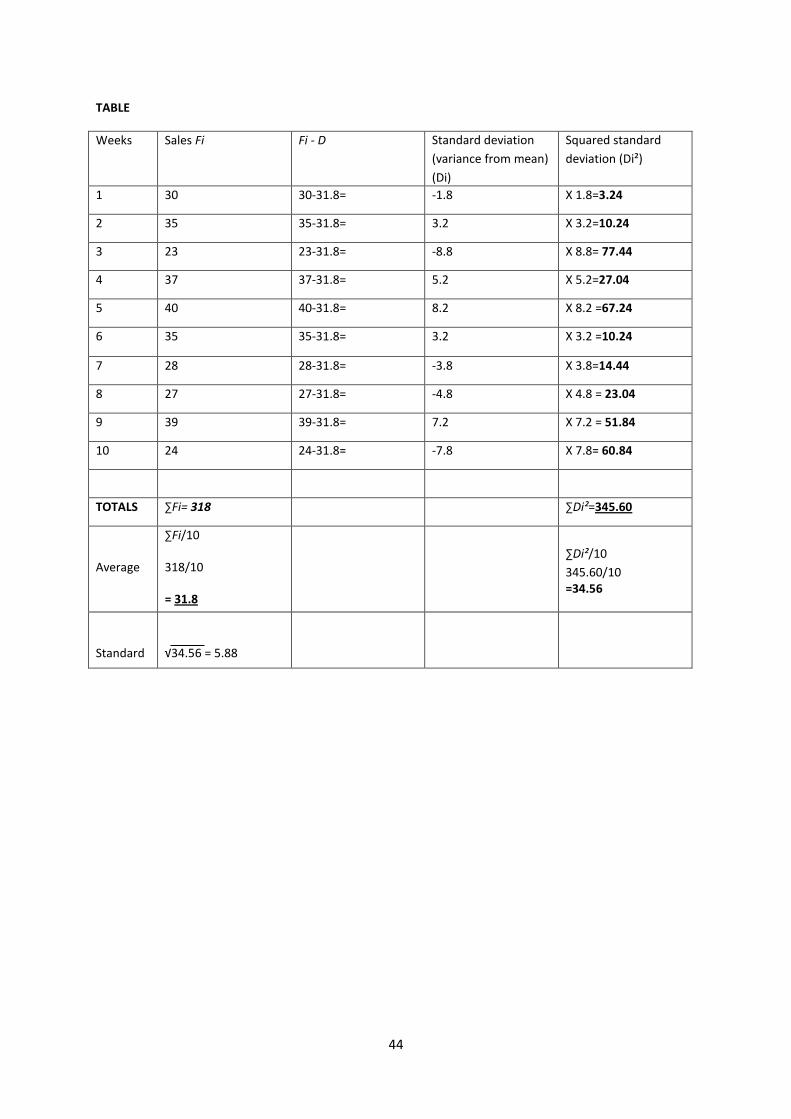
44
TABLE
Weeks Sales Fi Fi - D Standard deviation
(variance from mean)
(Di)
Squared standard
deviation (Di²)
1
1
30
30
30-31.8=
30 – 31.8 =
-1.8
-1.8
X 1.8=3.24
× 1.8 = 3.24 2
2
35
35
35-31.8=
35 – 31.8 =
3.2
3.2
X 3.2=10.24
× 3.2 = 10.243
3
23
23
23-31.8=
23 – 31.8 =
-8.8
-8.8
X 8.8= 77.44
× 8.8 = 77.44 4
4
37
37
37-31.8=
37– 31.8 =
5.2
5.2
X 5.2=27.04
× 5.2 = 27.04 5
5
40
40
40-31.8=
40 – 31.8 =
8.2
8.2
X 8.2 =67.24
× 8.2 = 67.24 6
6
35
35
35-31.8=
35 – 31.8 =
3.2
3.2
X 3.2 =10.24
7
7
28
28
28-31.8=
28 – 31.8 =
-3.8
-3.8
X 3.8=14.44
× 3.8 = 14.448
8
27
27
27-31.8=
27 – 31.8 =
-4.8
-4.8
X 4.8 = 23.04
× 4.8 = 23.04 9
9
39
39
39-31.8=
39 – 31.8 =
7.2
7.2
X 7.2 = 51.84
× 7.2 = 51.84 10
10
24
24
24-31.8=
24 – 31.8 =
-7.8
-7.8
X 7.8= 60.84
× 7.8 = 60.84
TOTALS
Totals
∑Fi= 318
∑Fi = 318
∑Di²=345.60
∑Di² = 345.60
Average
∑Fi/10
318/10
= 31.8
∑Di²/10
345.60/10 =34.56
= 34.56Standard
deviation
√34.56 = 5.88
45
CONTENTS
4.1 INTEGRATED LOGISTICS
4.2 OPERATIONAL OBJECTIVES
4.3 BARRIERS TO INTERNAL INTEGRATION
4.4 SUMMARY
4.5 SELF-ASSESSMENT QUESTIONS
PURPOSE
The purpose of this study unit is to enable you to contribute towards minimising total logistics costs in
business by understanding the integration between customer relationship management, manufacturing
production and procurement as well as the flow of inventory between these logistical components.
OUTCOMES
After working through this study unit, you will be able to
(1) provide a framework for internal operational integration
(2) explain inventory and information flows which serve as a basis for integrating
(a) customer relationship management
(b) manufacturing production
(c) procurement
(3) review the operating objectives which can be achieved through integrated logistics
(4) consider barriers preventing effective internal integration
4.1 INTEGRATED LOGISTICS
4.1.1 Coordinating the components of logistics operations__________________________________________
Thus far in this module we have discussed integrated logistics in terms of the coordination of logistics activities
(such as inventory, transport, warehousing, and so forth), which requires various trade-offs in order to achieve
the logistics goal of superior service at the lowest total cost. Refer to figure 4.1.
STUDY UNIT 4
FRAMEWORK FOR INTEGRATING LOGISTICS OPERATIONS
TRL2604/001/4/2017
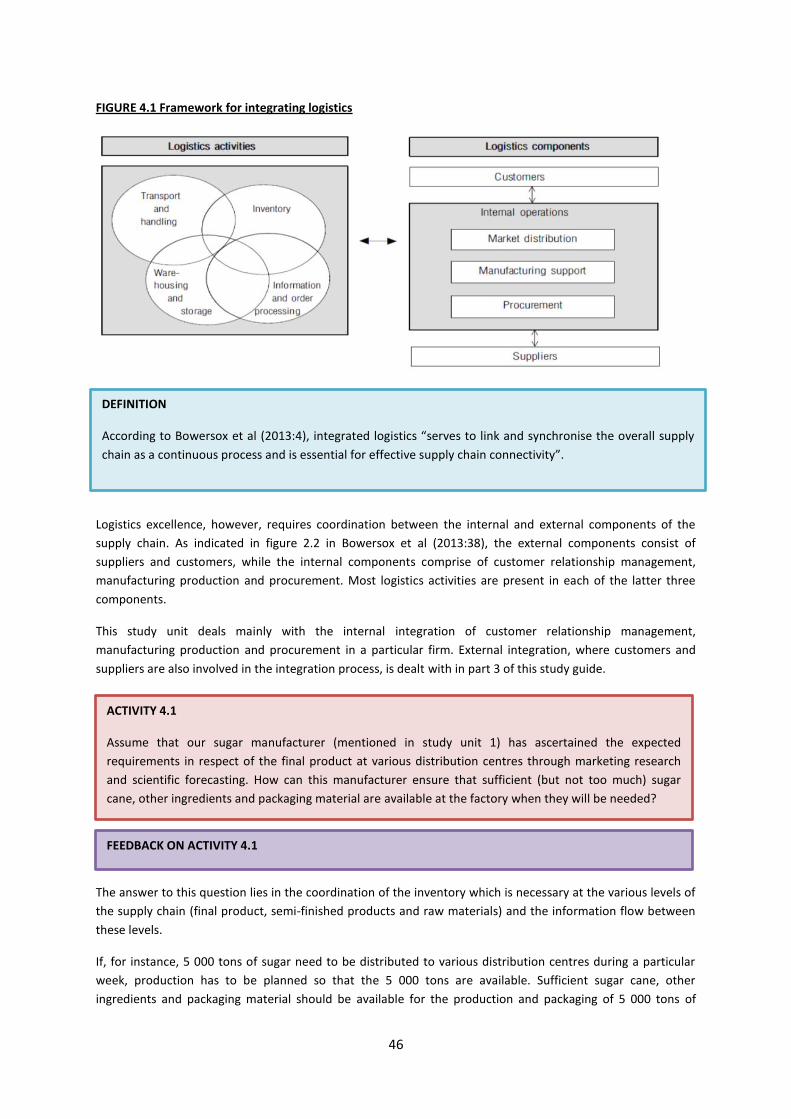
46
FIGURE 4.1 Framework for integrating logistics
Logistics excellence, however, requires coordination between the internal and external components of the
supply chain. As indicated in figure 2.2 in Bowersox et al (2013:38), the external components consist of
suppliers and customers, while the internal components comprise of customer relationship management,
manufacturing production and procurement. Most logistics activities are present in each of the latter three
components.
This study unit deals mainly with the internal integration of customer relationship management,
manufacturing production and procurement in a particular firm. External integration, where customers and
suppliers are also involved in the integration process, is dealt with in part 3 of this study guide.
The answer to this question lies in the coordination of the inventory which is necessary at the various levels of
the supply chain (final product, semi-finished products and raw materials) and the information flow between
these levels.
If, for instance, 5 000 tons of sugar need to be distributed to various distribution centres during a particular
week, production has to be planned so that the 5 000 tons are available. Sufficient sugar cane, other
ingredients and packaging material should be available for the production and packaging of 5 000 tons of
ACTIVITY 4.1
Assume that our sugar manufacturer (mentioned in study unit 1) has ascertained the expected
requirements in respect of the final product at various distribution centres through marketing research
and scientific forecasting. How can this manufacturer ensure that sufficient (but not too much) sugar
cane, other ingredients and packaging material are available at the factory when they will be needed?
FEEDBACK ON ACTIVITY 4.1
DEFINITION
According to Bowersox et al (2013:4), integrated logistics “serves to link and synchronise the overall supply
chain as a continuous process and is essential for effective supply chain connectivity”.
47
sugar. If the process is not coordinated properly, the sugar manufacturer may find that there is sugar cane for
10 000 tons or 2 000 tons, resulting in either excessive or insufficient stock in order to ensure availability of the
final product.
Activity 4.1 suggests that the integrated logistics process should be viewed in terms of inventory flow and
information flow within the three components of customer relationship management, manufacturing
production and procurement.
It is clear that inventory flow and information flow form the basis of the internal integration of logistics
operations.
4.1.2 Inventory flow__________________________________________________________________________
Without inventory flow there would be no logistics system. This section focuses on inventory flow within the
three components of logistics operations.
Did you note the following?
(1) Value is added to materials at each step of their transformation into finished inventory.
(2) Although the activities performed in customer relationship management, manufacturing production and
procurement are similar; there is a difference in the specific operating concerns and objectives.
By integrating inventory flows in these components, money can be saved in the form of reduced inventories in
respect of manufacturing production (semi-finished products) and procurement (materials).
In table 2.2 in Bowersox et al (2013:40), the differences in the operating concerns are summarised, and it is
evident that the basic activities of logistics (inventories, storage, handling and transport) feature in all three
components.
The main observation to be emphasised is that the three internal components of logistics overlap. The main
concern of an integrated logistics process is to coordinate overall, value-added inventory movement.
Integrated logistics is concerned with the strategic management of total movement and storage.
ACTIVITY 4.2
Study Bowersox et al (2013:38) for the conceptualisation of a framework for operational integration.
What are the main elements in the coordination process?
FEEDBACK ON ACTIVITY 4.2
ACTIVITY 4.3
Study Bowersox et al (2013:38-40) and write notes on the differences in inventory flow which are
necessary within customer relationship management, manufacturing production and procurement.
FEEDBACK ON ACTIVITY 4.3
TRL2604/001/4/2017
48
To put what has just been said in another way, we can say that customer relationship management,
manufacturing production and procurement combine to provide integrated management of materials, semi-
finished components and products moving between factories (plants), warehouses, supply sources and
customers.
The inventory flows for customer accommodation rely mainly on sales forecasts for the final product and have
to take into account the uncertainty of consumer demand. Inventories for semi-finished products and
materials depend on customer accommodation needs and are controlled by the manufacturing enterprise.
This process of integrating customer relationship management, manufacturing production and procurement
will be explained in more practical terms in study unit 8, which deals with logistics requirement planning.
4.1.3 Information flow_______________________________________________________________________
In this section you should only take note of the important role of information flow for the effective integration
of internal logistics operations. This topic will be addressed in more detail in the third-year modules.
Without relevant information, planning and operating the logistics system is impossible and will result in either
excessive inventories or non-availability of inventories.
Bowersox et al (2013:40) distinguish between information flow for logistics planning and coordination, on the
one hand, and information flow for logistics operations, on the other.
The purpose of information for logistics planning and coordination is to integrate specific activities in a
company and to facilitate overall integrated performance. The purpose of operational information is to
provide detailed data which is required for the integrated performance of customer relationship management,
manufacturing production and procurement operations.
Whereas planning/coordination information flows provide information on planned activities, operational
requirements are needed for the coordination of the day-to-day logistics work. Note that inventory
deployment interfaces with both planning and operations requirements. While inventory management is
performed on a daily basis, the deployment plan specifies the timing of where inventory will be positioned.
4.2 OPERATIONAL OBJECTIVES
Within the operations integration framework of coordinating customer relationship management,
manufacturing production and procurement through inventory and information flows, another key question
arises:
What do we hope to achieve by integrating internal operations?
Having studied the role of inventory flow and information flow in the coordination of customer relationship
management, manufacturing production and procurement, it should be clear that certain operational
objectives must be achieved in order to fully exploit logistical competency. A logical objective which can be
deduced from the above discussion is that of minimum inventories within all three of the components.
There are at least six different operational objectives which are the primary determinants of logistical
performance:
(1) responsiveness
(2) variance reduction
(3) inventory reduction
49
(4) movement consolidation
(5) quality
(6) life cycle support
All of them contribute to achieving the ultimate goal of integrated logistics, namely superior service at the
lowest total costs.
The operational objectives focus on both logistics costs and service quality. In studying these objectives, did
you notice that achieving them can effect savings in business, amounting to thousands if not millions of rand?
The key to achieving these objectives is to coordinate customer relationship management, manufacturing
production and procurement by managing inventory and information flows.
4.3 BARRIERS TO INTERNAL INTEGRATION_______________________________________________________
The implementation of internal logistics operations does not occur in a vacuum, but is influenced by various
internal and external factors. The barriers to internal integration stem from
(1) the organisation as a whole
(2) the measurement and rewards systems
(3) inventory leveraging
(4) an infocratic structure
(5) knowledge hoarding
This makes effective integration a difficult task. However, once these barriers have been identified, measures
can be introduced to overcome most of them.
ACTIVITY 4.4
Study Bowersox et al (2013:5–6, 40-42 & 288-291). Then,
(1) define each operational objective of integrated logistics
(2) indicate how attaining these objectives can contribute to achieving the lowest total logistics costs
(3) note that the integration of customer relationship management, manufacturing production and procurement
facilitates the achievement of operational objectives
ACTIVITY 4.5
Study Bowersox et al (2013:347–349). Then answer the following questions:
(1) What major obstacles inhibit internal logistics operation integration?
(2) What measures can be introduced to overcome these obstacles?
FEEDBACK ON ACTIVITY 4.4
TRL2604/001/4/2017
50
It should be clear that knowing what the obstacles are beforehand can facilitate the introduction of measures
to overcome them, thus allowing the implementation of integrated logistics.
Logistical operations can be divided into three components: customer relationship management,
manufacturing production and procurement. To achieve internal integration, the inventory and information
flows between these components must be coordinated. The three components must be synchronised with a
view to achieving the operational objectives of logistics. There are also various barriers that inhibit the process
of internal integration, but these can be counteracted.
Refer back to the study unit outcomes formulated at the beginning of the study unit and determine whether
you have achieved them by answering the self-assessment questions below.
(1) Distinguish between customer relationship management, manufacturing production and procurement as
three components of internal logistical operations which need to be coordinated.
(2) Discuss in detail the role of inventory flow and information flow in internal logistics operations integration.
(3) Identify and discuss six specific operational objectives which serve as the primary determinants of logistical
performance.
(4) Discuss the barriers which frequently prevent businesses from achieving internal logistics integration.
Also indicate what measures can be introduced to overcome these obstacles.
4.4 SUMMARY
4.5 SELF-ASSESSMENT QUESTIONS
FEEDBACK ON ACTIVITY 4.5
51
CONTENTS
5.1 LOGISTICS PERFORMANCE CYCLES AS A BASIS FOR INTEGRATION
5.2 PERFORMANCE CYCLES WITHIN EACH LOGISTICS COMPONENT
5.3 MANAGING OPERATIONAL UNCERTAINTY
5.4 SUMMARY
5.5 SELF-ASSESSMENT QUESTIONS
PURPOSE
The purpose of this study unit is to explain how you can contribute towards minimising lowest total logistics
costs by understanding the performance cycle structure and the management of performance cycle
uncertainty.
OUTCOMES
After working through this study unit, you will be able to
(1) describe how performance cycle structures serve as a basic unit of analysis in order to achieve internal
operations integration
(2) explain the characteristics of each performance cycle and differences between them within each logistics
component
(3) provide an overview of how operational uncertainty can be managed
5.1 LOGISTICS PERFORMANCE CYCLES AS A BASIS FOR INTEGRATION
This can best be described by way of a node-link relationship in which the facilities within and outside a firm
(such as production plants, warehouses, depots, suppliers and customers) are regarded as nodes, with the
movement and communication between these nodes being the links. A simple node-link relationship is
depicted in figure 5.1 below.
STUDY UNIT 5
LOGISTICS PERFORMANCE CYCLES
DEFINITION
Logistics performance cycles link together suppliers, facilities within the firm and customers by means of
transportation and communication.
TRL2604/001/4/2017
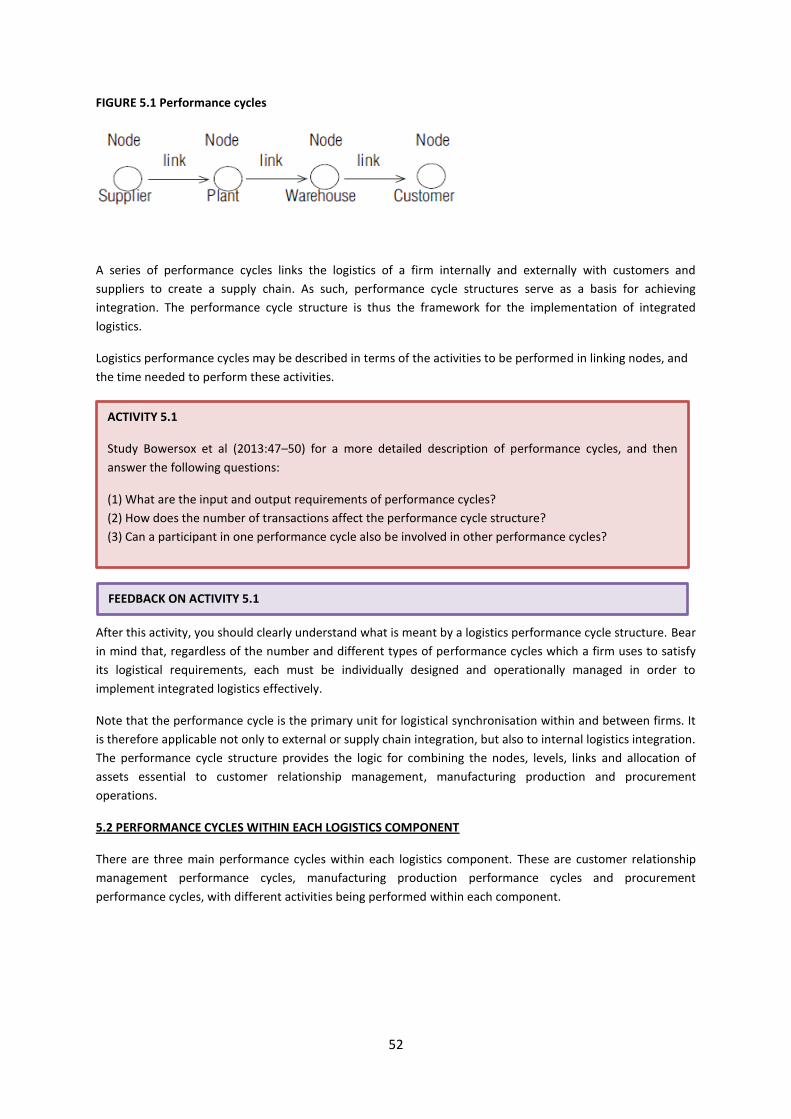
52
FIGURE 5.1 Performance cycles
A series of performance cycles links the logistics of a firm internally and externally with customers and
suppliers to create a supply chain. As such, performance cycle structures serve as a basis for achieving
integration. The performance cycle structure is thus the framework for the implementation of integrated
logistics.
Logistics performance cycles may be described in terms of the activities to be performed in linking nodes, and
the time needed to perform these activities.
After this activity, you should clearly understand what is meant by a logistics performance cycle structure. Bear
in mind that, regardless of the number and different types of performance cycles which a firm uses to satisfy
its logistical requirements, each must be individually designed and operationally managed in order to
implement integrated logistics effectively.
Note that the performance cycle is the primary unit for logistical synchronisation within and between firms. It
is therefore applicable not only to external or supply chain integration, but also to internal logistics integration.
The performance cycle structure provides the logic for combining the nodes, levels, links and allocation of
assets essential to customer relationship management, manufacturing production and procurement
operations.
5.2 PERFORMANCE CYCLES WITHIN EACH LOGISTICS COMPONENT
There are three main performance cycles within each logistics component. These are customer relationship
management performance cycles, manufacturing production performance cycles and procurement
performance cycles, with different activities being performed within each component.
ACTIVITY 5.1
Study Bowersox et al (2013:47–50) for a more detailed description of performance cycles, and then
answer the following questions:
(1) What are the input and output requirements of performance cycles?
(2) How does the number of transactions affect the performance cycle structure?
(3) Can a participant in one performance cycle also be involved in other performance cycles?
FEEDBACK ON ACTIVITY 5.1
53
In the above example, at least five different performance cycles can be identified, three procurement
performance cycles and two customer relationship management performance cycles. There will, however, be
more since internal links between factory and warehouse may result in one or more manufacturing production
performance cycles.
The characteristics and the differences of the three performance cycle are summarised in table 5.1.
Performance cycle Characteristics and differences
Procurement
• This consists of the many activities that maintain theflow of materials, parts, or finished goods into amanufacturing or distribution facility.• The scope of procurement activities is limited.• Although similar to the customer order processing cycle,shipments are generally larger and cycles often requiremuch more time and are therefore usually longer thancustomer accommodation performance cycles.• Maintaining raw materials inventory is sometimes lessexpensive relative to finished goods, since the time ofdelivery and material security is often less sensitive intofacility than out to the customer.• The number of suppliers of a firm is generally less thanthe number of customers, making the procurement cyclemore direct.
Manufacturing production
• This serves as the logistics of production.• The functions maintain orderly and economic flow ofmaterials and work-in process inventory to supportproduction schedules.• The goal is to support manufacturing requirements asefficiently as possible.• Since these are internal cycles to the firm, they arerarely affected by behavioural uncertainty.• The individual firm can exercise a great deal of controlover these cycles.
ACTIVITY 5.2
Consider the following example of some of the logistics activities required for a brewery in Gauteng:
• Crops must be acquired from a farm in the Western Cape.
• Cans and packaging materials need to be acquired from a local supplier.
• Pallets with cases of beer need to be delivered to a wholesaler.
Pallets with cases of beer need to be delivered to the local liquor stores.
(1) Identify the number of different performance cycles that will be required in this small operation.
(2) Try to classify them into customer relationship management, manufacturing production and
procurement performance cycles.
FEEDBACK ON ACTIVITY 5.2
TRL2604/001/4/2017
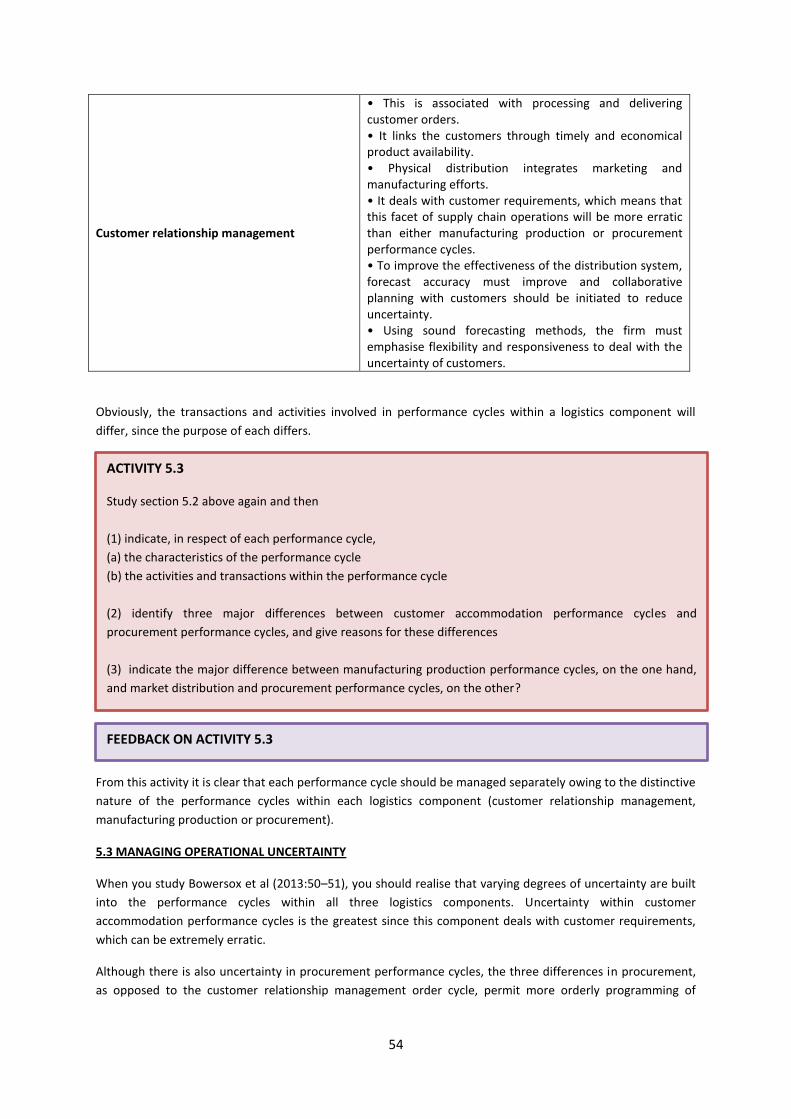
54
Customer relationship management
• This is associated with processing and deliveringcustomer orders.• It links the customers through timely and economicalproduct availability.• Physical distribution integrates marketing andmanufacturing efforts.• It deals with customer requirements, which means thatthis facet of supply chain operations will be more erraticthan either manufacturing production or procurementperformance cycles.• To improve the effectiveness of the distribution system,forecast accuracy must improve and collaborativeplanning with customers should be initiated to reduceuncertainty.• Using sound forecasting methods, the firm mustemphasise flexibility and responsiveness to deal with theuncertainty of customers.
Obviously, the transactions and activities involved in performance cycles within a logistics component will
differ, since the purpose of each differs.
From this activity it is clear that each performance cycle should be managed separately owing to the distinctive
nature of the performance cycles within each logistics component (customer relationship management,
manufacturing production or procurement).
5.3 MANAGING OPERATIONAL UNCERTAINTY
When you study Bowersox et al (2013:50–51), you should realise that varying degrees of uncertainty are built
into the performance cycles within all three logistics components. Uncertainty within customer
accommodation performance cycles is the greatest since this component deals with customer requirements,
which can be extremely erratic.
Although there is also uncertainty in procurement performance cycles, the three differences in procurement,
as opposed to the customer relationship management order cycle, permit more orderly programming of
ACTIVITY 5.3
Study section 5.2 above again and then
(1) indicate, in respect of each performance cycle,
(a) the characteristics of the performance cycle
(b) the activities and transactions within the performance cycle
(2) identify three major differences between customer accommodation performance cycles and
procurement performance cycles, and give reasons for these differences
(3) indicate the major difference between manufacturing production performance cycles, on the one hand,
and market distribution and procurement performance cycles, on the other?
FEEDBACK ON ACTIVITY 5.3
55
logistical activities, resulting in less uncertainty in procurement performance cycles. Because manufacturing
support logistics is under internal management control, operational uncertainty in this component is limited.
Although there is also uncertainty in procurement performance cycles, the three differences in procurement,
as opposed to the customer accommodation order cycle, permit more orderly programming of logistical
activities, resulting in less uncertainty in procurement performance cycles.
Since manufacturing production logistics is under internal management control, operational uncertainty within
this component is limited. It is clear that operational consistency (conforming to the expected or standard
order cycle time) is the key to effective and efficient logistics operations. This can be achieved by taking into
consideration the factors causing operational uncertainty.
If the brewery’s customers know that it will take ten days to deliver from the time that they place their orders
with the brewery, they can plan accordingly and ensure that sufficient, but not excessive, stock is available at
all times. Similarly, if the brewery knows that the order cycle time for the delivery of hops is five days, it can
plan its stock levels, which are necessary for production. Once consistent operations are achieved, an attempt
can be made to reduce performance cycle duration.
Logistical systems are best understood and evaluated in terms of performance cycle structure. The
performance cycle structure provides a logical basis for combining the nodes, links and activities essential to
customer relationship management, manufacturing production and procurement.
Although performance cycles in the respective logistics components have many similarities, there are a
number of differences regarding the nature and the degree of managerial control in each component.
It is necessary to analyse performance cycle variance. The challenge is to design a network of performance
cycles capable of doing the logistics work as rapidly and consistently as possible.
Refer back to the study unit outcomes formulated at the beginning of the study unit and determine whether
you have achieved them by answering the self-assessment questions below.
(1) Explain what is meant by a performance cycle. Use a sketch of a typical node-link relationship to
substantiate your answer.
(2) Clearly identify the inputs and outputs of a performance cycle.
ACTIVITY 5.4
Study Bowersox et al (2013:50–51) and then answer the following questions:
(1) What factors cause variance in each of the customer accommodation performance cycle activities, that is,
order transmission, order processing, order selection, order transportation and customer delivery?
(2) How can performance cycle management contribute to limiting operational uncertainty?
5.5 SELF-ASSESSMENT QUESTIONS
5.4 SUMMARY
FEEDBACK ON ACTIVITY 5.4
TRL2604/001/4/2017
56
(3) Describe the fundamental similarities and differences between procurement, manufacturing production
and customer relationship performance cycles.
(4) Explain why customer accommodation operations are more erratic than manufacturing and procurement
operations.
(5) Discuss uncertainty in relation to the overall logistics performance cycle. How can order cycle variance be
controlled?
57
CONTENTS
6.1 THE LOGISTICS/MARKETING INTERFACE
6.2 CUSTOMER-FOCUSED MARKETING
6.3 CUSTOMER SERVICE
6.4 CUSTOMER SATISFACTION
6.5 CUSTOMER SUCCESS
6.6 SUMMARY
6.7 SELF-ASSESSMENT QUESTIONS
PURPOSE
The purpose of this study unit is to explain how you can identify customers at various levels in the supply
chain, formulate customer service strategies for different customers and help support a specific marketing
strategy.
OUTCOMES
After working through this study unit, you will be able to
(1) explain the integration between logistics and marketing within a firm
(2) relate logistics performance to customer service
(3) provide an overview of how customers’ needs are met at the various levels
6.1 THE LOGISTICS/MARKETING INTERFACE
Most firms realise that in order to make a profit, marketing should focus on satisfying customer requirements.
Meeting customer expectations is viewed as the motivation behind all activities within the firm.
A useful way of explaining the integration between marketing and logistics is to view the marketing mix as
indicated in figure 6.1. The marketing mix consists of four policy instruments which are frequently referred to
as the four P’s: product/service, promotion, price and place. Logistics concentrates on the policy regarding
place by ensuring that the right product is available at the right place, at the right time and in the right
quantity. It therefore ensures availability of the product at the time that it is required-in other words, we can
state that logistics provides time and place utility.
STUDY UNIT 6
CUSTOMER ACCOMMODATION
TRL2604/001/4/2017
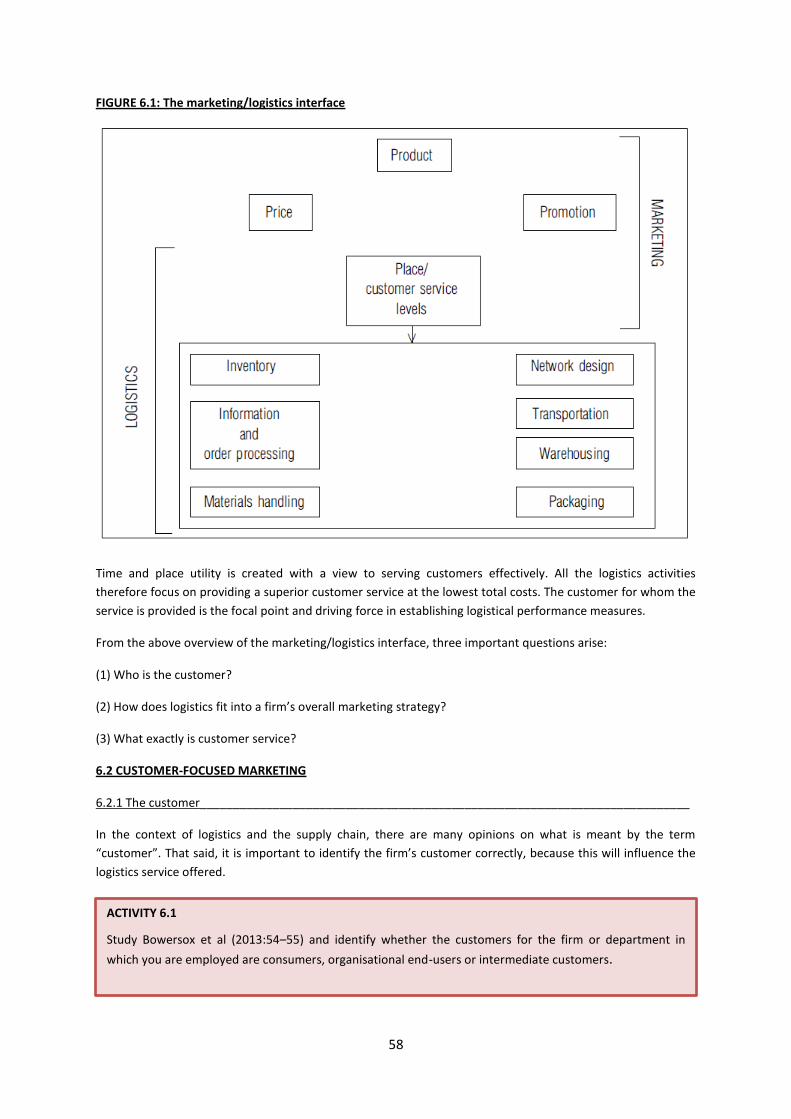
58
FIGURE 6.1: The marketing/logistics interface
Time and place utility is created with a view to serving customers effectively. All the logistics activities
therefore focus on providing a superior customer service at the lowest total costs. The customer for whom the
service is provided is the focal point and driving force in establishing logistical performance measures.
From the above overview of the marketing/logistics interface, three important questions arise:
(1) Who is the customer?
(2) How does logistics fit into a firm’s overall marketing strategy?
(3) What exactly is customer service?
6.2 CUSTOMER-FOCUSED MARKETING
6.2.1 The customer__________________________________________________________________________
In the context of logistics and the supply chain, there are many opinions on what is meant by the term
“customer”. That said, it is important to identify the firm’s customer correctly, because this will influence the
logistics service offered.
ACTIVITY 6.1
Study Bowersox et al (2013:54–55) and identify whether the customers for the firm or department in
which you are employed are consumers, organisational end-users or intermediate customers.
59
Did you notice that, from a logistics point of view, a customer is any delivery location? A customer may even
be a person or point within the firm.
6.2.2 Logistics and the marketing concept___________________________________________________
The marketing concept involves identifying specific customer needs and focusing activities on satisfying these
needs.
Did you note how logistical competency affects the ideas on which marketing is based? The three ideas are
explained briefly below.
Customer needs are more important than products. It is necessary to establish the needs of customers before
producing a product. Why, for instance, are beer or cold-drink bottles and cans round and not square? If they
were square, stowability would be improved in that more of them could be packed into a crate or onto a
pallet. However, they are round because customers prefer round containers, for the simple reason that it is
easier and more comfortable to hold a round can in one’s hand.
Market segmentation requires the identification of target markets based on homogeneous features. Different
customers with similar logistics requirements can be the basis for classification into a specific target market.
Products/services must be available. We mentioned above that logistics creates time and place utility. A
product is not marketable if it is not available at the place and time required. No customer can be served if the
product is not available.
Profit is more important than the volume of products sold. All businesses are in business to make a profit.
Individual consumer requirements (such as the example in Bowersox et al (2013:56) of a uniquely coloured
appliance) may result in high costs. These unique requirements should be met only if the customer is prepared
to pay for them.
6.2.3 Transactional versus relationship marketing__________________________________________________
In customer-focused marketing it is important to distinguish between transactional and relationship
marketing.
ACTIVITY 6.2
Study Bowersox et al (2013:55–56) and then write notes on the fundamental ideas on which the marketing
concept is based.
FEEDBACK ON ACTIVITY 6.2
ACTIVITY 6.3
Study Bowersox et al (2013:56–57). Pay particular attention to the strategies of a transactional approach
and the steps involved in a one-to-one marketing programme. Explain to a friend the differences between
transactional and relationship marketing and state why you would use a relationship approach in a supply
chain context.
FEEDBACK ON ACTIVITY 6.1
TRL2604/001/4/2017
60
Did you notice how the unique requirements of a specific customer can be accommodated in relationship
marketing?
According to the modern interpretation of the marketing concept, developing relationships with customers is
more important than perfect individual transactions. This interpretation focuses on the needs and
requirements of individual customers as the main element of one-to-one marketing.
6.2.4 Supply chain service outputs______________________________________________________________
From the above discussion it is clear that, in a supply chain context, logistical operations must accommodate
customer requirements. These requirements feature, to a great extent, in the supply chain service outputs –
see the discussion in Bowersox et al (2013: 57-59).
The generic service outputs (spatial convenience, batch size, waiting time and product variety and assortment)
focus mainly on end-users in the supply chain. It is clear that different customers have different requirements
as far as each service output is concerned. These different requirements have various logistical services and
cost implications in terms of the number of warehouses, delivery frequency, order processing, packaging
configurations, and so forth.
In the following sections of this study unit, we discuss the increasing levels of sophistication in customer
accommodation in a logistical context. These levels range from the traditional view of customer service to
customer satisfaction (meeting customer expectations) to customer success (helping customers to be
successful in meeting their business requirements).
6.3 CUSTOMER SERVICE
6.3.1 Basic customer service__________________________________________________________________
In study unit 1, we stated that the overall goal of logistics is to achieve a predetermined or target level of
customer service at the lowest total cost. We also made the point that logistical competency can result in a
competitive advantage for the company concerned. The attributes (characteristics) of basic customer service
were also (briefly) identified as availability, operational performance and service reliability.
FEEDBACK ON ACTIVITY 6.3
ACTIVITY 6.4
Study Bowersox et al (2013:57-59). Make a summary of the generic supply chain service inputs. What are
the implications for logistics costs?
FEEDBACK ON ACTIVITY 6.4
ACTIVITY 6.5
Study Bowersox et al (2013:59–62) and then answer the following questions:
(1) What is meant by customer service?
(2) What is meant by availability and how can it be measured?
(3) What measures of operational performance are there? List and discuss at least four such measures,
and indicate the importance of each in customer service.
(4) What is meant by reliability and how can it be measured?
61
During this exercise you would have noticed that it is futile having a customer service policy and developing
customer service strategies without being able to measure the attributes of customer service.
This exercise can be valuable to any company in benchmarking its performance; in other words, how does your
customer service compare with that of your competitors? Customer service levels can be improved only if you
know how you are currently performing.
However, superior service can be quite costly and a trade-off has to be made between the cost of customer
service and the benefits which can be achieved through a certain level of customer service. This trade-off is
discussed in study unit 7.
6.3.2 The perfect order (zero defect) ____________________________________________________________
Since this commitment is expensive, it is offered only to customers who are willing to respond to such
exceptional performance by showing increased purchasing loyalty.
When doing the above activity you should have realised that the perfect order strategy will be adopted only
for selected customers who are willing to commit themselves to significant future business. Perfect order
performance commitment is commitment over and above a firm’s basic service programme, and is introduced
to ensure loyalty on the part of key customers. Basic service involves treating all customers equally at a
specified level in order to build up and maintain overall customer loyalty, while perfect order commitment is
offered to selected customers as a way of gaining and maintaining preferred supplier status.
6.4 CUSTOMER SATISFACTION
Now that you have a clear understanding of basic customer service and six-sigma performance (zero defect
service), we need to ask the following key question:
Does achieving perfect order delivery mean automatic customer satisfaction?
At face value, this seems to be the case. After all, if all orders are delivered with no defects, on what basis
could customers be dissatisfied? Part of the answer to this question can be found in the fact that perfect
orders, although important, involve only the execution of individual transactions and deliveries (which can be
related to transactional marketing).
FEEDBACK ON ACTIVITY 6.5
ACTIVITY 6.6
Study Bowersox et al (2013:62–64) and then answer the following questions:
(1) What is meant by the perfect order?
(2) Should this strategy be adopted for each customer? Substantiate your answer.
(3) What is the difference between basic service and zero defect?
FEEDBACK ON ACTIVITY 6.6
DEFINITION
A perfect order implies logistics quality, which means that everything is done right the first time. This
requires consistent commitment to promised performance every time.
TRL2604/001/4/2017
62
Customer satisfaction, however, is a much broader concept, and includes many other aspects of the overall
relationship between suppliers and customers. For example, a customer may always receive perfect orders,
but be dissatisfied with aspects of the relationship such as difficulty in obtaining information, delays in
response to enquiries and the perception that he or she is somehow not being treated in a friendly and
respectful manner. In other words, customer satisfaction goes beyond operational performance and includes
the finer points of personal and interpersonal relationships (Bowersox et al 2013:64).
The questions in activity 6.7 could have been answered as follows:
(1) Customer expectations
Reliability refers to the way the supplier performs all activities. If a courier (eg DHL or Fedex)
promises overnight delivery and fails, it will be considered unreliable, even if its delivery service is
faster than that of any other courier. Customers tend to judge reliability in terms of all the parts that
make up basic service.
Responsiveness refers to the customer’s expectation of the ability and willingness to provide timely
service. If Woolworths experiences a stockout of a certain product, its supplier’s responsiveness will
be measured by the time it takes to replenish the stock.
Access measures the ease of contact and the approachability of the supplier. For example, the ease
of obtaining information about the status of a pending order will be used as a measurement of
accessibility.
Communication means keeping the customer informed and doing so proactively. If the supplier
expects there to be a shortage of raw material that may influence future deliveries, an advance
notice to the customer will not only help to explore an alternative, but will also build a stronger
partnership.
Credibility refers to the customer’s expectation that any communication from the suppliers will be
both believable and honest. The real “essence” of this is the completeness of the information.
Security refers to the customer’s feeling of riskiness in doing business with a supplier. For example,
suppose a customer drafts its production schedule in anticipation of delivery. If the supply is delayed,
the customer faces the risk of having to suddenly change plans. Another aspect of security is the
confidentiality of business dealings with a supplier.
Courtesy involves politeness, friendliness and respect for the contact person. Since the customer may
have to deal with different individuals in the supplier’s organisation, bad behaviour by one person
can undo the best efforts of everybody else.
A supplier’s competency is judged (by the customer) in every interaction. A truck driver’s
competency is therefore measured when deliveries are made, customer service personnel when
ACTIVITY 6.7
Study Bowersox et al (2013:64–70) and then answer the following questions:
(1) Using the ten (10) categories of customer expectations, think of examples of how customers might
evaluate performance.
(2) Which of the gaps in the satisfaction and quality model do you think represent the major problem for
most firms?
(3) How can an organisation attempt to eliminate the knowledge gap and the communication gap?
FEEDBACK ON ACTIVITY 6.7
63
phone calls are made, etc. In other words, individual failure may affect the customer’s perception of
the supplier as a whole.
Tangibles refer to the customer’s expectation of the physical appearances of facilities, equipment
and personnel. For example, an old and badly maintained warehouse may be regarded as an
indicator of the firm’s overall performance to its customers.
“Knowing the customer” refers to the customer’s expectation that the supplier will understand the
customer’s unique requirements and be willing to adapt to these needs. For example, Woolworths
expects its suppliers to understand its unique needs and respond to these needs accordingly.
(2) Gaps representing the major problem for most firms
Knowledge, performance and communications gaps represent the major concerns for most firms. The other
gaps are derivatives of these three.
gap 1: Knowledge
gap 2: Standards
gap 3: Performance
gap 4: Communication
gap 5: Perception
gap 6: Satisfaction/quality
(You should be able to describe the above gaps.)
(3) Knowledge and communication gaps
The knowledge gap is a result of the gap between the customer’s actual expectations and the supplier’s
perception of those expectations. A thorough understanding of the customer’s expectations, how they are
formed and how they are prioritised can reduce this gap.
The communication gap is the result of over commitment or promising higher levels of performance than the
supplier can achieve. Making realistic promises to customers and then keeping to these promises can reduce
this gap. Customers should also be made aware of what the firm is capable of doing.
6.5 CUSTOMER SUCCESS
The highest level of customer accommodation is customer success. This boils down to helping customers be
successful by meeting their business requirements. The success of a firm frequently depends on the success of
its major customers. If a firm can contribute to its customers’ successes, the firm itself will become more
successful.
ACTIVITY 6.8
Study Bowersox et al (2013:70–72) and section 6.5 in this study unit. Then answer the following questions:
(1) What is meant by value-added services? Why are these services considered essential in a customer
success programme?
(2) How could a company use the four-stage process of cost-effectiveness, market access, market extension
and market creation to gain a competitive advantage?
TRL2604/001/4/2017
64
Value-added services refer to the unique (tailored) and specific activities that firms can undertake jointly to
improve efficiency and effectiveness. These services are usually customer specific and therefore cannot be
generalised. Value-added services are considered essential because, by providing unique product packages,
creating customised unit loads, offering unique information services and so forth, firms improve their
customers’ chances of success. It is also clear that a competitive advantage can be gained by rendering value-
added services to specific customers, irrespective of whether such services are rendered by the firm itself or by
service specialists such as carriers and warehousing specialists.
The four-stage process is as follows:
Cost-effectiveness is the first and most fundamental step of logistical competency as a means of
gaining a competitive advantage. It is essential for a firm to provide basic services consistently and
cost-effectively. Without this basic prerequisite, there is only a limited possibility of the supplier
building any relationship with its customers.
The market access stage represents a higher level of commitment to those customers who are willing
to cooperate. This stage involves sharing basic information between the buyers and sellers to
facilitate smooth delivery. This stage, however, does not require a high degree of customer
selectivity.
Market extension aims to move towards zero defects and to introduce value-added services in order
to build and strengthen business relationships. A great deal of customer selectivity occurs during this
stage, since only a limited number of customers will be willing or able to participate. Those companies
that are willing to participate might, for example, be involved in innovative value-added services
designed to increase operating efficiency and improve overall competitiveness.
Market creation is the final stage and, if the customer is to be successful, this requires total
commitment. Market creation could involve creative arrangements such as establishing electronic
link-ups between suppliers and customers. Building such relationships obviously takes time and
success requires a long-term commitment.
Bowersox et al (2013:76-77) provide an excellent summary of the topics covered in this study unit. Make a
point of reading this section of the prescribed book.
Refer back to the study unit outcomes formulated at the beginning of the study unit and determine whether
you have achieved them by answering the self-assessment questions below.
(1) With the aid of an appropriate sketch, briefly explain the interface between marketing and logistics.
(2) Distinguish between consumers, organisational users and intermediate customers as different kinds of
customers in the supply chain. Who would be the logistician’s customer?
(3) Briefly explain the fundamental ideas on which the marketing concept is based and indicate how logistical
competency affects these ideas.
FEEDBACK ON ACTIVITY 6.8
6.6 SUMMARY
6.7 SELF-ASSESSMENT QUESTIONS
65
(4) Contrast transactional marketing with relationship marketing and indicate how the differences between
these two result in increasing emphasis on logistical performance in the supply chain.
(5) Why are the four generic service outputs of spatial convenience, batch size, waiting time and product
variety important to logistics management? Give examples of competing firms that differ in the level of
service output provided by the customer.
(6) Define the quantitative criteria used for the ongoing evaluation of basic customer service.
(7) Define availability and discuss ways of measuring and tracking it.
(8) Compare and contrast speed, consistency and flexibility as operational performance activities. Is one
activity more critical than the other in certain situations? Substantiate your answer.
(9) Define basic service, zero defect and value-added service. Give two examples of each.
(10) Fully explain the zero defect customer service strategy.
(11) Compare and contrast the customer service, customer satisfaction and customer success philosophies of
supply chain management.
(12) Fully explain customer expectations related to logistical performance.
(13) Describe a model that you would use to deliver customer satisfaction.
(14) Explain the limitations of customer satisfaction.
(15) Explain how a competitive advantage can be gained by providing value-added services.
(16) Identify four stages of developing business success based on logistical competency. How are the different
levels of customer accommodation implemented during these stages?
(17) Based on your knowledge of customer accommodation, formulate the strategies which you would adopt
in order to provide an ice cream manufacturer with a competitive advantage.
TRL2604/001/4/2017
66
CONTENTS
7.1 INTRODUCTION
7.2 THE SERVICE LEVEL/COST RELATIONSHIP
7.3 CUSTOMER SERVICE COSTS
7.4 THE COST OF LOST SALES
7.5 TRADE-OFF BETWEEN COSTS AND BENEFITS OF CUSTOMER SERVICE
7.6 CUSTOMER SERVICE EFFICIENCY
7.7 SUMMARY
7.8 SELF-ASSESSMENT QUESTIONS
PURPOSE
The purpose of this study unit is to explain how you can contribute towards minimising total logistics costs in
business by understanding how to trade customer service levels off against the costs of customer
accommodation.
OUTCOMES
After working through this study unit, you will be able to
(1) list the costs involved in customer service
(2) identify the principles applied in finding an optimum level of service
(3) explain the trade-off between the costs of customer service and the cost of lost sales through poor service
7.1 INTRODUCTION
There are no references to the prescribed book by Bowersox et al (2013) in this study unit. This does not mean
that you do not have to study this study unit. It is a vital part of the study material for this module. This study
unit is therefore based on other material, particularly that of Gattorna et al (1991:22–28) and Stock and
Lambert (2001:105–110).
Deciding on the level of basic service offering requires an analysis of the trade-off between the costs of
rendering a superior service and the benefits of such service, with the benefits being mostly the prevention or
avoidance of the cost of lost sales through poor service. The costs of customer service are mainly the costs
involved in the various activities needed to ensure availability of the right product at the right place, at the
right time and in the right quantities.
STUDY UNIT 7
CUSTOMER SERVICE COSTS AND EFFICIENCY
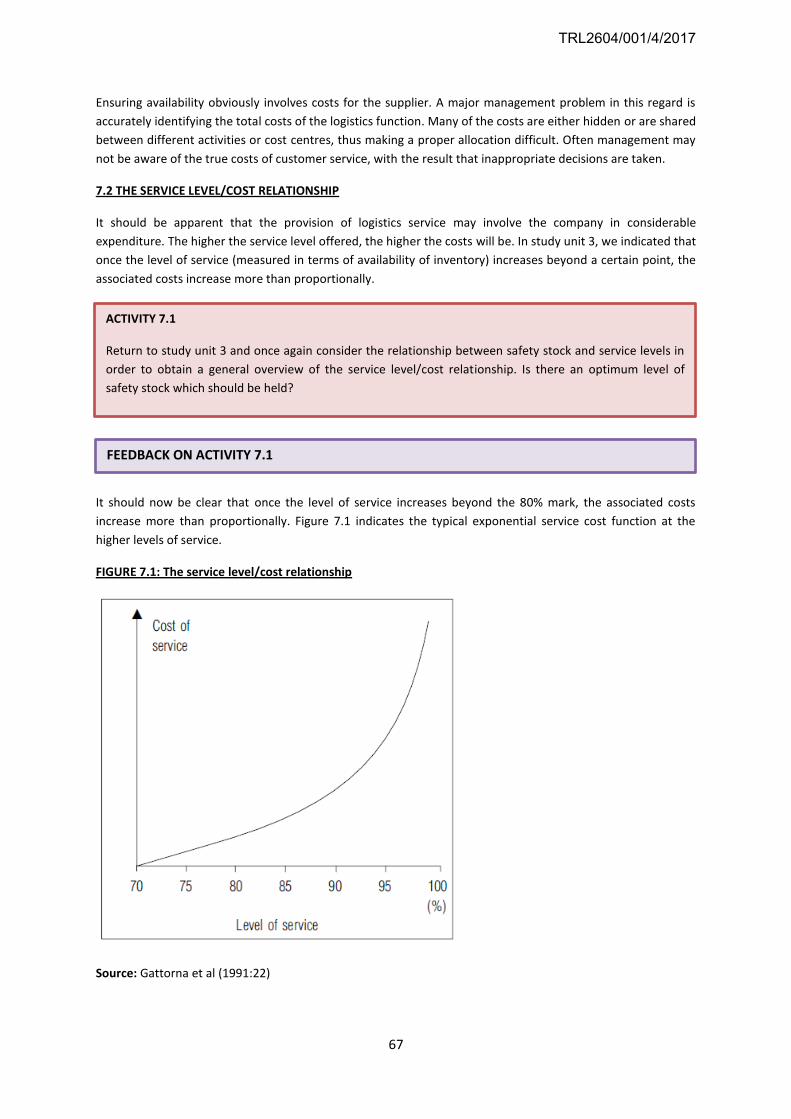
67
Ensuring availability obviously involves costs for the supplier. A major management problem in this regard is
accurately identifying the total costs of the logistics function. Many of the costs are either hidden or are shared
between different activities or cost centres, thus making a proper allocation difficult. Often management may
not be aware of the true costs of customer service, with the result that inappropriate decisions are taken.
7.2 THE SERVICE LEVEL/COST RELATIONSHIP
It should be apparent that the provision of logistics service may involve the company in considerable
expenditure. The higher the service level offered, the higher the costs will be. In study unit 3, we indicated that
once the level of service (measured in terms of availability of inventory) increases beyond a certain point, the
associated costs increase more than proportionally.
It should now be clear that once the level of service increases beyond the 80% mark, the associated costs
increase more than proportionally. Figure 7.1 indicates the typical exponential service cost function at the
higher levels of service.
FIGURE 7.1: The service level/cost relationship
Source: Gattorna et al (1991:22)
ACTIVITY 7.1
Return to study unit 3 and once again consider the relationship between safety stock and service levels in
order to obtain a general overview of the service level/cost relationship. Is there an optimum level of
safety stock which should be held?
FEEDBACK ON ACTIVITY 7.1
TRL2604/001/4/2017
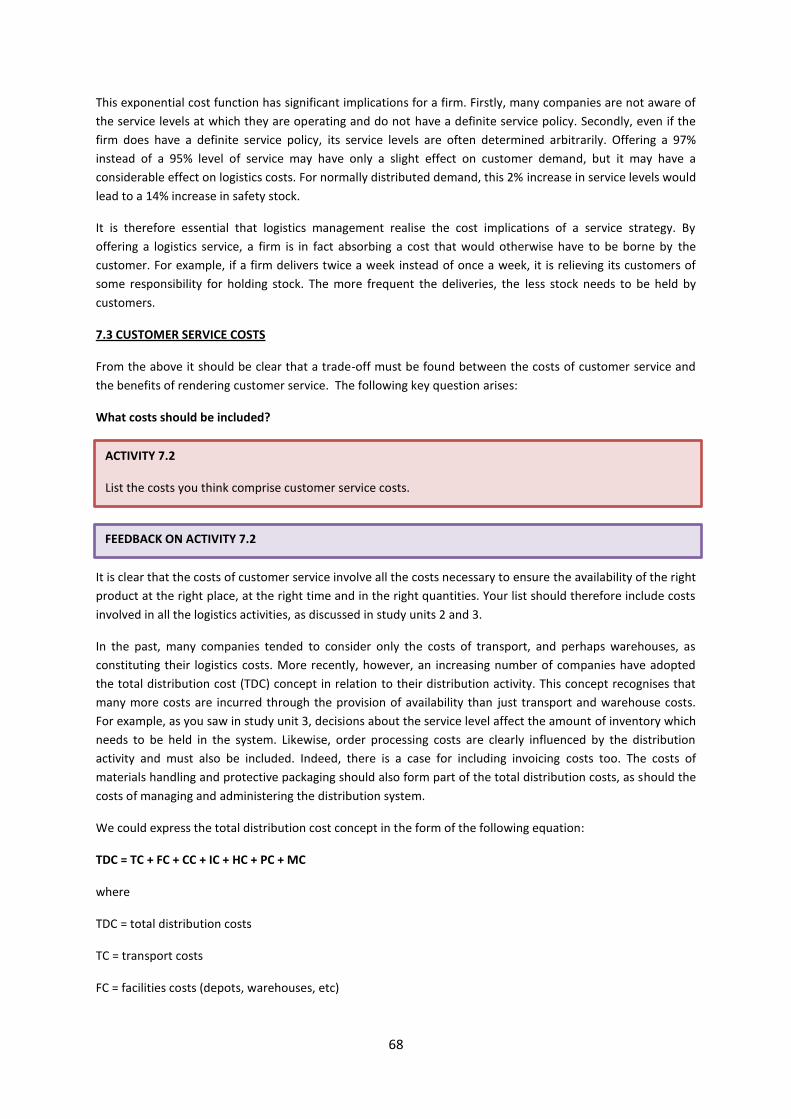
68
This exponential cost function has significant implications for a firm. Firstly, many companies are not aware of
the service levels at which they are operating and do not have a definite service policy. Secondly, even if the
firm does have a definite service policy, its service levels are often determined arbitrarily. Offering a 97%
instead of a 95% level of service may have only a slight effect on customer demand, but it may have a
considerable effect on logistics costs. For normally distributed demand, this 2% increase in service levels would
lead to a 14% increase in safety stock.
It is therefore essential that logistics management realise the cost implications of a service strategy. By
offering a logistics service, a firm is in fact absorbing a cost that would otherwise have to be borne by the
customer. For example, if a firm delivers twice a week instead of once a week, it is relieving its customers of
some responsibility for holding stock. The more frequent the deliveries, the less stock needs to be held by
customers.
7.3 CUSTOMER SERVICE COSTS
From the above it should be clear that a trade-off must be found between the costs of customer service and
the benefits of rendering customer service. The following key question arises:
What costs should be included?
It is clear that the costs of customer service involve all the costs necessary to ensure the availability of the right
product at the right place, at the right time and in the right quantities. Your list should therefore include costs
involved in all the logistics activities, as discussed in study units 2 and 3.
In the past, many companies tended to consider only the costs of transport, and perhaps warehouses, as
constituting their logistics costs. More recently, however, an increasing number of companies have adopted
the total distribution cost (TDC) concept in relation to their distribution activity. This concept recognises that
many more costs are incurred through the provision of availability than just transport and warehouse costs.
For example, as you saw in study unit 3, decisions about the service level affect the amount of inventory which
needs to be held in the system. Likewise, order processing costs are clearly influenced by the distribution
activity and must also be included. Indeed, there is a case for including invoicing costs too. The costs of
materials handling and protective packaging should also form part of the total distribution costs, as should the
costs of managing and administering the distribution system.
We could express the total distribution cost concept in the form of the following equation:
TDC = TC + FC + CC + IC + HC + PC + MC
where
TDC = total distribution costs
TC = transport costs
FC = facilities costs (depots, warehouses, etc)
ACTIVITY 7.2
List the costs you think comprise customer service costs.
FEEDBACK ON ACTIVITY 7.2
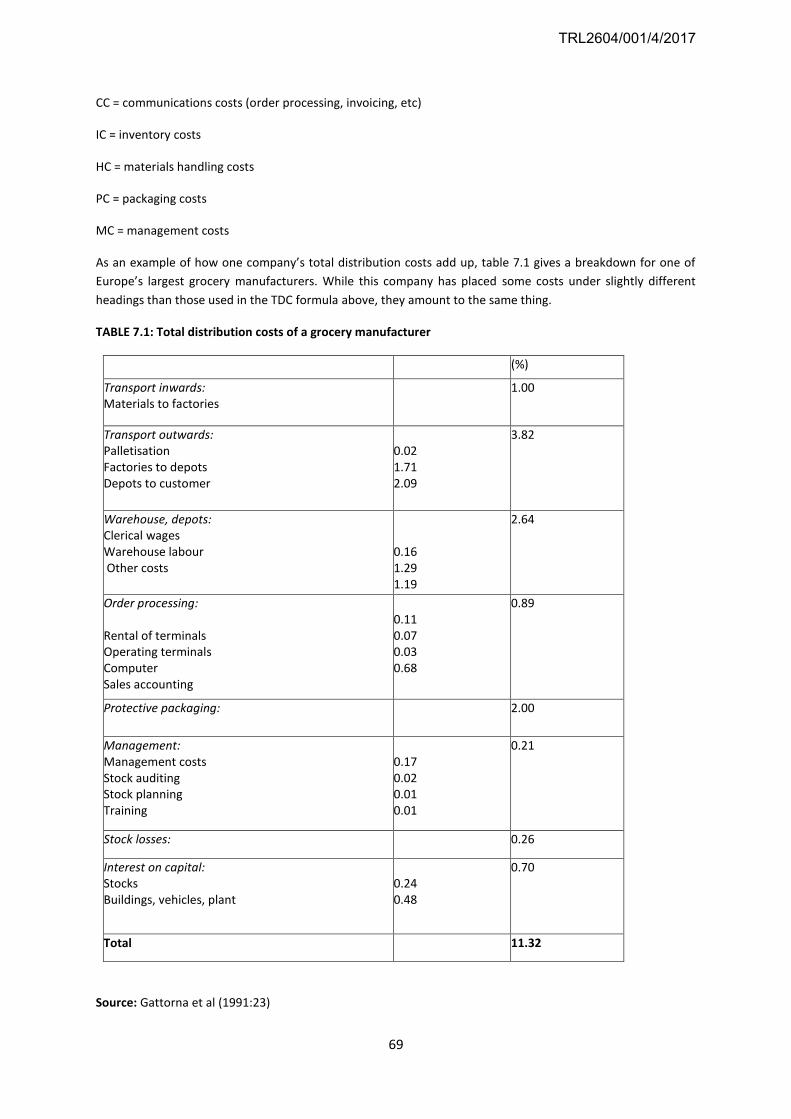
69
CC = communications costs (order processing, invoicing, etc)
IC = inventory costs
HC = materials handling costs
PC = packaging costs
MC = management costs
As an example of how one company’s total distribution costs add up, table 7.1 gives a breakdown for one of
Europe’s largest grocery manufacturers. While this company has placed some costs under slightly different
headings than those used in the TDC formula above, they amount to the same thing.
TABLE 7.1: Total distribution costs of a grocery manufacturer
(%)
Transport inwards: Materials to factories
1.00
Transport outwards: Palletisation Factories to depots Depots to customer
0.02 1.71 2.09
3.82
Warehouse, depots: Clerical wages Warehouse labour Other costs
0.16 1.29 1.19
2.64
Order processing:
Rental of terminals Operating terminals Computer Sales accounting
0.11 0.07 0.03 0.68
0.89
Protective packaging: 2.00
Management: Management costs Stock auditing Stock planning Training
0.17 0.02 0.01 0.01
0.21
Stock losses: 0.26
Interest on capital: Stocks Buildings, vehicles, plant
0.24 0.48
0.70
Total 11.32
Source: Gattorna et al (1991:23)
TRL2604/001/4/2017
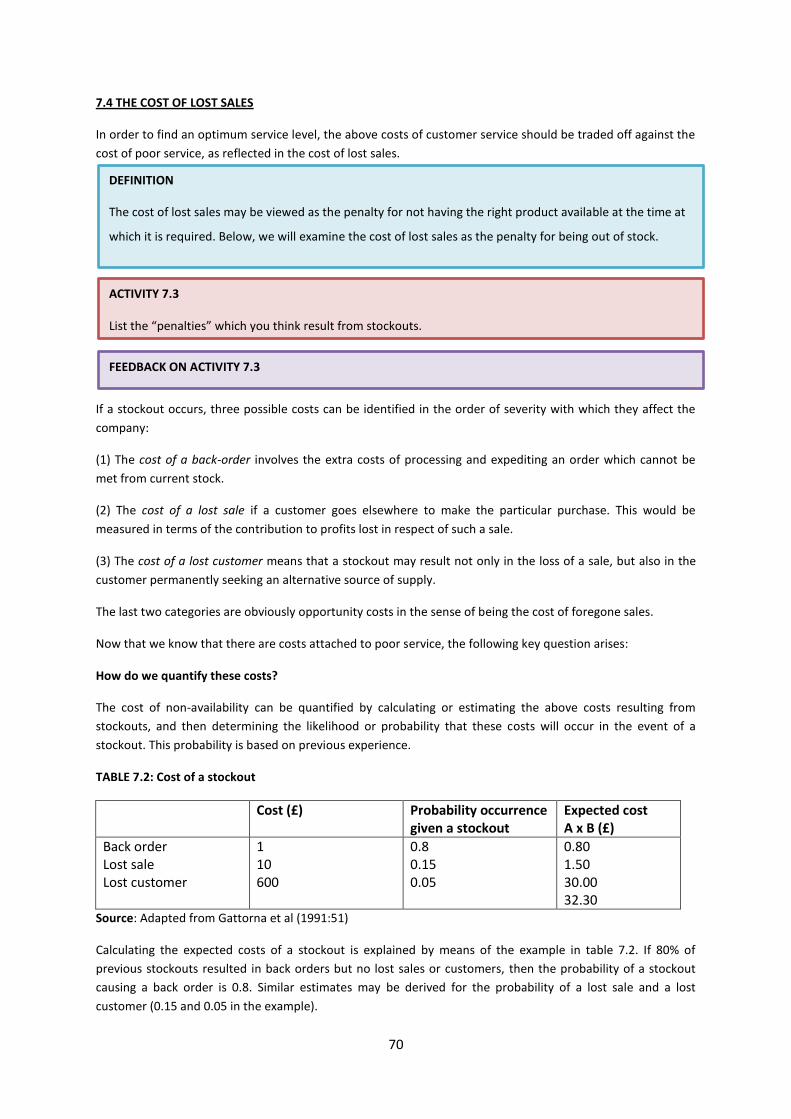
70
7.4 THE COST OF LOST SALES
In order to find an optimum service level, the above costs of customer service should be traded off against the
cost of poor service, as reflected in the cost of lost sales.
If a stockout occurs, three possible costs can be identified in the order of severity with which they affect the
company:
(1) The cost of a back-order involves the extra costs of processing and expediting an order which cannot be
met from current stock.
(2) The cost of a lost sale if a customer goes elsewhere to make the particular purchase. This would be
measured in terms of the contribution to profits lost in respect of such a sale.
(3) The cost of a lost customer means that a stockout may result not only in the loss of a sale, but also in the
customer permanently seeking an alternative source of supply.
The last two categories are obviously opportunity costs in the sense of being the cost of foregone sales.
Now that we know that there are costs attached to poor service, the following key question arises:
How do we quantify these costs?
The cost of non-availability can be quantified by calculating or estimating the above costs resulting from
stockouts, and then determining the likelihood or probability that these costs will occur in the event of a
stockout. This probability is based on previous experience.
TABLE 7.2: Cost of a stockout
Cost (£) Probability occurrence given a stockout
Expected cost A x B (£)
Back order Lost sale Lost customer
1 10 600
0.8 0.15 0.05
0.80 1.50 30.00 32.30
Source: Adapted from Gattorna et al (1991:51)
Calculating the expected costs of a stockout is explained by means of the example in table 7.2. If 80% of
previous stockouts resulted in back orders but no lost sales or customers, then the probability of a stockout
causing a back order is 0.8. Similar estimates may be derived for the probability of a lost sale and a lost
customer (0.15 and 0.05 in the example).
ACTIVITY 7.3
List the “penalties” which you think result from stockouts.
FEEDBACK ON ACTIVITY 7.3
DEFINITION
The cost of lost sales may be viewed as the penalty for not having the right product available at the time at
which it is required. Below, we will examine the cost of lost sales as the penalty for being out of stock.
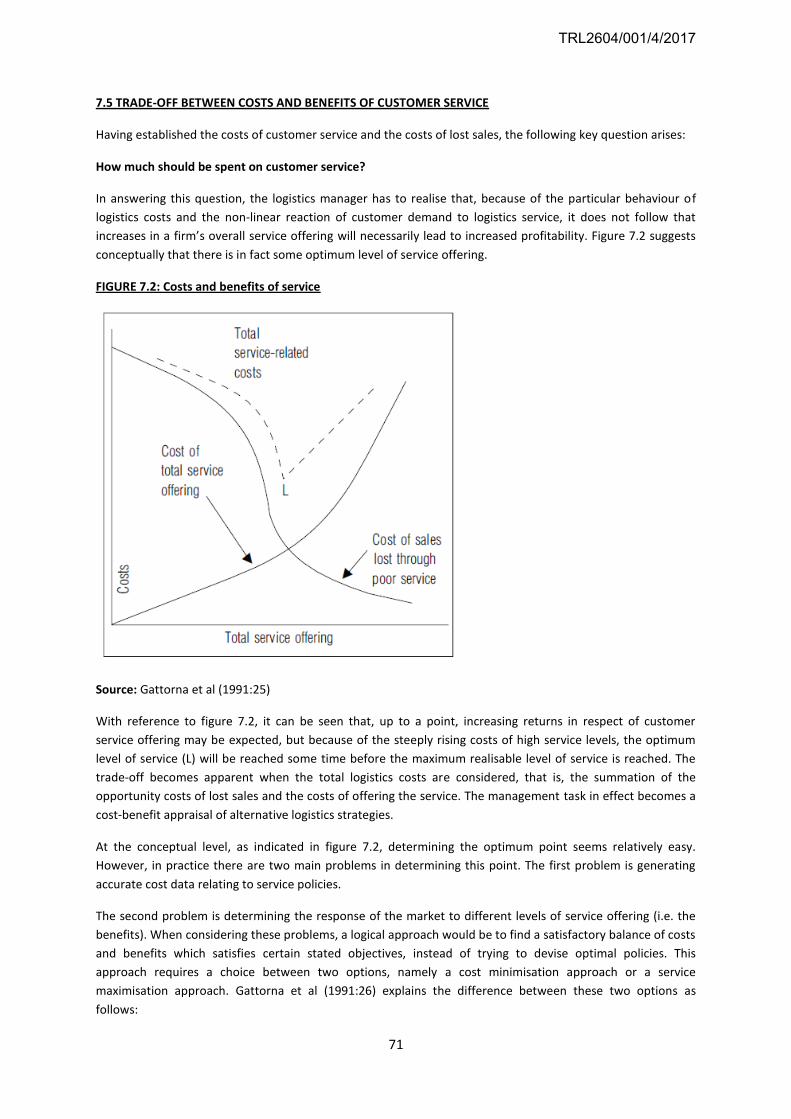
71
7.5 TRADE-OFF BETWEEN COSTS AND BENEFITS OF CUSTOMER SERVICE
Having established the costs of customer service and the costs of lost sales, the following key question arises:
How much should be spent on customer service?
In answering this question, the logistics manager has to realise that, because of the particular behaviour of
logistics costs and the non-linear reaction of customer demand to logistics service, it does not follow that
increases in a firm’s overall service offering will necessarily lead to increased profitability. Figure 7.2 suggests
conceptually that there is in fact some optimum level of service offering.
FIGURE 7.2: Costs and benefits of service
Source: Gattorna et al (1991:25)
With reference to figure 7.2, it can be seen that, up to a point, increasing returns in respect of customer
service offering may be expected, but because of the steeply rising costs of high service levels, the optimum
level of service (L) will be reached some time before the maximum realisable level of service is reached. The
trade-off becomes apparent when the total logistics costs are considered, that is, the summation of the
opportunity costs of lost sales and the costs of offering the service. The management task in effect becomes a
cost-benefit appraisal of alternative logistics strategies.
At the conceptual level, as indicated in figure 7.2, determining the optimum point seems relatively easy.
However, in practice there are two main problems in determining this point. The first problem is generating
accurate cost data relating to service policies.
The second problem is determining the response of the market to different levels of service offering (i.e. the
benefits). When considering these problems, a logical approach would be to find a satisfactory balance of costs
and benefits which satisfies certain stated objectives, instead of trying to devise optimal policies. This
approach requires a choice between two options, namely a cost minimisation approach or a service
maximisation approach. Gattorna et al (1991:26) explains the difference between these two options as
follows:
TRL2604/001/4/2017
72
The cost minimisation approach requires management to lay down specific objectives for customer service and
then to ask the question: how might those objectives be met at minimum cost? The alternative approach,
namely that of service maximisation, is based upon the notion of a fixed budget with the consequent
management task of maximising the service offering within the budget constraint. It is not possible to lay
down hard-and-fast rules as to which of these two approaches is preferable. In those market situations where
customer service is highly competitive, the cost minimisation approach may well be the only viable strategy.
Alternatively, given a situation of limited corporate resources, the firm may well have to work within the
constraints of a tightly controlled budget, thus necessitating a service maximisation approach.
A further complication concerning the question of how much should be spent on customer service is that the
development of any customer service strategy in a company must take place in the total context of the
business. It would be self-defeating to attempt to implement a customer service strategy which is not
integrated with the other areas of the business. Marketing, financial, production and purchasing
considerations will have the greatest effect on the development of a cohesive service strategy.
7.6 CUSTOMER SERVICE EFFICIENCY
The above trade-off analysis applies mainly when deciding on the level of basic service to be offered. In the
case of zero defect (perfect order) and value-added services, further analysis may be needed. The following
key question arises:
For which customers should we attempt to provide a zero defect service?
It is clear that some products and customers are more profitable than others. But how do we identify the
customers for whom it is worth providing zero defect services? The answer to this question can be found in
ABC analysis and customer account profitability (CAP).
ACTIVITY 7.4
Consider two customers, A and B. Customer A orders regularly in large quantities, with 80% of the order
comprising fast-moving products and 20% comprising more expensive, slow-moving products. Customer B,
however, occasionally orders small quantities, with the bulk of the order consisting of slow-moving
products which are expensive to keep in stock.
Would you implement a perfect order strategy, incurring higher customer service costs, for both
customers?
FEEDBACK ON ACTIVITY 7.4
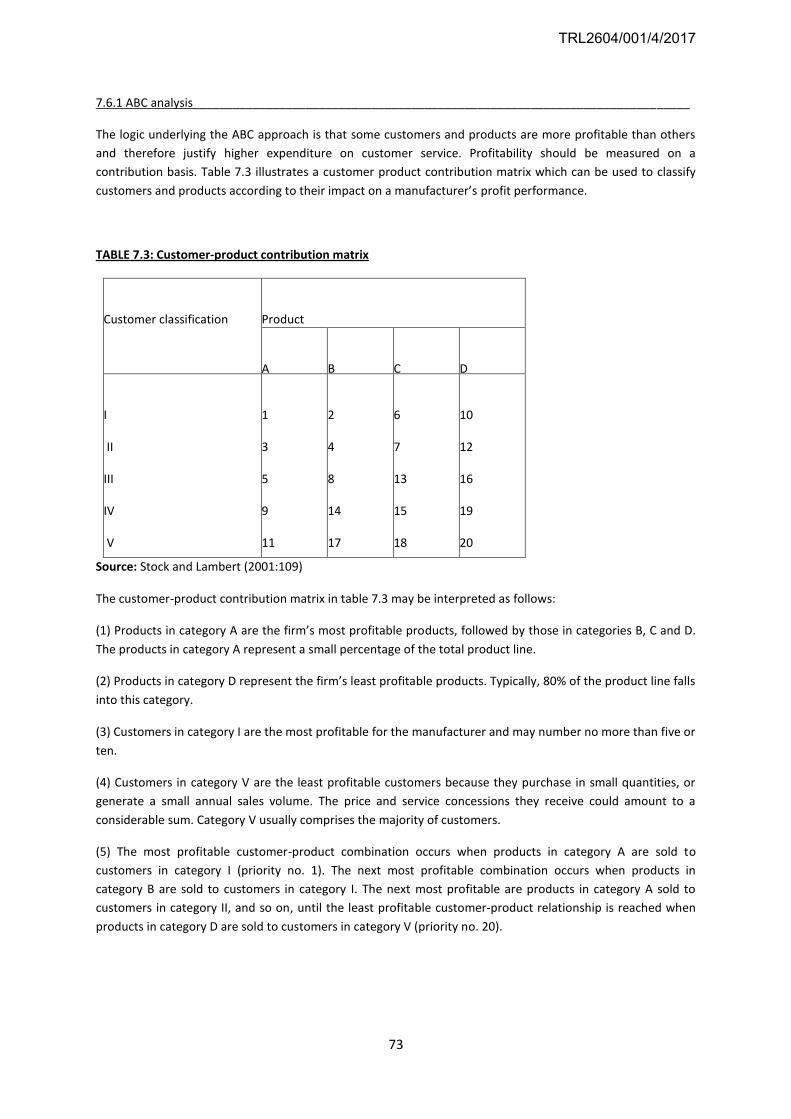
73
7.6.1 ABC analysis___________________________________________________________________________
The logic underlying the ABC approach is that some customers and products are more profitable than others
and therefore justify higher expenditure on customer service. Profitability should be measured on a
contribution basis. Table 7.3 illustrates a customer product contribution matrix which can be used to classify
customers and products according to their impact on a manufacturer’s profit performance.
TABLE 7.3: Customer-product contribution matrix
Customer classification Product
A B C D
I
II
III
IV
V
1
3
5
9
11
2
4
8
14
17
6
7
13
15
18
10
12
16
19
20
Source: Stock and Lambert (2001:109)
The customer-product contribution matrix in table 7.3 may be interpreted as follows:
(1) Products in category A are the firm’s most profitable products, followed by those in categories B, C and D.
The products in category A represent a small percentage of the total product line.
(2) Products in category D represent the firm’s least profitable products. Typically, 80% of the product line falls
into this category.
(3) Customers in category I are the most profitable for the manufacturer and may number no more than five or
ten.
(4) Customers in category V are the least profitable customers because they purchase in small quantities, or
generate a small annual sales volume. The price and service concessions they receive could amount to a
considerable sum. Category V usually comprises the majority of customers.
(5) The most profitable customer-product combination occurs when products in category A are sold to
customers in category I (priority no. 1). The next most profitable combination occurs when products in
category B are sold to customers in category I. The next most profitable are products in category A sold to
customers in category II, and so on, until the least profitable customer-product relationship is reached when
products in category D are sold to customers in category V (priority no. 20).
TRL2604/001/4/2017
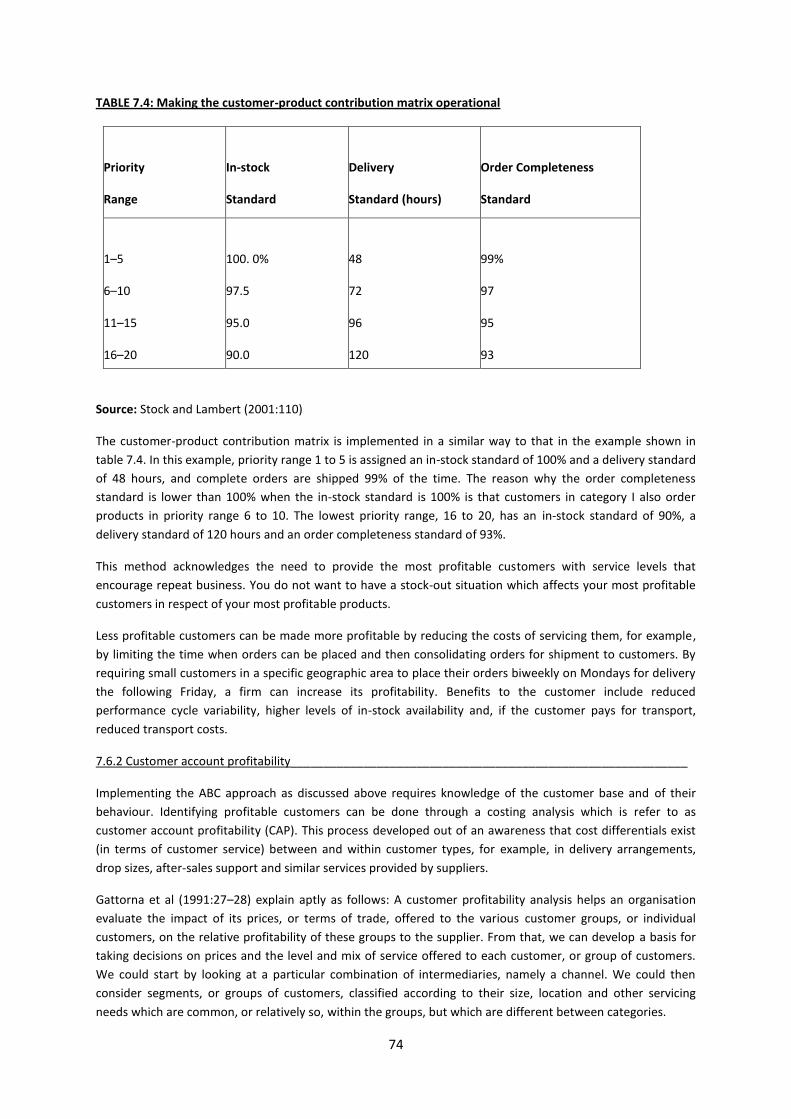
74
TABLE 7.4: Making the customer-product contribution matrix operational
Priority
Range
In-stock
Standard
Delivery
Standard (hours)
Order Completeness
Standard
1–5
6–10
11–15
16–20
100. 0%
97.5
95.0
90.0
48
72
96
120
99%
97
95
93
Source: Stock and Lambert (2001:110)
The customer-product contribution matrix is implemented in a similar way to that in the example shown in
table 7.4. In this example, priority range 1 to 5 is assigned an in-stock standard of 100% and a delivery standard
of 48 hours, and complete orders are shipped 99% of the time. The reason why the order completeness
standard is lower than 100% when the in-stock standard is 100% is that customers in category I also order
products in priority range 6 to 10. The lowest priority range, 16 to 20, has an in-stock standard of 90%, a
delivery standard of 120 hours and an order completeness standard of 93%.
This method acknowledges the need to provide the most profitable customers with service levels that
encourage repeat business. You do not want to have a stock-out situation which affects your most profitable
customers in respect of your most profitable products.
Less profitable customers can be made more profitable by reducing the costs of servicing them, for example,
by limiting the time when orders can be placed and then consolidating orders for shipment to customers. By
requiring small customers in a specific geographic area to place their orders biweekly on Mondays for delivery
the following Friday, a firm can increase its profitability. Benefits to the customer include reduced
performance cycle variability, higher levels of in-stock availability and, if the customer pays for transport,
reduced transport costs.
7.6.2 Customer account profitability____________________________________________________________
Implementing the ABC approach as discussed above requires knowledge of the customer base and of their
behaviour. Identifying profitable customers can be done through a costing analysis which is refer to as
customer account profitability (CAP). This process developed out of an awareness that cost differentials exist
(in terms of customer service) between and within customer types, for example, in delivery arrangements,
drop sizes, after-sales support and similar services provided by suppliers.
Gattorna et al (1991:27–28) explain aptly as follows: A customer profitability analysis helps an organisation
evaluate the impact of its prices, or terms of trade, offered to the various customer groups, or individual
customers, on the relative profitability of these groups to the supplier. From that, we can develop a basis for
taking decisions on prices and the level and mix of service offered to each customer, or group of customers.
We could start by looking at a particular combination of intermediaries, namely a channel. We could then
consider segments, or groups of customers, classified according to their size, location and other servicing
needs which are common, or relatively so, within the groups, but which are different between categories.
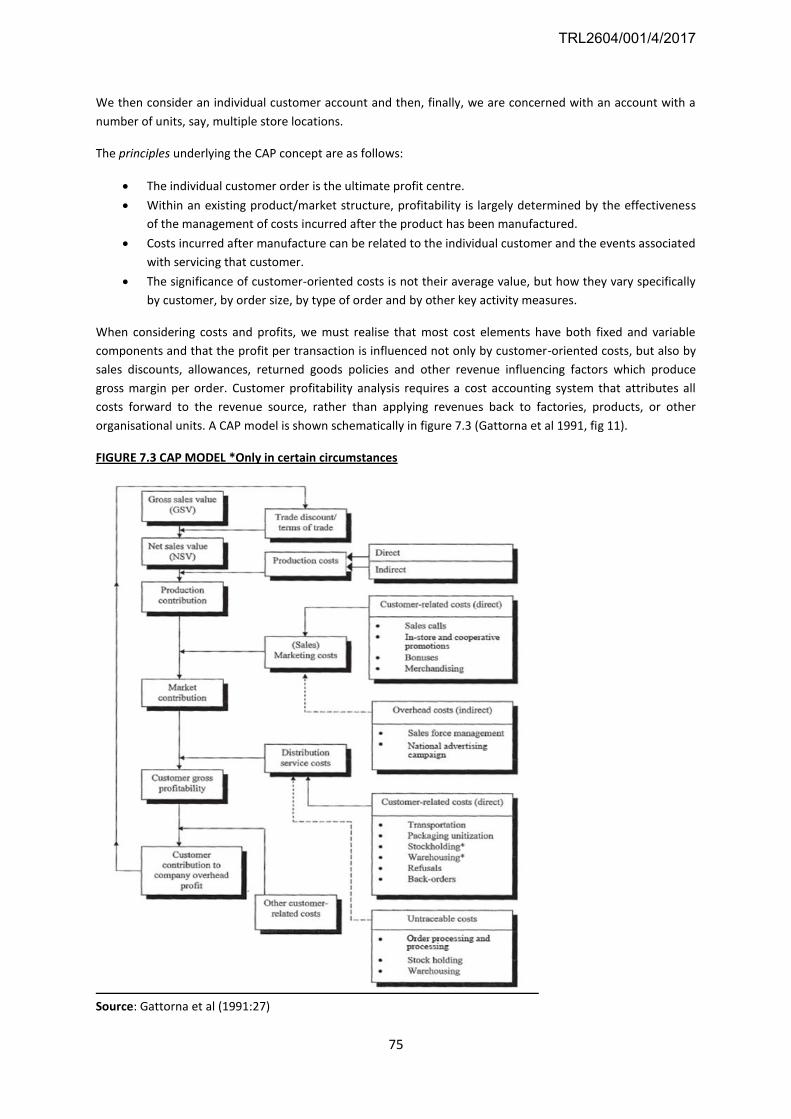
75
We then consider an individual customer account and then, finally, we are concerned with an account with a
number of units, say, multiple store locations.
The principles underlying the CAP concept are as follows:
The individual customer order is the ultimate profit centre.
Within an existing product/market structure, profitability is largely determined by the effectiveness
of the management of costs incurred after the product has been manufactured.
Costs incurred after manufacture can be related to the individual customer and the events associated
with servicing that customer.
The significance of customer-oriented costs is not their average value, but how they vary specifically
by customer, by order size, by type of order and by other key activity measures.
When considering costs and profits, we must realise that most cost elements have both fixed and variable
components and that the profit per transaction is influenced not only by customer-oriented costs, but also by
sales discounts, allowances, returned goods policies and other revenue influencing factors which produce
gross margin per order. Customer profitability analysis requires a cost accounting system that attributes all
costs forward to the revenue source, rather than applying revenues back to factories, products, or other
organisational units. A CAP model is shown schematically in figure 7.3 (Gattorna et al 1991, fig 11).
FIGURE 7.3 CAP MODEL *Only in certain circumstances
Source: Gattorna et al (1991:27)
TRL2604/001/4/2017
76
The components of a CAP analysis are basically gross and net sales revenue for each customer or customer
group and contribution by individual customer or customer group at two levels, net sales revenue less total
manufacturing costs of goods sold, and the above contribution level less costs of servicing the customer group.
In terms of attributing costs, there is a primary recognition that costs are product-related in manufacturing,
customer-related in selling and distribution, and “below-the-line” overheads composed of administration and
finance costs, which are not included in the CAP analysis.
Manufacturing costs attributed should include “fixed” or “indirect” manufacturing overheads. If the cost
accounting system excludes them from manufactured product cost, a simple basis of attributing them could be
according to the “value added” in manufacturing, that is, in proportion to the “variable” or “direct costs” of
manufacturing.
Selling and distribution costs should be related to individual customers and based on the activities associated
with servicing those customers. These costs are not a function of sales, and should not be attributed according
to the sales volume.
Attribution of the costs should be based on a classification of physically identifiable activities. Typical physical
activities might be as follows:
Storage: This is an identifiable physical activity in distribution, and the charge basis could be
warehouse space in square or cubic metres for each customer or group, based on their sales
throughput and stockholding needs.
Despatch or delivery activity: The basis might be a charge per sales order completed.
Order processing: Again, the charge could be based on the sales order.
Sales processing: This is another typical physical activity and the charge basis could be on the sales call
rate.
Promotion: Here, the charge basis could be on sales “potential” or each customer or group being
serviced.
Clearly, many questions need to be resolved, not only in terms of the technical issues involved in allocating
costs, but also in actually implementing any of the changes which may be indicated by the analysis itself.
Nevertheless, there are strong grounds for attempting to improve our knowledge of CAP because it enables
financial performance to be measured, and therefore acted upon at the source in a way which traditional
accounting and information systems fail to do.
The following are some of the actions which lead to improvement in performance, but which may only be
indicated by a CAP analysis:
enrich the product mix, which has the effect of increasing margins
increase sales volume per customer, which will usually increase order size
reduce delivery frequency, which in turn increases order and drop size
apply a “minimum order” policy or charge a premium on small orders
avoid “balancing” follow-up deliveries because this adds cost
lengthen order-cycle time
intensify business done in each delivery area, and again, this has the effect of increasing the drop size
encourage use of intermediaries, where appropriate, particularly for handling small orders
reduce level of service at the drop point; this increases the speed of turnaround and therefore
reduces turnaround time
77
seek more cost-effective methods of obtaining orders, for example using telephone sales methods
instead of sales forces in the field who often become no more than customer service reps and who
are therefore ineffective as “order getters”.
Despite both conceptual and practical difficulties, companies which attempt to understand and introduce the
mechanisms of CAP are likely to be amply rewarded at the “bottom line”, even with only limited application of
the principles.
There are limits to the level of customer service. The benefits of a high level of service must be traded off
against the costs of providing that level of service. Once a certain level of service is reached, the costs of
improving service levels increase more than proportionally.
The cost of customer service is represented by the total distribution cost concept, which includes all costs
pertaining to distribution. In order to find an optimum level of service, the costs of customer service should be
traded off against the cost of poor service, as reflected in the cost of back orders and the cost of lost sales.
Some customers are worth more to the firm than others. Profitable customers can be identified by using ABC
and CAP analysis.
Refer back to the study unit outcomes formulated at the beginning of the study unit and determine whether
you have achieved them by answering the self-assessment questions below.
(1) Identify the costs which should be regarded as customer service costs. What constitutes the cost of lost
sales?
(2) Explain by means of an example how the cost of lost sales can be quantified.
(3) Explain the trade-off between costs and benefits of customer service.
(4) Explain the term “ABC analysis” in terms of customer service.
(5) Describe how you would go about using a CAP analysis to determine a customer’s profitability.
7.7 SUMMARY
7.8 SELF-ASSESSMENT QUESTIONS
TRL2604/001/4/2017
78
CONTENTS
8.1 WHAT IS LOGISTICS REQUIREMENT PLANNING (LRP)?
8.2 DEPENDENT AND INDEPENDENT DEMAND
8.3 THE SCOPE OF LRP
8.4 VARIABLES REQUIRED FOR IMPLEMENTING LRP
8.5 PROCEDURE FOR IMPLEMENTING LRP
8.6 ADVANTAGES OF LRP
8.7 PRACTICAL APPLICATION OF LRP
8.8 SUMMARY
8.9 SELF-ASSESSMENT QUESTIONS
PURPOSE
The purpose of this study unit is to enable you to contribute towards achieving lowest total logistics costs in
business by minimising inventory investment and risk for customer accommodation, manufacturing support and
procurement throughout the supply chain.
OUTCOMES
After working through this study unit, you will be able to explain
(1) the internal integration of logistics by introducing a scheduling technique that facilitates having the right
quantity of the right product available at the right place and time
(2) how logistics requirements planning constitutes the interface between marketing, production and logistics
8.1 WHAT IS LOGISTICS REQUIREMENT PLANNING (LRP)?
There are no references to the prescribed book by Bowersox et al (2013) in this study unit. You still have to study it
because it is an essential part of the study material for this module. This study unit is therefore based on other
material, mainly that of Pienaar and Vogt (2009).
STUDY UNIT 8
LOGISTICS REQUIREMENT PLANNING
DEFINITION
LRP is a scheduling technique which ensures that the right goods are available at the right place and time and
in the right quantities. As such, it is a logical combination of materials requirement planning (MRP) and
distribution requirements planning (DRP) and can be applied to distribution inventories as well as feeder and
manufacturing inventories.
79
The emphasis is on the integration of distribution inventory planning and manufacturing inventory planning to
ensure that the right supplies will be available when needed instead of being allocated once they become available.
At this stage, you will probably not be able to answer this question, but it is worthwhile thinking about it. The
answer lies in LRP where inventories for distribution and manufacturing are coordinated to ensure minimum
inventories at all levels. The tools for solving this problem are provided in this study unit.
8.2 DEPENDENT AND INDEPENDENT DEMAND
Central to the understanding of LRP are the concepts of dependent and independent demand.
It should now be clear that final products have an independent demand (which means that such demand has to be
forecast), while the demand for raw materials is dependent on the demand for the final product. There is no need
to forecast the demand for materials requirement since it can be calculated on the basis of the demand for the final
product. The difference between dependent and independent demand is crucial in ensuring that supplies are
available when they are needed instead of allocating them after they become available.
ACTIVITY 8.1
Suppose a brewery brews 10 different kinds of beer, has a central warehouse close to it and has 12 distribution
centres countrywide. How would you go about ensuring that there is sufficient, but not excessive, stock of each
brand at each distribution centre and that sufficient but minimum, raw materials, packaging materials and so
on, are available during production?
FEEDBACK ON ACTIVITY 8.1
ACTIVITY 8.2
Try to relate dependent and independent demand to materials requirements (stock which is required for
production) and distribution requirements (stock required to serve final customers).
FEEDBACK ON ACTIVITY 8.2
DEFINITION
Independent demand, as the name implies, is when the demand for an item is not related to, or dependent
on, the demand for any other item. Examples of independent demand are the demand for finished goods
(such as cans of beer) and maintenance spares. Independent demand cannot be calculated and can only be
estimated by means of a forecast.
Dependent demand describes the demand for items, which is related to the demand for other items. Typical
examples are subassemblies, raw materials and packaging materials. Since the demand for these items
depends on the demand for the final product, it can be calculated and there is no need to forecast dependent
demand.
TRL2604/001/4/2017
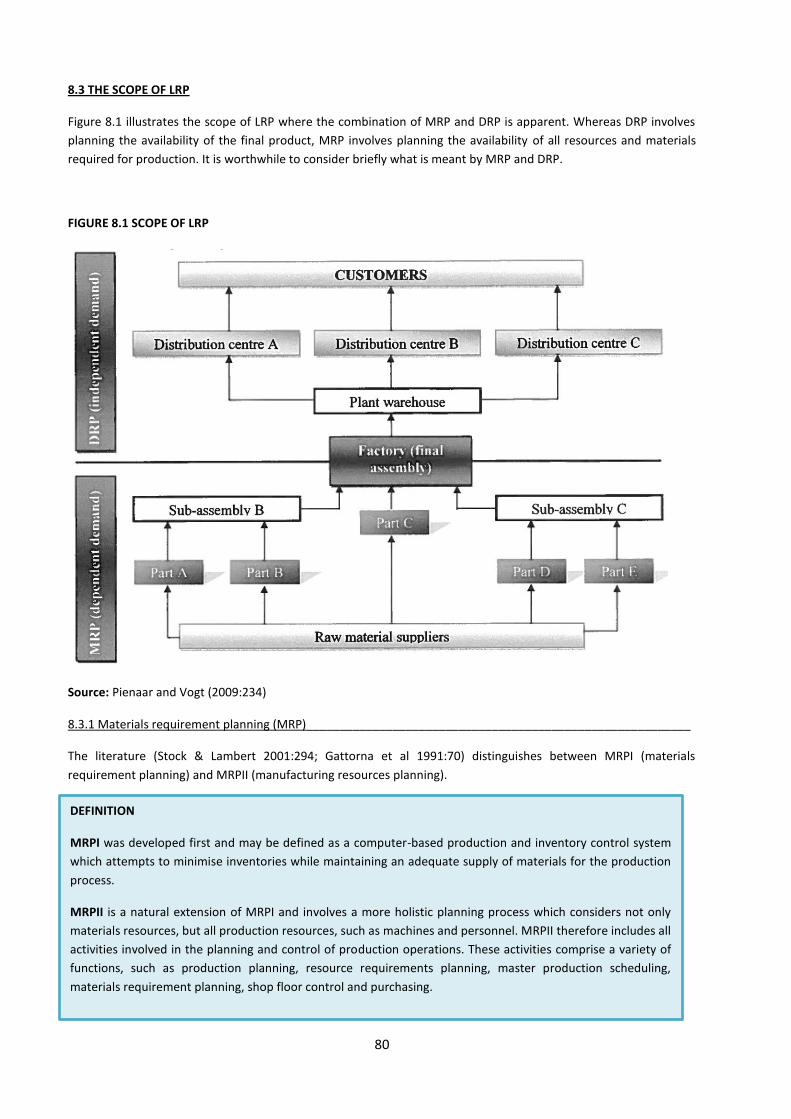
80
8.3 THE SCOPE OF LRP
Figure 8.1 illustrates the scope of LRP where the combination of MRP and DRP is apparent. Whereas DRP involves
planning the availability of the final product, MRP involves planning the availability of all resources and materials
required for production. It is worthwhile to consider briefly what is meant by MRP and DRP.
FIGURE 8.1 SCOPE OF LRP
Source: Pienaar and Vogt (2009:234)
8.3.1 Materials requirement planning (MRP)__________________________________________________________
The literature (Stock & Lambert 2001:294; Gattorna et al 1991:70) distinguishes between MRPI (materials
requirement planning) and MRPII (manufacturing resources planning).
DEFINITION
MRPI was developed first and may be defined as a computer-based production and inventory control system
which attempts to minimise inventories while maintaining an adequate supply of materials for the production
process.
MRPII is a natural extension of MRPI and involves a more holistic planning process which considers not only
materials resources, but all production resources, such as machines and personnel. MRPII therefore includes all
activities involved in the planning and control of production operations. These activities comprise a variety of
functions, such as production planning, resource requirements planning, master production scheduling,
materials requirement planning, shop floor control and purchasing.
81
The introduction of MRP allowed companies to manage dependent demand. MRP allows inventories to be managed
by priorities and based on a master production schedule (MPS). The MPS is, in turn, based on the distribution
requirements, that is, requirements of the final product to meet independent demand.
8.3.2 Distribution requirements planning (DRP) ________________________________________________________
8.4 VARIABLES REQUIRED FOR IMPLEMENTING LRP
The variables and requirements necessary to drive the LRP process refer mainly to the information which is required
to implement the system.
The first important variable is the weekly, daily or monthly demand for the final product (independent
demand). This is obtained through forecasting techniques. Most of these techniques are based on statistics
of historical sales, such as regression analysis and exponential smoothing. The statistical forecast should
also be adjusted, taking known factors such as possible future promotional efforts, fixed orders, customer
promises and seasonal variations into consideration. (A discussion of forecasting techniques falls outside
the scope of this module.)
The variability of independent demand is a second important variable. The variability of demand will
mainly determine the safety stock levels for each SKU.
A third factor is the lead time, which refers to the period between placing and receiving an order. The lead
time will determine the reorder point.
The order quantity is an equally important variable. The EOQ was briefly explained in study unit 3 and
depends mainly on volume discounts, inventory carrying costs and ordering costs.
Finally, the safety stock levels of all SKUs should be determined, as was discussed in study unit 3.
DEFINITION
DRP may be defined as a system of determining demand for inventory at distribution centres,
consolidating the demand information backwards, and acting as input for the production and materials
system. DRP is the mirror image of MRP. It uses the same logic, tools and techniques.
The core of DRP is independent demand, which is then fed back through the organisation as dependent
demand. A demand forecast is drawn up, with input from all levels and departments in the organisation,
and is communicated to manufacturing through the master production schedule.
The objective of DRP is to create an effective communication and planning linkage between the
manufacturing and distribution functions of the firm.
The starting point in DRP is identifying where and when individual stock-keeping units (SKUs) are needed.
This is done by analysing actual customer demand for SKUs by customer service location (e.g customer
demand per geographical region). Aggregated, time-phased requirement schedules at each echelon (e.g.
depot, regional warehouse, factory warehouse) in the distribution system are communicated back to
production via the MPS.
As with MRP, the evolution of DRP resulted in distribution resource planning (DRPII), which includes the
planning of key resources in a distribution system, such as warehouse space, human resource
requirements, transport capacity and financial flows.
TRL2604/001/4/2017
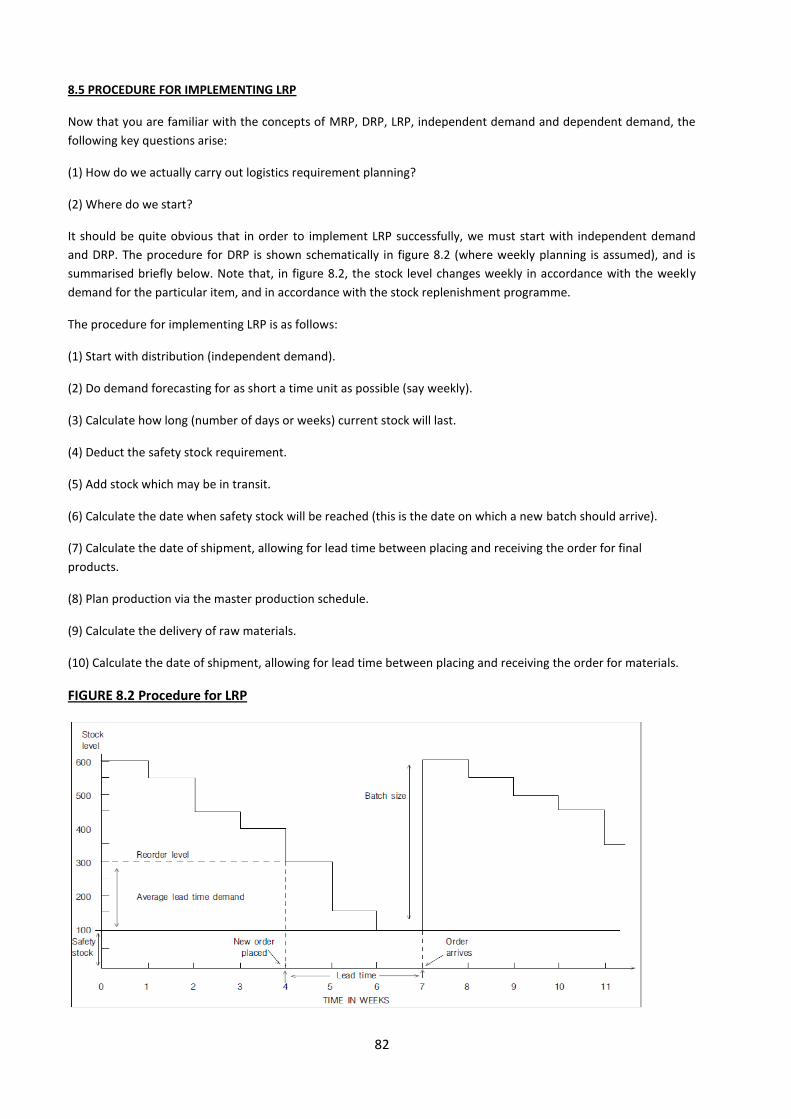
82
8.5 PROCEDURE FOR IMPLEMENTING LRP
Now that you are familiar with the concepts of MRP, DRP, LRP, independent demand and dependent demand, the
following key questions arise:
(1) How do we actually carry out logistics requirement planning?
(2) Where do we start?
It should be quite obvious that in order to implement LRP successfully, we must start with independent demand
and DRP. The procedure for DRP is shown schematically in figure 8.2 (where weekly planning is assumed), and is
summarised briefly below. Note that, in figure 8.2, the stock level changes weekly in accordance with the weekly
demand for the particular item, and in accordance with the stock replenishment programme.
The procedure for implementing LRP is as follows:
(1) Start with distribution (independent demand).
(2) Do demand forecasting for as short a time unit as possible (say weekly).
(3) Calculate how long (number of days or weeks) current stock will last.
(4) Deduct the safety stock requirement.
(5) Add stock which may be in transit.
(6) Calculate the date when safety stock will be reached (this is the date on which a new batch should arrive).
(7) Calculate the date of shipment, allowing for lead time between placing and receiving the order for final
products.
(8) Plan production via the master production schedule.
(9) Calculate the delivery of raw materials.
(10) Calculate the date of shipment, allowing for lead time between placing and receiving the order for materials.
FIGURE 8.2 Procedure for LRP
83
8.6 ADVANTAGES OF LRP
The integration of distribution inventory planning (final-product inventories) with manufacturing inventory planning
(inventories of raw materials, and subassemblies or semi-finished products) ensures that the right stock will be
available in the right quantities at the time at which it is needed, instead of allocating stock as it becomes available.
This integration (through LRP) results in marketing and logistics benefits, both of which have positive financial
implications, as discussed below.
8.6.1 Marketing benefits__________________________________________________________________________
(1) Proper planning in order to meet demand results in increased service levels through timely deliveries, and hence
fewer complaints.
(2) LRP enables the firm to plan in advance for promotions, especially in respect of new products, and to launch the
relevant campaigns effectively.
(3) LRP enables the firm to determine beforehand which products will not be available so that aggressive marketing
can be avoided when stock levels are low.
(4) Intrafunctional relations can be improved, since all departments in the organisation are working on the basis of
the same data and master production schedule.
8.6.2 Logistics benefits____________________________________________________________________________
(1) The costs of transporting goods to distribution centres are reduced owing to fewer urgent deliveries at high
transport rates and improved load planning.
(2) Inventory levels are lower. Through LRP, a fairly accurate prediction can be made of what will be needed, and
when it will be needed, by using up-to-date information.
(3) Less warehouse space is required owing to lower inventory levels.
(4) There is improved control over obsolescence by monitoring when stock at each centre will be depleted, and by
issuing timely warnings of obsolescence.
(5) The costs of distributing goods from distribution centres to customers are reduced owing to fewer overdue
orders, because the right products will be in stock when they are needed for despatch.
(6) The coordination and working relationships between distribution and manufacturing are improved owing to
familiarity with distribution requirements.
8.7 PRACTICAL APPLICATION OF LRP*
Consider a distribution network for a certain product (single SKU) with a central warehouse in Johannesburg (close
to the factory) and regional distribution warehouses in Windhoek, East London, Cape Town, Bloemfontein and
Durban. The estimated demand in Windhoek for the next eight weeks is indicated in table 8.1(a). The current (week
0) inventory level is 500 units, 250 of which constitute safety stock. The lead time is assumed to be two weeks,
while the most EOQ has been calculated as being 300 units.
The estimated stock is calculated by deducting the following week’s estimated demand from the existing stock. The
estimated stock on hand in week 1 is therefore 400 units (500 – 100). Similarly, the estimated stock in week 2 (280)
is calculated by deducting the estimated demand (120) from the estimated stock in week 1 (400). In week 3, the
estimated stock (190) will fall below the safety stock level in week 5, and the warehouse will be out of stock. This
warehouse therefore requires an order for delivery in week 3. With a lead time of two weeks, the order should be
placed in week 1, as indicated by planned receipt and planned order in table 8.1(b). This consignment will ensure
TRL2604/001/4/2017
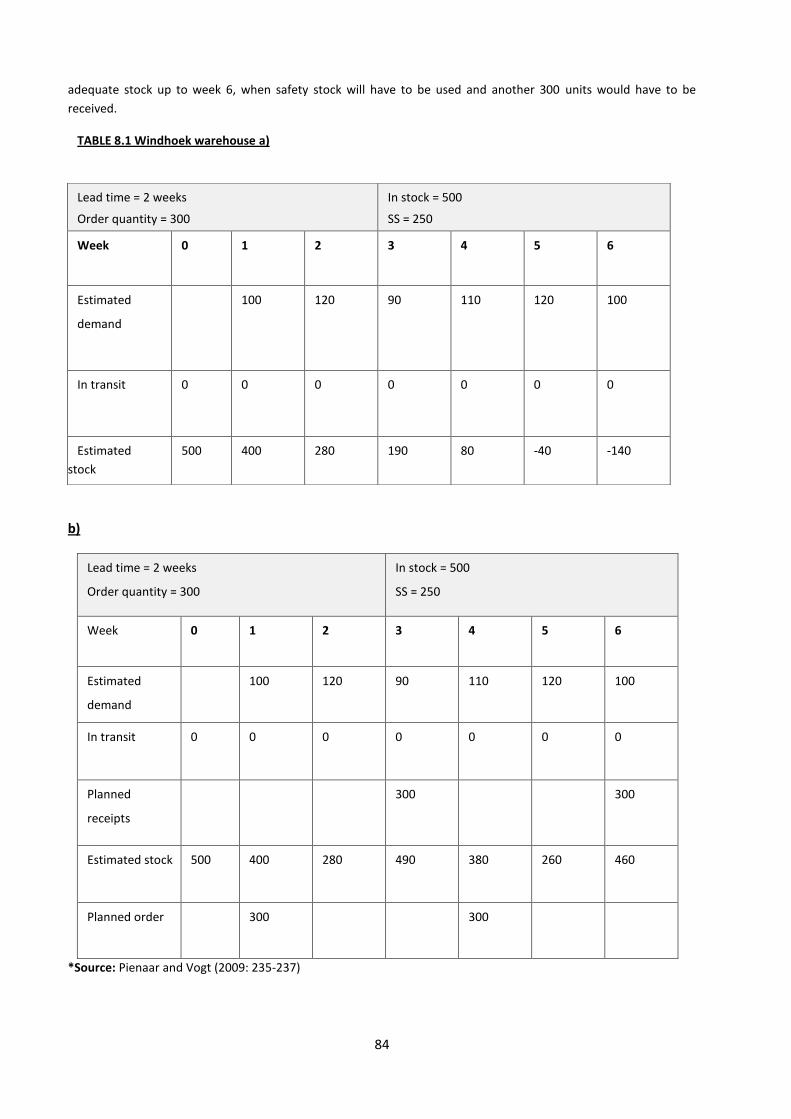
84
adequate stock up to week 6, when safety stock will have to be used and another 300 units would have to be
received.
TABLE 8.1 Windhoek warehouse a)
b)
Lead time = 2 weeks
Order quantity = 300
In stock = 500
SS = 250
Week 0 1 2 3 4 5 6
Estimated
demand
100 120 90 110 120 100
In transit 0 0 0 0 0 0 0
Planned
receipts
300 300
Estimated stock 500 400 280 490 380 260 460
Planned order 300 300
*Source: Pienaar and Vogt (2009: 235-237)
Lead time = 2 weeks
Order quantity = 300
In stock = 500
SS = 250
Week 0 1 2 3 4 5 6
Estimated
demand
100 120 90 110 120 100
In transit 0 0 0 0 0 0 0
Estimated
stock
500 400 280 190 80 -40 -140
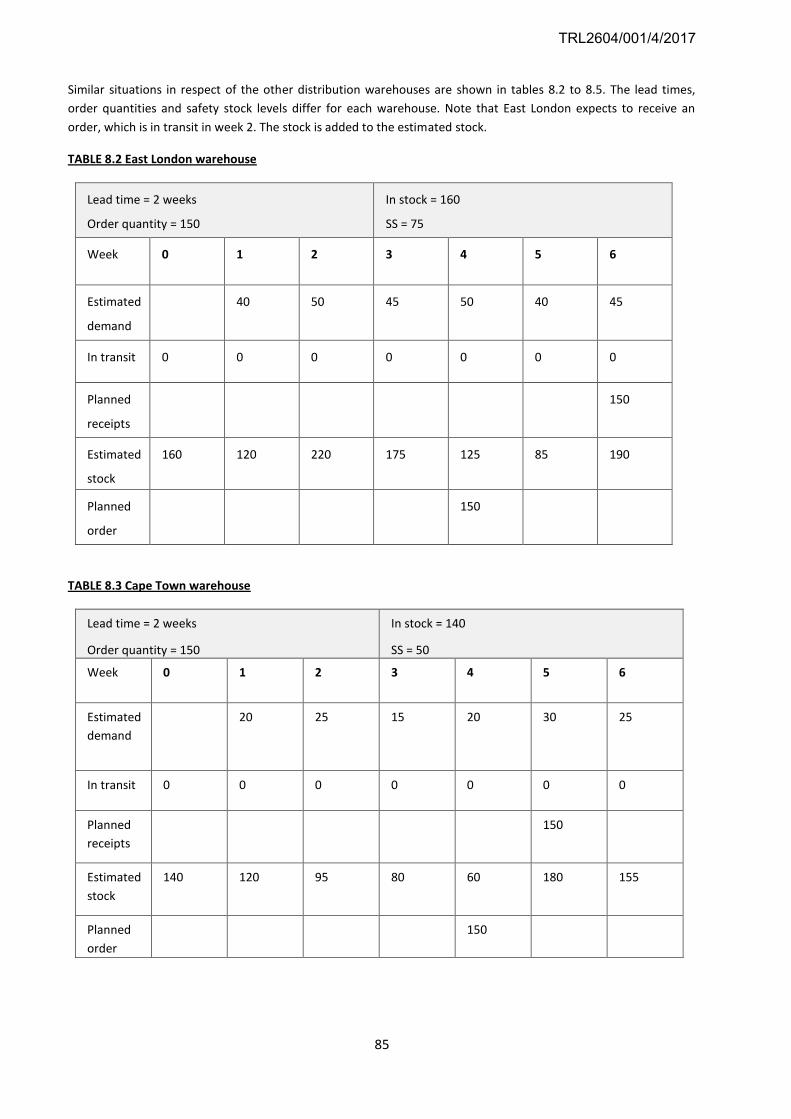
85
Similar situations in respect of the other distribution warehouses are shown in tables 8.2 to 8.5. The lead times,
order quantities and safety stock levels differ for each warehouse. Note that East London expects to receive an
order, which is in transit in week 2. The stock is added to the estimated stock.
TABLE 8.2 East London warehouse
Lead time = 2 weeks
Order quantity = 150
In stock = 160
SS = 75
Week 0 1 2 3 4 5 6
Estimated
demand
40 50 45 50 40 45
In transit 0 0 0 0 0 0 0
Planned
receipts
150
Estimated
stock
160 120 220 175 125 85 190
Planned
order
150
TABLE 8.3 Cape Town warehouse
Lead time = 2 weeks
Order quantity = 150
In stock = 140
SS = 50
Week 0 1 2 3 4 5 6
Estimated
demand
20 25 15 20 30 25
In transit 0 0 0 0 0 0 0
Planned
receipts
150
Estimated
stock
140 120 95 80 60 180 155
Planned
order
150
TRL2604/001/4/2017
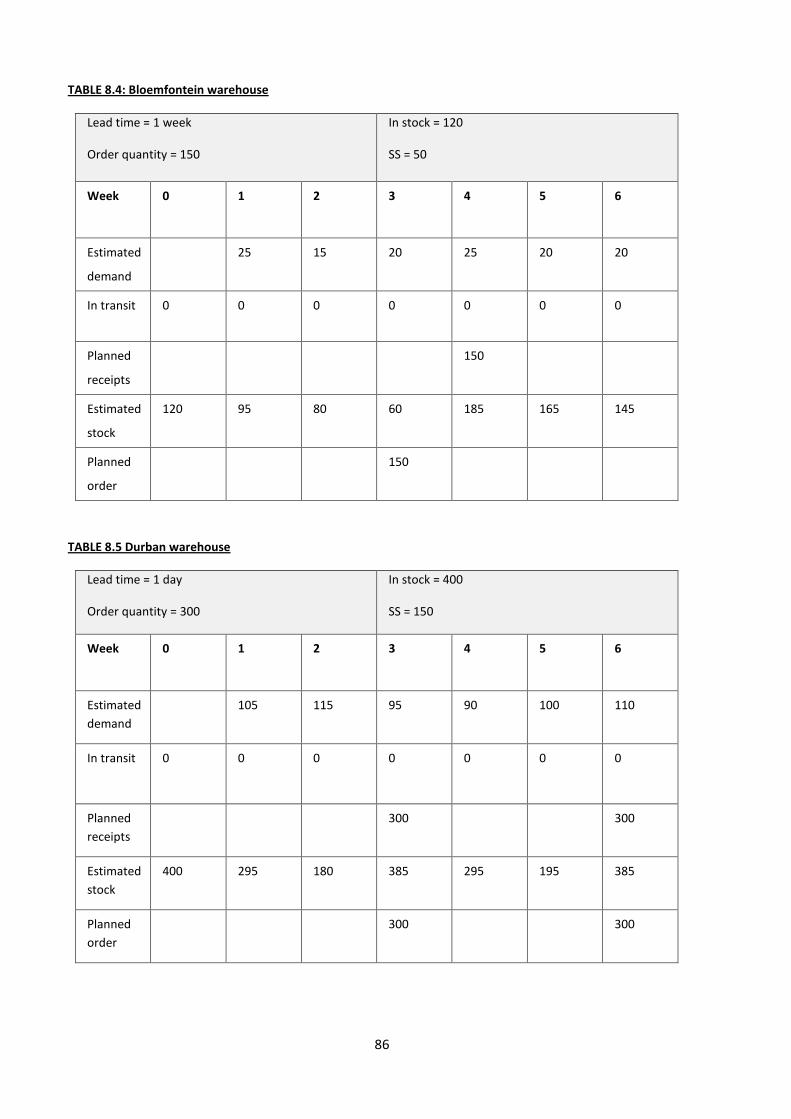
86
TABLE 8.4: Bloemfontein warehouse
Lead time = 1 week
Order quantity = 150
In stock = 120
SS = 50
Week 0 1 2 3 4 5 6
Estimated
demand
25 15 20 25 20 20
In transit 0 0 0 0 0 0 0
Planned
receipts
150
Estimated
stock
120 95 80 60 185 165 145
Planned
order
150
TABLE 8.5 Durban warehouse
Lead time = 1 day
Order quantity = 300
In stock = 400
SS = 150
Week 0 1 2 3 4 5 6
Estimated
demand
105 115 95 90 100 110
In transit 0 0 0 0 0 0 0
Planned
receipts
300 300
Estimated
stock
400 295 180 385 295 195 385
Planned
order
300 300
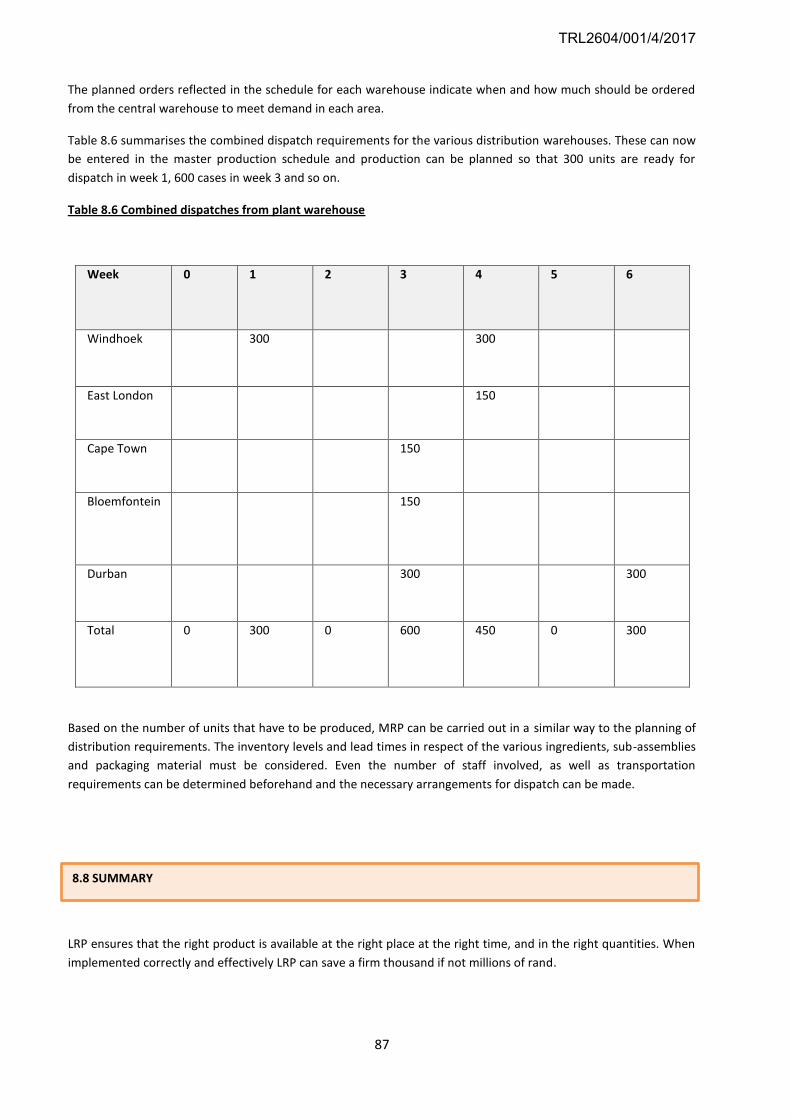
87
The planned orders reflected in the schedule for each warehouse indicate when and how much should be ordered
from the central warehouse to meet demand in each area.
Table 8.6 summarises the combined dispatch requirements for the various distribution warehouses. These can now
be entered in the master production schedule and production can be planned so that 300 units are ready for
dispatch in week 1, 600 cases in week 3 and so on.
Table 8.6 Combined dispatches from plant warehouse
Week 0 1 2 3 4 5 6
Windhoek 300 300
East London 150
Cape Town 150
Bloemfontein 150
Durban 300 300
Total 0 300 0 600 450 0 300
Based on the number of units that have to be produced, MRP can be carried out in a similar way to the planning of
distribution requirements. The inventory levels and lead times in respect of the various ingredients, sub-assemblies
and packaging material must be considered. Even the number of staff involved, as well as transportation
requirements can be determined beforehand and the necessary arrangements for dispatch can be made.
LRP ensures that the right product is available at the right place at the right time, and in the right quantities. When
implemented correctly and effectively LRP can save a firm thousand if not millions of rand.
8.8 SUMMARY
TRL2604/001/4/2017
88
Refer back to the study unit outcomes formulated at the beginning of the study unit and determine whether you
have achieved them by answering the self-assessment questions below.
(1) Describe in your own words what is meant by logistics requirement planning (LRP).
(2) Differentiate between dependent and independent demand and explain how these affect LRP.
(3) List the main variables and requirements necessary to implement an LRP system
(4) What are the advantages of LRP?
8.9 SELF-ASSESSMENT QUESTIONS
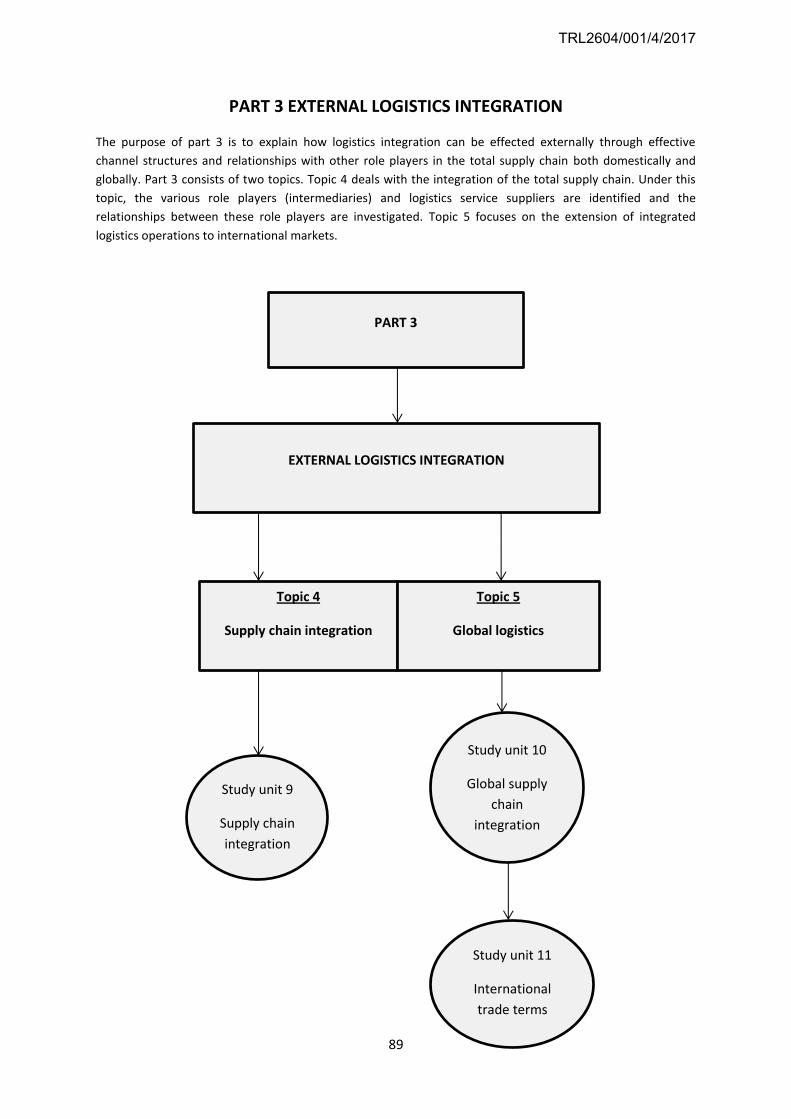
89
PART 3 EXTERNAL LOGISTICS INTEGRATION
The purpose of part 3 is to explain how logistics integration can be effected externally through effective
channel structures and relationships with other role players in the total supply chain both domestically and
globally. Part 3 consists of two topics. Topic 4 deals with the integration of the total supply chain. Under this
topic, the various role players (intermediaries) and logistics service suppliers are identified and the
relationships between these role players are investigated. Topic 5 focuses on the extension of integrated
logistics operations to international markets.
PART 3
EXTERNAL LOGISTICS INTEGRATION
Topic 4
Supply chain integration
Topic 5
Global logistics
Study unit 9
Supply chain
integration
Study unit 10
Global supply
chain
integration
Study unit 11
International
trade terms
TRL2604/001/4/2017
90
Contents
9.1 INTRODUCTION
9.2 SUPPLY CHAIN COMPETITIVENESS
9.3 RISK, POWER AND LEADERSHIP
9.4 SUPPLY CHAIN RELATIONSHIPS
9.5 SUPPLY CHAIN INTEGRATIVE FRAMEWORK
9.6 SUMMARY
9.7 SELF-ASSESSMENT QUESTIONS
PURPOSE
The purpose of this study unit is to guide you in developing a framework for collaboration and successful
supply chain integration by identifying capabilities and competencies that are essential for integrating supply
chain logistics. This will enable you to help your company participate successfully in supply chain
arrangements.
OUTCOMES
After working through this study unit, you will be able to
(1) explain the nature of supply chain relationships
(2) provide a framework for achieving comprehensive collaboration within the supply chain
9.1 INTRODUCTION
If logistics efficiency can be achieved by internal coordination of procurement, manufacturing support and
customer accommodation, it naturally follows that even greater efficiency is possible by integrating customers
and suppliers in a supply chain relationship. This can be done through proper supply chain collaboration, which
is based on sharing information and on joint planning by all participants in a channel. The first section of this
study unit covers the achievement of supply chain competitiveness through supply chain collaboration. This is
followed by a discussion of risk, power and leadership as important determinants of the nature of a supply
chain arrangement.
We then discuss supply chain relationships in terms of the classification of these relationships and the key
factors necessary for successful supply chain integration. The last section deals with the supply chain
integrative framework, where the focus is on the supply chain context, competencies and supportive
capabilities.
STUDY UNIT 9
SUPPLY CHAIN INTEGRATION
91
9.2 SUPPLY CHAIN COMPETITIVENESS
Why is it necessary to form supply chain relationships?
The driving force behind the formation of supply chain relationships is the desire to increase the
competitiveness of the channel by providing a superior service at the lowest total logistics costs. Each
participant in a distribution channel has some core competency which, when combined into an effective
supply chain, can result in superior service at the lowest logistics costs.
Did you notice that total logistics costs can be reduced by sharing information and minimising inventories?
Competitive superiority can be achieved by effectively integrating the supply chain through collaboration.
9.3 RISK, POWER AND LEADERSHIP
Acknowledged or perceived dependency is the driving force behind a firm’s willingness to enter into channel
arrangements and to negotiate the transfer of certain functions to other firms, to share key strategic
information and to participate in joint operational planning. Certain factors, however, influence the nature of
these relationships. These are the relative risk for each participant, the relative power enjoyed by each and the
issue of who should accept leadership for the arrangement.
The relationship between risk, power and leadership determines the nature of the channel arrangement. As a
general rule, the firm bearing the most risk will assume the leadership role and will accept greater
responsibility for facilitating supply chain cooperation.
ACTIVITY 9.1
Study Bowersox et al (2013:351-352) and then answer the following questions:
(1) What is supply chain management? ( See study unit 1.)
(2) How can the competitiveness of the supply chain be improved?
FEEDBACK ON ACTIVITY 9.1
ACTIVITY 9.2
Study Bowersox et al (2013:355–356) and then answer the following question: What is the impact of risk,
power and leadership on the development of supply chain relationships?
FEEDBACK ON ACTIVITY 9.2
TRL2604/001/4/2017
92
9.4 SUPPLY CHAIN RELATIONSHIPS
No firm can be self-sufficient and, in general, all firms are dependent on other firms for the performance of
logistics activities. For the supply chain to be effective, certain relationships and arrangements need to be in
place in participating firms. There are five basic forms of collaboration between supply chain participants,
namely
(1) contracting
(2) outsourcing
(3) administered
(4) alliances
(5) extended enterprises
As in any relationship, certain requirements are necessary for the relationship to be a successful one. The
following are the criteria for successful partnerships in the supply chain (the 8 I’s):
Individual excellence
Both partners are strong and have something of value to contribute to the relationship. Their motives for
entering into the relationship are positive (to pursue future opportunities), not negative (to mask weaknesses
or escape a difficult situation).
Importance
Because the relationship ties in with the major strategic objectives of the partners, they want to make it work.
Partners have long-term goals in which the relationship plays a key role.
Interdependence
The partners need each other. They have complementary assets and skills. Neither can accomplish its goals
independently of the other.
Investments
The partners invest in each other (e.g. through equity swaps, cross-ownership, or mutual board service) to
demonstrate their respective stakes in the relationship and each other. They show tangible signs of long-term
commitment by devoting financial and other resources to the relationship.
Information
Communication is reasonably open. Partners share information required to make the relationship work,
including their objectives and goals, technical data and knowledge of conflicts, trouble spots, or changing
situations.
ACTIVITY 9.3
Study Bowersox et al (2013:352-254) and then answer the following question: Draw up a framework to
explain the classification of supply chain relationships.
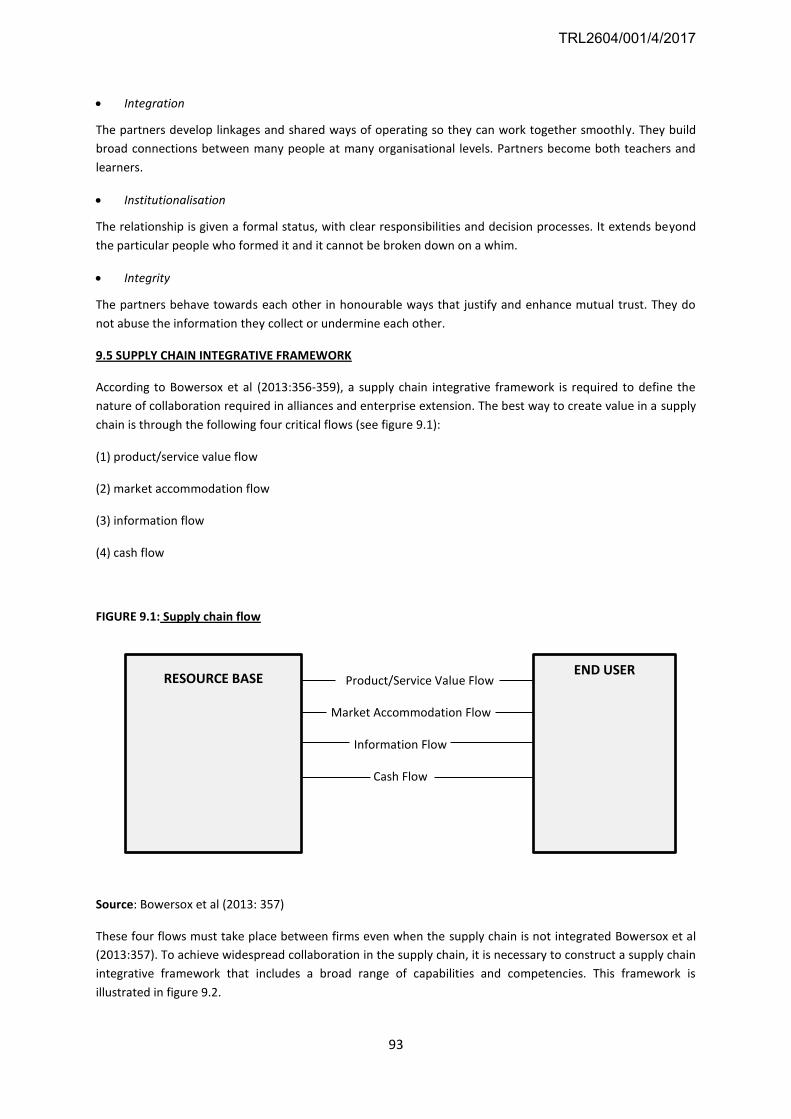
93
Integration
The partners develop linkages and shared ways of operating so they can work together smoothly. They build
broad connections between many people at many organisational levels. Partners become both teachers and
learners.
Institutionalisation
The relationship is given a formal status, with clear responsibilities and decision processes. It extends beyond
the particular people who formed it and it cannot be broken down on a whim.
Integrity
The partners behave towards each other in honourable ways that justify and enhance mutual trust. They do
not abuse the information they collect or undermine each other.
9.5 SUPPLY CHAIN INTEGRATIVE FRAMEWORK
According to Bowersox et al (2013:356-359), a supply chain integrative framework is required to define the
nature of collaboration required in alliances and enterprise extension. The best way to create value in a supply
chain is through the following four critical flows (see figure 9.1):
(1) product/service value flow
(2) market accommodation flow
(3) information flow
(4) cash flow
FIGURE 9.1: Supply chain flow
Product/Service Value Flow
Market Accommodation Flow
Information Flow
Cash Flow
Source: Bowersox et al (2013: 357)
These four flows must take place between firms even when the supply chain is not integrated Bowersox et al
(2013:357). To achieve widespread collaboration in the supply chain, it is necessary to construct a supply chain
integrative framework that includes a broad range of capabilities and competencies. This framework is
illustrated in figure 9.2.
RESOURCE BASE END USER
TRL2604/001/4/2017
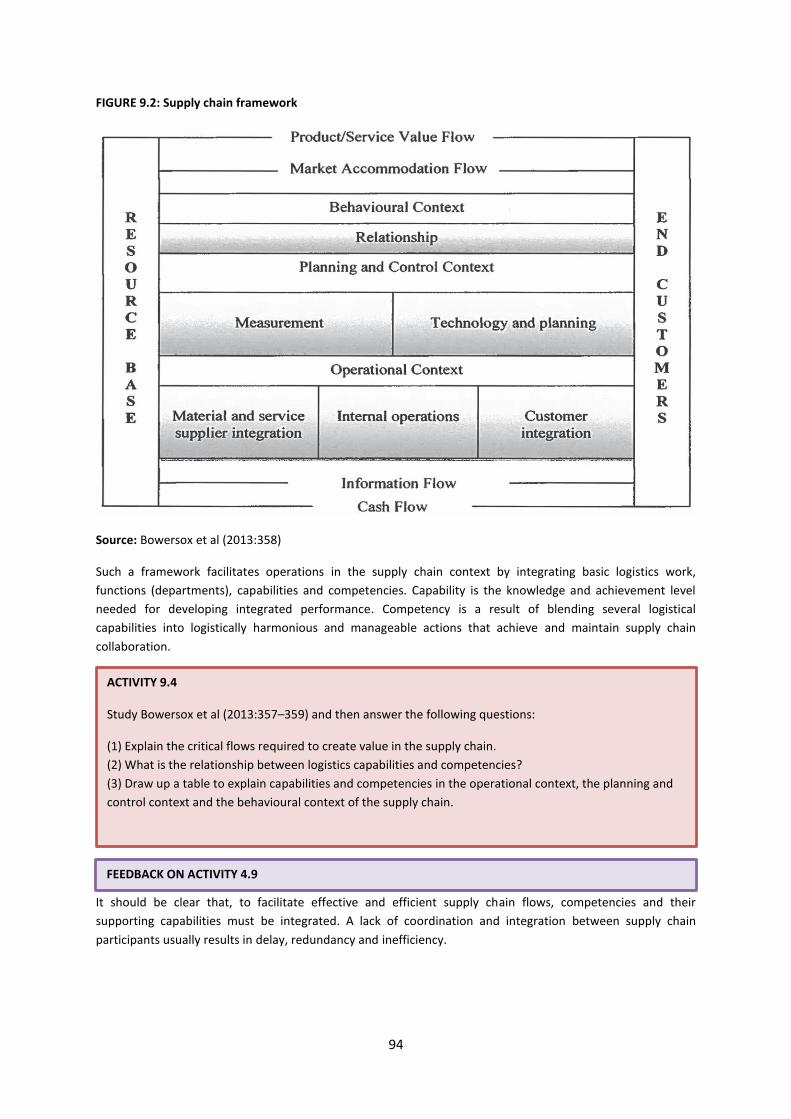
94
FIGURE 9.2: Supply chain framework
Source: Bowersox et al (2013:358)
Such a framework facilitates operations in the supply chain context by integrating basic logistics work,
functions (departments), capabilities and competencies. Capability is the knowledge and achievement level
needed for developing integrated performance. Competency is a result of blending several logistical
capabilities into logistically harmonious and manageable actions that achieve and maintain supply chain
collaboration.
It should be clear that, to facilitate effective and efficient supply chain flows, competencies and their
supporting capabilities must be integrated. A lack of coordination and integration between supply chain
participants usually results in delay, redundancy and inefficiency.
ACTIVITY 9.4
Study Bowersox et al (2013:357–359) and then answer the following questions:
(1) Explain the critical flows required to create value in the supply chain.
(2) What is the relationship between logistics capabilities and competencies?
(3) Draw up a table to explain capabilities and competencies in the operational context, the planning and
control context and the behavioural context of the supply chain.
FEEDBACK ON ACTIVITY 4.9
95
Capabilities link the supply chain and apply to all participants in the supply chain. Combining the capabilities
results in universal competencies. A competency is therefore the result of blending several logistical
capabilities into logistically coherent and manageable actions that achieve and maintain supply chain
collaboration. Supply chains that achieve high levels of competency integration tend to increase customer
loyalty and thus give the supply chain a competitive advantage.
The reason that supply chain integration achieves value is directly related to the significant potential this has
for reducing waste, duplication and operational redundancy. In particular, collaboration offers ways to reduce
inventory investment and related risks for participating firms. Successful supply chain integration requires
cross-organisational programmes to facilitate operations, technology and planning, and encourage relationship
management collaboration. Today, there is little, if any, complete supply chain collaboration, the potential
benefits of such holistic integration are enormous.
Refer back to the study unit outcomes formulated at the beginning of the study unit and determine whether
you have achieved them by answering the self-assessment questions below.
(1) What, in your opinion, is the main reason for supply chain integration? Write a brief paragraph on why
supply chain integration is necessary.
(2) Explain the impact of risk, power and leadership on the development of supply chain relationships.
(3) Discuss each of the five basic forms of supply chain collaboration.
(4) Explain the criteria for successful partnerships in the supply chain (8 I’s).
(5) Explain the capabilities and competencies in the operational context, the planning and control context, and
the behavioural context of the supply chain.
(6) Draw a diagram of a framework for supply chain integration.
9.6 SUMMARY
9.7 SELF-ASSESSMENT QUESTIONS
DEFINITION
Bowersox et al (2013:358) define capability as the knowledge and achievement level essential to
developing integrated performance.
TRL2604/001/4/2017
96
CONTENTS
10.1 INTRODUCTION
10.2 GLOBAL ECONOMIES
10.3 GLOBAL SUPPLY CHAIN INTEGRATION
10.4 MANAGING THE GLOBAL SUPPLY CHAIN
10.5 SUMMARY
10.6 SELF-ASSESSMENT QUESTIONS
PURPOSE
The purpose of this study unit is to enable you to contribute to international supply chain integration through
your understanding of the logistical implications of global logistics operations.
OUTCOMES
After working through this study unit, you will be able to
(1) review the extent of global involvement
(2) investigate the logistics implications of different levels of global involvement
(3) compare global logistics operations with domestic operations
10.1 INTRODUCTION
While an effective logistics system is important for domestic operations, it is essential for global manufacturing
and marketing. There are, however, major differences in global logistics when compared with domestic
logistics operations which pose certain challenges for logistics management. This study unit focuses on the
requirements which make global operations unique in comparison with domestic logistics.
In the first section of this study unit, attention is given to global economies. This is followed by a discussion of
global supply chain integration and the management of global supply chains. The final section summarises the
supply chain differences between domestic and international operations.
10.2 GLOBAL ECONOMIES
Irrespective of most organisations’ size, many of them will include an element of global operations at some
point in time (Bowersox et al, 2013:270). There exist several reasons why organisations engage in global
activities.
STUDY UNIT 10
GLOBAL SUPPLY CHAIN INTEGRATION
97
Table 11.1 in Bowersox et al (2013:271) lists the key objectives organisations use to substantiate globalization.
Mostly the objectives include the following:
• Increase in revenue
• Economies of scale
• Reduction of direct costs
• Advancements in technology
• Reduction of global tax liability
• Reduction of market access uncertainty
• Enhancement of sustainability
Global sourcing provides organisations with numerous opportunities to enhance the organisation’s
performance, especially in terms of revenue, volume and market share.
10.3 GLOBAL SUPPLY CHAIN INTEGRATION
10.3.1 Globalisation strategies________________________________________________________________
For this section, study Bowersox et al, (2013:271-276).
According to Bowersox et al, (2013:272) the globalisation of supply chains can be categorised into four
strategies namely:
1) No international strategy
These organisations are merely involved in domestic operations.
A few international transactions in the form of global sourcing, but no systematic strategy for the
organisation to expand international operations.
The advantage of this strategy is that it reduces complexities, and there is the least possible
coordination required across the supply chain and other firm functions.
The disadvantages are that it is problematic to respond to customers that do operate globally, and
development is restricted to local markets.
2) Multi-domestic strategy
Organisations indicate that they have operations in multiple countries, but the country in which the
corporate headquarters is located, is the main country.
Organisations normally have separate, semi- autonomous supply chains in each global district.
ACTIVITY 10.1
Study Bowersox et al. (2013:270-271), and then answer the following question:
(1) List all the possible reasons that you can think of that drives organisations to engage in global
operations.
FEEDBACK ON ACTIVITY 10.1
TRL2604/001/4/2017
98
International operations are used to assist domestic operations, mainly regarding sourcing raw
materials and goods for resale.
Logistics and supply chain operations within each district are self-regulating.
The advantage is that the organisation can concentrate on local markets while reducing overall
coordination requests.
The disadvantages are that it is non-responsive to globally based customers, and it is challenging to
develop economies of scale.
3) Global strategy
Cross-border operations with some local market customization.
Usually there is a single headquarters that organises global operations, but the logistics and supply
chain operations takes place in regions around the world.
Each country concentrates on the market characteristics of the region.
There is little motivation on reducing brand, manufacturing, and logistics complexity.
Transactions between various regions or countries are usually treated as intra-firm transfers.
Most advance integration is the focus on globally integrated financials.
Product development, marketing, supply chain, and planning are less popular.
Advantages are the ability to focus on numerous local markets, meeting the requirements of local
customers, and the competence to benefit of global brands and products.
Disadvantage: It is problematic to respond in a unified manner to global customers.
4) Transnational strategy
Organisations maintain regional operations around the globe and use a headquarters structure that
increases the efficiency of organisational operations and performance.
There are still mostly regional operations, but no single headquarters region.
Several activities may be situated in separate regions to guarantee global perspectives.
Goal is to administer activities in the region that can best manage those activities.
Organisations look for limited consolidated customer centers, production control facilities and
purchasing centers.
Advantages are that it enables a global focus of solution development and delivery, important
economies of scales.
Disadvantages are this demands coordination and information integration, and it minimises a firm’s
ability to respond to individual market distinctiveness.
10.4 MANAGING THE GLOBAL SUPPLY CHAIN
In order to meet the logistics challenges of global operations, logistics management needs to evaluate the
complexity of global supply chains. What makes global logistics unique in comparison with domestic logistics?
What is the implication of global operations for supply chain management?
ACTIVITY 10.2
Study Bowersox et al. (2013:272-276), and then answer the following question:
(1) Write down examples of organisations, which you can think of, that fit into each of the four globalizationstrategies.
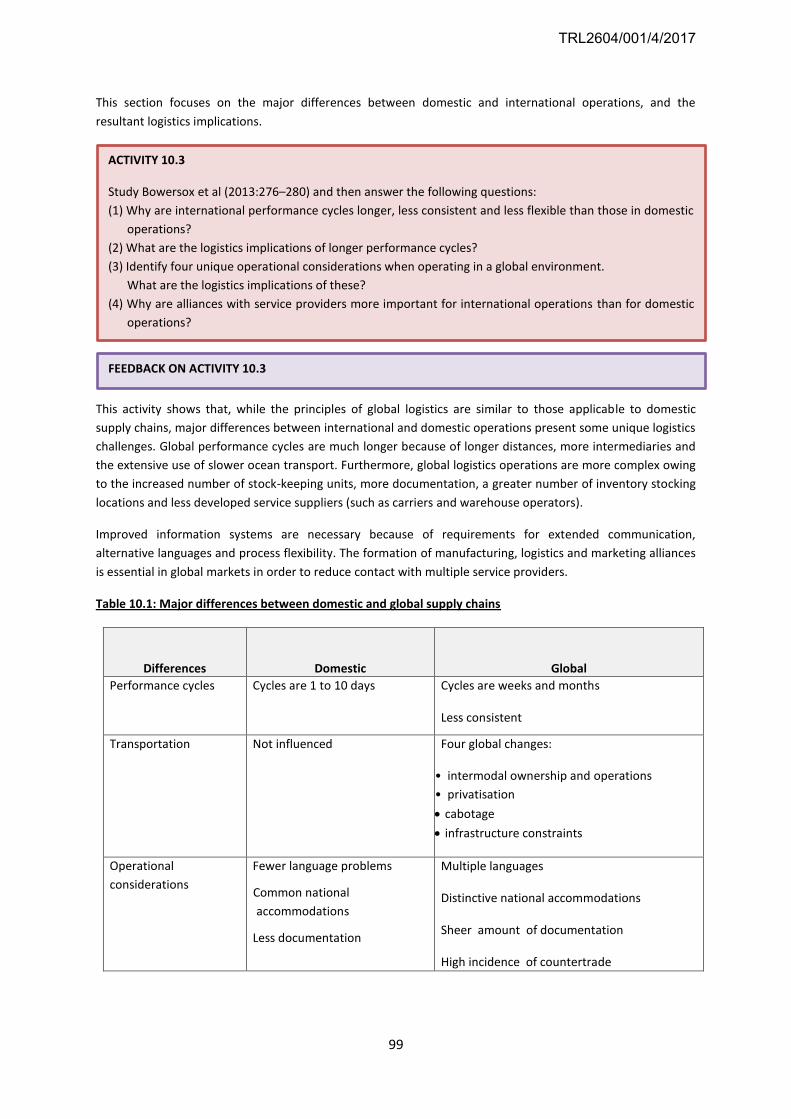
99
This section focuses on the major differences between domestic and international operations, and the
resultant logistics implications.
This activity shows that, while the principles of global logistics are similar to those applicable to domestic
supply chains, major differences between international and domestic operations present some unique logistics
challenges. Global performance cycles are much longer because of longer distances, more intermediaries and
the extensive use of slower ocean transport. Furthermore, global logistics operations are more complex owing
to the increased number of stock-keeping units, more documentation, a greater number of inventory stocking
locations and less developed service suppliers (such as carriers and warehouse operators).
Improved information systems are necessary because of requirements for extended communication,
alternative languages and process flexibility. The formation of manufacturing, logistics and marketing alliances
is essential in global markets in order to reduce contact with multiple service providers.
Table 10.1: Major differences between domestic and global supply chains
Differences Domestic Global
Performance cycles Cycles are 1 to 10 days
Flexible
Cycles are weeks and months
Less consistent
Transportation Not influenced Four global changes:
• intermodal ownership and operations
• privatisation
cabotage
infrastructure constraints
• cabotage
• infrastructure constraints
Operational
considerations
Fewer language problems
Common national
accommodations
Less documentation
Multiple languages
Distinctive national accommodations
Sheer amount of documentation
High incidence of countertrade
ACTIVITY 10.3
Study Bowersox et al (2013:276–280) and then answer the following questions:
(1) Why are international performance cycles longer, less consistent and less flexible than those in domestic
operations?
(2) What are the logistics implications of longer performance cycles?
(3) Identify four unique operational considerations when operating in a global environment.
What are the logistics implications of these?
(4) Why are alliances with service providers more important for international operations than for domestic
operations?
FEEDBACK ON ACTIVITY 10.3
TRL2604/001/4/2017
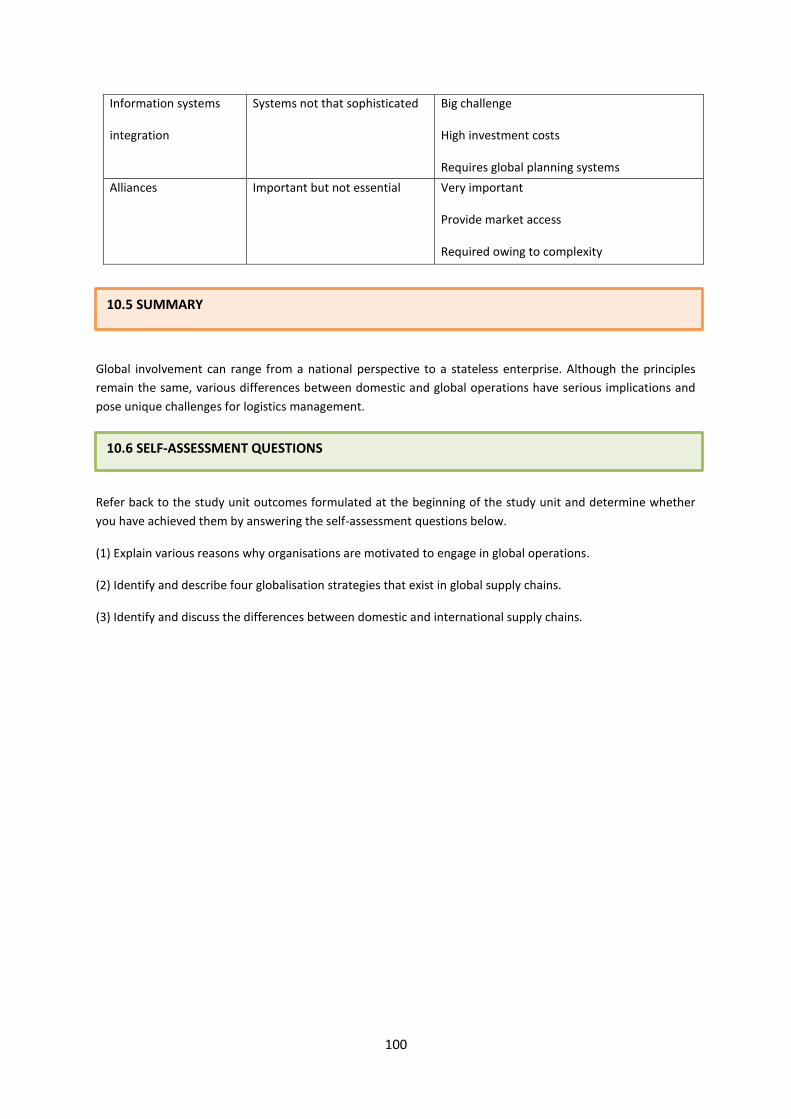
100
Information systems
integration
Systems not that sophisticated Big challenge
High investment costs
Requires global planning systems
Alliances Important but not essential Very important
Provide market access
Required owing to complexity
Global involvement can range from a national perspective to a stateless enterprise. Although the principles
remain the same, various differences between domestic and global operations have serious implications and
pose unique challenges for logistics management.
Refer back to the study unit outcomes formulated at the beginning of the study unit and determine whether
you have achieved them by answering the self-assessment questions below.
(1) Explain various reasons why organisations are motivated to engage in global operations.
(2) Identify and describe four globalisation strategies that exist in global supply chains.
(3) Identify and discuss the differences between domestic and international supply chains.
10.5 SUMMARY
10.6 SELF-ASSESSMENT QUESTIONS
101
CONTENTS
11.1 INTRODUCTION
11.2 ORGANISATION OF INCOTERMS 2010
11.3 DESCRIPTION OF INCOTERMS 2010
11.4 NOTES ON INCOTERMS 2010
11.5 SUMMARY
BIBLIOGRAPHY
PURPOSE
The purpose of this study unit is to introduce you to the trade terminology (Incoterms) used in foreign trade
and how it is used in a sales contract.
OUTCOMES
After working through this study unit, you should be able to interpret and use international trade terms to
facilitate global logistics operations.
11.1 INTRODUCTION
For global trade to function effectively, a set of international rules is required for the interpretation of the
most commonly used trade terms. This set of rules helps to avoid, or at least reduce, the problems caused by
different interpretations of trade terms in different countries. Incoterms are a set of international rules for the
interpretation of trade terms set forth by the International Chamber of Commerce (ICC). The word “Incoterm”
is an abbreviation of “international commercial terms” and the chosen Incoterm is a term of the contract of
sale. Incoterms are not terms of the contracts of carriage or delivery.
Incoterms are internationally accepted commercial terms of sale. They define the obligations, risks and costs
shared by the buyer and seller in a transaction relating to the delivery of goods. Since the creation of
Incoterms by the ICC in 1936, this worldwide contractual standard has been updated regularly to keep pace
with international trade development.
11.2 ORGANISATION OF INCOTERMS 2010
Incoterms 2010 are grouped into two categories to make them more understandable:
(1) Incoterms for any mode or modes of transport
EXW – ex works
FCA – free carrier
CPT – carriage paid to
STUDY UNIT 11
INTERNATIONAL TRADE TERMS
TRL2604/001/4/2017
102
CIP – carriage and insurance paid to
DAT – delivered at terminal
DAP – delivered at place
DDP – delivered duty paid
(2) Incoterms for sea and inland waterway transport only
FAS – free alongside ship
FOB – free on board
CFR – cost and freight
CIF – cost, insurance and freight
11.3 DESCRIPTION OF INCOTERMS 2010
11.3.1 EXW – ex works_______________________________________________________________________
The buyer bears all costs and risks involved in taking the goods from the seller’s premises to the desired
destination. The seller’s obligation is to make the goods available at their premises (works, factory and
warehouse). This term represents minimum obligation for the seller and can be used across all modes of
transport.
11.3.2 FCA – free carrier______________________________________________________________________
The seller’s obligation is to hand over the goods, cleared for export, into the charge of the carrier named by
the buyer at the named place or point. If no precise point is indicated by the buyer, the seller may choose
within the place or range stipulated where the carrier must take the goods into their charge. When the seller’s
assistance is required in making the contract with the carrier, the seller may act at the buyer’s risk and
expense. This term can be used across all modes of transport.
11.3.3 CPT – carriage paid to__________________________________________________________________
The seller pays the freight for the carriage of goods to the named destination. The risk of loss or damage to the
goods occurring after the delivery has been made to the carrier is transferred from the seller to the buyer. This
term requires the seller to clear the goods for export and can be used across all modes of transport.
11.3.4 CIP – carriage and insurance paid to_______________________________________________________
The seller has the same obligations as under CPT but has the responsibility of obtaining insurance against the
buyer’s risk of loss or damage of goods during the carriage. The seller is required to clear the goods for export
but is only required to obtain insurance on minimum coverage. This term requires the seller to clear the goods
for export and can be used across all modes of transport.
11.3.5 DAT – delivered at terminal______________________________________________________________
The seller delivers when the goods, once unloaded from the arriving means of transport, are placed at the
disposal of the buyer at a named terminal at the named port or place of destination. “Terminal” includes quay,
warehouse, container yard or road, rail or air terminal. Both parties should agree on the terminal and, if
possible, a point within the terminal, at which point the risks will transfer from the seller to the buyer of the
goods. If it is intended that the seller is to bear all the costs and responsibilities from the terminal to another
point, DAP or DDP may apply.
103
11.3.6 DAP – delivered at place_________________________________________________________________
The seller delivers the goods when they are placed at the disposal of the buyer on the arriving means of
transport ready for unloading at the named place of destination. Parties are advised to specify as clearly as
possible the point within the agreed place of destination, because risks transfer at this point from seller to
buyer. If the seller is responsible for clearing the goods, paying duties etc, consideration should be given to
using the DDP term.
11.3.7 DDP – delivered duty paid_______________________________________________________________
The seller is responsible for delivering the goods to the named place in the country of importation, including all
costs and risks in bringing the goods to import destination. This includes duties, taxes and customs formalities.
This term may be used irrespective of the mode of transport.
11.3.8 FAS – free alongside ship________________________________________________________________
The seller has fulfilled its obligation when goods have been placed alongside the vessel at the port of
shipment. The buyer is responsible for all costs and risks of loss or damage to the goods from that moment.
The buyer is also required to clear the goods for export. This term should only be used for sea or inland
waterway transport.
11.3.9 FOB – free on board____________________________________________________________________
Once the goods have passed over the ship’s rail at the port of export the buyer is responsible for all costs and
risks of loss or damage to the goods from that point. The seller is required to clear the goods for export. This
term should only be used for sea or inland waterway transport.
11.3.10 CFR – cost and freight__________________________________________________________________
The seller must pay the costs and freight required in bringing the goods to the named port of destination. The
risk of loss or damage is transferred from seller to buyer when the goods pass over the ship’s rail in the port of
shipment. The seller is required to clear the goods for export. This term should only be used for sea or inland
waterway transport.
11.3.11 CIF – cost, insurance and freight_________________________________________________________
The seller has the same obligations as under CFR, but is also required to provide insurance against the buyer’s
risk of loss or damage to the goods during transit. The seller is required to clear the goods for export. This term
should only be used for sea or inland waterway transport.
11.4 NOTES ON INCOTERMS 2010
The ICC outlines four important notes on the use of Incoterm rules in contracts for the sale of goods.
It must be clear from the contract that the parties want the Incoterms 2010 rules to apply
The ICC recommends citing the specific rule and a specific location together with explicit reference to
Incoterms 2010. To prevent misunderstandings, parties must make the intended effect of any variants clear in
their contract. In particular, the ICC recommends that “Incoterms 2010” rather than simply “Incoterms” should
be explicitly referred to in the sale contract (assuming it is the intention to incorporate the latest version), so
as to avoid any subsequent dispute as to which rules applies.
TRL2604/001/4/2017
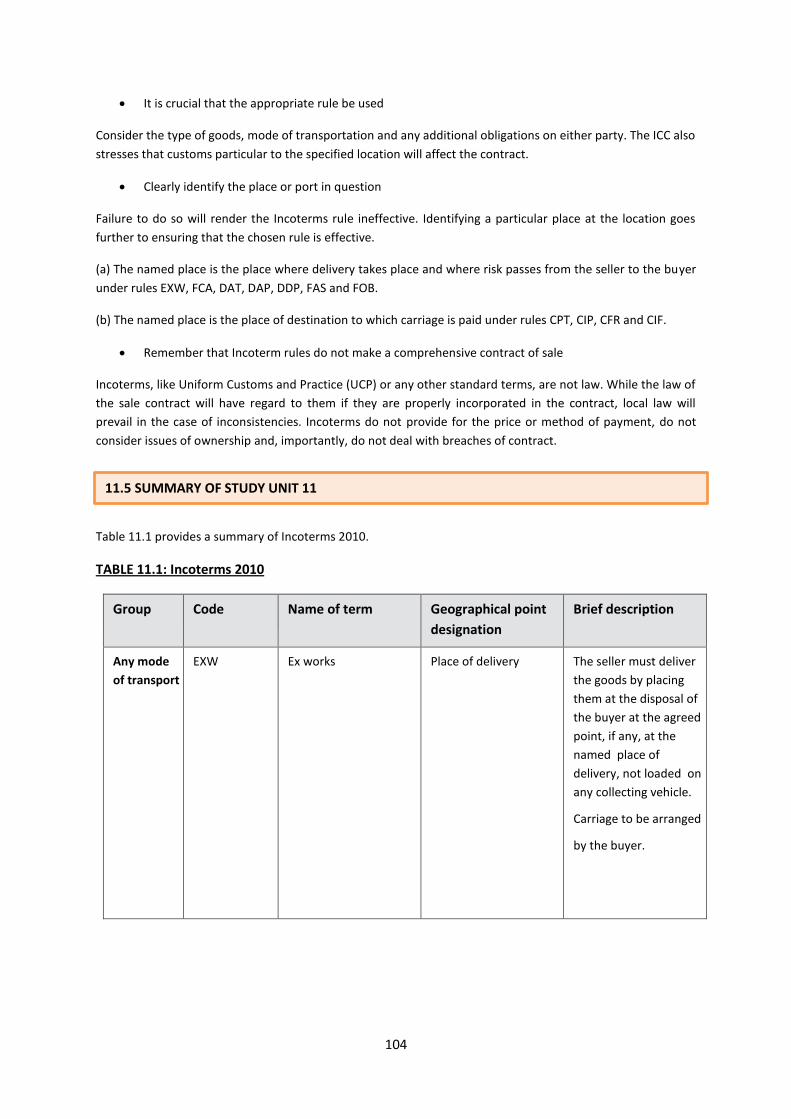
104
It is crucial that the appropriate rule be used
Consider the type of goods, mode of transportation and any additional obligations on either party. The ICC also
stresses that customs particular to the specified location will affect the contract.
Clearly identify the place or port in question
Failure to do so will render the Incoterms rule ineffective. Identifying a particular place at the location goes
further to ensuring that the chosen rule is effective.
(a) The named place is the place where delivery takes place and where risk passes from the seller to the buyer
under rules EXW, FCA, DAT, DAP, DDP, FAS and FOB.
(b) The named place is the place of destination to which carriage is paid under rules CPT, CIP, CFR and CIF.
Remember that Incoterm rules do not make a comprehensive contract of sale
Incoterms, like Uniform Customs and Practice (UCP) or any other standard terms, are not law. While the law of
the sale contract will have regard to them if they are properly incorporated in the contract, local law will
prevail in the case of inconsistencies. Incoterms do not provide for the price or method of payment, do not
consider issues of ownership and, importantly, do not deal with breaches of contract.
Table 11.1 provides a summary of Incoterms 2010.
TABLE 11.1: Incoterms 2010
Group Code Name of term Geographical point
designation
Brief description
Any mode
of transport
EXW Ex works Place of delivery The seller must deliver
the goods by placing
them at the disposal of
the buyer at the agreed
point, if any, at the
named place of
delivery, not loaded on
any collecting vehicle.
Carriage to be arranged
by the buyer.
11.5 SUMMARY OF STUDY UNIT 11
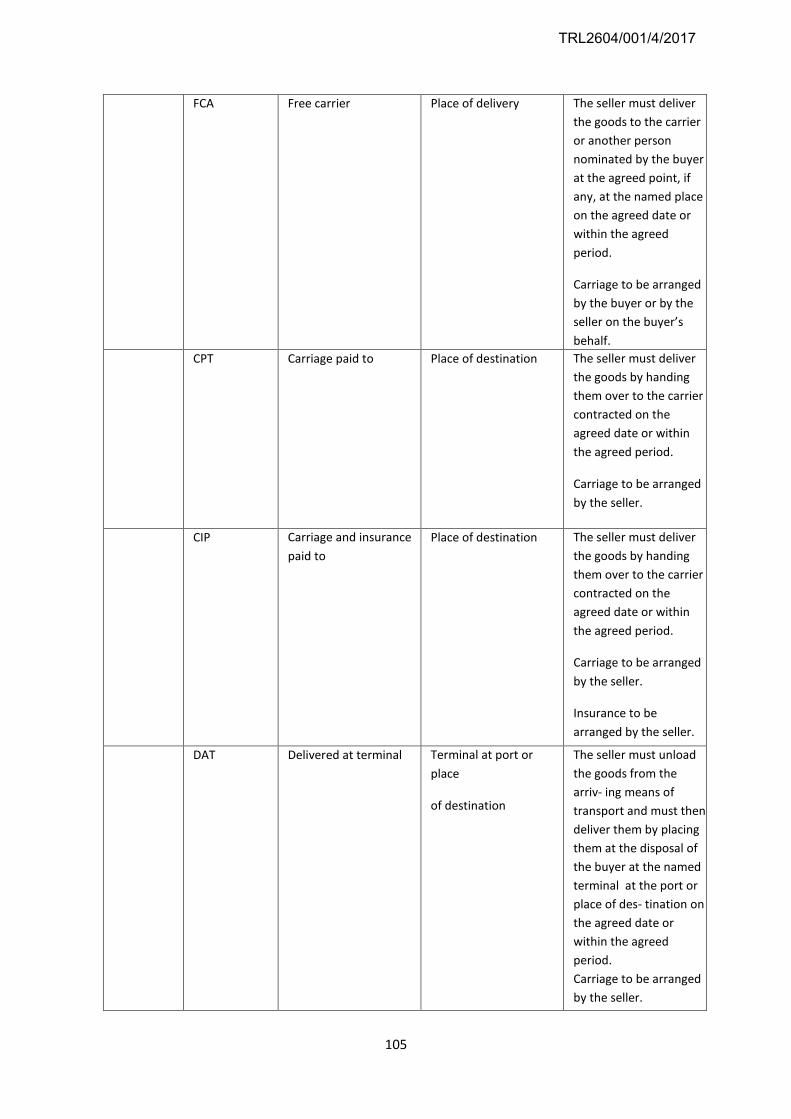
105
FCA Free carrier Place of delivery The seller must deliver
the goods to the carrier
or another person
nominated by the buyer
at the agreed point, if
any, at the named place
on the agreed date or
within the agreed
period.
Carriage to be arranged
by the buyer or by the
seller on the buyer’s
behalf.
CPT Carriage paid to Place of destination The seller must deliver
the goods by handing
them over to the carrier
contracted on the
agreed date or within
the agreed period.
Carriage to be arranged
by the seller.
CIP Carriage and insurance
paid to
Place of destination The seller must deliver
the goods by handing
them over to the carrier
contracted on the
agreed date or within
the agreed period.
Carriage to be arranged
by the seller.
Insurance to be
arranged by the seller.
DAT Delivered at terminal Terminal at port or
place
of destination
The seller must unload
the goods from the
arriv- ing means of
transport and must then
deliver them by placing
them at the disposal of
the buyer at the named
terminal at the port or
place of des- tination on
the agreed date or
within the agreed
period.
Carriage to be arranged
by the seller.
TRL2604/001/4/2017
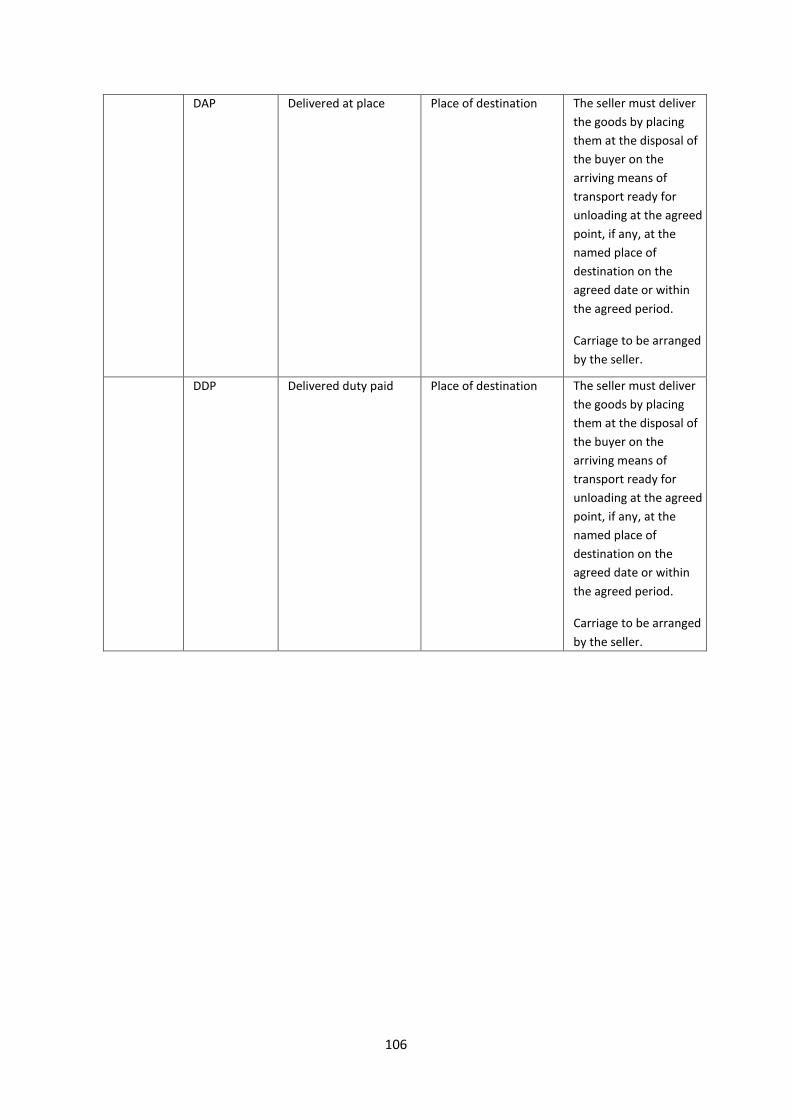
106
DAP Delivered at place Place of destination The seller must deliver
the goods by placing
them at the disposal of
the buyer on the
arriving means of
transport ready for
unloading at the agreed
point, if any, at the
named place of
destination on the
agreed date or within
the agreed period.
Carriage to be arranged
by the seller.
DDP Delivered duty paid Place of destination The seller must deliver
the goods by placing
them at the disposal of
the buyer on the
arriving means of
transport ready for
unloading at the agreed
point, if any, at the
named place of
destination on the
agreed date or within
the agreed period.
Carriage to be arranged
by the seller.
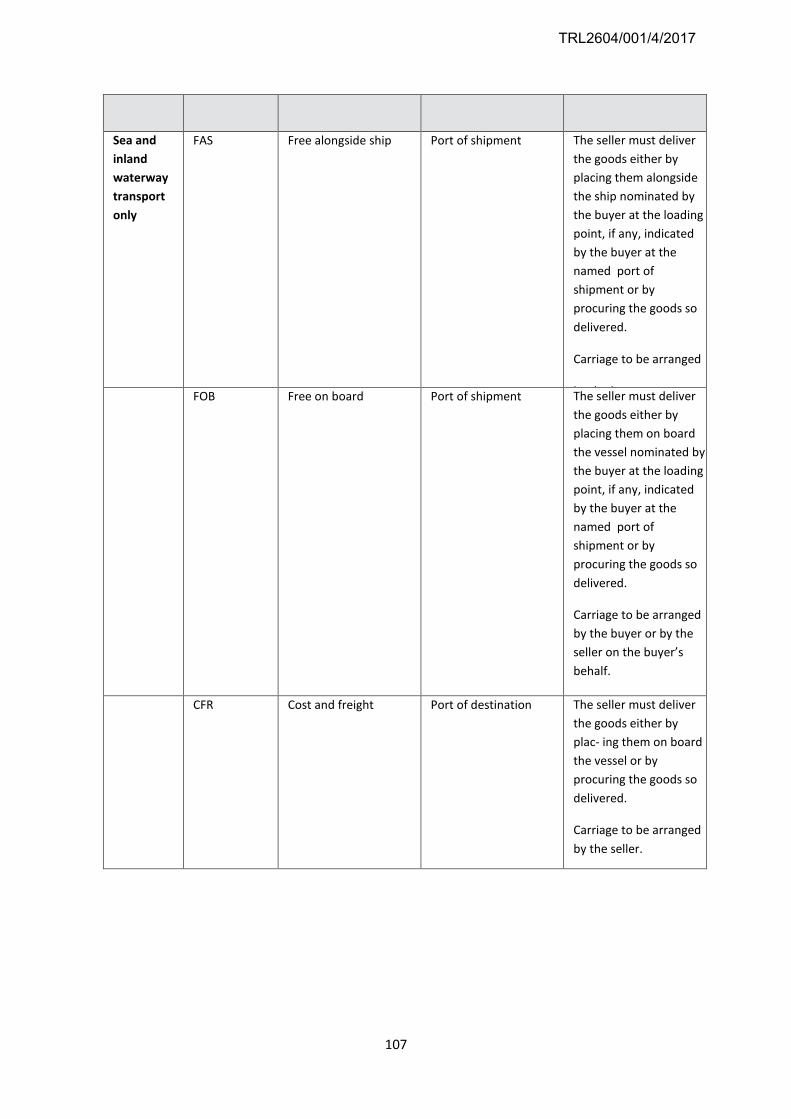
107
Sea and
inland
waterway
transport
only
FAS Free alongside ship Port of shipment The seller must deliver
the goods either by
placing them alongside
the ship nominated by
the buyer at the loading
point, if any, indicated
by the buyer at the
named port of
shipment or by
procuring the goods so
delivered.
Carriage to be arranged
by the buyer. FOB Free on board Port of shipment The seller must deliver
the goods either by
placing them on board
the vessel nominated by
the buyer at the loading
point, if any, indicated
by the buyer at the
named port of
shipment or by
procuring the goods so
delivered.
Carriage to be arranged
by the buyer or by the
seller on the buyer’s
behalf.
CFR Cost and freight Port of destination The seller must deliver
the goods either by
plac- ing them on board
the vessel or by
procuring the goods so
delivered.
Carriage to be arranged
by the seller.
TRL2604/001/4/2017
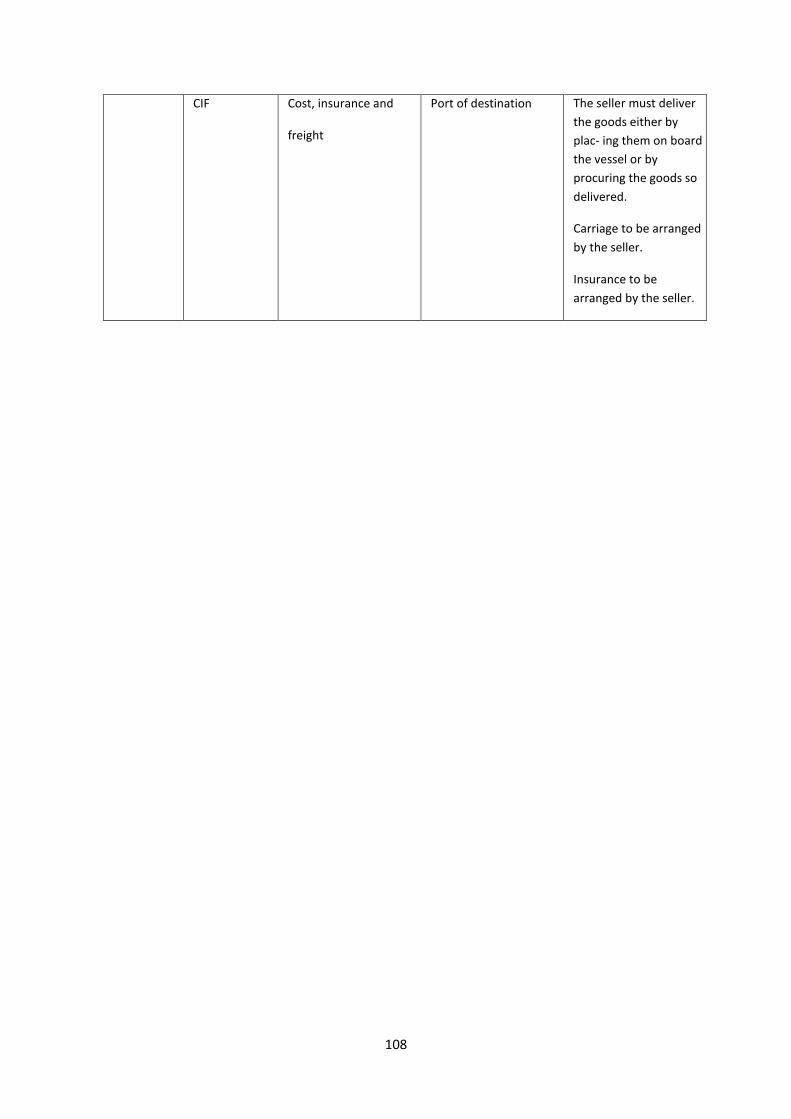
108
CIF Cost, insurance and
freight
Port of destination The seller must deliver
the goods either by
plac- ing them on board
the vessel or by
procuring the goods so
delivered.
Carriage to be arranged
by the seller.
Insurance to be
arranged by the seller.
109
BIBLIOGRAPHY
Ballou, RH. 1985. Business logistics management. Englewood Cliffs, NJ: Prentice Hall.
Bowersox, DJ, Closs, DJ, Cooper, MB, Bowersox, JC. 2013. Supply chain logistics management. New York:
McGraw-Hill.
Branch, A. 2000. Export practice and management. Singapore: Thompson.
Council of Supply Chain Management Professionals (CSCMP). 2010. Supply chain management terms and
glossary. http://cscmp.org/digital/glossary/document.pdf.
Du Plessis, JH. 2002. Freight Forwarding: Study Guide for PRFM03Q. Pretoria: University of South Africa.
Gattorna, J, Day, A & Hargreaves, J. 1991. Effective logistics management. Logistics Information Management,
4(2):1–86.
International Chamber of Commerce. 2010. Incoterms 2010. Paris.
Johnson, JC & Wood, DF. 1986. Contemporary physical distribution and logistics. 3rd edition. New York:
Macmillan.
Lambert, DJ & Stock, JR. 1982. Strategic physical distribution management. Homewood, Ill: Irwin.
Lambert, DJ & Stock, JR. 1993. Strategic logistics management. 3rd edition. Homewood, Ill: Irwin.
Pienaar, WJ & Vogt, JJ. 2009. Business logistics management: a supply chain perspective. Cape Town: Oxford
University Press.
Stock, JR & Lambert, DM. 2001. Strategic logistics management. 4th edition. Homewood, Ill: Irwin.
Vogt, JJ, Pienaar, WJ & De Wit, PWC. 2002. Business logistics management: theory and practice. Cape Town:
Oxford University Press.
TRL2604/001/4/2017