Embed Size (px)
Citation preview
386 | Soft Matter, 2016, 12, 386--401 This journal is©The Royal Society of Chemistry 2016
Cite this: SoftMatter, 2016,
12, 386
Entropic forces stabilize diverse emergentstructures in colloidal membranes
Louis Kang,*a Thomas Gibaud,b Zvonimir Dogicc and T. C. Lubenskya
The depletion interaction mediated by non-adsorbing polymers promotes condensation and assembly
of repulsive colloidal particles into diverse higher-order structures and materials. One example, with
particularly rich emergent behaviors, is the formation of two-dimensional colloidal membranes from a
suspension of filamentous fd viruses, which act as rods with effective repulsive interactions, and dextran,
which acts as a condensing, depletion-inducing agent. Colloidal membranes exhibit chiral twist even
when the constituent virus mixture lacks macroscopic chirality, change from a circular shape to a
striking starfish shape upon changing the chirality of constituent rods, and partially coalesce via domain
walls through which the viruses twist by 1801. We formulate an entropically-motivated theory that can
quantitatively explain these experimental structures and measurements, both previously published and
newly performed, over a wide range of experimental conditions. Our results elucidate how entropy
alone, manifested through the viruses as Frank elastic energy and through the depletants as an effective
surface tension, drives the formation and behavior of these diverse structures. Our generalizable
principles propose the existence of analogous effects in molecular membranes and can be exploited in
the design of reconfigurable colloidal structures.
I. Introduction
Suspensions of particles with hard-core repulsive interactionsform equilibrium phases that minimize the systems’ freeenergy by maximizing their entropy. Since entropy is conven-tionally associated with disorder, it might be expected thathard-particle fluids form structures that lack long-range order.However, extensive experimental work and theoretical modelshave repeatedly demonstrated the counterintuitive notion thatentropy alone is sufficient to stabilize ordered phases of ever-increasing complexity. Among other examples, it has beenshown that entropy can drive formation of 3D bulk crystals insuspensions of hard spheres,1–3 nematic and smectic liquidcrystalline phases with hard rods,4,5 and more exotic binarycrystals and diverse microphase-separated states in mixtures ofhard particles.6–8
Recent work has demonstrated that a mixture of mono-disperse micron-long filamentous bacteriophages and non-adsorbing polymers assemble into 2D one-rod-length-thickcolloidal monolayer membranes.9,10 Colloidal membranes
exhibit an exceedingly rich phenomenology. They support amyriad of defects including twist domain walls and lineararrays of pores.11 Increasing chirality induces a transition offlat 2D membranes into 1D twisted ribbons, and mixing rods ofmultiple lengths leads to formation of finite-sized colloidalrafts that are evocative of similar structures observed in con-ventional lipid bilayers.12,13 All of these complex mesoscopicbehaviors arise from very simple microscopic interactionsbetween constituent particles. Filamentous viruses interactonly through an effective hard-rod repulsion. Similarly, theuncharged dextran molecules act as effective Asakura–Oosawapenetrable spheres.14,15 From this perspective, the virus parti-cles and dextran molecules comprise a gas of hard rods andhard spheres, and the structures found in colloidal membranesmust be stabilized by entropic, hard-core interactions.16 Weformulate a theoretical model based purely on such entropicconsiderations. Our model explains many known structuralfeatures of colloidal membranes and directly relates themto the known entropic interactions in rod/polymer mixtures.Furthermore, it makes a number of new predictions that aredirectly verified by new experimental results.
Colloidal suspensions are a quintessential model system insoft condensed matter physics. They are not only interesting intheir own right but also provide new insights into the structureand dynamics of diverse phases; these insights only dependon the symmetries of the constituent particles and are thusrelevant on all lengthscales. For example, engineering colloidal
a Department of Physics & Astronomy, University of Pennsylvania,
203 South 33rd Street, Philadelphia, Pennsylvania 19104, USA.
E-mail: [email protected] Laboratoire de Physique, Ecole Normale Superieure de Lyon, Universite de Lyon,
CNRS/UMR 5672, 46 allee d’Italie, 69007 Lyon, Francec The Martin Fisher School of Physics, Brandeis University, 415 South Street,
Waltham, Massachusetts 02454, USA
Received 14th August 2015,Accepted 8th October 2015
DOI: 10.1039/c5sm02038g
www.rsc.org/softmatter
Soft Matter
PAPER
Publ
ishe
d on
09
Oct
ober
201
5. D
ownl
oade
d by
Bra
ndei
s U
nive
rsity
on
23/0
1/20
16 2
2:59
:32.
View Article OnlineView Journal | View Issue
This journal is©The Royal Society of Chemistry 2016 Soft Matter, 2016, 12, 386--401 | 387
shapes and interactions makes it possible to mimic manyprocesses found in atomic and molecular systems, includingliquid–gas phase separation, wetting, thermal capillary waves,crystal nucleation, and the glass transition.3,17–21 In starkcontrast to molecular systems, the size of model colloids makesit is possible to directly track the positions of all the constituentparticles, thus yielding important information about universalphysical processes in various condensed matter systems. Con-ventional fluid membranes, assembled from permanently-linked hydrophobic and hydrophilic components, are anotherinteresting and important soft matter system and play anessential role in biology.22 However, due to our inability todirectly visualize real-time dynamics of lipid bilayers at thenanometer scale, many membrane-based processes remainpoorly understood. Intriguingly, the large-scale elastic deforma-tions of colloidal membranes are described by the same con-tinuum theories that are used to describe conventional lipidbilayers. Based on this observation and following the analogybetween colloids and molecular substances, we hope thatcolloidal membranes will provide new understanding aboutuniversal membrane-mediated behaviors. There have beensome recent overtures in this vein. For example, colloidalmembranes permit direct visualization and quantitative char-acterization of liquid raft-like clusters,13 a subject that remainscontroversial in conventional lipid membranes.13,23 Eventualunderstanding of such complex structures requires a theoreticalmodel that relates mesoscopic properties of colloidal membranesto the microscopic interactions of their constituent buildingblocks.
The rest of the paper is organized as follows. In Section II webriefly review the rich phenomenology of colloidal membranes.In Section III, we introduce a new entropy-based theoreticalmodel of colloidal membranes and compare our results toknown properties of colloidal membranes, including staticedge fluctuation data (Fig. 5(b), (d), and (e)) and twist domainwall retardance (Fig. 8).11,12 Furthermore, we also discuss newpredictions of our theoretical model, including how the structureof the membrane’s edge depends on membrane radius (Fig. 4)and dynamical edge fluctuation data (Fig. 5(c)). These predictionsare tested against new experimental data. Section IV explains themodel in complete detail and Section V describes experimentalmethods. Finally, we summarize our findings and discuss theirwider implications in Section VI.
II. Overview of colloidal membranes
Filamentous fd viruses are monodisperse semi-rigid filamentswith 880 nm length, 7 nm diameter, and 2.8 mm persistencelength.24 When suspended in an aqueous solution at increasingconcentrations, they undergo a transition to an aligned nematicphase characterized by long-range orientational order. Thisisotropic-to-nematic phase transition is quantitatively describedby Onsager’s theory, indicating that viruses repel one anothervia hard-core and electrostatic interactions.4,24,25 Filamentousviruses are chiral and form a twisted nematic (cholesteric) phase
in which the director field rotates with a well-defined handedness.26
For wildtype fd virus, the strength of cholesteric interactions istemperature-dependent and continuously increases with decreasingtemperature. A single amino acid substitution in the major coatprotein leads to the Y21M virus whose cholesteric phase has ahandedness opposite to that of the wildtype.24 Mixing wildtype andY21M viruses produces cholesteric phases with intermediate twistpitches; at a certain ratio, the mixture exhibits no macroscopic twist.
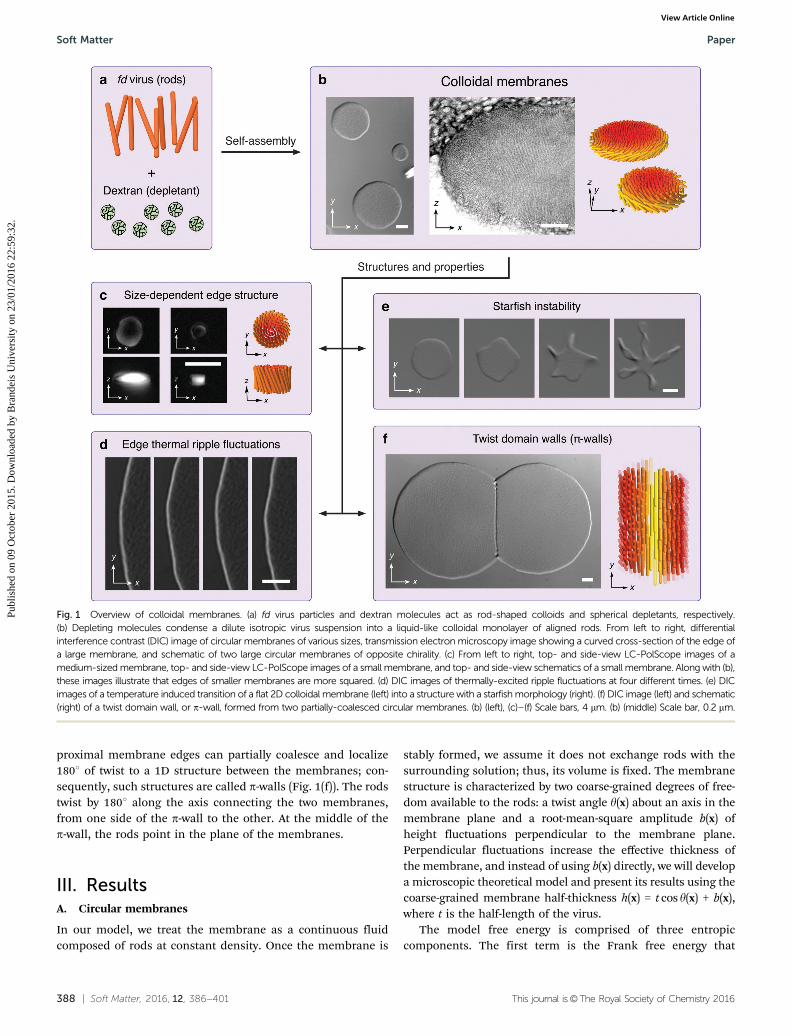
The addition of a polymer, such as dextran, in its non-adsorbing regime27 to a dilute isotropic fd suspension inducesvirus–virus attraction via depletion.14,15 The geometry of theconstituent rods ensures that attractive interactions are strongestfor lateral associations, causing the viruses to coalesce into one-rod-length-thick, disk-shaped mesoscopic clusters.9 They slowlysediment to the bottom of the glass container, which is coatedwith a polyacrylamide brush penetrable to dextran in orderto suppress depletion-induced virus–wall attractions.28 Over acertain range of depletant concentrations, protrusion fluctua-tions induce vertical repulsion between clusters, suppressingtheir face-on association.10 Consequently, such clusters continueto associate laterally, forming large equilibrium 2D colloidalmembranes that can be millimeters in diameter (Fig. 1(b)). Singlemolecule tracking indicates liquid-like order within a membrane.Twisting of constituent chiral viruses is inherently incompatiblewith assembly into a layered membrane-like structure.29 Conse-quently, twist can only penetrate into the membrane from theedges and is expelled from the bulk. Unique properties of thecolloidal membrane allow for direct visualization of the twistfield and quantitative measurement of the twist penetrationlength ltwist.
29 When the membrane radius is much bigger thanltwist B 1 mm, the edge adopts a surface-area-minimizingrounded shape with the constituent rods significantly tiltinginto the membrane plane (Fig. 1(b)); when the membrane radiusbecomes of the order of ltwist or smaller, the edge profilebecomes more square-like and rods do not significantly tilt awayfrom the membrane normal (Fig. 1(c)). Due to thermal excita-tions, membrane edges undergo ripple fluctuations that can bevisualized and precisely quantified (Fig. 1(d)).
When chirality-inverted Y21M viruses are used instead ofwildtype fd, rods at the edge twist with the opposite handedness,and when the macroscopically achiral mixture of wildtype andY21M viruses is used, edge-bound rods in each membrane haveequal probability of twisting with one handedness or the other.12
The achiral mixture exhibits spontaneous symmetry breaking,which has been observed in Langmuir–Blodgett films,30,31
another class of two-dimensional structures with nanoscalecomponents, and which has been used in sensors of molecularchirality.32 Increasing the rod chirality raises the free energyof interior untwisted rods while lowering the free energy ofedge-bound twisted rods, leading to chiral control of edge linetension.12 At sufficiently high chirality, the edge tensionapproaches zero, and a flat 2D disk spontaneously transitionsinto an array of 1D twisted ribbons, called a ‘‘starfish’’ (Fig. 1(e)).
The twist associated with the membranes edge also leads tounconventional pathways of membrane coalescence.11 As twomembranes of same chirality approach each other laterally, the
Paper Soft Matter
Publ
ishe
d on
09
Oct
ober
201
5. D
ownl
oade
d by
Bra
ndei
s U
nive
rsity
on
23/0
1/20
16 2
2:59
:32.
View Article Online
388 | Soft Matter, 2016, 12, 386--401 This journal is©The Royal Society of Chemistry 2016
proximal membrane edges can partially coalesce and localize1801 of twist to a 1D structure between the membranes; con-sequently, such structures are called p-walls (Fig. 1(f)). The rodstwist by 1801 along the axis connecting the two membranes,from one side of the p-wall to the other. At the middle of thep-wall, the rods point in the plane of the membranes.
III. ResultsA. Circular membranes
In our model, we treat the membrane as a continuous fluidcomposed of rods at constant density. Once the membrane is
stably formed, we assume it does not exchange rods with thesurrounding solution; thus, its volume is fixed. The membranestructure is characterized by two coarse-grained degrees of free-dom available to the rods: a twist angle y(x) about an axis in themembrane plane and a root-mean-square amplitude b(x) ofheight fluctuations perpendicular to the membrane plane.Perpendicular fluctuations increase the effective thickness ofthe membrane, and instead of using b(x) directly, we will developa microscopic theoretical model and present its results using thecoarse-grained membrane half-thickness h(x) = t cos y(x) + b(x),where t is the half-length of the virus.
The model free energy is comprised of three entropiccomponents. The first term is the Frank free energy that
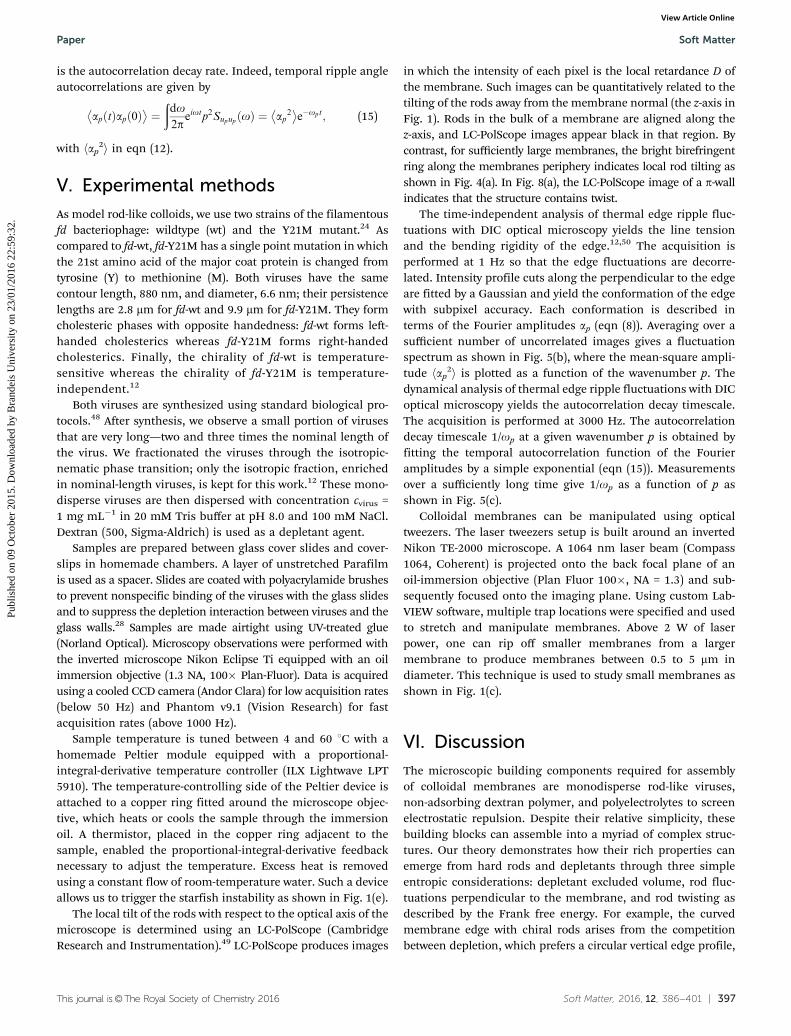
Fig. 1 Overview of colloidal membranes. (a) fd virus particles and dextran molecules act as rod-shaped colloids and spherical depletants, respectively.(b) Depleting molecules condense a dilute isotropic virus suspension into a liquid-like colloidal monolayer of aligned rods. From left to right, differentialinterference contrast (DIC) image of circular membranes of various sizes, transmission electron microscopy image showing a curved cross-section of the edge ofa large membrane, and schematic of two large circular membranes of opposite chirality. (c) From left to right, top- and side-view LC-PolScope images of amedium-sized membrane, top- and side-view LC-PolScope images of a small membrane, and top- and side-view schematics of a small membrane. Along with (b),these images illustrate that edges of smaller membranes are more squared. (d) DIC images of thermally-excited ripple fluctuations at four different times. (e) DICimages of a temperature induced transition of a flat 2D colloidal membrane (left) into a structure with a starfish morphology (right). (f) DIC image (left) and schematic(right) of a twist domain wall, or p-wall, formed from two partially-coalesced circular membranes. (b) (left), (c)–(f) Scale bars, 4 mm. (b) (middle) Scale bar, 0.2 mm.
Soft Matter Paper
Publ
ishe
d on
09
Oct
ober
201
5. D
ownl
oade
d by
Bra
ndei
s U
nive
rsity
on
23/0
1/20
16 2
2:59
:32.
View Article Online
This journal is©The Royal Society of Chemistry 2016 Soft Matter, 2016, 12, 386--401 | 389
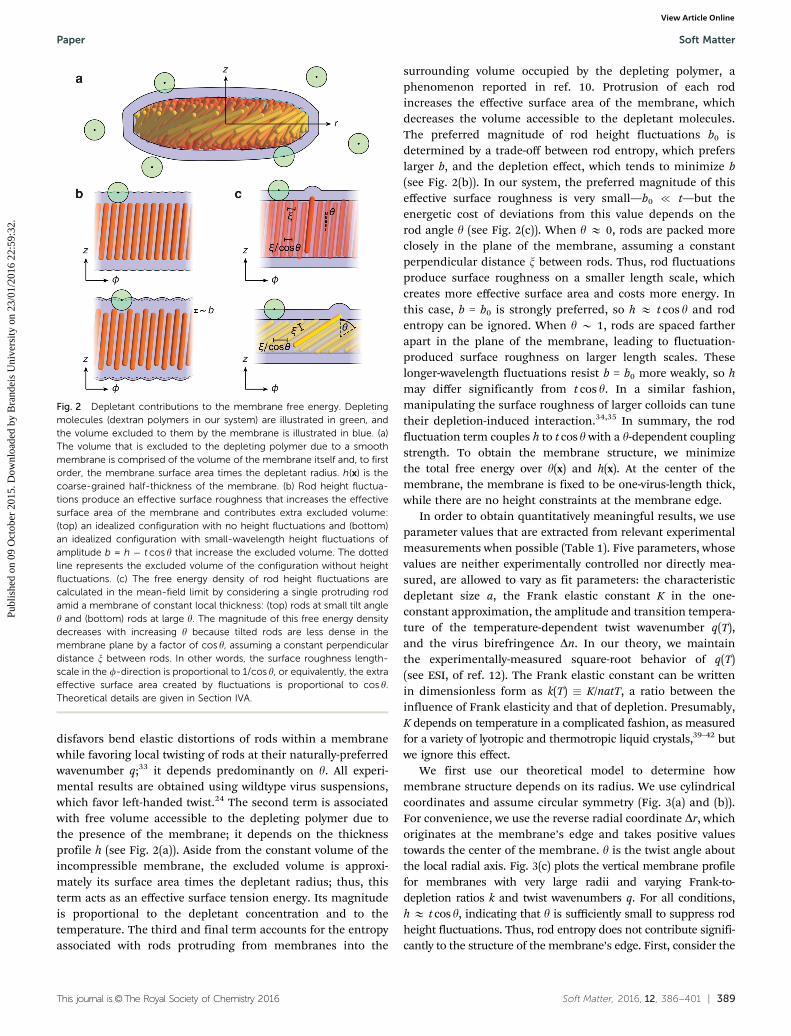
disfavors bend elastic distortions of rods within a membranewhile favoring local twisting of rods at their naturally-preferredwavenumber q;33 it depends predominantly on y. All experi-mental results are obtained using wildtype virus suspensions,which favor left-handed twist.24 The second term is associatedwith free volume accessible to the depleting polymer due tothe presence of the membrane; it depends on the thicknessprofile h (see Fig. 2(a)). Aside from the constant volume of theincompressible membrane, the excluded volume is approxi-mately its surface area times the depletant radius; thus, thisterm acts as an effective surface tension energy. Its magnitudeis proportional to the depletant concentration and to thetemperature. The third and final term accounts for the entropyassociated with rods protruding from membranes into the
surrounding volume occupied by the depleting polymer, aphenomenon reported in ref. 10. Protrusion of each rodincreases the effective surface area of the membrane, whichdecreases the volume accessible to the depletant molecules.The preferred magnitude of rod height fluctuations b0 isdetermined by a trade-off between rod entropy, which preferslarger b, and the depletion effect, which tends to minimize b(see Fig. 2(b)). In our system, the preferred magnitude of thiseffective surface roughness is very small—b0 { t—but theenergetic cost of deviations from this value depends on therod angle y (see Fig. 2(c)). When y E 0, rods are packed moreclosely in the plane of the membrane, assuming a constantperpendicular distance x between rods. Thus, rod fluctuationsproduce surface roughness on a smaller length scale, whichcreates more effective surface area and costs more energy. Inthis case, b = b0 is strongly preferred, so h E t cos y and rodentropy can be ignored. When y B 1, rods are spaced fartherapart in the plane of the membrane, leading to fluctuation-produced surface roughness on larger length scales. Theselonger-wavelength fluctuations resist b = b0 more weakly, so hmay differ significantly from t cos y. In a similar fashion,manipulating the surface roughness of larger colloids can tunetheir depletion-induced interaction.34,35 In summary, the rodfluctuation term couples h to t cos y with a y-dependent couplingstrength. To obtain the membrane structure, we minimizethe total free energy over y(x) and h(x). At the center of themembrane, the membrane is fixed to be one-virus-length thick,while there are no height constraints at the membrane edge.
In order to obtain quantitatively meaningful results, we useparameter values that are extracted from relevant experimentalmeasurements when possible (Table 1). Five parameters, whosevalues are neither experimentally controlled nor directly mea-sured, are allowed to vary as fit parameters: the characteristicdepletant size a, the Frank elastic constant K in the one-constant approximation, the amplitude and transition tempera-ture of the temperature-dependent twist wavenumber q(T),and the virus birefringence Dn. In our theory, we maintainthe experimentally-measured square-root behavior of q(T)(see ESI, of ref. 12). The Frank elastic constant can be writtenin dimensionless form as k(T) � K/natT, a ratio between theinfluence of Frank elasticity and that of depletion. Presumably,K depends on temperature in a complicated fashion, as measuredfor a variety of lyotropic and thermotropic liquid crystals,39–42 butwe ignore this effect.
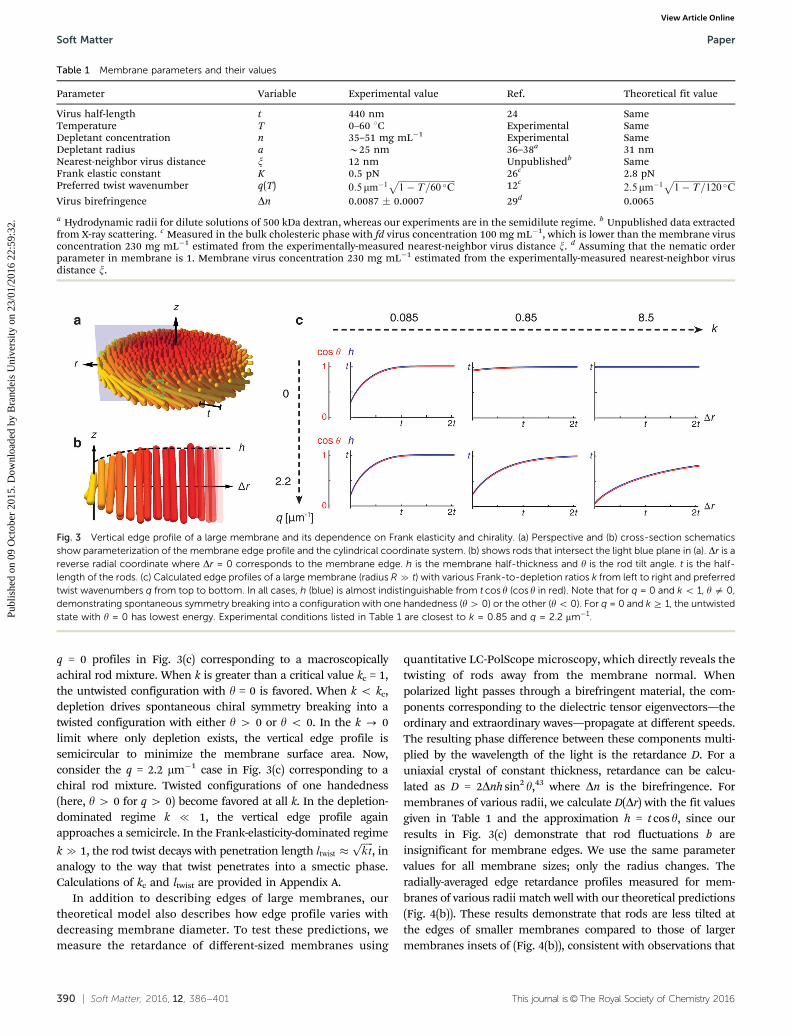
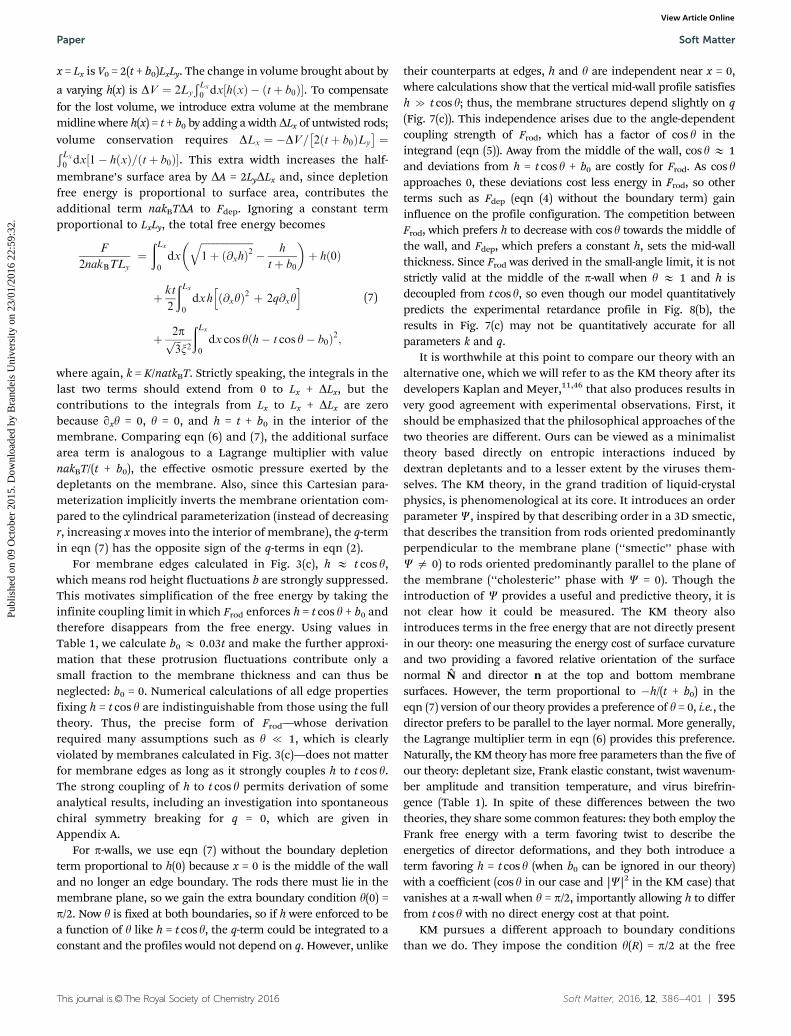
We first use our theoretical model to determine howmembrane structure depends on its radius. We use cylindricalcoordinates and assume circular symmetry (Fig. 3(a) and (b)).For convenience, we use the reverse radial coordinate Dr, whichoriginates at the membrane’s edge and takes positive valuestowards the center of the membrane. y is the twist angle aboutthe local radial axis. Fig. 3(c) plots the vertical membrane profilefor membranes with very large radii and varying Frank-to-depletion ratios k and twist wavenumbers q. For all conditions,h E t cos y, indicating that y is sufficiently small to suppress rodheight fluctuations. Thus, rod entropy does not contribute signifi-cantly to the structure of the membrane’s edge. First, consider the
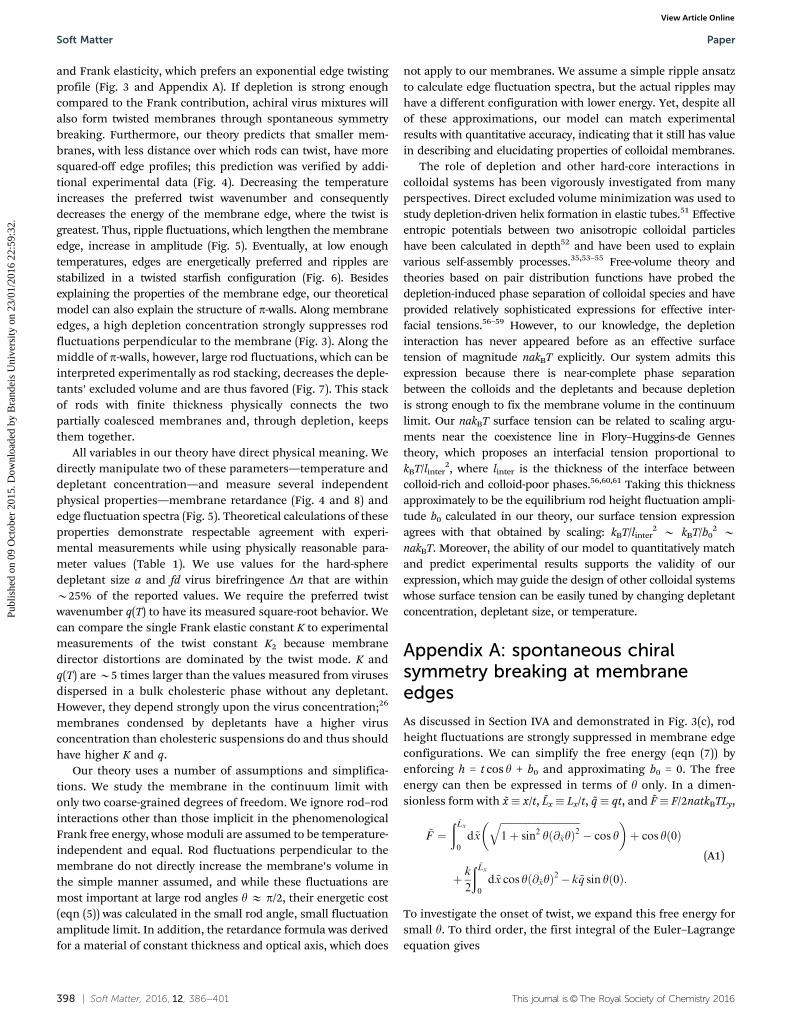
Fig. 2 Depletant contributions to the membrane free energy. Depletingmolecules (dextran polymers in our system) are illustrated in green, andthe volume excluded to them by the membrane is illustrated in blue. (a)The volume that is excluded to the depleting polymer due to a smoothmembrane is comprised of the volume of the membrane itself and, to firstorder, the membrane surface area times the depletant radius. h(x) is thecoarse-grained half-thickness of the membrane. (b) Rod height fluctua-tions produce an effective surface roughness that increases the effectivesurface area of the membrane and contributes extra excluded volume:(top) an idealized configuration with no height fluctuations and (bottom)an idealized configuration with small-wavelength height fluctuations ofamplitude b = h � t cos y that increase the excluded volume. The dottedline represents the excluded volume of the configuration without heightfluctuations. (c) The free energy density of rod height fluctuations arecalculated in the mean-field limit by considering a single protruding rodamid a membrane of constant local thickness: (top) rods at small tilt angley and (bottom) rods at large y. The magnitude of this free energy densitydecreases with increasing y because tilted rods are less dense in themembrane plane by a factor of cos y, assuming a constant perpendiculardistance x between rods. In other words, the surface roughness length-scale in the f-direction is proportional to 1/cos y, or equivalently, the extraeffective surface area created by fluctuations is proportional to cos y.Theoretical details are given in Section IVA.
Paper Soft Matter
Publ
ishe
d on
09
Oct
ober
201
5. D
ownl
oade
d by
Bra
ndei
s U
nive
rsity
on
23/0
1/20
16 2
2:59
:32.
View Article Online
390 | Soft Matter, 2016, 12, 386--401 This journal is©The Royal Society of Chemistry 2016
q = 0 profiles in Fig. 3(c) corresponding to a macroscopicallyachiral rod mixture. When k is greater than a critical value kc = 1,the untwisted configuration with y = 0 is favored. When k o kc,depletion drives spontaneous chiral symmetry breaking into atwisted configuration with either y 4 0 or y o 0. In the k - 0limit where only depletion exists, the vertical edge profile issemicircular to minimize the membrane surface area. Now,consider the q = 2.2 mm�1 case in Fig. 3(c) corresponding to achiral rod mixture. Twisted configurations of one handedness(here, y 4 0 for q 4 0) become favored at all k. In the depletion-dominated regime k { 1, the vertical edge profile againapproaches a semicircle. In the Frank-elasticity-dominated regime
k c 1, the rod twist decays with penetration length ltwist �ffiffiffiffiffiktp
, inanalogy to the way that twist penetrates into a smectic phase.Calculations of kc and ltwist are provided in Appendix A.
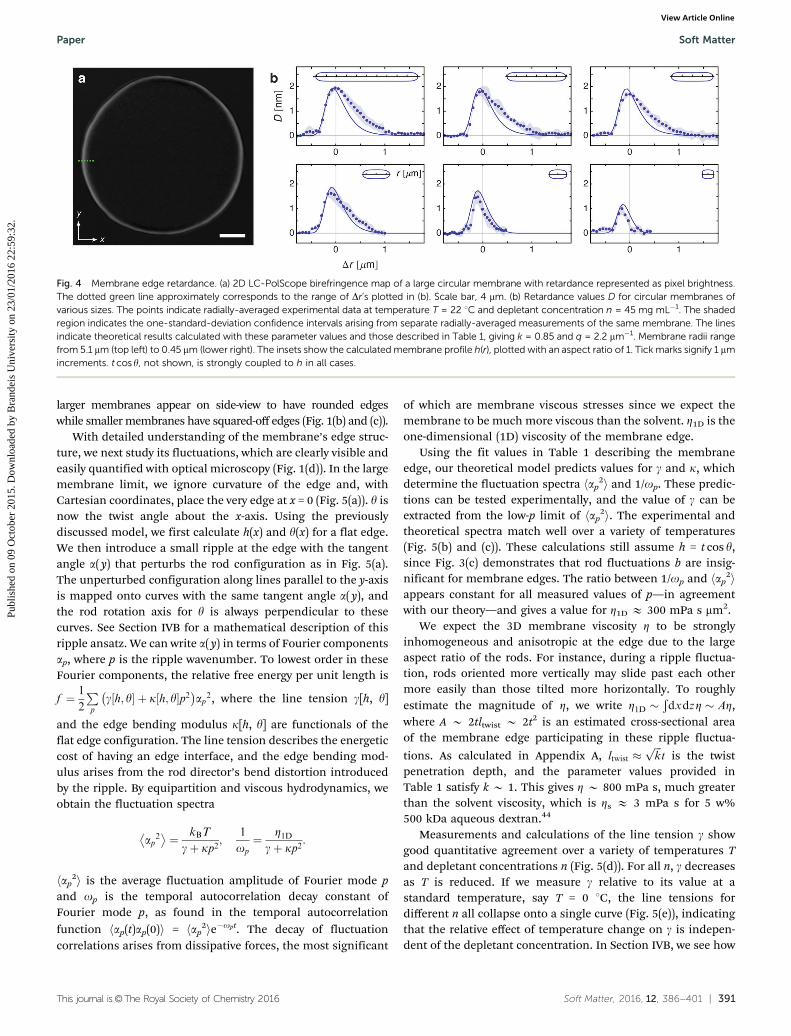
In addition to describing edges of large membranes, ourtheoretical model also describes how edge profile varies withdecreasing membrane diameter. To test these predictions, wemeasure the retardance of different-sized membranes using
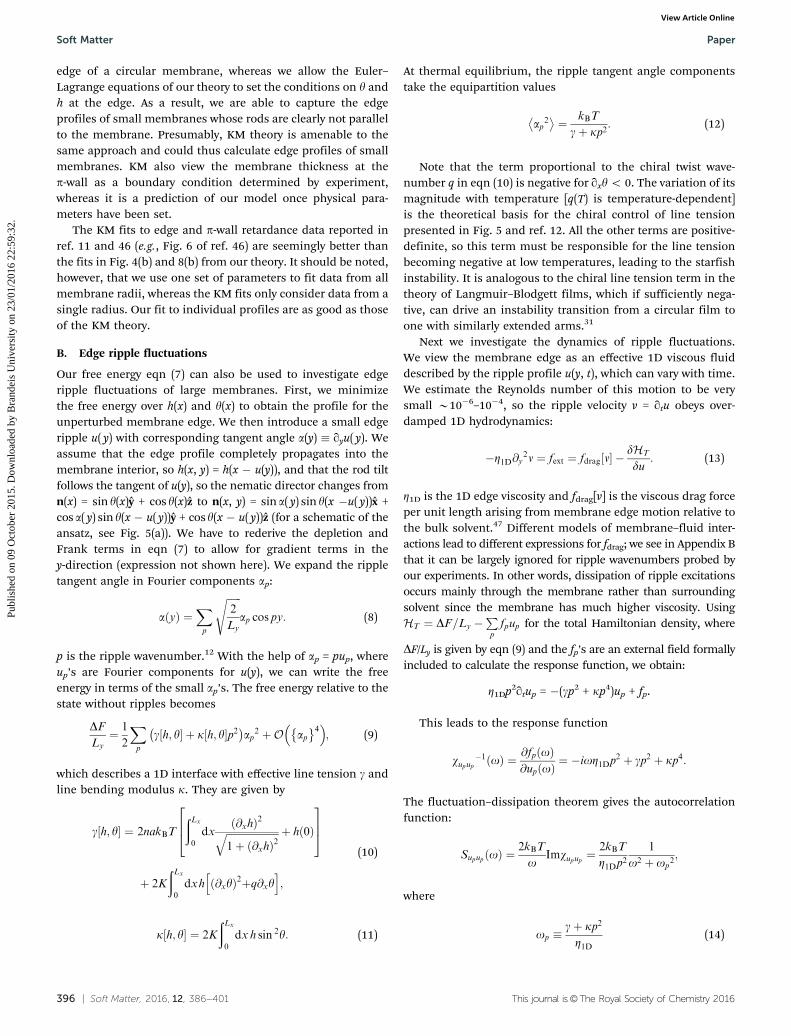
quantitative LC-PolScope microscopy, which directly reveals thetwisting of rods away from the membrane normal. Whenpolarized light passes through a birefringent material, the com-ponents corresponding to the dielectric tensor eigenvectors—theordinary and extraordinary waves—propagate at different speeds.The resulting phase difference between these components multi-plied by the wavelength of the light is the retardance D. For auniaxial crystal of constant thickness, retardance can be calcu-lated as D = 2Dnh sin2y,43 where Dn is the birefringence. Formembranes of various radii, we calculate D(Dr) with the fit valuesgiven in Table 1 and the approximation h = t cosy, since ourresults in Fig. 3(c) demonstrate that rod fluctuations b areinsignificant for membrane edges. We use the same parametervalues for all membrane sizes; only the radius changes. Theradially-averaged edge retardance profiles measured for mem-branes of various radii match well with our theoretical predictions(Fig. 4(b)). These results demonstrate that rods are less tilted atthe edges of smaller membranes compared to those of largermembranes insets of (Fig. 4(b)), consistent with observations that
Table 1 Membrane parameters and their values
Parameter Variable Experimental value Ref. Theoretical fit value
Virus half-length t 440 nm 24 SameTemperature T 0–60 1C Experimental SameDepletant concentration n 35–51 mg mL�1 Experimental SameDepletant radius a B25 nm 36–38a 31 nmNearest-neighbor virus distance x 12 nm Unpublishedb SameFrank elastic constant K 0.5 pN 26c 2.8 pNPreferred twist wavenumber q(T) 0:5 mm�1
ffiffiffiffiffiffiffiffiffiffiffiffiffiffiffiffiffiffiffiffiffiffiffiffiffiffi1� T=60 �C
p12c
2:5 mm�1ffiffiffiffiffiffiffiffiffiffiffiffiffiffiffiffiffiffiffiffiffiffiffiffiffiffiffiffi1� T=120 �C
pVirus birefringence Dn 0.0087 � 0.0007 29d 0.0065
a Hydrodynamic radii for dilute solutions of 500 kDa dextran, whereas our experiments are in the semidilute regime. b Unpublished data extractedfrom X-ray scattering. c Measured in the bulk cholesteric phase with fd virus concentration 100 mg mL�1, which is lower than the membrane virusconcentration 230 mg mL�1 estimated from the experimentally-measured nearest-neighbor virus distance x. d Assuming that the nematic orderparameter in membrane is 1. Membrane virus concentration 230 mg mL�1 estimated from the experimentally-measured nearest-neighbor virusdistance x.
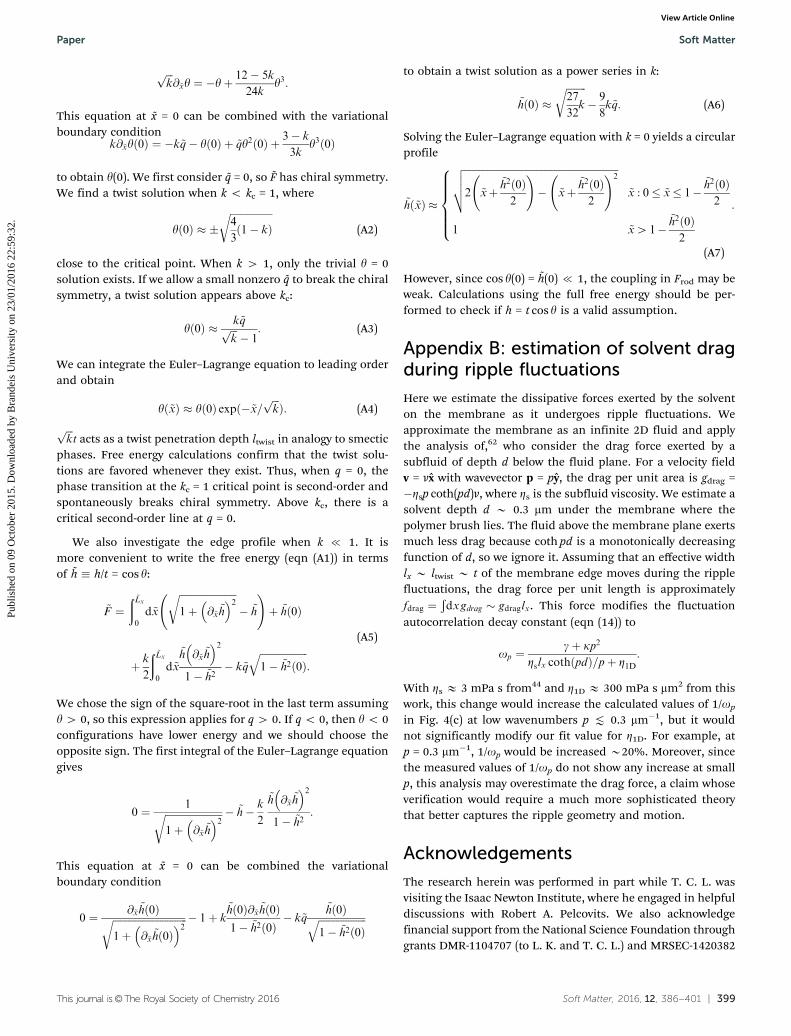
Fig. 3 Vertical edge profile of a large membrane and its dependence on Frank elasticity and chirality. (a) Perspective and (b) cross-section schematicsshow parameterization of the membrane edge profile and the cylindrical coordinate system. (b) shows rods that intersect the light blue plane in (a). Dr is areverse radial coordinate where Dr = 0 corresponds to the membrane edge. h is the membrane half-thickness and y is the rod tilt angle. t is the half-length of the rods. (c) Calculated edge profiles of a large membrane (radius R c t) with various Frank-to-depletion ratios k from left to right and preferredtwist wavenumbers q from top to bottom. In all cases, h (blue) is almost indistinguishable from t cos y (cos y in red). Note that for q = 0 and k o 1, y a 0,demonstrating spontaneous symmetry breaking into a configuration with one handedness (y4 0) or the other (yo 0). For q = 0 and k Z 1, the untwistedstate with y = 0 has lowest energy. Experimental conditions listed in Table 1 are closest to k = 0.85 and q = 2.2 mm�1.
Soft Matter Paper
Publ
ishe
d on
09
Oct
ober
201
5. D
ownl
oade
d by
Bra
ndei
s U
nive
rsity
on
23/0
1/20
16 2
2:59
:32.
View Article Online
This journal is©The Royal Society of Chemistry 2016 Soft Matter, 2016, 12, 386--401 | 391
larger membranes appear on side-view to have rounded edgeswhile smaller membranes have squared-off edges (Fig. 1(b) and (c)).
With detailed understanding of the membrane’s edge struc-ture, we next study its fluctuations, which are clearly visible andeasily quantified with optical microscopy (Fig. 1(d)). In the largemembrane limit, we ignore curvature of the edge and, withCartesian coordinates, place the very edge at x = 0 (Fig. 5(a)). y isnow the twist angle about the x-axis. Using the previouslydiscussed model, we first calculate h(x) and y(x) for a flat edge.We then introduce a small ripple at the edge with the tangentangle a( y) that perturbs the rod configuration as in Fig. 5(a).The unperturbed configuration along lines parallel to the y-axisis mapped onto curves with the same tangent angle a( y), andthe rod rotation axis for y is always perpendicular to thesecurves. See Section IVB for a mathematical description of thisripple ansatz. We can write a( y) in terms of Fourier componentsap, where p is the ripple wavenumber. To lowest order in theseFourier components, the relative free energy per unit length is
f ¼ 1
2
Pp
g½h; y� þ k½h; y�p2� �
ap2, where the line tension g[h, y]
and the edge bending modulus k[h, y] are functionals of theflat edge configuration. The line tension describes the energeticcost of having an edge interface, and the edge bending mod-ulus arises from the rod director’s bend distortion introducedby the ripple. By equipartition and viscous hydrodynamics, weobtain the fluctuation spectra
ap2� �
¼ kBT
gþ kp2;
1
op¼ Z1D
gþ kp2:
hap2i is the average fluctuation amplitude of Fourier mode p
and op is the temporal autocorrelation decay constant ofFourier mode p, as found in the temporal autocorrelationfunction hap(t)ap(0)i = hap
2ie�opt. The decay of fluctuationcorrelations arises from dissipative forces, the most significant
of which are membrane viscous stresses since we expect themembrane to be much more viscous than the solvent. Z1D is theone-dimensional (1D) viscosity of the membrane edge.
Using the fit values in Table 1 describing the membraneedge, our theoretical model predicts values for g and k, whichdetermine the fluctuation spectra hap
2i and 1/op. These predic-tions can be tested experimentally, and the value of g can beextracted from the low-p limit of hap
2i. The experimental andtheoretical spectra match well over a variety of temperatures(Fig. 5(b) and (c)). These calculations still assume h = t cos y,since Fig. 3(c) demonstrates that rod fluctuations b are insig-nificant for membrane edges. The ratio between 1/op and hap
2iappears constant for all measured values of p—in agreementwith our theory—and gives a value for Z1D E 300 mPa s mm2.
We expect the 3D membrane viscosity Z to be stronglyinhomogeneous and anisotropic at the edge due to the largeaspect ratio of the rods. For instance, during a ripple fluctua-tion, rods oriented more vertically may slide past each othermore easily than those tilted more horizontally. To roughlyestimate the magnitude of Z, we write Z1D �
ÐdxdzZ � AZ,
where A B 2tltwist B 2t2 is an estimated cross-sectional areaof the membrane edge participating in these ripple fluctua-
tions. As calculated in Appendix A, ltwist �ffiffiffikp
t is the twistpenetration depth, and the parameter values provided inTable 1 satisfy k B 1. This gives Z B 800 mPa s, much greaterthan the solvent viscosity, which is Zs E 3 mPa s for 5 w%500 kDa aqueous dextran.44
Measurements and calculations of the line tension g showgood quantitative agreement over a variety of temperatures Tand depletant concentrations n (Fig. 5(d)). For all n, g decreasesas T is reduced. If we measure g relative to its value at astandard temperature, say T = 0 1C, the line tensions fordifferent n all collapse onto a single curve (Fig. 5(e)), indicatingthat the relative effect of temperature change on g is indepen-dent of the depletant concentration. In Section IVB, we see how
Fig. 4 Membrane edge retardance. (a) 2D LC-PolScope birefringence map of a large circular membrane with retardance represented as pixel brightness.The dotted green line approximately corresponds to the range of Dr’s plotted in (b). Scale bar, 4 mm. (b) Retardance values D for circular membranes ofvarious sizes. The points indicate radially-averaged experimental data at temperature T = 22 1C and depletant concentration n = 45 mg mL�1. The shadedregion indicates the one-standard-deviation confidence intervals arising from separate radially-averaged measurements of the same membrane. The linesindicate theoretical results calculated with these parameter values and those described in Table 1, giving k = 0.85 and q = 2.2 mm�1. Membrane radii rangefrom 5.1 mm (top left) to 0.45 mm (lower right). The insets show the calculated membrane profile h(r), plotted with an aspect ratio of 1. Tick marks signify 1 mmincrements. t cos y, not shown, is strongly coupled to h in all cases.
Paper Soft Matter
Publ
ishe
d on
09
Oct
ober
201
5. D
ownl
oade
d by
Bra
ndei
s U
nive
rsity
on
23/0
1/20
16 2
2:59
:32.
View Article Online
392 | Soft Matter, 2016, 12, 386--401 This journal is©The Royal Society of Chemistry 2016
these effects arise naturally in our model via a q-dependentchiral term in the line tension. Colloidal membranes assembledfrom chiral rods are inherently frustrated, because the particlescannot simultaneously twist locally and assemble into a mono-layer globally. Consequently, twist is expelled from the membraneinterior and localized to its edges. Note that q(T) is a mono-tonically decreasing function of T (Table 1). Decreasing thetemperature increases q(T) and lowers the free energy of edge-bound twisted rods, leading to chiral control of edge line tension.12
B. Starfish morphological transition and p-wall structure
We now apply our theory to explain more exotic structuresfound in colloidal membranes. For example, when circularmembranes are subjected to a temperature quench, the linetension decreases significantly and fluctuations at the edgeincrease in amplitude. For sufficiently low T, the circularmembrane becomes unstable and grows arms of twisted ribbonsalong its entire periphery (Fig. 1(e)). In our model, these starfish
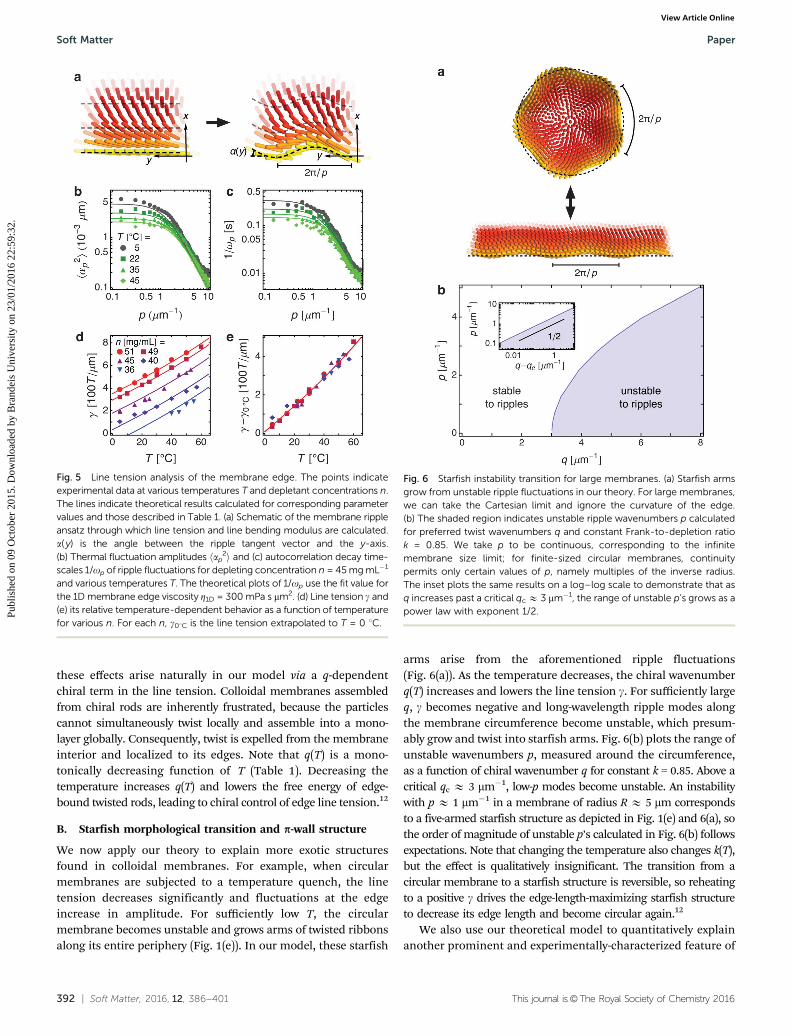
arms arise from the aforementioned ripple fluctuations(Fig. 6(a)). As the temperature decreases, the chiral wavenumberq(T) increases and lowers the line tension g. For sufficiently largeq, g becomes negative and long-wavelength ripple modes alongthe membrane circumference become unstable, which presum-ably grow and twist into starfish arms. Fig. 6(b) plots the range ofunstable wavenumbers p, measured around the circumference,as a function of chiral wavenumber q for constant k = 0.85. Above acritical qc E 3 mm�1, low-p modes become unstable. An instabilitywith p E 1 mm�1 in a membrane of radius R E 5 mm correspondsto a five-armed starfish structure as depicted in Fig. 1(e) and 6(a), sothe order of magnitude of unstable p’s calculated in Fig. 6(b) followsexpectations. Note that changing the temperature also changes k(T),but the effect is qualitatively insignificant. The transition from acircular membrane to a starfish structure is reversible, so reheatingto a positive g drives the edge-length-maximizing starfish structureto decrease its edge length and become circular again.12
We also use our theoretical model to quantitatively explainanother prominent and experimentally-characterized feature of
Fig. 5 Line tension analysis of the membrane edge. The points indicateexperimental data at various temperatures T and depletant concentrations n.The lines indicate theoretical results calculated for corresponding parametervalues and those described in Table 1. (a) Schematic of the membrane rippleansatz through which line tension and line bending modulus are calculated.a( y) is the angle between the ripple tangent vector and the y-axis.(b) Thermal fluctuation amplitudes hap
2i and (c) autocorrelation decay time-scales 1/op of ripple fluctuations for depleting concentration n = 45 mg mL�1
and various temperatures T. The theoretical plots of 1/op use the fit value forthe 1D membrane edge viscosity Z1D = 300 mPa s mm2. (d) Line tension g and(e) its relative temperature-dependent behavior as a function of temperaturefor various n. For each n, g01C is the line tension extrapolated to T = 0 1C.
Fig. 6 Starfish instability transition for large membranes. (a) Starfish armsgrow from unstable ripple fluctuations in our theory. For large membranes,we can take the Cartesian limit and ignore the curvature of the edge.(b) The shaded region indicates unstable ripple wavenumbers p calculatedfor preferred twist wavenumbers q and constant Frank-to-depletion ratiok = 0.85. We take p to be continuous, corresponding to the infinitemembrane size limit; for finite-sized circular membranes, continuitypermits only certain values of p, namely multiples of the inverse radius.The inset plots the same results on a log–log scale to demonstrate that asq increases past a critical qc E 3 mm�1, the range of unstable p’s grows as apower law with exponent 1/2.
Soft Matter Paper
Publ
ishe
d on
09
Oct
ober
201
5. D
ownl
oade
d by
Bra
ndei
s U
nive
rsity
on
23/0
1/20
16 2
2:59
:32.
View Article Online
This journal is©The Royal Society of Chemistry 2016 Soft Matter, 2016, 12, 386--401 | 393
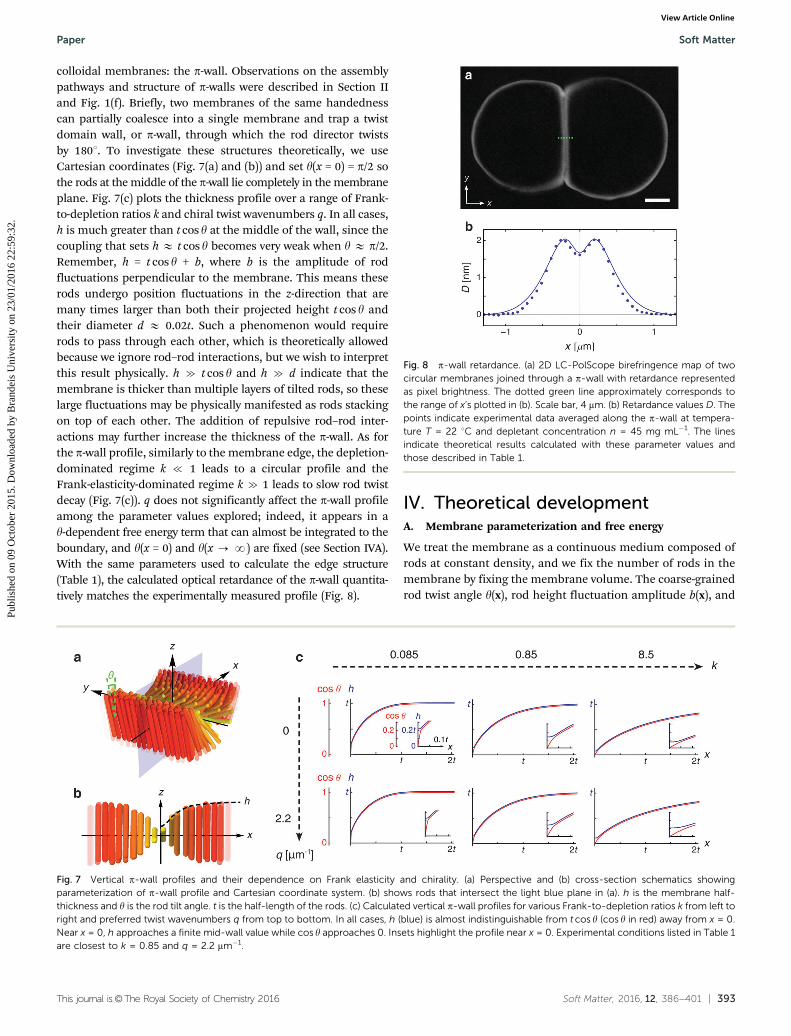
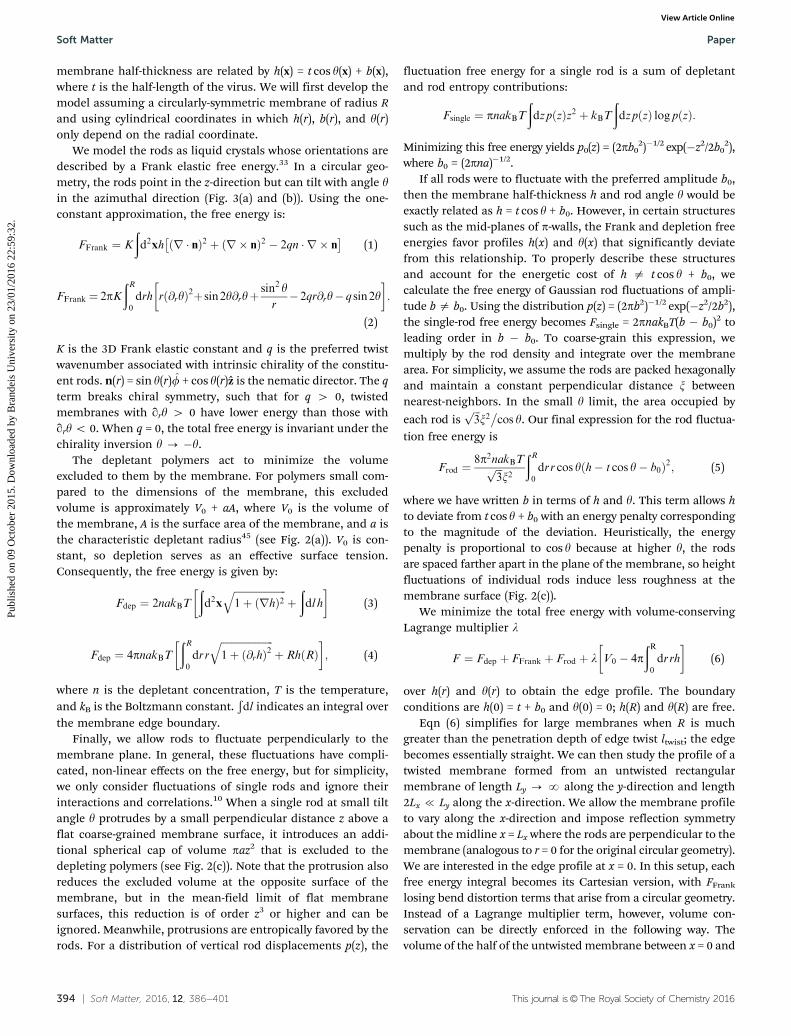
colloidal membranes: the p-wall. Observations on the assemblypathways and structure of p-walls were described in Section IIand Fig. 1(f). Briefly, two membranes of the same handednesscan partially coalesce into a single membrane and trap a twistdomain wall, or p-wall, through which the rod director twistsby 1801. To investigate these structures theoretically, we useCartesian coordinates (Fig. 7(a) and (b)) and set y(x = 0) = p/2 sothe rods at the middle of the p-wall lie completely in the membraneplane. Fig. 7(c) plots the thickness profile over a range of Frank-to-depletion ratios k and chiral twist wavenumbers q. In all cases,h is much greater than t cos y at the middle of the wall, since thecoupling that sets h E t cos y becomes very weak when y E p/2.Remember, h = t cos y + b, where b is the amplitude of rodfluctuations perpendicular to the membrane. This means theserods undergo position fluctuations in the z-direction that aremany times larger than both their projected height t cos y andtheir diameter d E 0.02t. Such a phenomenon would requirerods to pass through each other, which is theoretically allowedbecause we ignore rod–rod interactions, but we wish to interpretthis result physically. h c t cos y and h c d indicate that themembrane is thicker than multiple layers of tilted rods, so theselarge fluctuations may be physically manifested as rods stackingon top of each other. The addition of repulsive rod–rod inter-actions may further increase the thickness of the p-wall. As forthe p-wall profile, similarly to the membrane edge, the depletion-dominated regime k { 1 leads to a circular profile and theFrank-elasticity-dominated regime k c 1 leads to slow rod twistdecay (Fig. 7(c)). q does not significantly affect the p-wall profileamong the parameter values explored; indeed, it appears in ay-dependent free energy term that can almost be integrated to theboundary, and y(x = 0) and y(x - N) are fixed (see Section IVA).With the same parameters used to calculate the edge structure(Table 1), the calculated optical retardance of the p-wall quantita-tively matches the experimentally measured profile (Fig. 8).
IV. Theoretical developmentA. Membrane parameterization and free energy
We treat the membrane as a continuous medium composed ofrods at constant density, and we fix the number of rods in themembrane by fixing the membrane volume. The coarse-grainedrod twist angle y(x), rod height fluctuation amplitude b(x), and
Fig. 7 Vertical p-wall profiles and their dependence on Frank elasticity and chirality. (a) Perspective and (b) cross-section schematics showingparameterization of p-wall profile and Cartesian coordinate system. (b) shows rods that intersect the light blue plane in (a). h is the membrane half-thickness and y is the rod tilt angle. t is the half-length of the rods. (c) Calculated vertical p-wall profiles for various Frank-to-depletion ratios k from left toright and preferred twist wavenumbers q from top to bottom. In all cases, h (blue) is almost indistinguishable from t cos y (cos y in red) away from x = 0.Near x = 0, h approaches a finite mid-wall value while cos y approaches 0. Insets highlight the profile near x = 0. Experimental conditions listed in Table 1are closest to k = 0.85 and q = 2.2 mm�1.
Fig. 8 p-wall retardance. (a) 2D LC-PolScope birefringence map of twocircular membranes joined through a p-wall with retardance representedas pixel brightness. The dotted green line approximately corresponds tothe range of x’s plotted in (b). Scale bar, 4 mm. (b) Retardance values D. Thepoints indicate experimental data averaged along the p-wall at tempera-ture T = 22 1C and depletant concentration n = 45 mg mL�1. The linesindicate theoretical results calculated with these parameter values andthose described in Table 1.
Paper Soft Matter
Publ
ishe
d on
09
Oct
ober
201
5. D
ownl
oade
d by
Bra
ndei
s U
nive
rsity
on
23/0
1/20
16 2
2:59
:32.
View Article Online
394 | Soft Matter, 2016, 12, 386--401 This journal is©The Royal Society of Chemistry 2016
membrane half-thickness are related by h(x) = t cos y(x) + b(x),where t is the half-length of the virus. We will first develop themodel assuming a circularly-symmetric membrane of radius Rand using cylindrical coordinates in which h(r), b(r), and y(r)only depend on the radial coordinate.
We model the rods as liquid crystals whose orientations aredescribed by a Frank elastic free energy.33 In a circular geo-metry, the rods point in the z-direction but can tilt with angle yin the azimuthal direction (Fig. 3(a) and (b)). Using the one-constant approximation, the free energy is:
FFrank ¼ K
ðd2xh ðr nÞ2 þ ðr nÞ2 � 2qn r n
� �(1)
FFrank ¼ 2pKðR0
drh r @ryð Þ2þsin2y@ryþsin2 yr� 2qr@ry� q sin2y
:
(2)
K is the 3D Frank elastic constant and q is the preferred twistwavenumber associated with intrinsic chirality of the constitu-ent rods. n(r) = sin y(r)f + cos y(r)z is the nematic director. The qterm breaks chiral symmetry, such that for q 4 0, twistedmembranes with qry 4 0 have lower energy than those withqry o 0. When q = 0, the total free energy is invariant under thechirality inversion y - �y.
The depletant polymers act to minimize the volumeexcluded to them by the membrane. For polymers small com-pared to the dimensions of the membrane, this excludedvolume is approximately V0 + aA, where V0 is the volume ofthe membrane, A is the surface area of the membrane, and a isthe characteristic depletant radius45 (see Fig. 2(a)). V0 is con-stant, so depletion serves as an effective surface tension.Consequently, the free energy is given by:
Fdep ¼ 2nakBT
ðd2x
ffiffiffiffiffiffiffiffiffiffiffiffiffiffiffiffiffiffiffiffiffi1þ ðrhÞ2
qþðdl h
(3)
Fdep ¼ 4pnakBTðR0
drr
ffiffiffiffiffiffiffiffiffiffiffiffiffiffiffiffiffiffiffiffiffi1þ @rhð Þ2
qþ RhðRÞ
; (4)
where n is the depletant concentration, T is the temperature,and kB is the Boltzmann constant.
Ðdl indicates an integral over
the membrane edge boundary.Finally, we allow rods to fluctuate perpendicularly to the
membrane plane. In general, these fluctuations have compli-cated, non-linear effects on the free energy, but for simplicity,we only consider fluctuations of single rods and ignore theirinteractions and correlations.10 When a single rod at small tiltangle y protrudes by a small perpendicular distance z above aflat coarse-grained membrane surface, it introduces an addi-tional spherical cap of volume paz2 that is excluded to thedepleting polymers (see Fig. 2(c)). Note that the protrusion alsoreduces the excluded volume at the opposite surface of themembrane, but in the mean-field limit of flat membranesurfaces, this reduction is of order z3 or higher and can beignored. Meanwhile, protrusions are entropically favored by therods. For a distribution of vertical rod displacements p(z), the
fluctuation free energy for a single rod is a sum of depletantand rod entropy contributions:
Fsingle ¼ pnakBTðdzpðzÞz2 þ kBT
ðdzpðzÞ log pðzÞ:
Minimizing this free energy yields p0(z) = (2pb02)�1/2 exp(�z2/2b0
2),where b0 = (2pna)�1/2.
If all rods were to fluctuate with the preferred amplitude b0,then the membrane half-thickness h and rod angle y would beexactly related as h = t cos y + b0. However, in certain structuressuch as the mid-planes of p-walls, the Frank and depletion freeenergies favor profiles h(x) and y(x) that significantly deviatefrom this relationship. To properly describe these structuresand account for the energetic cost of h a t cos y + b0, wecalculate the free energy of Gaussian rod fluctuations of ampli-tude b a b0. Using the distribution p(z) = (2pb2)�1/2 exp(�z2/2b2),the single-rod free energy becomes Fsingle = 2pnakBT(b � b0)2 toleading order in b � b0. To coarse-grain this expression, wemultiply by the rod density and integrate over the membranearea. For simplicity, we assume the rods are packed hexagonallyand maintain a constant perpendicular distance x betweennearest-neighbors. In the small y limit, the area occupied by
each rod isffiffiffi3p
x2�cos y. Our final expression for the rod fluctua-
tion free energy is
Frod ¼8p2nakBTffiffiffi
3p
x2
ðR0
drr cos y h� t cos y� b0ð Þ2; (5)
where we have written b in terms of h and y. This term allows hto deviate from t cos y + b0 with an energy penalty correspondingto the magnitude of the deviation. Heuristically, the energypenalty is proportional to cos y because at higher y, the rodsare spaced farther apart in the plane of the membrane, so heightfluctuations of individual rods induce less roughness at themembrane surface (Fig. 2(c)).
We minimize the total free energy with volume-conservingLagrange multiplier l
F ¼ Fdep þ FFrank þ Frod þ l V0 � 4pðR0
drrh
(6)
over h(r) and y(r) to obtain the edge profile. The boundaryconditions are h(0) = t + b0 and y(0) = 0; h(R) and y(R) are free.
Eqn (6) simplifies for large membranes when R is muchgreater than the penetration depth of edge twist ltwist; the edgebecomes essentially straight. We can then study the profile of atwisted membrane formed from an untwisted rectangularmembrane of length Ly - N along the y-direction and length2Lx { Ly along the x-direction. We allow the membrane profileto vary along the x-direction and impose reflection symmetryabout the midline x = Lx where the rods are perpendicular to themembrane (analogous to r = 0 for the original circular geometry).We are interested in the edge profile at x = 0. In this setup, eachfree energy integral becomes its Cartesian version, with FFrank
losing bend distortion terms that arise from a circular geometry.Instead of a Lagrange multiplier term, however, volume con-servation can be directly enforced in the following way. Thevolume of the half of the untwisted membrane between x = 0 and
Soft Matter Paper
Publ
ishe
d on
09
Oct
ober
201
5. D
ownl
oade
d by
Bra
ndei
s U
nive
rsity
on
23/0
1/20
16 2
2:59
:32.
View Article Online
This journal is©The Royal Society of Chemistry 2016 Soft Matter, 2016, 12, 386--401 | 395
x = Lx is V0 = 2(t + b0)LxLy. The change in volume brought about by
a varying h(x) is DV ¼ 2Ly
Ð Lx
0 dx hðxÞ � tþ b0ð Þ½ �. To compensatefor the lost volume, we introduce extra volume at the membranemidline where h(x) = t + b0 by adding a width DLx of untwisted rods;volume conservation requires DLx ¼ �DV= 2 tþ b0ð ÞLy
� �¼Ð Lx
0dx 1� hðxÞ= tþ b0ð Þ½ �. This extra width increases the half-
membrane’s surface area by DA = 2LyDLx and, since depletionfree energy is proportional to surface area, contributes theadditional term nakBTDA to Fdep. Ignoring a constant termproportional to LxLy, the total free energy becomes
F
2nakBTLy¼ðLx
0
dx
ffiffiffiffiffiffiffiffiffiffiffiffiffiffiffiffiffiffiffiffiffi1þ @xhð Þ2
q� h
tþ b0
� þ hð0Þ
þ kt
2
ðLx
0
dxh @xyð Þ2 þ 2q@xyh i
þ 2pffiffiffi3p
x2
ðLx
0
dx cos y h� t cos y� b0ð Þ2;
(7)
where again, k = K/natkBT. Strictly speaking, the integrals in thelast two terms should extend from 0 to Lx + DLx, but thecontributions to the integrals from Lx to Lx + DLx are zerobecause qxy = 0, y = 0, and h = t + b0 in the interior of themembrane. Comparing eqn (6) and (7), the additional surfacearea term is analogous to a Lagrange multiplier with valuenakBT/(t + b0), the effective osmotic pressure exerted by thedepletants on the membrane. Also, since this Cartesian para-meterization implicitly inverts the membrane orientation com-pared to the cylindrical parameterization (instead of decreasingr, increasing x moves into the interior of membrane), the q-termin eqn (7) has the opposite sign of the q-terms in eqn (2).
For membrane edges calculated in Fig. 3(c), h E t cos y,which means rod height fluctuations b are strongly suppressed.This motivates simplification of the free energy by taking theinfinite coupling limit in which Frod enforces h = t cos y + b0 andtherefore disappears from the free energy. Using values inTable 1, we calculate b0 E 0.03t and make the further approxi-mation that these protrusion fluctuations contribute only asmall fraction to the membrane thickness and can thus beneglected: b0 = 0. Numerical calculations of all edge propertiesfixing h = t cos y are indistinguishable from those using the fulltheory. Thus, the precise form of Frod—whose derivationrequired many assumptions such as y { 1, which is clearlyviolated by membranes calculated in Fig. 3(c)—does not matterfor membrane edges as long as it strongly couples h to t cos y.The strong coupling of h to t cos y permits derivation of someanalytical results, including an investigation into spontaneouschiral symmetry breaking for q = 0, which are given inAppendix A.
For p-walls, we use eqn (7) without the boundary depletionterm proportional to h(0) because x = 0 is the middle of the walland no longer an edge boundary. The rods there must lie in themembrane plane, so we gain the extra boundary condition y(0) =p/2. Now y is fixed at both boundaries, so if h were enforced to bea function of y like h = t cosy, the q-term could be integrated to aconstant and the profiles would not depend on q. However, unlike
their counterparts at edges, h and y are independent near x = 0,where calculations show that the vertical mid-wall profile satisfiesh c t cos y; thus, the membrane structures depend slightly on q(Fig. 7(c)). This independence arises due to the angle-dependentcoupling strength of Frod, which has a factor of cosy in theintegrand (eqn (5)). Away from the middle of the wall, cosy E 1and deviations from h = t cosy + b0 are costly for Frod. As cosyapproaches 0, these deviations cost less energy in Frod, so otherterms such as Fdep (eqn (4) without the boundary term) gaininfluence on the profile configuration. The competition betweenFrod, which prefers h to decrease with cosy towards the middle ofthe wall, and Fdep, which prefers a constant h, sets the mid-wallthickness. Since Frod was derived in the small-angle limit, it is notstrictly valid at the middle of the p-wall when y E 1 and h isdecoupled from t cosy, so even though our model quantitativelypredicts the experimental retardance profile in Fig. 8(b), theresults in Fig. 7(c) may not be quantitatively accurate for allparameters k and q.
It is worthwhile at this point to compare our theory with analternative one, which we will refer to as the KM theory after itsdevelopers Kaplan and Meyer,11,46 that also produces results invery good agreement with experimental observations. First, itshould be emphasized that the philosophical approaches of thetwo theories are different. Ours can be viewed as a minimalisttheory based directly on entropic interactions induced bydextran depletants and to a lesser extent by the viruses them-selves. The KM theory, in the grand tradition of liquid-crystalphysics, is phenomenological at its core. It introduces an orderparameter C, inspired by that describing order in a 3D smectic,that describes the transition from rods oriented predominantlyperpendicular to the membrane plane (‘‘smectic’’ phase withC a 0) to rods oriented predominantly parallel to the plane ofthe membrane (‘‘cholesteric’’ phase with C = 0). Though theintroduction of C provides a useful and predictive theory, it isnot clear how it could be measured. The KM theory alsointroduces terms in the free energy that are not directly presentin our theory: one measuring the energy cost of surface curvatureand two providing a favored relative orientation of the surfacenormal N and director n at the top and bottom membranesurfaces. However, the term proportional to �h/(t + b0) in theeqn (7) version of our theory provides a preference of y = 0, i.e., thedirector prefers to be parallel to the layer normal. More generally,the Lagrange multiplier term in eqn (6) provides this preference.Naturally, the KM theory has more free parameters than the five ofour theory: depletant size, Frank elastic constant, twist wavenum-ber amplitude and transition temperature, and virus birefrin-gence (Table 1). In spite of these differences between the twotheories, they share some common features: they both employ theFrank free energy with a term favoring twist to describe theenergetics of director deformations, and they both introduce aterm favoring h = t cos y (when b0 can be ignored in our theory)with a coefficient (cosy in our case and |C|2 in the KM case) thatvanishes at a p-wall when y = p/2, importantly allowing h to differfrom t cosy with no direct energy cost at that point.
KM pursues a different approach to boundary conditionsthan we do. They impose the condition y(R) = p/2 at the free
Paper Soft Matter
Publ
ishe
d on
09
Oct
ober
201
5. D
ownl
oade
d by
Bra
ndei
s U
nive
rsity
on
23/0
1/20
16 2
2:59
:32.
View Article Online
396 | Soft Matter, 2016, 12, 386--401 This journal is©The Royal Society of Chemistry 2016
edge of a circular membrane, whereas we allow the Euler–Lagrange equations of our theory to set the conditions on y andh at the edge. As a result, we are able to capture the edgeprofiles of small membranes whose rods are clearly not parallelto the membrane. Presumably, KM theory is amenable to thesame approach and could thus calculate edge profiles of smallmembranes. KM also view the membrane thickness at thep-wall as a boundary condition determined by experiment,whereas it is a prediction of our model once physical para-meters have been set.
The KM fits to edge and p-wall retardance data reported inref. 11 and 46 (e.g., Fig. 6 of ref. 46) are seemingly better thanthe fits in Fig. 4(b) and 8(b) from our theory. It should be noted,however, that we use one set of parameters to fit data from allmembrane radii, whereas the KM fits only consider data from asingle radius. Our fit to individual profiles are as good as thoseof the KM theory.
B. Edge ripple fluctuations
Our free energy eqn (7) can also be used to investigate edgeripple fluctuations of large membranes. First, we minimizethe free energy over h(x) and y(x) to obtain the profile for theunperturbed membrane edge. We then introduce a small edgeripple u( y) with corresponding tangent angle a(y) � qyu( y). Weassume that the edge profile completely propagates into themembrane interior, so h(x, y) = h(x � u(y)), and that the rod tiltfollows the tangent of u(y), so the nematic director changes fromn(x) = sin y(x)y + cos y(x)z to n(x, y) = sin a( y) sin y(x �u( y))x +cos a( y) sin y(x � u( y))y + cosy(x � u( y))z (for a schematic of theansatz, see Fig. 5(a)). We have to rederive the depletion andFrank terms in eqn (7) to allow for gradient terms in they-direction (expression not shown here). We expand the rippletangent angle in Fourier components ap:
aðyÞ ¼Xp
ffiffiffiffiffiffi2
Ly
sap cos py: (8)
p is the ripple wavenumber.12 With the help of ap = pup, whereup’s are Fourier components for u(y), we can write the freeenergy in terms of the small ap’s. The free energy relative to thestate without ripples becomes
DFLy¼ 1
2
Xp
g½h; y� þ k½h; y�p2� �
ap2 þO ap� �4� �
; (9)
which describes a 1D interface with effective line tension g andline bending modulus k. They are given by
g½h; y� ¼ 2nakBT
ðLx
0
dx@xhð Þ2ffiffiffiffiffiffiffiffiffiffiffiffiffiffiffiffiffiffiffiffiffi
1þ @xhð Þ2q þ hð0Þ
264
375
þ 2K
ðLx
0
dxh @xyð Þ2þq@xyh i
;
(10)
k½h; y� ¼ 2K
ðLx
0
dx h sin 2y: (11)
At thermal equilibrium, the ripple tangent angle componentstake the equipartition values
ap2� �
¼ kBT
gþ kp2: (12)
Note that the term proportional to the chiral twist wave-number q in eqn (10) is negative for qxyo 0. The variation of itsmagnitude with temperature [q(T) is temperature-dependent]is the theoretical basis for the chiral control of line tensionpresented in Fig. 5 and ref. 12. All the other terms are positive-definite, so this term must be responsible for the line tensionbecoming negative at low temperatures, leading to the starfishinstability. It is analogous to the chiral line tension term in thetheory of Langmuir–Blodgett films, which if sufficiently nega-tive, can drive an instability transition from a circular film toone with similarly extended arms.31
Next we investigate the dynamics of ripple fluctuations.We view the membrane edge as an effective 1D viscous fluiddescribed by the ripple profile u(y, t), which can vary with time.We estimate the Reynolds number of this motion to be verysmall B10�6–10�4, so the ripple velocity v = qtu obeys over-damped 1D hydrodynamics:
�Z1D@y2v ¼ fext ¼ fdrag½v� �dHT
du: (13)
Z1D is the 1D edge viscosity and fdrag[v] is the viscous drag forceper unit length arising from membrane edge motion relative tothe bulk solvent.47 Different models of membrane–fluid inter-actions lead to different expressions for fdrag; we see in Appendix Bthat it can be largely ignored for ripple wavenumbers probed byour experiments. In other words, dissipation of ripple excitationsoccurs mainly through the membrane rather than surroundingsolvent since the membrane has much higher viscosity. UsingHT ¼ DF=Ly �
Pp
fpup for the total Hamiltonian density, where
DF/Ly is given by eqn (9) and the fp’s are an external field formallyincluded to calculate the response function, we obtain:
Z1Dp2qtup = �(gp2 + kp4)up + fp.
This leads to the response function
wupup�1ðoÞ ¼ @fpðoÞ
@upðoÞ¼ �ioZ1Dp2 þ gp2 þ kp4:
The fluctuation–dissipation theorem gives the autocorrelationfunction:
SupupðoÞ ¼2kBT
oImwupup ¼
2kBT
Z1Dp21
o2 þ op2;
where
op �gþ kp2
Z1D(14)
Soft Matter Paper
Publ
ishe
d on
09
Oct
ober
201
5. D
ownl
oade
d by
Bra
ndei
s U
nive
rsity
on
23/0
1/20
16 2
2:59
:32.
View Article Online
This journal is©The Royal Society of Chemistry 2016 Soft Matter, 2016, 12, 386--401 | 397
is the autocorrelation decay rate. Indeed, temporal ripple angleautocorrelations are given by
apðtÞapð0Þ� �
¼ðdo2p
eiotp2SupupðoÞ ¼ ap2� �
e�opt; (15)
with hap2i in eqn (12).
V. Experimental methods
As model rod-like colloids, we use two strains of the filamentousfd bacteriophage: wildtype (wt) and the Y21M mutant.24 Ascompared to fd-wt, fd-Y21M has a single point mutation in whichthe 21st amino acid of the major coat protein is changed fromtyrosine (Y) to methionine (M). Both viruses have the samecontour length, 880 nm, and diameter, 6.6 nm; their persistencelengths are 2.8 mm for fd-wt and 9.9 mm for fd-Y21M. They formcholesteric phases with opposite handedness: fd-wt forms left-handed cholesterics whereas fd-Y21M forms right-handedcholesterics. Finally, the chirality of fd-wt is temperature-sensitive whereas the chirality of fd-Y21M is temperature-independent.12
Both viruses are synthesized using standard biological pro-tocols.48 After synthesis, we observe a small portion of virusesthat are very long—two and three times the nominal length ofthe virus. We fractionated the viruses through the isotropic-nematic phase transition; only the isotropic fraction, enrichedin nominal-length viruses, is kept for this work.12 These mono-disperse viruses are then dispersed with concentration cvirus =1 mg mL�1 in 20 mM Tris buffer at pH 8.0 and 100 mM NaCl.Dextran (500, Sigma-Aldrich) is used as a depletant agent.
Samples are prepared between glass cover slides and cover-slips in homemade chambers. A layer of unstretched Parafilmis used as a spacer. Slides are coated with polyacrylamide brushesto prevent nonspecific binding of the viruses with the glass slidesand to suppress the depletion interaction between viruses and theglass walls.28 Samples are made airtight using UV-treated glue(Norland Optical). Microscopy observations were performed withthe inverted microscope Nikon Eclipse Ti equipped with an oilimmersion objective (1.3 NA, 100 Plan-Fluor). Data is acquiredusing a cooled CCD camera (Andor Clara) for low acquisition rates(below 50 Hz) and Phantom v9.1 (Vision Research) for fastacquisition rates (above 1000 Hz).
Sample temperature is tuned between 4 and 60 1C with ahomemade Peltier module equipped with a proportional-integral-derivative temperature controller (ILX Lightwave LPT5910). The temperature-controlling side of the Peltier device isattached to a copper ring fitted around the microscope objec-tive, which heats or cools the sample through the immersionoil. A thermistor, placed in the copper ring adjacent to thesample, enabled the proportional-integral-derivative feedbacknecessary to adjust the temperature. Excess heat is removedusing a constant flow of room-temperature water. Such a deviceallows us to trigger the starfish instability as shown in Fig. 1(e).
The local tilt of the rods with respect to the optical axis of themicroscope is determined using an LC-PolScope (CambridgeResearch and Instrumentation).49 LC-PolScope produces images
in which the intensity of each pixel is the local retardance D ofthe membrane. Such images can be quantitatively related to thetilting of the rods away from the membrane normal (the z-axis inFig. 1). Rods in the bulk of a membrane are aligned along thez-axis, and LC-PolScope images appear black in that region. Bycontrast, for sufficiently large membranes, the bright birefringentring along the membranes periphery indicates local rod tilting asshown in Fig. 4(a). In Fig. 8(a), the LC-PolScope image of a p-wallindicates that the structure contains twist.
The time-independent analysis of thermal edge ripple fluc-tuations with DIC optical microscopy yields the line tensionand the bending rigidity of the edge.12,50 The acquisition isperformed at 1 Hz so that the edge fluctuations are decorre-lated. Intensity profile cuts along the perpendicular to the edgeare fitted by a Gaussian and yield the conformation of the edgewith subpixel accuracy. Each conformation is described interms of the Fourier amplitudes ap (eqn (8)). Averaging over asufficient number of uncorrelated images gives a fluctuationspectrum as shown in Fig. 5(b), where the mean-square ampli-tude hap
2i is plotted as a function of the wavenumber p. Thedynamical analysis of thermal edge ripple fluctuations with DICoptical microscopy yields the autocorrelation decay timescale.The acquisition is performed at 3000 Hz. The autocorrelationdecay timescale 1/op at a given wavenumber p is obtained byfitting the temporal autocorrelation function of the Fourieramplitudes by a simple exponential (eqn (15)). Measurementsover a sufficiently long time give 1/op as a function of p asshown in Fig. 5(c).
Colloidal membranes can be manipulated using opticaltweezers. The laser tweezers setup is built around an invertedNikon TE-2000 microscope. A 1064 nm laser beam (Compass1064, Coherent) is projected onto the back focal plane of anoil-immersion objective (Plan Fluor 100, NA = 1.3) and sub-sequently focused onto the imaging plane. Using custom Lab-VIEW software, multiple trap locations were specified and usedto stretch and manipulate membranes. Above 2 W of laserpower, one can rip off smaller membranes from a largermembrane to produce membranes between 0.5 to 5 mm indiameter. This technique is used to study small membranes asshown in Fig. 1(c).
VI. Discussion
The microscopic building components required for assemblyof colloidal membranes are monodisperse rod-like viruses,non-adsorbing dextran polymer, and polyelectrolytes to screenelectrostatic repulsion. Despite their relative simplicity, thesebuilding blocks can assemble into a myriad of complex struc-tures. Our theory demonstrates how their rich properties canemerge from hard rods and depletants through three simpleentropic considerations: depletant excluded volume, rod fluc-tuations perpendicular to the membrane, and rod twisting asdescribed by the Frank free energy. For example, the curvedmembrane edge with chiral rods arises from the competitionbetween depletion, which prefers a circular vertical edge profile,
Paper Soft Matter
Publ
ishe
d on
09
Oct
ober
201
5. D
ownl
oade
d by
Bra
ndei
s U
nive
rsity
on
23/0
1/20
16 2
2:59
:32.
View Article Online
398 | Soft Matter, 2016, 12, 386--401 This journal is©The Royal Society of Chemistry 2016
and Frank elasticity, which prefers an exponential edge twistingprofile (Fig. 3 and Appendix A). If depletion is strong enoughcompared to the Frank contribution, achiral virus mixtures willalso form twisted membranes through spontaneous symmetrybreaking. Furthermore, our theory predicts that smaller mem-branes, with less distance over which rods can twist, have moresquared-off edge profiles; this prediction was verified by addi-tional experimental data (Fig. 4). Decreasing the temperatureincreases the preferred twist wavenumber and consequentlydecreases the energy of the membrane edge, where the twist isgreatest. Thus, ripple fluctuations, which lengthen the membraneedge, increase in amplitude (Fig. 5). Eventually, at low enoughtemperatures, edges are energetically preferred and ripples arestabilized in a twisted starfish configuration (Fig. 6). Besidesexplaining the properties of the membrane edge, our theoreticalmodel can also explain the structure of p-walls. Along membraneedges, a high depletion concentration strongly suppresses rodfluctuations perpendicular to the membrane (Fig. 3). Along themiddle of p-walls, however, large rod fluctuations, which can beinterpreted experimentally as rod stacking, decreases the deple-tants’ excluded volume and are thus favored (Fig. 7). This stackof rods with finite thickness physically connects the twopartially coalesced membranes and, through depletion, keepsthem together.
All variables in our theory have direct physical meaning. Wedirectly manipulate two of these parameters—temperature anddepletant concentration—and measure several independentphysical properties—membrane retardance (Fig. 4 and 8) andedge fluctuation spectra (Fig. 5). Theoretical calculations of theseproperties demonstrate respectable agreement with experi-mental measurements while using physically reasonable para-meter values (Table 1). We use values for the hard-spheredepletant size a and fd virus birefringence Dn that are withinB25% of the reported values. We require the preferred twistwavenumber q(T) to have its measured square-root behavior. Wecan compare the single Frank elastic constant K to experimentalmeasurements of the twist constant K2 because membranedirector distortions are dominated by the twist mode. K andq(T) are B5 times larger than the values measured from virusesdispersed in a bulk cholesteric phase without any depletant.However, they depend strongly upon the virus concentration;26
membranes condensed by depletants have a higher virusconcentration than cholesteric suspensions do and thus shouldhave higher K and q.
Our theory uses a number of assumptions and simplifica-tions. We study the membrane in the continuum limit withonly two coarse-grained degrees of freedom. We ignore rod–rodinteractions other than those implicit in the phenomenologicalFrank free energy, whose moduli are assumed to be temperature-independent and equal. Rod fluctuations perpendicular to themembrane do not directly increase the membrane’s volume inthe simple manner assumed, and while these fluctuations aremost important at large rod angles y E p/2, their energetic cost(eqn (5)) was calculated in the small rod angle, small fluctuationamplitude limit. In addition, the retardance formula was derivedfor a material of constant thickness and optical axis, which does
not apply to our membranes. We assume a simple ripple ansatzto calculate edge fluctuation spectra, but the actual ripples mayhave a different configuration with lower energy. Yet, despite allof these approximations, our model can match experimentalresults with quantitative accuracy, indicating that it still has valuein describing and elucidating properties of colloidal membranes.
The role of depletion and other hard-core interactions incolloidal systems has been vigorously investigated from manyperspectives. Direct excluded volume minimization was used tostudy depletion-driven helix formation in elastic tubes.51 Effectiveentropic potentials between two anisotropic colloidal particleshave been calculated in depth52 and have been used to explainvarious self-assembly processes.35,53–55 Free-volume theory andtheories based on pair distribution functions have probed thedepletion-induced phase separation of colloidal species and haveprovided relatively sophisticated expressions for effective inter-facial tensions.56–59 However, to our knowledge, the depletioninteraction has never appeared before as an effective surfacetension of magnitude nakBT explicitly. Our system admits thisexpression because there is near-complete phase separationbetween the colloids and the depletants and because depletionis strong enough to fix the membrane volume in the continuumlimit. Our nakBT surface tension can be related to scaling argu-ments near the coexistence line in Flory–Huggins-de Gennestheory, which proposes an interfacial tension proportional tokBT/linter
2, where linter is the thickness of the interface betweencolloid-rich and colloid-poor phases.56,60,61 Taking this thicknessapproximately to be the equilibrium rod height fluctuation ampli-tude b0 calculated in our theory, our surface tension expressionagrees with that obtained by scaling: kBT/linter
2 B kBT/b02 B
nakBT. Moreover, the ability of our model to quantitatively matchand predict experimental results supports the validity of ourexpression, which may guide the design of other colloidal systemswhose surface tension can be easily tuned by changing depletantconcentration, depletant size, or temperature.
Appendix A: spontaneous chiralsymmetry breaking at membraneedges
As discussed in Section IVA and demonstrated in Fig. 3(c), rodheight fluctuations are strongly suppressed in membrane edgeconfigurations. We can simplify the free energy (eqn (7)) byenforcing h = t cos y + b0 and approximating b0 = 0. The freeenergy can then be expressed in terms of y only. In a dimen-sionless form with x� x/t, Lx� Lx/t, q� qt, and F� F/2natkBTLy,
~F ¼ð ~Lx
0
d~x
ffiffiffiffiffiffiffiffiffiffiffiffiffiffiffiffiffiffiffiffiffiffiffiffiffiffiffiffiffiffiffiffi1þ sin2 y @~xyð Þ2
q� cos y
� þ cos yð0Þ
þ k
2
ð ~Lx
0
d~x cos y @~xyð Þ2� k~q sin yð0Þ:
(A1)
To investigate the onset of twist, we expand this free energy forsmall y. To third order, the first integral of the Euler–Lagrangeequation gives
Soft Matter Paper
Publ
ishe
d on
09
Oct
ober
201
5. D
ownl
oade
d by
Bra
ndei
s U
nive
rsity
on
23/0
1/20
16 2
2:59
:32.
View Article Online
This journal is©The Royal Society of Chemistry 2016 Soft Matter, 2016, 12, 386--401 | 399
ffiffiffikp
@~xy ¼ �yþ12� 5k
24ky3:
This equation at x = 0 can be combined with the variationalboundary condition
k@~xyð0Þ ¼ �k~q� yð0Þ þ ~qy2ð0Þ þ 3� k
3ky3ð0Þ
to obtain y(0). We first consider q = 0, so F has chiral symmetry.We find a twist solution when k o kc = 1, where
yð0Þ � �ffiffiffiffiffiffiffiffiffiffiffiffiffiffiffiffiffi4
3ð1� kÞ
r(A2)
close to the critical point. When k 4 1, only the trivial y = 0solution exists. If we allow a small nonzero q to break the chiralsymmetry, a twist solution appears above kc:
yð0Þ � k~qffiffiffikp� 1
: (A3)
We can integrate the Euler–Lagrange equation to leading orderand obtain
yð~xÞ � yð0Þ expð�~x=ffiffiffikpÞ: (A4)
ffiffiffikp
t acts as a twist penetration depth ltwist in analogy to smecticphases. Free energy calculations confirm that the twist solu-tions are favored whenever they exist. Thus, when q = 0, thephase transition at the kc = 1 critical point is second-order andspontaneously breaks chiral symmetry. Above kc, there is acritical second-order line at q = 0.
We also investigate the edge profile when k { 1. It ismore convenient to write the free energy (eqn (A1)) in termsof h � h/t = cos y:
~F ¼ð ~Lx
0
d~x
ffiffiffiffiffiffiffiffiffiffiffiffiffiffiffiffiffiffiffiffiffiffiffi1þ @~x
~h� �2r
� ~h
!þ ~hð0Þ
þ k
2
ð ~Lx
0
d~x
~h @~x~h
� �21� ~h2
� k~q
ffiffiffiffiffiffiffiffiffiffiffiffiffiffiffiffiffiffiffi1� ~h2ð0Þ
q:
(A5)
We chose the sign of the square-root in the last term assumingy 4 0, so this expression applies for q 4 0. If q o 0, then yo 0configurations have lower energy and we should choose theopposite sign. The first integral of the Euler–Lagrange equationgives
0 ¼ 1ffiffiffiffiffiffiffiffiffiffiffiffiffiffiffiffiffiffiffiffiffiffiffi1þ @~x
~h� �2r � ~h� k
2
~h @~x~h
� �21� ~h2
:
This equation at x = 0 can be combined the variationalboundary condition
0 ¼ @~x~hð0Þffiffiffiffiffiffiffiffiffiffiffiffiffiffiffiffiffiffiffiffiffiffiffiffiffiffiffiffiffiffi
1þ @~x~hð0Þ
� �2r � 1þ k~hð0Þ@~x
~hð0Þ1� ~h2ð0Þ
� k~q~hð0Þffiffiffiffiffiffiffiffiffiffiffiffiffiffiffiffiffiffiffi
1� ~h2ð0Þq
to obtain a twist solution as a power series in k:
~hð0Þ �ffiffiffiffiffiffiffiffi27
32k
r� 9
8k~q: (A6)
Solving the Euler–Lagrange equation with k = 0 yields a circularprofile
~hð~xÞ �
ffiffiffiffiffiffiffiffiffiffiffiffiffiffiffiffiffiffiffiffiffiffiffiffiffiffiffiffiffiffiffiffiffiffiffiffiffiffiffiffiffiffiffiffiffiffiffiffiffiffiffiffiffiffiffiffiffiffiffiffiffiffi2 ~xþ
~h2ð0Þ2
!� ~xþ
~h2ð0Þ2
!2vuut ~x : 0� ~x� 1�
~h2ð0Þ2
1 ~x41�~h2ð0Þ2
:
8>>>><>>>>:
(A7)
However, since cos y(0) = h(0) { 1, the coupling in Frod may beweak. Calculations using the full free energy should be per-formed to check if h = t cos y is a valid assumption.
Appendix B: estimation of solvent dragduring ripple fluctuations
Here we estimate the dissipative forces exerted by the solventon the membrane as it undergoes ripple fluctuations. Weapproximate the membrane as an infinite 2D fluid and applythe analysis of,62 who consider the drag force exerted by asubfluid of depth d below the fluid plane. For a velocity fieldv = vx with wavevector p = py, the drag per unit area is gdrag =�Zsp coth(pd)v, where Zs is the subfluid viscosity. We estimate asolvent depth d B 0.3 mm under the membrane where thepolymer brush lies. The fluid above the membrane plane exertsmuch less drag because coth pd is a monotonically decreasingfunction of d, so we ignore it. Assuming that an effective widthlx B ltwist B t of the membrane edge moves during the ripplefluctuations, the drag force per unit length is approximatelyfdrag ¼
Ðdxgdrag � gdraglx. This force modifies the fluctuation
autocorrelation decay constant (eqn (14)) to
op ¼gþ kp2
Zslx cothðpdÞ=pþ Z1D:
With Zs E 3 mPa s from44 and Z1D E 300 mPa s mm2 from thiswork, this change would increase the calculated values of 1/op
in Fig. 4(c) at low wavenumbers p t 0.3 mm�1, but it wouldnot significantly modify our fit value for Z1D. For example, atp = 0.3 mm�1, 1/op would be increased B20%. Moreover, sincethe measured values of 1/op do not show any increase at smallp, this analysis may overestimate the drag force, a claim whoseverification would require a much more sophisticated theorythat better captures the ripple geometry and motion.
Acknowledgements
The research herein was performed in part while T. C. L. wasvisiting the Isaac Newton Institute, where he engaged in helpfuldiscussions with Robert A. Pelcovits. We also acknowledgefinancial support from the National Science Foundation throughgrants DMR-1104707 (to L. K. and T. C. L.) and MRSEC-1420382
Paper Soft Matter
Publ
ishe
d on
09
Oct
ober
201
5. D
ownl
oade
d by
Bra
ndei
s U
nive
rsity
on
23/0
1/20
16 2
2:59
:32.
View Article Online
400 | Soft Matter, 2016, 12, 386--401 This journal is©The Royal Society of Chemistry 2016
and DMR-0955776 (to Z. D.), and from the Agence Nationale dela Recherche through grant ANR-11-PDOC-027 (to T. G.).
References
1 B. J. Alder and T. E. Wainwright, J. Chem. Phys., 1957,27, 1208.
2 B. J. Alder and T. E. Wainwright, Phys. Rev., 1962, 127, 359.3 P. N. Pusey and W. van Megen, Nature, 1986, 320, 340.4 L. Onsager, Ann. N. Y. Acad. Sci., 1949, 51, 627.5 D. Frenkel, H. N. W. Lekkerkerker and A. Stroobants,
Nature, 1988, 332, 822.6 M. D. Eldridge, P. A. Madden and D. Frenkel, Nature, 1993,
365, 35.7 M. Adams, Z. Dogic, S. L. Keller and S. Fraden, Nature, 1998,
393, 349.8 C. Vega, E. P. A. Paras and P. A. Monson, J. Chem. Phys.,
1992, 96, 9060.9 E. Barry and Z. Dogic, Proc. Natl. Acad. Sci. U. S. A., 2010,
107, 10348.10 Y. Yang, E. Barry, Z. Dogic and M. F. Hagan, Soft Matter,
2012, 8, 707.11 M. J. Zakhary, T. Gibaud, C. N. Kaplan, E. Barry,
R. Oldenbourg, R. B. Meyer and Z. Dogic, Nat. Commun.,2014, 5, 3063.
12 T. Gibaud, E. Barry, M. J. Zakhary, M. Henglin, A. Ward,Y. Yang, C. Berciu, R. Oldenbourg, M. F. Hagan, D. Nicastro,R. B. Meyer and Z. Dogic, Nature, 2012, 481, 348.
13 P. Sharma, A. Ward, T. Gibaud, M. F. Hagan and Z. Dogic,Nature, 2014, 513, 77.
14 S. Asakura and F. Oosawa, J. Chem. Phys., 1954, 22, 1255.15 S. Asakura and F. Oosawa, J. Polym. Sci., 1958, 33, 183.16 D. Frenkel, Phys. World, 1993, 6, 24.17 D. G. A. L. Aarts, M. Schmidt and H. N. W. Lekkerkerker,
Science, 2004, 304, 847.18 U. Gasser, E. R. Weeks, A. Schofield, P. N. Pusey and
D. A. Weitz, Science, 2001, 292, 258.19 A. P. Gast, C. K. Hall and W. B. Russel, J. Colloid Interface
Sci., 1983, 96, 251.20 H. N. W. Lekkerkerker, W. C. K. Poon, P. N. Pusey,
A. Stroobants and P. B. Warren, Europhys. Lett., 2007,20, 559.
21 E. Weeks, J. Crocker, A. Levitt, A. Schofield and D. Weitz,Science, 2000, 287, 627.
22 B. Alberts, A. Johnson, J. Lewis, M. Raff, K. Roberts andP. Walter, Molecular Biology of the Cell: Reference Edition, 5thedn, Garland Science, New York, 2008.
23 D. Lingwood and K. Simons, Science, 2009, 327, 46.24 E. Barry, D. Beller and Z. Dogic, Soft Matter, 2009, 5, 2563.25 K. R. Purdy, Z. Dogic, S. Fraden, A. Ruhm, L. Lurio and
S. G. J. Mochrie, Phys. Rev. E: Stat., Nonlinear, Soft MatterPhys., 2003, 67, 031708.
26 Z. Dogic and S. Fraden, Langmuir, 2000, 16, 7820.27 L. Feng, B. Laderman, S. Sacanna and P. Chaikin, Nat.
Mater., 2014, 14, 61.
28 A. W. C. Lau, A. Prasad and Z. Dogic, Europhys. Lett., 2009,87, 48006.
29 E. Barry, Z. Dogic, R. B. Meyer, R. A. Pelcovits andR. Oldenbourg, J. Phys. Chem. B, 2009, 113, 3910.
30 R. Viswanathan, J. A. Zasadzinski and D. K. Schwartz,Nature, 1994, 368, 440.
31 D. Pettey and T. C. Lubensky, Phys. Rev. E: Stat. Phys.,Plasmas, Fluids, Relat. Interdiscip. Top., 1999, 59, 1834.
32 T. Ohzono, T. Yamamoto and J.-i. Fukuda, Nat. Commun.,2014, 5, 3735.
33 F. C. Frank, Discuss. Faraday Soc., 1958, 25, 19.34 K. Zhao and T. G. Mason, Phys. Rev. Lett., 2008, 101, 148301.35 D. J. Kraft, R. Ni, F. Smallenburg, M. Hermes, K. Yoon,
D. A. Weitz, A. van Blaaderen, J. Groenewold, M. Dijkstraand W. K. Kegel, Proc. Natl. Acad. Sci. U. S. A., 2012,109, 10787.
36 C. E. Ioan, T. Aberle and W. Burchard, Macromolecules,2000, 33, 5730.
37 J. K. Armstrong, R. B. Wenby, H. J. Meiselman andT. C. Fisher, Biophys. J., 2004, 87, 4259.
38 D. S. Banks and C. Fradin, Biophys. J., 2005, 89, 2960.39 D. B. DuPre, J. Chem. Phys., 1975, 63, 143.40 F. Leenhouts, F. van der Woude and A. J. Dekker, Phys. Lett.,
1976, 58, 242.41 P. P. Karat and N. V. Madhusudana, Mol. Cryst. Liq. Cryst.,
1977, 40, 239.42 S. Zhou, Y. A. Nastishin, M. M. Omelchenko, L. Tortora,
V. G. Nazarenko, O. P. Boiko, T. Ostapenko, T. Hu, C. C.Almasan, S. N. Sprunt, J. T. Gleeson and O. D. Lavrentovich,Phys. Rev. Lett., 2012, 109, 037801.
43 M. Born and E. Wolf, Principles of Optics, CambridgeUniversity Press, Cambridge, 7th edn, 2005, p. 829.
44 R. Cush, P. S. Russo, Z. Kucukyavuz, Z. Bu, D. Neau, D. Shih,S. Kucukyavuz and H. Ricks, Macromolecules, 1997, 30, 4920.
45 C. B. Allendoerfer, Proc. Am. Math. Soc., 1948, 54, 128.46 C. N. Kaplan and R. B. Meyer, Soft Matter, 2014, 10, 4700.47 P. M. Chaikin and T. C. Lubensky, Principles of Condensed
Matter Physics, Cambridge University Press, Cambridge,1995, pp. 440–449.
48 T. Maniatis, E. F. Fritsch and J. Sambrook, MolecularCloning: A Laboratory Manual, Cold Spring Harbor Laboratory,New York, 1982.
49 R. Oldenbourg and G. Mei, J. Microsc., 2011, 180, 140.50 S. Safran, Statistical Thermodynamics of Surfaces, Interfaces,
and Membranes, Addison-Wesley, Reading, 1994, pp. 83–84,201–202.
51 Y. Snir and R. D. Kamien, Science, 2005, 307, 1067.52 G. van Anders, D. Klotsa, N. K. Ahmed, M. Engel and
S. C. Glotzer, Proc. Natl. Acad. Sci. U. S. A., 2014, 111, E4812.53 S. Sacanna and D. J. Pine, Curr. Opin. Colloid Interface Sci.,
2011, 16, 96.54 S. Sacanna, M. Korpics, K. Rodriguez, L. Colon-Melendez,
S.-H. Kim, D. J. Pine and G.-R. Yi, Nat. Commun., 2013,4, 1688.
55 D. J. Ashton, R. L. Jack and N. B. Wilding, Soft Matter, 2013,9, 9661.
Soft Matter Paper
Publ
ishe
d on
09
Oct
ober
201
5. D
ownl
oade
d by
Bra
ndei
s U
nive
rsity
on
23/0
1/20
16 2
2:59
:32.
View Article Online
This journal is©The Royal Society of Chemistry 2016 Soft Matter, 2016, 12, 386--401 | 401
56 H. N. W. Lekkerkerker and R. Tuinier, Colloids and theDepletion Interaction, Lecture Notes in Physics, SpringerNetherlands, Dordrecht, 2011, vol. 833.
57 S. M. Oversteegen and R. Roth, J. Chem. Phys., 2005,122, 214502.
58 D. G. A. L. Aarts, R. P. A. Dullens, H. N. W. Lekkerkerker,D. Bonn and R. van Roij, J. Chem. Phys., 2004, 120, 1973.
59 A. Vrij, Phys. A, 1997, 235, 120.60 P.-G. de Gennes, Scaling Concepts in Polymer Physics,
Cornell, Ithica, 1979, p. 123.61 E. H. A. de Hoog and H. N. W. Lekkerkerker, J. Phys. Chem.
B, 1999, 103, 5274.62 D. K. Lubensky and R. E. Goldstein, Phys. Fluids, 1996,
8, 843.
Paper Soft Matter
Publ
ishe
d on
09
Oct
ober
201
5. D
ownl
oade
d by
Bra
ndei
s U
nive
rsity
on
23/0
1/20
16 2
2:59
:32.
View Article Online