Embed Size (px)
Citation preview
Environment & Neighbourhood Delivery Plan 2018/19
2
Index 1 Key Priorities for 2018/19 3 2 Overview & Profile 4 3 Performance Review 6 4 Strategic Assessment 14 5 Corporate Information 20 6 Resources 21 7 Risks 22
Appendix 1: Structure Chart 23 Appendix 2: Delivery Plan 2018/19 24 Appendix 3: Workforce Plan - Action Plan 2018/19 29
3
1 Key Priorities for 2018/19 The Environment and Neighbourhood Services make a difference every day to the lives of the residents of West Dunbartonshire through the range of services that we provide. During 2018/19 we will deliver excellent services which respond to the demands of our communities. We will support our services to be the best by providing the tools and opportunities required to deliver a responsive front line service underpinned by continuous improvement. We aim to enhance our communities through a range of initiatives that will allow our residents to enjoy the local environment and experience a better quality of life. Our 2018/19 key priorities are:
deliver our capital projects within budget and agreed timescales;
complete the transition of roads and transportation to the shared service;
implement committee and budget decisions timeously; and
assist in the development of the early years strategic expansion.
4
2 Overview & Profile
Overview
Environment & Neighbourhood comprises a wide range of services covering roads and transportation, fleet and waste, greenspace, and leisure and facilities management. With 870 employees (598 full time equivalents - FTE) and a net revenue budget of £25.8m, it is one of 8 strategic areas with responsibility for delivering the Council’s Strategic Plan. This Plan sets out key actions to help deliver the Strategic Plan priorities and address the performance issues and service priorities identified in our planning process. It outlines the performance indicators we will monitor to measure our success, provides an overview of services and resources, including employees and budgets, and considers the relevant risks. Progress will be monitored and managed on a regular basis at Environment & Neighbourhood management team meetings and reported twice yearly to Infrastructure, Regeneration and Economic Development (IRED) Committee, at mid-year and year end. Profile
There are four distinct services within Environment and Neighbourhood: Roads and Transportation; Fleet and Waste; Greenspace (including street cleansing); and Leisure and Facilities Management. Brief details of each service are outlined below and a structure chart is set out at Appendix 1. Roads and Transportation This service manages and maintains the Council’s road network and associated infrastructure which has a combined asset value in excess of £560m. It also has additional responsibilities for monitoring all watercourses and taking appropriate measures to mitigate the risk of flooding, responding to adverse weather and promoting road safety. The service manages, maintains and undertakes regular safety inspections of the 347km of public road and 664 km of footways and footpaths. It also manages and maintains over 200 related structures including bridges, underpasses, retaining walls and large culverts and over 16,000 streetlights and illuminated street signs.
5
Fleet and Waste This service manages the waste arisings from all households in the Council area, in-house operations and registered commercial waste users. The service also procures, manages, maintains and arranges the end of life disposal of the Council’s vehicle fleet and manages the social transport service for Health and Social Care, and Educational Services. Greenspace Greenspace operates the Council’s grounds maintenance, street cleaning and burial and cremation services under the terms of a Service Level Agreement. The Service Level Agreement is the mechanism by which the Council delivers its policy aims and objectives for the management and maintenance of the Greenspace service. Greenspace also provides outdoor facilities such as football pitches, play areas and parks, as well as dealing with countryside access, maintenance of woodlands and delivering a ranger service. Greenspace is particularly successful in attracting external funding from Sport Scotland and Heritage Lottery Funding. Leisure and Facilities Management This service provides building cleaning, facilities support, and catering services support to a range of Council establishments, including all Council schools and Early Years establishments. It also has responsibility for the management and operation of a number of Council offices. The service also includes a client liaison link between the Council and West Dunbartonshire Leisure Trust. It has performance monitoring responsibility for the Leisure Trust as it delivers a range of services on behalf of the Council, including the Council’s annual events programme. Capital Projects
All of the above services have responsibility for a range of capital projects including:
Clydebank Community Sports Hub;
Mountblow Pavilion and 3G pitch;
continuation of our playpark rollout;
Levengrove Heritage Lottery Fund project;
Posties Park running track and pavilion; and
major road repairs.
6
3 Performance Review
The Environment & Neighbourhood management team completed a detailed performance review of 2017/18. As well as highlighting key achievements, it identified a number of performance challenges to be addressed in 2018/19.
Key Achievements
The key achievements highlighted by the performance review are set out below. Roads and Transportation
Nominated in two categories for APSE for Best Council and most improved performing council for street lighting.
Delivery of the Minor Civils Framework, a framework for the efficient, effective and compliant procurement of civil engineering and construction contractors.
Completion of the LED Street lighting upgrade programme. Fleet and Waste
Began implementation of an all-electric pool cars scheme at Aurora House offices to reduce the costs and carbon emissions generated by staff business travel.
Introduced CCTV on the Council’s heavy goods vehicle fleet to improve the management of on road risk, and installed a Safe Stop device on each of the Council’s bin lorries to improve the operating safety of these large vehicles .
Created a range of options around delivery of our waste and recycling services which ensure we meet the needs of citizens while also delivering the Household Recycling Charter for Scotland.
Greenspace
The Bereavement Services Team won the team of the year award at the Employee Recognition Awards. This recognised the excellent service delivered by the team in a sensitive and caring manner.
Development of seven new play areas throughout West Dunbartonshire. This will help to increase the levels of active play amongst our children.
Creation of a volunteer network agreement in partnership with Loch Lomond and Trossachs National Park (LLTNP). This has resulted in a successful ongoing programme of volunteering events and activities throughout West Dunbartonshire.
Leisure and Facilities Management
Evelyn Bryce, the Cook from one of our local primary schools won the title of Council Employee of the year at the Council’s annual Employee Recognition Awards.
7
The team from Linnvale Primary School won the title of Scottish Catering Team of the Year at the ASSIST National Facilities Management Awards. This is a great accolade for the service and is recognition of the hard work and dedication that the team at Linnvale and all the Catering teams across the Council provide.
The Catering Service has developed a ‘Picking Plate’ as part of the Primary School lunch to encourage children to eat healthy and nutritious foods at lunchtime. The concept has been recognised as best practise across Scotland and a number of authorities are now introducing similar provision.
Challenges
The challenges identified by the performance review are set out below. These relate to sports facilities, waste, street cleaning, and roads and will be the focus of improvement activity in 2018/19. Sports Facilities The cost per attendance at sports facilities fell by 2.34% between 2015/16 and 2016/17, from £5.46 to £5.34. This was despite a reduction of 4.4% in the number of attendances between the two periods, due, in part, to the early closure of the Playdrome in advance of the opening of the new Clydebank Leisure Centre. However, the improvement in the cost per attendance figure was not enough to impact positively on our ranking which fell one place from 31st to 32nd, with a Scotland average of £2.90. Existing facilities performed well. With the introduction of the new Clydebank Leisure Centre, visitor numbers and memberships have significantly increased which will impact positively on this indicator going forward. Programmes have been reviewed to meet service users’ needs, and actively engage with partners, the college and employee groups. In addition to this, construction of the new Clydebank Community Sports Hub has now commenced and the investment of £3.8m alongside the new Clydebank Leisure Centre will certainly support an increase in participation and a reduction in costs. Waste Disposal Costs While we continue to have one of the lowest waste collection costs per household of all Scottish councils (2nd best in Scotland in 2016/17), our waste disposal costs are above the Scottish average. This can be explained, in part, by an increase in the total waste arisings managed by the Council, which increased by 938 tonnes between 2015/16 and 2017/18. To improve this indicator in 2018/19, we have conducted an analysis of the material householders are placing in their landfill waste bin rather than in the recycling bins provided. This exercise identified that the around 40% of the waste could have been
8
recycled thereby reducing the cost of disposal. Consequently, we will implement a number of actions to support residents in recycling more of their waste to reduce the cost of landfill disposals. Biodegradable Municipal Waste Landfilled The tonnage of biodegradable municipal waste landfilled has more than halved since 2015/6. However, 14,154 tonnes were landfilled in 2016/17, missing the target of 12,100 set for the year. Performance in the first three quarters of 2017/18 is also adrift of target making it unlikely that the 2017/18 year-end target will be met. To improve this indicator in 2018/19, we will continue with and intensify our 2017/18 recycling promotional campaign, which is designed to encourage households to maximise the recycling of their waste by fully utilising the Council’s current recycling services. We will also finalise future service delivery change options that are compliant with the code of practice associated with the Household Recycling Charter for Scotland, to which the Council is a signatory, for consideration by the IRED Committee Street Cleaning The net cost of street cleaning per 1,000 population decreased by over 6% between 2015/16 and 2016/17, improving our ranking from 31st to 30th. Our cleanliness score also improved slightly over the same period, giving a ranking of 21st, up from 23rd the previous year. There was a very slight reduction in the percentage of adults satisfied with street cleaning but this did not impact negatively on our ranking, with an improvement of one place to 7th. We will work to maintain our improved performance across our street cleaning indicators in 2018/19. Roads The cost of maintenance per kilometer of roads fell significantly between 2015/16 and 2016/17, resulting in an improved ranking, up 9 places to 22nd. Following a very severe winter during 2017/18, a major priority for the Roads team is to reinstate much of the damage to our roads network. It is also anticipated that the Roads team will move to a shared service in 2018/19 which will deliver both challenges and opportunities. Service Users’ Feedback
The Council has a clear focus on learning from the feedback we receive from our service users. Complaints data, monthly telephone surveys and a range of other mechanisms provide invaluable feedback to help us improve our services.
9
Complaints Every year, Environment and Neighbourhood services are involved in millions of service interactions. Every quarter, for example, there are over 1 million bin collections. The scale of Environment and Neighbourhood’s service interactions provides important context to the complaints data that follows. Between 1 April and 31 December 2017, Environment & Neighbourhood received a total of 102 complaints, comprising 97 at Stage 1 and 5 at Stage 2. During the same period, 100 complaints were closed, 95 at Stage 1 and 5 at Stage 2.
73% of complaints closed at Stage 1 met the 5 working days target for resolving complaints, with an average of 6 days for all complaints closed at Stage 1. 80% of the complaints closed at Stage 2 were resolved within the 20 working days target, with an average of 12 days.
63% of complaints closed at Stage 1 and 40% closed at Stage 2 were upheld.
The management team reviews complaints regularly to identify trends and areas for improvement. In the past year, we have refined the process for reporting faults about street lighting apparatus, making it more efficient and reducing the response times for resolving faults.
In addition, we will continue to ensure that all relevant staff receive customer service standards training. Residents’ Telephone Survey A monthly telephone survey of 100 residents is carried out to gauge satisfaction levels with a range of Council services. Within Environment & Neighbourhood, street cleaning, waste services, roads maintenance, and leisure and community centres are all covered by the telephone survey. For the 2017 calendar year (1 January to 31 December 2017), satisfaction with street cleaning was 73%, down from 83% in 2016. Satisfaction with waste services improved by 6% over 2017 to 97%, reflective of quarterly satisfaction levels over the year. This is similar to satisfaction with leisure and community centres, which rose to 96% in 2017, an increase of 9% on the 2016 level. Satisfaction with roads maintenance continues to be low in comparison with other services and decreased to 31% in 2017, from 40% in 2016. This was influenced in part by a notable decrease between Q3 and Q4, falling from 32% to 20%.
10
Citizens’ Panel In the most recent Citizens’ Panel survey carried out in 2017/18, two thirds of respondents (67%) stated that dog fouling was an issue in West Dunbartonshire. While more than two thirds (73%) had seen signage relating to dog fouling offences in their area, only 29% agreed that enough was being done by the Council to tackle the issue. In response, the Greenspace team plan to reinvigorate the Dog Fouling campaign in 2018/19 to address the concerns raised. We will continue to review feedback from Citizens’ Panel surveys and identify how we can address the issues that emerge. Continuous Improvement
Self-Evaluation Programme
The Council has agreed a three year self-evaluation programme using a checklist approach implemented through an online survey. Over the three year programme, all Council services that are not subject to an external evaluation will undertake self-evaluation, with 11 scheduled in the first year. Within Environment and Neighbourhood, a self-evaluation of Facilities Management was completed in February 2018. Improvement actions arising from the process will be implemented in 2018/19 and once completed, a follow up survey will determine their impact. External Validation The road condition index is independently assessed annually and the results reported through the Local Government Benchmarking Framework. Local Government Benchmarking Framework (LGBF) All 32 councils in Scotland measure a common set of performance indicators called the Local Government Benchmarking Framework. It comprises service delivery, cost, and satisfaction indicators covering all major council service areas, including education, housing, social work, and leisure. Using the same indicators across all councils allows us to compare our performance so that we can identify best practice, learn from each other, and improve what we do. The most recent comparative data for all councils was published in February 2018 and relates to the period 2016/17 unless otherwise specified in the table below. In summary, of Environment & Neighbourhood’s 16 LGBF indicators, 9 improved their comparative position, 5 got worse and 2 stayed the same. Two PIs improved
11
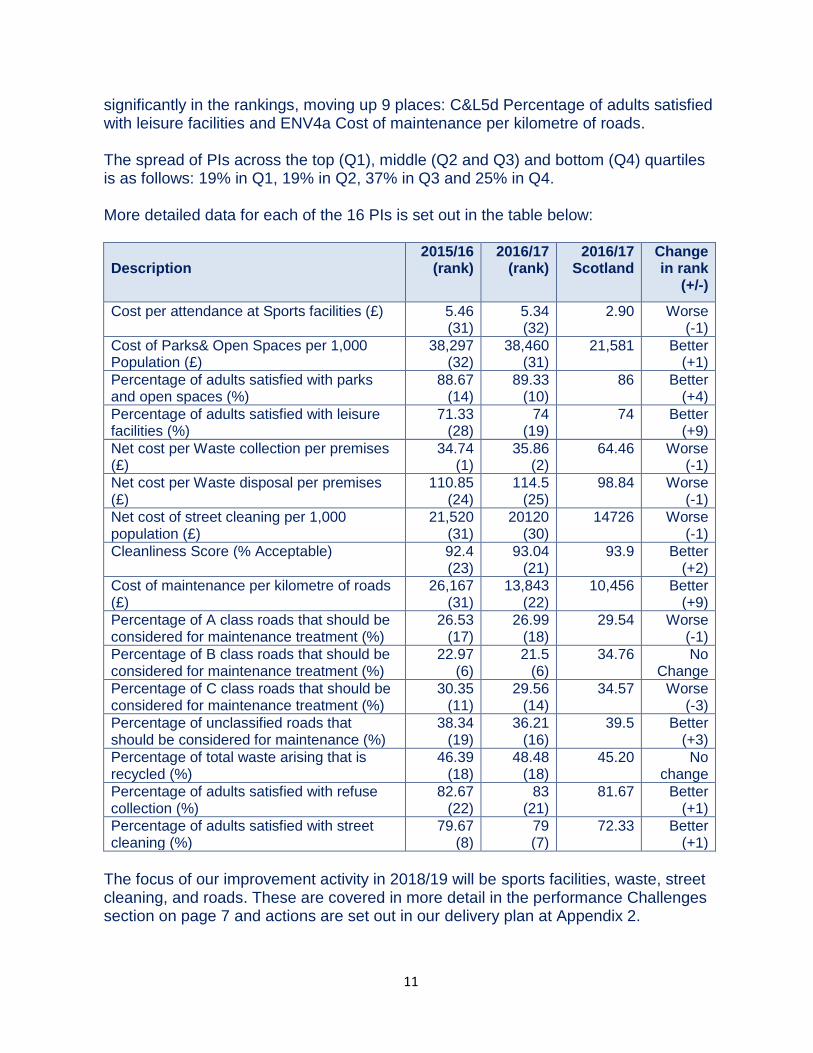
significantly in the rankings, moving up 9 places: C&L5d Percentage of adults satisfied with leisure facilities and ENV4a Cost of maintenance per kilometre of roads. The spread of PIs across the top (Q1), middle (Q2 and Q3) and bottom (Q4) quartiles is as follows: 19% in Q1, 19% in Q2, 37% in Q3 and 25% in Q4. More detailed data for each of the 16 PIs is set out in the table below:
Description
2015/16 (rank)
2016/17 (rank)
2016/17 Scotland
Change in rank
(+/-)
Cost per attendance at Sports facilities (£) 5.46 (31)
5.34 (32)
2.90 Worse (-1)
Cost of Parks& Open Spaces per 1,000 Population (£)
38,297 (32)
38,460 (31)
21,581 Better (+1)
Percentage of adults satisfied with parks and open spaces (%)
88.67 (14)
89.33 (10)
86 Better (+4)
Percentage of adults satisfied with leisure facilities (%)
71.33 (28)
74 (19)
74 Better (+9)
Net cost per Waste collection per premises (£)
34.74 (1)
35.86 (2)
64.46 Worse (-1)
Net cost per Waste disposal per premises (£)
110.85 (24)
114.5 (25)
98.84 Worse (-1)
Net cost of street cleaning per 1,000 population (£)
21,520 (31)
20120 (30)
14726 Worse (-1)
Cleanliness Score (% Acceptable) 92.4 (23)
93.04 (21)
93.9 Better (+2)
Cost of maintenance per kilometre of roads (£)
26,167 (31)
13,843 (22)
10,456 Better (+9)
Percentage of A class roads that should be considered for maintenance treatment (%)
26.53 (17)
26.99 (18)
29.54 Worse (-1)
Percentage of B class roads that should be considered for maintenance treatment (%)
22.97 (6)
21.5 (6)
34.76 No Change
Percentage of C class roads that should be considered for maintenance treatment (%)
30.35 (11)
29.56 (14)
34.57 Worse (-3)
Percentage of unclassified roads that should be considered for maintenance (%)
38.34 (19)
36.21 (16)
39.5 Better (+3)
Percentage of total waste arising that is recycled (%)
46.39 (18)
48.48 (18)
45.20 No change
Percentage of adults satisfied with refuse collection (%)
82.67 (22)
83 (21)
81.67 Better (+1)
Percentage of adults satisfied with street cleaning (%)
79.67 (8)
79 (7)
72.33 Better (+1)
The focus of our improvement activity in 2018/19 will be sports facilities, waste, street cleaning, and roads. These are covered in more detail in the performance Challenges section on page 7 and actions are set out in our delivery plan at Appendix 2.
12
West Dunbartonshire Council’s Benchmarking Programme
As well as participating in the Scotland wide LGBF programme, the Council has embarked on a three year programme to ensure that all services are engaged in benchmarking performance in relation to service delivery, cost and customer satisfaction measures. The first step is to identify any gaps in our current benchmarking activity in relation to service areas and/or measures. Where gaps are identified, we will consider how they might be addressed, working with other councils
and organisations to develop this.
Over the period of this plan, Leisure & Facilities Management will review and develop its benchmarking approach and any improvement actions that arise from the benchmarking activities that follow will be included in future delivery plans and reported to committee. Employee Survey 2017
59% of Environment & Neighbourhood employees completed the Employee Survey. The results, published in December 2017, have been reviewed by the management team for the Environment & Neighbourhood strategic area as a whole. The key highlights and areas for improvement identified are set out below. Key Highlights
95% of respondents have a clear understanding of their role and responsibilities - 3 percentage points (pp) better than the Council figure and 1pp better than the previous survey;
84% said their team worked well together - 1pp better than the Council figure and 26pp better than the previous survey;
91% are proud of what their service delivers - 6pp better than the Council figure and the previous survey;
83% reported good morale at work - 12pp better than the Council figure and 18pp better than the previous survey;
75% said they get the information they need to do their job well - 2pp better than the Council figure and 21pp better than the previous survey;
66% said that communication within their service is straightforward and honest - 5pp better than the Council figure and 20pp better than the previous survey.
Areas for Improvement The key areas for improvement are focused on engaging with employees individually and collectively, with many areas showing significant improvement since the 2015 Employee Survey.
13
57% said they felt appreciated and valued for the work that they do - equal to the Council figure and 1pp better than the previous survey;
62% get enough helpful feedback on how well they do their work – 1pp better than the Council figure and 4pp better than the previous survey;
53% reported regular Be the Best conversations with their manager where they discuss and identify learning and development requirements – 6pp lower than the Council figure and 7pp lower than the previous survey;
56% reported that their line manager encourages them to continuously improve and develop new skills and knowledge – 8pp lower than Council figure and 2pp better than the previous survey;
50% said that information reaches them in good time – 5pp lower than the Council figure and 8pp better than the previous survey;
53% reported regular communication and updates on proposed change – 2pp lower than the Council figure and 16pp better than the previous survey;
50% said they are asked about their views as an employee when change directly affecting them is taking place – 4pp better than the Council figure and 14pp better than the previous survey.
To improve our engagement with employees in 2018/19, we will continue to implement ‘Be the Best’ Conversations across all our services, our visible manager programme and undertake back to the floor visits to improve the visibility and accessibility of senior managers. As well as reviewing the results for the strategic area as a whole, managers are reviewing their individual service areas and developing actions to address the key issues that have been raised at that level where necessary. Quality Standards
Quality standards help to define what users of our services can expect to receive, and remind both the organisation and our employees of the challenges and obligations they face in delivering best value services. The organisation is committed to developing and publishing appropriate quality standards across all service areas where they do not already exist. In a number of services, these quality standards are being detailed in this way for the first time, and therefore the roll out will be phased to focus on those standards that fit best with strategic priorities or relate most to those areas residents highlight as important. This will be taken forward as part of the Continuous Improvement activity across the Council and quality standards will be incorporated into delivery plans as they are developed. Once in place, they will be monitored and managed by the management team on a regular basis and reported annually to committee.
14
4 Strategic Assessment The Environment & Neighbourhood management team completed a detailed strategic assessment to determine the major influences on service delivery and priorities in 2018/19 and beyond. This covered a review of the financial context, local and national political priorities, new legislation and technology, and Council policies among others. The following factors were identified as significant. Key Factors
Financial Challenges The entire public sector is facing significant financial challenges. The Council is predicting cumulative funding gaps in 2018/19, 2019/20 and 2020/21 of £nil, £7.646m and £13.806m respectively.This means that action has to be taken to balance our budget and protect services for residents. This will undoubtedly mean that within Environment & Neighbourhood, available funding will be reduced and we will need to change how we do our jobs, what we do, where we work, and may reduce the number of people employed.
In 2018/19, we will:
implement Management Adjustments and Savings Options within Environment and Neighbourhood services;
implement the new shared service model for Roads and Transportation;
continuously review our service delivery models to ensure services are being delivered as efficiently as possible; and
work in conjunction with other departments to deliver service improvements, in particular the office rationalisation project and the Early Years Expansion Strategy.
Shared Services/ Roads Collaborative Programme initiative A report was submitted to Council in June 2016 agreeing the formation of a Shared Services Joint Committee with East Dunbartonshire and Inverclyde councils. In the first instance, we are focusing on sharing Roads Services and have developed a strategic business case for consideration. Council will have considered a Shared Services report on 5 March 2018 where it was agreed to progress the model with Inverclyde Council.
In 2018/19, we will:
continue to progress the roads collaborative programme; and
consider the benefits of sharing other Environment & Neighbourhood services.
15
Staff Resources The overall staff resource within Environment and Neighbourhood is 630 FTE. While resources are focused on delivering frontline services, Greenspace in particular is leading on an increasing number of large capital projects. A lack of suitably qualified technical staff within the service provides challenges in delivering these projects within agreed timescales. The age demographic of the workforce continues to be a challenge with predominantly part-time, female employees in Facilities Management and long serving employees in Roads, Greenspace, and Fleet & Waste. This challenge can result in increased levels of absence. Climate Change Environment and Neighbourhood has made a significant contribution to the reduction in the Council’s carbon emissions through upgrading street lighting to LEDs, introducing pool cars, improving our recycling performance, reviewing the composition of the vehicle fleet, increasing areas of biodiversity and removing mercury from all cremations. While our actions contribute positively to slowing climate change, it continues to have a significant impact on all Council services. Responding to disruptive weather events (intense rainfall, flooding, storms and high winds) increases pressure on all resources, (staff, equipment, budgets), impacts on day to day and planned service delivery, and often adversely affects the Council’s reputation. The growing season is now nearly 5 weeks longer, lasting form March until November. This is impacting on our resources, including seasonal staff, and how we deliver services effectively and efficiently. Our services must adapt to meet these and other challenges resulting from climate change.
In 2018/19, we will:
hold resilience planning for disruptive weather events;
contribute to raising the awareness for community self-resilience;
further develop Flood Alleviation Schemes and surface water management plans for areas identified as potentially vulnerable; and
re-configure the Greenspace service to recognise the seasonal nature of the service.
16
External Funding Accessing external funding has become more difficult given current economic situation This will have a negative impact on our ability to deliver major capital infrastructure projects.
In 2018/19, we will:
continue to identify new sources of external funding; and
develop robust business cases and funding applications. Demographic Changes Demand for services increases due to the demographics of the resident population. An aging population has resulted in a huge rise in demand for the care of gardens scheme.
In 2018/19, we will:
implement the agreed changes to eligibility criteria to ensure that only those most in need get access to the service.
Allotments The Greenspace service currently manages two allotment sites in Dumbarton. There is a 10 year waiting list for allocation of an allotment. The Community Empowerment Act places an obligation on Local Authorities to provide sufficient allotments for its residents. There is an allocation of £400k in the Councils capital plan to develop new allotment sites. The challenge is to identify suitable sites that are not contaminated.
In 2018/19, we will:
identify and develop a suitable new allotment site with provision for 40 traditional plots;
continue to work with community groups to establish local community growing spaces; and
develop a food growing strategy for West Dunbartonshire.
Legislative Changes Scottish Government Decisions on School Food The provision of school lunches is presently governed by the Schools (Health Promotion and Nutrition) (Scotland) Act 2007 and the Nutritional Requirements for Food and Drink in Schools (Scotland) Regulations 2008. These are Scottish Government regulations which specify the acceptable standards and nutritional content of school food.
17
The Scottish Government is presently consulting with stakeholders prior to reviewing the school food legislation. Once agreed, any changes are likely to have an impact upon school meal provision. Additionally, new legislation has been developed by NHS Health Scotland called “Setting the Table - Nutritional Guidance and Food Standards for Early Years Childcare Providers in Scotland” This guidance has been developed to help Early Years childcare providers meet the Scottish Government National Care Standards. The Facilities Management team is currently utilising the new guidance to develop menus for the Early Years sector however the Early Years Expansion Strategy will require a greater degree of menu development and analysis.
To assist in the development of a range of nutritionally balanced menu options to meet the various legislative requirements, Facilities Management will recruit a Food and Nutrition Co-ordinator to the team. The post holder will be responsible for leading menu development and implementation for snacks and school meals within the Early Years, Primary, Special and Secondary sectors, for monitoring and reviewing uptake and for ensuring compliance with national guidelines and legislation.
General Data Protection Regulation May 2018 The General Data Protection Regulation (GDPR) is replacing the Data Protection Act 1998 and comes into effect in May 2018. There are a number of new requirements contained within the legislation that will have a major impact on the way that personal data is processed and stored within the Council.
Along with all other Council services, Environment & Neighbourhood will work with the Records Management Section of Legal Services to ensure we meet the new requirements.
Scottish Government Funding for Provision of Electric Vehicles Charging Points The Council has been awarded Scottish Government funding to introduce further electric vehicle charging points over the next three years.
In 2018/19 we will:
collaborate with the Scottish Government to identify opportunities for electric vehicle charging points.
Develop a strategy for domestic charging points with a focus on on-street use.
Pesticides Legislative changes in the use of pesticides will have an impact on our ability to continue with the present level of weed control. Alternative delivery methods will be labour intensive.
18
In 2018/19 we will:
investigate alternative methods of weed control; and
develop more biodiversity areas that do not require weed control.
Income Generation Given the financial challenges facing the Council all services must develop new, innovative ways of generating income by commercialisng parts of our services.
In 2018/19 we will:
continue to market commercial waste collection services.
Depot Accommodation The current depot estate has evolved and grown over time. The resultant depot portfolio has not been commissioned in response to forward planning or locating services in an optimum position but rather reflects a legacy situation. In general, the majority of our depot buildings are in a poor condition (Grade C) and do not meet future service delivery needs. Whilst acknowledging that Local Authorities shared services models are progressing, depot rationalisation proposals remain a viable option. However it is highly likely that there will continue to be a need for local centres.
Capital Investment Team (CIT) and Asset Management are tasked with progressing
feasibility studies and an options appraisal to assess depot provision / rationalisation.
Technological Developments The Greenspace service in partnership with Public Sector Software (PSS) has developed an electronic playground inspection system (Playsafe) that will streamline this process and allow more time for inspections. Playsafe will allow for real time live reporting of issues and will replace an outdated paper based system. The current Roads costing system is no longer fit for purpose. It requires development to reflect changing demands (e.g. Minor Civils/Shared Services) and reflect service requirements.
In 2018/19, we will review, revise and upgrade the current roads costing system to ensure that it is fit for purpose, enabling a more economical and efficient service delivery. It is anticipated that research, development and implementation will be completed in 2018/19.

19
Action Plan
The challenges and issues identified in the performance review and strategic assessment have informed Environment & Neighbourhood priorities for 2018/19. The management team has developed an action plan to address them, supported by a range of performance indicators to enable progress to be monitored and reported to stakeholders. This is set out at Appendix 2.
In accordance with the current Performance Management Framework, progress will be monitored and managed on a regular basis by the Environment & Neighbourhood management team and reported twice yearly to IRED Committee, at mid-year and year end.
20
5 Corporate Information Staff Absence
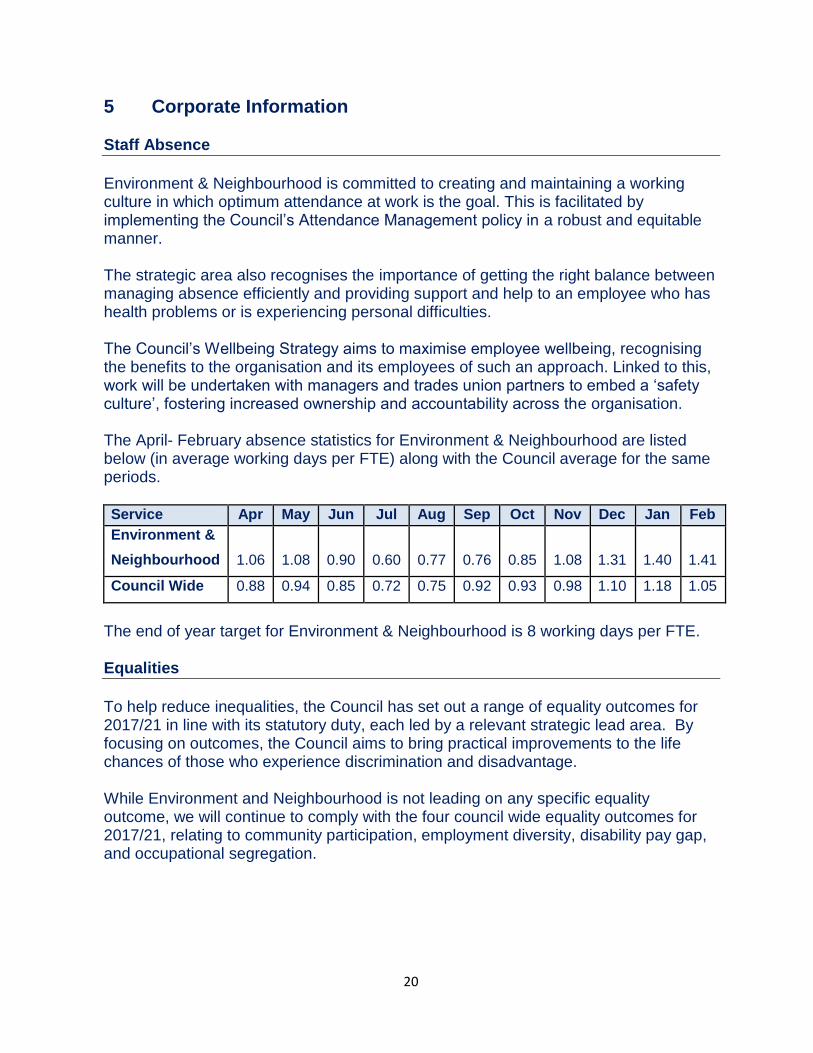
Environment & Neighbourhood is committed to creating and maintaining a working culture in which optimum attendance at work is the goal. This is facilitated by implementing the Council’s Attendance Management policy in a robust and equitable manner. The strategic area also recognises the importance of getting the right balance between managing absence efficiently and providing support and help to an employee who has health problems or is experiencing personal difficulties. The Council’s Wellbeing Strategy aims to maximise employee wellbeing, recognising the benefits to the organisation and its employees of such an approach. Linked to this, work will be undertaken with managers and trades union partners to embed a ‘safety culture’, fostering increased ownership and accountability across the organisation. The April- February absence statistics for Environment & Neighbourhood are listed below (in average working days per FTE) along with the Council average for the same periods. Service Apr May Jun Jul Aug Sep Oct Nov Dec Jan Feb
Environment &
Neighbourhood 1.06 1.08 0.90 0.60 0.77 0.76 0.85 1.08 1.31 1.40 1.41
Council Wide 0.88 0.94 0.85 0.72 0.75 0.92 0.93 0.98 1.10 1.18 1.05
The end of year target for Environment & Neighbourhood is 8 working days per FTE. Equalities
To help reduce inequalities, the Council has set out a range of equality outcomes for 2017/21 in line with its statutory duty, each led by a relevant strategic lead area. By focusing on outcomes, the Council aims to bring practical improvements to the life chances of those who experience discrimination and disadvantage. While Environment and Neighbourhood is not leading on any specific equality outcome, we will continue to comply with the four council wide equality outcomes for 2017/21, relating to community participation, employment diversity, disability pay gap, and occupational segregation.
21
6 Resources
Financial
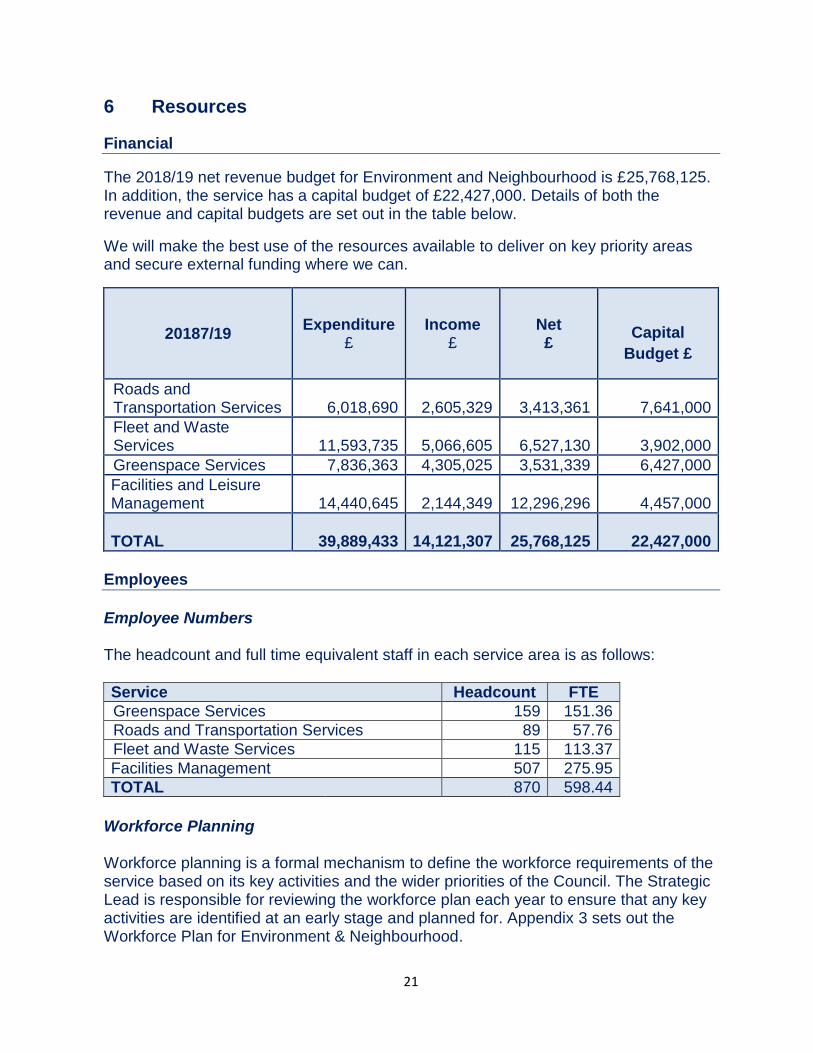
The 2018/19 net revenue budget for Environment and Neighbourhood is £25,768,125. In addition, the service has a capital budget of £22,427,000. Details of both the revenue and capital budgets are set out in the table below.
We will make the best use of the resources available to deliver on key priority areas and secure external funding where we can.
20187/19 Expenditure
£ Income
£ Net £
Capital
Budget £
Roads and Transportation Services 6,018,690 2,605,329 3,413,361 7,641,000
Fleet and Waste Services 11,593,735 5,066,605 6,527,130 3,902,000
Greenspace Services 7,836,363 4,305,025 3,531,339 6,427,000
Facilities and Leisure Management 14,440,645 2,144,349 12,296,296 4,457,000
TOTAL 39,889,433 14,121,307 25,768,125 22,427,000
Employees
Employee Numbers The headcount and full time equivalent staff in each service area is as follows:
Service Headcount FTE
Greenspace Services 159 151.36
Roads and Transportation Services 89 57.76
Fleet and Waste Services 115 113.37
Facilities Management 507 275.95
TOTAL 870 598.44
Workforce Planning Workforce planning is a formal mechanism to define the workforce requirements of the service based on its key activities and the wider priorities of the Council. The Strategic Lead is responsible for reviewing the workforce plan each year to ensure that any key activities are identified at an early stage and planned for. Appendix 3 sets out the Workforce Plan for Environment & Neighbourhood.
22
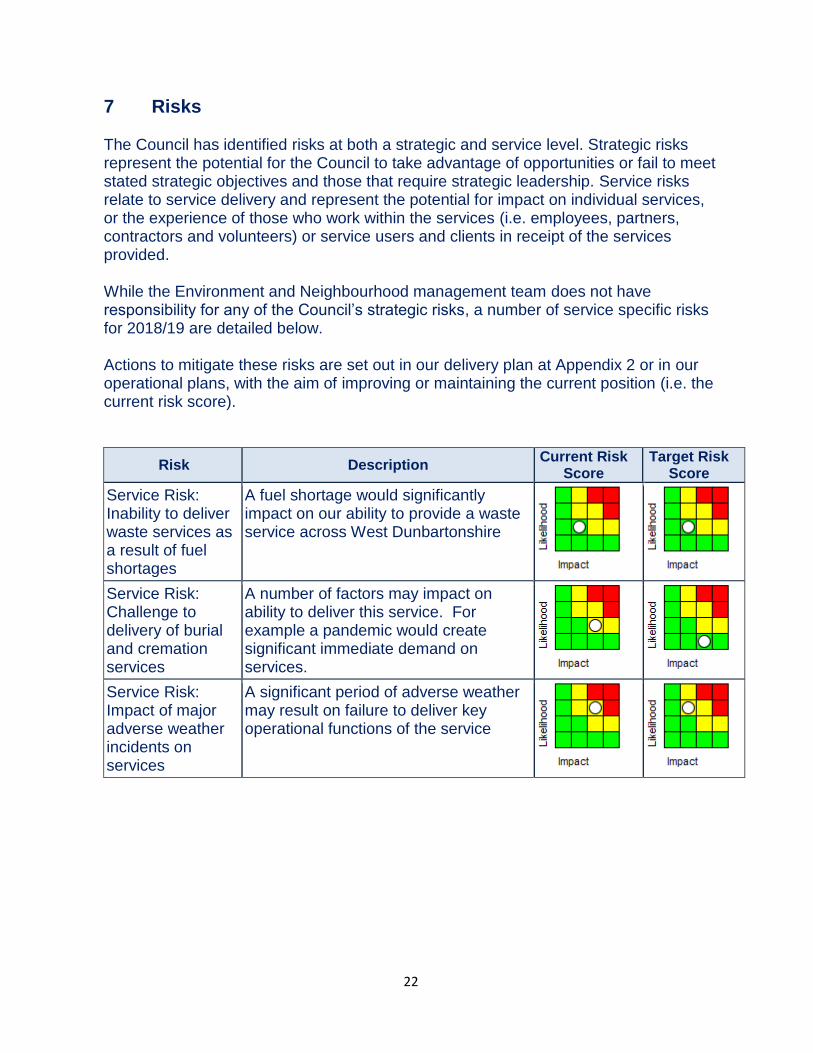
7 Risks The Council has identified risks at both a strategic and service level. Strategic risks represent the potential for the Council to take advantage of opportunities or fail to meet stated strategic objectives and those that require strategic leadership. Service risks relate to service delivery and represent the potential for impact on individual services, or the experience of those who work within the services (i.e. employees, partners, contractors and volunteers) or service users and clients in receipt of the services provided. While the Environment and Neighbourhood management team does not have responsibility for any of the Council’s strategic risks, a number of service specific risks for 2018/19 are detailed below. Actions to mitigate these risks are set out in our delivery plan at Appendix 2 or in our operational plans, with the aim of improving or maintaining the current position (i.e. the current risk score).
Risk Description Current Risk
Score Target Risk
Score
Service Risk: Inability to deliver waste services as a result of fuel shortages
A fuel shortage would significantly impact on our ability to provide a waste service across West Dunbartonshire
Service Risk: Challenge to delivery of burial and cremation services
A number of factors may impact on ability to deliver this service. For example a pandemic would create significant immediate demand on services.
Service Risk: Impact of major adverse weather incidents on services
A significant period of adverse weather may result on failure to deliver key operational functions of the service
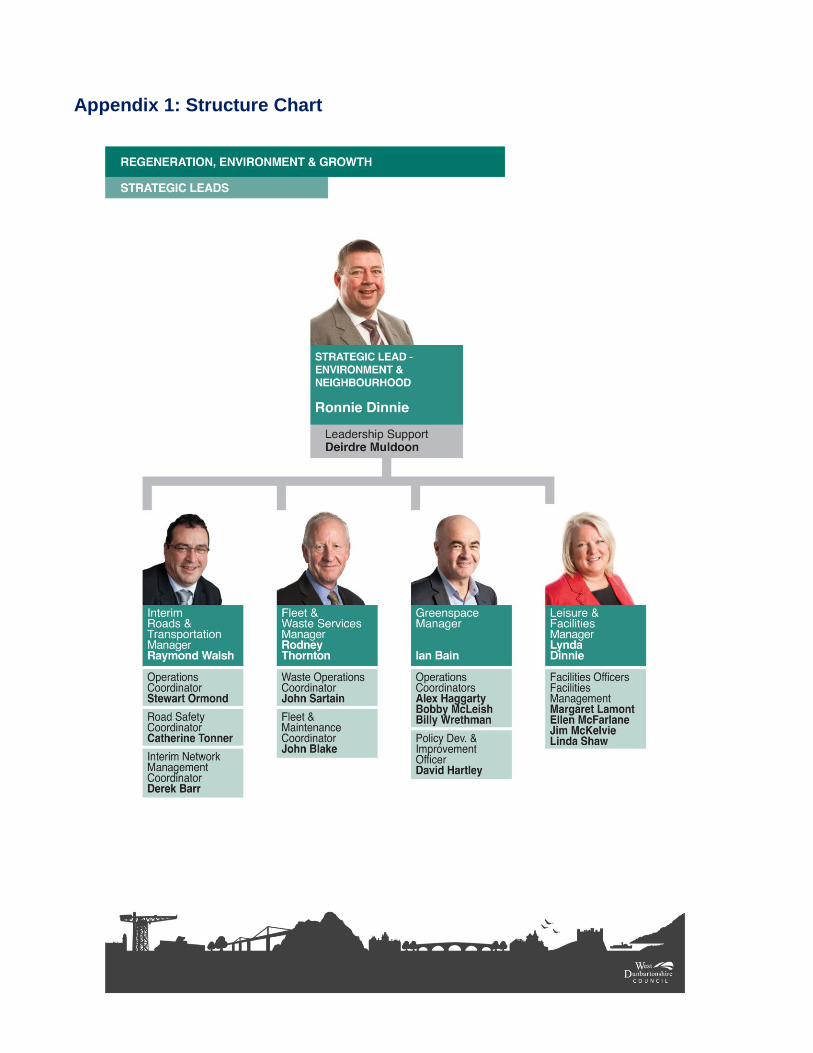
Appendix 1: Structure Chart
24
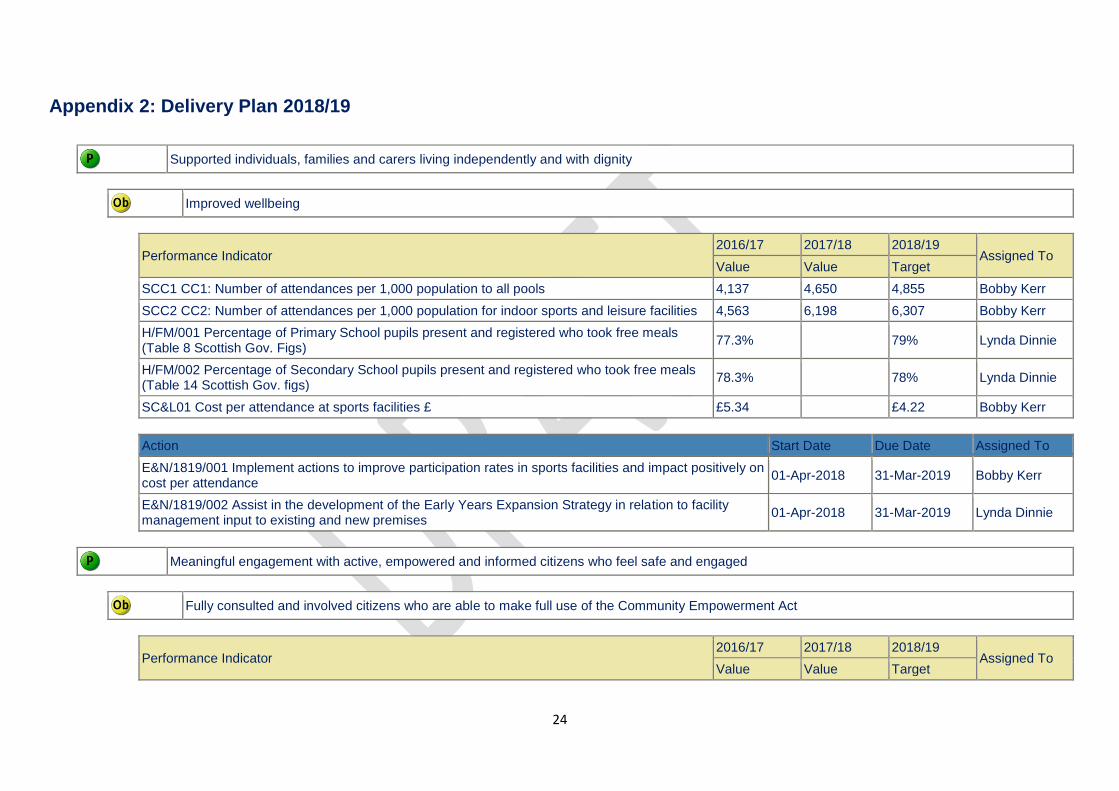
Appendix 2: Delivery Plan 2018/19
Supported individuals, families and carers living independently and with dignity
Improved wellbeing
Performance Indicator
2016/17 2017/18 2018/19 Assigned To
Value Value Target
SCC1 CC1: Number of attendances per 1,000 population to all pools 4,137 4,650 4,855 Bobby Kerr
SCC2 CC2: Number of attendances per 1,000 population for indoor sports and leisure facilities 4,563 6,198 6,307 Bobby Kerr
H/FM/001 Percentage of Primary School pupils present and registered who took free meals (Table 8 Scottish Gov. Figs)
77.3% 79% Lynda Dinnie
H/FM/002 Percentage of Secondary School pupils present and registered who took free meals (Table 14 Scottish Gov. figs)
78.3% 78% Lynda Dinnie
SC&L01 Cost per attendance at sports facilities £ £5.34 £4.22 Bobby Kerr
Action Start Date Due Date Assigned To
E&N/1819/001 Implement actions to improve participation rates in sports facilities and impact positively on cost per attendance
01-Apr-2018 31-Mar-2019 Bobby Kerr
E&N/1819/002 Assist in the development of the Early Years Expansion Strategy in relation to facility management input to existing and new premises
01-Apr-2018 31-Mar-2019 Lynda Dinnie
Meaningful engagement with active, empowered and informed citizens who feel safe and engaged
Fully consulted and involved citizens who are able to make full use of the Community Empowerment Act
Performance Indicator
2016/17 2017/18 2018/19 Assigned To
Value Value Target
25
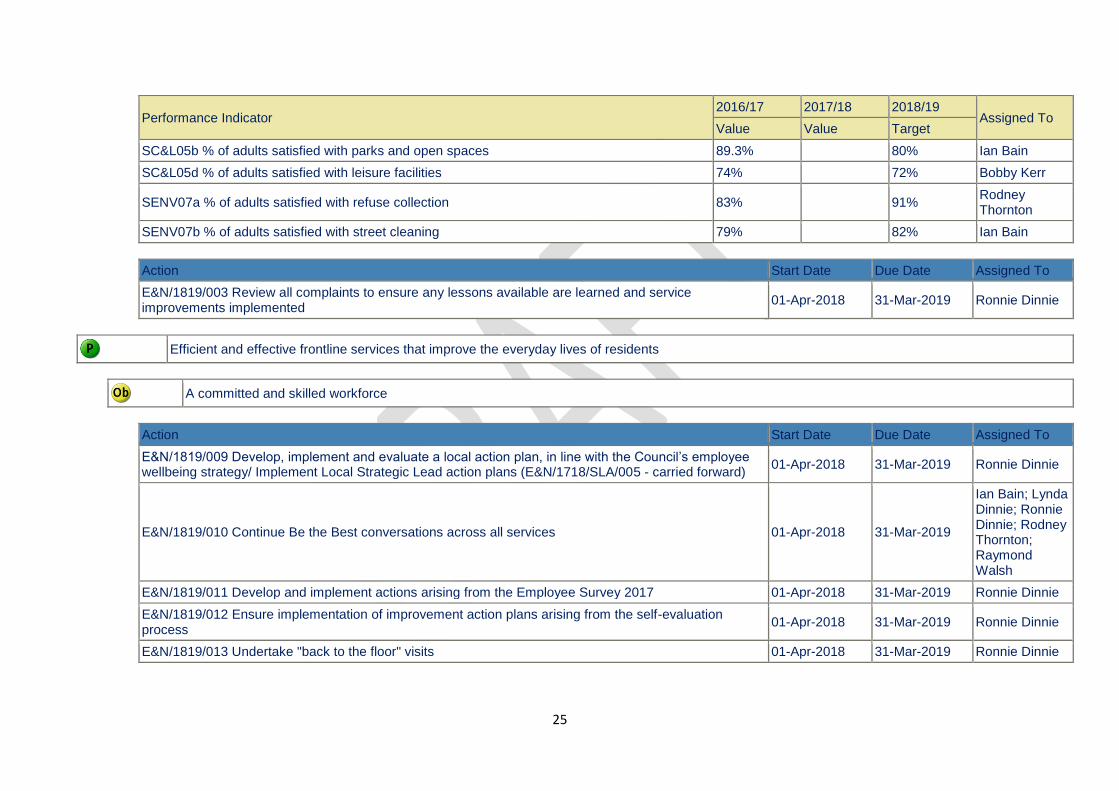
Performance Indicator
2016/17 2017/18 2018/19 Assigned To
Value Value Target
SC&L05b % of adults satisfied with parks and open spaces 89.3% 80% Ian Bain
SC&L05d % of adults satisfied with leisure facilities 74% 72% Bobby Kerr
SENV07a % of adults satisfied with refuse collection 83% 91% Rodney Thornton
SENV07b % of adults satisfied with street cleaning 79% 82% Ian Bain
Action Start Date Due Date Assigned To
E&N/1819/003 Review all complaints to ensure any lessons available are learned and service improvements implemented
01-Apr-2018 31-Mar-2019 Ronnie Dinnie
Efficient and effective frontline services that improve the everyday lives of residents
A committed and skilled workforce
Action Start Date Due Date Assigned To
E&N/1819/009 Develop, implement and evaluate a local action plan, in line with the Council’s employee wellbeing strategy/ Implement Local Strategic Lead action plans (E&N/1718/SLA/005 - carried forward)
01-Apr-2018 31-Mar-2019 Ronnie Dinnie
E&N/1819/010 Continue Be the Best conversations across all services 01-Apr-2018 31-Mar-2019
Ian Bain; Lynda Dinnie; Ronnie Dinnie; Rodney Thornton; Raymond Walsh
E&N/1819/011 Develop and implement actions arising from the Employee Survey 2017 01-Apr-2018 31-Mar-2019 Ronnie Dinnie
E&N/1819/012 Ensure implementation of improvement action plans arising from the self-evaluation process
01-Apr-2018 31-Mar-2019 Ronnie Dinnie
E&N/1819/013 Undertake "back to the floor" visits 01-Apr-2018 31-Mar-2019 Ronnie Dinnie
26
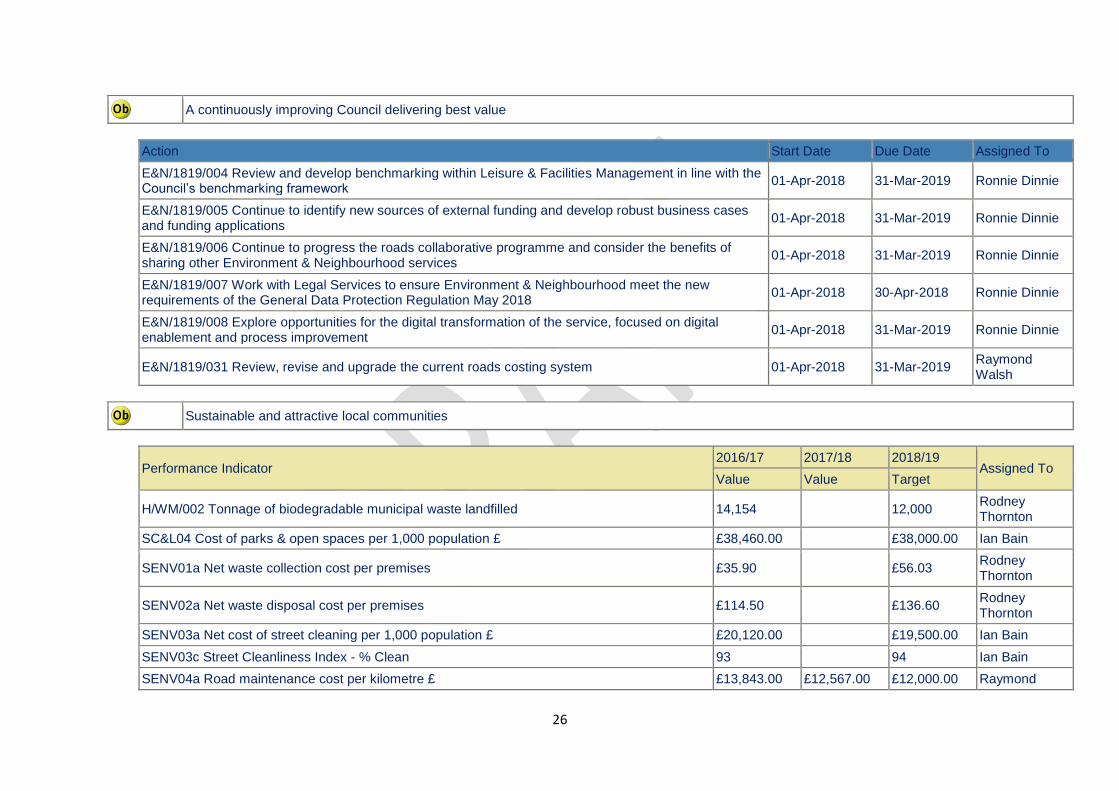
A continuously improving Council delivering best value
Action Start Date Due Date Assigned To
E&N/1819/004 Review and develop benchmarking within Leisure & Facilities Management in line with the Council’s benchmarking framework
01-Apr-2018 31-Mar-2019 Ronnie Dinnie
E&N/1819/005 Continue to identify new sources of external funding and develop robust business cases and funding applications
01-Apr-2018 31-Mar-2019 Ronnie Dinnie
E&N/1819/006 Continue to progress the roads collaborative programme and consider the benefits of sharing other Environment & Neighbourhood services
01-Apr-2018 31-Mar-2019 Ronnie Dinnie
E&N/1819/007 Work with Legal Services to ensure Environment & Neighbourhood meet the new requirements of the General Data Protection Regulation May 2018
01-Apr-2018 30-Apr-2018 Ronnie Dinnie
E&N/1819/008 Explore opportunities for the digital transformation of the service, focused on digital enablement and process improvement
01-Apr-2018 31-Mar-2019 Ronnie Dinnie
E&N/1819/031 Review, revise and upgrade the current roads costing system 01-Apr-2018 31-Mar-2019 Raymond Walsh
Sustainable and attractive local communities
Performance Indicator
2016/17 2017/18 2018/19 Assigned To
Value Value Target
H/WM/002 Tonnage of biodegradable municipal waste landfilled 14,154 12,000 Rodney Thornton
SC&L04 Cost of parks & open spaces per 1,000 population £ £38,460.00 £38,000.00 Ian Bain
SENV01a Net waste collection cost per premises £35.90 £56.03 Rodney Thornton
SENV02a Net waste disposal cost per premises £114.50 £136.60 Rodney Thornton
SENV03a Net cost of street cleaning per 1,000 population £ £20,120.00 £19,500.00 Ian Bain
SENV03c Street Cleanliness Index - % Clean 93 94 Ian Bain
SENV04a Road maintenance cost per kilometre £ £13,843.00 £12,567.00 £12,000.00 Raymond
27
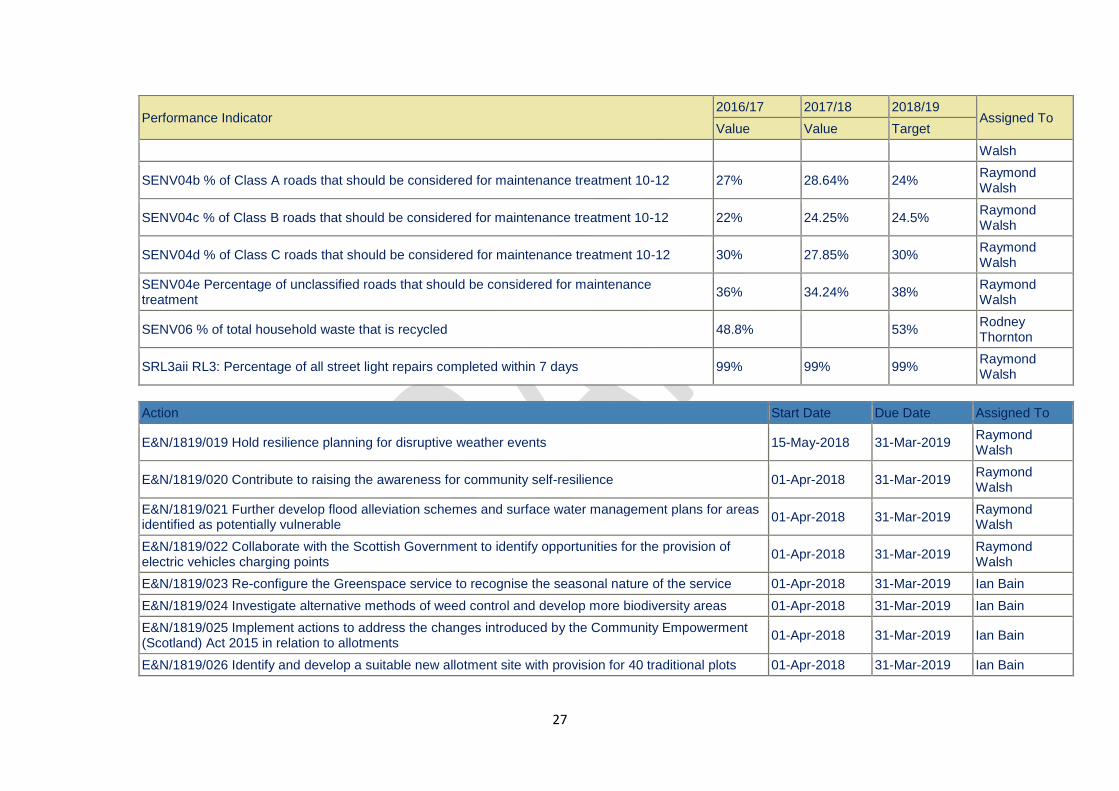
Performance Indicator
2016/17 2017/18 2018/19 Assigned To
Value Value Target
Walsh
SENV04b % of Class A roads that should be considered for maintenance treatment 10-12 27% 28.64% 24% Raymond Walsh
SENV04c % of Class B roads that should be considered for maintenance treatment 10-12 22% 24.25% 24.5% Raymond Walsh
SENV04d % of Class C roads that should be considered for maintenance treatment 10-12 30% 27.85% 30% Raymond Walsh
SENV04e Percentage of unclassified roads that should be considered for maintenance treatment
36% 34.24% 38% Raymond Walsh
SENV06 % of total household waste that is recycled 48.8% 53% Rodney Thornton
SRL3aii RL3: Percentage of all street light repairs completed within 7 days 99% 99% 99% Raymond Walsh
Action Start Date Due Date Assigned To
E&N/1819/019 Hold resilience planning for disruptive weather events 15-May-2018 31-Mar-2019 Raymond Walsh
E&N/1819/020 Contribute to raising the awareness for community self-resilience 01-Apr-2018 31-Mar-2019 Raymond Walsh
E&N/1819/021 Further develop flood alleviation schemes and surface water management plans for areas identified as potentially vulnerable
01-Apr-2018 31-Mar-2019 Raymond Walsh
E&N/1819/022 Collaborate with the Scottish Government to identify opportunities for the provision of electric vehicles charging points
01-Apr-2018 31-Mar-2019 Raymond Walsh
E&N/1819/023 Re-configure the Greenspace service to recognise the seasonal nature of the service 01-Apr-2018 31-Mar-2019 Ian Bain
E&N/1819/024 Investigate alternative methods of weed control and develop more biodiversity areas 01-Apr-2018 31-Mar-2019 Ian Bain
E&N/1819/025 Implement actions to address the changes introduced by the Community Empowerment (Scotland) Act 2015 in relation to allotments
01-Apr-2018 31-Mar-2019 Ian Bain
E&N/1819/026 Identify and develop a suitable new allotment site with provision for 40 traditional plots 01-Apr-2018 31-Mar-2019 Ian Bain
28
Action Start Date Due Date Assigned To
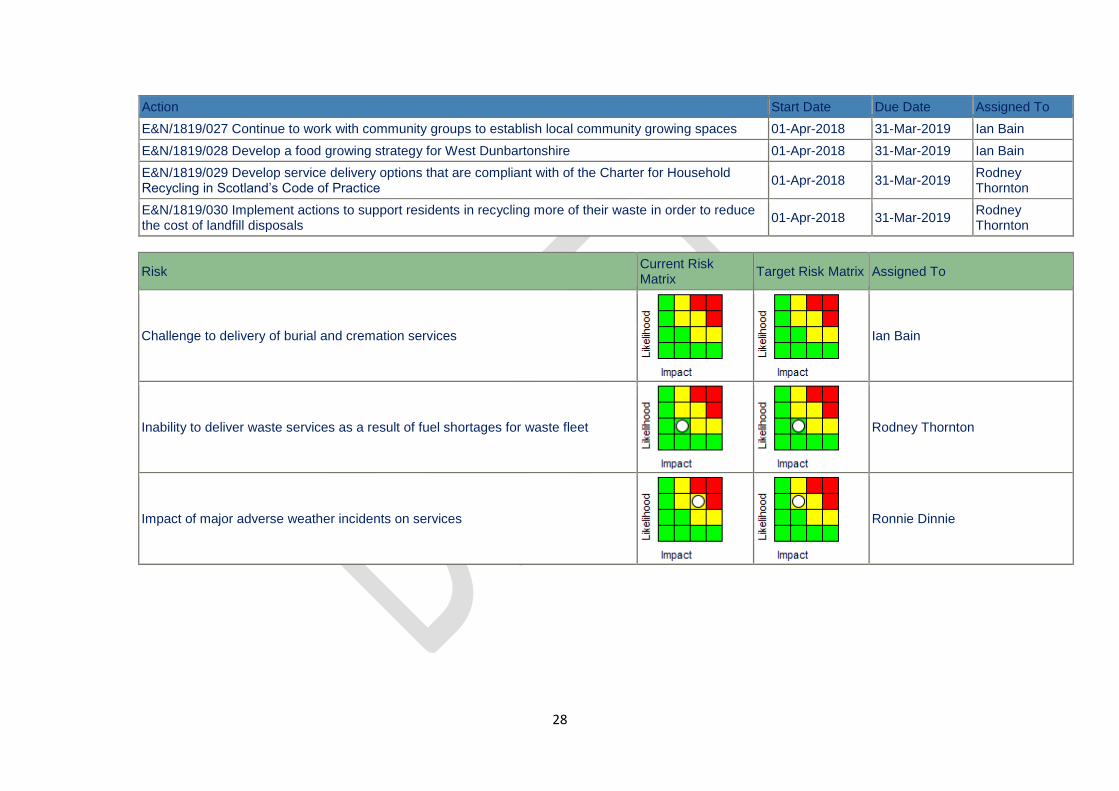
E&N/1819/027 Continue to work with community groups to establish local community growing spaces 01-Apr-2018 31-Mar-2019 Ian Bain
E&N/1819/028 Develop a food growing strategy for West Dunbartonshire 01-Apr-2018 31-Mar-2019 Ian Bain
E&N/1819/029 Develop service delivery options that are compliant with of the Charter for Household Recycling in Scotland’s Code of Practice
01-Apr-2018 31-Mar-2019 Rodney Thornton
E&N/1819/030 Implement actions to support residents in recycling more of their waste in order to reduce the cost of landfill disposals
01-Apr-2018 31-Mar-2019 Rodney Thornton
Risk Current Risk Matrix
Target Risk Matrix Assigned To
Challenge to delivery of burial and cremation services
Ian Bain
Inability to deliver waste services as a result of fuel shortages for waste fleet
Rodney Thornton
Impact of major adverse weather incidents on services
Ronnie Dinnie
29
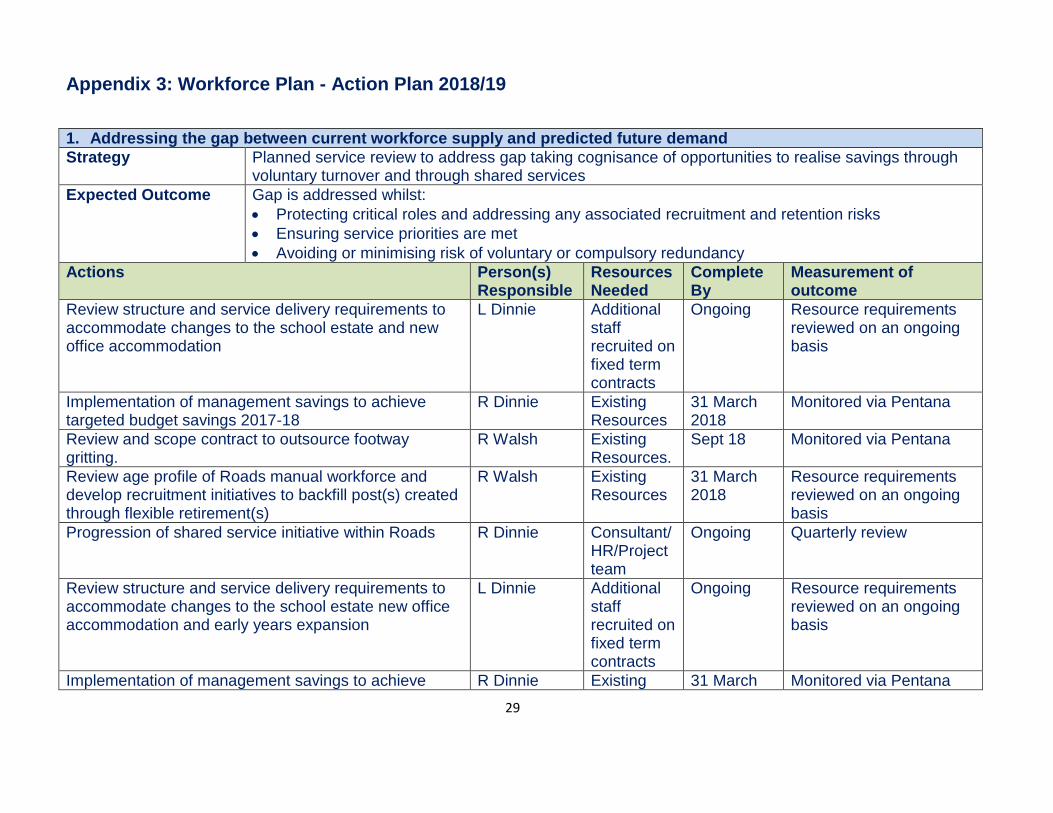
Appendix 3: Workforce Plan - Action Plan 2018/19
1. Addressing the gap between current workforce supply and predicted future demand
Strategy Planned service review to address gap taking cognisance of opportunities to realise savings through voluntary turnover and through shared services
Expected Outcome
Gap is addressed whilst:
Protecting critical roles and addressing any associated recruitment and retention risks
Ensuring service priorities are met
Avoiding or minimising risk of voluntary or compulsory redundancy
Actions Person(s) Responsible
Resources Needed
Complete By
Measurement of outcome
Review structure and service delivery requirements to accommodate changes to the school estate and new office accommodation
L Dinnie Additional staff recruited on fixed term contracts
Ongoing Resource requirements reviewed on an ongoing basis
Implementation of management savings to achieve targeted budget savings 2017-18
R Dinnie Existing Resources
31 March 2018
Monitored via Pentana
Review and scope contract to outsource footway gritting.
R Walsh Existing Resources.
Sept 18 Monitored via Pentana
Review age profile of Roads manual workforce and develop recruitment initiatives to backfill post(s) created through flexible retirement(s)
R Walsh Existing Resources
31 March 2018
Resource requirements reviewed on an ongoing basis
Progression of shared service initiative within Roads R Dinnie Consultant/HR/Project team
Ongoing Quarterly review
Review structure and service delivery requirements to accommodate changes to the school estate new office accommodation and early years expansion
L Dinnie Additional staff recruited on fixed term contracts
Ongoing Resource requirements reviewed on an ongoing basis
Implementation of management savings to achieve R Dinnie Existing 31 March Monitored via Pentana
30
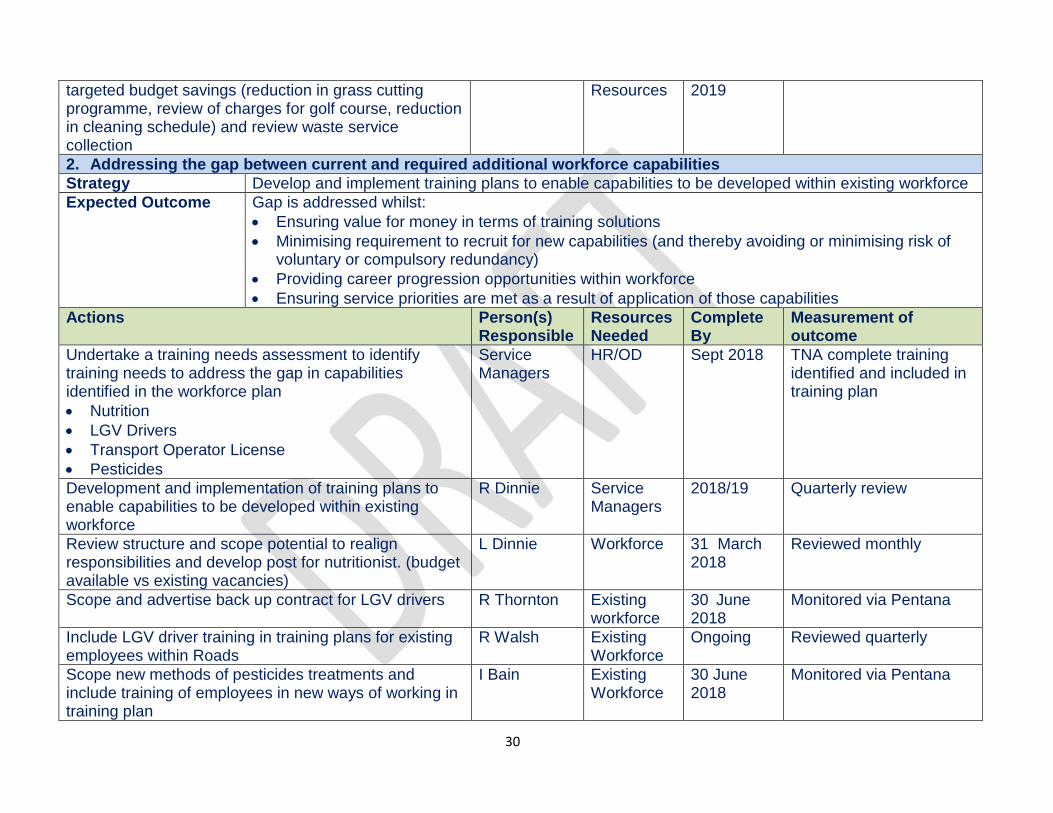
targeted budget savings (reduction in grass cutting programme, review of charges for golf course, reduction in cleaning schedule) and review waste service collection
Resources 2019
2. Addressing the gap between current and required additional workforce capabilities
Strategy Develop and implement training plans to enable capabilities to be developed within existing workforce
Expected Outcome Gap is addressed whilst:
Ensuring value for money in terms of training solutions
Minimising requirement to recruit for new capabilities (and thereby avoiding or minimising risk of voluntary or compulsory redundancy)
Providing career progression opportunities within workforce
Ensuring service priorities are met as a result of application of those capabilities
Actions Person(s) Responsible
Resources Needed
Complete By
Measurement of outcome
Undertake a training needs assessment to identify training needs to address the gap in capabilities identified in the workforce plan
Nutrition
LGV Drivers
Transport Operator License
Pesticides
Service Managers
HR/OD Sept 2018 TNA complete training identified and included in training plan
Development and implementation of training plans to enable capabilities to be developed within existing workforce
R Dinnie Service Managers
2018/19 Quarterly review
Review structure and scope potential to realign responsibilities and develop post for nutritionist. (budget available vs existing vacancies)
L Dinnie Workforce 31 March 2018
Reviewed monthly
Scope and advertise back up contract for LGV drivers R Thornton Existing workforce
30 June 2018
Monitored via Pentana
Include LGV driver training in training plans for existing employees within Roads
R Walsh Existing Workforce
Ongoing Reviewed quarterly
Scope new methods of pesticides treatments and include training of employees in new ways of working in training plan
I Bain Existing Workforce
30 June 2018
Monitored via Pentana
31
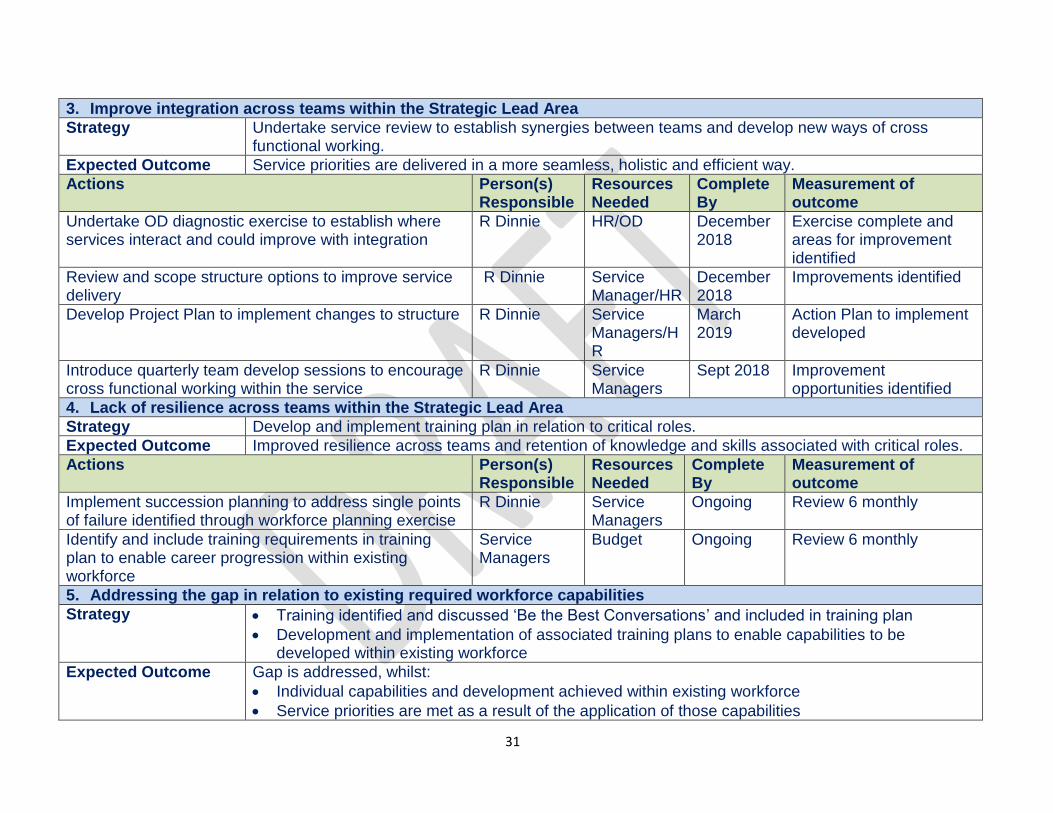
3. Improve integration across teams within the Strategic Lead Area
Strategy Undertake service review to establish synergies between teams and develop new ways of cross functional working.
Expected Outcome Service priorities are delivered in a more seamless, holistic and efficient way.
Actions Person(s) Responsible
Resources Needed
Complete By
Measurement of outcome
Undertake OD diagnostic exercise to establish where services interact and could improve with integration
R Dinnie HR/OD December 2018
Exercise complete and areas for improvement identified
Review and scope structure options to improve service delivery
R Dinnie Service Manager/HR
December 2018
Improvements identified
Develop Project Plan to implement changes to structure R Dinnie Service Managers/HR
March 2019
Action Plan to implement developed
Introduce quarterly team develop sessions to encourage cross functional working within the service
R Dinnie Service Managers
Sept 2018 Improvement opportunities identified
4. Lack of resilience across teams within the Strategic Lead Area
Strategy Develop and implement training plan in relation to critical roles.
Expected Outcome Improved resilience across teams and retention of knowledge and skills associated with critical roles.
Actions Person(s) Responsible
Resources Needed
Complete By
Measurement of outcome
Implement succession planning to address single points of failure identified through workforce planning exercise
R Dinnie Service Managers
Ongoing Review 6 monthly
Identify and include training requirements in training plan to enable career progression within existing workforce
Service Managers
Budget Ongoing Review 6 monthly
5. Addressing the gap in relation to existing required workforce capabilities
Strategy Training identified and discussed ‘Be the Best Conversations’ and included in training plan
Development and implementation of associated training plans to enable capabilities to be developed within existing workforce
Expected Outcome Gap is addressed, whilst:
Individual capabilities and development achieved within existing workforce
Service priorities are met as a result of the application of those capabilities
32
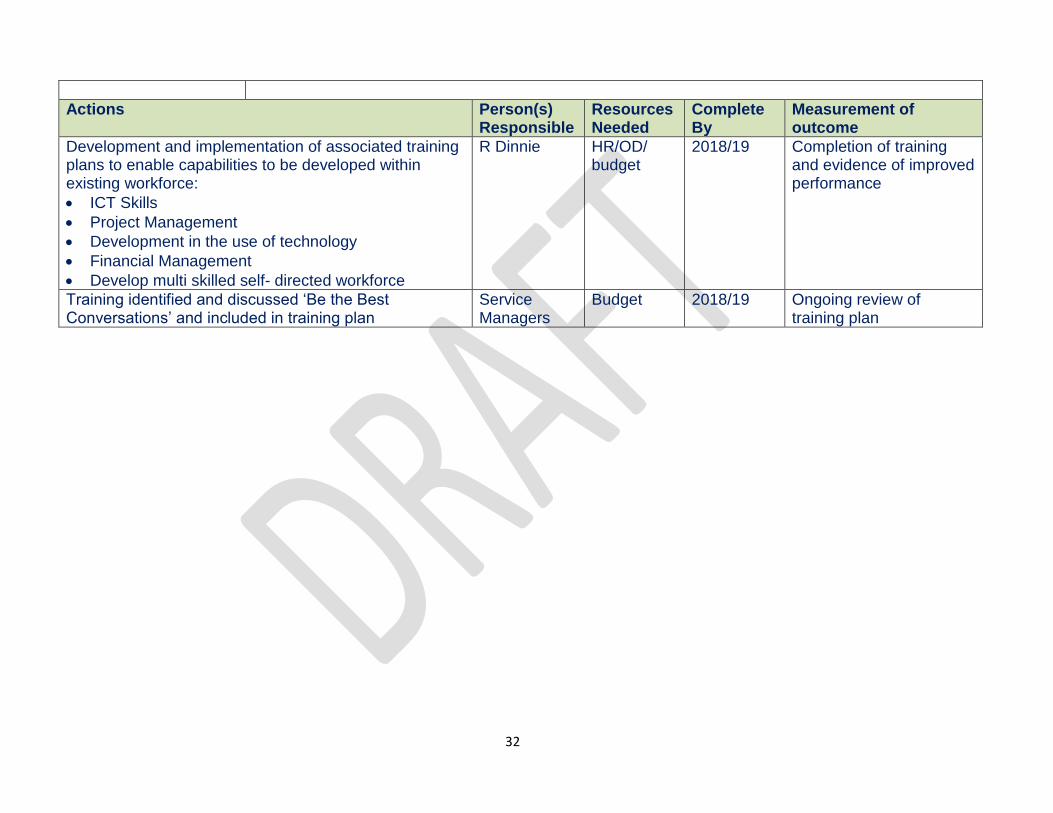
Actions Person(s) Responsible
Resources Needed
Complete By
Measurement of outcome
Development and implementation of associated training plans to enable capabilities to be developed within existing workforce:
ICT Skills
Project Management
Development in the use of technology
Financial Management
Develop multi skilled self- directed workforce
R Dinnie HR/OD/ budget
2018/19 Completion of training and evidence of improved performance
Training identified and discussed ‘Be the Best Conversations’ and included in training plan
Service Managers
Budget 2018/19 Ongoing review of training plan