Embed Size (px)
Citation preview
1
HOUSING AND INDEPENDENT LIVING
ENVIRONMENTAL AND BUILT FACTORS FOR MAINTAINING INDEPENDENCE IN OLDER AGE
Report to
Ageing Disability and Home Care, Department of Human Services.
March 2011
2
HOUSING AND INDEPENDENT LIVING ENVIRONMENTAL AND BUILT FACTORS FOR
MAINTAINING INDEPENDENCE IN OLDER AGE
HAIL Investigators:
Julie Byles, Lynette MacKenzie, Sally Redman, Anna Williamson, Lynne Parkinson
HAIL Team:
Jennifer Byrne, Elodie Sprenger, Lucy Gallienne, Alison Cowle
HAIL Staff:
Ms Gillian Cronk and Ms Lauren Frohlich - HAIL assessors, Bankstown area
Ms Kate O'Flynn and Mr Alasdair Grant - HAIL assessors, Sutherland area
Ms Helen Driscoll and Ms Tilly Jones - HAIL assessors, Mosman area
Ms Bronwyn Kaspura and Ms Sara Middlebrook - HAIL assessors, Woollahra area
Ms Claire Boyle and Ms Ellie Gresham - HAIL assessors, Ku-ring-gai area
Ms Georgie Moore and Ms Amy Jongerden - HAIL assessors, Hunters Hill area
Ms Gemma Courtney, Ms Caitlin West - HAIL Assessors, Wyong area.
This research has been undertaken with assistance from Ageing, Disability and Home Care (ADHC) in the Department of Human Services. However the information and views contained in this study do not necessarily, or at all, reflect the views or information held by ADHC, the NSW Government or the Minister for Ageing, Minister for Disability Services.
March 2011

3
CONTENTS Page No.
Acknowledgements 4
Abbreviations 5
Main Messages 6
Executive Summary 8
Introduction 12
Approach 14
Measures 15
Participants 17
Findings: 19
How do older people perceive their housing and neighbourhoods in terms of accessibility, usability and safety?
19
Are levels of housing for people in NSW likely to support independence in older age? 26
Which groups of people are likely to be most disadvantaged by having homes that are less supportive in terms of accessibility, usability and safety?
33
What are people’s expectations of their housing needs as they age and how will these needs be met?
36
Implications and concluding comments 40
References 42

4
ACKNOWLEDGEMENTS
This research was undertaken by researchers from the University of Newcastle, the University of Sydney and the Sax Institute.
This report was produced by Professor Julie Byles, Dr Lynette MacKenzie, Professor Sally Redman, Dr Anna Williamson, and Assoc. Professor Lynne Parkinson.
Statistical analyses were undertaken by Ms Lucy Gallienne and editorial input was provided by Ms Jennifer Byrne and Ms Alison Cowle.
The project is funded by the Ageing Disability and Home Care, NSW Department of Human Services.
HAIL investigators would like to thank all HAIL Staff who conducted the home visits.
Researchers would also like to sincerely thank the men and women of the 45 and Up Study who consented to participate in the HAIL project and who allowed assessors to visit them in their home. We are grateful for their graciousness and willingness to provide information relevant to the HAIL project.
Professor Julie Byles Director, Priority Research Centre for Gender, Health and Ageing (PRCGHA) The University of Newcastle Dr Lynette MacKenzie Faculty of Health The University of Sydney Professor Sally Redman Director, The Sax Institute Sydney Dr Anna Williamson The Sax Institute Sydney Assoc. Professor Lynne Parkinson Priority Research Centre for Gender, Health and Ageing (PRCGHA) The University of Newcastle

5
ABBREVIATIONS
ABS Australian Bureau of Statistics
ADHC Ageing Disability and Home Care
ALSWH Australian Longitudinal Study on Women’s Health
AS 4299 Australian Design for Access and Mobility Standard AS 4299 (Adaptable Housing)
AUDIT Active Neighbourhood Checklist (AUDIT)
BMI Body Mass Index
ENABLE-AGE The Enabling, Autonomy, Participation, and Well-Being in Old Age: The Home Environment as a Determinant for Healthy Ageing Project
HAIL Home and Independent Living
HOME FAST Home Falls and Accidents Screening Tool
HOOP Housing Options for Older People
IADL Instrumental Activities of Daily Living
ICF International Classification of Functioning, Disability and Health
IQR Interquartile range
LLFDI Late Life Function and Disability Instrument
LGA Local Government Area
MH Mental Health
MMSE Mini Mental State Examination
NEWS Neighbourhood Environmental Walkability Scale
PASE Physical Activity Scale for the Elderly
PRCGHA Priority Research Centre for Gender, Health and Ageing
SD Standard Deviation
SF-36 Short Form 36 item Health Survey
SPPB Short Physical Performance Battery
TDF Late Life Function Disability Index - Total Dimension Frequency
TDL Late Life Function Disability Index - Total Dimension Limitation
TUG Timed Up and Go
WHO World Health Organization

6
MAIN MESSAGES
The Housing and Independent Living (HAIL) project provides a detailed snapshot of the homes and neighbourhoods of a sample of older people living in selected metropolitan areas, including observation of their homes and physical functioning. HAIL participants have lived in their homes for many years, and most expect to continue living in their homes for some time to come. The findings of this project show that while the participants themselves rated their homes highly in terms of usability and accessibility, the homes did not comply with many features of the Australian Standard AS 4299 (adaptable housing)1
The results suggest that policies and systems are needed so these homes can be appropriately modified and adapted according to current standards. These might include information services and education, incentives for people to build and modify homes appropriately, and services to help people access appropriate tradespeople. There appears to be a need for education for older people, especially those entering retirement or considering home modification, down-sizing, or moving to a new area. This information should include advice about what to look for in supportive housing for older age. User friendly self-assessment and rating systems may also help, such as a star rating system for houses and neighbourhoods, or a self-assessment checklist.
and may not be suitable for people as they age and develop increasing physical disability. Also, many homes had high levels of hazards that would indicate falls risk, and people with highest levels of disability had the greatest level of risk. There appears to be a mismatch between what participants want and expect from their homes and what they may need to support them in their older age.
For new individual residential buildings, government and council organisations need to work together to ensure that development applications accommodate at least the essential aspects of the AS 4299 recommendations.
Policies are needed to encourage the market, including the private sector and local government, to develop housing products to meet future needs.
Bathrooms are a particular area in need of attention, with many not having adequate levels of access or safety. A focus on bathroom design and modification could be included in education to consumers, suppliers, and legislators.
The high prevalence of home hazards that increase falls risk points to the importance of the home environment in falls prevention strategies. Likewise, associations between higher levels of disability and more home hazards identify those with disability as a particular target group for falls prevention.
It is also worth noting that people living in apartments were least likely to rate their homes highly in terms of usability. Further investigation of the appropriateness of the stock of apartments for older people would be useful, particularly since this is a favoured option for many people who chose to move to a smaller dwelling as they grow older.
Cooling of housing is a potential issue for older people, even for those with air conditioning.
While most of the neighbourhoods included in the HAIL project rated highly on both subjective and objective measures, some features are worth further consideration. Parking was one area that was rated most poorly by participants. Access to hospitals, supermarkets, and fruit and vegetables are other important considerations in the development of age friendly communities. Although living in urban environments, a large proportion of HAIL participants reported they were more than 30 minutes from a hospital, and women and those who lived alone were more likely to be residing more than 30 minutes of a hospital. Also, while most people had access to a convenience store, access to supermarkets and fresh fruit and vegetables stores within convenient walking distance was limited for many participants.
People identified concerns about their ongoing ability to drive, particularly in neighbourhoods with increasing development and greater density. The impact of these changes on older people should be considered in

7
urban design and developments of public spaces such as shopping centres. Transport alternatives for older people, with consideration of safety and shelter, are also required.
Social connectedness was highly valued by older people and seen as important in maintaining them in their homes and neighbourhoods as they age. Strategies to enhance social networks as people age, and as their neighbourhoods develop, may be important for enabling people to remain in their own homes.

8
EXECUTIVE SUMMARY
The NSW Government’s ageing strategy Towards 2030: Planning for our Changing Population2, a whole of NSW Government strategy to actively plan for the ageing of the population, emphasises appropriate housing, community and proximity to services as central to people’s ability to maintain quality of life and continue living in their communities as they grow older. This report provides an overview of the findings of the Housing and Independent Living (HAIL) project, undertaken by researchers at the University of Newcastle, the University of Sydney and the SAX Institute, and funded by the Ageing Disability and Home Care, in the NSW Department of Human Services.
The HAIL project focused on environmental and built factors for maintaining independence in older age, by studying the homes and neighbourhoods of a sample of community dwelling older people. These people were randomly selected from among 45 and Up Study participants who were aged 75 to 79 years at the time of the HAIL project, and who were living in seven selected local government areas (LGAs) in the greater Sydney area. Selected LGAs were those with the greatest proportion of people aged 70 years or over. Regional and rural areas were not included in this study.
The main aims of the HAIL project were to:
Determine the extent to which home and neighbourhood environments can be considered to be “supportive” according to international measures;
To identify those people who are least likely to be currently living in more supportive environments; and
To contrast these findings against people’s expectations of their increasing needs as they age and of how these needs are to be met.
The main findings of the project are presented below.
How do older people perceive their housing and neighbourhoods in terms of accessibility, usability and safety?
For this project, we conceptualised “supportive” environments to be those that are well designed to enable people to continue to be independent in activities of daily living despite increasing levels of impairment or disability. The features of such environments include homes that are accessible, usable, and free from hazards, and neighbourhoods that are walkable, safe and accessible.
Participants in the HAIL project mostly felt that their houses and neighbourhoods rated highly on accessibility, usability and safety. Most people rated their homes as “very suitable” in terms of how well the home was designed to allow them to manage activities of daily living (such as dressing and toileting, cooking, cleaning, and washing clothes) and leisure activities (such as being alone, socialising with friends, hobbies, and relaxation). Aspects most likely to be rated as “very suitable” were whether the home was perceived to be well designed for dressing and toileting and for relaxing. The item least likely to be rated as “very suitable” was whether the home was well designed for washing clothes.
In terms of safety, most people felt completely secure in their homes, although women were more likely to feel more secure than men: 79% of women reported they felt completely secure compared with 64% of men.
The majority of people in the HAIL study described their neighbourhoods as convenient, familiar, and safe. They felt they were known by other people and help was available if required. People described their homes as a good base for their activities and a place where they can “live in peace of mind” for as long as they wish.
Measures of neighbourhood satisfaction were also high. A majority of people agreed that they have a lot in common with their neighbours, they trust their neighbours to look out for their property, and that they are good friends with people in their neighbourhood. These findings indicate that people in the HAIL study feel highly connected with others in their neighbourhood and that they perceive that their neighbours are supportive.

9
People also mostly thought children are safe walking around their neighbourhood by day, although people were less likely to say that it is safe to walk around their neighbourhood at night. People indicated that they were likely to see and speak to other people whilst walking in their neighbourhood, and felt that few physical barriers impeded neighbourhood walkability.
The area people were most likely to give a low ranking to was the availability and ease of parking.
In terms of proximity to shops and places of business, there was a large variability depending on the type of business. Closest businesses were convenience stores. Businesses which were furthest away were hardware stores, clothing stores, banks/credit unions, recreation centres, fitness facilities, libraries and book shops. Around 27% of people were within 10 minutes walk of a supermarket, but 40% had to walk at least 20 minutes to reach this type of shopping. Likewise, 36% of people were within 10 minutes walk of a fruit and vegetable market, but 35% of people had to walk at least 20 minutes.
Most participants (94%) said it would take them less than 30 minutes to get to their nearest general practitioner (GP) (assuming their usual mode of transport to this service). However, fewer participants were within 30 minutes of the nearest hospital. Men, and those who lived with their spouse, were more likely to say they lived within 30 minutes of the hospital (75% of men, and 65% of women indicated they were within 30 minutes of a hospital, and 76% of those who live with their spouse, compared with 53% of those who live alone reported they lived within 30 minutes of a hospital). Since women are more likely to live alone than men, they are particularly vulnerable to having to travel longer to a hospital. Women are also less likely to drive themselves as their main form of transport than men.
Are levels of housing for people in NSW likely to support independence in older age?
Many features relating to a continuous path of travel in the home, circulation space or the placement of fittings were not compliant, with only:
36% of dwellings having a level accessible entry;
19% having an entry door with at least 850mm clearance; and
16% having internal doors with 820mm clearance standards.
Most corridors did not meet the 1000mm minimum (42% met this standard). Also, the height of the sink, location of taps, and isolating switch on the cook top did not meet the standards in more than 60% of the homes assessed. Bathrooms were particularly non-compliant where:
96% of people did not have provision for a folding seat in the shower;
80% of people did not have a grab rail in the shower recess;
77% did not have a slip resistant floor surface; and
40% did not have an easy to reach shower tap.
Only 9% of people had provision for a grab rail near the toilet and only 24% of people had a slip resistant floor surface in the toilet.
Such results do not provide confidence that the homes of the HAIL participants would have the capacity to accommodate increased frailty or disability into the future. If wheelchair use or the use of walking aids were to become a necessity at some point, the width of doorways and corridors, the accessibility of switches, or the reach required to work in the kitchen may provide sufficient environmental barriers to participants remaining in their own homes. At the very least, such features would prevent participants with increased disability participating in many activities without significant help from a carer or paid assistant. Many of these household features could also affect the safety of older people with impaired mobility in their own homes, and may make them more vulnerable to falls and injury in the future (see HOME FAST3 results, from p.29).
Among the homes in the HAIL project, 27% scored eight or more out of the 25 possible hazards, and participants living in these homes were considered to be at high risk of falls due to hazards in the home. The

10
most common problems were not having non-slip floors (79%), non-slip mats (74%), loose mats (61%), shower or bath grab rails (62%), and difficulties identifying the edges of stairs (66%).
Most participants were living in neighbourhoods that were characterised by large single family homes, although half the participants lived in neighbourhoods with a mixture of single dwelling homes and apartments. A minority of participants (9%) lived in neighbourhoods that included mobile homes or caravans.
Most of the neighbourhoods included some sort of commercial destination such as a small grocery store, coffee shop or pharmacy.
These features are of importance to older people in terms of being able to maintain their independence in shopping, and in being able to access local places for social interaction.
Importantly, 96% of participants had some alternative means of transport within 400m of their home, indicating high levels of access to public transport.
Most participants lived in areas that included features that enable walking, such as footpaths and street shoulders. However, some negative traffic aspects were also recorded, including aggressive drivers and a lack of pedestrian crossings. These features are likely to pose a hazard for older pedestrians.
In terms of the social environment, most participants lived in areas that were well populated, with teenagers, children, and older adults visible in most areas. The findings also indicate a high level of positive social contact in the neighbourhood environment. Importantly, no surveys reported hostile behaviour. However, during the interviews some participants expressed concerns about other people in their neighbourhood, the loss of a sense of community and some concern over developments and increasing population density.
In the main, however, the findings indicate that the suburbs were mostly “age friendly” although distances to supermarkets and fruit and vegetable stalls may be a problem for some people. Some traffic concerns may also be a problem for older pedestrians.
Which groups of people are likely to be most disadvantaged by having homes that are less supportive in terms of accessibility, usability and safety?
We compared people who could be considered to be living in less supportive homes and neighbourhoods according to gender, transport options (whether people drive themselves or not), housing type (house/apartment/other), function (measured using the Late Life Function and Disability Instrument – LLFDI4), and health-related quality of life (using the Short Form 36 item Health Survey – SF-365; see page 16). Factors most consistently associated with less supportive homes and neighbourhoods were the physical function, mental health, and social function sub-scales of the SF-36 health-related quality of life measure, and limitations on the LLFDI. These results indicate that the homes are less supportive for people who have higher levels of disability, and suggest that the favourable perceptions of usability reported by most participants may attenuate as they age and if their functional capacity declines.
Home hazards were assessed using the Home Falls and Accidents Screening Tool (HOME FAST).3 A negative correlation between LLFDI scores and HOME FAST scores (where higher scores are worse) was found. This result indicates that the worse a person’s physical function is, the more home hazards they have, and that those with the greatest physical vulnerability also have the most home hazards.
Other findings were that drivers tend to rate their access to shops more poorly than non-drivers, but non-drivers had lower ratings on neighbourhood safety. The ability to drive is important for most older people, particularly those who live in areas where shops and services are not as closely located to their homes. On the other hand, those who walk to local shops and services may be more concerned about their safety.
Living in an apartment was associated with lower ratings on the usability scale in terms of activities of daily living, suggesting that the design of apartments may not be ideal for older people, particularly those with higher levels of disability.
11
Many people felt their housing needs would change in the next 10 years, but only one in five had plans to move at some time in the future. The majority of people had already made some changes to their home in the last five years, with most common changes being bathroom modifications, kitchen modifications and changes to garden and outdoor areas.
What are people’s expectations of their housing needs as they age and how these needs will be met?
The findings from the semi-structured interviews emphasise the importance of home and place to older people, and that many people do not plan to move as their needs change. While many people acknowledged the need to adapt as they age, few people had thought through what this would mean in terms of home modifications, and most did not have firm plans. People had thought about ramps and making some minor changes, but these considerations were not commensurate with the large number of standards that were seen to be lacking on the interviewers’ assessment against the Australian standards.
Interestingly, people seemed more likely to make changes to their own behaviour than to their environment, modifying and restricting their activities in keeping with their changing abilities. While some of these changes may be appropriate, others may be socially limiting and contribute to isolation.
Participants also described a number of difficulties with home maintenance tasks that may compromise the future safety of their homes, and limit their ability to remain at home as they age.
The ability to drive is a particular concern for older people. Many recognise that they may eventually lose their ability to drive, and others had already ceased driving. The ability to drive has an impact on access to shops and services, and the time taken to complete errands and tasks. Likewise, the design and location of shopping centres was seen to impact on whether people could keep driving, with traffic and difficulties parking being seen as an issue for many.
Public transport options were appreciated, but some people identified needs for improvements in shelters at bus stops.
Implications
The HAIL Project provides a detailed snapshot of the homes and neighbourhoods of a sample of older people living in selected metropolitan areas, including observation of their homes and physical functioning. It is of interest that the participants themselves rated their homes highly in terms of usability and accessibility. There appears to be a mismatch between what participants want and expect from their homes and what they may need to support them in their older age.
The results suggest that policies and systems are needed so these homes can be appropriately modified and adapted according to current standards. These might include information services and education, incentives for people to build and modify homes appropriately and services to help people access appropriate tradespeople. For new individual residential buildings, government and council organisations need to work together to ensure that development applications accommodate at least the essential aspect of the AS 4299 recommendations.1 Policies are needed to encourage the market, including the private sector and local government, to develop housing products to meet future needs.
Bathrooms are a particular area in need of attention, with many not having adequate levels of access or safety. A focus on bathroom design and modification could be included in education to consumers, suppliers, and legislators.
While most of the neighbourhoods included in the HAIL project rated highly on both subjective and objective measures, some features are worthy of further consideration including: adequacy and accessibility of parking; access to supermarkets, and fruit and vegetables; and proximity to hospitals.
12
INTRODUCTION
There is a real need to develop effective public policy and practical actions that encourage people to remain optimally active and independent as they age. As part of this need, there is the growing expectation that people will continue to remain in their own homes. Supportive home and neighbourhood environments that enable people to continue to function at home despite increasing levels of disability are therefore seen as being of considerable importance to maintaining independence and wellbeing among older people. Indeed, it is now widely recognised that “housing and communities can play a major role in facilitating personal independence and community involvement as people grow older” (NSW Government Towards 2030: Planning for our changing population http://www.dadhc.nsw.gov.au~towards2031.pdf ).2 However, there is currently very little information on the extent to which older people’s homes and neighbourhoods are supportive of their increasing needs. In this study we describe the homes and neighbourhoods of a sample of older people living in selected local government areas in the greater Sydney region. The aims were to:
Determine the extent to which home and neighbourhood environments can be considered to be “supportive” according to international measures;
To identify those people who are least likely to be currently living in more supportive environments; and
To contrast these findings against people’s expectations of their increasing needs as they age and of how these needs are to be met.
THE NEED FOR THIS RESEARCH
According to the World Health Organisation (WHO), ageing is one of the major forces of the new millennium.6 Likewise, the Australian Government’s Third Intergenerational Report (2010)7 highlighted the substantial policy implications of the ageing population – it noted that spending on aged care will more than double as a proportion of Gross Domestic Product by 2047, largely as a result of increased spending on residential aged care. Australia presently has around 2.7 million people aged 65 years and over. In 2006, about half (52%) of these older people were aged 65–74 years, about one-third (36%) were aged 75–84, and the remainder (12%) were aged 85 years and over. By 2050, the proportion of people aged 65 and over is expected to double and the proportion aged 85 or over to triple.8 Many older people will have some degree of disability and, according to the Australian Bureau of Statistics, over half of all people aged 65 years and over (56% or 1.4 million) had at least one form of disability lasting (or expected to last) at least 6 months and which restricted everyday activities, and 23% had at least one profound or severe core activity limitation.9 Disability rates increase with age; among people aged over 80 years, 71% have specific activity restriction (indicating mild levels of dependency) and 46% a profound or severe core activity restriction (indicating more serious dependency).9 Even if age-specific rates of disability and dependency remain stable, the absolute numbers of people aged 65 years and over with a core activity restriction is expected to double between 1998 and 2020 as the population ages.10 Giles et al. (2003)10 estimate that there will be a 70% increase in the number of older people with profound disability over the next 30 years. There is a critical need to understand the factors that enable individuals to remain active and independent as they age, to reduce the demand on residential care and community services, and enable older people to live independently for a longer period.
The NSW Government identifies the challenge of population ageing in Towards 2030: Planning for our changing population.2 This document emphasises appropriate housing, community and proximity to services as central to people’s ability to maintain quality of life and continue living in their communities as they grow older. It is argued that if the external environment is supportive, older people may be more active and better able to manage disability; this will mean reduced demand for residential and other aged care services. According to the WHO, unsafe homes and neighbourhoods that have multiple physical barriers to access and usability are likely to limit older people’s mobility and physical and social participation, and increase the risk of isolation, depression, and declining fitness.6
As people age, their housing and neighbourhood may be increasingly important because of an increased vulnerability to environmental challenges.11 Conditions such as chronic diseases, vision problems, limited mobility, and other impairments create special needs, but responsive environments can reduce the impact of

13
these conditions. For example, an elderly person who is no longer able to drive but lives in an area with public transport options has the ability to stay mobile well beyond the capacity of many in less well serviced communities.12 Likewise, a person with arthritis may or may not experience disability depending upon the degree to which their environment supports or impedes their activity and participation.13 The development of adequate public policy will therefore require a detailed understanding of those aspects of the external environment that are important in affecting functional status, and, importantly, what environmental aspects are likely to matter for which individuals.
SUPPORTIVE ENVIRONMENTS
For this project we considered “supportive” environments to be those that are well designed to enable people to continue to be independent on activities of daily living despite increasing levels of impairment or disability. The features of such environments include homes that are accessible, usable, and free from hazards, and neighbourhoods that are walkable, safe and accessible (see Table 1 below).
Table 1: Features considered to contribute to “supportive” environments addressed in this research
Homes Neighbourhoods
Accessibility – people are able to move around without hindrance from physical barriers. This aspect includes pathways and external access, corridors and circulation within the home.
Accessibility – distances to services, availability of suitable transport options.
Usability – people are able to perform their daily activities within their environment. This aspect includes features of universal design and physical aids that assist people to perform these activities.
Walkability – a measure of how friendly an area is to walk in. This aspect includes physical layout, hazards, personal safety and neighbourhood satisfaction.
Safety – the home is free from hazards that might contribute to falls and other accidents.
Safety – the extent to which people feel safe in their homes and local area, and able to trust their neighbours.

14
APPROACH
The Housing and Independent Living (HAIL) project was undertaken by researchers at the University of Newcastle, the University of Sydney and the SAX Institute, and funded by Ageing Disability and Home Care, in the NSW Department of Human Services.
The project focused on environmental and built factors for maintaining independence in older age, by studying the homes and neighbourhoods of a sample of community dwelling older people. These people were randomly selected from among 45 and Up Study (www.45andup.org) participants who were aged 75 to 79 years at the time of the HAIL project, and who were living in seven selected local government areas (LGAs) in the greater Sydney area. Selected LGAs were those with the greatest proportion of people aged 70 years or over, namely Bankstown, Hunters Hill, Ku-ring-gai, Mosman, Sutherland, Woollahra, and Wyong (see Table 2). Regional and rural areas were not included in this study.
Table 2: Selected LGAs for HAIL sample
LGA name total 75 + proportion 75 +
Bankstown 4458 8.3%
Hunters Hill 1509 10.9%
Ku-ring-gai 9302 8.8%
Mosman 2234 8.0%
Sutherland Shire 8628 8.5%
Woollahra 4450 8.3%
Wyong NE and SW 12625 8.9%
A total of 200 men and 200 women were randomly selected for inclusion in the project (See Figure 1).
These randomly selected men and women were invited to complete a postal questionnaire and to participate in an interview conducted in their home.
A total of 260 people completed the questionnaire, and a total of 202 home visits were conducted.
The research was approved by the University of Newcastle Human Research Ethics Committee.
Figure 1: The Study Sample

15
MEASURES
We used the International Classification of Functioning Disability and Health14 to select objective and perceived measures of supportive home and neighbourhood environments, measures of individual factors that are expected to be associated with more supportive environments (differences in socio-economic status, age, gender, and physical need), and measures of function, activity and participation that are likely to be mediated by better support. Table 3 indicates the variables measured within the components of the International Classification of Functioning Disability and Health.
Table 3. Measures and data source
Postal Questionnaire Home Visit Interview ENVIRONMENTAL FACTORS: Home and Neighbourhood Environment Type of housing, tenure (questions from the 45 and Up Study baseline) www.45andup.org.au
Perceptions about housing (structured interview)
Perception of home as supporting activity (using Usability in My Home questionnaire)
Recent /planned housing change 15
Neighbourhood walkability and satisfaction with neighbourhood (using NEWS Parts C Access to Services, G Traffic Hazards, I Parking, K Hilliness, L Physical Barriers)
Neighbourhood walkability and satisfaction with neighbourhood (using NEWS Parts B Land use diversity, E Walking Safety, N Social interaction while walking, H Crime) 16
Main modes of transport and accessibility and availability of public transport (items used in surveys of the Australian Longitudinal Study on Women’s Health (ALSWH)
16
www.alswh.org.au
Aids and devices used in the home
Neighbourhood satisfaction and safety Quality of the home based on compliance with Australian standards (AS 4299)
17
General perceptions of neighbourhood: convenience, familiarity, safety.
1 Home hazards (HOME FAST)
3
Neighbourhood Assessment (using AUDIT tool) 19
INDIVIDUAL FACTORS: Personal Factors and Body Structures Age/ sex, marital status, living arrangements, caring, work status, (questions from the 45 and Up Study baseline)
Access to car
Self -reported diagnoses and medications (repeating items from the 45 and Up Study baseline – self completed questionnaire)
Pets Body Mass Index FUNCTIONAL FACTORS: Function, Activity and Participation Physical, emotional and social well being (using SF-36 sub-scales): Pain, Mental Health, Vitality, General Health, Physical Function, Role Physical, Social Function, Role Emotional5
Physical ability and activities of daily living (using LLFDI) 4
Life Space Questionnaire 18 Physical measures: grip strength, peak flow, body mass index, short physical performance battery20 and the timed up and go.21

16
A postal questionnaire was used to gather basic information about the person, their home, and their perceptions of their home and neighbourhood. The questionnaire included some standard measures of whether people saw the home as suited to their daily activities and needs (The 23-item Usability in My Home questionnaire),15 measures of people’s perceptions of their neighbourhood in terms of safety and accessibility (using items and scales from the Neighbourhood Environment Walkability Scale - NEWS),16 and their sense of community, neighbourhood cohesion, safety and trust (using the Sense of Neighbourhood and Safety Scale).17 The SF-36,5 a widely used and well-validated generic health profile, was included to measure eight dimensions of health-related quality of life, and the Life Space Questionnaire18 measured the spatial extent of the person’s recent activities.
After people returned the questionnaire they were invited to participate in a home visit and interview. This commenced with a brief semi-structured interview about the participant’s home, their expectations of future needs and their plans for housing renovation or relocation. The interview also collected responses to further questions from the NEWS16, and self reported diagnoses and medications. The Late Life Function and Disability Instrument (LLFDI)4 questions were included in the interview to assess the degree of difficulty associated with daily tasks as well as how often people perform activities and how limited they are on each activity.
Participants completed some brief physical measures including grip strength, peak flow measure (respiratory capacity), body mass index, short physical performance battery (balance, walking speed, chair stands)20 and the timed up and go21 which measures balance and basic mobility skills. While in the home, the interviewers completed a home assessment against the Australian Design for Access and Mobility Standard AS 42991 and the HOME FAST3. The AS 4299 provides a range of essential design requirements including paths and external access, clearances in corridors and between workstations/storage, circulation and pinch points, dimensions for door thresholds/nibs/hobs etc. For this study, the standards were scored according to whether the features were observed to be present during the home visit. The HOME FAST is a 25-item interviewer administered observational tool to assess home hazards. The instrument was developed to identify older people living at home in the community who are at risk of falls and injury due to their home environment and assesses aspects of home safety including stairs and rails, bathroom accessibility, floor coverings, cupboard access, lighting, and the appropriateness of furnishings such as beds and chairs. Items also measure hazards in the yard and front and back entranceways.3 After leaving the home, interviewers collected detailed "street-level" data on physical environmental factors that are potential influences on walking in local neighbourhoods by making direct observation of features visible in the environment within a 400-m radius of each participant’s home and recording these against the Active Neighbourhood Checklist (AUDIT).19

17
PARTICIPANTS
Basic demographic data for 128 men and 131 women in the study are shown in Table 4 (note one person did not state their gender on the questionnaire). The mean age of respondents was 77 years. Men were more likely to be married than women, and women were more likely to be living alone. Most participants were completely retired, although 6% of men described themselves as partly retired.
Table 4: Basic demographic data for men and women#
Variable Male % Female %
Age 75 24 12
76 16 18
77 16 17
78 21 28
79 21 18
80 2 6
Marital status Single 2 7
Married 84 52
Defacto 1 1
Widowed 10 28
Divorced/separated 3 12
Living arrangement Alone 11 37
Spouse/partner 76 53
Spouse/partner + other family 5 1
Spouse/partner + own children 3 0
Own children/other family 5 8
Work status Partly retired 6 0
Completely retired 77 83
Not retired 17 17
Note:# cells may not add to 100% due to rounding error
18
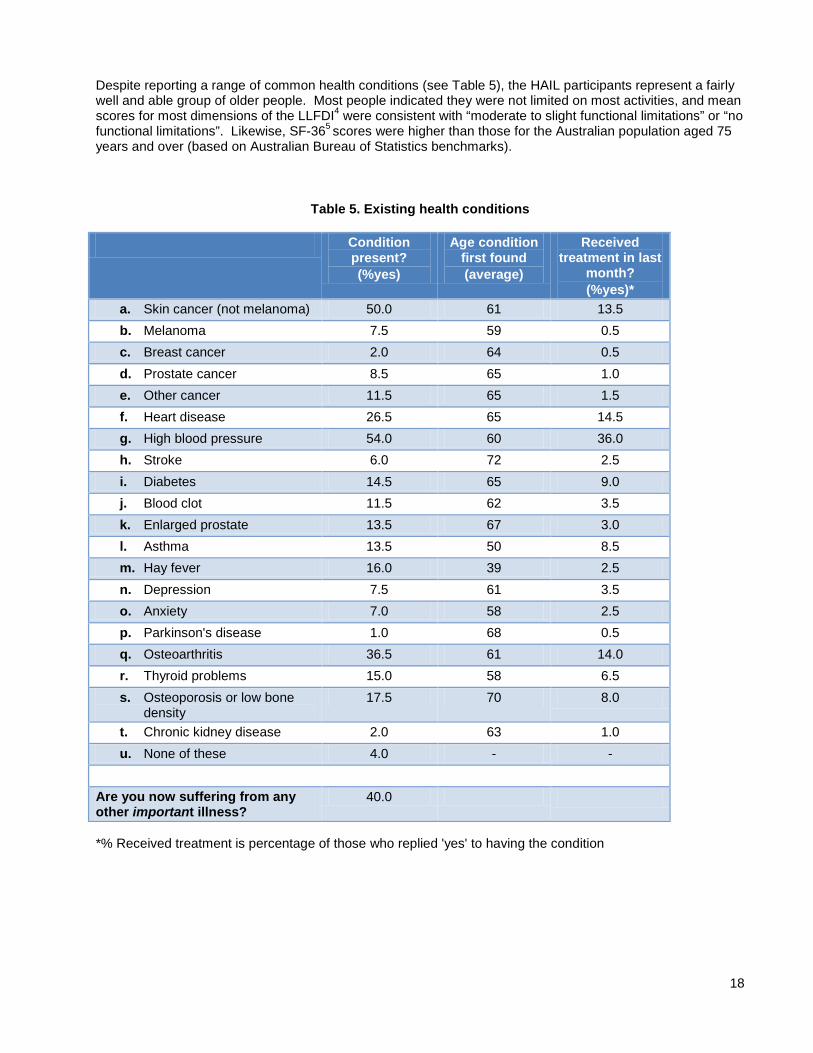
Despite reporting a range of common health conditions (see Table 5), the HAIL participants represent a fairly well and able group of older people. Most people indicated they were not limited on most activities, and mean scores for most dimensions of the LLFDI4 were consistent with “moderate to slight functional limitations” or “no functional limitations”. Likewise, SF-365 scores were higher than those for the Australian population aged 75 years and over (based on Australian Bureau of Statistics benchmarks).
Table 5. Existing health conditions
Condition present? (%yes)
Age condition first found (average)
Received treatment in last
month? (%yes)*
a. Skin cancer (not melanoma) 50.0 61 13.5 b. Melanoma 7.5 59 0.5 c. Breast cancer 2.0 64 0.5 d. Prostate cancer 8.5 65 1.0 e. Other cancer 11.5 65 1.5 f. Heart disease 26.5 65 14.5 g. High blood pressure 54.0 60 36.0 h. Stroke 6.0 72 2.5 i. Diabetes 14.5 65 9.0 j. Blood clot 11.5 62 3.5 k. Enlarged prostate 13.5 67 3.0 l. Asthma 13.5 50 8.5 m. Hay fever 16.0 39 2.5 n. Depression 7.5 61 3.5 o. Anxiety 7.0 58 2.5 p. Parkinson's disease 1.0 68 0.5 q. Osteoarthritis 36.5 61 14.0 r. Thyroid problems 15.0 58 6.5 s. Osteoporosis or low bone
density 17.5 70 8.0
t. Chronic kidney disease 2.0 63 1.0 u. None of these 4.0 - -
Are you now suffering from any other important illness?
40.0
*% Received treatment is percentage of those who replied 'yes' to having the condition

19
FINDINGS
The aims of the HAIL project were to determine the extent to which home and neighbourhood environments can be considered to be “supportive” according to international measures, to identify those people who are least likely to be currently living in more supportive environments, and to contrast these findings against people’s expectations of their increasing needs as they age and of how these needs are to be met. The main findings of the project are presented against the key research questions below.
HOW DO OLDER PEOPLE PERCEIVE THEIR HOUSING AND NEIGHBOURHOODS IN TERMS OF ACCESSIBILITY, USABILITY, AND SAFETY?
Participants in the HAIL project mostly felt that their houses and neighbourhoods rated highly on accessibility, usability and safety. Most people (93%) lived in their own homes, predominantly in a house, although some lived in a flat or unit. A few people lived on a farm (2%) or in a retirement village (<1%) or mobile home (2%). People had generally lived in their homes for several decades and in their neighbourhood for even longer. Most people (99%) said they liked their neighbourhood.
Perceptions of housing
Perceptions of housing were measured using a standard instrument called Usability in My Home.15 This instrument includes questions that measure the extent to which the home is perceived as supporting various activities. Most people rated their homes as “very suitable” in terms of how well the home was designed to allow them to manage activities of daily living (such as dressing and toileting, cooking, cleaning, and washing clothes) and leisure activities (such as being alone, socialising with friends, hobbies, and relaxation). Figure 2 shows that the aspects most likely to be rated as “very suitable” were whether the home was perceived to be well designed for dressing and toileting and for relaxing. The item least likely to be rated as “very suitable” was whether the home was well designed for washing clothes. This item was rated as “very suitable” by 79% of people in the study: 7% said their home was suitable for this purpose, and 2% of people said their home was “not suitable” for this purpose. The rest of the participants selected the “neutral” response for this item or left the question unanswered.
Most people (63%) reported they have some form of air conditioning in the home. However, 24% said that in the past year the home had been too hot to sleep, and 17% said the home had been too hot to undertake their usual activities. Very few people (3%) said their home was too cold.
In terms of safety, most people felt completely secure in their homes, although women were more likely to feel more secure than men: 79% of women reported they felt completely secure compared with 64% of men. The reasons for this gender difference are not clear from the study but may be cultural, relating to men’s sense of needing to protect their partner throughout life, social in that women have greater social networks (although there were no gender differences on neighbourhood satisfaction or safety scores), or may be operational in that women felt they had made more arrangements to protect their security.
In the interviews, most participants said they were very satisfied with their homes, and many described their home as their “castle.” They acknowledged that minor things could be improved about the home such as painting, but this did not overly concern them, while others were very happy with what they considered to be their low maintenance homes. Whilst some participants were aware that they were “slowing up,” they were satisfied with their homes as long as they could be sustained within the home and do the activities they enjoyed, such as gardening. Gardens and trees appeared to be highly valued, and several participants mentioned being close to nature and enjoying the bird life in their gardens.
The physical features of the home that participants valued included having a level home with no steps, and not needing any alterations in the future. Most people were satisfied with their homes because they considered them to be a good match for their needs.

20
One of the few areas of dissatisfaction was in relation to the orientation of the home, which meant the participants experienced more cold in the winter without accessing sunshine. Participants living in older houses identified issues with having enough space for cars.
Participants identified the social functions of their home location as important to them. Several participants valued their spare rooms as necessary to allow children and grandchildren to visit. On occasions they were also able to accommodate sons and daughters who needed somewhere to live after marital breakdowns etc. Most participants valued the opportunity to host family occasions in the home because of the size and design of their homes.
Perceptions of neighbourhood
The majority of people in the HAIL study described their neighbourhoods as convenient, familiar, and safe (see Figure 3). They felt they were known by other people and help was available if required. People described their homes as a good base for their activities (97%) and a place where they can “live in peace of mind” for as long as they wish (99%).

21
Scores on the Neighbourhood Satisfaction and Safety Scale16 were also high with the average (median) overall score for neighbourhood satisfaction being 3.00 for men and 3.17 for women (with 4 being the highest possible score). A majority of people (over 80%) agreed that they have a lot in common with their neighbours, they trust their neighbours to look out for their property, and that they are good friends with people in their neighbourhood. Most people disagreed that they have little to do with others, and that no one would notice if they moved away (see Figure 4). These figures indicate that people feel highly connected with others in their neighbourhood and that they perceive that their neighbours are supportive.
Figure 4: Measures of neighbourhood satisfaction

22
People also mostly thought that their neighbours treated them with respect, and that children are safe walking around their neighbourhood by day (over 95%). Although people were less likely to say that it is safe to walk around their neighbourhood at night, a majority of people (around 70%) still agreed with this statement (see Figure 5). Overall scores for neighbourhood safety were 3.37 for men and 3.34 for women (with 4 being the highest possible score).
Figure 5: Measures of Neighbourhood safety
These quantitative findings about the neighbourhood were also reflected in the comments recorded during the interviews. People described the location of their home as a source of satisfaction, being close to neighbours, feeling safe such as by being located in a cul de sac, and being close to family members and community activities. Participants valued the proximity to friends and long-time neighbours and lamented the loss of those who had moved away. People identified that the numbers of people known to them in their local community was diminishing. They suggested that people now tended to kept to themselves, and they only knew their immediate neighbours.
Several participants indicated that they felt their sense of their local community was being replaced by the arrival of greater numbers of younger people. They felt that the age of their neighbours was important, as they had better relationships with older neighbours, although some participants valued a range of age groups in the neighbourhood, especially any contact with children.
Many participants were concerned about increasing levels of development, including high rise and dense housing developments that attract more people to live in the area. Participants also described having to negotiate crowded public spaces, deal with traffic congestion and difficulty parking, and increasing aircraft noise. Some participants described their experience of these changes in very strong terms such as “hell” and “bedlam,” suggesting a sense of alienation within their local community. Some participants suggested that these changes had led to the need to lock doors and protect themselves against burglaries. Other participants suggested that these issues became much worse at the weekends, in the form of crowds, noise and unsociable behaviour, leaving them to “bunker down.” There were also several complaints about the local councils who had allowed these changes to the local community, without consultation.
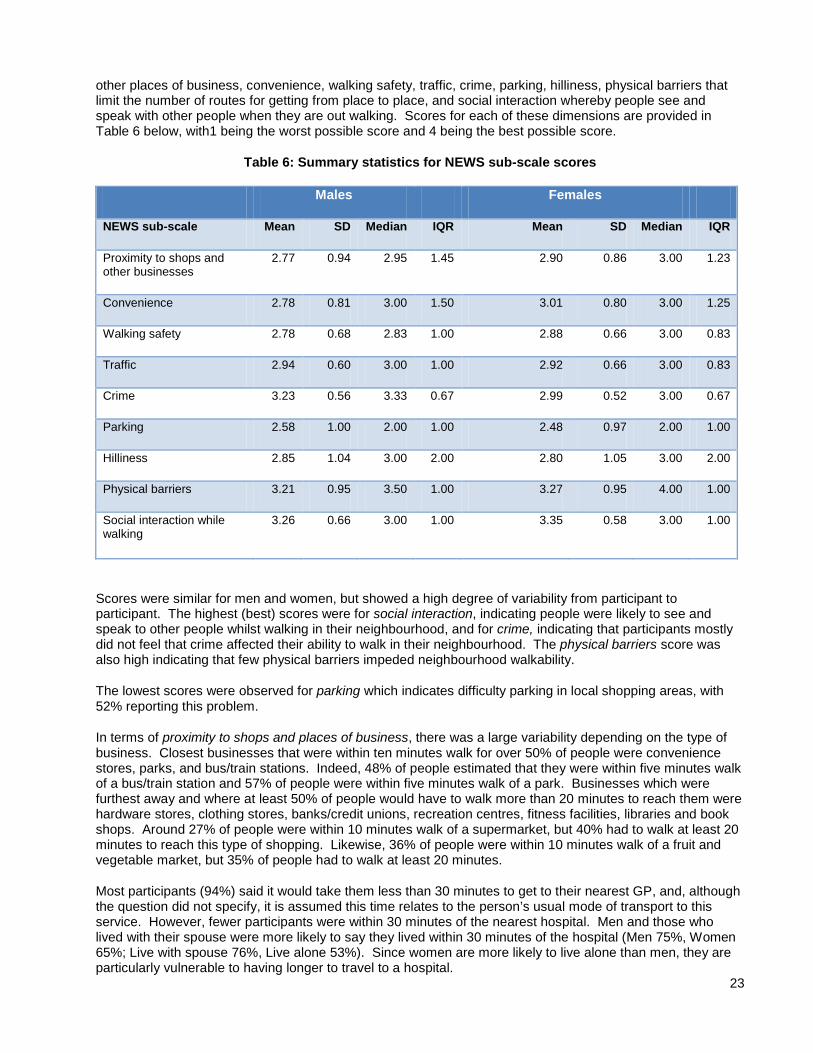
More specific perceptions of neighbourhood were obtained from selected questions from the Neighbourhood Environmental Walkability Scale (NEWS)16 which is a self report measure of key aspects of neighbourhood walkability that is particularly relevant for older people because it captures features like hills, and the quality of footpaths. The scale provides scores on a number of different dimensions including proximity to shops and
23
other places of business, convenience, walking safety, traffic, crime, parking, hilliness, physical barriers that limit the number of routes for getting from place to place, and social interaction whereby people see and speak with other people when they are out walking. Scores for each of these dimensions are provided in Table 6 below, with1 being the worst possible score and 4 being the best possible score.
Table 6: Summary statistics for NEWS sub-scale scores
Males Females
NEWS sub-scale Mean SD Median IQR Mean SD Median IQR
Proximity to shops and other businesses
2.77 0.94 2.95 1.45 2.90 0.86 3.00 1.23
Convenience 2.78 0.81 3.00 1.50 3.01 0.80 3.00 1.25
Walking safety 2.78 0.68 2.83 1.00 2.88 0.66 3.00 0.83
Traffic 2.94 0.60 3.00 1.00 2.92 0.66 3.00 0.83
Crime 3.23 0.56 3.33 0.67 2.99 0.52 3.00 0.67
Parking 2.58 1.00 2.00 1.00 2.48 0.97 2.00 1.00
Hilliness 2.85 1.04 3.00 2.00 2.80 1.05 3.00 2.00
Physical barriers 3.21 0.95 3.50 1.00 3.27 0.95 4.00 1.00
Social interaction while walking
3.26 0.66 3.00 1.00 3.35 0.58 3.00 1.00
Scores were similar for men and women, but showed a high degree of variability from participant to participant. The highest (best) scores were for social interaction, indicating people were likely to see and speak to other people whilst walking in their neighbourhood, and for crime, indicating that participants mostly did not feel that crime affected their ability to walk in their neighbourhood. The physical barriers score was also high indicating that few physical barriers impeded neighbourhood walkability.
The lowest scores were observed for parking which indicates difficulty parking in local shopping areas, with 52% reporting this problem.
In terms of proximity to shops and places of business, there was a large variability depending on the type of business. Closest businesses that were within ten minutes walk for over 50% of people were convenience stores, parks, and bus/train stations. Indeed, 48% of people estimated that they were within five minutes walk of a bus/train station and 57% of people were within five minutes walk of a park. Businesses which were furthest away and where at least 50% of people would have to walk more than 20 minutes to reach them were hardware stores, clothing stores, banks/credit unions, recreation centres, fitness facilities, libraries and book shops. Around 27% of people were within 10 minutes walk of a supermarket, but 40% had to walk at least 20 minutes to reach this type of shopping. Likewise, 36% of people were within 10 minutes walk of a fruit and vegetable market, but 35% of people had to walk at least 20 minutes.
Most participants (94%) said it would take them less than 30 minutes to get to their nearest GP, and, although the question did not specify, it is assumed this time relates to the person’s usual mode of transport to this service. However, fewer participants were within 30 minutes of the nearest hospital. Men and those who lived with their spouse were more likely to say they lived within 30 minutes of the hospital (Men 75%, Women 65%; Live with spouse 76%, Live alone 53%). Since women are more likely to live alone than men, they are particularly vulnerable to having longer to travel to a hospital.
24
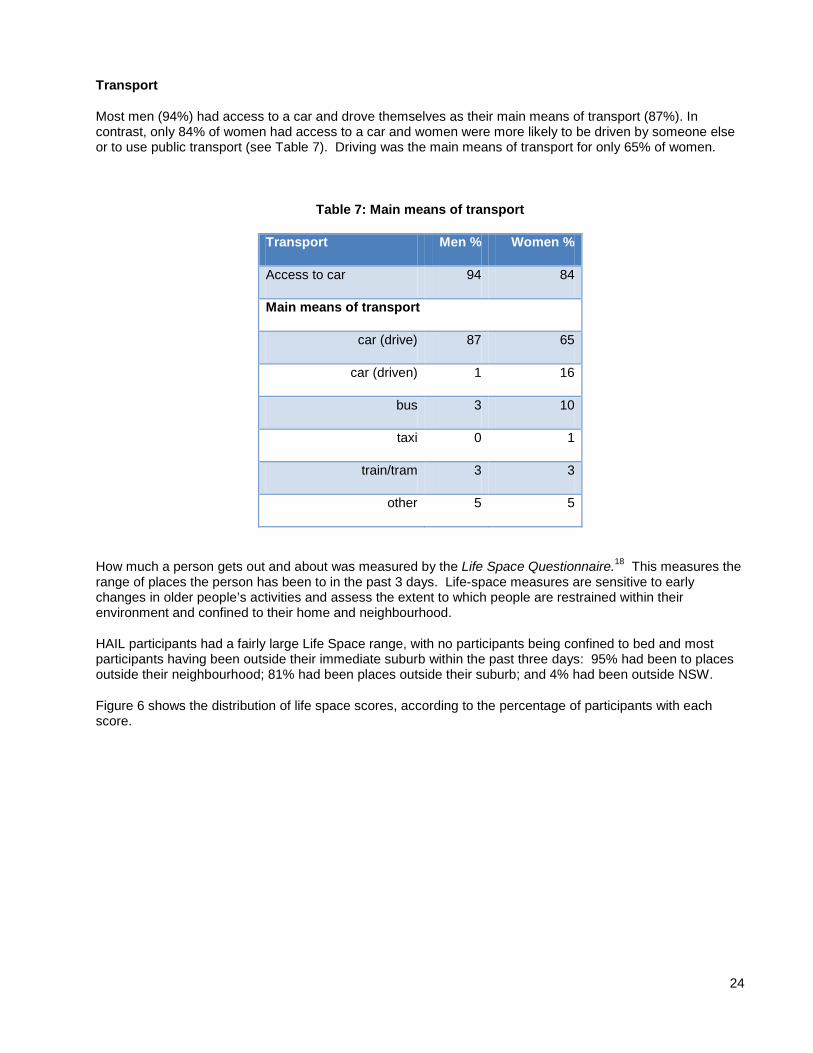
Transport
Most men (94%) had access to a car and drove themselves as their main means of transport (87%). In contrast, only 84% of women had access to a car and women were more likely to be driven by someone else or to use public transport (see Table 7). Driving was the main means of transport for only 65% of women.
Table 7: Main means of transport
Transport Men % Women %
Access to car 94 84
Main means of transport
car (drive) 87 65
car (driven) 1 16
bus 3 10
taxi 0 1
train/tram 3 3
other 5 5
How much a person gets out and about was measured by the Life Space Questionnaire.18 This measures the range of places the person has been to in the past 3 days. Life-space measures are sensitive to early changes in older people’s activities and assess the extent to which people are restrained within their environment and confined to their home and neighbourhood.
HAIL participants had a fairly large Life Space range, with no participants being confined to bed and most participants having been outside their immediate suburb within the past three days: 95% had been to places outside their neighbourhood; 81% had been places outside their suburb; and 4% had been outside NSW.
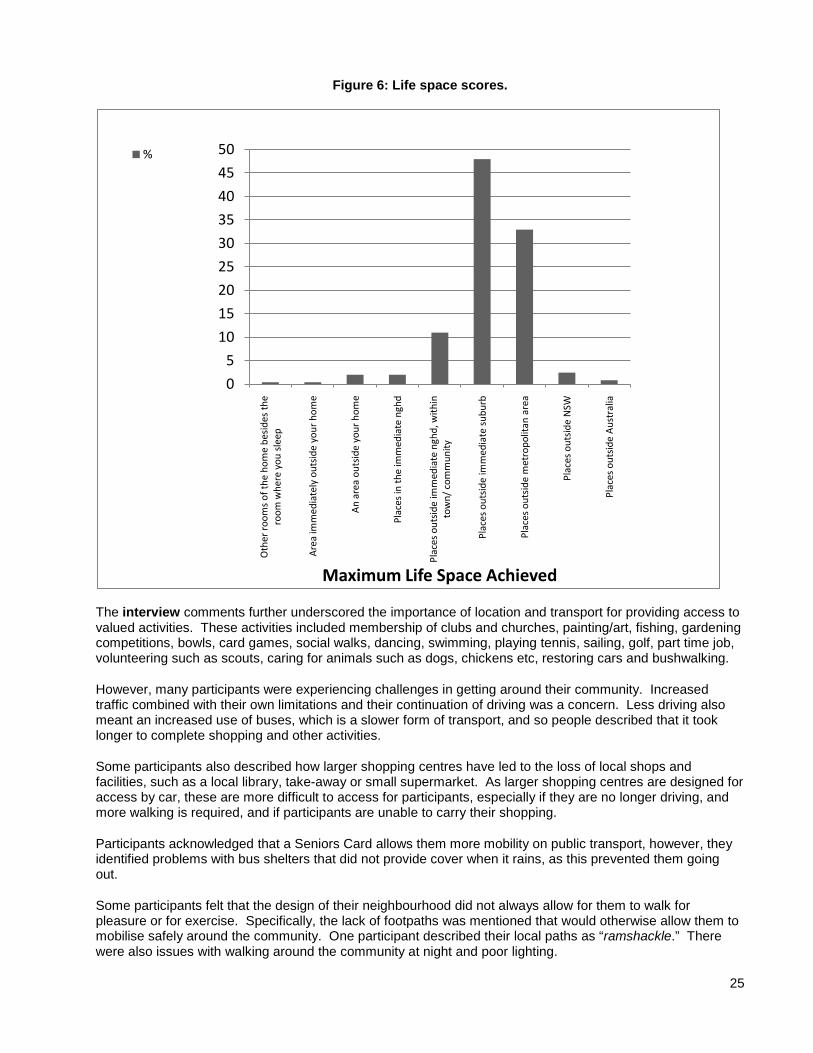
Figure 6 shows the distribution of life space scores, according to the percentage of participants with each score.
25
Figure 6: Life space scores.
The interview comments further underscored the importance of location and transport for providing access to valued activities. These activities included membership of clubs and churches, painting/art, fishing, gardening competitions, bowls, card games, social walks, dancing, swimming, playing tennis, sailing, golf, part time job, volunteering such as scouts, caring for animals such as dogs, chickens etc, restoring cars and bushwalking.
However, many participants were experiencing challenges in getting around their community. Increased traffic combined with their own limitations and their continuation of driving was a concern. Less driving also meant an increased use of buses, which is a slower form of transport, and so people described that it took longer to complete shopping and other activities.
Some participants also described how larger shopping centres have led to the loss of local shops and facilities, such as a local library, take-away or small supermarket. As larger shopping centres are designed for access by car, these are more difficult to access for participants, especially if they are no longer driving, and more walking is required, and if participants are unable to carry their shopping.
Participants acknowledged that a Seniors Card allows them more mobility on public transport, however, they identified problems with bus shelters that did not provide cover when it rains, as this prevented them going out.
Some participants felt that the design of their neighbourhood did not always allow for them to walk for pleasure or for exercise. Specifically, the lack of footpaths was mentioned that would otherwise allow them to mobilise safely around the community. One participant described their local paths as “ramshackle.” There were also issues with walking around the community at night and poor lighting.
0
5
10
15
20
25
30
35
40
45
50
Oth
er ro
oms
of th
e ho
me
besi
des
the
room
whe
re y
ou s
leep
Are
a im
med
iate
ly o
utsi
de y
our
hom
e
An
area
out
side
you
r ho
me
Plac
es in
the
imm
edia
te n
ghd
Plac
es o
utsi
de im
med
iate
ngh
d, w
ithin
to
wn/
com
mun
ity
Plac
es o
utsi
de im
med
iate
sub
urb
Plac
es o
utsi
de m
etro
polit
an a
rea
Plac
es o
utsi
de N
SW
Plac
es o
utsi
de A
ustr
alia
Maximum Life Space Achieved
%
26
ARE LEVELS OF HOUSING FOR PEOPLE IN NSW LIKELY TO SUPPORT INDEPENDENCE IN OLDER AGE?
Pairs of health professionals visited the study participants in their homes in order to make more objective assessments of the home and neighbourhood environment. Assessments included an audit against the Australian Design for Access and Mobility Standard AS 4299 (Adaptable Housing),1 and the Home Falls and Accidents Screening Tool (HOME FAST).3 The AS 4299 provides a range of essential design requirements including paths and external access, clearances in corridors and between workstations/storage, circulation and pinch points, and dimensions for door thresholds/nibs/hobs etc. The HOME FAST is a 25 item interviewer administered observational tool to assess home hazards associated with falls. The tool was developed in Australia to identify older people living at home in the community who are at risk of falls and injury due to their home environment.3
Assessment of the neighbourhood included an audit of neighbourhood features against the Active Neighbourhood Checklist (AUDIT)
It assesses aspects of home safety, including stairs and rails, bathroom accessibility, floor coverings, cupboard access, lighting, and the appropriateness of furnishings, such as beds and chairs. Items also measure hazards in the yard and front and back entranceways.
19
Features of older people’s houses
which provides detailed “street-level” data on physical environmental factors that are potential influences on walking in local neighbourhoods. These data were obtained by direct observation of features visible in the environment within a 400 metre radius of each participant’s home.
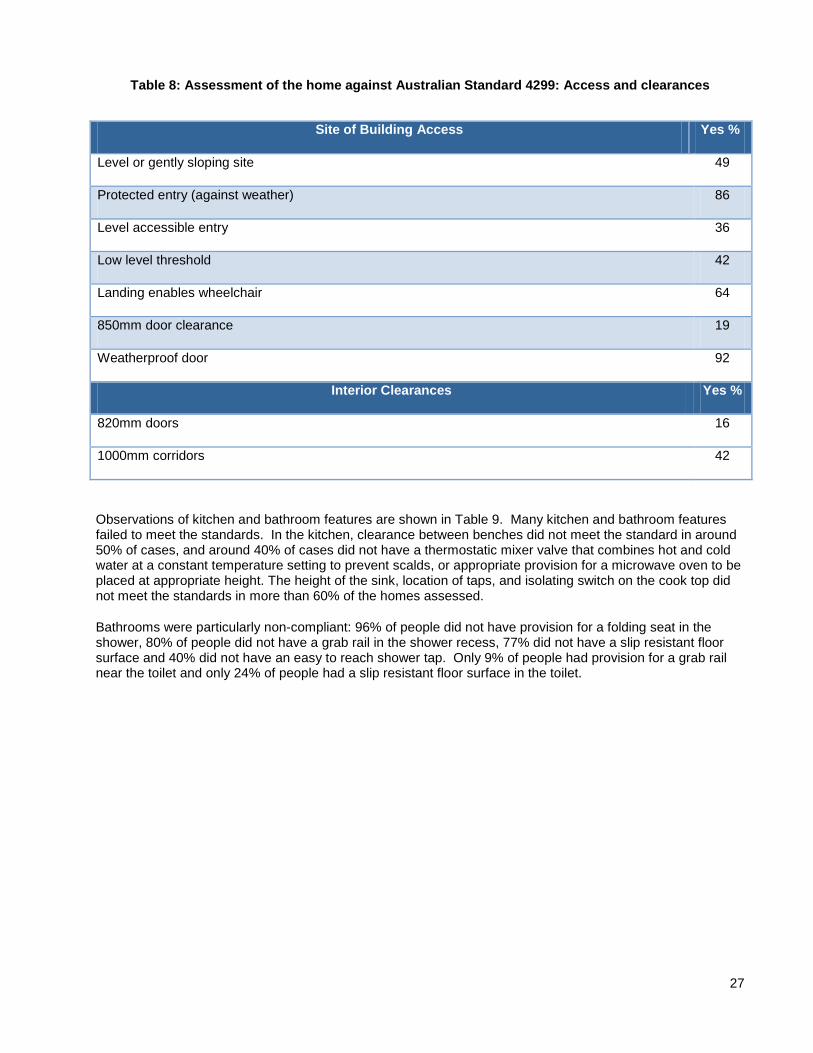
Most dwellings were classified as a single level abode (57%) or a two or more storey house (24%), and 40% of people had to navigate stairs, either internally or externally. Interviewers’ observations of the homes against items from the AS 4299 indicate a large proportion of homes had issues of concern with respect to access and clearances (Table 8). Less than half of the participants lived in homes on level or gently sloping sites with up to 1:14 gradient, or with level accessible entry. Over half did not have a low level threshold and most homes did not meet the standard in terms of door and corridor clearances.
27
Table 8: Assessment of the home against Australian Standard 4299: Access and clearances
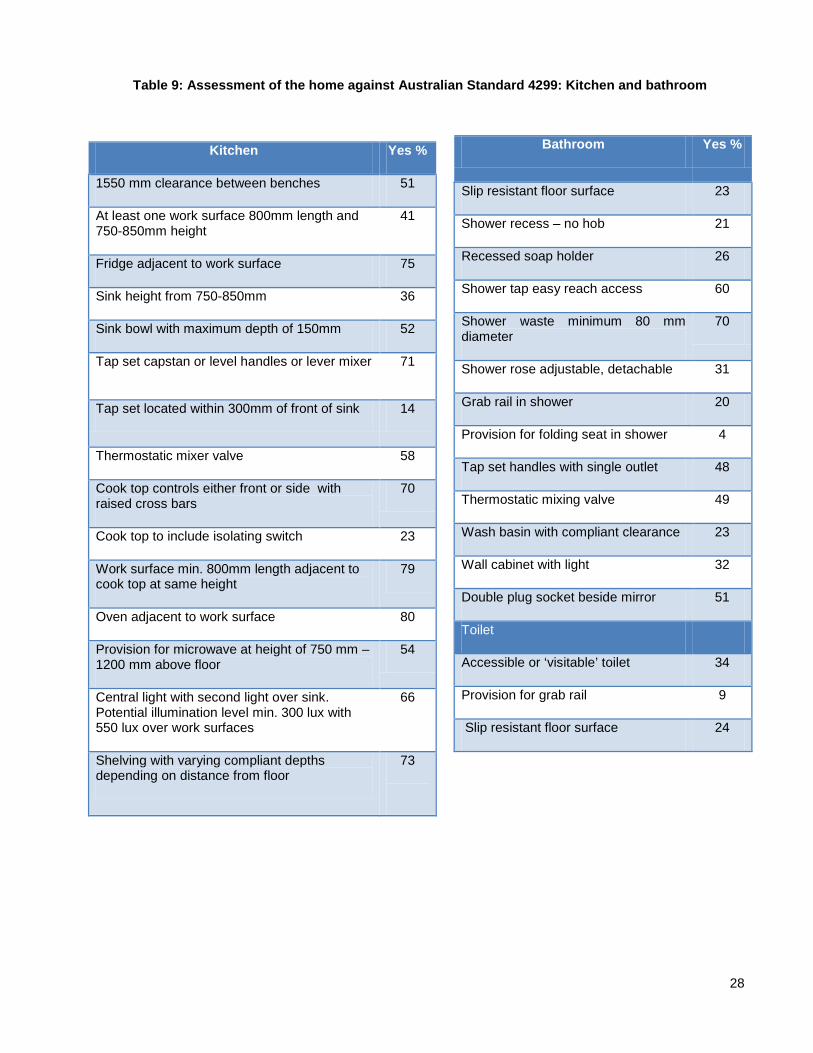
Observations of kitchen and bathroom features are shown in Table 9. Many kitchen and bathroom features failed to meet the standards. In the kitchen, clearance between benches did not meet the standard in around 50% of cases, and around 40% of cases did not have a thermostatic mixer valve that combines hot and cold water at a constant temperature setting to prevent scalds, or appropriate provision for a microwave oven to be placed at appropriate height. The height of the sink, location of taps, and isolating switch on the cook top did not meet the standards in more than 60% of the homes assessed.
Bathrooms were particularly non-compliant: 96% of people did not have provision for a folding seat in the shower, 80% of people did not have a grab rail in the shower recess, 77% did not have a slip resistant floor surface and 40% did not have an easy to reach shower tap. Only 9% of people had provision for a grab rail near the toilet and only 24% of people had a slip resistant floor surface in the toilet.
Site of Building Access Yes %
Level or gently sloping site 49
Protected entry (against weather) 86
Level accessible entry 36
Low level threshold 42
Landing enables wheelchair 64
850mm door clearance 19
Weatherproof door 92
Interior Clearances Yes %
820mm doors 16
1000mm corridors 42
28
Table 9: Assessment of the home against Australian Standard 4299: Kitchen and bathroom
Bathroom Yes %
Slip resistant floor surface 23
Shower recess – no hob 21
Recessed soap holder 26
Shower tap easy reach access 60
Shower waste minimum 80 mm diameter
70
Shower rose adjustable, detachable 31
Grab rail in shower 20
Provision for folding seat in shower 4
Tap set handles with single outlet 48
Thermostatic mixing valve 49
Wash basin with compliant clearance 23
Wall cabinet with light 32
Double plug socket beside mirror 51
Toilet
Accessible or ‘visitable’ toilet 34
Provision for grab rail 9
Slip resistant floor surface 24
Kitchen Yes %
1550 mm clearance between benches 51
At least one work surface 800mm length and 750-850mm height
41
Fridge adjacent to work surface 75
Sink height from 750-850mm 36
Sink bowl with maximum depth of 150mm 52
Tap set capstan or level handles or lever mixer 71
Tap set located within 300mm of front of sink 14
Thermostatic mixer valve 58
Cook top controls either front or side with raised cross bars
70
Cook top to include isolating switch 23
Work surface min. 800mm length adjacent to cook top at same height
79
Oven adjacent to work surface 80
Provision for microwave at height of 750 mm – 1200 mm above floor
54
Central light with second light over sink. Potential illumination level min. 300 lux with 550 lux over work surfaces
66
Shelving with varying compliant depths depending on distance from floor
73

29
Assessment of home hazards
Among the homes in the HAIL project, 27% scored eight or more out of the 25 possible hazards listed in the screening tool, and participants living in these homes were considered to be at high risk of falls due to hazards in the home. Table 10 shows the percentage of people who scored unfavourably on each of the HOME FAST3 items (who did not meet the safety standards). The most common problems were not having: non-slip floors (79%); non-slip mats (74%); loose mats (61%); shower or bath grab rails (62%); and having difficulties identifying edges of stairs (66%).
Table 10. HOME FAST items
HOME FAST ITEM % identified as hazardous HOME FAST ITEM % identified as hazardous
Are the walkways free of cords and other clutter?
13 Are slip resistant mats used in the bath/bathroom/shower recess?
74
Are the floor coverings in good condition? 14 Is the toilet in close proximity to the bedroom? 18
Are the floor surfaces non-slip? 79 Can the person easily reach items in the kitchen that are used regularly without climbing, bending or upsetting his or her balance?
14
Are loose mats securely fixed to the floor? 61 Can the person carry meals easily and safely from the kitchen to the dining area?
5
Can the person get in and out of bed easily and safely?
3 Do the indoor steps/stairs have an accessible/sturdy grab rail extending along the full length of the steps/stairs?
16
Can the person get up from the lounge chair easily and safely?
6 Do the outdoor steps have an accessible/sturdy grab rail extending along the full length of the steps/stairs?
40
Are all the lights bright enough for the person to see clearly?
12 Can the person easily and safely go up and down the steps/stairs, inside or outside the house?
8
Can the person switch a light on easily from his or her bed?
9 Are the edges of the steps/stairs easily identified?
66
Are the outside paths, steps and entrances well lit at night?
10 Can the person use the entrance door/s safely and easily?
4
Is the person able to get on and off the toilet easily and safely?
4 Are the paths around the house in good repair, and free of clutter?
19
Is the person able to get in and out of the bath easily and safely?
14 Is the person wearing well fitting slippers and shoes?
26
Is the person able to walk in and out of the shower recess easily and safely?
5 If there are pets, can the person care for them without bending and being at risk of falling over?
20
Is there an accessible/sturdy grab rail/s in the shower or beside the bath?
62

30
The results of this audit do not provide confidence that the homes of the HAIL participants would have the capacity to accommodate increased frailty or disability of the participants into the future. If participants came to need wheelchairs or walking aids in the future, the width of doorways and corridors and the accessibility of switches or the reach required to work in the kitchen may provide sufficient environmental barriers to participants remaining in their own homes. At the very least, such features would prevent participants with increased disability participating in many activities without significant help from a carer or paid assistant. Many of these household features could also affect the safety of older people with impaired mobility in their own homes, and may make them more vulnerable to falls and injury.
This vulnerability to falls is further highlighted by the results of the HOME FAST assessment which showed that many homes had identifiable hazards that have been associated with increased falls risk.3 Many of these hazards can be alleviated through simple home modifications.
Features of the neighbourhood
After leaving the home, interviewers scanned a 400 metre radius from each participant’s home to identify characteristics of the physical environment, using a standard neighbourhood audit form.19 Most participants were living in neighbourhoods that were characterised by large single family homes, although half the participants lived in neighbourhoods with a mixture of single dwelling homes and apartments. A minority of participants (9%) lived in neighbourhoods that included mobile homes or caravans. The predominance of single family homes may reflect the selection of neighbourhoods with high density of people aged over 70 years, as these people tend to live in more established neighbourhoods, but it is also typical of the Australian residential landscape.
Common types of commercial destinations were present in over 50% of segments surveyed, including a small grocery store (74%), fast food restaurant (60%) or other restaurant (53%), coffee shop (60%), and pharmacy (54%) (See Table 11). These features are of importance to older people in terms of being able to maintain their independence in shopping, and in being able to access local places for social interaction.
Importantly, 96% of participants had some alternative means of transport within 400m of their home, indicating high levels of access to public transport.
Common public/government service destinations were also present in over 50% of segments surveyed, including a primary school (72%), transportation facility (68%), churches or place of worship (57%), day care or pre-school (53%), and health or social services (53%)
Open natural space was close by 66% participants’ homes. Most people had some green space in the neighbourhood, with 91% having a visible park, a playground (79%) and sports or playing field (57%).
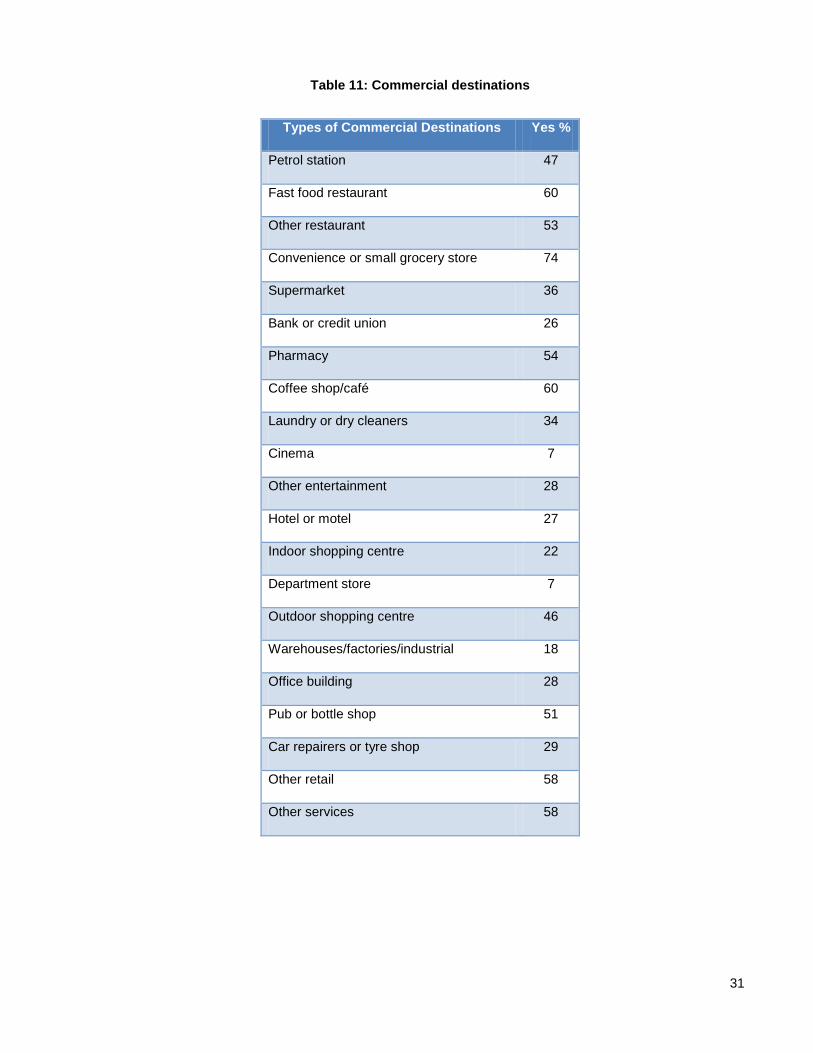
31
Table 11: Commercial destinations
Types of Commercial Destinations Yes %
Petrol station 47
Fast food restaurant 60
Other restaurant 53
Convenience or small grocery store 74
Supermarket 36
Bank or credit union 26
Pharmacy 54
Coffee shop/café 60
Laundry or dry cleaners 34
Cinema 7
Other entertainment 28
Hotel or motel 27
Indoor shopping centre 22
Department store 7
Outdoor shopping centre 46
Warehouses/factories/industrial 18
Office building 28
Pub or bottle shop 51
Car repairers or tyre shop 29
Other retail 58
Other services 58

32
Most participants lived in areas that included features that enable walking. These include footpaths (84%), street shoulders (73%), bus stops (95%) and walking trails (66%) (see Table 12). Moreover, 98% of participants lived in areas where the speed limit was 60km per hour or less. These findings are consistent with participants’ perceptions of high levels of walkability in their areas (as measured by the NEWS).16 However, some negative traffic aspects were also recorded, including aggressive drivers observed near 37% of homes and the absence of crossings in 36% of the areas observed. These features are likely to pose a hazard for older pedestrians.
Table 12. Features associated with walkability
In terms of the social environment most participants lived in areas that were well populated, with teenagers visible in 85% of neighbourhood segments, children visible in 55%, and older adults visible in 78% of segments. These findings indicate a broad range of ages living in the neighbourhoods. Moreover, positive social contact was common (51%). No surveys reported hostile behavior (see Table 13).
Table 13: Social environment
Walkability Yes %
Presence of foot paths 84
Presence of bike lanes 29
Presence of street shoulders 73
Presence of bus stops 95
Presence of walking trails 66
%
Any people visible in this segment? 93
Any children visible? 55
Any teenagers or adults visible? 85
Children engaging in active behaviours? 36
Teenagers or adults engaging in active behaviours? 58
Any older adults? 78
Older adults engaging in active behaviours? 55
Are people stopping to talk? 51
Are people fighting, or acting hostile? 0
Any stray dogs or cats? 3

33
WHICH GROUPS OF PEOPLE ARE LIKELY TO BE MOST DISADVANTAGED BY HAVING HOMES THAT ARE LESS SUPPORTIVE IN TERMS OF ACCESSIBILITY, USABILITY AND SAFETY?
A number of measures were used to define less supportive environments in terms of accessibility, usability and safety.
• Accessibility was defined by scores on the NEWS C (access to shops)16
• Usability was defined from the Usability in My Home scales
. 15
• Safety was defined by HOME FAST scores
. This measure provides two summary scores: Usability Part A – suitability for activities of daily living; Usability Part B – suitability for leisure and social activities.
3 and from the neighourhood satisfaction scale (neighbourhood satisfaction and neighbourhood safety sub-scales).
17
We compared people who could be considered to be living in less supportive homes and neighbourhoods, based on these measures, according to gender, transport (whether people drive themselves or not), housing type (house/apartment/ other), function, and health-related quality of life. Function was measured by the Late Life Function and Disability Index (LLFDI) dimension scores for frequency and limitation of activities (higher scores represent higher levels of function)4 and quality of life was assessed using the SF-36 health-related quality of life profile (with higher scores representing better health-related quality of life).
On these comparisons, a number of factors were associated with living in less supportive environments (see Table 14). The factors most consistently associated with less supportive homes and neighbourhoods were physical function, mental health, and social function sub-scales of the SF-36 and limitations on the LLFDI. These results indicate that the homes are less supportive for people who have higher levels of disability, and suggest that the favourable perceptions of usability reported by most participants may attenuate as they age and if their functional capacity declines.
5
Gender was not strongly associated with being in less supportive environments, except that men were more likely to have lower ratings of access to shops and services. This gender difference is consistent with the finding that drivers also tended to rate access to shops and services more poorly than non-drivers (and men are more likely to be drivers).
While drivers had lower ratings on access to shops and services, non-drivers had lower ratings on neighbourhood safety. Potentially, those who live further from shops may be more likely to continue driving than those where these services are more accessible. However, those who don’t drive may feel more vulnerable in their environments.
Living in an apartment was associated with lower ratings on usability in terms of activities of daily living, suggesting that the design of apartments may not be ideal for older people, particularly those with higher levels of disability.

34
Table 14. Factors associated with less supportive environments (only significant associations are shown)
Characteristic Usability A: Activities of Daily Living, Usability
Usability B: Leisure and social activities
NEWS C Access to shops, services, transport
Neighb’d satisfaction
Neighb’d Safety
HOME FAST Score
Gender Males
Transport Drivers Don’t drive
Housing Type Apartment
SF36 health-related quality of life
Physical Function Lower Lower
Mental Health Lower Lower Lower Lower
Social Function Lower Lower Lower Lower Lower
Late Life Function and Disability Index (LLFDI)
Total Dimension Score (Frequency)
Worse scores
Total Dimension Score (Limitation)
Worse scores Worse scores
Worse scores
Worse scores
Another way of looking at the relationship between housing and neighbourhood characteristics and disability is to assess the correlation between scores for the measures of housing and neighbourhood and scores on SF-365 and LLFDI.4 Significant correlations between home and neighbouhood scores and SF-36 are shown in Table 15, and correlations between home and environment scores and LLFDI scores are shown in Table 16. There were significant correlations between many of the SF-36 sub-scales and Usability in My Home scores,15 perceived access to shops and services (NEWS Part C)16, Neighbourhood Satisfaction and Neighbourhood Safety.16 The physical function sub-scale was particularly associated with all these measures. These associations indicate that people living in more supportive environments are likely to have better health-related quality of life (and vice versa).
LLFDI scales and sub-scales were associated with all housing and neighbourhood scores, except Neighbourhood Safety. Higher LLFDI scores (better functioning) were associated with higher home and neighbourhood scores (better usability, access and satisfaction). The negative correlation between LLFDI scores and HOME FAST3 scores (where higher scores are worse across the continuum of scores) indicates that the worse a person’s physical function is, the more home hazards they have. Thus, those with the greatest physical vulnerability also have the most home hazards.
There were no significant correlations between scores on physical measures (grip strength, peak flow, body mass index, short physical performance battery20 and the timed up and go21) and these home and neighbourhood characteristics (data not shown).

35
Table 15: Simple correlations between home and environment scores and SF-36 (only significant correlations are shown)
SF-36 Usability A
Usability B Access to shops,
services, transport
Neighbour-hood
satisfaction
Safety HOME FAST Score
Physical function 0.238 0.163 0.145 0.151 0.164
Role physical 0.213 0.153 0.156
Bodily pain 0.220
General health 0.182 0.186 0.185 0.203 0.142
Mental health 0.148 0.240 0.166
Role emotional 0.147 0.221
Social function 0.129 0.157 0.255 0.145
Vitality 0.276 0.277 0.181
BMI -0.206
Blank cells indicate no significant correlation. Correlations that were statistically significant at alpha = 5% are shown in the Table.
Table 16: Simple correlations between home and environment scores and LLFDI
(only significant correlations are shown) LLFDI Usability
A Usability B
Access to shops, services, transport
Neighb’d satisfaction
Safety HOME FAST Score
Total dimension score (frequency)
0.166 0.178 0.166 0.339 -0.189
Social role sub-score 0.183 0.209 0.168 0.430 -0.168
Total dimension score (limit) 0.238 0.281 0.190 -0.247
Instrumental role sub-scale 0.235 0.239 0.214 0.166 -0.244
Management role sub-scale 0.148 0.209 0.192 -0.222
Total function score 0.191 0.190
Upper extremity -0.178
Basic lower extremity 0.205 0.206
Advanced lower extremity 0.192 0.163
Blank cells indicate no significant correlation. Correlations that were statistically significant at alpha = 5% are shown in the Table.

36
WHAT ARE PEOPLE’S EXPECTATIONS OF THEIR HOUSING NEEDS AS THEY AGE AND HOW WILL THESE NEEDS BE MET?
Many people (35%) answered “yes” to the question about whether they felt their housing needs would change in the next 10 years, and 18% answered “yes” to the question as to whether they had plans to move at some time in the future. The majority of people (70%) reported they had already made some changes to their home in the last five years, with most common changes being bathroom modifications (27%), kitchen modifications (22%), and changes to garden and outdoor area (30%) (see Table 16).
Table 16: Modifications made to the home in the past five years
Item %
Are you able to make changes to your home if you need to?
89
Have you made any changes? 70
a. Modify entrance to house 12
b. Replace steps with ramp 5
c. Modify doorways 7
d. Widen hallways 3
e. Modify bathroom 27
f. Replace bathroom floor 12
g. Modify kitchen 22
h. Move light switches 4
i. Install extra lighting 11
j. Install extra power-points 13
k. Change garden /outdoor area 30
l. None of the above 30

37
In order to further explore people’s expectations of their housing needs, the HAIL project included semi-structured interview questions that asked about people’s perceptions of their homes and their expectations of their future housing needs. The interviews were recorded and transcribed verbatim. Transcripts were coded within a computerized qualitative analysis program (called Nvivo) to identify broad themes. These themes are summarised below and related to people’s attachment to their homes, and how they planned to adapt either their homes or themselves in relation to their changing needs. Since most HAIL participants lived in urban areas, owned their own home, and had usually been in the same home for many years, these reflections need to be interpreted in this light. Issues for renters, for people with less stable housing histories, and those living in regional and rural areas may well be very different.
Each theme is summarised below.
Housing choice
For many participants, their current home was a long-term residence of 50 years or more, and many had lived in the area since their youth. For these people, the home was decided upon in the early stages of their marriage and was an integral part of their adult life and identity. Many participants had planned their home and built it themselves. Homes were built to allow space for children, and as a long term investment.
Other residents had been in their current homes for a shorter period. Some participants, for example, had moved into a new home after recently marrying, where both partners invested in a new home, or one partner moved into the existing home owned by the other person. Other people had moved homes as part of their retirement transition. Some people said they moved for family reasons such as children growing up and moving away so that the “house outlived its usefulness”. Other participants wanted to be closer to family members, and some had decided to move after the death of their spouse.
Some participants had decided to move because of changes in their local environment such as “getting out” of a built up area in the city, or having their area re-zoned for high rise developments. For some participants a move made good financial sense, and for others a move was necessary as they could no longer be dependent on using a car and needed to be closer to public transport. Others decided to move because of difficulties continuing to manage a large yard, or because they were no longer working and could consider their housing options more freely. One participant suggested that the reason they were living where they were was determined by government strategies for settling new migrants when they first came to Australia.
Attachment to place
Many participants described their levels of attachment to the area where they lived or the specific home that they lived in (sometimes returning to live in the same place after periods of living elsewhere). Most participants were reluctant to consider moving because of their sense of connection with long-term neighbours, and their preference to be settled rather than moving to different places and having to re-establish connections. This sense of connection persisted even after neighbours moved away, with some participants stating that they still called houses by their ex-neighbour’s names after they had left. A positive sense of connection with a location appeared to be related to having grown up in the same area.
Many participants simply “loved” the area that they lived in, with one participant considering that they lived in “paradise.” Participants mentioned the value of access to the beach and bays, even if it meant walking up and down hills to get there.
For some participants, their attachment to the home was related to them having built the home themselves. Several participants were tradespeople during their working lives and had a substantial personal investment in their home because of their personal efforts in building it – often with help from family members, either physical assistance or pooling resources to finish the home. These participants had further cemented their investment in their home by continuing to work on the house over the years of their residence, to improve it.
Some participants who had already moved to down size and have less maintenance, still missed the old home.

38
Financial issues
Many participants reported having lost funds in the recent global economic downturn, and therefore could not foresee being able to afford any major changes that may be needed to their homes, such as changes to kitchens and bathrooms. Many participants had already committed what funds they did have to providing financial assistance to their children. Participants recognised that they might have limitations in funding to increase their comfort but they were mostly concerned about their financial security.
Changes to the home over time
Participants acknowledged the challenges of deteriorations to their home (especially paintwork), and the need for more maintenance over time. One participant suggested that “everything’s getting a bit battered.”
Many participants had made changes to essential household features such as improving the lighting, adapting or changing furniture and cupboards, and updating floor coverings. Some participants had made more value-added changes such as ducted air conditioning and ducted vacuuming facilities.
Some participants described more extensive physical changes to the structure of the home over the time of their residence such as extensions, adding an extra storey to allow part of the house to be rented out, provision of an outdoor undercover entertaining area, putting in a pool, adding a car port, or adding an entertaining room. Many of these alterations were made to accommodate changes in the family. Some participants mentioned specific changes related to providing accommodation for older relatives living with them (such as a ramp or an extension), and providing a new bathroom and toilet when mains sewerage became available.
Some changes over time were related to activities that participants valued, such as having a “decent workshop,” or providing switches to allow for the installation of a computer. Other changes were related to the organisation of existing rooms within the house to meet changing needs.
Views about the future
Participants seemed to fall into one of three groups in relation to their future – resistant to change, considering change reluctantly, or disregarding change while they are well.
Resistance to change: Some very extreme statements were made such as they would only leave their homes “in a box”, or that if they needed to move into a nursing home they would “walk into the water at the beach.”
Considering change reluctantly: Most participants had given some thought to changes needed in the future. Many participants associated getting older with frailty. Many dreaded the potential to need to be cared for by others, and would only consider supported living if they were totally incapacitated and needed a nursing home. Some participants were concerned about having no family to depend on for the future, should the transition to further care become necessary, and participants who lived alone acknowledged that they viewed the future differently in terms of being willing to consider moving into a hostel. Many participants had observed what has happened to other older people they know who had moved into hostels, or had experienced a stroke, and tended to compare themselves to them when reflecting on their future needs. Others were aware that difficulties with the loss of a driving licence were inevitable, as well as difficulties of maintaining their property long term, and that these issues may force them to consider a change in their housing. Some participants had their name on a reservation list for a hostel as a kind of insurance for the future, but were not really intending to move. They were more likely to wait until their need for such accommodation became more urgent before considering this seriously.
Other strategies to accommodate changing needs included planning to live downstairs in a two storey home if their abilities deteriorated.
Some of the married participants described a lack of agreement between them and their partners about their future housing needs and plans.

39
Disregarding change: Some participants chose not to think about future changes to their housing unless they were forced to by immediate changes to their circumstances or health status. They were realistic about the future but decided not to think about it while they were healthy. They had the view that whilst they were mobile they would stay at home, and that there came a point where they were too old to consider a move. One lady imagined her future:
“ I just have a feeling that people will say that funny old lady that lives up there on the corner with those animals and that overgrown garden and they’ll be all talking about me. Because I’ve made no arrangements to go anywhere or do anything...”
Some participants described the need for them to add special equipment (such as adjustable beds) or to modify the home to meet the changes in their needs as they age. For instance, many people suggested they could replace steps with ramps if needed. In some cases, modifications had been done already to assist older relatives living in the home (such as putting rails on stairs), or the need to be closer to the toilet had meant that bedrooms were re-organised within the home.
Many people described changes in their own behaviours and expectations, rather than changes to their environment. These changes included, quitting activities such as bowls (because of vision problems), no longer attempting long trips in the car, and taking more time to do things such as caring for the garden and lawns. Other participants planned to delegate tasks to others such as getting a tradesman to work on the house rather than doing the tasks themselves, especially tasks that involved the use of ladders due to an increasing loss of balance.
Participants attributed changes in their activities to various health challenges such as loss of memory, problems with knees, slower walking, difficulties with balance, difficulty with bending and reduced energy. Participants were concerned about their reduced activity levels, and described a general slowing down and avoidance of strenuous activities.
People also described how they would “look out for each other”, noting if neighbours had not been seen for a day or so, and having sets of each other’s keys for emergency use.
Participants described difficulties with tasks around the house, such as cleaning gutters, cleaning windows, working on ladders or getting up to the ceiling to do work, working on the roof, maintaining the house and garden, and heavy housework.
Participants also described limitations with selected activities, such as no longer being allowed to go out in their boat alone, difficulty playing bowls and challenges with increasingly complex technology (phones, TV’s).

40
IMPLICATIONS AND CONCLUDING COMMENTS
This report provides a large amount of information on the homes and neighbourhoods of over 200 people aged 70-75 living in New South Wales. Most of these people owned their own homes, and most were very satisfied with their homes and neighbourhoods. However, objective assessment of the homes indicated a level of need in terms of the proportion of participant’s homes that were considered to be at risk on the HOME FAST3 checklist, or non-compliant on items of Australian Standard AS 4299.1
There are some limitations to the generalisability of these findings, in that the HAIL study involved people in a narrow age range and from selected urban neighbourhoods who were already participants in the NSW 45 and Up study. It should be acknowledged that the suburbs selected for the HAIL study are not typical of all neighbourhoods in NSW. The suburbs were particularly selected to be those where a large proportion of the population are older. These suburbs would be expected to be more “age friendly” than areas with more diverse age ranges, and are more established with older homes. A survey of older people in newer suburbs may yield different findings in relation to the proportion of homes meeting the Australian Standards and levels of hazards. A comparison of newer and older suburbs would yield interesting results.
This study was limited to urban areas. Rural homes and neighbourhoods are likely to exhibit different features, particularly with respect to access to shops and services.
The HAIL participants may also be biased towards those who are more healthy and able. A study involving people with greater levels of disability may find stronger associations between disability and environmental factors. It would also be of interest to observe the changes in the association between functional capacity and housing and neighbourhood features as the HAIL participants age. None-the-less, the findings do provide insight into how older people relate to their homes and neighbourhoods, and some of the ways in which their home and neighbourhood environments contribute to their experiences in older age.
HAIL participants have lived in their homes for many years, and most expect to continue living in their homes for some time to come. Most people’s homes were built long before current legislative changes or building standards were introduced, and despite many having been modified in recent years, most of the homes do not meet the Australian Standard AS 42991 and may not be suitable for people as they age and develop increasing physical disability. Moreover, assessment of home hazards using the HOME FAST3
Bathrooms are a particular area in need of attention with many not having adequate levels of access or safety. A focus on bathroom design and modification could be included in education to consumers, suppliers, and legislators.
instrument indicates that many homes (27%) present falls risks for the participants – those with highest levels of disability having the greatest level of risk.
Cooling of housing is a potential issue for older people.
It is of interest that the participants themselves rated their homes highly in terms of usability and accessibility. There appears to be a mismatch between what participants want and expect from their homes and what they may need to support them in their older age. However, it is also worth noting that people living in apartments were least likely to rate their homes highly in terms of usability. Further investigation of the appropriateness of the stock of apartments for older people would be useful, particularly since this is a favoured option for many people who choose to move to a smaller dwelling as they grow older.
The results suggest that policies and systems are needed so these homes can be appropriately modified and adapted according to current standards. These might include information services, education, and incentives for people to build and modify homes appropriately, and services to help people access appropriate tradespeople. There appears to be a need for education for older people, especially those entering retirement or considering home modification, down-sizing, or moving to a new area. This information should include advice about what to look for in supportive housing for older age. User friendly self-assessment and rating systems may also help, such as a star rating system for houses and neighbourhoods, or a self-assessment checklist.

41
For new individual residential buildings, government and council organisations need to work together to ensure that development applications accommodate at least the essential aspects of the AS 4299 recommendations.1 Policies are needed to encourage the market, including the private sector and local government, to develop housing products to meet future needs.
The Australian Standard AS 4299 was designed to inform people making modifications to their home, to assist people to decide if they should stay in their current home or move to a more suitable home, and for those who are considering building a new home. The AS 4299 defines housing design features that are easily adapted to accommodate the changing needs of the occupants.1 Essential features include: a continuous path of travel; adequate circulation spaces; and appropriate fittings and their placement. These features of adaptable housing are distinct from accessible housing (which is purpose built for people with a disability according to AS 1428 standards for public buildings), or adjustable housing (where features are adjustable – such as heights of door handles, kitchen benches etc). If homes are designed according to AS 4299, any adaptations required later on should require less work at less cost. If adaptable, homes should also be suitable enough that older people will not need to move to more accessible accommodation in the future. Therefore, adaptable housing is referred to as “housing for life.” The Master Builders Association estimates that these principles can be incorporated into the construction of a new home for as little as 2-6% of the cost of construction. Yet, most homes do not currently comply.
While most of the neighbourhoods included in the HAIL project rated highly on both subjective and objective measures, some features are worth further consideration. Parking was one area that was rated most poorly by participants. Access to hospitals, supermarkets, and fruit and vegetables are other important considerations in the development of age friendly communities. Although living in urban environments, a large proportion of HAIL participants reported they were more than 30 minutes from a hospital, and women and those who lived alone were particularly vulnerable to being more than 30 minutes of a hospital. Also, while most people had access to a convenience store, access to supermarkets and fresh fruit and vegetables stores within convenient walking distance was limited for many participants.
These findings from the HAIL study have considerable policy implications. Development of age-friendly communities is receiving attention at all levels of government and is a priority for ageing research, policy and planning, and service provision. Current NSW state government policies, including the NSW State Plan and Towards 2030: Planning for our changing population,2 outline actions and commitments which are relevant to these findings. These include: specific commitments to encourage the take up of universal design principles; support for long term planning that is sufficiently flexible to accommodate the changing population demographic; a focus on "walkable and wheelable" and safe communities; and a focus on ensuring the principles of early intervention and prevention, and social inclusion, are firmly embedded in policies and programs. There is currently no plan to mandate housing standards for older Australians. However appropriate design and housing adaptation may be encouraged by providing education and tools to assist planners, builders and developers, and older people.

42
REFERENCES
1. AS 4299—Australian Standard Design for adaptable housing. (1995) Standards Australia International Ltd, GPO Box 5420, Sydney, NSW 2001, Australia. ISBN 0 7337 3927 X.
2. New South Wales Department of Premier and Cabinet. (2008). Towards 2030: Planning for our changing population. Sydney, NSW, Australia. ISBN 978 0 9752356 2 1. Available from http://www.nsw.gov.au/towards2030 Accessed 17 March 2011
3. Mackenzie L, et al. (2002). Reliability of the Home Falls and Accident Screening Tool (HOME FAST) for measuring falls risk for older people. Dis & Rehab; 24(5):266-74.
4. Jette A et al. (2002). Late Life Function and Disability Instrument : I. Development and evaluation of the disability component; and Haley S, Jette A et al. (2002) Late Life Function and Disability Instrument: II. Development and evaluation of the function component. (LLFDI). J Gerontol A. Biol Sci Med Sci; 57A(4):M209-16 and 217:222.
5. Ware J, et al. (1994). SF-36® Physical and Mental Health Summary Scales: A User's Manual. Boston, MA: The Health Institute.
6. WHO. (2007). Global Age-friendly cities: a guide. http://www.who.int (Accessed 6 Mar 2008).
7. Commonwealth of Australia. (2010). The 2010 Intergenerational Report. Canberra.
8. AIHW. (2007). Older Australia at a glance: 4th edition. Cat. no. AGE 52. Canberra: AIHW.
9. Australian Bureau of Statistics. (2003). Disability, Ageing and Carers: Summary of Findings, Australia. Cat. no. 4430.0. http://abs.gov.au/AUSSTATS/[email protected]/DetailsPage/4430.02003?OpenDocument (accessed 17 March 2011)
10. Giles L, et al. (2003). Disability in older Australians: projections for 2006-2031. Medical J Aust; 179(3):130-3.
11. Kendig H. (2000). Ageing and the built environment. In Troy P (Ed). Equity, Environment, Efficiency: Ethics and Economics in Urban Australia. Melbourne University Press, Victoria.
12. Centers for Disease Control and Prevention. Healthy ageing and the built environment. http://www.cdc.gov/healthyplaces/healthtopics/healthyaging.htm. Accessed 17 March 2011
13. Jette A. (2006). Toward a common language for function, disability and health. Phys. Therapy; 86(5):726-34.
14. WHO. (2001). International classification of functioning, disability and health: ICF. Geneva, Switzerland. World Health Organisation.
15. Fänge A, et al. (2003). Accessibility and usability in housing: construct validity and implications for research and practice. Dis & Rehab; 25(23):1316-25.
16. Saelens B, et al. (2003). Neighborhood-based differences in physical activity. An environment scale evaluation. Am J Public Health; 93(9):1552-8.
17. Young A,et al. (2004). The sense of belonging to a neighbourhood: Can it be measured and is it related to health and well being in older women? Soc Sci Med; 59(12):2627-37
18. Stalvey B, et al. (1999). The Life Space Questionnaire. A measure of the extent of mobility of older adults. J App Geron; 18(4):479-98.
19. Hoehner CM, et al. (2007). Active neighborhood checklist: a user-friendly and reliable tool for assessing activity friendliness. Am J Health Promot; 21(6):534-7.
20. Guralnik J, et al. (1994). A short physical performance battery assessing lower extremity function. J Gerontol; 49(2): M85-94.
21. Podsiadlo D, et al. (1991). The timed “up and go”: a test of basic functional mobility for frail elderly persons. J Am Geriatr Soc; 39(2):142-8.