Embed Size (px)
Citation preview


ABSTRACT
ENVIRONMENTAL AND ECONOMIC IMPACT OF
UNDERGROUND STORAGE TANKS IN THE
UNITED STATES AND TERRITORIES
By
Clete R. Helvey
December 1992
The existing population of Underground Storage Tanks
(USTs) in the United States is enormous. The three major
problems relating to (USTs) which must be addresses by
communities and UST owners are: (1) the large number of
aged USTs in the United States without adequate leak
protection, (2) the risks associated with UST management
and (3) the rising costs of UST remediation and regulation
requirements. The consequences of using USTs for storage
of liquid fuels and chemicals are addresses in this paper.
The discussion involves such parameters as age, material,
product, corrosion, location and quantity. All of these
parameters have a direct influence on the environmental
and economic impact of USTs in the United States. It will
be seen that while age, material and corrosion play a
T257860


2
major role in the number of leaking USTs; product,
location and quantity are major factors associated with
the impacts of those leaks.
This paper discusses the number of existing USTs and
the percentage of those that are leaking. It also
presents the costs associated with the remediation of
those leaks and the separate costs of replacing or
updating old USTs to meet the new Environmental Protection
Agency (EPA) regulations.


ENVIRONMENTAL AND ECONOMIC IMPACT OF
UNDERGROUND STORAGE TANKS IN THE
UNITED STATES AND TERRITORIES
A THESIS
Presented to the Department of Civil Engineering
California State University, Long Beach
In Partial Fulfillment
of the Reguirements for the Degree
Master of Science
By
Clete R. Helvey(t
B.M.E., 1984, Georgia Institute of Technology
December 1992


WE, THE UNDERSIGNED MEMBERS OF THE COMMITTEE,
HAVE APPROVED THIS THESIS
ENVIRONMENTAL AND ECONOMIC IMPACT OF
UNDERGROUND STORAGE TANKS IN THE
UNITED STATES AND TERRITORIES
By
Clete R. ^Helvey
COMMITTEE MEMBERS

/ <

VA
ACKNOWLEDGEMENTS
There are many people to thank. To those in the
Federal Government, especially Mr. Troy Harper, and Mr.
Bill Lenish of the EPA; Mr. Herb Frazer, Mr. Steve
McDonald, Mr. Reece and Mr. Chris Leadon of the DOD who
gave me the assistance and information most expeditiously
and without pause. To those in the State Governments
especially Charlene Herbst who, also, without pause gave
of their time to provide requested information. To my
personal friend, Dr. William Drukker, for his installment
of wisdom and enthusiasm. To Ms Kathy Striegl, who's help
in preparing this thesis was invaluable. To Dr. Cowan and
Mr Wael Ibrahim for taking time out from their busy
schedules to review and participate as committee members
for this thesis. Finally, I would like to express my
thanks and appreciation to my thesis advisor, Dr. Joseph
Plecnik, for his advice, support and patience, without
which the thesis Environmental and economic Impacts of
USTs in the United States would not have been.
111


TABLE OF CONTENTS
Page
ACKNOWLEDGEMENTS iii
LIST OF TABLES vi
LIST OF FIGURES vii
Chapter
1. INTRODUCTION 1
2. PERSPECTIVE ON THE PROBLEM 4
Overview 4
Leaks 5
Construction of USTs 6
Products Stored in USTs 6
Regulated vs. Unregulated 7
Leaking USTs 8
Tank Construction 10
Corrosion 12
3. ENVIRONMENTAL AND ECONOMIC IMPACT 16
Numbers of Leaking USTs 17
What About the Millions of UnregulatedUSTs? 18
Contamination Profile 19
Cost Overview for Leaking USTs 22
Cost Estimates 24
Financial Responsibility Requirements . . 29
Requirements and Shortcomings of theFinancial Responsibility Regulations . 33
iv


V
Chapter Page
Financial Responsibility Deadlines . . 35
4. DETAILED STATISTICS ON IMPACTS OF USTS ... 37
Petroleum USTs 3 8
UST Material 41
UST Regulations 44
Upgrading Expenses 48
Numbers of Leaking USTs 50
UST Locations 57
Fate of the USTs 59
Above Ground Storage Tanks 61
The Decision 63
Tanks in Vaults 65
The UST Market 66
5. CONCLUSIONS 68
USTs Abandoned in Place 72
APPENDIX 74
REFERENCES 98


LIST OF TABLES
Table Page
3.1. Clean Up and Replacement Costs for a5000 and 7000 Gallon UST 28
3.2. Financial Responsibility Deadlines .... 35
4.1. New Tank Requirement 4 6
4.2. Existing Tank Requirements 47
4.3. Civil Penalties 48
4.4. Leak Detection Costs 49
4.5. Sample Survey of Leaking USTs over20 Years Old 51
4.6. Estimated Number of Leaking Regulated USTs 54
4.7. UST Population Density Table 59
4.8. Advantages and Disadvantages of USTsand ASTs 62
5.1. Corrective Action Measures FiscalYear 92 69
VI

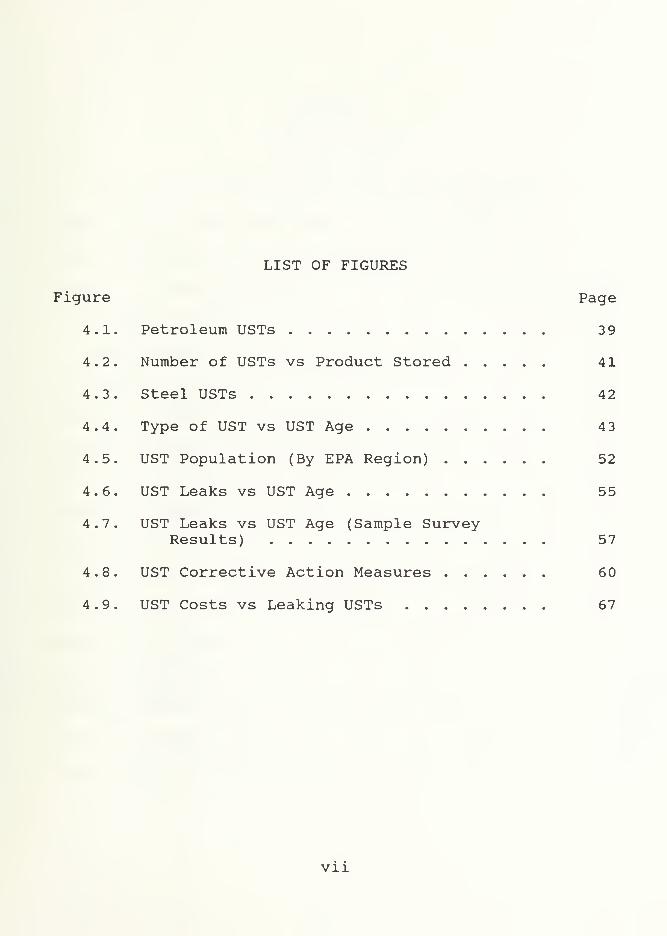
LIST OF FIGURES
Figure Page
4.1. Petroleum USTs 39
4.2. Number of USTs vs Product Stored 41
4.3. Steel USTs 42
4.4. Type of UST vs UST Age 4 3
4.5. UST Population (By EPA Region) 52
4.6. UST Leaks vs UST Age 55
4.7. UST Leaks vs UST Age (Sample SurveyResults) 57
4.8. UST Corrective Action Measures 60
4.9. UST Costs vs Leaking USTs 67
VII

CHAPTER 1
INTRODUCTION
The use of tanks for storing liquid fuels has been a
common practice for many years. The placement of these
tanks underground, has been going on for well over forty
years. (A tank is considered to be an underground storage
tank (UST) if 10% or more of its volume, including piping,
is underground) . Savings in space, safety from fire and
explosions, and visual aesthetics were some obvious advan-
tages to locating tanks underground. However, such use as
liquid storage vessels has not been without problems.
Today, the environmental impact of leaking fuel from USTs
into the ground water and soil poses significant issues;
only very recently have corrective measures been taken.
Without regulations as a guide, the practice of
placing tanks underground went virtually unchecked for
more than 40 years. The result was literally millions of
underground tanks. Determining the exact numbers and
locations of USTs is an enormous task which may never be
realized, simply because there was until recently no
requirement to maintain records for them. Many are no


2
longer in use, some have been forgotten and a goodly
number are leaking.
The number of USTs leaking is truly an unknown. More
precise statistics have been tallied since mandatory
reporting and registration of USTs was required by Con-
gress in 1984 under Subtitle I of the Resource Conser-
vation and Recovery Act (RCRA) . Clearly, however, those
forgotten may never be counted. By 1992, over 25 states
cited leaking USTs as the #1 threat to the nations ground
water [5]. (Unless otherwise noted, the word nation as
used in this paper will include all of the United States
and the territories; Guam, Virgin Islands and Puerto
Rico) . Leaking USTs not only contaminate ground water,
but also threaten public safety. Explosions, fires, and
contaminated soil are common hazards associated with
leaking USTs. Cleanup costs associated with leaking USTs
are considerable and escalate with time and ongoing leak-
age. While there are still advantages in placing tanks
underground for storage of liquid fuels, the expenses
related to new environmental rules have likewise dramati-
cally multiplied the cost of doing business using USTs.
Regulations implemented by the environmental protec-
tion agency (EPA) in the Code of Federal Regulations (40
CFR, parts 280 and 281) , as a result of RCRA, require leak
detection, financial responsibility (to cover mitigation


3
costs in case of leakage) , and accountability records for
USTs. These regulations require management of both newly
installed and existing USTs. Older USTs must thus be
upgraded to meet the new regulations for leak detection,
financial responsibility, and accountability records. In
view of the high cost of upgrade, replacement of the tank
is often the most economical solution. The more serious
problem may well be that the regulators are relying on the
regulated far too much for registration and leakage data
input. If not a classic case of the fox guarding the hen
house, it is at least a most troubling aspect of this
national debt-like dilemma.

CHAPTER 2
A PERSPECTIVE ON THE PROBLEM
Overview
The following background data collected on USTs
includes information on numbers of tanks placed under-
ground for liquid fuel storage, types of materials used
for tank construction, tank sizes, products stored, regu-
lated versus unregulated UST, corrosion concerns and the
best insight on the scope of the leakage problem.
Current statistics are by no means all inclusive and
do not include every underground storage tank in this
country. The largest obstacle in obtaining data was the
many inconsistencies detected in the various reference
sources. There was no agreement at all as to the exact
number of USTs nationwide. Each reference gave only
estimates; some used ranges while others offered approxi-
mate amounts. For example, reference 5 estimated 326,000
motor fuel storage tanks, adding that the EPA believed at
least one third of these tanks are leaking. Reference 18
indicates that there are an estimated 5 million USTs
across the country and that about one in four is leaking.
This source does not describe the contents or use of the
tanks and bases its 5 million on an estimate from a spe-


5
cialist with the New York based Environmental Defense Fund
(EDF) . In sharp contrast, reference 24 asserts a range of
USTs on the order of 7 to 15 million nationwide. This
estimate includes all regulated and unregulated tanks:
tanks used for heating oil for homes (3 to 5 million)
,
commercial use (1 to 2 million), motor fuel storage and
regulated tanks (2 million) , and an unknown number of UST
at industrial sites for chemical storage and flow through
manufacturing processes which store waste water. Even the
figures from government agencies are guestionable, despite
the implementation of UST regulations under 40 CFR, re-
quiring compilation of information into an updated data
base of all tanks under their jurisdiction. On a regular
basis, agencies report discoveries of USTs not previously
recorded.
One fact is inescapable: no one knows for certain the
quantity of USTs buried beneath our crust. Determining
the exact number is beyond the scope of this paper and
probably not terribly relevant to the solutions suggested
herein.
Leaks
How many USTs are really leaking? The wide ranging
estimates of total USTs make determining exact numbers of
leaking USTs impossible. However, for purposes of this
paper, estimated percentages will be used based on a


6
statistical sample of some recently collected data, corre-
lated with tank ages and known numbers of leaking tanks
for a specific group.
Construction of USTs
There is little data describing the types of UST
construction material other than to report that most of
the tanks were constructed of steel in the 1950s and
1960s. Fiberglass Reinforced Plastic (FRP) was increas-
ingly used in the 1970s and 1980s. Other types of materi-
al included plastic, steel coated with plastic or FRP, and
concrete tanks. All of these materials have likewise been
used in tank replacement projects over the years.
Products Stored in USTs
USTs are used for the storage of many types of lig-
uids including various industrial chemicals and petroleum
products such as gasoline, JP5 and diesel fuel. This paper
will concentrate on the approximately two million USTs
regulated by the EPA which contain, for the most part,
petroleum products. The majority of the USTs so regulated
are auto/truck gasoline and diesel fuel storage tanks at
service stations.


7
Regulated vs. Unregulated
Of the close to two million regulated USTs, 97 per-
cent are used for storage of petroleum products with the
majority containing gasoline. The other 3 percent include
one or more of 701 chemicals listed under the Comprehen-
sive Environmental Response Compensation Liability Act
(CERCLA) , also know as the Superfund Act [25]. With
estimates of up to 15 million USTs, one might ask why are
not more tanks being regulated by the EPA? The answer
lies in 40 CFR parts 280 and 281 wherein regulations under
Subtitle I of RCRA. This section excludes farm or resi-
dential tanks of 1100 gallons or less storing motor fuel
for non-commercial uses, tanks storing heating oils for
use on the premises where stored, septic tanks, pipeline
facilities regulated under the Natural Gas Pipeline Safety
Act or other comparable state statutes, flow through
process tanks, storage tanks placed on or above the floor
of underground areas such as basements or cellars, and
tanks containing hazardous wastes regulated under RCRA
Subtitle C.
The EPA estimates the number of unregulated tanks to
be about 3.1 million, 2.7 million farm and residential
fuel tanks under 1,100 gallons and 0.4 million heating oil
tanks. Justification for non-regulation is premised upon
four rationale: (1) most are owned by home owners with


8
little expertise or finances to implement new regulations,
(2) the EPA has no significant mechanism yet in place to
regulate these extra tanks (3) uniform regulations
throughout the nation may be inappropriate because prob-
lems associated with these tank systems vary from area to
area, and (4) state and local governments can better
regulate these tanks based on localized conditions and
problems [25]
.
The EPA's total estimate for regulated and unregulat-
ed USTs is thus about 5.1 million USTs. Most likely the
actual number is significantly higher, primarily there is
no reporting requirement for unregulated tanks while in
the regulated category there may be hundreds of thousands
(millions) of forgotten or overlooked tanks.
Leaking USTs
Leaking USTs are becoming the environmental issue.
"These leaking USTs, spell trouble with a capital T," is a
typical comment made today when referring to USTs. Re-
ports citing a petroleum ocean of 250 million gallons of
gasoline under a Chevron refinery in California which
leaked from USTs on the site and an underground petroleum
lake of 17 million gallons at a site in New York are but a
few examples of this immense dilemma. But even small
leaks that go unchecked can be catastrophic to the envi-
ronment due to the contamination potential. There is also

9
substantial risk of explosions resulting from buildup of
gas vapors in basements, underground storm drains, and
sewers.
The largest concern to the environment at this time
is that of contaminating the nation's groundwater. The
leaking of one and one half cups of petroleum per hour can
contaminate one million gallons of water in a day [18].
Cleanup costs associated with petroleum contaminated water
are enormous; typically in the $100,000 to $1,000,000
range. Of the two million regulated USTs, the EPA estim-
ates about 25 percent are non-tight. This estimate is
based on various studies performed by states with local
UST programs and commercial UST users. These studies show
that, depending on location, material used, installation
method and maintenance program, between 11 and 48 percent
of the USTs leaked. The regulated USTs are located at
about 750,000 sites throughout the nation. Of these
sites, at least 100,000 have confirmed releases of hazar-
dous liquids into the ground. The majority of these leaks
come from single walled, steel tanks over 16 years old
[9]. Most existing USTs are made of bare steel [25].
Tank failure history shows that when these steel tanks do
leak from corrosion, it is almost always from external
corrosion. Of all the current causes of releases, cor-
rosion is by far the major contributor [4],


10
Tank Construction
A very recent EPA survey based upon reports by tank
owners in 56 states and territories shows that about 4 out
of 5 tanks are made of steel. This survey was conducted
in 1990 and updated April 1991 and includes all ages of
regulated USTs from to greater than 25 years old.
Roughly 2 5 percent of these steel tanks are over quarter
of a century old.
Fiberglass Reinforced Plastics (FRP) , on the other
hand, make up only ten percent of the existing USTs. Of
these, roughly 50 percent are under 5 years of age. The
popularity of FRP is, however, increasing, as indicated by
this last figure. Concrete is another material used to
construct USTs, but it is encountered in relatively low
numbers. Extended use data on other materials used for
USTs is not available.
New construction materials and methods are in various
stages of development. The use of steel tanks covered
with a plastic coat, steel-FRP composite, and combinations
of these with cathodic protection on the steel tank are
some of these innovations. One new tank, called the
STI-P3, is a steel tank with an external non-corrodible
coating and a factory-applied metal anode that sacrifices
itself to protect any bare spots on the tank. The tank
vessel is also electrically isolated from the attached


11
piping. The only documented failures associated with this
new tank have been attributed to improper installation
[4]. Steel-FRP composite tanks have not been used as much
as the FRP or coated and cathodically protected tanks.
About 65,000 steel FRP USTs have been installed and no
reported corrosion-related failures have occurred. As
more externally corrosion resistant tanks become avail-
able, the threat of internal corrosion may well take over
as the primary cause of tank failure. A recently sought
patent [19] shows an air pressurized void between the
inner and outer walls of a double wall tank that will plug
any holes as they develop and signal the leak due to the
drop in air pressure between the walls as indicated on a
pressure gage.
The need to develop a leak-proof UST is significant
for it will provide a safe and effective method of storing
fuels underground.
The problems associated with leaking USTs are many.
The difference in soils, climate, seismology and ground
water levels from area to area are just some of the vari-
ables that have to be taken into consideration when de-
signing a tank for underground use. The most abundant
material used for UST construction is steel. The current
estimate by the EPA for regulated USTs is about 1.6 mil-
lion steel tanks. FRP constructed tanks is second at


12
about 200,000; concrete constructed tanks at about 15,000
and the unknown and other category at about 3 00,000. Of
the tanks constructed of steel, the major concern at this
point is corrosion, both internal and external. Of the
approximately 1.5 million steel USTs about 1 in 8 has some
known form of protection either internal, external, cath-
odic or any combination of the three. Surveys by the EPA
show that the failure rate of tanks using new materials
and new methods of protection is very rare. The failure
rate of all existing FRP tanks is estimated to be about
1/2 of one percent. Of those FRP tanks that failed, the
one main factor contributing to the failures has been
improper installation practices.
Fiberglass Reinforced Plastic tanks are considered to
be rust free. Installation of FRP tanks underground is
however considered to be critical in preventing future
leaks. A small object such as a stone in the bed of an
FRP tank can in time cause a stress fracture and failure.
Surveys show that if an FRP tank fails from improper
installation it will typically fail within the first year
of installation.
Corrosion
The actual number of leaking USTs is unknown but what
is known is that the number one cause is corrosion. Most
existing USTs are made of material that is not corrosion


13
resistant, mainly steel. But even those UST systems with
corrosion protection experience failure due to such prob-
lems as imperfections in the coating or taping setup.
Depletion of sacrificial anodes, inadvertent interruption
of impressed current, or corrosion from inside by the
stored product, likewise account for leakage.
The EPA estimates that there were over 450,000 UST
systems in use as of October 1988, that were protected
from external corrosion. The EPA regulations for USTs
became effective in September 1988 with 40 CFR parts 280
and 281. These regulations mandated corrosion protection
and leak monitoring [4]. Although the regulations did not
require secondary protection, they do state that secondary
containment with interstitial monitoring would most likely
result in fewer releases to the environment compared with
protected single wall tanks with release detection.
The required corrosion protection can be obtained in
several ways: corrosion resistant coating, cathodic pro-
tection or by construction with composite. The regul-
ations do not stipulate that secondary protection is
required. Some states, however, require secondary protec-
tion and interstitial monitoring for tanks used in under-
ground storage of liquids. California, Kansas and
Maine are three such states but the list goes on. Some
states also require double wall piping for UST systems.


14
The specific construction techniques allowed by the
regulations to prevent galvanic corrosion are:
(1) fiberglass reinforced plastic, (2) coated and cathodi-
cally protected steel, and (3) steel with FRP composite.
Other methods of construction and/or use of other materi-
als is allowed, if it is determined that no less protec-
tion for the environment and human health will occur as a
result of their use. The purpose of this provision was to
allow for development and use of new techniques and tech-
nologies as well as to allow for design variations for
specific site conditions.
Existing USTs are included in the new regulations,
though most are not equipped with any release protection
or detection features. The new regulations, nevertheless,
require existing USTs to comply with corrosion prevention
and failure detection provisions or be closed. The owners
of these USTs are given 10 years to comply with regula-
tions commencing September 1988.
Most concern about UST corrosion has been from the
view of external corrosion. However, internal corrosion
could very well become the major corrosion problem with
the reduction of external corrosion by the newly required
corrosion protection techniques. Internal corrosion is
caused by the reaction of oxygen and water in the stored
product with the internal metal surface of the structure.


15
As more corrosion susceptible internal areas are discov-
ered, new methods for preventing corrosion of internal
surfaces are developed. One novel method uses a non-
corrosive protective coating or lining of the inside
surface. The use of FRP for tank construction does away
with the requirement for corrosion protection. However,
such USTs are more sensitive to failure because they have
less structural integrity compared to steel, additionally
they are susceptible to deterioration caused by the prod-
uct stored, especially alcohol. Indeed, the liquids of
most concern for non-compatibility are the various alcohol
blend fuels. The standard FRP tank can withstand alcohol
blend fuels with up to 10 percent alcohol. A special
resin must be used for FRP tanks that store blended fuels
with more than 10 percent alcohol content.
Present concerns are focused on determining the
number and location of leaking USTs and dealing with these
leaks. In order to prevent adding to the existing problem
new management practices must include new materials,
monitoring methods and leak detection for all new instal-
lations of USTs.


CHAPTER 3
ENVIRONMENTAL AND ECONOMIC IMPACT
Tanks were typically placed under ground to store
liquids that were hazardous because of their flammability
.
Aesthetics and space saving were added benefits of the
underground storage tank. Because most tanks were instal-
led underground without afterthought, little if any con-
sideration was given to the consequences of any leakage
that might occur.
With the discovery of leaking USTs came the realiza-
tion that major environmental and economic impacts would
ensue. In 1987, this realization came only too soon with
the discovery of gasoline odors coming from the tap water
in a farm house in Mount Sterling, Ohio and a gasoline
contaminated water supply in Northwood, New Hampshire. In
both of these cases, contamination of the ground water
came from long forgotten USTs.
Nationwide there are numerous documented cases of
drinking water wells that have been threatened or dest-
royed by leaking UST systems. Without knowing the exact
numbers of leaking USTs, one can only speculate on the
ultimate economic and environmental impact of the problem.
16


17
However, by extrapolating known data, a prediction of
impacts will be attempted.
Numbers of Leaking USTs
It can be assumed fairly reasonably that one-fourth
of the existing USTs are leaking, based on surveys by
state, local and industrial sources from Florida to Cali-
fornia [4]. Some industry sources estimate less than
three percent while others claim leaks could be as high as
50 percent in some areas. Leak tightness tests support an
average of 25 percent. Therefore, of the 2 million EPA
regulated USTs, 500,000 tanks are probably leaking to some
degree.
One study of a 1987 EPA "Causes of Release" document
[4] shows that 10 to 13 percent of the tanks 12 to 13
years old were non-tight. In another study, of the tanks
actually found to be leaking, 42 percent of the leakers
were 14 to 20 years old, and 30 percent of the leakers
were 10 to 15 years old. All of the tanks leaking were
constructed of bare steel. This would indicate that the
critical age in an unprotected steel tank is the period
between 10 and 20 years when failure due to corrosion is
most likely to occur.
Of the 750,000 sites regulated, the EPA has documen-
tation that over 100,000 of these sites have had releases
from the USTs located there. Estimates show that about 75


18
percent of the existing UST systems are without corrosion
protection. With this basis, the EPA estimates that as
many as 210,000 sites may be contaminated by leaking UST
systems [4]
.
What About the Millions of Unregulated USTs?
The above leak estimates are associated with regulat-
ed USTs. As indicated above, the EPA estimates 2.7 mil-
lion unregulated heating oil USTs and 0.4 million un-
regulated motor fuel USTs. In 1984, there were 425 re-
ported releases nationally from these unregulated USTs. In
1985 and 1986 there were 2,032 releases reported from but
three states (Maine, Maryland and New York) . The EPA
surmises that 95 percent of the unregulated USTs are
constructed of bare steel and lack corrosion protection,
that most residential heating oil USTs are made of thinner
steel than regulated tanks and one-third to one-half of
the unregulated USTs are over 16 years old. Consequently,
there is a tremendous potential for unregulated tank leak-
age with concomitant negative impact to the environment
and human health.
In any event, considering just the regulated UST
population, the number of sites needing significant clean-
up is expected to be in the tens of thousands nationwide.
The unregulated USTs may prove to be as devastating to the
environment as the regulated group. Careless past UST


19
management practices must be changed and modified with
real alacrity and concern for more than just financial
gain.
Contamination Profile
How much gasoline does it take to contaminate water
so that it is no longer suitable for consumption? As
previously noted, a leak of one and one half cups of
gasoline per hour can render one million gallons of water
per day unsuitable for consumption [18]. Another way to
look at it is that one gallon of gasoline can render 1
million gallons of water unsuitable for consumption [20].
Since such small amounts ruin the water supply it is
obvious that once gasoline reaches ground water there will
be major remediation expense. With ground water supplying
some 50 percent of the drinking water for the United
States population nationwide the potential for usable,
and/or consumable drinking water shortages is quite real.
Over 25 states claim that the number one threat to their
ground water supply is leaking USTs. The EPA estimates
that 11 million gallons of gasoline seep into the soil
each year [9], and while certainly not all of those mil-
lion gallons of gasoline leak into the ground water, a
large percent will eventually percolate into water tables
each year!


20
The potential environmental impact associated with 11
million gallons of spilled gasoline can be more easily
understood if compared to the 11 million gallons of oil
spilled in Alaska by Exxon's oil tanker, Valdez. There
are of course some major differences, since the EPA esti-
mate is an annual spill while the Valdez was a
one-time incident. Another variance is that the estimated
11 millon gallons of leaking gasoline is not concentrated
in one area, but dispersed into the many sites where USTs
are located. Arguably gasoline leaks over many areas
dilutes the impact, therefore, less of a problem exists
than if it were all leaked into one area. The dispersion
of this amount over many areas, however, could be even
more devastating because of its potential to contaminate
ground water at many different areas throughout the na-
tion. The EPA estimates that even with the new regula-
tions, 62,000 private and 4,700 public wells will be
contaminated with petroleum products over the next 3
years [18]
.
Another concern associated with leaking USTs is the
short term and long term health effects on both humans and
animals in the ecosystem. Petroleum, with its 300 compo-
nent chemicals, is linked with diseases such as cancer and
anemia. It also causes liver problems, spots on the brain
(that cause symptoms associated with Parkinson's disease


21
and multiple sclerosis) and eye and skin irritation. The
carcinogenic properties of the petroleum components ben-
zene, xylene and toluene are well documented. Benzene is
the most sinister for it can not be detected by smell or
taste until it exceeds the drinking standard level in
water. All three chemicals have long been used as re-
placements for lead in gasoline since it was banned so
that octane levels could be maintained. Furthermore,
these three chemicals, unlike other components of gaso-
line, are partially soluble in water, thus creating far
more complex treatment methods for gasoline contaminated
water.
The impact on the environment, however, is not limit-
ed to ground water pollution. Air pollution caused by
volatile substances in gasoline is a serious problem,
especially in parts of the nation where smog levels are
already high (Southern Californian Basin, Denver, Colorado
and the surrounding county) . Soil contamination caused by
leaking USTs is another problem that can effect the food
chain from plants to animals to humans. Finally gasoline
and the associated vapor/ fumes from leaking USTs storing
gasoline can collect in sewers, basements or cellars
eventually leading to explosions and fires. A recent and
devastating example of this is the destruction in
Guadalajara, Mexico. On April 24, 1992, explosions ripped


22
through the city and, according to the Mexican attorney
general, damaged 1,422 homes, 450 businesses, 600 vehicles
and gouged trenches in five miles of streets. Over and
beyond this tremendous physical was the human and economic
costs. Estimates made indicate over 2 00 people were
killed with over 65 million dollars worth of damage. And
this in a country that already has a staggering debt
problem. Petroleos Mexico (Pemex) , the Mexico City based
state oil company, has accepted responsibility for the
gasoline leak into the sewer system and offered to provide
$32.7 million to rebuild the 20 block area leveled in the
explosions. The cause of this disaster was attributed to
corrosion of an underground gasoline line , owned and
operated by Pemex, which crossed the southeast part of the
city and supplied one of the main storage and distribution
plants with gasoline. Unquestionably our local American
fire departments are (and should be) acutely interested in
USTs and their location, size, material of construction,
age, and contents. The recent disaster in Chicago with
underground flooding might be nothing to an urban confla-
gration caused by a leaking UST.
Cost Overview for Leaking USTs
Damage caused by leaking product from USTs can be
very costly. The factors affecting costs associated with
leaking USTs systems can be broken down into three major


23
areas of concern: (1) loss of UST use during corrective
action, (2) liability costs associated with public health
and environmental damage, and (3) remediation costs.
The first two cost areas, down time and law suits
involve many variables such as location and proximity to
population, ground water and use of USTs. Costs relative
to these areas are site specific and could vary tremen-
dously depending on litigation and changing times. As an
example, in the above Guadalajara, Mexico incident, what
price can be placed on 200 human lives? By the same
token, had this unfortunate event occurred in a less
populated area or at a time when people were at work or
away from home, perhaps fewer lives would have been lost.
However, it is not the aim of this paper to concentrate on
these type costs, but rather actual tank replacement and
remediation costs.
Cleanup or remediation of the leaked product from the
contaminated site will be estimated based on actual costs
from some specific sites that have been and are presently
contaminated. The primary factors affecting costs in this
area are the substance involved, the magnitude of release,
the hydro-geology of the site, the environmental standards
and criteria or objectives relative to the site
remediation plan. A risk management overview, as more
specifically detailed in the Underground Storage Tank


24
Guide [25], will also be given showing that remediation
costs can be very high. Although, liability costs could
exceed cleanup or remediation costs, (depending on circum-
stances as noted above) only cleanup costs will be ad-
dressed.
Cost Estimates
Perhaps up to $750 million is spent annually to clean
up leaks from USTs [10]. Much of the money is provided by
major oil companies trying to comply with environmental
laws. The costs associated with remediation is exemp-
lified by the following ground water contamination case.
In Clarksburg, New Jersey, leaking gasoline from USTs had
contaminated ground water at 12 feet below ground level.
The gasoline spread over the surface of the ground water
and eventually reached water wells that were used by
residents of the area. When the drinking water was found
contaminated by the plume of hydrocarbons, a cleanup was
ordered by the New Jersey State Environmental Agency. The
ground water is now being pumped through a process that
removes the contaminants by using a separator, a filter, a
granular activated carbon unit and an incinerator to burn
the expelled gases. It is expected that clean up of the
ground water at the Clarksburg site will take 5 years or
more. The pumping to clean up the water began in Nov. of
1989. After about two years, 1000 gallons of gasoline has


25
been extracted from about 2 million gallons of water. An
air powered pump, instead of electricity or other power
generating method that could produce a spark, is used to
pump the water out of the ground to minimize the risk of
explosion or fire due to the volatile gases in the water.
These special precautions are one reason why costs can be
high.
The compounds added to gasoline, and the required
processes to remove them, add time to the water treatment
procedure. These also cause costs for cleanup of gasoline
contaminated ground water to be high. As noted in the
Clarksburg case, treatment of gasoline contaminated ground
water can easily take over 5 years; costs for the cleanup
have already exceeded $350,000.
Risk management is a method of estimating costs that
are unknown or undeterminable and then choosing between
alternatives to manage these risks. In this paper only
expected costs will be determined, management alternatives
will not be addressed. One factor that cannot be deter-
mined with certainty is when or if a UST will leak. This
uncertainty can be accounted for by using leak data asso-
ciated with existing USTs and establishing probabil-ities
of leaks according to the data. As an example, the data
previously noted in this chapter shows that 10 to 13
percent of the existing USTs 12 to 13 years old experience


26
leaks, and 42 percent of these USTs 14 to 20 years old
experience leaks. Using this leak probability, expected
leak costs can be calculated. The expected value of the
uncertain outcomes can be calculated as the sum of the
value of the costs times the probability of the occur-
rence. The result can then be used to determine what
action is necessary in order to bring the risk to an
acceptable level. Mathematically this process is expres-
sed by equation 3.1 below.
(3.1) Expected Value = S i=1 (Val. of Outcome i)x(Prob. of i)
Here the probability that a tank 10 to 20 years old
will leak is 0.115 (the average of 10% and 13%) times the
number of tanks in the age category of 12 to 13 years old,
plus 0.42 times the number of tanks in the age category of
14 to 20 years old. Estimates show that there are about
600,000 regulated tanks in the age category of 10 to 20
years. About 350,000 of these are in the 10 to 15 year
category and about 2 50,000 in the 15 to 2 year category.
Using these numbers, the Expected Value, or the number of
tanks expected to leak is 142,250 USTs.
An estimate by the EPA breaks down costs associated
with existing USTs by separating them into percentages.
The EPA estimate is that cleanup of product from 85 per-
cent of the leaking USTs will cost about $36,000, and for


27
10 percent the costs will be about $300,000, and for the
remaining 5 percent the costs will be about $1 million.
If these percentages are used on the above expected value
of 145,250 USTs, in the age category of 10 to 20 years
old, the costs associated with these leaking tanks would
be: $4.4 billion for 85 percent at $36,000 each, $4.36
billion for 10 percent at $300,000 each, and $7.26 billion
for 5 percent at $1 million each. The total cost is $16.2
billion for all three percent groups. If 25 percent of
the estimated two million USTs are leaking or 500,000
USTs, and this number is multiplied using these percent-
ages and estimated costs, the cost break down would be:
$15 billion for the 85 percent at $36,000 each, $15 bil-
lion for the 10 percent at $300,000 each and $25 billion
for the 5 percent at $1 million each. Overall cleanup
costs would be $55 billion using this method of estimat-
ing. Once ground water is found to be contaminated hy-
drologists need to determine the volume and the area that
the ground water encompasses, the direction of flow and
the extent of the spread of the contaminant. After this a
cleanup plan can be designed. Each site is different and
costs vary. Another estimate [24] for cleanup and re-
placement costs of a 5000 to 7000 gallon UST is $120,000
to $265,000. The breakdown for these costs is as follows:


28
Table 3.1.—Cleanup and replacement costs for a 5000 to7000 gallon UST
Cleanup and Replacement Cost
Tank preparation and test $1,000
Tank excavation $1,000
Soil analysis $10,000 to$20,000
Ground water analysis $20,000 to$50,000
Contaminated soil removal and disposal $5,000 to$20,000
Ground water cleanup $20,000 to$100,000
Replacement tank (coated steel) $50,000
Regrading $3,000
Management $10,000
Total $120,000 to$265,000
A site of leaking USTs at East Setauket in Long
Island, New York, is estimated to contain 1 million gal-
lons of gasoline in an underground lake that is 7 feet
deep in places. The cleanup costs associated with this
site have already exceeded $10 million and the end is not
in sight [18]. Fortunately, leaks of this magnitude are
not common, although they do occur as previously dis-
cussed, but with the new regulations governing leak moni-
toring most leaks should be discovered before significant


29
damage has occurred to either human health or the environ-
ment. The bottom line is that the longer un-protected
tanks are under ground, the more leaks will occur. The
guicker leaks are found, the lower the costs will be for
remediation and liability.
Financial Responsibility Requirements
The new regulations found in the Code of Federal
Regulations (CFR) 40 part 280 and 281 published October
26, 1988, require owners of USTs to be financially respon-
sible for any costs associated with leaks from the "USTs
systems" (The term "USTs systems" means any under ground
storage tank and associated piping and valves)
.
At present the regulations require financial respon-
sibility for all USTs containing petroleum products.
Exempted tanks include USTs in the following categories:
1. USTs containing hazardous waste already covered
by RCRA
2. USTs systems containing electrical equipment
and hydraulic lifts
3
.
Waste water treatment USTs that are regulated by
the Clean Water Act
4. USTs with capacity of less than 110 gallons and
tanks holding a minimal concentration of regulated sub-
stances


30
5. USTs that serve as emergency backup, hold
regulated substances for only a short time, and are expe-
ditiously emptied after use
6. Field constructed tanks
7. USTs containing radioactive materials and USTs
used a backup diesel tanks at nuclear facilities
8. Airport hydraulic fueling systems
9. Farm or residential tanks with capacity of less
than 1,100 gallons used for storing motor fuel which is
not for resale
10. Tanks for storing heating oil which is used
on-site
11. Septic tanks
12. Certain pipeline systems, such as those regulat-
ed under the Natural Gas Pipeline Safety Act of 1968
13. Surface impoundments, pits, ponds or lagoons
14. Storm or waste water collection systems
15. Flow through process tanks
16. Liquid trap and other lines used in oil or gas
production
17. Storage tanks on or above the floor of an under-
ground area, such as a basement or tunnel
To be sure, this is a lengthy list and includes
millions of tanks. However, these federal EPA exemptions
may be denied by the state's environmental protection


31
agencies. Many states in fact refuse to exempt tanks in
some of the above categories. The state of Maine, for
example, has gone so far as to not allow exemptions for
underground storage tanks of any kind . The present law
there governing USTs reguires all new USTs to have second-
ary containment with interstitial monitoring. California
regulates residential USTs which contain heating oil,
greater than 1,100 gallons capacity. Wisconsin regulates
all USTs. While some USTs are exempt from government
imposed financial responsibility they are not exempt from
third party liability suits or state charges for damage
caused by leakage. For example, if a leak from an exempt
UST is found, the owner of the property with the UST may
still be liable for damages caused to adjoining property
owners. Even if the UST was not known to exist. Or the
state may impose penalties for leakage. Consider the poor
owner of property in Potchogue, Long Island, New York who
had an UST that leaked. The owner was reguired to pay
$3,000 for removal and cleanup and $60,000 in follow-up
monitoring costs [18].
Farmers and other property owners have an incentive
to determine the status of any UST within their property.
Realtors and financial lenders are reguiring verification
of the status of USTs prior to the sale of farm property
[24], The reasons for these more conservative reguire-


32
merits are easy to understand when banks and lending inst-
itutions are found liable for remediation costs if a
borrower defaults on a loan. Typical of this is the case
in Northwood, Ohio, where a bank loaned $73,000 in 1978 to
a borrower to purchase about 3 acres of land. In 1989,
the bank foreclosed on $62,700. The bank had the property
checked by an environmental firm who found two 750 gallon
capacity USTs which stored gasoline. Research revealed
that the site had been used in the late 1920s as a gaso-
line station. The bank, now the title owner of property,
by default, was required, by EPA regulations to remove the
two tanks at a cost of $14,560.
Recently, the Bush Administration has eased the
liability of banks for toxic pollution caused by business
operations financed with their loans. This rule change,
issued by the EPA in April of 1992 was intended to encour-
age uneasy lending institutions to offer more credit to
commercial property buyers and spur the economy. The rule
shifted the cleanup to provisions of the 1980 Comprehen-
sive Environmetal Response, Compensation, and Liability
Act (CERCLA) , which is also called the Superfund law.


33
Requirements and Shortcomings of the FinancialResponsibility Regulation (FRR)
Showing financial responsibility is not just a matter
of finding an insurance company and paying a premium.
Insurance for UST owners is hard to obtain. The require-
ments of FRR mandate one of two financial commitments.
The first one is if you are a "Petroleum Marketer," you
must have at least one million liability coverage for
costs associated with leaks or spills of any USTs you own;
if you are not a marketer then you need "only $500,000" to
cover losses due to leaks or spills associated with your
USTs. 1
This required coverage can be evidenced by net worth,
insurance, bonds, sureties or other methods, however,
these minimum financial responsibility levels do not limit
the total UST owner liability. Third party suits could
well endanger the very existence of even large corpora-
tions. Currently, most companies cover the FRR with the
following:
1. Net worth greater than required by EPA minimum of
$10,000,000
2
.
Insurance coverage
'These requirements are listed in the Federal Registerof October 26, 1988.


34
3. Guarantee from a corporation, relative or other
firm with which you have a business relationship
4
.
Surety bond
5. Letter of credit
6. State funds, if available
7. Use state approved methods if available
8
.
Set up a trust
Most states do not have programs to provide funding
for financial responsibility and/or many of the above
methods are not available. Large corporations can get by
using net worth to sales by FRR. Small businesses with
less than $10 million net worth use insurance primarily to
show financial responsibility. Unfortunately, however,
insurance is not always available. Private insurers are
very selective in the USTs they will cover. Coverage for
tanks over 20 years old is extremely hard to obtain. Even
if an UST is less than 20 years old certain conditions
will be required to obtain coverage. These include test-
ing the UST for tightness, installing leak detection
equipment or providing corrosion protection. Such "addi-
tions" can be expensive and may well exceed the cost of
tank replacement. Obviously, when this is the case re-
placement then becomes the most sensible alternative.


35
Financial Responsibility Deadlines
The deadlines for demonstrating financial respon-
sibility are likewise broken down into petroleum marketers
and non-marketers by number of tanks and net worth of non-
marketers. 2 The following table is an updated overview of
this data.
Table 3.2.—Financial Responsibility Deadlines
Deadline Marketer Non-Marketer LocalGovernment
Jan. 89 1000 or more Net worth NAtanks >$20 million
Oct. 89 100-999 tank NA NA
April 91 13-99 tanks NA NA
Dec. 93 1-12 tanks Net worth To be>$20 million determined
These deadlines were changed by the EPA from those
originally established because it was apparent that they
could not be met. The original deadline for local govern-
ments, marketers with 1-12 tanks and non marketers with
less than $20 million net worth was October 1990. This
deadline was changed to allow insurers to offer more
policies and to revisit the reguirement for local govern-
ments to show financial responsibility. Presently, insur-
2Reference 4 has a detailed break down of the deadlines.


36
ance is limited and small businesses are finding it diffi-
cult to obtain coverage and meet the EPA Financial Respon-
sibility deadline [7]. Local government compliance has
been deferred. Economics seem, for the moment, to have
overcome environmental concern.


CHAPTER 4
DETAILED STATISTICS ON IMPACTS OF USTs
Today there are many unanswered questions regarding
USTs due impart to the inadequate record keeping practices
of the past. Some of the more pressing of these questions
concern leaks, costs, and environmental damages.
This chapter will concentrate on estimating the
statistics associated with USTs such as size, contents
stored, population and construction material. It will
also address the number of leaking USTs, location of USTs,
the length of time USTs have been in the ground. Major
emphasis will be placed on the economic and environmental
aspects associated with the UST data collected.
With this in mind, the following issues will be
addressed:
1. Where are USTs located and what is the population
density?
2. What was the dominant material used in UST
construction in the past and what is being used today?
3. How many UST are leaking and what are the
environmental and economic consequences of those leaks?
4. How much will it cost to meet the new UST
regulations?
37


38
The actual number of reported and EPA registered USTs
is less than 2 million, presently 1,788,505. This number
and actual collected data will be used in all estimates in
this chapter. For example, if actual data collected on a
representative survey of 100 tanks show that 10 tanks
leaked, then an estimate of 10 percent of existing tanks
of the same material and age group would be currently
estimated. In the case of 1,788,505 UST, if all were of
the same material and age group as the tanks surveyed,
then the estimate for existing conditions would be 178,850
leaking UST. This technique contrasts with using existing
approximations for the number of leaking USTs based solely
on incomplete and partially estimated data. Necessary
approximations will be made if data simply does not exist,
but they will be highlighted accordingly. The information
found on USTs will be separated into age groups. These
age groups will show different categories such as material
of construction and products stored. One category dis-
cussed is referred to as the "Unknown Category." The
unknown category includes tanks that are known to exist
but specific data such as contents stored, age, and tank
material are not known.
Petroleum USTs
Figure 4 . 1 shows an estimate of the number of USTs
storing petroleum products by age groups.


39
PETROLEUM UST'S
500Thousands
400 -
300 -
200 -
100 -
252.1
416.6
282.5
0-5 Yrs 6-10 Yrs 11-15 Yrs 16-20 Yrs 21-25 Yrs >25 Yrs
Years
Figure 4.1. Number of USTs storing petroleum products
The total number of UST used to store petroleum
products is estimated to be 1,579,300. The majority of
the tanks storing petroleum products have been in the
ground for well over 10 years (about 1,044,700 tanks or 66
percent) . Close to 26 percent of the tanks are over 25
years old. Their condition cannot be very good. Figure
4.2 shows the estimated number of USTs storing non-petro-
leum products with the estimated number of USTs


40
storing petroleum products. Clearly the majority of USTs
are used to store petroleum products. In fact 90 percent
of USTs in all age groups, except the over 25 year age
group, are used for petroleum storage. In the over 2 5
year age group only 80 percent are shown to be used for
petroleum storage. The reason for this marked difference
is the unknown category. The number of tanks over 2 5
years old is estimated at 517,900 but records do not show
the use for many of these tanks. In other words, it is
not known what some USTs (approximately 43,000) over the
age of 25 years actually store. This should not come as a
great surprise considering the scanty record keeping
practices prior to the implementation of the 1988 UST
regulations. However, it is highly likely that the major-
ity of the USTs, in the unknown category, are used to
store petroleum products. But, with or without the inclu-
sion of the unknown category the data shows that the large
majority of regulated USTs are used to store petroleum
products. It can, therefore, be predicted that, for the
most part, petroleum products will be the agent of inter-
est when coping with the population of regulated leaking
USTs.


41
600
NUMBER OF UST'S VS PRODUCT STORED(IN AGE GROUPS)
Thousands of UST's
0-5 Yrs 6-10 Yrs 11-15 Yrs 16-20 Yrs 20-25 Yrs >25 Yrs
Years
PETROLEUM £223 ALL PRODUCTS
Figure 4.2. Number of USTs Versus Product Stored
UST Material
As previously discussed corrosion is the major cause
of UST leakage. In order to assess how many UST are
leaking, because of corrosion, it must first be determined
how many existing USTs are made of a material that is
susceptible to corrosion. Figure 4.3 shows estimates
according to age groups, of underground storage tanks made
of steel.


42
STEEL UST'S(Years in Ground)
500
400
300 --
200 --
Thousands of UST's
100 --
373:5
0-5 Yrs 6-10 Yrs 11-15 Yrs 16-20 Yrs 21-25 Yrs >25 Yrs
Years in Ground
Figure 4.3. Steel USTs
There are an estimated 1,427,200 UST made of steel.
This represents almost 80 percent of the UST population.
Most USTs are over 10 years old (about 1,060,000 out of
1,427,200 or 74%). Of more interest, is the number of
USTs in the over 2 5 year age group, where it is estimated
that 379,472 tanks are made of steel or about 27 percent
of the total steel UST population. The concern here is


43
that most of the tanks installed over 25 years ago were
installed without corrosion protection . The probability
that the majority of older tanks are leaking is very high.
As shown above in figure 4.3, the steel UST popula-
tion over 20 years old is significant. In figure 4.4
below a comparison of USTs made of different materials to
the total UST population is given.
100%
75%
50%
25%
0%
TYPE OF UST VS UST AGE(Years in Ground)
0-5 Yrs 6-10 Yrs 11-15 Yrs 16-20 Yrs 21-25 Yrs >25 Yrs
Steel
FRPConcrete
Unknown
180000
70000
2500
23200
241000
60000
2100
13200
259200
19600
1600
15000
234900
9900
1400
14000
132400
1900
560
9300
379500
10000
4200
118000
Unknown E22 Concrete ES FRP ESS! Steel
Figure 4.4. Type of UST versus UST age


44
Here it is shown, as stated above, steel USTs make up the
large majority of the total UST population 1,427,000. Of
the total steel USTs, 511,900 are estimated to be over 20
years old. This represents more than 28 percent of the
total UST population. If one applies the 25 percent
leakage rate arrived at in chapter 3 to these aged unpro-
tected steel tanks, the result will quite likely be a
gross under-estimate of the number of leaking USTs in the
age groups of 16 to 20 years and 21 to 25 years old. The
actual leak history of USTs, however, will not be known
until the actions required by regulations are met.
It will be shown later in this chapter under "Number
of Leaking USTs" how many steel USTs are estimated to be
leaking.
UST Regulations
Tables 4.1 and 4.2 below present an overview of the
current regulations regarding new and existing USTs. All
newly installed USTs must meet new tank requirements of
table 4.1. Existing UST are allowed a phase-in period of
ten years, commencing Dec. 22, 1988 (see table 4.2). The
leak detection requirements, for existing tanks, also
includes a phase-in based on tank age. For an existing
UST, the regulations allow for one of two actions to be
implemented: either meet the monthly monitoring as


45
required by the new tank requirements or monthly inventory
control and tank tightness testing.
The monthly monitoring allows a phase-in of require-
ments depending on tank age. If a tank is older than 2 5
years, it must have met the monthly monitoring requirement
as of Dec. 22, 1988. The latest implemen-tation date for
this method is Dec. 22, 1993 for tanks less than 10 years
old. If the monthly inventory control method is used for
leak detection then the latest implem-entation date for
tank upgrade is Dec. 22, 1998. For tanks over 25 years
old, the "monthly inventory control with tank tightness
testing" requirement must have been implemented by Dec.
22, 1988 and the "monthly monitoring" requirement must
have been implemented by Dec. 22, 1988. For other age
groups, the required actions are as shown in the table.
All existing USTs, over 15 years old, should already have
a leak detection method in place.
Regulations also require that leaking USTs be report-
ed to the EPA for record purposes. It is unexplained why
there remains such a large number of regulated USTs over
2 5 years old in the "unknown" category for leaks; espe-
cially with the most indulgent method, monthly monitoring,
required since Dec. 22, 1989 for those USTs in the over 25
year age group.


46
Pc
g
•H3CTQ)
M
r*crd
4->
0)
I
Eh
0)
c 5-H 0)
r-1 c73(0 £0) 4-> CQ •H O
>-H(1) Pg 73 ffl
-H <D rHH rH rH
•h a3 -Pcr w0) c« -h
co•HPo<
Pc
g<D
U-H
(1)
73O
Prd
U
P-H5
a)
a)
pw
co•HP
73 U0) 0)
P Pid oo >h
u a
Oh
P•H
73rd
rHu
uO rH
0)
Oh <D
« P
cm m
cc o
•H•H pw uo 0)
rH puo uU a
orH
Pcou
50)
c
P c•H O>-H
•P73 Id
Q) rHr-l rH•H (C
3 p& (0
<D cOJ-H
a
73Oo&
>1rH Popc
>c•H
to
a)
p
rd
a)
>i
rCPco •
g -0
c
p3&0)
r-l
cH
rH If)
p -CC PO -H2 £
wrH
rd
0)
>1 r-l
oO PH -H
co op g
rQ
tnc-Hr-l
OP-Hcog
rCPcos
r-l S-l
o o
c c-H -HCH 5-1
rd O1T>P
r-l
O
c•H>H
op-Hcog
(a
r-l 73o o
rCCT>PC 0)
•H grH
op-Heoe
r-l
0)
p p•H (d
P 5W 73>-l C
to
wa)
cp
•HpSh
(0
a)
u
73>i <D
rH (/]
P 3Co a)
2 rQ
a)
.cp<uo
0)
co
>1c10
4-1
O
73rd
0)
PIfl
c•H
P(0
a) .qP rd
0)
>o
rH CM m ^ IT) <£>
C
•HPu
M Q)
f0 PQ) 0)
J 73
5a)
C
p•H2
co-H-p
73 rd
0) rH^ rH-H rd
3 PD1
10
0) CPS -H
<H rH<*H rHO R3
P XI3£ Uw o
u w•H gP Mrd rd
g rHO fO
-P3 rHfC rH
-H73 M-l
C rH
<d a)
>w oc•H rH
w ord
a)
>rHrd
>Cfl
0)
U PrCu -h fd
P > ofd 0) rHO 73 <*h
73C 5rd O W
rH a)
rH <4H
rH U •H-H Q) >a > 0)
W OT3


47
w-pc<D
eQ)
rH
•HPcr<d
cfd
-p
D^C•H-PW•HXW
I
CM
Q)
iH
fd
Eh
• •
OX! 73 73 73-H rH rH rH-P 73 O O OU H >i(CO • • SiWWW CO,* . ^O i^rilM cr>
C w >icr. >icr> >i w o>0) CO ro s-i a» c\ u Hc Oi +J >ico in h (Ti h ^ n >ir>•H (7» CO CM H H CT\ (T> «.
H <H 5 to <n i * i v| o)ow CM
T3 d)CMHOCMlf)CMOHHH CMfd ». CA CM CM H CM H Vd) CM •n, V *. •
Q CM U«^ CM M ' M • M CM ,* CMCCcmCOCOCcmCcm d)
<D • H (0 10 0) 10 G) id fd Qg u +J+J .-PQ-PQ-P • -P •
•H Q) d) O O O >iEh Q Q) <H-| Q) <H-| >,<H_| >,<4H d) <H d)gHQHXJHXJHQHQ
\-\ tH CM m ^T If)
CQ
wcT CO rH
U O CO >iO -H en•H 4-> H orH 73 ~ >i H rH H<D d) 73 C H H • >h •
p a C (0 C Eh X! O <1) g ^c w fd O -—-P d) -P § d)
•H C C -rH c Q <H O CO d)
•H rH O -P >1 P o <d 73 fd en Hu O -H C5 W E >i c H Oi XJ
^i rH -P d) d) X! 73 fd • • an fd
fd 4-> O > 73 •• -P 73 d) c d) pC rH c i a) d) a) c c ~h • 0) u •
C 3 ••O 1 PrHHd)W(dSH w x: O c•H tj> >h o p o an x: w s <d U d) p TD d) rl
-H P (1) W ^ fd P d) • ^— 4-> •• >i73 C Q-P o ^ >i(D a^+) cw w c fd CU fd Xo 0) y iH+J OWC0+JrHfj>Cd) if) u w >1 C< -P £ co chccox:>iC-hx: en Eh X! fd
O -P (d-PWO'H-HCTiO-i -H -p >1 a rH Eh -P>-i -H •P C W -H rH H H If) rH CU rH 3 0)
a ^ (DCDWd)—- +J O W CO d) H T3 51— 5 > C O > CU - >i-P co > rH a, fd fd d)
O X! d) G-P rH OWCM^ rH'HtaCTl d) d) u u C•H D>4-> C -H Xi rl \ CMCdJC H p c &>T3 C O o> o h «-« rd>ocu Eh Mh c a wO -H X3 W >i-H OH • Eh <D g O • Eh fd c < fd
x: c (0 H +J -H a U OP -H S-l x: <h a.u o ~ <h d) ^-* in ^^ d)
(OH O d)4->^HW>—Q(d HQ fd H fd gu g c c
<d o (d •
W g P H CM en
fd
-pc cd) C cg O -H T30) •H -p -H C 5u w o p fd o w•H O d) H d)
3 rH -p X d) H <H oD1 U fd P H U -<-{
0) O >H d) -H d) >K U CU iJ 73 a > d)
W OTJ


48
Some deadlines have already passed. For those tank
owners who have not met the deadlines, there are stiff
penalties for noncompliance; anywhere from $10,000 to
$25,000 can be assessed per violation as shown in table
4.3.
Table 4.3.—Civil penalties
Violation Penalty
Non-compliance of admin, order
Notification violation
All other requirements
$25,000
$10,000
$10,000
With the exception of the "Notification Violation" all
penalties can be compounded on a per tank per day basis.
There are, however, no criminal penalties associated with
these regulations.
Upgrading Expenses
Table 4 . 4 below shows expenses that might be expected
when implementing the new regulations to bring existing
UST into compliance. Even the least expensive leak detec-
tion method, the tank tightness test, is no bargain. It
must include the labor intensive monthly inventory control
by manual gauging costing $50 to $1000 per tank or the


49
automatic tank gauging costs of $10,000 to $17,300. The
EPA conducted numerous surveys and requested considerable
input from enterprises most impacted by UST regulations,
before actually implementing them. The intent was not
only to consider the financial aspects of implementing UST
regulations, but also the enforceability of the regula-
tions. As noted above in table 4.3, other EPA approved
methods different than those listed in table 4.4 are also
allowed. This allowance was intentional so as to leave
the door open for new ideas and or technologies that
might provide less expensive alternatives while providing
an adequate UST leak detection method.
Table 4.4.—Leak detection costs
Leak Detection Method Costs
Ground water monitoring $2200 to $14,000; 100 ft well+ $100-$200/yr oper.
Vapor monitoring $2450 to $8200
Secondary containment w/ $25000 to $46000 for 3 10Kinterstitial monitoring gal. tanks
Automatic tank gauging $10000 to $17300
Tank tightness testing w/ $250 to $1000 per tankinventory control
Manual tank gauging $200 to $1000 per tank
Leak detection for suction Approx. $250 to $10000+pipe
Leak detection for Approx. $50 to $10000+pressurized pipe


50
Numbers of Leaking UST
The major environmental concern associated with USTs
is the population of existing unprotected, old steel
tanks. As older tanks are replaced with newer models the
incidence of leaks will decrease, but there remains a
large number of existing USTs that have been in the ground
over 10 years.
Studies discussed in chapter 3, have shown that the
critical age for leaks to develop in unprotected steel
tanks, is between 10 and 20 years. With 42 percent of the
UST in the 14 to 2 year age group leaking, it is unde-
niable that an even greater percentage of the unprotected
steel tanks which have been in the ground for over 2
years are leaking. Without complete and accurate data, it
is impossible to know the precise numbers of leaking tanks
in any age group. However, a representative, small scale,
sample survey of unprotected steel tanks in the over 2
year group was obtained. The results are shown in table
4.5 below. The areas covered include those of the East
and of the West Coast of the United States. The results
of this survey show that over 95 percent of steel tanks
past 20 years old leaked. Even the steel tanks that were
installed with a protective tar coating leaked.


51
Table 4.5.—Sample survey of leaking UST over20 years old
Locationof Ust
Number ofUST
NumberTested
NumberLeaked
PercentLeaked
E Coast
W Coast
556
1399
167
566
159
547
95
96
Although not shown on the survey, there are many USTs
still in use, that were placed underground in the 1940s,
especially the USTs used for military fuel storage. Some
records show USTs placed as far back as 1914. The sample
survey represents only a fraction of the UST population.
However, it is reasonably representative of both coasts.
If the survey findings are expanded to include all exist-
ing, regulated UST's, then the number of leaking USTs must
be much larger than the accepted 2 5 percent.
The EPA's most recent compilation of confirmed re-
leases nation wide is shown in figure 4.5. This data
shows that of 1,788,505 USTs a total of 127,195 have been
reported to have leaked.
Using the results of the survey shown in table 4.5,
if 95 percent of the USTs over 20 years old are leaking
then there would be 486,305 USTs releasing product into
the environment from this age group alone. (This compares
to an estimate of 448,300 total leaking USTs based on an

52
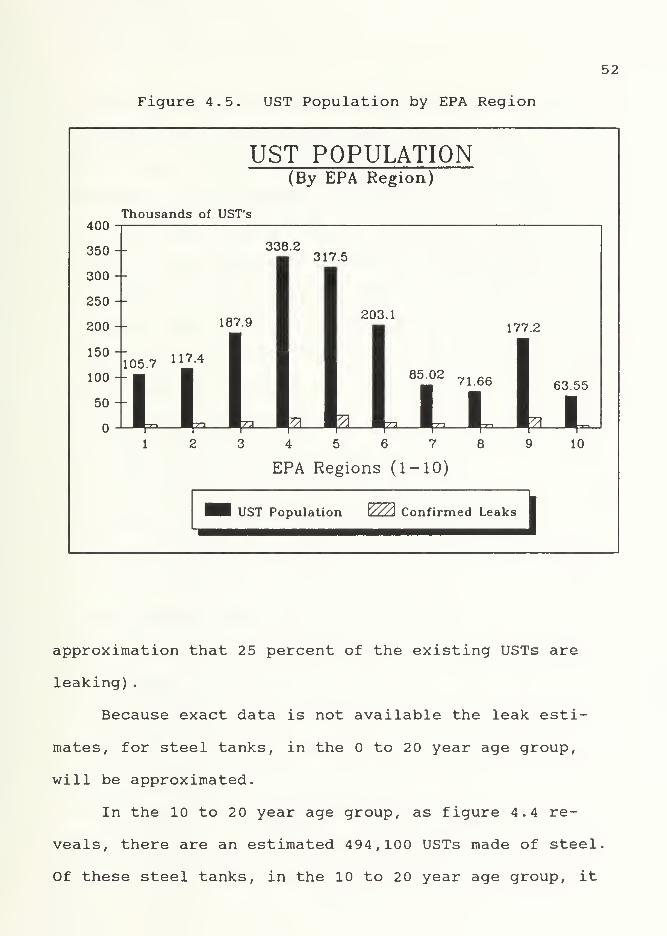
Figure 4.5. UST Population by EPA Region
UST POPULATION(By EPA Region)
400Thousands of UST's
338.2317.5
177.2
UST Population Y//A Confirmed Leaks
approximation that 25 percent of the existing USTs are
leaking)
.
Because exact data is not available the leak esti-
mates, for steel tanks, in the to 20 year age group,
will be approximated.
In the 10 to 20 year age group, as figure 4.4 re-
veals, there are an estimated 494,100 USTs made of steel
Of these steel tanks, in the 10 to 20 year age group, it


53
is reported that, as of April 1991, 122,473 have no corro-
sion protection, 213,766 are in the unknown category (not
known if any corrosion protection is provided) and 42,492
are known to have cathodic or lining corrosion protection
[4]. Since the critical age for unprotected steel USTs is
between 10 and 2 years, a 25 percent leakage approxima-
tion will be used for the steel USTs in the 10 to 20 year
age group. This may be conservative but considering the
age range and the unknown status of corrosion protection
data, 25 percent is probably a good estimate. By using
the 2 5 percent leakage estimate for steel USTs in the 10
to 20 year age group, an estimated 123,525 USTs are leak-
ing in this group. The remaining USTs in the to 10 year
age group are mostly USTs that have corrosion protection
or are made of materials such as FRP that are corrosion
resistant. There are, however, an estimated 102,022 USTs
in this category that are without corrosion protection.
This is out of a total of 421,200 USTs in this age group
or 24 percent. Because of the relatively high number of
unprotected USTs in this age group and the potential for
damage of the UST during installation a 5 percent (approx-
imation) leakage rate for these USTs is used. This gives
a total number of leaking USTs in the to 10 year age
group as 21,060. Based on these estimates the total number
of leaking steel USTs nation wide would be 630,890.


54
These estimates are only for steel USTs and do not
include USTs made of concrete, FRP or any other material.
Non steel USTs make up about 2 percent of the UST popula-
tion or about 3 66,077 USTs (see figure 4.4), and do count
as part of the overall number of leaking UST's. The
following is an approximation for the number of leaking
USTs that are made of material other than steel. Of the
366,077 USTs in the non steel category, 146,934 are in the
unknown category and may well be made of steel. For this
reason and because these USTs include non steel USTs in
the age group from to over 2 5 years old, a 2 5 percent
leak criteria will be used. This gives an estimate of an
additional 91,519 leaking USTs for a total of 722,700
(rounded of to the nearest hundred) leaking USTs nation
wide. Table 4.6 is a summary of these leak estimates.
Table 4.6.—Estimated Number of Leaking Regulated USTs
Tank Material 0-10 years 10-20 years Over 20 years
Steel 21,100 123,500 486,300
Non Steel 40,200 15,400 36,200
Total 61,300 138,900 522,500
To the totals of table 4.6 must be added the number of
unregulated USTs that are leaking. They have the poten-


55
tial to cause the same economic and environmental havoc as
the regulated USTs.
Figure 4.6 gives a comparison of steel and total USTs
with a cumulative estimate of leaks by age group based on
a 2 5 percent across the board leak approximation.
500
400 -
300 -
200 -
100 -
UST LEAKS VS UST AGE(Years in Ground)
Thousands of UST's
Leaks Steel UST's
Leaks All UST's
- mP0-5 Yrs 6-10 Yrs 11-16 Yrs 16-20 Yrs 21-25 Yrs >25 Yrs
45.1
69
60.3
76.5
64.8
73.9
58.8
65
33.1
36
94.9
127.9
Years in Ground
Leaks Steel UST's fz23 Leaks All UST'
The gragh shows the cumulativetotal of leaks from UST's usingthe 25% approximated leak theory.
Figure 4.6. UST leaks versus UST Age

56
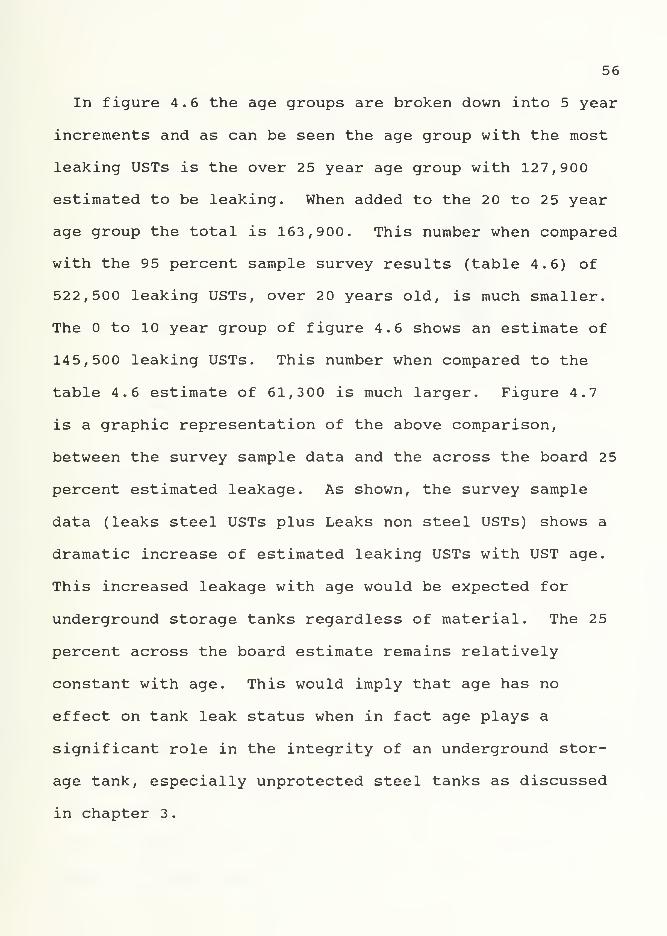
In figure 4.6 the age groups are broken down into 5 year
increments and as can be seen the age group with the most
leaking USTs is the over 25 year age group with 127,900
estimated to be leaking. When added to the 2 to 2 5 year
age group the total is 163,900. This number when compared
with the 95 percent sample survey results (table 4.6) of
522,500 leaking USTs, over 20 years old, is much smaller.
The to 10 year group of figure 4.6 shows an estimate of
145,500 leaking USTs. This number when compared to the
table 4.6 estimate of 61,300 is much larger. Figure 4.7
is a graphic representation of the above comparison,
between the survey sample data and the across the board 2 5
percent estimated leakage. As shown, the survey sample
data (leaks steel USTs plus Leaks non steel USTs) shows a
dramatic increase of estimated leaking USTs with UST age.
This increased leakage with age would be expected for
underground storage tanks regardless of material. The 25
percent across the board estimate remains relatively
constant with age. This would imply that age has no
effect on tank leak status when in fact age plays a
significant role in the integrity of an underground stor-
age tank, especially unprotected steel tanks as discussed
in chapter 3
.


57
UST LEAKS VS UST AGE(Sample Survey Results)
600Thousands
0-10 Yrs 10-20 Yrs
Years in Ground
>20 Yrs
I Leaks Steel UST's
EEQ Leaks all UST's 25%
EZ3 Leaks Non Steel USTs
The graph shows an estimatedleakage based on sample dataas explained In chapter 4.
Figure 4.7. UST Leak Versus UST Age Sample Survey Result
UST Location
Table 4.7 below shows the UST population density by
state in the range of less than 10,000 tanks to over
100,000 tanks. If the continental United States is divid-
ed roughly in half geographically by the Mississippi
River, twenty six states will be in the eastern portion
and 22 in the western portion. Including Alaska and
Hawaii with the western group gives an approximate equal


58
split mathematically. Those states in EPA regions one
through five are in the eastern portion and those in
regions 6 through ten are in the western portion. With
this separation one can better understand the concentra-
tion of USTs and, therefore, the potential problems nation
wide.
Only two states have estimates of USTs over 100,000:
California with an estimate of 148,311 USTs and Texas with
an estimated 132,954 USTs. Twelve states and 3 territor-
ies have estimates of less than 10,000 USTs. Sixteen
states, the largest number, have an estimated number of
USTs in the 25,000 to 50,000 range. With the exception of
Washington, all of these states are located in the eastern
portion of the nation. Nine states have an estimated
number of USTs in the 50,000 to 100,000 range and all of
these states are also in the eastern portion of the na-
tion. With the exception of California, Texas and Wash-
ington, no state west of Oklahoma has more than an esti-
mated 25,000 USTs. Washington has an estimated 30,909
USTs. Consequently, the eastern portion of the nation
contains 70 percent of the country's regulated USTs:
1,257,424 out of the reported 1,788,505.
Of the 22 states in the western portion of the na-
tion, California and Texas have 53 percent of the USTs or
281,265 Of 531,081 USTs.


59
Table 4.7.—UST population density table (per state)
No. of USTs State Name No. of States(Abbrevi ated] and Territories
<10,000 NH, RI, VT, DC, DE, WY, ND 15SD, NV, HA, ID, AK, GUAM,VIRGIN IS, PUERTO RICO
10,000 to WV, MS, AR, NM, IA, KS, NB 1225,000 CO, MT, UT, AZ, OR
25,000 to CT, ME, MA, NJ, MD, GA, TN, 1650,000 KY,
MO,AL, SC,MINN
IN, WA, LA, OK,
50,000 to NY, VA, PA, NC, FL, OH, WI, 9
100,000 IL, MICH
>100,000 TEXAS & CALIFORNIA 2
Fate of the USTs
What happens to USTs as they go through the reguired
process to meet the new regulations? The answer to this
guestion is that USTs will end up falling into one of four
categories: (1) disposed of and replaced with new USTs
designed to meet the latest UST criteria, (2) disposed of
and not replaced (Tank Closed) , (3) repaired and/or up-
dated to meet new UST criteria and, (4) disposed of and
replaced with an above ground storage tank.
Figure 4.8 shows the result of a survey taken on a
small number of UST owners in different parts of the
nation. The data shows that many USTs fall into category
2 and just simply are not replaced. In this case the tank


60
is closed by following tank closure procedures as promul-
gated by the EPA or other governing authority. A small
percentage are repaired in place and new leak testing,
monitoring and corrosion protection is incorporated in the
repair contract. Others are replaced with new USTs that
UST CORRECTIVE ACTION MEASURES(Florida Texas California Arizona)
800
600
400
200
Number of UST's
^^3REPAIRED CLOSED REPLACED ABOVE GROUND
Action completed or planned
I WEST COAST IS3 EAST COAST
Graph shows completed or planned action.
Repair column Includes tanks that may bereplaced vs repaired depending on status
Figure 4.8. UST Corrective Action Measures
meet the latest EPA and/or state requirements for USTs.
And a very small percentage are replaced with above ground
storage tanks. If an UST falls into category 1 and


61
is replaced with a new UST the most common choice is a
double walled FRP tank. The reasons for choosing this
type of tank are many, however, that subject is beyond the
scope of this paper.
Above Ground Storage Tank
As noted above, some underground storage tanks are
replaced with aboveground storage tanks (ASTs) . Is this a
solution to the environmental problems associated with
USTs? Obviously if all USTs were replaced with ASTs there
would not be any more tanks leaking under ground. With
all the regulations governing USTs, leak detection re-
quirements, insurance requirements and other costs it
would seem that replacing USTs with ASTs is the most
logical thing to do. However, ASTs come with their own
set of problems and in many cases an AST is not an appro-
priate choice for petroleum or hazardous liquid storage.
In order to make an informed decision on whether to put in
an AST, a wide range of factors should be considered.
Table 4.8 shows some advantages and disadvantages between
USTs and ASTs. And, although this list gives numerous
advantages and disadvantages careful consideration must be
give to the specific site where tank storage is needed.
Case in point, an airport. If tank storage is required at
an airport just having a tank above ground presents a
hazard to the daily operations. If the tank additionally


CO
O CD
P U c3•H *
0) > to CP CD CO P fd >.TJ T3 C (0 -P o
c5 rH -H u g CU
O +J O -H C•H U ft CD U<W -P D 4-1 -H -H
C 4-> c 4H -Pto U O U rd T3 <4H Uu CD U D JM (D CD CU
O > -H s ^ G 4->
< O rH 4-1 (/) to •H -H OH rH 4-> C >i 3 MJ2T, TJ g -H CD M -H +J to tr cu a.<c >-i o a u •H C Q) g> (0 ^ CO 04 >1<H >H 3 CQ N <W -p a +J-H •H rH< rd CT> CO t« rd 3 -H XI 4-> CT> O -HCO £ W C4J Ui to rH rd rd c > to
H -H -H -H W CD -H rH rH -H OQ CD >H a g CD a,* X -H d ftj: u
CO >H -H g ^ ^ g c ro re CP g Cr> >-<
E-t -H a P CD -H CD rd •H > CU 3 -HCO En CO Q,Ch QBE J ICC<T( rH CN n -^f IT) VO H cn n ** incfd
to
Hto CU
Dc
<H rd
o h3
10 CO
<D C gCP •H Ord u-P >1 <+H
C P >.rd •H CD ,* O> rH CO C Cn •H O rd CU .* CU
rd CO X! O 4-J -H c u10 W re x: u fd a p•H o •H O g -H P P Jh
Q < rH O <4H fd oE-» C O U <u o u a
TS S CD O -P 4h CD p <u ac < >-H a 3rd > •H p w 5 CD 5 g w
a CO rd C O g CU
CO < C <H CPrH 3 rH 4-> rH0) CD 3 -H 4H rH to u rd
CT acptn o CD U P M(0 X CD CD >. > W -H >i C 3P <D >-i -d P 3 P P fd 4->
c •H CD CU •H pcfl CO W CD > tP tj x: > W 3> Ul th U (0 u C P fd c u73 CU CU >-i fO fO CO U 4->
1
1
JhlSOhl
«H cm n ^j. id
J u O U CO
1
00 iH cn O rf IT)
*r
cd
f-{ « Eh HX 2 CO COrd < < DH Eh
62


63
contained a flammable liquid the hazard would be even
greater. Therefore, use of ASTs at certain sites would not
be practical even if the advantages far out number the
disadvantages
.
Presently ASTs are not regulated to the degree that
USTs are regulated. The National Fire Protection Associa-
tion has the most extensive regulations governing ASTs.
These regulations typically involve matters dealing with
fire safety such as dike design, building and structure
spacing. The Fire Department, in most local-ities, has
the responsibility of regulating ASTs. Unlike the UST,
(unless the UST is leaking into a void or sewer system)
the main threat involving the AST is the explosive or fire
hazard associated with the product stored. If the AST
presents a fire hazard to the surrounding community, the
local fire department will more than likely require a
permit and extensive fire equipment.
The ASTs that are presently regulated by the EPA are
those storing hazardous wastes and those that are near
water sources where the Clean Water Act applies. It is,
however, only a matter of time before the federal EPA
initiates regulations for all ASTs.
The Decision
There are situations where an AST is more practical
than an UST. If the location is relatively remote, real

64
estate is plentiful, esthetics is not a problem, it would
be advantageous to have gravity flow from the storage tank
and security is not a concern then perhaps an AST is in
order.
Few if any of the above factors apply to most areas
where storage tanks are most needed, mainly gasoline
stations in towns and cities throughout the nation. Mili-
tary bases, refining facilities and fuel transfer stations
do, however, contain many of these factors and may well
benefit by using ASTs. ASTs offer a distinct advantage
over USTs in that gravity flow can be used to remove the
product instead of pumping. This allows for much higher
efficiency in moving large volumes of product. Another
advantage of the AST over the UST is the number of differ-
ent designs available. ASTs are available in sizes rang-
ing from 275 gallons to over 10,000,000 gallons and come
in many different shapes. In contrast, USTs usually do
not exceed 30,000 gallons and are typically cylindrical in
shape. A limiting factor in the design area is the mate-
rial used for the AST. ASTs must be constructed of a
material that will contain a liquid without the added
support of surrounding soil. This rules out the use of
FRP because it does not have the structural integrity to
withstand the weight of liquid product without additional


65
support of surrounding soil. At Military installations
security may well dictate the use of USTs even if all
other factors are in favor of the AST. As table 4.8
shows, another advantage of the AST is the less expensive
liability insurance. However, cost is not listed as an
advantage because the cost of an AST may be as much as
that for an UST. Even if all the factors seem to be in
favor of the AST, the requirement for items such as dikes,
fire protection equipment, structural support, spill and
overflow protection and maybe insulation to protect the
stored product from temperature fluctuations, may well
push the costs of an AST installation close to that of an
UST.
Tanks in Vaults
A storage tank placed in an underground vault is
considered an AST. Therefore, UST regulations do not
apply. The advantage to this arrangement is the savings
in land space and temperature control. However, the costs
for installation are higher and gravity flow from the tank
is no longer available.
In conclusion, although there are presently fewer
regulations governing ASTs, this fact should not be used
in choosing an AST because, as previously noted, it is
just a matter of time before ASTs are federally regulated.
With routine visual and olfactory (if the product is


66
odoriferous) inspection it can be determined if product is
leaking from an AST. For this reason leak detection
equipment is not needed for an AST. And it may appear
that ASTs offer less risk associated with the environment,
but they obviously have limitations. Operating and main-
tenance costs, safety requirements and possibly insulation
needs may drive the cost of the AST to be in the same
neighborhood as the UST. With the latest improvements in
the UST design, construction and installation, the new UST
should experience few leaks. And if a leak does occur,
with the new leak detection requirements, it should be
discovered in time to correct it with little or no envi-
ronmental damage.
The UST Market
The Jennings Group estimates that the UST Market for
contracting and consulting will be in the neighborhood of
$38 billon over the four years from 1991 to 1995. Esti-
mates such as these are not unreasonable considering the
huge population of older USTs. This cost estimate over a
4 year period may easily be realized if the actual popula-
tion of leaking USTs is in the 700,000 range.
Figure 4.9 below shows a comparison of costs associat-
ed with leaking USTs. The costs are cumulative except for
those shown at the 100 percent point where "Tank Only @
$36K ea" costs are indicated. This cost of $26,089 bil-


67
lion represents the costs if all leaking USTs were re-
placed at $36,000 each, excluding remediation. This is
assuming, of course, that all the leaking tanks are re-
placed, which is not the result shown in the sample survey
of figure 4.8. But for purposes of showing estimated
costs on tank replacement only, cleanup costs are ignored.
UST COSTS VS LEAKING UST"S(Cumulative costs Except Tank Only Cost)
100Billions
26.08JI
85% 10% 6%Coats per Estimated leak damage
100%
iM Sample data Leakage
EES Tank Only • $36K ea
86% of leaking UST'a • $36,000 each10% of Leaking UST'a • $300,000 each6% of Leaking UST'a • $1,000,000 each
Y/A 25% estimate Leakage
Figure 4.9. UST Costs Versus Leaking USTs


CHAPTER 5
CONCLUSIONS
Underground storage of liquid products in tanks will
continue into the foreseeable future. Proper management
of these tanks is the vital ingredient to an environ-
mentally safe and effective UST program. The present
regulations governing USTs should prove to be an effective
management tool in insuring the proper safeguards are
installed for safe and effective utilization of USTs.
Although there has been much needed improvement in
the management of USTs there is still a long way to go
before it can be stated that USTs are no longer causing an
adverse impact to the environment. Regulations require
tank owners to report leaks, closures, cleanups and other
vital information about USTs to the EPA. This data is
then compiled and updated on a quarterly basis. The
second quarter of FY 92 data on the number of leaks, tank
closures and cleanups reported to the EPA is shown below
by EPA region in table 5.1. It is important to note that
this data is reported data and does not include leaks that
may have occurred but have not yet been discovered or
reported. The data shows the number of completed cleanups
to be 38,709 as of the second quarter of FY 92, or 31
68


69
March 92. Comparing this to the number of reported con-
firmed releases, 156,287 shows that there is a long way to
go before the reported leaks are cleaned up.
Table 5.1.—Corrective Action Measures FY 92
Region Number of Confirmed Tanks CleanupsTanks Releases Closed Completed
One 100,617 6,813 10,556 4,153
Two 109,399 10,915 23,785 5,218
Three 170,068 15,029 34,102 3,566
Four 322,280 27,387 112,118 6,874
Five 337,555 34,880 84,520 5,031
Six 183,456 13,586 29,767 2,969
Seven 62,537 10,588 29,033 2,646
Eight 69,945 6,977 21,213 1,903
Nine 155,591 23,812 16,522 4,683
Ten 54,165 6,300 30,644 1,666
Total 1,565,613 156,287 392,260 38,709
If the trend for reporting leaks is an indicator then
there are many existing USTs leaking that have not yet
been reported. For instance figure 4.5 in chapter 4 shows
the number of confirmed releases to be 127,195 for the
fourth quarter of FY 91. Table 5.1 above shows the number
of releases as of the second quarter FY 92 to be 156,280.
This is an increase of almost 23 percent in a period of 6


70
months. If the number of reported leaks continue to
increase at this rate then by 1994 there will be an esti-
mated 436,174 confirmed releases by USTs and by late 1995
the number of confirmed releases will be over 700,000.
This supports the analysis in chapter 4 on the estimated
number of leaks. Page 97 of the appendix is a national
corrective action activity gragh showing this trend.
These estimates are of course speculative. The EPA,
however, [25] estimates that when all required information
regarding USTs is reported there will be on the order of
about 400,000 leaking USTs. A question that might be
asked is: Why are there only 156,280 reported leaking USTs
when all data indicates that the real number of leaking
USTs is much larger? Once a leak is discovered it must be
cleaned up and remediation costs can be extremely high.
So part of the answer may be that some owners of USTs
cannot afford to discover a leaking UST. And part of the
answer is that, in spite of the requirement to report
leaking USTs, enforcement of this item in the regulations
regarding USTs has not been easy. The enforcement problem
can be partially attributed to the down turn in the econo-
my but some of it is the fact that many of the existing
USTs are owned by operators, with not only financial
limitations, but with multiple tanks that make it hard for
them to meet the new regulations in the time required.


71
However, for those owners with limited finances, the
financial burden associated with upgrading USTs will
probably not be lessened with time. Because if unprotect-
ed steel tanks are allowed continued operation, after 10
years, many will eventually leak and reguire corrective
action. This will prove to be much more financially
burdensome than upgrading or replacing exist-ing USTs.
Again, risk management is in order here to determine what
action should be taken. If the reguired actions are put
off to a later date not only are fines for non-conformance
a potential cost but also the clean up efforts associated
with leaking USTs are, as discussed in chapter 3, very
costly. An existing UST may not be leak-ing today and if
upgraded to meet the new standards may never leak. If on
the other hand the same UST is not up-graded it may devel-
op a leak in one or two years reguiring expensive cleanup
and disposal costs. The precept here is "pay a little now
or pay a lot later."
In reality, any owner of USTs should seriously con-
sider upgrading to meet the new regulations, not just
because of the negative impact leaking USTs have on the
environment but also because in the long run all USTs will
have to conform to the new regulations and further delay
will only add to the costs.


72
The most aggressive single group to implement the new
regulations and upgrade their existing USTs is the oil
companies [16]. This is probably because they not only
have an invested interest in maintaining a positive envi-
ronmental perception of the petroleum industry, but also
have the capital to implement the required upgrades.
USTs Abandoned In Place
Little has been mentioned of those USTs that have
been placed in a state of indecision, specifically those
USTs "abandoned in place" which have been left for future
demise. Are there a significant number of these USTs?
Data indicates that USTs in this category are significant
in numbers. A survey of 1,54 6 USTs that belonged to one
owner showed that 650 of these were designated as "aban-
doned in place" (AIP) . The fate of the USTs placed in the
AIP category is yet to be determined but meanwhile further
action to upgrade, replace or remove is delayed until
either time or money allows for it. Most will probably be
closed out by removal and disposal followed by any re-
quired remediation. The number of 650 USTs for the above
survey represents 42 percent of the total population of
USTs in this specific owners possession. Herein lies
another possible answer to why many leaking USTs have not
been reported. USTs abandoned in place are typically the
last to be upgraded by monitoring and leak testing because


73
they are not in use and do not require immediate attention
by the owner for operational requirements.

APPENDIX
Data contained in this appendix is public information andcan be obtained by requests from the Federal EPA.
74


75
STARS4QTn. FY 91
Region/State NUMBER OF TANKS CLOSURES CONFIRMED RELEASESOfCCT 30,574 1,224 1,205
MA 30,986 2,000 2,775
ME 23,217 4,982 803W 11,096 1,157 449Rl 6.271 1,027 251
V T 6,252 1,375 754
[TOTAL (Reg ion 1) 108,396 11,765 6,237
TWONJ 47,977 1.219 3,073
NY 85,410 18,581 6,666
PR 6,420 98 111
VJ 273 34 12
ITOTAL (Region 2) 140,080 19,932 9,862
THREEDC 9,776 266 250CE 7,419 1,202 891
KV 29,472 3.564 6.394
PA 90.321 11,551 1,771
VA 62,328 7.822 2,890WV 14,247 2,335 484[TOTAL (Region 3) 213,563 26,740 12,680
FOURAL 33.262 2,704 1.063
FL 92.407 43,932 9,242
GA 38,485 5,771 1,359
KY 31.347 3,165 1,554
M3 20.389 4,502 411
NS 84,060 24.367 2,991
9C 34.C90 3.670 1,480
TN 42,512 10,549 1,31 1
[TOTAL (Region 4) 376,552 98,660 19,411
FIVE
IL 61,792 5,743 5,808IN 41,058 2,508 1.619
Ml 72.275 23,690 5,401
Ml 36,032 4.820 4,372
CH 74.959 9.479 3.730
Wl 53,190 7,295 4.798
ITOTAL (Region 5) 339,306 53,535 25,728


76
STARS4QTR. FY 91
Reglon/Stato NUMBER OF TANKS CLOSURES CONFIRMED RELEASESSIX
AR 16,202 2.371 202LA 25,658 5,954 1,143
ER OF TANKS CLOSURES
16,202 2,371
25,658 5,954
12,290 2,274
27,924 1,644
132,954 12,998
m 12,290 2,274 616OK 27,924 1,644 918TX 132,954 12,998 8,647[TOTAL (Region 6) 216,028 25,241 11,526
SEVENIA 26,125 11,020 3,827KS 22,123 3,532 2.149
MO 24,534 3.323 1.396
NE 17,658 4,276 1,457
ITOTAL (Region 7) 90,440 22,151 8,829
EIGHT
CO 23,277 3,646 2,033MT 21,154 2.650 721
ND 8,186 717 337
23,277 3,64621 ,154 2,650
8.186 71 7
7.889 67312.882 4,521
8.054 2,613
SO 7,889 673 922UT 12.882 4,521 1.239
VVY 8.054 2,613 635ITOTAL (Region 8) 81,442 14,820 6,087
NINEAZ 19,888 8.087 1,846
CA 133,552 3,996 18,074HI 5,195 287 293
19,888 8.087
133,552 3,996
5,195 2876,576 2.377
70 1
446 8256
NV 6,576 2.377 89200 70 1 1
GJ 446 82 67SA 56ITOTAL (Region 9) 165,783 14,830 21,173
TENAK 4,957 854 358ID 9,124 1,923 394CR 17.240 11.064 2,657WA 25,594 13.343 1,874
ITOTAL (Region 10) 56,915 27,184 5,283
NATIONAL TOTAL 1,788,505 314,858 127,195


STARS4 0TR. FY 91
77
Regiori/Stato CLEANUPS INITIATED
OtJE RP TF STATE TOTALCT 1,152 1 2 1 3 1,177
MA 2,303 3 42 2,348
M5 724 7 62 793NH 450 r
> 455Rl 252 7 259VT 725 19 1 754Itotal (Region D 5,606 53 127 5,786 |
TWO RP TF STATE TOTALNJ 2.279 6 3 2.288
W 5,989 20 620 6,637
PR 109 109VI 1 1 1 1
Itotal (Region 2) 8,300 34 623 9,045 |
three RP TF STATE TOTALDC 190 1 191
CE 573 -1 1 2 589MD 5.610 1 -1 1 5,625
PA 1.437 1 1,438
VA 2.057 1 9 8 2.084
wv 360 2 362Itotal (Region 3) 10,227 41 21 10,289 |
four RP TF STATE TOTALAL 233 30 406 669FL 1,587 395 1.982
GA 895 4 899KV 1.560 1 7 1.577
MS 47 2 135 184N3 2.205 23 2 2,230SC 389 7 396TM 561 29 590Itotal (Region 4) 7,477 108 942 8,527 |
FIVE RP ir STATE TOTALIL 4.635 1 2 4.647
IN 1,337 1 2 1 'i 1.362
Ml 4.153 67 ;.() 4,24 9
K/N 1.942 1 1 1.94 7
OH 3,121 4 3.125
Wl 4.318 23 4.341
Itotal (Region 5) 19,506 120 45 19,671 |


STARS4QTR. FY 91
78
SIX
ARLANMOKTX
np1605744473256,316
CLEANUPS INITIATED
TF
2
8
STATE
2
1 5
TOTAL1605764573256,339
|TOTAL (Region 6) 7,022 18 1 7 7,857
SEVEN RP TF STATE TOTALIA 702 702KS 1,910 3 1.913
MD 1,151 4 1 1,156
NE 55 1 56|TOTAL (Region 7) 3,818 8 1 3,827 |
EIGHT RP TF STATE TOTALCO 1.072 2 1.074
m 580 13 1 594nd 295 1 296so 753 1 754LIT 462 2 464wr 298 1 1 16 415[TOTAL (Region 8) 3,460 20 117 3,597 |
NINE RP TF STATE TOTALAZ 585 1 585CA 5.621 5,621HI 168 168NV 590 3 78 671
COGU 66 66SA|TOTAL (Region 9) 7,030 4 78 7,112 |
TEN RP TF STATE TOTALAK 219 1 1 221
ID 310 1 31 1
cn 1.492 5 3 1,500
WA 1.758 1 4 1,763
ITOTAL JRegjon 10) 3,779 8 8 3,795 |
National Sub-totals 77,1 13 414 1,979
Cleanups Initiated Nationally 79,506


STARS 4 QTR. FY 91
79
Region/StateOnoCTMAMEN-l
Rl
VT
SITES UNDER COflTRCL
[TOTAL (Region 1)
RP1.058
2.1566794 4 1
250727
TF8
3
3
8
2
1 9
STATE1 2
58363
TOTAL1,078
2.217718452252754
5,311 43 1 17 5,471
TWONJ
WPRVI
[TOTAL (Region 2)
RP1,840
3,8651091 1
TF
6
22
STATE3
443
TOTAL1,849
4,330
1091 1
5,825 28 446
THREEDC
CE
MDPAVAWV
RP173
291
5.467
1,150
458330
TF1
1 2
1
12
STATE
2
1
C
t
TOTAL174
2935.480
1,151
471
330ITOTAL (Region 3 )
7,869 26 6,651
FOURALFL
GAKY
MSNCSCTN
RP202
1 ,641
2481,059
351.570
333429
ITOTAL (Region 4) 5,517
TF1 5
1
6
8
4
3
4 6
STATE344192
661
TOTAL561
1,833
2481,069
107
1,579
337432
603 6,166
FIVEIL
IN
Ml
MMCMWl
ITOTAL (Reg ion 5)
RP4,6351,116
4.315
1.21 1
757859
TF1
3
1 7
STATE2
TOTAL4.647
1,116
4,315
1,214
757876
12,893 30 12,925


STARS 4 OTR. FY 91
80
Fteglon/Stato
SIX
ARLAr-M
CKTX
SITES UNDER CONTROLRP1 1 1
553331
541
4,696
TF
2
4
1
STATE
1
TOTAL1 1 1
5553355424,697
Itotal (Region 6) 6,232 7 1 6,240
SEVEN RP TF STATE TOTALIA 702 702KS 1.407 1,407
MD 922 3 1 926ME 31 31
Itotal (Region 7) 3,062 3 1 3.06S
EIGHT RP TF STATE TOTALCO 296 296m 576 5 1 582ND 243 243SO 709 709UT 296 296vjy 230 1 81 312Itotal (Region 8) 2.350 6 82 2,438 |
NINE RP TF STATE TOTALAZ 366 1 367CA 3,375 3.375HI 74 74NV 569 39 608COGU 50 50SAItotal (Region 9) 4,434 1 39 4,474 |
ten RP TF STATE TOTALAK 146 6 1 153ID 302 302CR 1,248 1.248
WA 1.572 1 4 1.577
Itotal (Region 10) 3,268 7 5 3,280 |
National Sub-totals 56,761 1 97 1 ,300
Sites Under Control Nationally 57,010


STARS 4 QTR. FY 91
81
Region/State
Of-E
CTMAMENHRl
VT
CLEANUPS COMPLETED
[TOTAL (Region 1)
RP8321,767
643163129387
TF STATE2 2
8
37
2
2
TOTAL8361,775
680163131
3893,921 49 3,974 1
TWONJ
WPRVI
ITOTAL (Region 2)
CLEANUPS COMPLETEDRP TF STATE TOTAL101 2 1 1043,865 1 443 4,30936 36
4,002 444 4,449
THREEDC
LE
K/D
PAVAWVITOTAL (Region 3)
RP1 1 7
2151,786
343298136
TF1
8
STATE
1
TOTAL1 18
2151,786
343307136
2,895 2,905
FOURALFL
KY
MSbCSCTN
RP632691 64
67226
55243235
ITOTAL (Reg ion 4) 2,024
TF
30
2
3
"3 5
STATE144
4 7
42
TOTAL23731616467270
51843235
233 2,292
FIVE
IL
IN
Ml
UNOHWl
RP70478
507857293548
TF
1
9
STATE TOTAL70578
507857293557
ITOTAL (Region 5) 2,987 10 2,997|


STARS 4 QTR. FY 91
82
Region/State
SIX
ARLANMCKTX
CLEANUPS COMPLETED
ITOTAL (Region 6)
RP30429206365894
TF STATE TOTAL30429206365894
1,924 1,924
SEVENIA
KS
mdNE
RP3858968266
TF STATE
1
TOTAL3858958276
|TOTAL (Region 7] 2,113 1 2,114 !
EIGHT RP TF STATE TOTALCO 282 232MT 245 3 248t-D 1 85 185
SO 228 228UT 142 1 143
vw 242 59 301
JTOTAL (Region 8) 1,324 4 59 1,387 |
NINE RP TF STATE TOTALAZ 306 306CA 2,420 2,420HI
NV 447 48 495OQGJ 40 40SA[TOTAL (Region 9) 3,213 48 3,261 |
TEN RP TF STATE TOTALAK 55 1 1 57ID 173 173cn 730 730WA 368 35 403|TOTAL (Region 10) 1,326 1 36 1,363
National Sub-totals 25,729 66 871
Cleanups Completed Nationally 26,656


83
STARS4QTR. FY 91
Region/State Emergency Responses Enforcement Actions
etcCT 2 8 3 7 1
MA 1,772 1.607
ME 165 34NH 18 2 6 3 8
Rl 14 251VT 76 1J_2ITOTAL (Region 1) 2,237 3,013
|
TWONJ 44 2.558NT 46 5,989PR 53 36VI 3 9
ITOTAL (Region 2) 146 | 8,592 _J
THREEDC 11 88CE 103 779MD 148 1,255PA 2 7 302VA 36 2,890WV 1J 1_40
ITOTAL (Region 3) 341 5,454~~
FOURAL 73 1,063FL 111 2,587GA 7 5
KT 115 785MS 38 8
NO 140 518SC 11 63TN 5 1,31 1
ITOTAL (R eg ion 4) 500 6 ,340
f
FIVE
IL 61 183
IN 20 549Ml 194 2.324
W 12 4,372
CH 18 2 4
Wl 1_58 __3i_9|TOTAL (R egion 5) 4J53 7,986

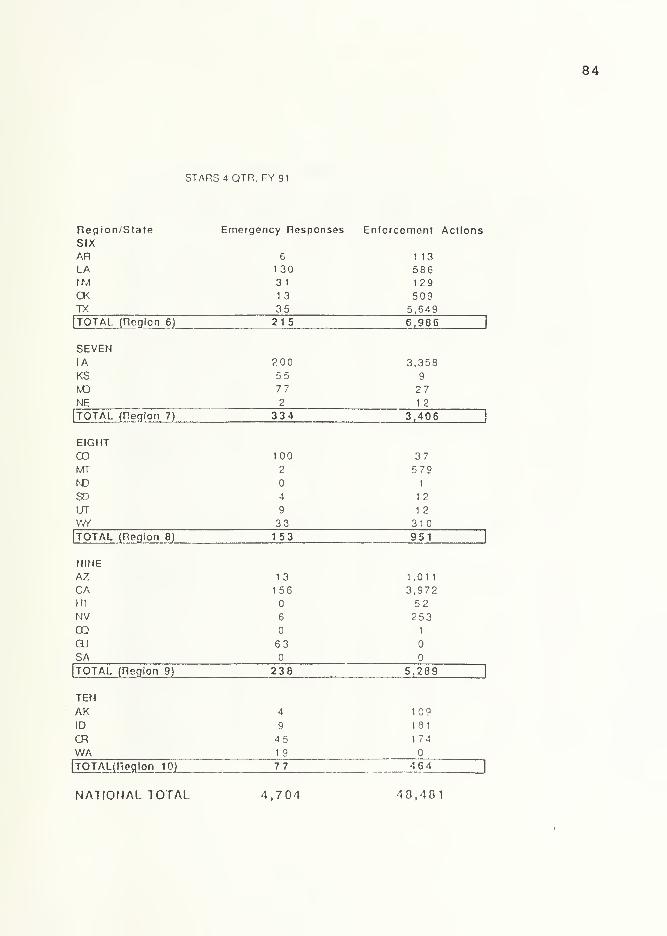
84
STARS 4 QTR. FY 91
Region/State Emergency Responses Enforcement ActionsSIXAR 6 113LA 130 586tM 3 1 129CK 13 509TX 35 5,649ITOTAL (R egion 6) 215 6,98 6
\
SEVENIA 200 3.358
KS 5 5 9
KO 77 27NE 2 1_2
ITOTAL (R e"glon 7) 3J3J 3,406
EIGHT00 100 37rvTT 2 579ND 1
SO 4 12
UT 9 12
WY 33 3H>ITOTAL (Region 8) 153 951
|
NINEAZ 13 1,011
CA 156 3,972HI 52NV 6 253CO 1
GU 63SAITOTAL (Region 9) 238 5,289 |
TENAK 4 109
ID 9 131
CR 45 174
WA 19
77 464
NATIONAL TOTAL. 4,704 40,401


Corrective Action Measures For Third Quarter FY 92
85
1 Regioa/Suie Number of
Tanks
Tanks
Closed
Confirmed
Releases
Cleanups
Initiated
Sites Under
Control
Cleanups
Completed
ONE
I CT 34792 1288 1265 1237 1143 869
1MA 24825 7709 3247 2751 2598 1916
8me 17134 5022 895 877 798 734
1 NH 13366 1651 522 522 508 216
1RI 6264 1297 320 320 313 163
1 VT 4236 1602 876 876 876 403
j SUBTOTAL 100,617 18,569 7.119 6,583 6.236 4,301
1 TWO
1
NJ 51558 3020 3809 2822 2419 671
|NY 51006 40982 7590 7520 4966 4940
IPR 6555 411 123 123 116 41
ji vi 280 50 13 12 12
| SUBTOTAL 109,399 44,463 11,534 10,477 7,513 5,652
|THREE
I DC 5041 414 323 239 189 157
1DE 6492 1799 1162 858 509 420
SMD 21659 6174 8298 7490 6526 2573
1PA 66289 15583 2160 1750 1296 362
1 VA 52648 10949 3568 2547 619 363
\ wv 17939 2821 718 438 410 48
| SUBTOTAL 170,068 37,740 16,229 13,322 9,549 3,923
|FOUR
1AL 31271 3757 1414 867 799 436
1^ 57615 50651 10877 2949 2756 608
1GA 51233 7812 1868 1324 466 307
1KY 34133 4759 2402 2400 1210 940
1MS 17181 5856 491 359 242 167
1NC 60309 29303 3^92 3225 2537 894
1SC 26295 5541 2728 328 161 39
1TN 44243 15588 6844 5839 5656 5376
| SUBTOTAL 322,280 123,267 30,616 17,291 13,827 8,767


86
1 Region/State Number of
Tanks
Tanks
Closed
Confirmed
Releases
Cleanup*
Initiated
Sites Under
Control
Cleanup)
Completed
1 FIVE
1
^ 63922 11318 7807 6582 6582 1130|
1
W 29227 18526 2759 1387 1116 243|
1 MI 69133 29635 6934 6455 6007 884|
jMN 33033 3577 3542 2905 1752 1272
|
1 OH 74959 12497 9824 8586 8575 1960|
WI 67281 14621 6192 5323 1159 774j
|SUBTOTAL 337,555 90,174 37,058 31,238 25,191 6,263
1 SIX
1 AR 16030 2734 261 201 126 10
LA 25265 6628 1348 629 608 508
1 NM 8411 3223 860 609 480 336
I OK 29384 1830 1151 392 392 388
TX 104366 17526 11082 7,335 6095 2025
jSUBTOTAL 183,456 31,941 14,702 9,166 7,701 3,267
SEVEN
IA 15904 17851 4228 813 813 473
KS 15331 10508 2664 2383 1715 1165
|MO 20443 6000 1966 1686 1302 1182
1 NE 10859 6352 1749 257 161 117
j SUBTOTAL 62,537 40,711 10,607 5,139 3,991 2,937
1 EIGHT
CO 22246 4938 2371 1508 519 470
MT 12828 6501 1034 779 739 292
jND 8030 910 436 389 292 232
SD 8325 1079 1186 971 879 413
UT 10299 6108 14% 1066 635 381
|WY 8217 2921 973 469 406 331
|SUBTOTAL 69.945 22,457 7,496 5,182 3,470 2,119


87
Region/State Number of
Tanks
Tanks
Gosed
Confirmed
Releases
Geanups
Initiated
Sites Under
Control
Geanups
Completed
NINE
AZ 18540 9299 2261 1537 1072 496
CA 124872 4516 20656 7760 4899 3728
HI 5618 424 444 197 80 2
NV . 5986 2650 1068 800 771 586
CQ 89 14 2 2 2
GU 433 109 70 70 70 50
SA 53 2 2
SUBTOTAL 155,591 17,012 24,503 10,368 6,894 4,862
Iten
Iak 5847 2244 543 392 371 139
ID 8493 2200 517 408 408 240
OR 16105 11600 3386 1998 1388 1040
WA 23720 15158 2414 2210 1987 498
SUBTOTAL! = =
54,165 31,202 6,860 5,008 4,154 1,917
Number of
Tanks
Tanks 1
Gosed|
Confirmed
Releases
Cleanups
Initiated
Sites Under
Control1
Cleanups 1
Completed 1
National
Total1,565,613 457,536 166,731 113,774 88,526 44,008


88
Corrective Action Measures For Third Quarter FY 92
Region/Stale Emergency
Response*
Enforcement 1
Action*|
ONE JCT 35 383 1
MA 2079 1781 1
ME 188 48 1
NH 182 826 1
RI 14 312|
VT 82 123|
SUBTOTAL 2,580 3,473|
TWO JNJ 49 2889
NY 51 6725
PR 69 42
VI 4 9
SUBTOTAL 173 9,665
THREE
DC 14 123
DE 135 945
MD 179 1422
PA 47 406
VA 37 3568
WV 19 376
SUBTOTAL 431 6,840
FOUR
AL 96 1252
FL 129 2609
GA 7 6
KY 123 1592
MS 54 497
NC 170 977
sc 11 66
TN 8 1750
SUBTOTAL 598 8,749


89
Region/Sute Emergency
Response*
Enforcement
Actions
FIVE
IL 210 311
IN 22 617
MI 241 2392
MN 74 3597
OH 246 246
WI 187 966
SUBTOTAL 980 8.129 1
srx JAR 6 138
|
LA 158 595|
NM 38 519|
OK 16 642|
TX 75 7702
SUBTOTAL 293 9.596 1
SEVEN
IA 203 3529
KS 60 10|
MO 89 26
NE 2 11
SUBTOTAL 354 3,576
EIGHT JCO 121 37
|
MT 2 13 1
ND 5 |
SD 6 12|
UT 9 24 I
WY 44 310|
| SUBTOTAL 187 396|


90
Region/Sute Emergency
Response*
Enforcement
Actions
NINE
AZ 15 1030
CA 162 5278
HI 52 1
NV 14 407
CQ
GU 63
SA 2
SUBTOTAL 254 6,769|
TEN nAK 4 169 1
ID 9 226 1
OR 51 176|
WA 21 50|
SUBTOTAL 85 621 I
Emergency
Responses
Enforcement
Actions
National
Total
5,935 57,814


Leak Detection Compliance Measures For Third Quarter FY 92
91
Region/State Facilities
Required to
Submit
Evidence??
Facilities Judged
to Be in
Compliance
Facilities
Inspected
Facilities Judged
to Be in
Compliance
Informal
Enforcement
Orders Issued
Formal
Enforcement
Orders Issued
ONE
CT 4300 1100 33 4 48 23
MA
ME 7900 3375 39 18 60 11
NH 1310 611 108 108 190
RI 273 270 12 54 8|
VT 757 662 220 146 413 75j
SUBTOTAL 14,540 6,018 412 276 765 117
TWO
NJ 331 261 10 10
NY 2212 1079 18 10 1 I
PR 182 242 71 1
VI 157 85 76 39 59 251
SUBTOTAL 2,882 1,415 346 59 130 26 1
THREE JDC 348 187 14 11 170 4
f
DE 117 97 211 141 97 19|
MD 27 22 1238 104 1196 22
PA
VA 178 97 70 68 21 302
WV 1903 59 112 81 4 56
SUBTOTAL 2,573 462 1,645 405 1,488 403
FOUR
AL 1672 1535 150 503
FL 61405
GA 61 9 107 16 7 22
KY 1176 260 40
MS 1760 876 55 53 608 32
1 NC 118 40 78
1 5C 173 173 20 20
TN 6215 2594 6215
|SUBTOTAL 9,385 3,912 63,377 1,664 7,098 -l


92
Region/Stale Facilities
Required to
Submit Evidence
Facilities Judged
to Be in
Compliance
Facilities
Inspected
Facilities Judged
to Be id
Compliance
Informal
Enforcement
Orders Issued
Formal
Enforcement
FIVE
XL 3183 3183 185
IN
MI '5788 5093 783 175 266
MN 17
OH 25583 186 170 6
WI 9760 649 61
SUBTOTAL 44,314 8.925 1,047 345 272 185
SIX
AR 5380 2900 42 30 8
LA 990 990 871 774 92 5|
NM 1453 1087 3661
OK 568 413 64 3|
TX 19173 8090 1981 1962 9551 41
SUBTOTAL 25,543 11,980 4,915 4,266 9,715 378|
SEVEN
LA 979 266 51 1
KS 5391 4852 40 40 640 2
MO 731 358 53 28
NE 998 143 558|
SUBTOTAL 5,391 4,852 2.748 807 1,302 31|
EIGHT
CO 345 316 209 191 20 ol
MT 274 221 21 1
ND 684 681 63 9 373 11
SD 2890 801 410 288 94
UT 2126 1758 71 29 23 10J
WY 2798 388 13 2 108 4J
SUBTOTAL 8,843 3,944 1,040 740 639 26|


93
Regioa/Sute Ficilities
Required to
Submit Evidence
Facilities Judged
to Be in
Compliance
Ficilities
Inspected
Facilities Judged
to Be in
Compliance
Informal
Enforcement
Orders Issued
Formal
Enforcement
NINE
AZ 4S98 2166 322 134 60
CA 130573 87548 9163 7057 2749 353
HI 1070 862 33 21 227
NV 224 170 90 85 89 7
CQ 82 12 4 5
GU 46 43 46 43 2
SA 49 49 53 51 4
SUBTOTAL 136,642 90,850 9,711 7,396 3,131 360
j—TEN
AX 3091 1054 25 6 28
ID HI 80 30 9
OR 4 2 2
WA 6654 5221 458 377 126
SUBTOTAL 9,745 6,275 598 465 1861
9
Facilities
Required to
Submit Evidence
Facilities Judged
to Be in
Compliance
Facilities
Inspected
Facilities Judged
to Be in
Compliance
Informal
Enforcement
Orders Issued
Formal
Enforcement
Orders Issued|
National
Total259,858 138,643 85,839 16,423 24,726 2,092
'These totals include actions taken by the Regions to promote compliance within their States,
totals are cumulative since 1" quarter FY 1991.


94
CM
0)
rID
o
0)
D)CO a>4-» c/)c i—
(1) <D
o >1—CD
Q.
C3
m C(/) (0(0 H(0 (/)(DCO c(0 o0) O)<D (1)
DC DC
T3 .cQ> uE <0
k. UJ«*—
coO
£^£3&riaa&ftwiK
o momT- T—
esj3A|un iuei |fuo|0.iy i° luoojod
00
to i:
Q)
rx
<am uj
n


95
tNOO)
0)
3O
ft o
e 2£ aO £
a c</>—
a) wn °
E *o "o
M13
s
09 Kgftl
a
CM Bsi
N BP^BSS^5^!15
1
N1
en EKJIjj
w £"
28.6 H
^ ECM K
o E2S
Vs
S S § 8
sesBeiey pewj|juoo jo jueojed
o
c
•IO)VDC
<a.
IT)LU
CO
CN


96
0)
c3oo
P -E
°> 5?CO
JQ)
E ao oJr.
w
isCO O
CO ©5 CC
JE -a
a E3 .!=
sio5°
8 § 2 § 8T"
sesBeiey peiujuuoo jo lueojed

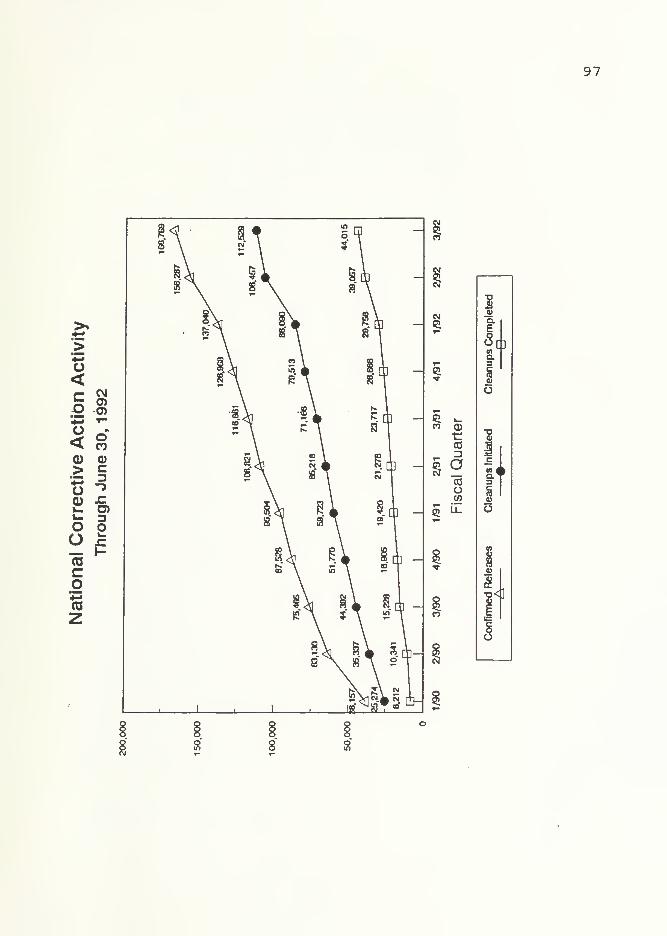
97
[]
Y
3g
o


REFERENCES
98


REFERENCES
1. Baker, Peter. Oil leaks pose hazard in FairfaxCounty. 1991. Washington Post . 25 July, Al.
2. Baker, P. and Cohn D'Vera. Leak impact of USTs atFairfax County. 1991. Washington Post . 26 July, CI.
3. Brooks, Andree. Dealing with those underground "timebombs." 1990. New York Times 25 February, sec. 1,
p. 34.
4. Code of Federal Regulations Title 4 Parts 280 and281. September 1988 and October 1988.
5. Cruver, Philip C, "Above Ground Alternatives,"Environmental Journal 3 . July-August 1991, pp.14.
6. Frazier, Herb. Southern division naval facilitiesengineering command. 1992. Interview by author, May15, Jacksonville, FL. Telephone interview.
7. Fuel Tank Insurance. 1990. Nations BusinessJanuary: pp.6.
8. Harper, Troy. Federal EPA Region 9. 1992.Interview by author, April 12, San Francisco.Telephone interview.
9. Hoffman R.D.R., "Stopping the Peril of LeakingTanks," Popular Science . March 1991, pp. 77-80.
10. Holusha, John. Water isn't the only thing coming outof the well. 1991. New York Times . 15 September,sec. 3, p. 5.
11. Kaiser receives contract to clean up UST leaks. 1991Washington Post . 2 2 October, W6.
12. Kelley, Daryl . Test of buried tanks lag; leaksinto water feared. 1988. L.A. Times . 28 August. II.
13. Kocheisen, Carol, "Financial Responsibility,"Nations Cities Weekly . June 1990, pp.5.
14. . "NLC Wins Delay," Nations CitiesWeekly . 19 November 1990, pp.2.
99


100
15. Lemonick, Michael D. , "Nightmare on theMonongahela, " Time . 18 January 1988, pp. 50-51.
16. Lenish, Bill. Federal EPA. 1992. Interview byauthor, July 9, Washington DC. Telephone interview.
17. McDonald, Steve. Director environmental departmentnaval weapons station. 1992. Interview by author,April 11, Seal Beach.
18. McGarvey, Robert. 1991. Danger on Tap. AmericanLegion Magazine . August: pp. 22-24.
19. New York Times. System finds, stops leaks inunderground storage tanks. 1992. Orange CountyRegister . 24 February, E5.
20. "New Technology," American City and Country .
November 1989, pp. 44.
21. Patton, Mary Kay. California EPA. 1992.Interview by author, June 10, Sacramento.Telephone interview.
22. Southerland, Bill. Southwest division navalfacilities engineering command. 1992. Interview byauthor, May 5, San Diego. Telephone interview.
23. Taylor, Jay. 1990. Threatened by a Safer Environment.Insight . 4 January: pp. 42.
24. Tevis, Cheryl, "Trouble Below," SuccessfulFarming . April 1991, pp. 16.
25. Thompson Publishing Group. 1991. Underground StorageTank Guide . Salisbury, MD.


ThesisH4353 Helveyc.l Environmental and eco-
nomic impact of under-ground storage tanks in
the United States andTerritories.