Embed Size (px)
Citation preview
1
Environmental and macroeconomic impact assessment of different development scenarios to organic and low-input farming
in Croatia
Darko Znaor Jules Pretty
James Morrison Sonja Karoglan Todorović
November 2005
2
Further information can be obtained from:
UNIVERSITY OF ESSEX Centre for Environment and Society Wivenhoe Park Colchester CO 3SQ United Kingdom Tel: 00 44 12 06 87 22 19 Fax: 00 44 12 06 87 34 16 Email: [email protected]
ECOLOGICA Vlaška 64 10000 Zagreb Croatia Tel: 00 385 1 46 36 959 Fax: 00 385 1 46 36 956 Email: [email protected]
This project has been carried out with support from the FAO
3
CONTENTS
CONTENTS ............................................................................................................................ 3 GLOSSARY OF TERMS AND ABBREVIATIONS .................................................................. 7 ACKNOWLEDGEMENT.......................................................................................................... 8 1. BACKGROUND INFORMATION ................................................................................. 11
1.1. FAO’s assistance to Croatian organic and low-input farming .............................................................11 1.2. Croatia on the accession road to the EU............................................................................................11 1.3. Croatian agricultural policy at the crossroads.....................................................................................12
2. RESEARCH METHODOLOGY.................................................................................... 13 2.1. Research questions............................................................................................................................13 2.2. Research objectives ...........................................................................................................................13 2.3. Research hypotheses.........................................................................................................................14 2.4. Research relevance ...........................................................................................................................14 2.5. Research steps and methods.............................................................................................................15
2.5.1 Step 1: Baseline scenario ....................................................................................................15 2.5.2 Quantification of environmental pollutants............................................................................16 2.5.3 Step 2: Development scenarios............................................................................................19 2.5.4 Step 3: Implications for policy-making ..................................................................................20
2.6. Research boundaries .........................................................................................................................20 2.6.1 Sectoral boundaries..............................................................................................................20 2.6.2 Type of externalities .............................................................................................................20 2.6.3 Impact categories .................................................................................................................21 2.6.4 Geographical boundaries .....................................................................................................21
2.7. Uncertainties, cavities and constraints ...............................................................................................21 3. CROATIAN FARMING SECTOR................................................................................. 23
3.1. Croatia in a nutshell............................................................................................................................23 3.2. Natural resources...............................................................................................................................23
3.2.1 The climate ...........................................................................................................................23 3.2.2 The soil .................................................................................................................................25 3.2.3 Biodiversity ...........................................................................................................................25 3.2.4 Agro-ecological zones ..........................................................................................................28
3.3. Legacies of the past ...........................................................................................................................29 3.3.1 The fall of state-planned agricultural economy .....................................................................30
3.4. Agricultural statistics...........................................................................................................................30 3.4.1 Number and size of farms.....................................................................................................32 3.4.2 Land use and cropping pattern .............................................................................................33 3.4.3 Livestock...............................................................................................................................38
3.5. Agricultural inputs...............................................................................................................................39 3.5.1 Fertiliser consumption ..........................................................................................................40
4
3.5.2 Pesticide consumption..........................................................................................................41 3.5.3 Machinery and irrigation .......................................................................................................42
3.6. Environmental impact of agriculture ...................................................................................................43 3.6.1 Perceptions on environmental impact of agriculture .............................................................43 3.6.2 Biodiversity ...........................................................................................................................46
3.7. Agricultural outputs and employment .................................................................................................47 3.7.1 Production volume and yields...............................................................................................47 3.7.2 Agricultural trade balance.....................................................................................................48 3.7.3 Employment..........................................................................................................................49
3.8. Agricultural policy ...............................................................................................................................50 3.8.1 First pillar: production subsidies ...........................................................................................50 3.8.2 Second pillar: structural policy measures .............................................................................51 3.8.3 Other support schemes ........................................................................................................53 3.8.4 Penalties...............................................................................................................................53
3.9. Organic farming..................................................................................................................................53 3.9.1 Organic subsides..................................................................................................................57 3.9.2 Organic market .....................................................................................................................60
4. GDP OF FARMING AND FULS................................................................................... 62 4.1. Croatian GDP.....................................................................................................................................62 4.2. Problems with calculation of the value added of Croatian farming .....................................................62 4.3. Methodology.......................................................................................................................................64 4.4. Selection of relevant economic activities............................................................................................64 4.5. Value added from farming sector .......................................................................................................64
4.5.1 Intermediate consumption ....................................................................................................65 4.6. Value added from FULS.....................................................................................................................68 4.7. Results ...............................................................................................................................................72
4.7.1 Economic activities selected according to NCEA .................................................................72 4.7.2 Fertiliser and pesticide consumption ....................................................................................74 4.7.3 GVA from farming and FULS................................................................................................77
4.8. Discussion..........................................................................................................................................87 4.8.1 Fertiliser consumption ..........................................................................................................87 4.8.2 Pesticide consumption..........................................................................................................88 4.8.3 Efficiency of inputs................................................................................................................89 4.8.4 GVA calculation ....................................................................................................................91
5. DAMAGE TO AIR......................................................................................................... 93 5.1. Greenhouse gases.............................................................................................................................93 5.2. Regional and local air pollutants ........................................................................................................94 5.3. Methodology.......................................................................................................................................94
5.3.1 Quantity of air pollutants arising from farming ......................................................................95 5.3.2 Quantity of air pollutants caused by FULS ...........................................................................95 5.3.3 Valuation of air-related externalities .....................................................................................96
5
5.4. Results .............................................................................................................................................101 5.5. Discussion........................................................................................................................................106
6. DAMAGE TO WATER................................................................................................ 109 6.1. Water and agriculture .......................................................................................................................109 6.2. Pathways of entering water and type of pollutants ...........................................................................109
6.2.1 Nitrogen balance and losses to water.................................................................................109 6.3. Environmental problems...................................................................................................................112 6.4. Impact on human health...................................................................................................................114
6.4.1 Pesticides ...........................................................................................................................114 6.4.2 Nitrates ...............................................................................................................................115 6.4.3 Other water pollutants ........................................................................................................115
6.5. Water valuation methods..................................................................................................................116 6.5.1 Contingent valuation...........................................................................................................120 6.5.2 Pollution abatement and shadow prices method ................................................................120 6.5.3 Pressure-state-response method .......................................................................................123 6.5.4 Water purification costs ......................................................................................................124
6.6. Quality of Croatian water resources .................................................................................................125 6.6.1 General...............................................................................................................................125 6.6.2 Nutrients .............................................................................................................................126 6.6.3 Pesticides ...........................................................................................................................131 6.6.4 Heavy metals and radioactivity ...........................................................................................133 6.6.5 Conclusions ........................................................................................................................133
6.7. Water valuation methodology for Croatia .........................................................................................134 6.7.1 Agricultural nitrogen balance calculation ............................................................................135 6.7.2 Calculation of N loss to water .............................................................................................136 6.7.3 Costing the damage ...........................................................................................................136
6.8. Results .............................................................................................................................................139 6.9. Discussion........................................................................................................................................142
7. DAMAGE TO SOIL .................................................................................................... 145 7.1. Soil-related external costs and valuation methods ...........................................................................145
7.1.1 Soil carbon..........................................................................................................................146 7.1.2 Soil erosion.........................................................................................................................147
7.2. State of Croatian soils ......................................................................................................................148 7.3. Methodology.....................................................................................................................................150 7.4. Results .............................................................................................................................................151 7.5. Discussion........................................................................................................................................154
8. PUBLIC INVESTMENTS............................................................................................ 157 8.1. General ............................................................................................................................................157 8.2. Investment to public institutions providing service to agricultural sector...........................................157 8.3. Farming subsidies ............................................................................................................................157 8.4. Subsidies to agri-industrial complexes .............................................................................................159
6
8.5. Public investments in water and road conveyance systems.............................................................160 8.6. Transport subsidies ..........................................................................................................................161 8.7. Subsidy to fertiliser production .........................................................................................................161
8.7.1 Allergy-related public investments ......................................................................................165 8.8. Summary of findings.........................................................................................................................167
9. BASELINE SCENARIO: SUMMARY ......................................................................... 169 10. large-scale ORGANIC farming SCENARIOS............................................................. 171
10.1. Comparison issues...........................................................................................................................171 10.2. Environmental and economic performance of organic farming ........................................................172 10.3. Methodology.....................................................................................................................................174 10.4. Results .............................................................................................................................................175
11. conclusionS................................................................................................................ 187 12. REFERENCES........................................................................................................... 190
GLOSSARY OF TERMS AND ABBREVIATIONS
AE Agri-Environment AZO Environment Protection Agency DZS Central Bureau of Statistics EC European Commission EC European Commission EU European Union EUR European Monetary Union currency FAO Food and Agriculture Organisation of the United Nations FINA Financial Agency FTE Full-time (employment) equivalent FULS Farm-upstream linked sectors FUTURO External costs measurement (1 FUTURO = 1 EUR) FZOEU Environmental Protection and Energy Efficiency Fund GDP Gross domestic product GM Gross margin GVA Gross value added HGK Croatian Chamber of Economy HR Croatia IC Intermediate consumption HZPSS Croatian State Extension Service KZO Cadastre of Emissions into Environment LU Livestock unit MPŠ Ministry of Agriculture and Forestry (pre-2004 name) MPŠVG Ministry of Agriculture, Forestry and Water Management MZOPUG Ministry of Environmental Protection, Spatial Planning and Construction NCEA National classification of economic activities NGO Non-governmental organisation PPA Plant protection agents t-km Tonne-kilometres UAA Utilised agricultural area
8
ACKNOWLEDGEMENT
The authors would like to thank all those who have helped in the implementation of this project and in assembling the many elements required for this study:
Irena Bagarić (Croatian Chamber of Economics); Delko Barišić (Ruđer Bošković Institute); Dubravka Begović (Ministry of Finance); Morana Belamarić Šaravija (Croatian Centre for Greener Production); Bosiljka Bogunović (Croatian Railways); Blaženka Buturajec (Central Bureau of Statistics); Krunoslav Capak (Croatian Institute of Public Health); Krunoslav Čačić (Croatian Institute of Public Health, Vukovarsko-Srijemska County); Zlatko Černjul (Croatian Association of Plant Protection Manufacturers and Distributors); Mirjana Čerškov-Klika (APO d.o.o); Alen Čičko (INA d.d.); Krunoslav Čović, (Chromos Agro d.o.o); Ankica Čulo (Ministry of Agriculture, Forestry and Water Management); Luka Čuljak (Croatian Agricultural Extension Service); Gorana Ćosić-Flajsig (Croatian Waters); Marija Devčić (Croatian Institute of Public Health, Bjelovarsko-Bilogorska County); Tin Dumbović (Croatian Highways); Ramona Franić (Faculty of Agronomy, University of Zagreb); Josip Friščić (Croatian Union of Gas Syndicates); Božo Galić (Ministry of Agriculture, Forestry and Water Management); Ružica Gelo (Croatian Chamber of Economics); Jasna Golubić (Faculty of Transport and Connections, University of Zagreb); Tihomir Gorša (independent veterinary consultant); Petar Grahovac (Faculty of Economics, University of Zagreb); Goran Granić (Energy Institute Hrvoje Požar); Darko Grbeša (Faculty of Agronomy, University of Zagreb); Višnja Grgasović (Ministry of Environment, Spatial Planning and Construction); Zoran Grgić (Faculty of Agronomy, University of Zagreb); Željka Gudelj Velaga (Ministry of Agriculture, Forestry and Water Management); Marjan Host (Croatian Centre for Greener Production); Stjepan Husnjak (Faculty of Agronomy, University of Zagreb); Mijo Ivanković (Herbos, d.o.o.); Damir Ježić (Croatian Highways); Petar Jurjević (Croatian Forests); Ivan Juras of the (Croatian Agricultural Extension Service); Mladenka Karačić (Ministry of Finance); Petar Karoglan (Faculty of Agronomy, University of Zagreb); Jasna Kiš (Central Bureau of Statistics); Mira Klarić Sobota (Croatian Railways); Vesna Koletić (Central Bureau of Statistics); Vesna Kubiček (Ministry of Agriculture, Forestry and Water Management); Savka Kučar-Dragičević (Environmental Protection Agency); Dragica Kušen (Financial Agency); Ivona Lakovnik (Central Bureau of Statistics); Mojca Lukšić (Ministry of Agriculture, Forestry and Water Management); Višnja Ljubetić (Ministry of Agriculture, Forestry and Water Management); Biserka Ljubić (Central Bureau of Statistics); Vera Maksimović Stipan (Croatian Railways); Božo Mikuš (Syndicate of Oil Industries); Vinko Mladineo (Environmental Protection and Energy Efficiency Fund); Mladen Njavro (Faculty of Agronomy, University of Zagreb); Vanja Mastelić (Central Bureau of Statistics); Milan Maceljski (Croatian Academy of Science and Arts); Marina Mikšić (Croatian Agricultural Extension Service); Renata Pekorari (HIDRA); Damir Pešut (Energy Institute Hrvoje Požar); Renata Peternel (Croatian Institute of Public Health); Nevenka Petković (Veterinary Institute Vinkovici); Danica Pikec (Central Bureau of Statistics); Dragana Pnjak (Park d.o.o); Štefica Posavčević (Veterinary Institute Vinkovci); Jasna Purgar (Central Bureau of Statistics); Boris Raus (Croatian Roads); Srećko Selanac (Ministry of Agriculture, Forestry and Water Management); Mario Sever (Sever Organic Farm); Ivan Smolčić (Herbos d.o.o); Mirjana Stančić (City of Zagreb); Ranko Stevanović (Croatian Institute of Public Health); Ivan Stilinović (Veterina d.o.o.); Slavko Šobot (Croatian Institute of Public Health); Mira Šimanović (Central Bureau of Statistics), Mira Šolić Gavranović (Ministry of Environment, Spatial Planning and Construction); Ivan Štiglić (Veterina d.o.o.); Ivona Štritof (VRED); Antonio Šustić (State Cadastre Office); Vesna Tomić Benko (Veterina d.o.o); Ljudevit Tropan (Croatian Waters); Marina Valek (Croatian Institute of Public Health, Osječko-Baranjska County); Ankica Vujčić (Dalmed
9
d.o.o); Ariana Znaor (Croatian Institute of Public Health); Mirjana Žeželj (Financial Agency); Tito Žimbrek (Faculty of Agriculture, University of Zagreb);
We are particularly grateful to the following people who have provided us with some vital information and data: • Danko Biondić (Croatian Waters) for various costs related to water management in
Croatia • Mate Brstilo (Ministry of Agriculture, Forestry and Water Management) for the
information on veterinary medicine in Croatia • Dražen Gorjanski (Osijek Association for combating allergic diseases) for providing
us with data on pollen-induced allergies in Slavonia and elsewhere • Zlatko Grzelj (Central Bureau of Statistics) for discussing with us the problems of the
land-use statistics in Croatia • Fons Habets (Independent Consultant, the Netherlands) for providing us with the
improved version of the FARM model software on farm balances • Jos Haynes of (Bespoke Consultancy) for various comments on the external costs of
air pollution and added value of the Croatian farming sector • Sven Jelaska and Vladimir Kušan from Oikon, d.o.o. for sharing with us data and
expert opinion on the satellite images of the Croatian land-use • Žaklina Jurišić (Ministry of Agriculture, Forestry and Water Management) for
discussing with us the issue of the gross value added of Croatian farming • Elza Kauf and Katica Marinić of Croatian Railways for the financial data on Croatian
railways. • Dubravka Kipčić (Croatian Institute of Public Health) for the overview on pesticide
residues in Croatia • Višnja Knjaz (Croatian Chamber of Economics) and Zorislav Weigant (Krmiva d.o.o)
for the feedstuff calculations • Nic Lampkin (University of Wales, Aberystwyth) for the discussion on methodological
considerations regarding the comparison between the baseline and organic scenarios • Branimir Molak (Ministry of Defence) for his comprehensive knowledge and critical
views on the Croatian energy sector • Silvana Muškardin (Environmental Protection and Energy Efficiency Fund) and Jasna
Kufrin (Environmental Protection Agency) kindly supplied us various data from the Cadastre of Emissions into the Environment
• Višnja Jelić Mück (Ministry of Environment, Spatial Planning and Construction) for facilitating access to various environmental data
• Jasenka Nećak (Ministry of Environment, Spatial Planning and Construction) for the data on green house gases and air pollution in Croatia.
• Goran Purić (Faculty of Food Technology, University of Zagreb) took care of the questionnaires and contact with water companies
• Martien Schenider Jacobi (Euronatur) for sharing with us data and observations on water pollution in Lonjsko Polje Nature Park
• John Sumelius of (Faculty of Agriculture and Forestry, University of Helsinki) for the discussion on nitrogen abatement costs in Croatia
• Branka Viduka (Financial Agency) for facilitating getting detailed financial figures of selected economic sectors
• Raffaele Zanoli (Università Politecnica delle Marche, Ancona) for the fruitful discussion regarding the organic scenarios.
The staff of Petrokemija d.d. have shown a genuine interest in the study. They have promptly and professionally treated our numerous questions and transparently provided us with various environmental and financial data. We thank them all for their kind co-
10
operation: Boris Mesarić, Zdenka Krstanović, Nedjeljko Klopček, Damir Piršić, Grozdana Avirović, Antun Vešligaj and Željka Bačić.
Very special thanks goes to: • Bert Dorste-Franke (Institute of Energy Economics and the Rational Use of Energy,
University of Stuttgart) for providing us with insight into the external costs of the ExternE project and for calculating air pollution damage factors for Croatia
• Blanka Dragojević of Ecologica for assisting us in collecting and sorting various data needed for the study
• Eighty six Croatian organic farmers who responded to our questionnaire and provided us with valuable data and comments
• Rainer Krell and Nadia Scialabba of the FAO for their patience and study co-ordination
• Philippa Jill Gallop for language assistance • Željko Jurić, Davor Vešligaj and Snježana Fijan-Parlov from Ekonerg d.o.o for
providing us with valuable assistance regarding the emissions of greenhouse gases and air pollutants.
• Anđelka Palfi (Croatian Railways) for her endurance in connecting “loose-ends” and providing us with very detailed information on the Croatian railway freight
• Ivanka Purić (Central Bureau of Statistics) for being our “statistical trouble-shooter” and for facilitating obtaining numerous statistical datasets
• Ivan Šutalo and Milenka Crnogorac of the Croatian Bureau of statistics for discussing with us the methodology for the calculation of gross value added.
• Branko Vuk (Hrvoje Požar Energy Institute) for providing data and additional clarifications regarding the Croatian energy balance
• Sanja Vulama (Hrvoje Požar Energy Institute) for the comparative calculation of the gas prices in Croatia and elsewhere
11
1. BACKGROUND INFORMATION
1.1. FAO’s assistance to Croatian organic and low-input farming
Following the request of the Government of the Republic of Croatia, in September 2003 the Food and Agriculture Organisation of the United Nations (FAO) funded a technical assistance project for Croatia. The overall objective of this project was to improve rural income and food security through diversified production and specialty marketing of high-value and high quality products with environment-enhancing production methods.
One of the project’s tasks was to produce an environmental and macroeconomic impact assessment of large-scale conversion to organic agriculture. The real impacts of large-scale conversion to organic and low-input agriculture are largely unknown and are subject to speculation. This assessment is meant to provide building bricks for future Croatian agriculture policies and measures required to support organic and low-input farming. In May 2004, the FAO commissioned the University of Essex to commence a study trying to assess the environmental and economic consequences of widespread adoption of organic and low-input farming in Croatia.
1.2. Croatia on the accession road to the EU
After nearly a thousand years, Croatians have managed to achieve their long-sought independence. Croatia’s recent history has been marked with turbulent events. The country has been passing through a process of deep transformation. In the course of the last fifteen years the country has struggled with several difficult and painful processes: • the breakdown of the communist regime • the shift to a more democratic society • the transition to a market economy • the war for independence and post-war recovery (return of refugees,
reconstruction, war-crimes sanctioning, etc) • accession to major international political and other associations (EU,
NATO, WTO, etc.).
Croatia has been trying to access the economic and political mainstream of Europe. It aspires to join the European Union before 2010. All major political parties have defined Croatia’s accession to the EU as a strategic national goal and support the county’s application for EU membership. In its efforts to pursue new aspirations and catch up with modern developments, the country is encountering new challenges. In May 2004, the European Commission granted Croatia candidate country status. In order to nurture a positive relationship with the EU and to prevent itself from further lagging behind in the accession process, Croatia has taken the first steps towards the adoption of EU-based regulations in nearly all fields of policy. Like the previous one, the present Government is also determined to create a closer relationship with the EU. In order to accelerate the EU accession process the Government has initiated a challenging reform programme. Its main
FAO project
Study on impacts of organic and low-input farming
Turbulent recent history
EU accession efforts
12
objectives are to complete the process of transition and achieve sustainable economic performance; enhance the democratisation of society and contribute to regional stability (EC 2004).
1.3. Croatian agricultural policy at the crossroads
In its search for new social, economic and political models, Croatia is trying to pursue modern achievements and concepts, including those in the agricultural sector. Croatian agricultural policies are still at the crossroads. They are not yet fully developed and enforced. This situation enables the concept of sustainable agriculture to be embedded into policy makers’ efforts for further policy improvements.
Croatia is in the process of creating the necessary conditions for its agriculture to face EU competitiveness and develop adequate working and living conditions in rural areas. It is therefore of the utmost importance to initiate the appropriate steps to bring agricultural and environmental policy in Croatia into line with that in the EU.
Sixty five percent of the agricultural land is privately owned. It is small-scale family farming (average farm size is 3 hectares). The remaining thirty five percent is in the hands of the former co-operatives. These are now restructured (and partly privatised) and have continued practising high-input agriculture. The agricultural policy support, notably subsidies is designed mainly to support high-input farming. The same goes for the extension, research, education and market promotion. The official agricultural policy in Croatia is geared towards supporting high external input agriculture. Both scientists and policy makers tend to believe this is the best way to increase agricultural production and strengthen the national economy. However, in recent years this way of thinking has been under revision and several programmes supporting more sustainable ways of farming have been initiated.
The need for a change of the present farming practices to more sustainable management has slowly been taking hold among Croatian policy makers, farmers, consumers and other societal groups. The current way of farming poses a serious treat to environment, food safety and animal welfare. In addition, there is growing consumer concern about food quality and its taste. In the last couple of years, Croatia has been recording an obvious growth of the area under organic management. The government has adopted legislation on organic farming and introduced direct payments to stimulate its further growth.
Chance for sustainable agriculture
Small-scale farming prevails
Rapid development of organic farming
13
2. RESEARCH METHODOLOGY
2.1. Research questions
The key research question is what would be the environmental and economic consequences of the conversion of a substantial portion of Croatian agricultural land to organic and low-input farming.
The research intends to answer this by comparing the economic and environmental performance of farming and farm-upstream linked economic sectors (FULS): energy supply, the farm inputs industry, transport and trade. The assessment is to be corrected for external costs (health, environment, social investments, etc.) arising from these activities. The comparison will be made between the baseline situation (2001-2003) and development scenarios having various shares of acreage under different farming methods (high-input, low-input and organic agriculture).
The impact of different scenarios will be examined against the following categories: 1. National agricultural output 2. Gross value added (GVA) 3. Employment 4. State of the environment.
2.2. Research objectives
The research objectives are to:
1. Provide a methodological framework for the determination and quantification of causal links associated with large-scale adoption of organic and low-input farming so that it can be used for other similar studies in Croatia and elsewhere
2. Provide first quantitative assessments on present externalities linked to Croatian farming and farm-upstream sectors
3. Assess the environmental and economic feasibility of widespread adoption to organic and low-input farming in Croatia taking into account externalities of farming and linked upstream sectors.
4. Identify gaps in current understanding, methodology and results 5. Outline policy actions needed to facilitate the adoption of the most
desirable development scenarios and thus provide output of immediate policy relevance.
Key question
How it is going to be answered
Impact categories
Provide methodological framework
Assess shift to organic and low-input farming including externalities
Stimulate wider debate and policy change
14
2.3. Research hypotheses
Achievements in farming practice, as well as a vast body of scientific evidence (see Chapter on organic farming) suggest that organic and other types of low-input farming can achieve a high degree of economic viability and environmental friendliness. Therefore it is expected that development scenarios comprising a substantial portion of organic and low-input farming exhibit equal or higher benefits for the national economy and national environmental account than the scenarios that have less area under such management regimes. It is presumed that these benefits are even greater if negative externalities associated with farm-upstream linked sectors were taken into account.
However the soundness of this hypothesis is highly questionable. Environmental and economic gains from organic and low-input agriculture have mostly been calculated at the farm level. Widespread adoption of these farming methods is most likely to have a range of impacts on the economic sectors linked to farming. These consequences are largely unknown and have hardly yet been assessed either in Croatia or elsewhere.
2.4. Research relevance
As this research attempts to address some fundamental but yet unanswered questions, it is hoped that its outcome will be highly relevant both for academics and policy-makers. The research aims at providing guidance for sensible judgement as to what the policy makers should do in order to promote sustainable agriculture. Its results are hoped to be a useful tool in helping Croatian policy-makers in shaping and implementing adequate policy measures supporting the development of the most promising development scenarios.
The assessed impact categories belong to key features associated with sustainable agriculture. The national agricultural output is an important element of food security. The GVA, corrected for external costs is a measurement of the size of the economy and indicates the “real” economic feasibility of various development scenarios. Employment is linked to social aspects, but is primarily the result of economic wealth. The GVA already includes the value of labour (and thus actual jobs or potential to create the new ones). However, employment is added as a separate category because it is an important “measure of success” for the general public and most policy makers. The state of the environment affects the quality of life and is essential for the well-being of future generations.
This research represents a pioneering work not only in Croatia but also further afield. Its questions seem to have been only partly addressed and answered in sustainable farming debates so far. Therefore the methodology and approach to be developed through this research could also be a useful framework for similar studies in other countries.
More organic and low-input farming is good for environment and farm economy
... but impact of widespread adoption is unknown
Tool for policy making
.. and their relevance
Pioneering work
15
2.5. Research steps and methods
The research path followed consists of the three main steps:
1. Construction and impact assessment of the baseline scenario 2. Construction and impact assessment of development scenarios 3. Considerations of scenario results on policy-making
Each of these three steps involved several sub-steps.
2.5.1 Step 1: Baseline scenario The baseline scenario is based on the average results obtained for the period 2001-2003.
Sub-step 1.1
A brief inventory of the current state of Croatian agricultural sector was made. It covers natural resources, land use, key agricultural commodities, farm inputs and outputs, policies, institutional settings, etc. This part should provide sound background information on the socio-economic, political and environmental context in which Croatian agriculture is operating.
Sub-step 1.2
Farming is closely linked with several farm-upstream economic sectors, notably:
1. Energy supply (oil, gas and electricity) 2. The farm inputs industry (pesticides, fertiliser, feeds, seeds and
veterinary medicine, farm machinery) 3. Transport of raw materials and final products of farm inputs and the
energy supply industry 4. Trade (wholesale and retail) of farm inputs and energy
The relevant economic activities from these sectors were identified and coded in accordance with the Croatian national classification of economic activities (NCEA) (N.N. 2003). The NCEA is a universal key for classifying economic activities and the Croatian coding system is more or less in line with international standards. Further selection of the key organisations from each of the identified economic activities was made using the database of the Croatian Chamber of Economy (HGK 2004) and its selection criteria for the size of the business (turnover and number of employees).
Sub-step 1.3
Gross value added (GVA) and number of employees were calculated for farming and identified farm-upstream linked economic activities (FULEA) following the methodology provided by the Croatian Bureau of Statistics (DZS 2004; Crnogorac 2005) and financial datasets supplied by the Croatian Financial Agency (FINA 2005). A detailed description of this step can be found in Chapter on GVA Exchange rates in this as well in
Inventory of Croatian agriculture
NCEA codes of farm-upstream linked economic activities
Calculation of GVA and number of employees
16
all other calculations were carried out using data from the Croatian National Bank (HNB 2005).
Sub-step 1.4
The emission of soil and water pollutants and environmental degradation of soil caused by the FULEA were quantified using data from the following sources:
2.5.2 Quantification of environmental pollutants The emissions of pollutants from economic activities linked to Croatian farming was quantified using data from the following sources:
1. Cadastre of Emissions into the Environment (KZO): This national database has been run by the Ministry of the Environment (MZOPUG) and the National Environmental Fund (FZOEU). The KZO database contains air and wastewater emissions from point sources and data on industrial and municipal waste generation and treatment (Jurić, Burek et al. 2005; MZOPUG 2005). The primary data for the Cadastre have been supplied by companies and other legal entities which are obliged to keep regular records and carry out annual reporting to the authorities. The KZO proved to be an important source of information, providing the type and quantity of pollutants for major companies of the interest for the study. In cases of doubts and unclearness regarding the KZO data, additional consultations were made with experts from MZOPUG (Nećak 2004; Šolić-Gavranović 2004), FZOEU (Muškardin 2004; Muškardin 2005) and the Environment Protection Agency (Kufrin 2004).
2. Water Pollution Cadastre. The public company Croatian Waters maintains its own cadastre (database) on water pollution. Companies that have obtained water permits from Croatian Waters are obliged to submit regular reports on water pollution. The water pollution data reported here are more detailed than those to the Cadastre of Emissions into the Environment.
3. Environmental information directly obtained from industries. The key companies were contacted in order to obtain new or check previously collected pollution information. Most of these, especially agri-chemical companies reacted positively to this request, providing various useful information: Herbos (Ivanković 2004; Smolčić 2004), Chromos (Čović 2004), Veterina (Benko Tomić 2004; Benko Tomić 2005; Stilinović 2005) and Dalmed (Vujčić 2004). Petrokemija (Avirović 2004; Vešligaj 2004; Avirović 2005) submitted particularly detailed and useful environmental data.
4. Corporate environmental reports, such as (HŽ 2001; HŽ 2002; Petrokemija 2002; Petrokemija 2002b; HEP 2003; INA 2004; Petrokemija 2004b).
5. Governmental environmental reports, such as (Hrvatske vode 2002; Hrvatske vode 2003; MZOPU 2003; CCPC 2004; Hrvatske vode 2004; MZOPUG 2004; MZOPUG 2004b).
Environmental emissions and degradations data
17
6. Research and consultancy organisations dealing with environmental pollution: EKONERG (Jurić 2005; Vešligaj 2005), the Hrvoje Požar Energy Institute (Vuk 2005) and the Croatian Centre for Cleaner Production ((Belamarić Šaravija 2004; Horst 2004). These organisations prepare various environmental analysis for national authorities and international projects and have unrivalled expertise in the field of air pollution and energy-related environmental issues.
Sub-step 1.5
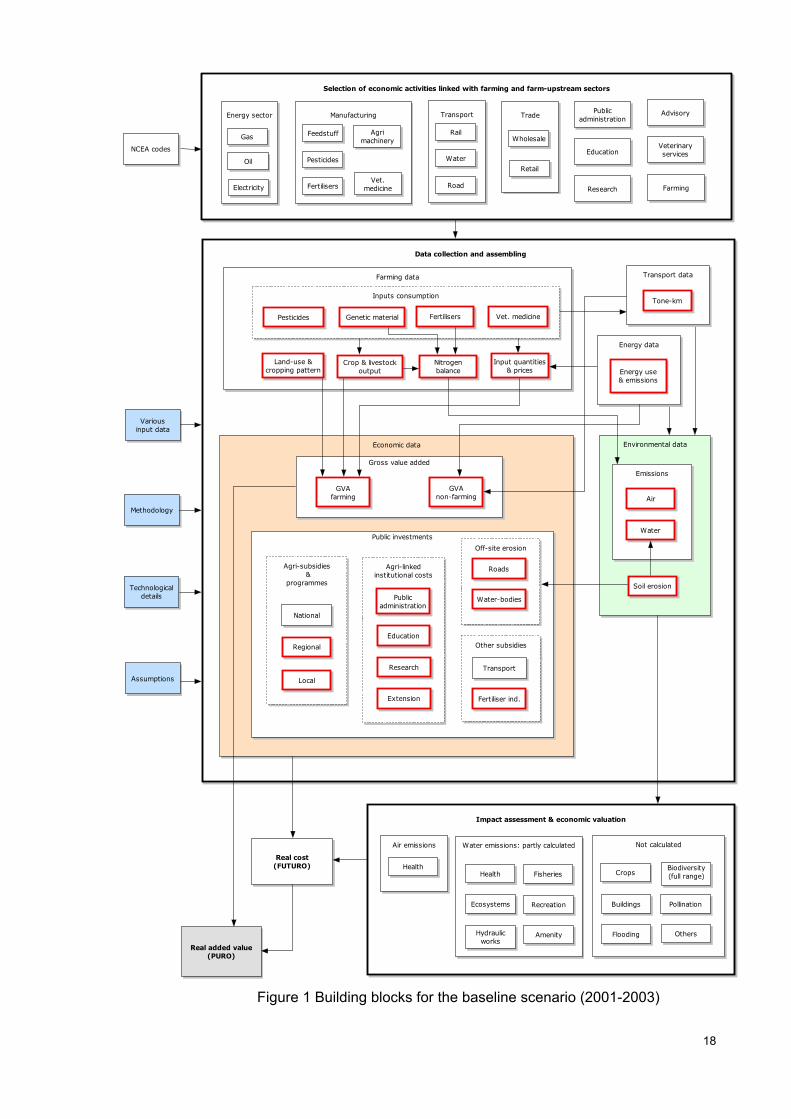
A methodological framework for assessing external costs related to damage to air, water and soil, as well as social investments was developed. Using various environmental accounting methods, an attempt was made to assign monetary value to the identified external costs throughout FULEA. The final external cost was named FUTURO (since most of these costs are to be paid in the future). The final real value added, that is value corrected for external costs was named PURO (since it represents added value “purified” from external costs). Some external costs were not possible to valuate due to the lack of data and/or appropriate valuation methods. More detailed information on the methods employed to assess external costs can be found in the chapters on air, water and soil damage and the chapter on social investments.
Figure 1 outlines the key building blocks used in constructing the baseline situation. The boxes framed in red indicate areas in which fundamental calculations had to be performed to the lack of data or inaccuracy, inconsistency and/or unreliability of the official data. More detailed explanation is given in the relevant chapters.
Assessment of external costs
18
Figure 1 Building blocks for the baseline scenario (2001-2003)
Data collection and assembling
Economic data Environmental data
Impact assessment & economic valuation
Real cost(FUTURO)
Real added value(PURO)
Methodology
Soil erosion
NCEA codes
Farming data
Land-use &cropping pattern
Input quantities& prices
Assumptions
Inputs consumption
FertilisersPesticides Vet. medicineGenetic material
Crop & livestockoutput
Nitrogenbalance
Technologicaldetails
Variousinput data
Selection of economic activities linked with farming and farm-upstream sectors
Energy sector
Electricity
Gas
Oil
Manufacturing
Fertilisers
Feedstuff
Pesticides
Agrimachinery
Vet.medicine
Transport
Road
Rail
Water
Trade
Wholesale
Retail
Publicadministration
Research
VeterinaryservicesEducation
Advisory
Farming
Emissions
Water
Air
Air emissions Water emissions: partly calculated
Health
Ecosystems
Not calculated
HealthCrops
Buildings
Flooding
Biodiversity(full range)Fisheries
PollinationRecreation
Hydraulicworks
Transport data
Tone-km
Energy data
Energy use& emissions
Amenity Others
Public investments
Agri-linkedinstitutional costs
Publicadministration
Research
Extension
EducationOther subsidies
Fertiliser ind.
Transport
Agri-subsidies &
programmes
National
Regional
Local
Off-site erosion
Water-bodies
Roads
Gross value added
GVAfarming
GVAnon-farming
19
Organic farmingsurvey
Assumptions onorganic farming
Literature survey Assumptions on convent. farming
- From baseline scenario
Assumptions onlow-input farming
Scenarios withdifferent shares
Real added value(EUR)
Assumptions on FULEA
- From baseline scenario
2.5.3 Step 2: Development scenarios
Sub-step 2.1
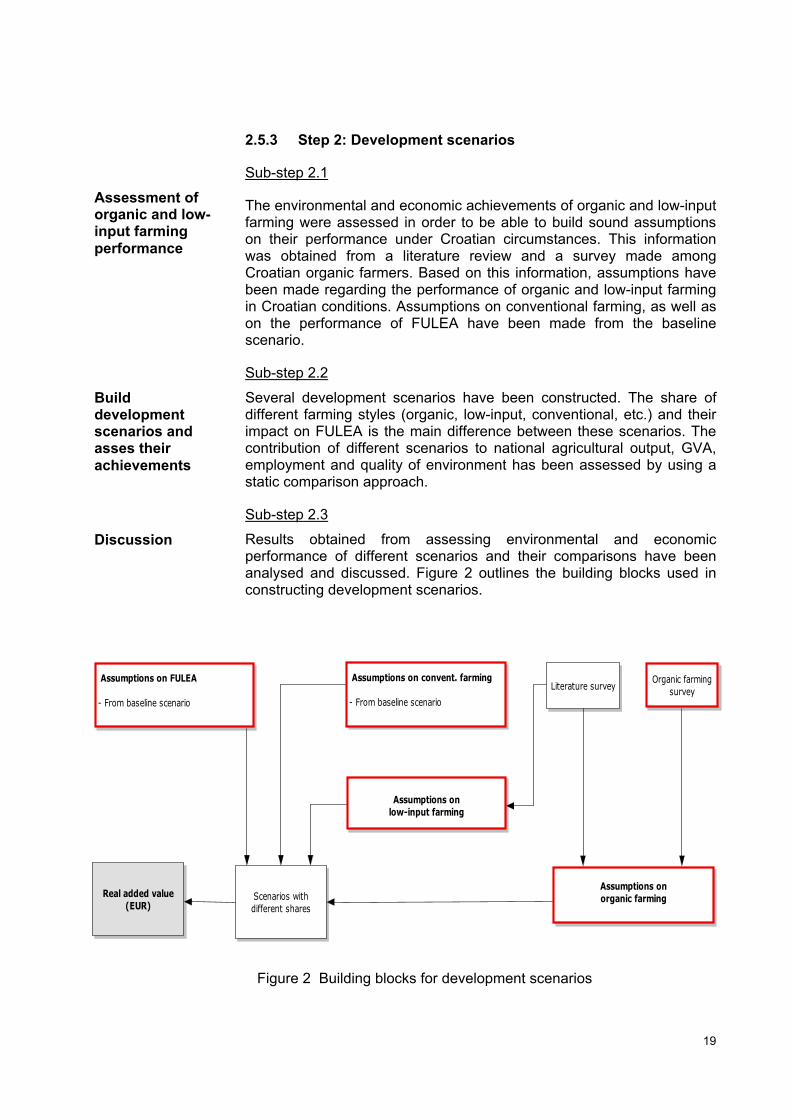
The environmental and economic achievements of organic and low-input farming were assessed in order to be able to build sound assumptions on their performance under Croatian circumstances. This information was obtained from a literature review and a survey made among Croatian organic farmers. Based on this information, assumptions have been made regarding the performance of organic and low-input farming in Croatian conditions. Assumptions on conventional farming, as well as on the performance of FULEA have been made from the baseline scenario.
Sub-step 2.2
Several development scenarios have been constructed. The share of different farming styles (organic, low-input, conventional, etc.) and their impact on FULEA is the main difference between these scenarios. The contribution of different scenarios to national agricultural output, GVA, employment and quality of environment has been assessed by using a static comparison approach.
Sub-step 2.3
Results obtained from assessing environmental and economic performance of different scenarios and their comparisons have been analysed and discussed. Figure 2 outlines the building blocks used in constructing development scenarios.
Figure 2 Building blocks for development scenarios
Assessment of organic and low-input farming performance
Build development scenarios and asses their achievements
Discussion
20
2.5.4 Step 3: Implications for policy-making The results obtained have been discussed in the light of policy making. Their implications for policy making have been analysed as well as the impact of the present Croatian agricultural and environmental policies on the development of desirable scenarios. Policy recommendations have been outlined and the likelihood of their realisation discussed.
2.6. Research boundaries
2.6.1 Sectoral boundaries Agriculture is linked to many economic sectors and human activities. Conversion to large-scale sustainable farming is most likely to have a range of impacts on various economic activities. The research focuses only on the FULEA. The farm downstream sectors such as the food processing industry, transport and retail are believed not to be significantly affected by the widespread adoption of organic and low-input farming and are thus excluded from the assessment. Several other socio-economic activities linked with farming have also not been assessed, because they are deemed to be insignificant for the final outcome. These activities include: • Hunting and forestry • Fisheries • Coal, solar and wind power • Tourism
2.6.2 Type of externalities The research addresses only negative externalities - costs. In order to obtain the “full picture” of the impact of the scenarios discussed, besides negative, positive externalities (health, biodiversity, human capital, etc.) should be included, too. However, in a number of cases, these might not be significant and their impact is often difficult to assess.
As already mentioned earlier, due to the lack of sound data and/or valuation methods, some external costs had to be excluded from the assessment, such as: • Odour and noise • Navigation restrictions and flooding caused by the reduced retention
capacity of water bodies due to erosion • Biodiversity and nature services • Pollination losses • Resistance to pesticides and antibiotics • Animal welfare • Decreased food quality However, where appropriate these externalities have been discussed in qualitative terms.
Policy options
Farm-downstream linked sectors excluded
Positive externalities excluded
... and not all negative valuated
21
2.6.3 Impact categories The scenario impact has been assessed for the four categories that are essential features of sustainable farming: agricultural output, GVA, employment and quality of environment. Several other categories that are also important elements of sustainability have been left out from the quantitative assessment and where appropriate have been discussed only in qualitative terms. These include: • Gender issues • Impact on rural life and development • Impact on consumers in urban areas
2.6.4 Geographical boundaries The research focused only on the impacts the widespread conversion to organic and low-input farming would have in Croatia and not elsewhere. This boundary is necessary, as the consideration of the wider impact on these sectors abroad (e.g. on foreign industry exporting pesticides to Croatia or raw phosphate mining industry in Africa) would complicate the already complex calculations even further. Widening the horizons outside the borders of Croatia itself is certainly needed and worthwhile, but this would make the assessment virtually impossible. Since the objective of this study is primarily to provide an answer as to whether the large-scale conversion to sustainable types of agriculture is economically viable and environmentally sound from the Croatian (national) policy point of view, calculation expansion to other countries is of less relevance.
However, the external costs on damage to air have been given both for Croatia and elsewhere because these costs have been generated in Croatia by Croatian farming and its upstream-linked economic sectors.
All assessments have been aggregated at the national scale, and are given as the average for the period 2001-2003.
2.7. Uncertainties, cavities and constraints
This research is rather complex and holistic. It tries to explore and assess a number of economic and environmental linkages between farming and farm-upstream sectors. Besides it attempts to quantify major external costs involved. In such “fragmented” research, results cannot be obtained by applying uniform methods and methodology. These have had to be developed from case to case. The methods employed in this research have been described in relevant chapter and comprise: • Willingness to pay • Cost: benefit analysis • Contingent valuation • Literature survey • Proxy • Extrapolation from primary data sources • Farm surveys
Four essential categories included
Croatia only
National vs. regional level
Methodological issues
22
• Case study results • Consultation with opinion leaders • Unobtrusive measures or indirect observation (documentary
analysis, content analysis, archival analysis). Much of the data needed to perform such a study was not available or was of questionable quality. In other words, the research had to be performed in a data-poor context. Unexpectedly, but in a number of cases, even some of the most fundamental calculations had to be made from scratch (e.g. national agricultural output, GVA of farming and other economic activities, land use area and pattern, consumption of fertilisers and pesticides, nitrogen balance, etc.). All these data are usually available in national statistics, government reports and academic research. Unfortunately, this is not the case in Croatia. These fundamental calculations required an enormous time and energy input by the project team.
During the course of the research approximately a hundred and thirty organisations and individual experts both from Croatia and elsewhere were contacted. These provided very useful advice, information, comments and data. Various methodological issues and calculations have been discussed and cross-checked with relevant opinion leaders in Croatia and elsewhere.
Due to time and finance constraints, where necessary the Pareto 20:80% rule was applied. The rule says that instead of investing time, energy and resources on numerous “trivial many”, in purchasing goals, focus should be made on the “vital few” that are essential for reaching 80% of the desired result. The rule is named after Italian economist Vilfredo Pareto (1848-1923) who first described this principle.
Sincere efforts have been made to bridge the gaps and overcome methodological and other problems encountered in this study. The results and calculations presented here are just first approximations and are certainly open for improvements. After all the objective of this study was first of all to provide a sound framework for discussion and first estimates of the consequences of widespread adoption to organic and low-input farming, rather than to provide meticulous calculations. However, the results presented here are essential starting points for further analysis and debate that should help in overhauling agricultural, economic and environmental decision-making.
Data-poor context
Contributions by some 130 organisations and experts
Pareto rule: question of efficiency
Results confidence
23
3. CROATIAN FARMING SECTOR
3.1. Croatia in a nutshell
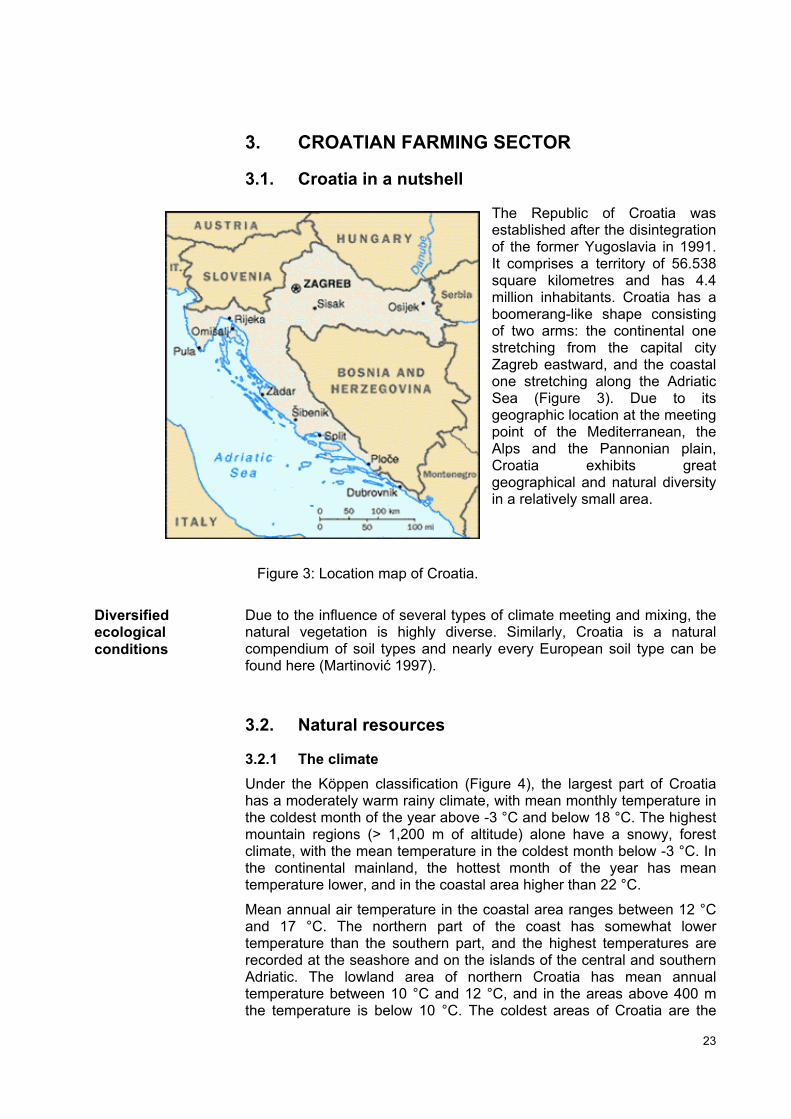
The Republic of Croatia was established after the disintegration of the former Yugoslavia in 1991. It comprises a territory of 56.538 square kilometres and has 4.4 million inhabitants. Croatia has a boomerang-like shape consisting of two arms: the continental one stretching from the capital city Zagreb eastward, and the coastal one stretching along the Adriatic Sea (Figure 3). Due to its geographic location at the meeting point of the Mediterranean, the Alps and the Pannonian plain, Croatia exhibits great geographical and natural diversity in a relatively small area.
Figure 3: Location map of Croatia.
Due to the influence of several types of climate meeting and mixing, the natural vegetation is highly diverse. Similarly, Croatia is a natural compendium of soil types and nearly every European soil type can be found here (Martinović 1997).
3.2. Natural resources
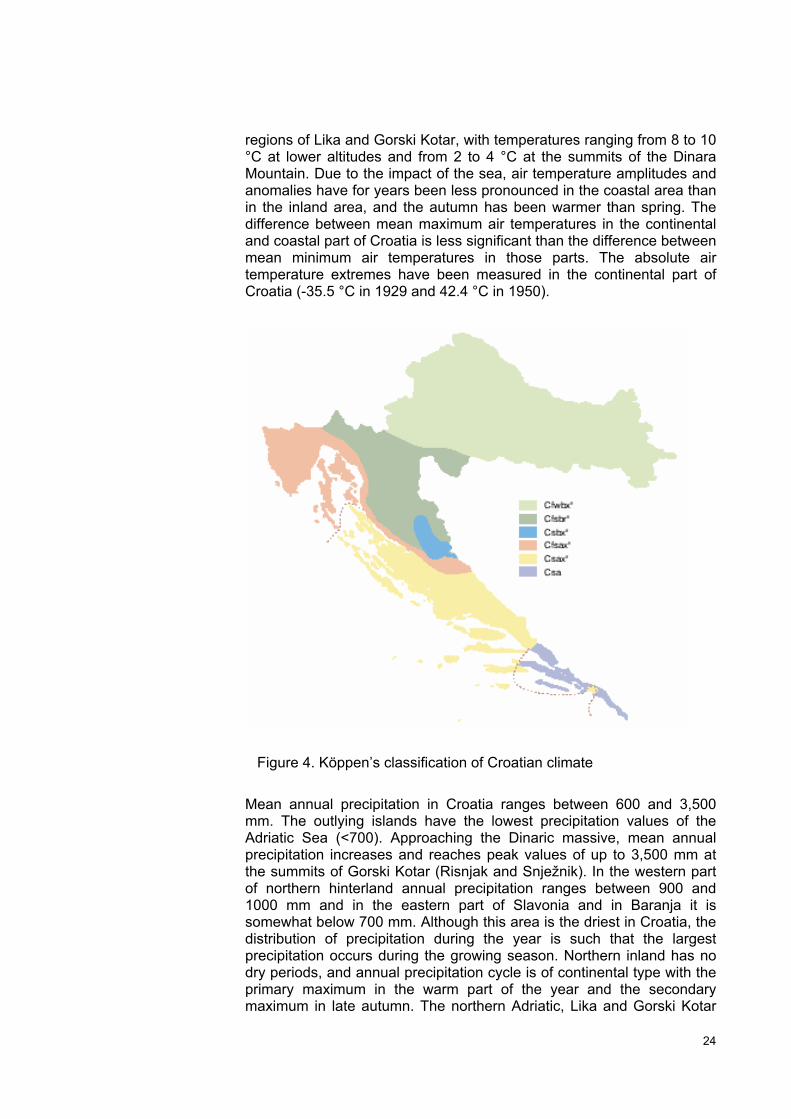
3.2.1 The climate Under the Köppen classification (Figure 4), the largest part of Croatia has a moderately warm rainy climate, with mean monthly temperature in the coldest month of the year above -3 °C and below 18 °C. The highest mountain regions (> 1,200 m of altitude) alone have a snowy, forest climate, with the mean temperature in the coldest month below -3 °C. In the continental mainland, the hottest month of the year has mean temperature lower, and in the coastal area higher than 22 °C.
Mean annual air temperature in the coastal area ranges between 12 °C and 17 °C. The northern part of the coast has somewhat lower temperature than the southern part, and the highest temperatures are recorded at the seashore and on the islands of the central and southern Adriatic. The lowland area of northern Croatia has mean annual temperature between 10 °C and 12 °C, and in the areas above 400 m the temperature is below 10 °C. The coldest areas of Croatia are the
Diversified ecological conditions
24
regions of Lika and Gorski Kotar, with temperatures ranging from 8 to 10 °C at lower altitudes and from 2 to 4 °C at the summits of the Dinara Mountain. Due to the impact of the sea, air temperature amplitudes and anomalies have for years been less pronounced in the coastal area than in the inland area, and the autumn has been warmer than spring. The difference between mean maximum air temperatures in the continental and coastal part of Croatia is less significant than the difference between mean minimum air temperatures in those parts. The absolute air temperature extremes have been measured in the continental part of Croatia (-35.5 °C in 1929 and 42.4 °C in 1950).
Figure 4. Köppen’s classification of Croatian climate
Mean annual precipitation in Croatia ranges between 600 and 3,500 mm. The outlying islands have the lowest precipitation values of the Adriatic Sea (<700). Approaching the Dinaric massive, mean annual precipitation increases and reaches peak values of up to 3,500 mm at the summits of Gorski Kotar (Risnjak and Snježnik). In the western part of northern hinterland annual precipitation ranges between 900 and 1000 mm and in the eastern part of Slavonia and in Baranja it is somewhat below 700 mm. Although this area is the driest in Croatia, the distribution of precipitation during the year is such that the largest precipitation occurs during the growing season. Northern inland has no dry periods, and annual precipitation cycle is of continental type with the primary maximum in the warm part of the year and the secondary maximum in late autumn. The northern Adriatic, Lika and Gorski Kotar
25
do not have dry periods, have two maximums, but the primary precipitation maximum occurs in the cold part of the year and the secondary maximum at the turn of spring into summer. At the central and southern Adriatic, annual precipitation cycle is of maritime type with dry summers and the precipitation maximum occurs in the cold part of the year.
3.2.2 The soil Due to their origin and management, Croatian soils are relatively poor in organic matter (Martinović 1997; Moller 2003), which has been subject to a constant decline since the mid sixties (Martinović 1997; Vidaček, Racz et al. 2003). The main bottleneck for achieving high and stable crop yields is the unfavourable water ratio between the soils’ water and air holding capacity, leading to a constant or temporary water surplus or shortage . Consequently, nearly 1.8 million hectares (57% of total agricultural land) of mostly arable land suffers from seasonal waterlogging. This situation enhances soil acidity, which is considered to be the major factor hindering the fertility of Croatian soils and the effective utilisation of applied nutrients (particularly phosphorus). It is estimated that 1,15 million hectares (35% of total agricultural land) have a pH value less than 5.5 (Moller 2003). In year 2000, less than 0.1% of all agricultural land (0.2% of arable land) received irrigation (FAO 2003)
3.2.3 Biodiversity 3.2.1.3 Diversity of Croatian nature Croatia is famous for its nature and is among most the biologically rich countries in Europe. At the European level, it ranks second for the number of fish species, third for the estimated number of invertebrates, fifth for number of reptiles and seventh for the number of vascular plants and mammals (DUZPO 1999). When the number of species is expressed in relation to land area, Croatia ranks third for the number of plant species per area and fourth for the number of vertebrates per area. Croatia has an unusually high concentration of endemic species, particularly in the Karst (calcium carbonate limestone) region. Approximately six percent of the taxa of flower plants and algae (of a total of four hundred and thirty nine) are endemic to Croatia. Out of 4,924 known plant species in Croatia, five hundred and fourteen (10.4%) are endangered. But in spite of this, there are only 44 protected plant species, while an additional 92 deserve strict protection because they are seriously threatened (DUZPO 1999). It is estimated that Croatia harbours some 56,121 animal species (eight hundred and eight are endemic), of which only 39% have been identified (MZOPU 2002).
The high biodiversity in Croatia is enhanced by its location in quite different climatic, (geo)morphological and hydrological zones: the Danube floodplain, the Karst limestone zone, the Dinaric Alps and the Mediterranean Coast with its unique islands. A substantial part of Croatian biodiversity and many protected natural areas were devastated during the recent war and are still suffering from this destruction (Welp, Hamidović et al. 2002).
Poor soils
Diversity of Croatian nature
26
3.2.2.3 Biodiversity on agricultural habitats Although many valuable species are in decline, some of these can still be found in agricultural habitats. According to the Biodiversity Strategy (DUZPO 1999) agricultural habitats harbour many rare and threatened species. The wild plants include the Corn Cockle (Agrostemma githago) that has disappeared from the areas of intensive agriculture (Slavonia and Baranja) and the Tulip (Tulipa praecox ), which is locally limited to vineyards of the island of Korčula. Oriental Knight’s Spur (Conosolida orientalis) and the White Poppy (Papaver dubium ssp. lecoquii var. albifolium) can be found only in the eastern part of Croatia. Croatian arable land and grassland still host some birds of important European conservation status such as Corncrake (Crex crex), Partridges (Perdix perdix) and Quails (Coturnix coturnix), Stone-Curlews (Burhinus oedicnemus) (Krk and Pag islands), Shrike (Lanius minor) and Calandra Lark (Melanocorypha calangra) (Mediterranean areas). Furthermore, some of the rarest Croatian breeding birds, such as the Imperial Eagle (Aqueila heliaca), Lesser Kestrel (Falco naumanni), Redfooted Falcon (Falco vespertinus) and Saker Falcon (Falco cherrug), as well as the Common Redshank (Tringa totanus) which nests only in two places in Croatia) also live in agricultural habitats.
Croatian grasslands are habitats for numerous endangered plants, among which the most important are the whole family of orchids (Orchidaceae) and exemplars of diverse other families or genera such as Anemone, Arnica, Daphne, Dianthus, Edraianthus, Eryngium, Gentiana, Iris, Lilium, Ligularia, Linum, Narcissus, Primula, Scilla, Veratrum, etc. The most important rare mammals living on Croatian grasslands are hamsters (Cricateus cricateus) and mound-building mice (Mus spicilegus) and among endangered species, the European ground squirrel (Citellus citellus) and lesser mole rat (Nannospalax leucodon). Grassland habitats in Croatia have a rich fauna of grasshoppers and butterflies. The majority of its 187 species of daily butterflies can be found in meadow habitats. Two genera are particularly important: the endemic subspecies and species of the arguses (genus Erebia) and the myrmecophyllous genus of large blue Maculinea. These are either endemic taxa or species endangered at the European level.
During the last 50 years, a major part of Croatia's lowland grassland has been converted into arable land. Extensive land reclamation and regulation of watercourses has left hardly any marshy and wet grassland. They are now very extensively and only temporarily used for grazing and mowing. If this trend continues, lowland grassland in Croatia will entirely disappear. Formerly diverse swampy and wet grassland (communities Caricetum, Deschampsietum, Molinietum) are turning into less wet areas, predominantly communities of tall oatgrass (Arrhenatheretum). This results in a significant decline in biodiversity.
Croatian karst ecosystems are widely acknowledged not only because of their plant and animal biodiversity, but also because their fragile hydrological and geological features (caves, lakes, waterfalls, “underground rivers”, limestone phenomena, etc.). These subterranean and terrestrial karst ecosystems are interconnected and dependent upon
Species in agricultural habitats
Lowland grassland
Karst grassland
27
the maintenance of a delicate balance between relief, hydrology, climate and vegetation. Karst regions account for more than half of Croatia's territory.
The major cause of Karst grassland degradation is depopulation and changes in traditional agricultural practices in mountainous regions of Croatia (Gorski kotar, Lika, Velebit, etc.) where cattle breeding used to be much more developed. Without grazing and regular mowing large areas are increasingly overgrown by woodland. Similar processes are ongoing in Mediterranean karst areas on littoral dry grassland and rocky pastures. Although due to the dry and hot climate the natural succession here is rather slow, the long-term result is the same: shrubby vegetation is suppressing valuable grassland species adapted to survive on sparse soil or in holes between rocks with a shortage of water.
Protected natural areas in Croatia cover approximately 10% of the country (excluding territorial seas) and are made-up of 450 protected sites. The best known among these are the eight national parks (IUCN category II): Plitvice Lakes, Paklenica, Risnjak, Mljet, Kornati, Brijuni, North Velebit and Krka and 2 strict nature reserves (IUCN category I): Hajducki i Rosanski Kukovi and Bijele i Samarske stijene. Several of these have been listed as internationally valuable natural areas. The Plitvice Lakes are included in the UNESCO World Natural Heritage List and the Velebit Mountain is in the UNESCO MaB (Man and Biosphere) scientific programme. Four areas are included in the Ramsar Convention List (Kopački rit, Lonjsko polje, the lower Neretva and Crna Mlaka).
Appropriate agricultural management is essential for the biodiversity and wildlife of many Croatian protected natural areas. However, most of these areas either are without significant agricultural production or depopulated (or sometimes both). Therefore, agriculture-dependent biodiversity is in decline. A particular threat is the absence of moving and grazing operations in protected natural areas. Shrubs and other pioneering vegetation take over vast areas and thus diminish the biodiversity of the rich meadows and pastures. Neglected or abandoned land or land that has become afforested or overgrown by scrub decreases the biodiversity value of grassland. Besides, such land is at risk of fire that can arise if excess biomass is not subject to grazing pressure. Therefore, the forest area in Croatia has been gradually and continuously increasing at the expense of species-rich grassland. This trend is worrying and has to be stopped. The encouraging news is that the remaining (agricultural) population in protected areas is becoming increasingly aware of the problem. The same goes for the management teams in protected areas of nature. These have started to work on management plans and prescriptions for specific agricultural measures.
Although the existing Croatian regulations limit the application of agricultural inputs, notably pesticides and fertilisers, as well as some other agricultural practices in nature-protected areas, they are not precise enough. Thus, their interpretation is quite liberal and monitoring and control over farming protected areas is moderate.
Agriculture in protected areas
28
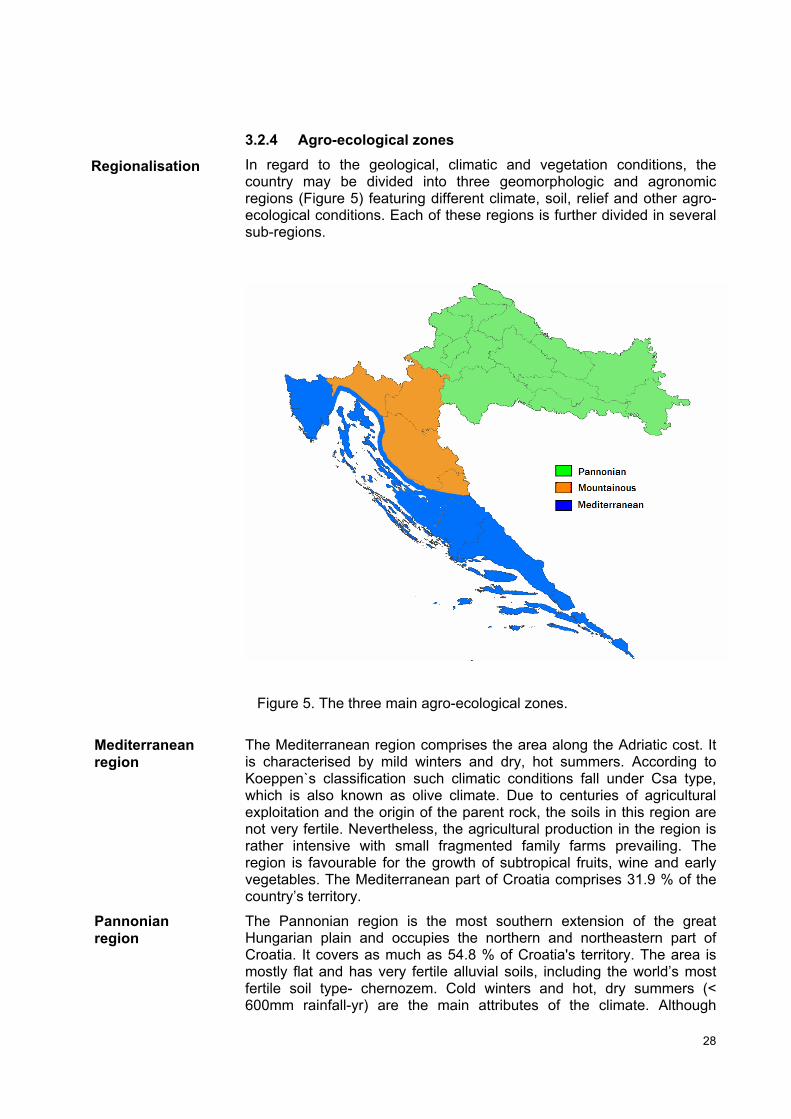
3.2.4 Agro-ecological zones In regard to the geological, climatic and vegetation conditions, the country may be divided into three geomorphologic and agronomic regions (Figure 5) featuring different climate, soil, relief and other agro-ecological conditions. Each of these regions is further divided in several sub-regions.
Figure 5. The three main agro-ecological zones.
The Mediterranean region comprises the area along the Adriatic cost. It is characterised by mild winters and dry, hot summers. According to Koeppen`s classification such climatic conditions fall under Csa type, which is also known as olive climate. Due to centuries of agricultural exploitation and the origin of the parent rock, the soils in this region are not very fertile. Nevertheless, the agricultural production in the region is rather intensive with small fragmented family farms prevailing. The region is favourable for the growth of subtropical fruits, wine and early vegetables. The Mediterranean part of Croatia comprises 31.9 % of the country’s territory.
The Pannonian region is the most southern extension of the great Hungarian plain and occupies the northern and northeastern part of Croatia. It covers as much as 54.8 % of Croatia's territory. The area is mostly flat and has very fertile alluvial soils, including the world’s most fertile soil type- chernozem. Cold winters and hot, dry summers (< 600mm rainfall-yr) are the main attributes of the climate. Although
Regionalisation
Mediterranean region
Pannonian region
29
private farms prevail, all the major former co-operatives are located here. This is Croatia’s prime agricultural area (also called the Croatian breadbasket) where the majority of the country’s cereals and industrial crops are produced.
The hilly and mountainous region is located between the two above-mentioned areas. The agriculture here is based on small-scale private farms, with animal husbandry prevailing. The entire region is in a karst area with hilly and mountainous relief. Due to very cold winters and a long snow-melting period, the vegetation season is rather short. The soils are poor and shallow (Martinović 1997). The area is mostly under grassland and has some orchards, too. In the scarce (karst) valleys, there is some crop production, too (mostly potatoes and cereals). This area accounts for 13.3% of the Croatian territory.
3.3. Legacies of the past
Although it did not formally belong to the former Soviet Union block, being part of the former Yugoslavia, Croatia also experienced a communist regime and its agricultural management and policy.
The Communist style of agriculture, operating in a centrally planned economy, was characterised by excessively high levels of inputs of energy and agri-chemicals, as well as the use of heavy mechanisation to operate in endless fields. Wide crop rotation was hardly practised, resulting in a monoculture, mainly of cereals and industrial crops. The energy to power the whole system was “cheap” and environmental protection was not an issue. Agriculture’s main role was to produce immense quantities of cheap food for the population and raw materials for industry. The Communists believed that technology, fertilisers and pesticides could produce an infinite increase in crop yields and that agriculture could consume soil resources infinitely (Fesbach and Friendly 1992). Consequently, some Communist countries, such as Ukraine, lost up to 25% of their organic soil matter in the last three decades (Morgan 1996). Similarly, Croatian soils have also lost some 30% of the stable and some 50% of the “active” organic matter (Martinović 1997; Vidaček, Racz et al. 2003). In 1989, out of 750 million hectares of cultivated land in the Soviet Union, nearly half was seriously imperilled (Fesbach and Friendly 1992).
However, it is not only the environment that suffered under this system. The planned economy, a distorted market system and de-motivated workers produced also questionable economic returns. In spite of the high-input levels of agri-chemicals and energy, Communist-style agriculture proved to be highly inefficient and yielded low outputs. This can be best illustrated by a striking figure from the former Soviet Union. Although private plots made up only 1-2% of the total land of the former Soviet Union, these plots produced about 75% of the potatoes and eggs, and about 40 % of meat, milk and vegetables consumed in the 1960s (Fesbach and Friendly 1992). Two hundred million hectares were saline, 150 million hectares have been eroded, and 30 million were waterlogged or swampy, while an additional 13 % was marginal (rocky, hilly, or overgrown).
Hilly and mountainous region
The communist regime
Communist agriculture
Social setting and productivity
30
Having being a part of the Socialist Federal Republic of Yugoslavia, Croatia adopted and practiced a socialist system with self-management and social ownership. But unlike other Communist countries, Croatia retained private land ownership in agriculture even during Communist rule and some 60 % of the total Croatian agricultural land remained in the hands of private farmers. These were allowed to have their own land up to a maximum of 10 hectares of arable land and 30 hectares of grassland. However, private farmers were often considered as “ideologically low-conscious outcasts of the bourgeois class” (ref) and were not favoured by the regime. The communists favoured large, state-owned agricultural co-operatives. These co-operatives were usually part of even greater agribusiness units, so called agri-industrial complexes, better known as “agrokombinates” or “PiK”s.. These tried to unite primary agricultural production; processing and retail activities within a single company and often employed several tens of thousands of people.
Today’s Croatian agricultural sector is to a large extent reflection of this historical development. Even nowadays, the Croatian agricultural sector has two parallel production systems: private family farms and big agricultural companies that have mainly evolved from the ex-state owned agricultural co-operatives.
3.3.1 The fall of state-planned agricultural economy The economic transition in Croatia over the last fifteen years resulted in rather drastic changes in the agricultural sector, particularly the agricultural inputs. Since the costs of (expensive) inputs do not pay back through the (cheap) agricultural commodities the Croatian farmers substantially reduced the use of agri-chemicals or refrained from using them altogether (ref). This resulted in a drop of fertilisers and pesticides consumption by over XY% in comparison with levels applied in 1985-1990 (to be checked). However, like in other CEE countries the shift from high-input to low-external-input farming in the Croatia was not the result of a designed agri-environmental policy, but rather the consequence of an evolution from state economy to market economy (Kieft 1999).
3.4. Agricultural statistics
At present, in Croatia there are two official sources of agricultural statistics: the recent Agricultural Census 2003 (DZS 2003) and the Statistical Yearbook of the Republic of Croatia for 2003 (DZS 2003). Unfortunately, these sources significantly differ in some very basic figures, such as land use and the number and type of livestock and inputs (some figures differ by as much as 1,800%).
At present, in Croatia there are two official sources of agricultural statistics: the recent Agricultural Census 2003 and the Statistical Yearbook of the Republic of Croatia for 2003. Both are published by the Central Bureau of Statistics. Unfortunately, these sources significantly differ in some very basic figures, such as land use and the number and type of livestock and inputs (some figures differ by as much as 1,800%).
Croatia retained private agriculture
Dual agriculture even today
31
It is debateable which of the two methodologies provides more reliable data and which ones are closer to reality. The census data seem to have some advantage, as these are very recent and involved nearly all agricultural households and agricultural companies.
The agricultural census took place in June 2003 and was the first census made since Croatia gained independence. It involved nearly all Croatian agricultural households and all registered agricultural companies except a minor number consisting of: • Stockless households with less than 0.1 ha land • “Agricultural” households having only forest land • “Unavailable” households which for various reasons were unable to
take part in the census
The census consisted of 29 questions for agricultural households and 31 questions (each question having several sub questions) for agricultural companies. It engaged 15,000 people in making the interviews. They were paid per interviewed household and were motivated to cover as many households as possible. Non-response to the census and the provision of flawed information were subject to penalties of up to 1,330 EUR. The census cost approximately 17 million EUR. The data were published at the end of December 2003, very shortly before the completion of this project.
While the agricultural census was based on statements collected by interviewing private farmers and figures provided by the agricultural companies, the Statistical Yearbook for 2003 used a different methodology. Most of its agricultural data are compilations of data provided in statistical annual reports by agricultural companies and expert estimates for the private sector. While the first should be quite accurate, the later can be problematic, as is explained in the chapters on land use and inputs.
It is debateable which of the two methodologies provides more reliable data and which ones are closer to reality. The census data seem to have some advantage, as these are very recent and involved nearly all agricultural households and agricultural companies.
Agricultural census 2003
Statistical Yearbook
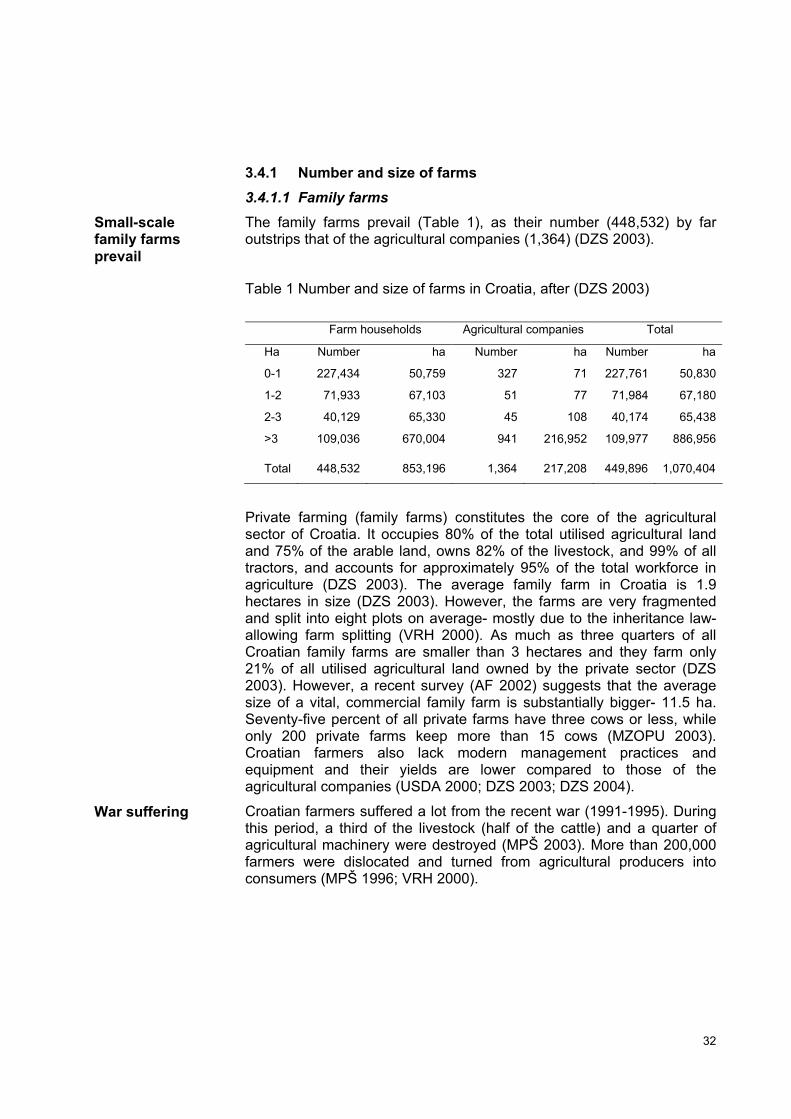
32
3.4.1 Number and size of farms 3.4.1.1 Family farms The family farms prevail (Table 1), as their number (448,532) by far outstrips that of the agricultural companies (1,364) (DZS 2003).
Table 1 Number and size of farms in Croatia, after (DZS 2003)
Farm households Agricultural companies Total
Ha Number ha Number ha Number ha
0-1 227,434 50,759 327 71 227,761 50,830
1-2 71,933 67,103 51 77 71,984 67,180
2-3 40,129 65,330 45 108 40,174 65,438
>3 109,036 670,004 941 216,952 109,977 886,956
Total 448,532 853,196 1,364 217,208 449,896 1,070,404
Private farming (family farms) constitutes the core of the agricultural sector of Croatia. It occupies 80% of the total utilised agricultural land and 75% of the arable land, owns 82% of the livestock, and 99% of all tractors, and accounts for approximately 95% of the total workforce in agriculture (DZS 2003). The average family farm in Croatia is 1.9 hectares in size (DZS 2003). However, the farms are very fragmented and split into eight plots on average- mostly due to the inheritance law-allowing farm splitting (VRH 2000). As much as three quarters of all Croatian family farms are smaller than 3 hectares and they farm only 21% of all utilised agricultural land owned by the private sector (DZS 2003). However, a recent survey (AF 2002) suggests that the average size of a vital, commercial family farm is substantially bigger- 11.5 ha. Seventy-five percent of all private farms have three cows or less, while only 200 private farms keep more than 15 cows (MZOPU 2003). Croatian farmers also lack modern management practices and equipment and their yields are lower compared to those of the agricultural companies (USDA 2000; DZS 2003; DZS 2004).
Croatian farmers suffered a lot from the recent war (1991-1995). During this period, a third of the livestock (half of the cattle) and a quarter of agricultural machinery were destroyed (MPŠ 2003). More than 200,000 farmers were dislocated and turned from agricultural producers into consumers (MPŠ 1996; VRH 2000).
Small-scale family farms prevail
War suffering
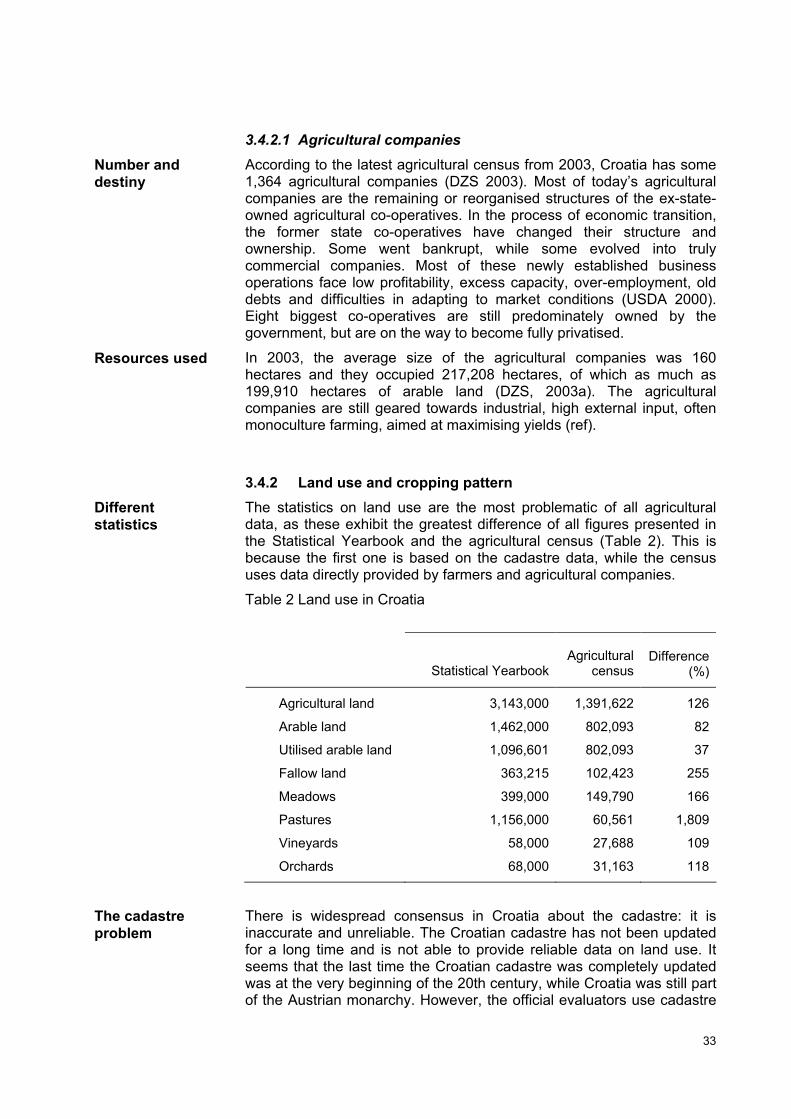
33
3.4.2.1 Agricultural companies According to the latest agricultural census from 2003, Croatia has some 1,364 agricultural companies (DZS 2003). Most of today’s agricultural companies are the remaining or reorganised structures of the ex-state-owned agricultural co-operatives. In the process of economic transition, the former state co-operatives have changed their structure and ownership. Some went bankrupt, while some evolved into truly commercial companies. Most of these newly established business operations face low profitability, excess capacity, over-employment, old debts and difficulties in adapting to market conditions (USDA 2000). Eight biggest co-operatives are still predominately owned by the government, but are on the way to become fully privatised.
In 2003, the average size of the agricultural companies was 160 hectares and they occupied 217,208 hectares, of which as much as 199,910 hectares of arable land (DZS, 2003a). The agricultural companies are still geared towards industrial, high external input, often monoculture farming, aimed at maximising yields (ref).
3.4.2 Land use and cropping pattern The statistics on land use are the most problematic of all agricultural data, as these exhibit the greatest difference of all figures presented in the Statistical Yearbook and the agricultural census (Table 2). This is because the first one is based on the cadastre data, while the census uses data directly provided by farmers and agricultural companies.
Table 2 Land use in Croatia
Statistical Yearbook Agricultural
census
Difference
(%)
Agricultural land 3,143,000 1,391,622 126
Arable land 1,462,000 802,093 82
Utilised arable land 1,096,601 802,093 37
Fallow land 363,215 102,423 255
Meadows 399,000 149,790 166
Pastures 1,156,000 60,561 1,809
Vineyards 58,000 27,688 109
Orchards 68,000 31,163 118
There is widespread consensus in Croatia about the cadastre: it is inaccurate and unreliable. The Croatian cadastre has not been updated for a long time and is not able to provide reliable data on land use. It seems that the last time the Croatian cadastre was completely updated was at the very beginning of the 20th century, while Croatia was still part of the Austrian monarchy. However, the official evaluators use cadastre
Number and destiny
Resources used
Different statistics
The cadastre problem
34
maps to determine the structure of land use and the area sown with different crops. As this job has been done for years by the same people, their annual estimates might be influenced by the data they provided in previous years. This problem has been recognised and documented for along time. Reports from the mid sixties as well as from the early nineties (RZS 1964; Stipetić 1991) emphasise cadastral inaccuracy in terms of land use. Stipetić (Stipetić 1991) stresses that Croatia “has less arable land than shown in the cadastre and statistics on crop production”. According to the same sources, it was quite common for evaluators to report the surface under wheat and maize as being 20% greater than actually sown. The same goes for grassland development into shrubs and later forest. This was not recorded either, partly because the owners did not report on it. An additional problem was also cadastre regulations, which “did not accept conversion of arable land into grassland” (RZS 1964). This is because the municipal land tax was paid according to the land use categories from the cadastre, with arable land, vineyards and orchards being taxed much higher than grassland. Therefore, each municipality claimed to have lot of agricultural land, particularly under arable and permanent crops (Stipetić 1991). On the other hand, for the same reason, most farmers did not declare grassland conversion into arable land or permanent crops. This system of land taxing was abolished in 2000. Because of this, as well as because of the new subsidy scheme, farmers and agricultural companies have no interest in declaring a smaller area under arable crops, vine, fruits and vegetables, as these are entitled to high subsidies. Therefore, it is quite unlikely that the agricultural census data is “missing” a lot of agricultural land, particularly arable and land under permanent crops.
Croatia covers 56,538 square kilometres. According to the cadastre-map-based estimates, agricultural land comprises 55.8% of the territory (DZS 2003). However, the census data give quite a shocking figure, suggesting that Croatia's agricultural land area is only 23.3% of the total land area. This suggests that 1.75 million ha of agricultural land (56% of the total) has been lost! The difference is most likely due to the evolution of neglected grassland into forest and infrastructure and settlements spreading. In addition, some common or state-owned land that is used for grazing might have not been reported by farmers in the census, as this land is not their property and most likely not leased either.
The Statistical Yearbook (DZS 2003) indicates a rather bipolar land use pattern in Croatia: arable land occupies nearly half (46.2%) of the total agricultural land while the other half is grassland: meadows and pastures. However, the census data give quite a different picture, with grassland occupying just 15% of the total agricultural land. Arable land and meadows unused for longer than 5 years did not qualify in the census under these categories, and nor did pastures unused for longer than 10 years (DZS 2003).
Two other sources suggest that agricultural census figures on land use reflect the actual situation. Preliminary figures from a satellite image of Croatia (DZZP 2004) prepared for a project on habitat mapping indicates that Croatia has far less agricultural land than has been presented in DZS Statistical Yearbooks. Although this satellite image was made in 2000, its figures correspond quite well with those from the census.
Lost agricultural land
Satellite image and Farm Register
35
Similarly, to the census, it shows 1.37 million hectares of “pure” agricultural land and an additional surface of 0.4 million hectares of neglected (mostly karstic) grasslands mixed with shrubs and forest-like vegetation. This area seems to be out of agricultural production and by 2003 (census year) is most likely to have turned even more into scrubland. MPŠVG’s Farm Register for 2003 also shows that the area of Croatia's agricultural land is much smaller than suggested by the Statistical Yearbook. Farmers and farm companies only registered 870,334 hectares (of which 728,447 hectares of arable land)- an area that is some 3.5 times smaller than the agricultural land area in the Statistical Yearbook! Similar share of meadows and grassland can be found in both Farm Register and agricultural census. The Farm Register covers nearly all farmland in Croatia. It includes all farms receiving any kind of financial support from the MPŠVG, as well as all smallholdings selling their produce at local markets and all farms that have ever been inscribed into any kind of register by MPŠVG.
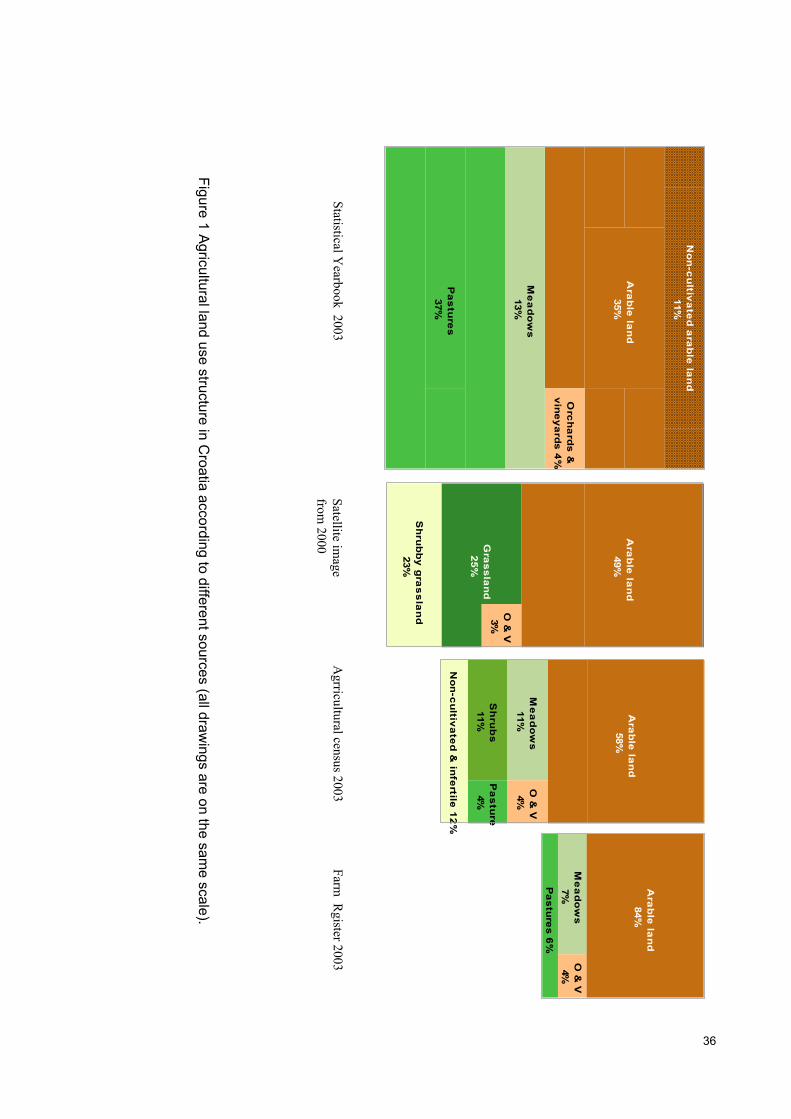
36
Figure 1 Agricultural land use structure in Croatia according to different sources (all draw
ings are on the same scale).
Satellite image
from 2000
Agrricultural census 2003
Farm R
gister 2003 Statistical Y
earbook 2003
No
n-c
ultiv
ate
d a
rab
le la
nd
11%
Ara
ble
lan
d35%
Orc
ha
rds
&vineyards 4
%
Me
ad
ow
s13%
Pa
stu
res
37%
Ara
ble
lan
d58%
Me
ad
ow
s11%
O &
V4%
Sh
rub
s11%
Pa
stu
re4%
Non
-cultiva
ted &
infertile
12%
Ara
ble
lan
d49%
Gra
ssland 25%
O &
V3%
Sh
rub
by
gra
ss
lan
d23%
Ara
ble
lan
d84%
Me
ad
ow
s 7%
O &
V4%
Pastures 6%
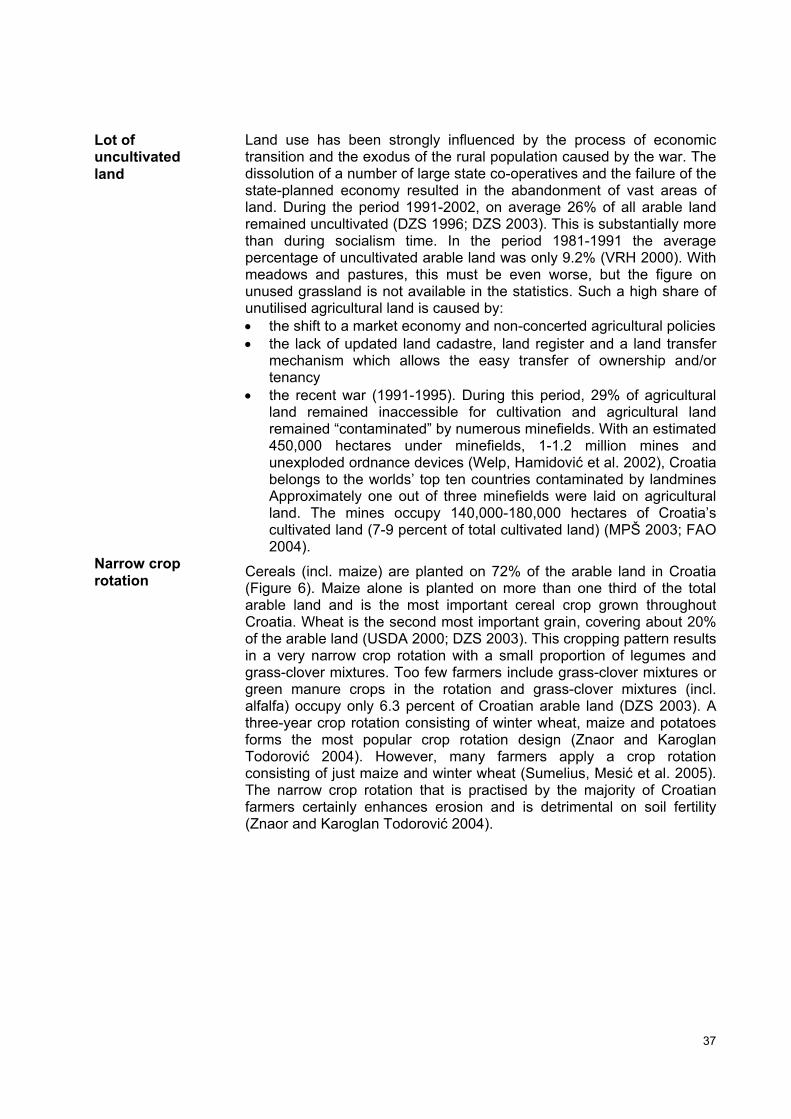
37
Land use has been strongly influenced by the process of economic transition and the exodus of the rural population caused by the war. The dissolution of a number of large state co-operatives and the failure of the state-planned economy resulted in the abandonment of vast areas of land. During the period 1991-2002, on average 26% of all arable land remained uncultivated (DZS 1996; DZS 2003). This is substantially more than during socialism time. In the period 1981-1991 the average percentage of uncultivated arable land was only 9.2% (VRH 2000). With meadows and pastures, this must be even worse, but the figure on unused grassland is not available in the statistics. Such a high share of unutilised agricultural land is caused by: • the shift to a market economy and non-concerted agricultural policies • the lack of updated land cadastre, land register and a land transfer
mechanism which allows the easy transfer of ownership and/or tenancy
• the recent war (1991-1995). During this period, 29% of agricultural land remained inaccessible for cultivation and agricultural land remained “contaminated” by numerous minefields. With an estimated 450,000 hectares under minefields, 1-1.2 million mines and unexploded ordnance devices (Welp, Hamidović et al. 2002), Croatia belongs to the worlds’ top ten countries contaminated by landmines Approximately one out of three minefields were laid on agricultural land. The mines occupy 140,000-180,000 hectares of Croatia’s cultivated land (7-9 percent of total cultivated land) (MPŠ 2003; FAO 2004).
Cereals (incl. maize) are planted on 72% of the arable land in Croatia (Figure 6). Maize alone is planted on more than one third of the total arable land and is the most important cereal crop grown throughout Croatia. Wheat is the second most important grain, covering about 20% of the arable land (USDA 2000; DZS 2003). This cropping pattern results in a very narrow crop rotation with a small proportion of legumes and grass-clover mixtures. Too few farmers include grass-clover mixtures or green manure crops in the rotation and grass-clover mixtures (incl. alfalfa) occupy only 6.3 percent of Croatian arable land (DZS 2003). A three-year crop rotation consisting of winter wheat, maize and potatoes forms the most popular crop rotation design (Znaor and Karoglan Todorović 2004). However, many farmers apply a crop rotation consisting of just maize and winter wheat (Sumelius, Mesić et al. 2005). The narrow crop rotation that is practised by the majority of Croatian farmers certainly enhances erosion and is detrimental on soil fertility (Znaor and Karoglan Todorović 2004).
Lot of uncultivated land
Narrow crop rotation
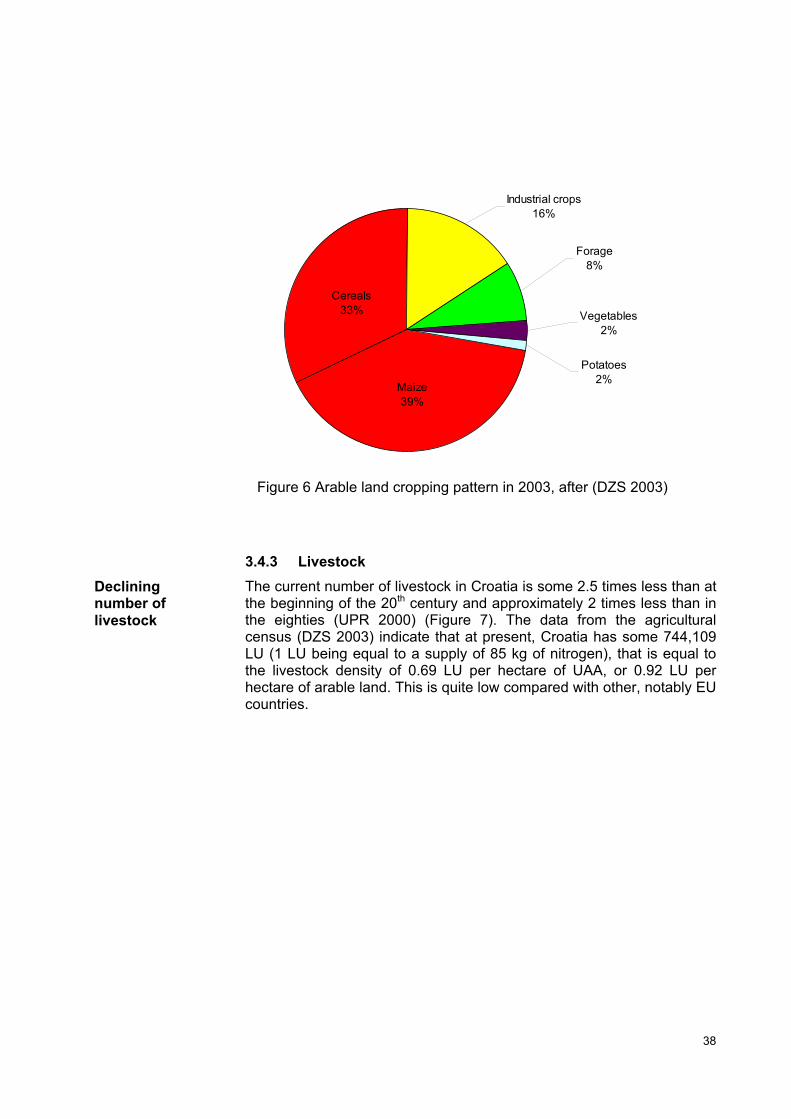
38
Potatoes2%
Vegetables2%
Forage8%
Industrial crops16%
Cereals33%
Maize39%
Figure 6 Arable land cropping pattern in 2003, after (DZS 2003)
3.4.3 Livestock The current number of livestock in Croatia is some 2.5 times less than at the beginning of the 20th century and approximately 2 times less than in the eighties (UPR 2000) (Figure 7). The data from the agricultural census (DZS 2003) indicate that at present, Croatia has some 744,109 LU (1 LU being equal to a supply of 85 kg of nitrogen), that is equal to the livestock density of 0.69 LU per hectare of UAA, or 0.92 LU per hectare of arable land. This is quite low compared with other, notably EU countries.
Declining number of livestock
39
Figure 7 Livestock number in Croatia (Znaor and Karoglan Todorović 2004).
It is estimated that Croatian livestock produce some 65,000 tonnes of nitrogen and 33,000 tonnes of P2O5 annually (UN-ECE 1999) (MZOPU 2002). While in 1991 the Croatian farming sector consumed 16 million tonnes of manure, due to a decreased number of animals, this figure has been reduced to 10 million tonnes in 2001 (Institute for Special Animal Husbandry, 2002). In 2000, only 35 % of the total nitrogen applied originated from livestock manure (Mesić 2002).
3.5. Agricultural inputs
Croatia has no comprehensive statistical method of data collection with regard to the use of agricultural inputs. In other words, all sources used provide only partial data with limited reliability. Thus, the official figures can vary a lot, depending on the source of primary data used and the purpose for which it is gathered. However, the most common problem and mistake in these calculations is the surface of agricultural land. As demonstrated in chapter on the land use, Croatia has today some 50% less agricultural land than shown by the Statistical Yearbook. Therefore, calculations on per hectare consumption of agri-chemicals based on this large agricultural land surface do not seem to be feasible and accurate. However, this approach is used with no exception! Thus, no wonder that Croatian authorities and scientists report on relatively low per hectare fertiliser and pesticide consumption (Grgić, Franić et al. 1999; ICID 2001; Igrc-Barčić 2002; MZOPU 2002; MPŠ 2003; VRH 2003). However, the environmental pressure caused by fertiliser and pesticides
Manure
Inputs and agricultural area
0
0,5
1
1,5
2
1910 1988 2001 2003
LU i
n m
illio
n
40
in Croatia is much greater, since these substances are spread over a relatively small surface.
Another problem related to the assessment of consumption of agri-chemicals is whether to use total agricultural land, utilised agricultural land or arable land. Croatia practices bipolar agriculture. On one hand, there are areas of abandoned or extensively managed land, mostly grassland. On the other hand, arable and permanent crops are managed quite intensively. In practice, grassland in Croatia is hardly ever treated with fertilisers or pesticides. The only areas receiving application of agri-chemicals are arable and permanent crops. Therefore, it is more appropriate to assess environmental pressure of agri-chemicals in Croatia by expressing their consumption per hectare of actually treated arable land and permanent crops or per hectare of arable land.
Because of the varying intensity of agricultural production in different regions, agrichemicals are unevenly spread in Croatia. Regions with plenty of arable land and intensive agriculture (Slavonia, Međimurje, Podravina, etc.) record quite high applications of pesticides and fertilisers, while karstic Croatia with vast areas under (neglected) grassland uses far less of these (Mesić 2002; DZS 2003; Moller 2003).
3.5.1 Fertiliser consumption There is a widespread consensus that the consumption of fertilisers in Croatia is “relatively low” (MPŠ 2003) and “certainly some 30 % lower than before 1990” (MPŠ 2003). In other words, the consumption level of pre-1990 is inter alia set as a reference and desired target that is to be reached again. However, although some studies predicted a sharp recovery of the consumption in mineral fertilisers and a return to pre-1990 levels by 2000 (MPŠ 1996; Grgić, Franić et al. 1999).
Croatia has too few figures on agricultural inputs at the farm level and the official statistics consist only of aggregated national figures. The DZS data on fertiliser consumption presented in the Statistical Yearbook are derived from two sources: annual statistical reports from agricultural companies and estimates based on questionnaires carried out among some 9,000 family farms. While the figures for the usage of fertilisers by companies should be quite accurate, estimates based on interviewing representatives of small number of farms are certainly less accurate. The fertiliser data presented in the Statistical Yearbook are incomplete and have been subject to criticism (Mesić 2002). The agricultural census (DZS 2003) does not give information about the quantity of fertilisers consumed, but it does give figures on the land area treated. According to these, fertilisers are spread on as much as 755,517 hectares- a surface that is equal to 70% of the total UAA or 93% of arable land.
The fertiliser data in the Statistical Yearbooks (DZS 2003; DZS 2004) are expressed as the total quantity of fertilisers used, by both family farms and companies. Unfortunately, this figure does not tell us much about the environmental load of fertilisers, as it is not expressed in terms of active ingredients. Different types of fertilisers contain different quantities of nutrients (N, P2O5 and K2O). Thus a figure indicating consumption of 100 kg fertiliser gives no idea about how many nutrients
Believed to be low and predicted to rise
DZS data
41
were loaded into the environment. For instance 100 kg of urea fertilisers contains 46 kg N, while the same amount of calcium ammonium nitrate (CAN) contains only 25-28 kg N -just over half as much. In both cases, consumed is 100 kg fertiliser, but the consumption of nutrients is quite different The quantity of fertilisers consumed, expressed in terms of active ingredients is given only for companies and a similar figure for the private sector cannot be obtained by the DZS.
Nevertheless, the DZS data indicate that the consumption of fertilisers in Croatia in the period 2000-2002 was stable (in average 416,000 t), with the difference between the year with the lowest and highest consumption being only 8%.
FAO statistics give also data on fertiliser consumption in Croatia (FAO 2005). However, FAO figures are expressed as nutrients and are approximately four times higher than figures on nutrients reported by the DZS in the Statistical Yearbook. This is because DZS gives data only on nutrients used by the agricultural companies. FAO statistics are based on the figures provided by Petrokemija (Deur 2004; Piršić 2004) - the sole Croatian fertiliser producer and biggest fertiliser trader. Therefore, FAO statistics do not include fertiliser quantities imported and distributed by other companies. As the FAO calculates fertiliser consumption per agricultural year (July 1- June 30) this also causes some difficulties in comparing its figures with those from the Croatian statistics, which are always recorded per calendar year. FAO figures also indicate quite a stable use of mineral fertilisers over the last couple of years.
According to a recent study assessing agricultural impact on water in Croatia, conducted by experts from the Faculty of Agronomy at the University of Zagreb (Mesić 2002), in 2000 Croatia consumed 505,000 tonnes of fertilisers (or 215,000 of nutrients). This figure is much higher than the figure shown in the Statistical Yearbook (403,316 t total fertiliser)! Data for this study were also largely provided by Petrokemija and its results have been already been quoted in some policy documents (Moller 2003; MPŠ 2003; FAO 2004).
3.5.2 Pesticide consumption It is very difficult to obtain reliable statistics on pesticide consumption in Croatia, as there is no organisation responsible for keeping track of this. Pesticide consumption is also not reported in the Statistical Yearbook and DZS has no data related to pesticides. Some policy documents suggest that the consumption of synthetic plant protection agents in Croatia has been quite stable over the last couple of years, amounting to approximately 3,300 tonnes of active ingredients per year (MZOPU 2002; MPŠ 2003). The MPŠVG’s Department for Plant Protection estimates that the use of pesticides in Croatia is between 7,200-9,000 tonnes (Moller 2003). According to census data, pesticides are spread at least once a year on as much as 656,426 hectares - a surface that is equal to 61% of the total UAA or 82% of arable land (DZS 2003). Herbicides seem to account for 50-60% of all agents used, while fungicides make up 35-45% and insecticides only 5-6% (MZOPU 2002). Currently there are some 700 approved pesticides (based on some 280 active ingredients) on the Croatian market. Illegal pesticide trading/smuggling from neighbouring countries is a problem that occurs
FAO data
Data from recent studies
No reliable statistics
42
due to cheaper prices abroad. This practice is known to the public, but the quantities of illegally imported pesticides are never estimated and/or reported.
Although Croatian plant protection specialists suggest that the use of pesticides per hectare in Croatia is approximately 2.5 times lower than in the EU (Igrc-Barčić 2002), this does not seem to be the case. A recent calculation (Znaor and Karoglan Todorović 2004) shows that when calculated per actual surface of arable land, Croatian pesticide consumption in the period 1999-2003 amounts to 4.2 kg of active ingredients per hectare of arable land. This is substantially higher than the figure of some 3 kg that can be found in other recent documents (Znaor 2002; Moller 2003; WRI 2003). The new data from EUROSTAT (EUROSTAT 2003), suggest that the average pesticide consumption in 1999 (last year with complete statistics) for EU-15 was 3.1 kg of active ingredients per hectare of arable land. In the same year, Croatian consumption was 3.6 kg- a mere 16% higher than the average of the EU-15. However, the average pesticide consumption in the EU-15 has most likely lowered in the meantime. This is because several EU countries (notably Benelux and Scandinavian) have initiated serious national pesticide reduction programmes since then. In addition, new pesticides containing less active ingredients are being applied and a number of farms have been enrolled into agri-environment programmes. However, during this time consumption in Croatia has remained quite stable.
3.5.3 Machinery and irrigation The machinery used is outdated and inappropriate for modern agricultural operations (MPŠ 1996; MPŠ 2003). The average age of the tractors used in Croatia is more than fifteen years (VRH 2000), with former co-operatives having substantially younger tractors than private farms, whose average tractor is older than twenty years (UN-ECE 1999). The amount of agricultural machinery in use has been in constant decline since 1994, particularly in the former co-operatives (Sviržnjak 2001). In 2003 these had only 3,934 tractors (DZS 2003), which is equal to only 0.018 tractors per hectare of the companies’ UAA, and represents a drop of some 40% in comparison with 1994. At the other hand, the family farms seem to be well equipped. In 2003, these had 86,243 single and 185,954 two-axis tractors (DZS 2003), an equivalent of even 0.21 two-axis tractors per hectare of the UAA cultivated by the family farms. However, this is still some 40% less than in 1995 (DZS 1996).
According to the government’s figures, up to 1.8 million hectares of agricultural land (50 % of the total) requires drainage systems (UN, 2002). However, these are built on only 600,000 hectares (on 33.5% of the area needed) and only partly on 520,000 hectares, while 670,000 hectares (37.5%) of excessively moist soils have no drainage systems at all (UN 2002). Subsoil pipe drainage has been installed on only 162,000 hectares (out of 823,000 hectares requiring this system (UN 2002). Since almost the entire Croatian drainage system was built before 1990 and has been inadequately maintained, it is in rather bad condition (MPŠ 1996). Only 0.2% of cropland is irrigated (according to the FAO's
Pesticide consumption higher than EU average
Outdated machinery
Poor irrigation
43
AQUASTAT Information System on National Water Extraction from Agriculture (FAO 2003), 0% of total water extracted in Croatia goes to agriculture).
3.6. Environmental impact of agriculture
Agricultural land covers a considerable part of Croatia's territory and agriculture is by far the biggest single influence on Croatian nature and the countryside. Agricultural activities affect both the quantity and quality of nature and the environment. Agriculture has a substantial impact on soil, water, and air, as well as on species, habitats and landscape diversity.
3.6.1 Perceptions on environmental impact of agriculture For decades, Croatian policy makers and scientists have believed and declared that the state of the Croatian environment is quite good and certainly much better than in most other, notably EU, countries (DUZPO 1999; Grgić, Franić et al. 1999; UN-ECE 1999; VRH 2000; Grgić and Mesić 2001; MZOPU 2002; UN 2002). A similar attitude was held relating to agriculture and the environment. A widespread and dominant belief was that agriculture is not a significant source of environmental pollution and nature degradation, especially when compared with other countries (RH 1998; UN-ECE 1999; VRH 2000; RH 2002; UN 2002). The 1998 "Report on the state of environment" (RH 1998) does not at all list agriculture among the sources of environmental pollution, while the latest review on the state of the Croatian environment (MZOPU 2003), states: “Because of the low intensity of production and extensive management, in comparison with other countries, Croatian agriculture is not considered to be a significant source of environmental pollution”.
Further examples of similar opinions:
• “Although there was no adequate attention paid to the problem of environment protection up until a decade ago, the soil, water and air in Croatia are among the best most preserved in Europe” (Grgić, Franić et al. 1999)
• Agriculture “has a significantly small role as a polluter” (Grgić, Franić et al. 1999)
• “The soil of the Croatian mountainous region is among the cleanest in Europe” (UN-ECE 1999).
• “Compared with other countries, Croatia’s agriculture is not a serious source of pollution” (UN-ECE 1999).
• “…agricultural impact on biological and landscape diversity in Croatia is comparatively better” than in Europe, where this problem is “particularly serious” (DUZPO 1999).
• “Agricultural activities have not caused serious soil or environmental pollution” (UN-ECE 1999)
• Croatian soils are “one of the best preserved in Europe” (VRH 2000) • “Croatia has the most preserved soils in Europe” (Grgić and Mesić
2001) • “In agriculture there is, however, a relatively low level of production
intensity which has little significance in soil pollution (Grgić and Mesić 2001).
Environmental impact
Negligible environmental impact?
44
• “Because of its low intensity of production and extensive management, in comparison with other countries, Croatian agriculture is not considered to be a significant source of environmental pollution” (MZOPU 2002).
• “Today, agriculture is not a serious source of pollution in Croatia” (MZOPU 2002).
• “Agriculture does not cause any significant pollution of soil or environment” (RH 2002).
• “Although nowadays agriculture is mentioned as a potential source of pollution of surface and ground water, due to low consumption of mineral fertilizers and chemicals, in particular on private farms, surface and ground water in Croatia is not seriously burdened from this source” (UN 2002). An identical text appears also in the report made by the International Commission on Irrigation and Drainage (ICID 2001).
• “Due to low consumption of pesticides and fertilisers, surface and ground water in Croatia is not polluted by the substances deriving from these agents” (UN 2002).
• “The level of pollution from agricultural production is moderate” (UN 2002)
• “The consumption of fertilisers in Croatia is relatively low” (MPŠ 2003).
In the recent accession document submitted to the EC the Croatian government declares that Croatia has no special measures for the reduction of fertiliser and pesticide use, since “the use of these products in the Republic of Croatia is below the European average” (VRH 2003). The same opinion is shared by the key pesticide industry leaders. Čović for instance (2004) states that Croatia «uses slightly more pesticides than Albania». Mesarić stresses that Croatian farmers use 50% less fertilisers than those in EU (Mesarić 2004) and that Croatia should be using at least 1.2 million tonnes of fertilisers (Mesarić 2003; Mesarić 2004), which is more than double is uses today. Key agricultural media also stresses that due to the low use of agri-chemicals, Croatia is one of the most ecologically preserved countries in (Grgurić 2004).
The above-mentioned statements require further analysis. In all of these documents, statements appear without any reference to the corresponding studies and data. These conclusions are more assumptions (and wishful thinking), rather than statements drawn from sound research and analysis. Several important policy reports recognise the lack of data and reliable (scientific) monitoring regarding the state of soil and environmental impact of agriculture in general (UN-ECE 1999) GRC, 2000).
The Environmental Performance Review (UN-ECE 1999) for instance states that Croatian agriculture is not a serious source of pollution and praises the environmental state of the Croatian soils. However, the same document states that due to the "absence of a soil inventory and of regular soil monitoring..." "...the true condition of the soil is practically unknown". The Report for the Food Summit prepared by the Croatian government (UN 2002) also states that the Croatian soils are “one of the best preserved in Europe”. However, the same document, just two
“Superiority” is not well backed-up
45
sentences further, concludes that “analysis shows that in spite of relatively low contamination levels, damage in the pedosphere has reached a level which requires investigation and measures for the protection and preservation of soil quality”. It is interesting to notice that almost identical text has already appeared in (Grgić, Franić et al. 1999), several years earlier. This indicates that some of the text appearing in official documents has been “recycling.
Even if agriculture was recognised as a source of (potential) environmental pollution and nature degradation, it was believed that the problem does not lie with the family farms, which occupy majority of agricultural land, but rather with the agricultural companies (mostly former co-operatives) (DUZPO 1999; Grgić, Franić et al. 1999). According to Grgić et al. (Grgić, Franić et al. 1999) these operations “use more of the potentially harmful inputs (fertilizers, pesticides, fossil/solid fuels) and have larger livestock farms (harmful gases and waste). However, since “agricultural development in Croatia is not based on large-scale farms that could possibly be greater polluters of the environment“ (Grgić, Franić et al. 1999)- consequently the total (possible) polluting effect of agriculture is thought to be negligible.
However, things have been slowly changing. A deeper analysis raises doubts as to whether Croatian agriculture is as environmentally friendly as it was thought to be. Some recent studies question the environmental “friendliness” of Croatian agriculture (Znaor 2002; Moller 2003), while a recent FAO document on rural development in Croatia concluded that the situation concerning the environmental impact of Croatian agriculture “is far away from being satisfactory” (FAO 2004). A recent agri-environment programme for Croatia (Znaor and Karoglan Todorović 2004) has highlighted heavy use of pesticides and fertilisers in Croatia. However, the data presented in this report were heavily criticised by the fertiliser industry and academics linked to it (Hrvatsko tloznanstveno društvo 2004; Maceljski 2004; Petrokemija 2004; Petrokemija 2004; Petrokemija/AF 2004). Moreover, the MPŠVG was requested not to accept presented calculations (although just few months later, MPŠVG issued its annual report (MPŠVG 2004) in which it recognised the basis of the calculations provided by Znaor and Karoglan Todorović (Znaor and Karoglan Todorović 2004)).
However, several recent developments indicate that Croatian policy makers have been taking an approach to the subject that is somewhat more critical. A good example is a recent President’s speech on agri-environment programme for Croatia (Mesić 2004). Awareness of the causal link between agriculture and the environment/nature (regarding both small and large farms) is slowly taking root in Croatia, too. Several recent policy initiatives are quite encouraging. These include work on several regulations, introduction of some new economic instruments (e.g. subsidies for local breeds and organic farming) and important institutional changes (e.g. within MPŠVG and the extension service). Besides, the government has initiated several interesting international projects dealing with protection of the environment/nature and agriculture (DZZP 2004; FAO/MPŠVG 2004). A positive change can be noticed among the scientific and NGO communities, too. Whereas earlier, environmentally oriented scientists and NGOs have perceived
Environmental degradation is caused only by big farms?
Changing attitude
Promising recent developments
46
agriculture, farmers and agronomists as “enemies”, now there is a slow shift in their attitude. The opposite is true, too. For many farmers and agronomists, environmentalists are no longer just dreamers wishing to abolish agriculture, but a concerned group whose remarks are relevant for the future of agricultural sustainability.
The above-mentioned clearly indicates a positive evolution in attitudes regarding agriculture and the environment. This development is quite encouraging and creates a favourable momentum for the introduction of concepts like organic farming.
3.6.2 Biodiversity Farmland, especially grassland and meadow orchards are very biodiversity rich habitats, hosting numerous valuable species. Agriculture also shapes the landscape and influences its quality and character.
The changes in farming practice that have taken place during the last decades are mainly a result of intensification of farming. These comprise the specialization of production, a decrease in traditional farming, the use of high quantities of industrial fertilisers and plant protection preparations, narrow crop rotations, changes in the types of crops grown, loss of field boundaries, etc. Intensive farming increases environmental pressures including soil erosion, loss of organic content, water pollution and a decreased number of wildlife species. The scheme will be applied on arable land and therefore will target Croatian areas with the most intensive farming practices (Slavonija, Baranja, Međimurje, etc.). These areas have lost a considerable part of their landscape characteristics and consequently a number of wildlife habitats. In addition, these are the areas with the highest mineral fertilizer and pesticide use.
Ironically, in Croatia both intensive and extensive agriculture have an adverse impact on landscape, habitat, species and genetic diversity. Intensive use of agri-chemicals, as well as reduction of the genetic pool caused by narrow crop rotations, lack of mixed-cropping and the use of limited number of breeds and varieties have had a significant negative impact on biodiversity (MZOPU 2002). Drainage of wetlands (among most important in Europe) and their conversion to arable land, as well as removal of hedges and trees from agricultural land has had a negative biodiversity impact, too (DUZPO 1999). Although Croatia has numerous local breeds and crop varieties, these have been replaced by modern stock that is likely to better suit the demands of the modern market. (MZOPU, 2002). Some less favoured areas and less-productive breeds, and crop varieties have been neglected or left out from production all together. All this has resulted in monotonous landscapes, and a decrease in genetic, species and habitat biodiversity.
The narrow crop rotation that is practised by most Croatian farmers and co-operatives is considered to have a negative impact on soil fertility and biodiversity (DUZPO 1999), although small farms with fragmented plots provide a good starting position for nature protection. In the period 1945-1990, huge grassland and wetland areas were reclaimed and converted to arable land. During this operation a thousand kilometres of hedgerows, stonewalls and farm woodlands have been removed, that
Loss of biodiversity
Other losses of biodiversity
47
used to be part of the traditional Croatian landscape. Unfortunately, many private farmers have also lost touch with nature and have eradicated valuable habitats and landscape elements from their farms, too. Besides, some less favoured areas (e.g. terraces and steep slopes), less-productive breeds, and crop varieties have been neglected or left out from production all together. All this has resulted in monotonous landscapes of some regions, and a decrease in genetic, species, habitat and landscape biodiversity.
The Ministry of environment claims that due to the small size, extensive management and numerous small plots “with rich hedges” and “vast pastures”, family farms (particularly those in the western, mountainous and karst regions) do not pose any treat to biodiversity (DUZPO 1999). According to the same source, the remaining structures of the ex-cooperatives, mostly situated in the eastern part of Croatia and practising intensive agriculture are associated with poor biodiversity. These operate on large fields that were converted into monoculture arable land and are “without hedges and groves that would at least slightly mitigate the effects of a disastrous reduction of the biological and landscape diversity” and “the consequence of such management, combined with the excessive use of chemicals, is the considerable degradation of land” (DUZPO 1999).
Due to the lack of livestock both organic soil matter and grassland biodiversity is in decline in Croatia. The stocking density is particularly low in areas of high natural value (Znaor and Karoglan Todorović 2004). This results in reforestation and the loss of species-rich grasslands and the open landscape important for migratory birds and many other species. The under-grazing also prevents the beneficial influence of animals on biodiversity, such as species selective grazing, seed dissemination, re-rooting of pasture flora, maintenance of soil organic matter, pest and disease control, etc. According to some estimates, in the period 1992-2002, bush re-encroachment has taken place on approximately 300,000 hectares (Moller 2003). However, this figure seems to be severely underestimated, as in the same period more than 400,000 hectares of arable land alone remained uncultivated and exposed to invasion by bushes. Most animals in Croatia (with the exception of sheep) are kept in stables all year round (DUZPO 1999). This practice together with decline in the number of animals does not allow for efficient utilisation of grassland. This has impoverished biological and landscape diversity, threatening the existence of numerous plant and animal species associated with grassland ecosystems and/or management practices (DUZPO 1999). This problem is particularly pronounced in the biodiversity-rich karst and mountainous regions (DUZPO 1999).
3.7. Agricultural outputs and employment
3.7.1 Production volume and yields The national agricultural output is still approximately 30% lower than in 1990 (DZS 2003; VRH 2003), before Croatia’s independence and a shift
Undergrazing problems
48
to market economy. The topic on agricultural production volume and yields is further elaborated in Chapter 4.
3.7.2 Agricultural trade balance The former state-owned agrokombinats still dominate food processing and distribution. Their restructuring resulted in huge declines in agricultural production and processed food that is now being compensated for by imports. Croatia is a substantial food importer! Since independence (1991), Croatia has been facing an accelerated growth in import value for agricultural and food products. Agricultural imports increased from $400 million in 1993 to $865 million (average imports from 1997 to 1999). For the same period, agricultural exports increased only marginally- from $497 million to $506 million (MPŠ 2000; USDA 2002). The average annual deficit in agricultural and food trade at the end of 90s was about $411 million or approximately 20% of agricultural GDP (DZS, 2001). For the same period, the average agricultural and food imports accounted for about 40-50% of the agricultural GDP. The value of imported agricultural products grew approximately 40% between 1997 and 2000 (USDA 2002).
Agriculture enables survival (food and some income) for approximately 500,000 rural inhabitants. These people are not formally registered as employed, but are rather subsistence farmers. In addition, agriculture provides free food for numerous urban inhabitants who have relatives in the village or practice some form of part-time farming or urban gardening on their own.
In the period 1991-2001 Croatia imported over $10 billion in food (Hedl 2001). This is an exceptionally high amount taking into account that Croatia's average annual budget for the same period was just slightly over $9 billion. In 2000 Croatia spent approximately 1 billion dollars on imported food, which accounts for 5% of GDP (DZS, 2001). Almost half of the imported food originates from the EU (USDA 2002), while the countries of the former Yugoslavia account for 15% and Hungary for an additional 10% (VRH 2000).
In the last ten years, Croatia has been self-sufficient in only five products: wheat, maize, eggs, poultry meat and wine (MPŠ 2000). Livestock production accounted for 43% of gross agricultural output in 2001 (DZS 2003), but the Croatian self-sufficiency index in 2001 for beef was still 6 %; pork 85 % and milk 83% (Moller 2003).
The officials claim that taking into account natural conditions and technological potential, Croatia can produce much more and achieve self-sufficiency for all “strategic” agricultural products and even export them (VRH 2000). However, such statements have to be treated with caution. Although MPŠVG emphasises that with its 0.72 hectares of agricultural land per capita (MPŠ 2003) Croatia exceeds the average for Western Europe, census data suggest that Croatia has only 0.31 ha of agricultural land and 0.18 ha of arable land per capita (DZS 2003). This low figure puts Croatia in the group of countries under 0.5 ha of agricultural land per capita- the FAO's figure for a minimum subsistence level (Znaor and Karoglan Todorović 2004). This is also one of the main reasons why Croatia is a substantial food importer.
Great food importer
Insufficient in agricultural commodities
Optimistic officials but scarce land
49
3.7.3 Employment The population census from 2001, suggests that Croatia has an agricultural population of 245,987, of which only 165,942 (67.5%) are economically active in agriculture (DZS 2003; MPŠ 2003). Economically active is defined as the part of the economically active population engaged in or seeking work in agriculture. According to FAO (FAO 2005) the economically active population (labour force) refers to the number of all employed and unemployed persons (including those seeking work for the first time). It covers employers; self-employed workers; salaried employees; wage earners; unpaid workers assisting in a family, farm or business operation; members of producers' co-operatives; and members of the armed forces. FAO’s (2003) figure for the Croatian “agricultural population” in 2001 is substantially higher: 370,000 people. This is probably because FAO’s category “agricultural population” includes all persons and their non-working dependants whose livelihood depends not only on agriculture, but also on hunting, fishing and forestry (FAO 2003). Here, too- FAO’s figure is somewhat higher- 174,000 people.
The size of both the rural and agricultural population has been in constant decline. In the period 1991-2001, the number of “active farmers” has dropped by 40% (DZS 2003). In 2001, the rural population accounted for 44.4% of the total population, while the agricultural population accounted for only 5.5% of the total population and for 11% of the rural population in Croatia (DZS 2003; FAO 2003). The figures from the last agricultural census (DZS 2003) indicate that agricultural households have nearly 1.5 million people (34% of total population in Croatia).
Agricultural sector in Croatia employed 8.3% of the labour force in 2002 (DZS 2004). The USDA (USDA 2002) estimates that Croatia has approximately 100,000 full-time private farmers, 400,000 part-time farmers and 33,000 employees in former co-operatives. According to the agricultural census (DZS 2003) 66% of all agricultural household members are engaged in agricultural activities. However, 51% of these do farming only 2 hours a day in average, while only 16% farm more than 6 hours a day in average. Less than 20% of family farms have more than one active member of the family working primarily on the farm itself (DZS 2003). In most cases, farming is part-time job that is often combined with a job in industry or services. The agricultural workforce on family farms consists of middle aged and elderly people who have very poor education. The younger (and usually better-educated) rural inhabitants see farming as a labour-intensive and unprofitable business and tend to work elsewhere. More than 50% of the Croatian farmers are older than 50 years (USDA 2002; DZS 2003). Some 90% of farmers have an education level equal or lower to primary school, while a huge 98% of all farmers do not have any agricultural education at all (DZS 2003).
Question of definition
Farming population in decline
50
3.8. Agricultural policy
Most of the governmental support for agriculture and rural areas operates through one of the aid schemes run by MPŠVG. In January 2003, Croatia implemented the Act on State Aid in Agriculture, Forestry and Fisheries (N.N. 2002; N.N. 2003). This act introduced a new subsidy scheme for farming and rural areas. It has replaced an old and quite complicated support scheme, consisting of nearly 150 different subsidies- all of which were production-oriented subsidies and none aimed at supporting environmentally friendly farming practices. The new policy consists of two pillars: production linked direct payments and structural policy measures.
The new policy distinguishes between support measures for commercial and non-commercial farms. In order to be eligible for support, both commercial and non-commercial farms have to be included in the Farm Register at MPŠVG (introduced in 2003). The Farm Register keeps records on production resources, land use, the number of livestock and other important data. All farmers whose production volume is bigger than a prescribed minimum and those who sell their products at the market are obliged to register. By the end of 2003, some 160,000 farms had been included in this register (MPŠVG 2004).
3.8.1 First pillar: production subsidies The first pillar is a set of production stimulation measures, providing direct payments (subsidies) basically to commercial farmers. It grants support for the six production categories: arable farming, animal husbandry, plantations (fruits and vineyards), organic farming, game birds and fishery. The subsidy level for each commodity should have been based on the coefficients derived from a standardised gross margin (production value minus variable costs of production). However, these coefficients were only used to determine farm business size and whether the farmer has the minimum size to qualify for a payment. They were not decisive for determining the payment level of the current subsidies. The payment levels were rather results of lobbying and political pressure from various interest groups- therefore no wonder that many subsidies support processing industry, rather than private farmers (Znaor and Karoglan Todorović 2004). While the subsidy for pastures and meadows is linked (coupled) to the requirement of a minimum of 0.5 LU per hectare, there are no similar restrictions for animals. In other words, animal husbandry farmers can obtain subsidies even if landless. This policy is detrimental to environmental protection. The maximum subsidy that can be paid to an individual farm in 2005 will be 267,000 EUR.
The subsidy cannot be claimed for just any production volume. For each of the above-mentioned production categories there is a minimum annual production volume set for the period 2003-2005 (Table 6). This is determined per type of production per individual commodity or production type and is equivalent to some 3 hectares of wheat or 3 dairy cows or various combinations. The objective with arable farming subsidies is to reach production on at least 3 hectares by year 2005. For fruit and vegetables, this target is lower - 0.5 ha. The minimum number
New support schemes
Eligible production and subsidy levels
51
for milking cows is 5 animals, while the lowest quantity of cow milk eligible for subsidy is 12,000 litres per year.
The requirement for the minimum production volume is quite low in organic farming. To be eligible for a subsidy organic farmers are required to have at least 0.5 ha and do not have to comply with a minimum area under a particular crop.
Less favoured areas (LFA) obtain higher premia than other regions. For some commodities, subsidy levels are 35% higher than in other regions, with the exception of cow milk, which attracts 62% higher premia per litre. Organic farmers in LFA receive the same amount as their organic colleagues in non-LFAs. The exception are milking cows, sheep and goat milk for which they receive 35% more per head and cow milk, which receives a 59% higher subsidy per litre of milk.
According to the Agriculture Act (NN, 66/01 and 83/02), the less favoured areas in agriculture include the following: • hilly and mountainous areas as defined in the Act on Hill and
Mountain Areas - NN, Nos. 12/02, 32/02 and 117/03). • all Croatian islands and the Pelješac Peninsula • areas with unfavourable hydrologic and pedologic properties (these
are yet to be determined by the government) • the first and second group of areas of special state concern (mostly
ex-war areas) as defined by the Act on Areas of Special State Concern (NN, 26/03).
3.8.2 Second pillar: structural policy measures The second pillar of state aid to farmers is still not fully functioning and only few aid lines have been in operation. The second pillar consists of three schemes: 1. an income support scheme 2. a farm capital investment scheme 3. a rural development scheme The income aid model was designed bearing in mind the need to provide additional income for small non-commercial or uncompetitive family farms run by elderly farmers who have not yet reached retirement age, but are paying retirement and social security benefit tax. Eligible for the support under this scheme are all male farmers older than 55 years and all female farmers older than 50 years on farms that are smaller than 3 hectares. Thus, this scheme is regarded as aid during the bridging period between 55 years (or 50 years for female farmers) and retirement. Once entitled to a pension, farmers are no longer permitted to benefit from the agricultural income support scheme. The maximum annual support is 960 EUR per person and this aid cannot be combined with aid from other schemes, except from rural development scheme. Currently some 42,000 farmers benefit from this scheme.
The farm capital investments scheme is set up to ease farmers’ relations with commercial banks. The scheme provides aid to the farmers who are granted investment loans by commercial banks for the purchase of livestock, establishment of vineyards and orchards, agricultural machinery and equipment, or construction of stables and storage
Subsidies for LFA
Income support scheme for senior farmers
Farm capital investments scheme
52
facilities. The aid is limited to 25% of the loan value. The minimum size of bank loan eligible for support under this scheme is 10,700 EUR, while the maximum aid that may be granted under this scheme is 33,000 EUR per applicant per year.
The rural development scheme consists of three sub-schemes under Pillar Two. It consists of three sub-schemes supporting: 1) marketing activities enabling a successful product launch 2) the preservation of traditional and protected breeds 3) development of rural areas in general The second sub-scheme provides support for keeping traditional and protected breeds. The subsidy is paid per head. The payment levels and the minimum quantity eligible for this support are given in Table 3. For particularly endangered varieties whose population is less than 100 individuals, the subsidy level may be increased by 50%. In 2002, the government spent 1.3 million EUR on this sub-scheme, nearly twice as much as in 2001 (MPŠ 2003). Table 3 Payments for traditional and protected breeds unit minimum unit quantity EUR
2003 2004 2005
Cattle head 1.00 1.00 1.00 392.16
Horses head 1.00 1.00 1.00 261.44
Pigs head 1.00 1.00 1.00 91.50
Sheep head 1.00 1.00 1.00 45.75
Donkeys head 1.00 1.00 1.00 78.43
Turkeys head 5.00 5.00 5.00 11.76
While the first two sub-schemes are already operating, the last one has still to get started. The sub-scheme to support the development of rural areas consists of 16 programme areas. One of these is dedicated to environmental protection of rural areas. This sub-scheme is still in its early phase of development and no concrete projects have been awarded yet. Its design might be changed soon. The National Programme for Agriculture and Rural Areas- a policy document that is soon to be adopted by the Croatian Parliament - requires the government to develop a comprehensive Rural Development Programme. This is to define in detail all measures and aid to be provided under this sub-scheme.
The grants to be awarded under the sub-scheme on rural areas development are subject to public tenders. Financial means for its implementation are to be provided not only by the MPŠVG, but also by counties and municipalities.
Rural development scheme
53
The total state support budget for agriculture, fishery and forestry in 2003 was approximately 300 million EUR and comprised some 90% of the entire MPŠVG budget. Some 98% of the agricultural aid has been earmarked for Pillar One production support subsidies. The farm capital investments scheme receives 0.9%, the income support scheme 0.7% and the rural development scheme only 0.4% of the total budget (Znaor and Karoglan Todorović 2004).
3.8.3 Other support schemes The former Ministry of Small and Medium-sized Enterprises used to run a support programme providing grants to organic agriculture co-operatives. This aid financed conversion plans, inspection and certification, training and technical advice, as well as product marketing. It was a one-off payment and was limited to 8,000 EUR per co-operative. So far, the support has been granted to 9 co-operatives receiving a 60,000 EUR in total (Znaor and Karoglan Todorović 2004).
3.8.4 Penalties Apart from stimulating economic instruments (subsidies, grants, etc.), Croatia also has several economic instruments preventing and penalising adverse impacts of agricultural activities on the environment and nature. These include various forms of fines, charges and penalties. A number of these are prescribed by the Directive on the Protection of Agricultural Land from Contamination with Harmful Substances (NN, 15/92) and the Regulations on Plant Protection (NN, 10/94 and amendments). Penalties are laid out for the discharge of agricultural pollutants into water (e.g. direct discharge of slurry or farm wastewater), application of slurry and liquid manure during winter and in excessive quantities, as well as the improper use of pesticides. However, the enforcement of these penalties is inadequate and insufficient. It mostly affects the big cooperatives and hardly touches the private farming sector.
Local authorities prescribe measures for maintaining farmland and its boundaries (hedgerows, field margins, farm roads, etc.). The Act on Agricultural Land and the Act on the Financing of Local Self-Government and Administration Units, allow local governments to penalise landowners and impose upon them a tax for land negligence. However, this practice has not been enforced.
3.9. Organic farming
The Croatian organic agriculture sector is still in an early stage of development but has recorded a very fast expansion over the last two years. Interest in organic agriculture is rapidly increasing among all actors: producers, NGOs, education and research organisations, businessmen and policy makers (Znaor and Karoglan Todorović 2004). According to the latest estimates by the Ministry of Agriculture, Croatia has some 7 000 hectares under organic management (Figure 8), managed by some 250, mostly family farms (Čulo 2005). Cereals seem to account for more than 50% of the total organic production in Croatia.
Agricultural support budget for 2003
Early stage of development, but rapid expansion
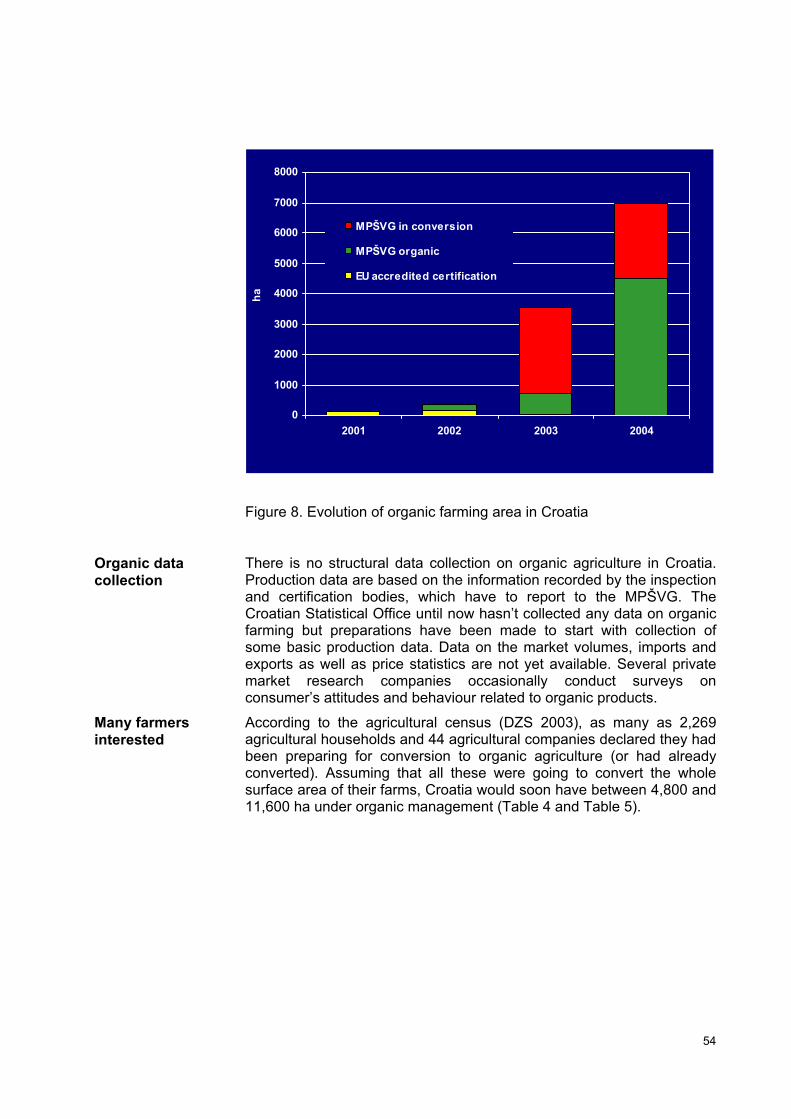
54
Figure 8. Evolution of organic farming area in Croatia
There is no structural data collection on organic agriculture in Croatia. Production data are based on the information recorded by the inspection and certification bodies, which have to report to the MPŠVG. The Croatian Statistical Office until now hasn’t collected any data on organic farming but preparations have been made to start with collection of some basic production data. Data on the market volumes, imports and exports as well as price statistics are not yet available. Several private market research companies occasionally conduct surveys on consumer’s attitudes and behaviour related to organic products.
According to the agricultural census (DZS 2003), as many as 2,269 agricultural households and 44 agricultural companies declared they had been preparing for conversion to organic agriculture (or had already converted). Assuming that all these were going to convert the whole surface area of their farms, Croatia would soon have between 4,800 and 11,600 ha under organic management (Table 4 and Table 5).
Organic data collection
Many farmers interested
0
1000
2000
3000
4000
5000
6000
7000
8000
2001 2002 2003 2004
ha
MPŠVG in conversion
MPŠVG organic
EU accredited certification
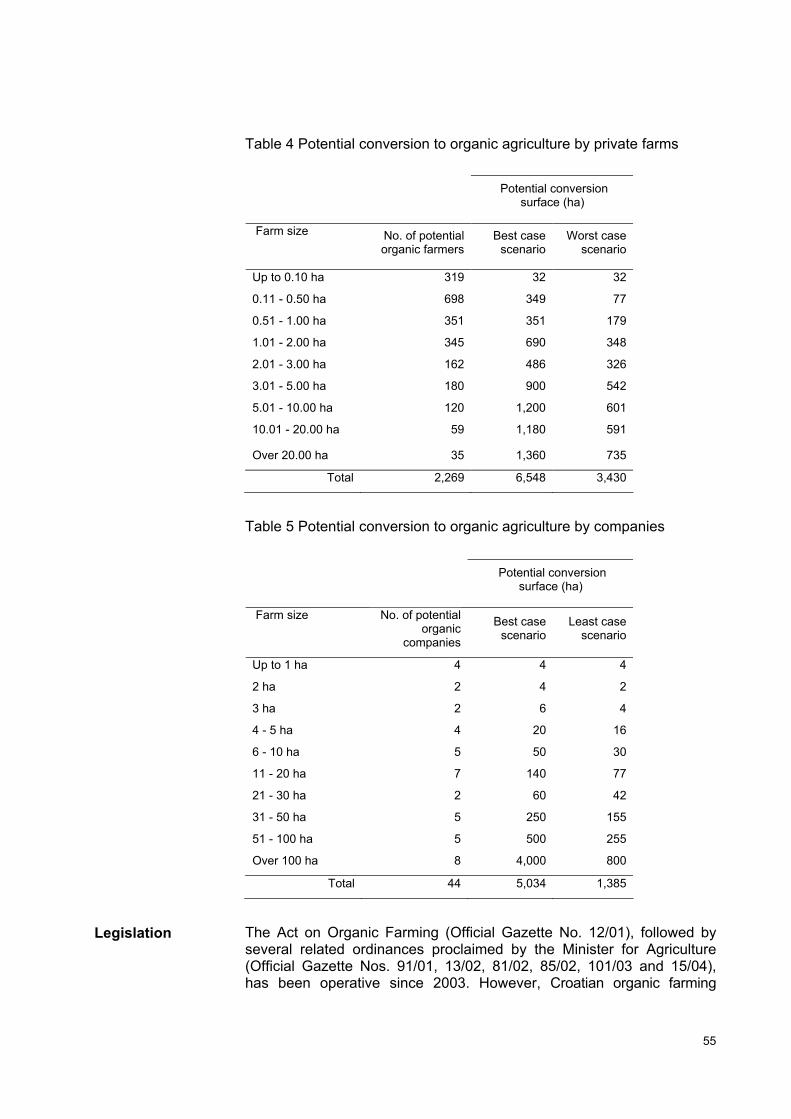
55
Table 4 Potential conversion to organic agriculture by private farms
Potential conversion
surface (ha)
Farm size
No. of potential organic farmers
Best case scenario
Worst case scenario
Up to 0.10 ha 319 32 32
0.11 - 0.50 ha 698 349 77
0.51 - 1.00 ha 351 351 179
1.01 - 2.00 ha 345 690 348
2.01 - 3.00 ha 162 486 326
3.01 - 5.00 ha 180 900 542
5.01 - 10.00 ha 120 1,200 601
10.01 - 20.00 ha 59 1,180 591
Over 20.00 ha 35 1,360 735
Total 2,269 6,548 3,430
Table 5 Potential conversion to organic agriculture by companies
Potential conversion
surface (ha)
Farm size
No. of potential organic
companies
Best case scenario
Least case scenario
Up to 1 ha 4 4 4
2 ha 2 4 2
3 ha 2 6 4
4 - 5 ha 4 20 16
6 - 10 ha 5 50 30
11 - 20 ha 7 140 77
21 - 30 ha 2 60 42
31 - 50 ha 5 250 155
51 - 100 ha 5 500 255
Over 100 ha 8 4,000 800
Total 44 5,034 1,385
The Act on Organic Farming (Official Gazette No. 12/01), followed by several related ordinances proclaimed by the Minister for Agriculture (Official Gazette Nos. 91/01, 13/02, 81/02, 85/02, 101/03 and 15/04), has been operative since 2003. However, Croatian organic farming
Legislation
56
legislation still requires substantial improvement and should be harmonised with that of the EU (Znaor and Karoglan Todorović 2004).
National public policies related to environmental protection and rural development (e.g. The National Environmental Strategy of 1999, The Strategy and Action Plan for Protection of Biological and Landscape Diversity of 2002, The 2002 National Agriculture and Fisheries Strategy, The 2001 Programme of Sustainable Development of Rural Areas, The 2003 Draft Rural Development Strategy, The 2004 National and Pilot Agri-Environment Programme) recognize the need to adopt organic agriculture on a larger scale. However, Croatia’s regulations that should be regulating and restricting the negative impact of agriculture on the environment and biodiversity are still in an early stage of development (Znaor 2002; Moller 2003; FAO 2004; Znaor and Karoglan Todorović 2004). Some positive efforts have been initiated recently, but in general, there is no comprehensive legislation on this subject yet. Croatia still has to develop codes of good agricultural practice - a set of basic environmental farming measures that are preconditions for any agri-environmental programme. Although the recently adopted law on fertilisers and soil additives obliged the Ministry of agriculture to prescribe codes of good agricultural practices by November 2004 at the latest, this has still not been done.
The institutional base for organic agriculture is established, with: • a dedicated Unit for Sustainable and Organic Agriculture within the
Ministry of Agriculture, Forestry and Water Management; • the National Board for Organic Agriculture - a think-tank and advisory
body to the Minister of Agriculture with a membership composed of public and private institutions, as defined in the Organic Law;
• an Organic Agriculture Accreditation Committee and an Ecolabels Committee, both composed of Government bodies;
• an ad hoc Committee for Organic Production, assigned to adjust the Organic Law.
These institutional structures as well as regulatory instruments are in an early stage of implementation and are subject to change to better adapt to EU accession negotiations and EC Regulation 2092/91 on organic agriculture (Karoglan Todorović and Znaor 2005).
The Croatian Agricultural Extension Service is the main agricultural farm advisory service in Croatia. This organisation is independent legal entity, but has to implement the policy of the Ministry of Agriculture, Forestry and Water Management. The Croatian Agricultural Extension Service employs some 150 people and has branches throughout the country. It has recently established a section for organic farming, consisting of eight experts. This group has just begun its work and its experts have been actively acquiring additional training and knowledge on the subject. At present, they are mostly focused on giving advice on conversion. In addition, technical advice on organic agriculture is provided by several NGOs.
An inspection and certification system in organic farming has been established and started to operate. Vital in this process is not only the role of the MPŠVG, but also the NGOs and companies appointed to carry out inspections and certification. Croatia has a fully functioning
Institutional base
Extension service
Inspection and certification
57
domestic inspection and certification system with six inspection (AgriBioCert, Biopa, Biotechnicon, Croatiainspect, Croatian Forests and PEZ) and two certification (AgriBioCert and Biopa) organizations accredited by the MPŠVG. The costs of inspection and certification are 30-100 EUR/ha, depending on the farm size. Due to complex and duplicative procedures to acquire the organic label the administrative burden is put on farmers. The existing organic inspection and certification system should be simplified and more responsibility and authority should be given to inspection and certification bodies in guaranteeing conformity with organic standards (FAO 2005).
In 2002 the government announced a programme that would initiate organic production on de-mined agricultural land (VRH 2002). However, so far no concrete projects have been started. The FAO and MPŠVG have jointly produced a strategy for organic farming (FAO/MPŠVG 2004). It envisages conversion of 10% of the UAA to organic management.
There have been several internationally funded projects on organic agriculture in Croatia in the last couple of years. Most of these projects have focused on the war-affected areas of Slavonija (Osijek) and Dalmatinska Zagora (Knin). These projects have been primarily focused on extension, certification as well as production and processing of organic products for export to the EU market. Foreign investments in the organic farming sector in the period 2000-2005 are estimated to be at about 2.7 MEUR and have been financed by the Netherlands, Swiss and Italian government, as well as by the FAO and Regional Environmental Centre based in Hungary. In the same period, the national and regional governments have invested an additional 1.5 m EUR in the form of various subsidies and promotion programmes (Karoglan Todorović and Znaor 2005).
The organic NGOs have done a major job in promoting organic agriculture in Croatia (Karoglan Todorović, Znaor et al. 2000; Znaor 2003). Their work encompasses a wide range of activities, such as training and education, publishing, consultancy, inspection and certification, awareness campaigns, etc. However, their limited political influence, manpower and financial means are their main obstacles for initiating further changes. At present there are some fifteen NGOs that are specialised in organic agriculture. However, the trend of flourishing new NGOs dealing with various forms of organic agriculture has slowed down. With some exceptions, most of the existing NGOs are voluntarily driven and lack professional capacities and infrastructure to run serious projects. Most are also active only in their specific region, and very few act on the national level (Znaor and Karoglan Todorović 2004; Karoglan Todorović and Znaor 2005).
3.9.1 Organic subsides From January 2003 the government introduced subsidies to support organic farming. The introduction of the organic farming subsidy had an immense impact on the development of this sector. The area under organic management in 2003 increased by about 10 times as compared with 2002. All registered organic farmers (both in conversion and fully converted) are entitled to subsidies. Depending on the type of
Government projects
Donors
Organic NGOs
Subsidies available
58
production, these are 30%-140% higher compared to conventional farming (Figure 9). The only exception is sugar beet and field (industrial) vegetables where the premium is equal for conventional and organic production. Organic farmers can also receive subsidies for poultry, lambs and kid-goats, while conventional ones are not entitled to this support. However, subsidy rates for different organic production types seem to be inconsistent. Orchards and vineyards for instance receive the same payment rate per hectare (392 EUR) as cereals or fodder crops. On the other hand, meadows and pastures receive only 17 EUR - an amount that does not seem to adequately compensate for the income foregone and additional costs incurred. Although the organic (as well as all other farming subsidies) in Croatia appear to be high, the reality is slightly different. These subsidies are just hypothetical! In practice there are always more subsidy claims than the MPŠVG can accommodate in its budget. Consequently, the MPŠVG pays only a portion of these hypothetical subsidies and in the period 2003-2005, Croatian farmers (both organic and conventional) received about 60 per cent of the hypothetical subsidy levels. This practice makes potential organic farmers less enthusiastic about conversion, which bears some additional costs, notably those related to inspection and certification.
The current administrative and legal system in Croatia allows regional authorities (Counties) to introduce their own subsidy programmes for agriculture and rural development. Therefore, farmers in some counties, beside the subsidies issued by Ministry of Agriculture, Forestry and Water Management, also receive subsidies awarded by their regional authority. These subsidies differ from county to county and are in the range between 150 and 700 EUR per hectare, depending on the crop. Besides, several counties are covering inspection and certification costs for organic farming. These are paid either to organic farmers or directly to inspection organisations.
Regional subsides
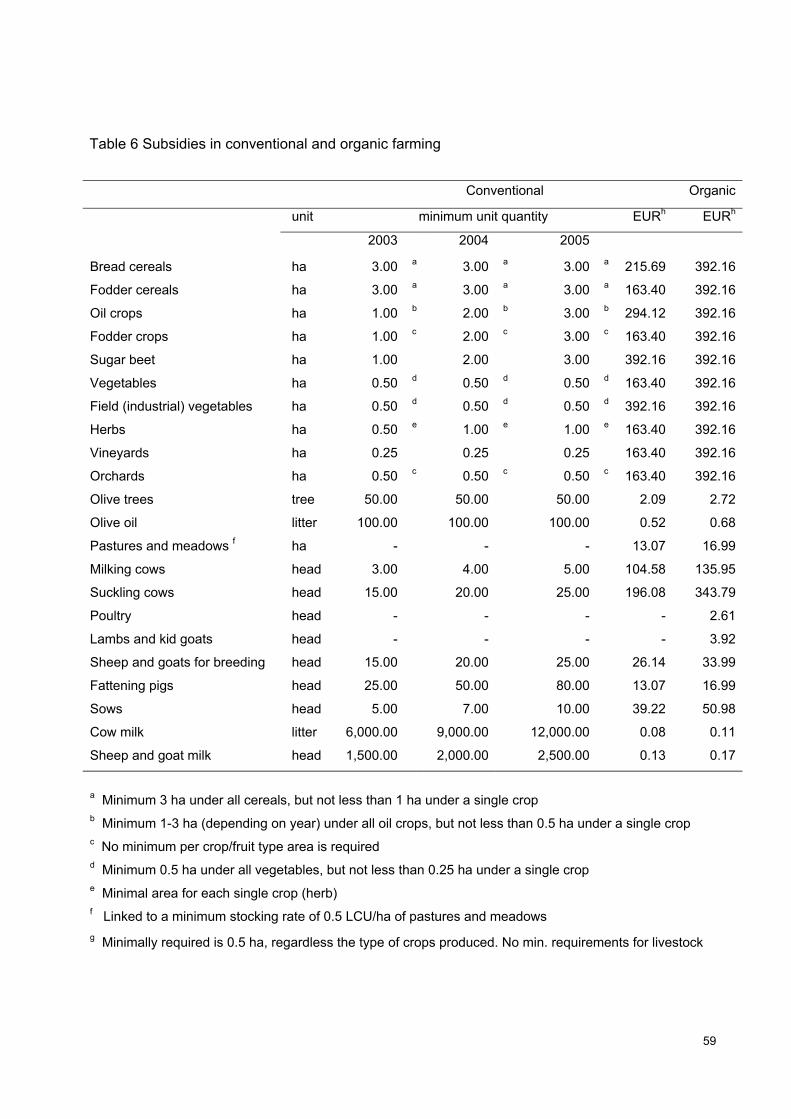
59
Table 6 Subsidies in conventional and organic farming
Conventional Organic
unit minimum unit quantity EURh EURh
2003 2004 2005
Bread cereals ha 3.00 a 3.00 a 3.00 a 215.69 392.16
Fodder cereals ha 3.00 a 3.00 a 3.00 a 163.40 392.16
Oil crops ha 1.00 b 2.00 b 3.00 b 294.12 392.16
Fodder crops ha 1.00 c 2.00 c 3.00 c 163.40 392.16
Sugar beet ha 1.00 2.00 3.00 392.16 392.16
Vegetables ha 0.50 d 0.50 d 0.50 d 163.40 392.16
Field (industrial) vegetables ha 0.50 d 0.50 d 0.50 d 392.16 392.16
Herbs ha 0.50 e 1.00 e 1.00 e 163.40 392.16
Vineyards ha 0.25 0.25 0.25 163.40 392.16
Orchards ha 0.50 c 0.50 c 0.50 c 163.40 392.16
Olive trees tree 50.00 50.00 50.00 2.09 2.72
Olive oil litter 100.00 100.00 100.00 0.52 0.68
Pastures and meadows f ha - - - 13.07 16.99
Milking cows head 3.00 4.00 5.00 104.58 135.95
Suckling cows head 15.00 20.00 25.00 196.08 343.79
Poultry head - - - - 2.61
Lambs and kid goats head - - - - 3.92
Sheep and goats for breeding head 15.00 20.00 25.00 26.14 33.99
Fattening pigs head 25.00 50.00 80.00 13.07 16.99
Sows head 5.00 7.00 10.00 39.22 50.98
Cow milk litter 6,000.00 9,000.00 12,000.00 0.08 0.11
Sheep and goat milk head 1,500.00 2,000.00 2,500.00 0.13 0.17
a Minimum 3 ha under all cereals, but not less than 1 ha under a single crop b Minimum 1-3 ha (depending on year) under all oil crops, but not less than 0.5 ha under a single crop c No minimum per crop/fruit type area is required d Minimum 0.5 ha under all vegetables, but not less than 0.25 ha under a single crop e Minimal area for each single crop (herb) f Linked to a minimum stocking rate of 0.5 LCU/ha of pastures and meadows g Minimally required is 0.5 ha, regardless the type of crops produced. No min. requirements for livestock
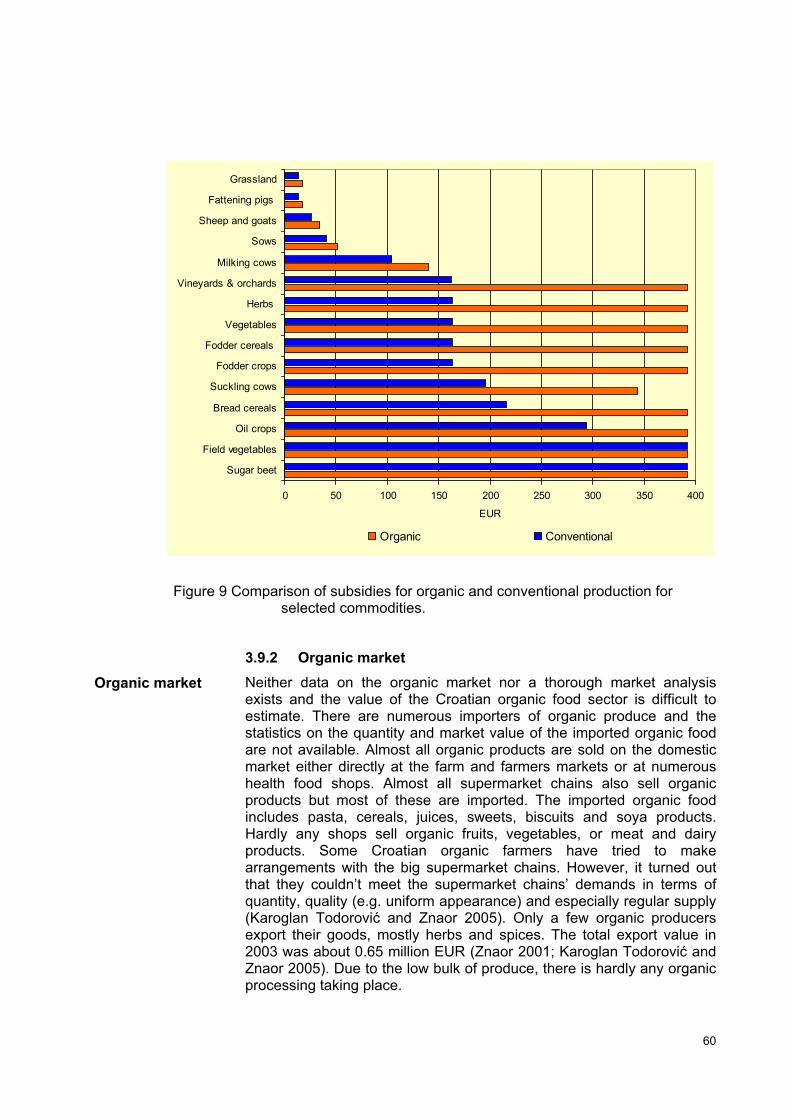
60
Figure 9 Comparison of subsidies for organic and conventional production for selected commodities.
3.9.2 Organic market Neither data on the organic market nor a thorough market analysis exists and the value of the Croatian organic food sector is difficult to estimate. There are numerous importers of organic produce and the statistics on the quantity and market value of the imported organic food are not available. Almost all organic products are sold on the domestic market either directly at the farm and farmers markets or at numerous health food shops. Almost all supermarket chains also sell organic products but most of these are imported. The imported organic food includes pasta, cereals, juices, sweets, biscuits and soya products. Hardly any shops sell organic fruits, vegetables, or meat and dairy products. Some Croatian organic farmers have tried to make arrangements with the big supermarket chains. However, it turned out that they couldn’t meet the supermarket chains’ demands in terms of quantity, quality (e.g. uniform appearance) and especially regular supply (Karoglan Todorović and Znaor 2005). Only a few organic producers export their goods, mostly herbs and spices. The total export value in 2003 was about 0.65 million EUR (Znaor 2001; Karoglan Todorović and Znaor 2005). Due to the low bulk of produce, there is hardly any organic processing taking place.
Organic market
0 50 100 150 200 250 300 350 400
Sugar beet
Field vegetables
Oil crops
Bread cereals
Suckling cows
Fodder crops
Fodder cereals
Vegetables
Herbs
Vineyards & orchards
Milking cows
Sows
Sheep and goats
Fattening pigs
Grassland
EUR
Organic Conventional
61
The price of Croatian organic food differs a lot, depending on the product, farmer, and season, as well as the supply and demand. Some organic products attract an extremely high premium price (e.g. organic products can be sold for a price that is > 150% higher than conventional ones). However, most organic products still seem to be sold as conventional, or obtain a 20-40% higher price than the conventional ones.
Consumer awareness on organic agriculture is still very weak and this point requires further attention. The link between organic agriculture and the environment/nature protection is missing too. Both the public and experts know very little about the fine links between society and agriculture. Health, fashion and ideological reasons, rather than nature and the environment are the driving forces for organic consumers (Znaor 2001; Karoglan Todorović and Znaor 2005). The current organic logo has never been promoted and is thus not well recognised by consumers.
Price
Consumers
62
4. GDP OF FARMING AND FULS
4.1. Croatian GDP
Croatian GDP is calculated by the Central Bureau of Statistics applying internationally accepted methodology used by the UN System of National Accounts - SNA 1993 and the European System of National Accounts (DZS 2003). The GDP in Croatia is expressed as the sum of the gross value added by all resident producers in the economy plus any product taxes and minus any subsidies not included in the value of the products (DZS 2003). According to the statistics, the average annual GDP in the period 2001-2003 was 24.18 billion EUR or 5.451 EUR per capita (DZS 2004).
Agriculture represents an important component of the Croatian economy, accounting for 6.8% of and employing 5.5% of the labour force GDP (DZS 2003). Other sources indicate that the economic importance of agriculture is even higher, estimating that its gross value contributes around 10% to total GDP (EC 2004). A strategic development document produced by the Office of the President of the Republic of Croatia states that agriculture is “justifiably proclaimed as the most important economic sector in Croatia” (UPR 2000). According to the same document, agriculture is linked to the chemical, fertiliser and oil industries, production of veterinary drugs, transport, tourism, etc. Therefore, it is estimated that as much as 45 % of production in Croatia is linked to agriculture (UPR 2000).
4.2. Problems with calculation of the value added of Croatian farming
The official reports of DZS (2003; 2004) and MPŠVG (2003; 2003; 2004) do not specify the value added by Croatian agriculture. The value added reported under code A.01 of the national classification of economic activities (NCEA) includes forestry and hunting in addition to agriculture (farming). This aggregation makes it impossible to determine the value added by farming alone. Another problem is that the present figures on value added from the agricultural sector (including forestry and hunting) seem to bear little resemblance to reality due to the following reasons:
1. Intermediate consumption is based on very old figures. The intermediate consumption in farming is calculated from the farm data on GMs and fixed costs. At present, none of the institutions in Croatia seems to have calculated the average national GMs for different crops and livestock production (Grgić 2005; Njavro 2005; Šutalo 2005; Žimbrek 2005). The Faculty of Agriculture of the University of Zagreb does have some GM calculations. However, these are made for specific (often large) agricultural enterprises (Grgić 2005; Njavro 2005) and thus do not reflect the national average. In determining the intermediate consumption of the agricultural sector (in order to calculate farming value added at the national level), DZS simply applies a 45 percent flat rate across the estimated overall farming output (Kiš 2005). The 45 percent rate is extrapolated from the data obtained from a survey made more than fifteen years ago, still during
GDP definition and size
GVA from agriculture
Unreliable value added from farming
63
the state-planned economy of the former Yugoslavia (Jurišić 2005; Šutalo 2005). Needless to say, these figures require an update and such an approach is most likely to result in unreliable data, especially if one bears in mind that the prices of a number of agricultural inputs of the centrally planned economy were heavily subsidised.
2. Farming value added is calculated from the non-existent agricultural area of 3.15 million hectares, instead of the current 1.08 million hectares actually used for farming according to the agricultural census (DZS 2003).
3. Family farms are not obliged to do bookkeeping. A vast majority of family farms in Croatia are not registered as business entities. Instead, these are just inscribed in the Farm Register of the MPŠVG and as such are not subject to compulsory bookkeeping. Therefore no authority in Croatia has a sound overview of the financial performance of family farms. Consequently, the value added they create remains unknown! Exceptions are agricultural operations that are registered as companies. These are, like any other legal entity in Croatia- subject to fiscal and financial inspection and thus required to do the bookkeeping and to submit financial reports to FINA.
4. Reported value added from farming includes various non-farming activities. A number of big companies listed under NCEA A.01 are, besides primary agricultural production (farming), involved in several other economic activities, notably food processing, wholesale and retail (of all kinds of commodities), tourism, etc. Although farming makes up just a part of their business, their entire income and expenditure is reported under NCEA code 01. In other words, these companies are formally (de iure) registered under NCEA code A.01, but in practice (de facto), their value added is created through a variety of economic activities, of which farming is sometimes just a minor part (Šutalo 2005; Viduka 2005). This situation has some historical roots. Most of these “mixed” companies are former agricultural-cooperatives. They’ve in the meantime undergone a major re-structuring and business re-orientation, but decided to keep the old company name (e.g. because of the good image among customers, brands, etc.) and the registration number belonging to NCEA code A.01.
A further problem with the current Croatian calculation of value-added from farming is that it doesn’t make adjustments for the economic categories required by the EU methodology on economic accounts for agriculture (EC 2004; EUROSTAT 2004) to be taken into account, such as:
Losses: field, harvesting and other losses occurring on farms due to the perishable nature of the products, weather influences, such as frost, drought, etc. Initial stocks: finished or semi-finished stocks of products existing at the beginning of the reference year. Intra-unit consumption: goods subjected to treatment and processing and their by-products which are sold by one agricultural unit to other units (e.g. animal feed, organic manure, seeds, wine grapes and olives used for processing, etc.).
Not in tune with the EU methodology
64
Processing by producers: quantities produced for further processing (e.g. milk processed to make butter or cheese, apples processed to make apple must or cider, etc. Own final consumption: products consumed by the farmers’ households which produced them and products stemming from the agricultural unit (holding) and used for payment in kind in the form of remuneration paid to holding workers or exchanged for other goods. Own-account produced fixed capital goods: these include work done (e.g. use of labour, machines and other means of production) for the own-account establishment of plantations and animals transferred to the account of fixed capital. Final stocks: stocks of finished products or work-in-progress and at the end of the reference year. Change in stocks: change in stocks during the reference year.
The above-mentioned shortcomings and inaccuracy regarding the present methodology employed to calculate value added from Croatian agriculture is recognised by the key institutions concerned and involved in measuring the farm business size in Croatia: DZS (Šutalo 2004; Crnogorac 2005; Kiš 2005; Šutalo 2005), MPŠVG (Jurišić 2005), HGK (Gelo 2005) and AF (Franić 2005; Grgić 2005; Njavro 2005; Žimbrek 2005). However, various limitations related to the institutional settings of these institutions and above all the lack of political interest in reliable statistics seems to have prevented more accurate calculation so far.
4.3. Methodology
For the purpose of this study, the contribution to national added value has been calculated for the farming sector, as well as for the linked farm-upstream economic activities. The methodology applied involves three steps:
1. Selection of relevant economic activities according to NCEA 2. Quantification of agricultural inputs and outputs 3. Calculation of value added by farming and FULS
4.4. Selection of relevant economic activities
All Croatian business entities (organisations) are assigned a code from the NCEA list. This code shows the nature of organisation’s business and is determined on the basis of its predominant economic activity. A selection of economic activities that are believed to be linked with farming and farm-upstream goods and services is made from the official Croatian NCEA list (N.N. 2003).
4.5. Value added from farming sector
As the official figures of added value from the Croatian farming sector are not reliable, this had to be calculated from scratch. In order to be able to perform this calculation it was necessary to estimate the agricultural output, intermediate consumption and fixed costs. The gross value added of Croatian farming was calculated by subtracting
Problem is recognised
Calculation method for this study
NCEA
Calculation from the scratch
65
agricultural output from intermediate consumption as laid down in the EUROSTAT methodology on economic accounts for agriculture (2004). The calculation presented in this study concerns only the primary agricultural production of crops and livestock. Processing of agricultural commodities, as well as any other economic activities of agricultural holdings (e.g. tourism) is not taken into account as they are beyond the study’s research boundaries. The agricultural output (revenue) basically depends on yields, prices of agricultural commodities and subsidies received. The average 2001-2003 yields per unit (hectare or livestock head) are calculated from the DZS annual agricultural reports (2002; 2003; 2004). The TISUP database (TISUP 2005) and the Croatian extension service (Mikšić, Murguić et al. 2004) were used to determine the average price per commodity, while the amount of subsidies paid for each commodity is taken from MPŠVG annual reports (MPŠ 2003; MPŠVG 2004). The output is calculated by multiplying the average yield per crop or livestock unit with an average price and by adding the amount of subsidies received on the top. While the crop output can be calculated straight because each crop gives only one product, this is not the case with livestock. The meat output is calculated according to the standard DZS methodology (DZS 2004), by adding the market surplus (the difference in selling and buying) to the weight of the slaughtered livestock and the difference in the herd weight (difference between last and this year’s herd weight). The milk sale revenue includes revenue from milk, factory premium (subsidy of 15 l for cow milk), meat value (replacement rate of 12% per cow is applied) and the value of the born animals. The value of the offspring animal is again included as intermediate cost in the meat production. The agricultural area and the number of livestock is considered to be a constant for the period 2001-2003 and is taken from the agricultural census (DZS 2003). In the calculation, both crops and animals are sorted according to the EUROSTAT Cronos codes (EUROSTAT 2004).
4.5.1 Intermediate consumption Intermediate consumption represents the value of all used or transformed goods and services employed as inputs in the production process (DZS 2003), excluding fixed assets whose consumption is recorded as fixed capital consumption (EUROSTAT 2004). According to the EUROSTAT methodology (2004) intermediate consumption in farming consists of the following cost categories: • Seeds and planting stocks • Energy and lubricants • Fertilisers and soil improvers • Plant protection products and pesticides • Veterinary expenses • Animal feedstuffs • Agricultural services • Maintenance of materials • Maintenance of buildings • Other goods and services.
Output depends on yields, prices and subsidies
Goods and services used in production
66
We were able to allocate most of these costs per each crop and animal type. However, the exceptions are the last three intermediate costs: maintenance of materials, maintenance of buildings and other goods and services. The last one is particularly difficult to determine as it includes:
• Rental paid for use of non-residential buildings and other capital assets
• Fees for workers medical examination • Fees for agricultural consultants, surveyors, accountants, tax
consultants and lawyers • Purchases of services of scientific research, market research and
advertising, expenditure on staff training and similar services; • Postal and telecommunications costs; • Remuneration for services contained in gross premiums of insurance • Expenditure of (certain) transport services • Stud fees • Billed bank charges • Subscriptions and fees for membership of professional associations • Subscriptions to agricultural co-operatives; • Costs of dairy tests, shows and entries in pedigree registers; • Expenditure on artificial insemination and castration • Payments for the use of non-produced intangible assets such as
patented assets, trade marks, copyright, milk quotas or other production rights, etc.
• Payments made to public bodies for the purpose of obtaining licences or permits to carry out commercial or professional activities
• Purchases of small tools, working clothing, spare parts and durable equipment of low value
• Purchases of tools, equipment and working clothing
The three excluded intermediate cost categories are largely fixed costs and as such cannot be allocated to the production of any particular crop or animal. Their magnitude is extremely difficult to assess, because they are not recorded in Croatia. We have therefore assigned for these costs a flat rate of 50 EUR per month per farm, resulting in a total cost of 269.94 MEUR. This estimate is based on the assumption that each of 448,532 agricultural households and 1,364 agricultural companies in Croatia (DZS 2003) has average fixed costs of 50 EUR per month. This is a conservative estimate because it is the equivalent of two pairs of rubber boots, for instance.
The average yields in Croatia are substantially lower than those taken in the gross margin calculations of the extension service (HZPSS 2003; Mikšić, Murguić et al. 2004). We believe that one of the reasons for the lower yields is also due to the use of lower quality, cheaper seeds. Therefore we applied a 40 percent lower cost for seeds than calculated by the extension service. This hypothesis was also reinforced through discussion with some commercially-oriented farmers (Sever 2005).
Fix costs
Seeds
67
The cost of energy is estimated from the national energy balance (Vuk 2005), the price of agricultural diesel (N.N. 2002) and the per crop use from the extension service data (HZPSS 2003; Mikšić, Murguić et al. 2004; Čuljak 2005). It is basically fuel use and the cost we applied is about 60 percent on average of those used in the extension service GM calculations (Mikšić, Murguić et al. 2004).
The fertiliser consumption is calculated from the production, import and export data provided by DZS (DZS 2005) for the period 2001-2003. Additional data were provided by Petrokemija (Piršić 2004; Klopček 2005; Mesarić 2005; Piršić 2005) and the final calculation has been checked with Petrokemija too (Piršić 2004; Piršić 2005). The fertiliser price is derived from the extension service data (HZPSS 2003; Mikšić, Murguić et al. 2004) and TISUP database (TISUP 2005). The data obtained on the average fertiliser consumption at the national level (quantity and value) were then compared with those derived by multiplying the extension service recommended fertiliser quantities per crop (HZPSS 2003; Mikšić, Murguić et al. 2004) with the area of each crop - determined by adjusting the DZS cropping pattern (DZS 2002; DZS 2003; DZS 2004) with the UAA reported in the agricultural census (DZS 2003). The comparison between fertiliser quantities recommended by the extension service and the quantity actually consumed in the period 2001-2003 shows that in the period 2001-2003, Croatian farmers applied about 70 percent of the fertilisers recommended by the extension service (Table 15).
Calculated in terms of expenditure, it is about 64 percent of what is given as fertiliser costs in the standard extension service gross margin calculations (Mikšić, Murguić et al. 2004). We have therefore in our gross margin calculations for fertiliser cost applied on average only 60 percent of what is used for fertiliser costs in the extension service calculations.
Similarly to fertilisers, the quantity of pesticides consumed is calculated from the production, export and import balance, based on the data provided by DZS (2005) and MPŠVG (Ljubetić 2004). Pesticides consumed by the forestry sector and railways are deducted from the calculation according to the information provided by Croatian Forests (Hrvatske šume 2005) and Croatian Railways (Marinić 2005). The price of pesticides is derived from the extension service data (HZPSS 2003; Mikšić, Murguić et al. 2004). As with fertilisers, the data obtained on the average national pesticide consumption (quantity and value) are further compared with those derived by multiplying the extension service recommended per crop pesticide rates (HZPSS 2003; Mikšić, Murguić et al. 2004) with the area of each crop as reported in the agricultural census (DZS 2003). The comparison between the recommended and actually used pesticide quantity and their costs suggests that Croatian farmers have on average applied about 88 percent of what is indicated in the extension service gross margin calculations (Mikšić, Murguić et al. 2004). Consequently, our calculation of gross margin included only 88 per cent of the pesticide cost indicated by the extension service.
Energy
Fertilisers
Pesticides
68
The use of feedstuff is Croatia based on the figures provided by DZS (2005), HGK (Knjaz 2005) and Krmiva d.o.o, the biggest Croatian feedstuff producer (Weigant 2005), and (Grbeša 2005). On average a 50 per cent lower feedstuff intake is applied than the values used by the extension service.
The estimate of the quantity and value of the veterinary medicine on the Croatian market is based on the information provided by MPŠVG (Brstilo 2005) and the biggest Croatian producer of veterinary medicine, Veterina d.o.o. (Benko Tomić 2004; Benko Tomić 2005; Stilinović 2005). These figures suggest that the value of veterinary medicine used in Croatia is about 50 percent lower than the value assessed by the extension service. Consequently, we have applied a 50 per cent lower cost for veterinary medicine that used in the GM calculations of the extension service.
4.6. Value added from FULS
The gross value added of FULS identified per NCEA codes is not readily available in Croatia. This is because the GVA is calculated at the level of major economic activities (two-digit NCEA codes) but not for the levels lower than two-digit NCEA codes. However, as the economic actors in the FULS are registered legal entities, contrary to the family farms, these are obliged to do bookkeeping and regularly submit financial progress data to FINA. Detailed financial performance data of the identified NCEA codes were obtained from FINA (2005) and their gross value added (output minus intermediate consumption) was calculated following the methodology employed by DZS (Crnogorac 2005). Additional instructions and clarifications regarding the GVA calculation methodology and FINA’s revenue and expenditure codes (so-called AOP codes) were received by DZS (Crnogorac 2004; Šutalo 2004; Crnogorac 2005; Šutalo 2005) and FINA (Viduka 2005). Besides GVA, the number of employees (expressed as FTE) was also calculated from FINA data. Although (un)employment is basically an economic category (if there is enough money people can be employed), this category is often used to express the size of a business and to many laymen it is “the measure” of economy.
After having calculated the GVA of the selected economic activities, it was necessary to determine the GVA portion connected to Croatian farming and FULS. Namely, the GVA of most of the identified economic activities is only partially related to the Croatian market and its specific segment, farming and FULS. A substantial portion of the GVA of some businesses is generated from exports (e.g. the fertiliser industry) while some other sectors (e.g. energy supply and transport) for instance deliver only a minor portion of their goods and services to farming and FULS. Therefore the overall GVA of each of the identified economic sectors was first corrected for the portion relating to the Croatian market, using FINA data on the relevant revenue and expenditure costs linked to the domestic and export market. Assessing the percentage at which these correlate to farming and FULS made a further GVA adjustment. For instance, pesticide manufacturers, in addition to plant protection
Feeds
Veterinary medicine
GVA calculation method
GVA correction for export and portion linked only to farming and FULS
69
agents, also produce some non-agricultural chemicals (e.g. dyes) and building materials. The GVA generated by these activities is excluded from our calculation. In the case of fertiliser, pesticide, feedstuff and veterinary medicine manufacturers these estimates were obtained directly from the companies (Benko Tomić 2004; Ivanković 2004; Vujčić 2004; Mesarić 2005; Stilinović 2005; Weigant 2005) and corporate financial reports (Chromos Agro 2003; Herbos 2003; Petrokemija 2003). For other sectors the share of GVA associated with farming and FULS is calculated as indicated below.
Farming and FULS’ share in the extraction of gas and oil, as well as in the production, import, export and domestic consumption of electricity, gas, and various petroleum products is calculated from the national energy balance data (Vuk 2005; Vuk 2005). The share of these sectors in the national consumption of electricity, gas and petroleum products is taken as the percentage these sectors contribute to the GVA generated by the oil and gas extraction, manufacture of petroleum products and production and distribution of electrical energy.
From the data on t-km of road, marine, river and rail freight generated by agricultural inputs (seeds and breeding animals, fertilisers, pesticides, feedstuff and veterinary medicine), raw materials required for their production (raw phosphates, potassium salts, etc.), gas and petroleum products (DZS 2004; DZS 2005; HŽ 2005), we calculated t-km associated with farming and FULS. Their share in the total t-km of road, marine and rail freight is considered to be their share in the GVA of these sectors. The same approach has been applied to derive the share of farming and FULS of the Croatian ports. The air freight linked to farming and FULS is not considered because it is believed to be trivial – similar results have been found for the UK (Pretty, Ball et al. 2005). Besides, globally 50 percent of air-freight is carried in the belly of passenger planes (Garnett 2003) and this makes a sound calculation even more complicated.
This sector includes basically companies selling agri-chemical machinery and inputs, as well as the fuel consumed by agricultural vehicles and lorries transporting agricultural inputs. The list of wholesale companies dealing with agri-chemicals is derived from the HGK company database (HGK 2004), the list of authorised pesticide importers and distributors (HDBZ 2001; HDBZ 2004) and information provided by MPŠVG (Ljubetić 2004; Brstilo 2005) and business representatives (Černjul 2004; Ivanković 2004; Vujčić 2004; Weigant 2005). The share of these companies in the overall GVA calculated for their NCEA code is assessed by extrapolating the ratio between their revenue and the revenue of their NCEA code. We assume that their share in the overall GVA of the group is the same as their share in the overall group revenue. The GVA generated by the retail companies selling agricultural inputs is based on the assumption on the number of companies/outlets selling them. The retail of these goods in Croatia is mostly organised through the network of the so-called agri-pharmacies. These are mostly small companies with 1-3 employees and only one, at most two outlets. According to the MPŠVG register, in 2002 there were six hundred and ninety agri-pharmacies in Croatia (Ljubetić 2004). However, according to Černjul (2004), only about four hundred of these
Energy
Transport sector
Wholesale and retail
70
seem to be active, while Maceljski (2005) estimates that there are about nine hundred outlets selling agri-chemical inputs in Croatia. However, Petrokemija estimates that the number of outlets selling fertilisers is much higher than those selling pesticides, because shops trading fertilisers do not have to meet legal conditions required for pesticide sale, suggesting that the number of these shops might be as high as ten thousand (Klopček 2005). Although there is no doubt that due to less stringent regulations, more shops sell fertilisers than pesticides, this estimate seems to be too high. Namely, according to FINA (2005), in the period 2001-2003 there were only 2,001 companies registered under code 52.11 (retail in non-specialised shops) and 2,531 companies registered under the code 52.12 (other retail in non-specialised shops), while under the code 52.48.7 (retail of other specialised goods) there were only 431 companies registered. The retail of agricultural inputs, tools and machinery can basically be registered only under one of these three codes. Some of the companies belonging to the code 52.48.7 are in particular supposed to be specialised in the retail of fertilisers. We have therefore estimated that about 1,200 companies are involved in the retail of agricultural inputs, tools and machinery, representing 24 percent of all retail companies registered under the three above-mentioned codes. Their share in the GVA of the economic activity group (NCEA code) they belong to is assumed to be proportional to their number.
Administration, research, education and advice organisations that are linked to Croatian agriculture have been identified from the recent key national reports on agriculture (MPŠ 2003; MPŠ 2003; VRH 2003; MPŠVG 2004). In the period 2001-2003 these organisations included: • The Ministry of Agriculture, Forestry and Fishery • Administrative structures in twenty one counties, a hundred and
twenty three cities and four hundred and twenty five municipalities • Fifteen research institutes and research stations • Three universities (two agricultural and one veterinary) and two
colleges • About fifteen private companies offering agricultural advice and
consultancy.
Most of these organisations are financed by public money. The GVA from those that are not financed by public money is calculated from the data provided by FINA (FINA 2005). However information on the financial performance of the organisations financed by public money is neither available at FINA (Viduka 2005; Žeželj 2005), nor can it be instantly accessed from the national treasury accounts (Karačić 2005). The GVA of these organisations is thus estimated by multiplying the number of their employees with the average estimated GVA per employee. The average number of employees is obtained from the HGK register (2004) or information obtained from direct telephone or E-mail contact with the administration departments of these organisations. Unlike for research, education and advisory organisations, the number of agriculture-related employees in the regional and local administration was particularly difficult to determine. Namely, only a few counties and municipalities have departments or sections for agriculture. In most cases these are integrated in the regional and local departments of economy. The City of Zagreb and Zagrebačka County have substantially
Administration, research, education and advice
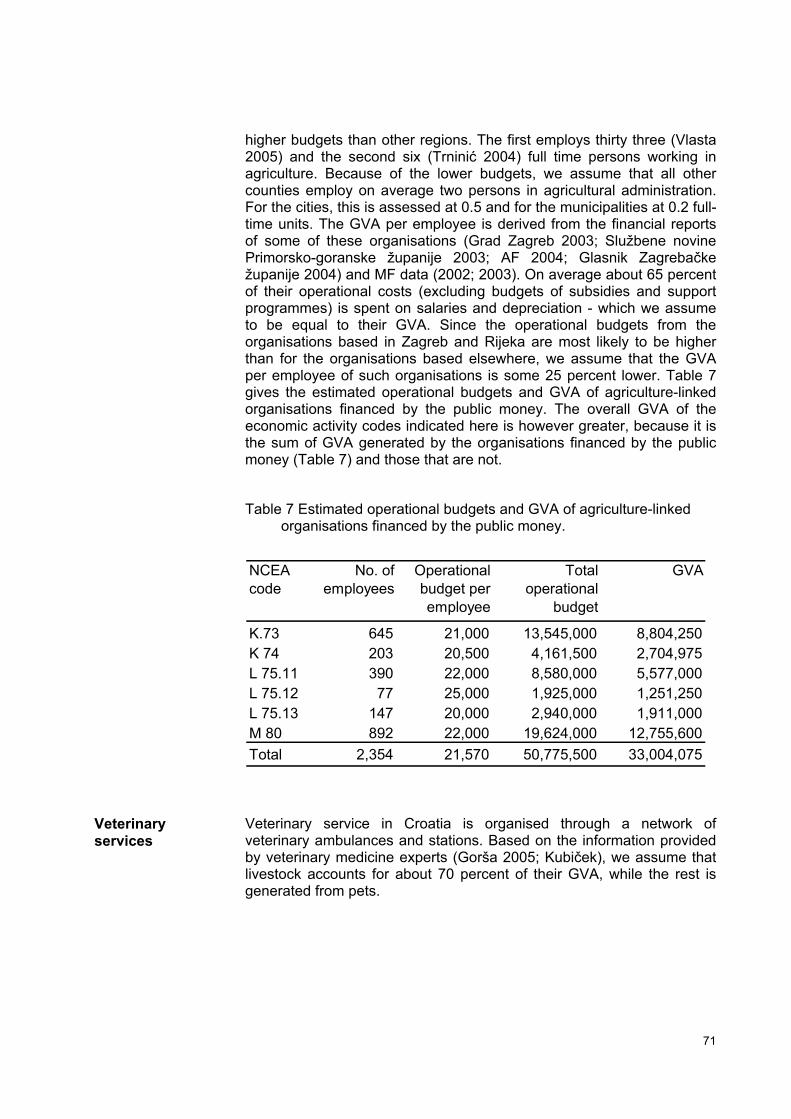
71
NCEA code
No. of employees
Operational budget per employee
Total operational
budget
GVA
K.73 645 21,000 13,545,000 8,804,250K 74 203 20,500 4,161,500 2,704,975L 75.11 390 22,000 8,580,000 5,577,000L 75.12 77 25,000 1,925,000 1,251,250L 75.13 147 20,000 2,940,000 1,911,000M 80 892 22,000 19,624,000 12,755,600Total 2,354 21,570 50,775,500 33,004,075
higher budgets than other regions. The first employs thirty three (Vlasta 2005) and the second six (Trninić 2004) full time persons working in agriculture. Because of the lower budgets, we assume that all other counties employ on average two persons in agricultural administration. For the cities, this is assessed at 0.5 and for the municipalities at 0.2 full-time units. The GVA per employee is derived from the financial reports of some of these organisations (Grad Zagreb 2003; Službene novine Primorsko-goranske županije 2003; AF 2004; Glasnik Zagrebačke županije 2004) and MF data (2002; 2003). On average about 65 percent of their operational costs (excluding budgets of subsidies and support programmes) is spent on salaries and depreciation - which we assume to be equal to their GVA. Since the operational budgets from the organisations based in Zagreb and Rijeka are most likely to be higher than for the organisations based elsewhere, we assume that the GVA per employee of such organisations is some 25 percent lower. Table 7 gives the estimated operational budgets and GVA of agriculture-linked organisations financed by the public money. The overall GVA of the economic activity codes indicated here is however greater, because it is the sum of GVA generated by the organisations financed by the public money (Table 7) and those that are not.
Table 7 Estimated operational budgets and GVA of agriculture-linked organisations financed by the public money.
Veterinary service in Croatia is organised through a network of veterinary ambulances and stations. Based on the information provided by veterinary medicine experts (Gorša 2005; Kubiček), we assume that livestock accounts for about 70 percent of their GVA, while the rest is generated from pets.
Veterinary services
72
4.7. Results
4.7.1 Economic activities selected according to NCEA Faming and farm-upstream economic activities considered to be relevant for the study are listed in Table 8. As well as farming, these include oil and gas extraction; manufacturing of farm inputs; energy supply; trade; transport and research, education, advisory, veterinary and administrative services. The list presented in Table 8 is certainly not exhaustive, but we believe it comprises nearly all economic activities that make farming possible. Some of these activities are entirely linked with farming (e.g. manufacture of agricultural inputs), while others deliver only a portion of their goods and services to farming and FULS (e.g. energy supply, transport and trade sector).
The agricultural inputs sector covers the manufacture of fertiliser, pesticides, veterinary medicine and agricultural machinery. All fertilisers in Croatia are produced by a sole fertiliser manufacturer- Petrokemija. Croatia has three herbicide producers: Herbos, Chromos and Veterina, while feedstuff is produced by about thirty, mostly small and medium companies. The veterinary medicine sector is dominated by Veterina, which supplies about 70 percent of all veterinary medicine sold on the Croatian market. Agricultural machinery is produced by Torpedo, Tomo Vinković and a few small companies.
The energy sector is completely under the control of two big companies. Oil and gas production, wholesale (and partly retail) is run by INA, a 75 per cent government-owned company. HEP, a 100 government-owned company produces and supplies all electricity in the country.
This sector is dominated by about thirty pesticide, and a few fertiliser, seeds and veterinary medicine wholesalers. Most of these companies are direct importers of agricultural inputs, while some combine trade of imported and domestically produced agricultural inputs. About a thousand small, mainly family-run companies run the retail of agricultural inputs, mostly in so-called “agri-pharmacies”.
NCEA codes
Agricultural inputs sector
Energy sector
Wholesale and retail
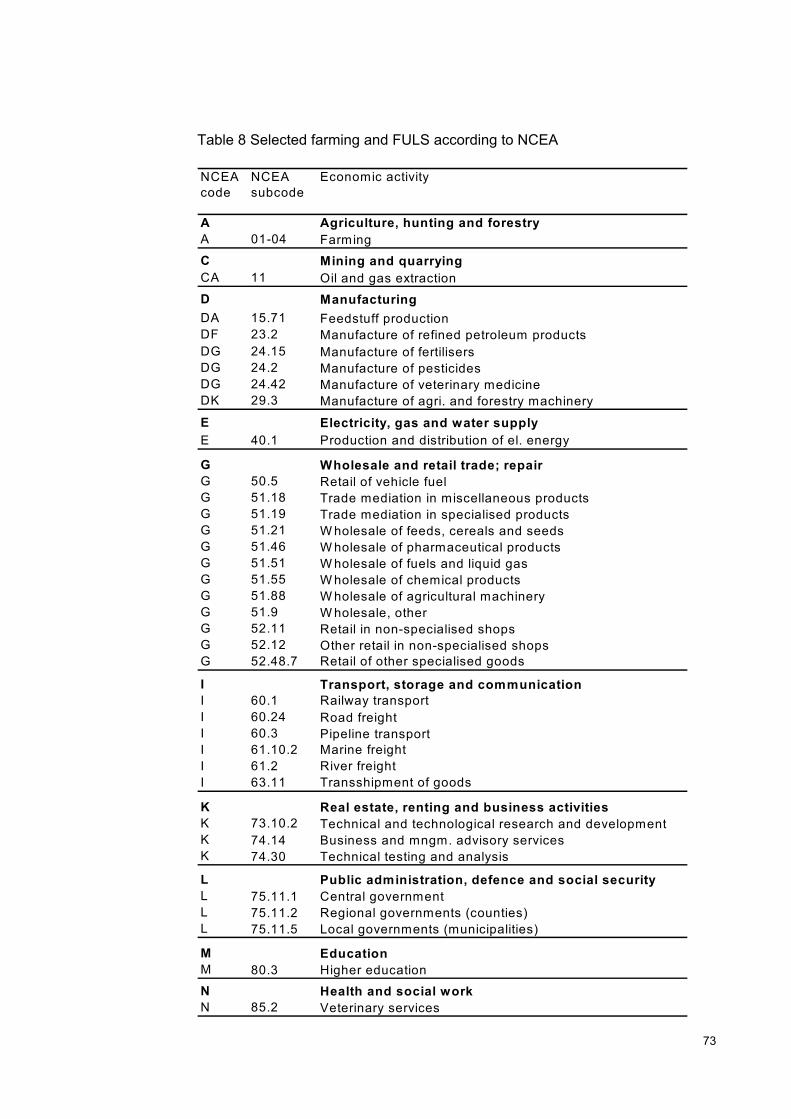
73
NCEA code
NCEA subcode
Economic activity
A Agriculture, hunting and forestryA 01-04 FarmingC Mining and quarryingCA 11 Oil and gas extractionD ManufacturingDA 15.71 Feedstuff productionDF 23.2 Manufacture of refined petroleum products DG 24.15 Manufacture of fertilisersDG 24.2 Manufacture of pesticidesDG 24.42 Manufacture of veterinary medicineDK 29.3 Manufacture of agri. and forestry machinery
E Electricity, gas and water supplyE 40.1 Production and distribution of el. energy
G Wholesale and retail trade; repairG 50.5 Retail of vehicle fuelG 51.18 Trade mediation in miscellaneous productsG 51.19 Trade mediation in specialised productsG 51.21 W holesale of feeds, cereals and seedsG 51.46 W holesale of pharmaceutical productsG 51.51 W holesale of fuels and liquid gasG 51.55 W holesale of chemical productsG 51.88 W holesale of agricultural machineryG 51.9 W holesale, otherG 52.11 Retail in non-specialised shopsG 52.12 Other retail in non-specialised shopsG 52.48.7 Retail of other specialised goods
I Transport, storage and communicationI 60.1 Railway transportI 60.24 Road freightI 60.3 Pipeline transportI 61.10.2 Marine freightI 61.2 River freightI 63.11 Transshipment of goods
K Real estate, renting and business activitiesK 73.10.2 Technical and technological research and developmentK 74.14 Business and mngm. advisory servicesK 74.30 Technical testing and analysis
L Public administration, defence and social securityL 75.11.1 Central governmentL 75.11.2 Regional governments (counties)L 75.11.5 Local governments (municipalities)
M EducationM 80.3 Higher educationN Health and social workN 85.2 Veterinary services
Table 8 Selected farming and FULS according to NCEA
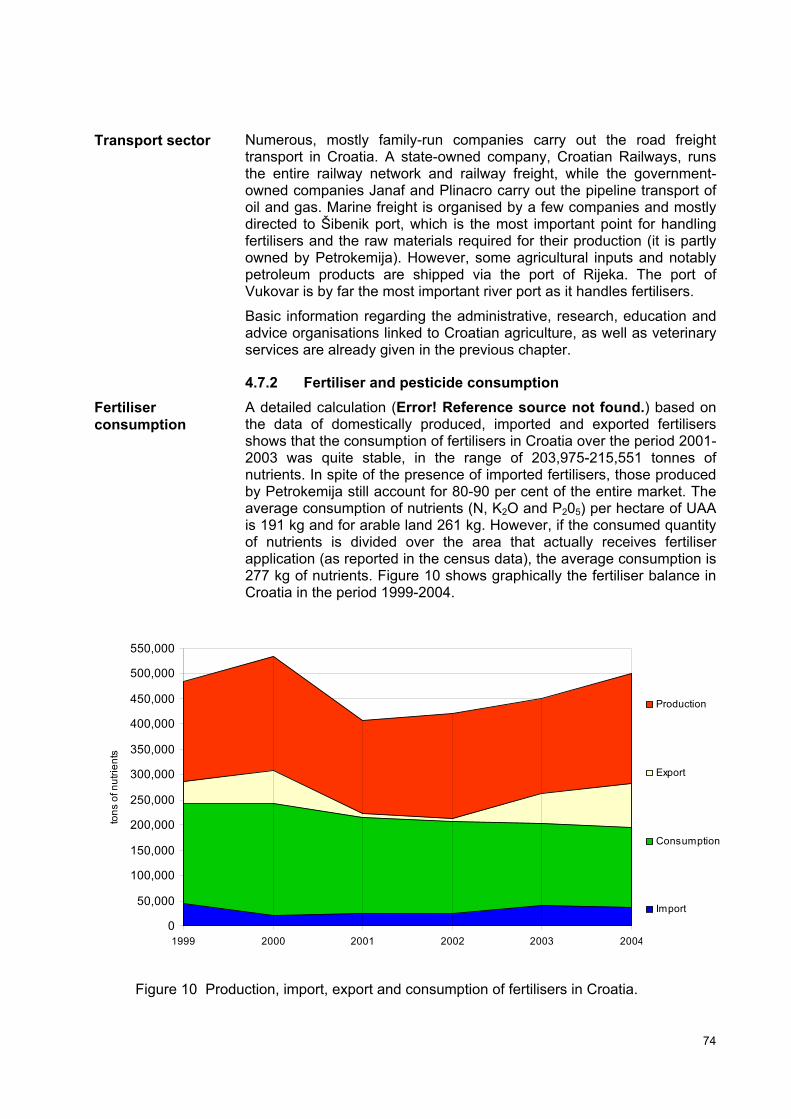
74
0
50,000
100,000
150,000
200,000
250,000
300,000
350,000
400,000
450,000
500,000
550,000
1999 2000 2001 2002 2003 2004
tons
of n
utrie
nts
Production
Export
Consumption
Import
Numerous, mostly family-run companies carry out the road freight transport in Croatia. A state-owned company, Croatian Railways, runs the entire railway network and railway freight, while the government-owned companies Janaf and Plinacro carry out the pipeline transport of oil and gas. Marine freight is organised by a few companies and mostly directed to Šibenik port, which is the most important point for handling fertilisers and the raw materials required for their production (it is partly owned by Petrokemija). However, some agricultural inputs and notably petroleum products are shipped via the port of Rijeka. The port of Vukovar is by far the most important river port as it handles fertilisers.
Basic information regarding the administrative, research, education and advice organisations linked to Croatian agriculture, as well as veterinary services are already given in the previous chapter.
4.7.2 Fertiliser and pesticide consumption A detailed calculation (Error! Reference source not found.) based on the data of domestically produced, imported and exported fertilisers shows that the consumption of fertilisers in Croatia over the period 2001-2003 was quite stable, in the range of 203,975-215,551 tonnes of nutrients. In spite of the presence of imported fertilisers, those produced by Petrokemija still account for 80-90 per cent of the entire market. The average consumption of nutrients (N, K2O and P205) per hectare of UAA is 191 kg and for arable land 261 kg. However, if the consumed quantity of nutrients is divided over the area that actually receives fertiliser application (as reported in the census data), the average consumption is 277 kg of nutrients. Figure 10 shows graphically the fertiliser balance in Croatia in the period 1999-2004.
Figure 10 Production, import, export and consumption of fertilisers in Croatia.
Transport sector
Fertiliser consumption
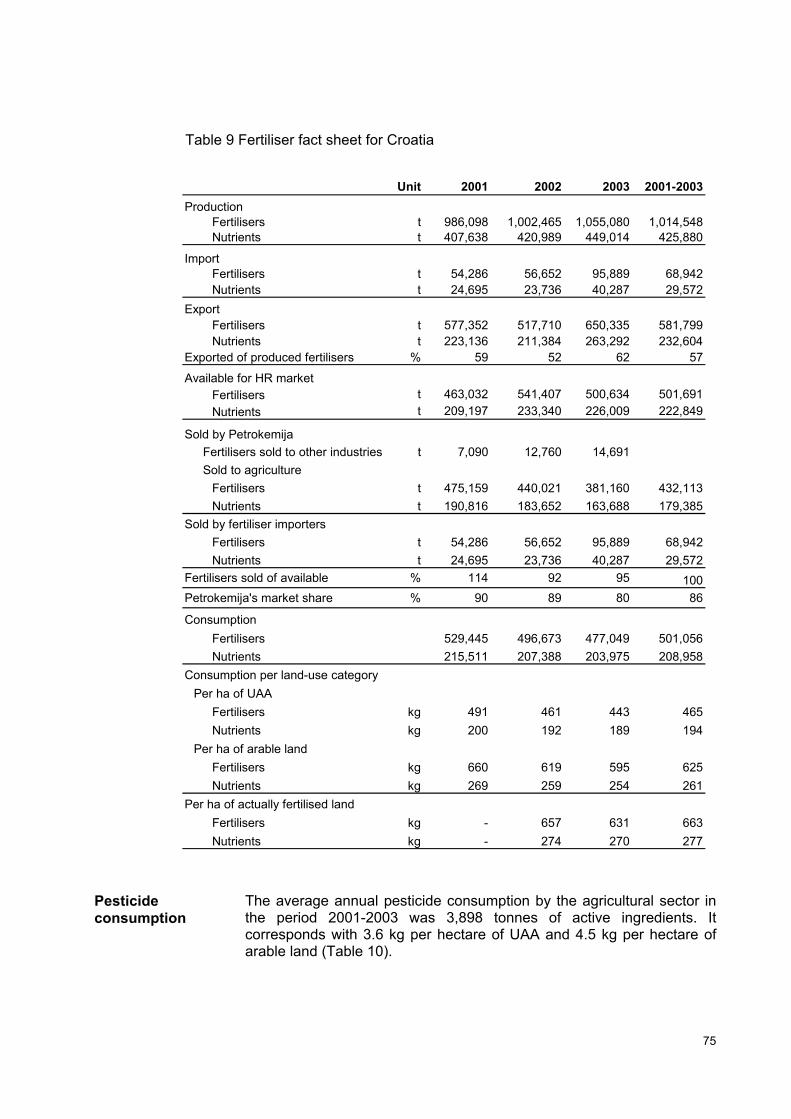
75
Unit 2001 2002 2003 2001-2003Production
Fertilisers t 986,098 1,002,465 1,055,080 1,014,548Nutrients t 407,638 420,989 449,014 425,880
ImportFertilisers t 54,286 56,652 95,889 68,942Nutrients t 24,695 23,736 40,287 29,572
ExportFertilisers t 577,352 517,710 650,335 581,799Nutrients t 223,136 211,384 263,292 232,604
Exported of produced fertilisers % 59 52 62 57
Available for HR marketFertilisers t 463,032 541,407 500,634 501,691Nutrients t 209,197 233,340 226,009 222,849
Sold by PetrokemijaFertilisers sold to other industries t 7,090 12,760 14,691Sold to agriculture
Fertilisers t 475,159 440,021 381,160 432,113Nutrients t 190,816 183,652 163,688 179,385
Sold by fertiliser importersFertilisers t 54,286 56,652 95,889 68,942Nutrients t 24,695 23,736 40,287 29,572
Fertilisers sold of available % 114 92 95 100Petrokemija's market share % 90 89 80 86
ConsumptionFertilisers 529,445 496,673 477,049 501,056Nutrients 215,511 207,388 203,975 208,958
Consumption per land-use categoryPer ha of UAA
Fertilisers kg 491 461 443 465Nutrients kg 200 192 189 194
Per ha of arable landFertilisers kg 660 619 595 625Nutrients kg 269 259 254 261
Per ha of actually fertilised landFertilisers kg - 657 631 663Nutrients kg - 274 270 277
Table 9 Fertiliser fact sheet for Croatia
The average annual pesticide consumption by the agricultural sector in the period 2001-2003 was 3,898 tonnes of active ingredients. It corresponds with 3.6 kg per hectare of UAA and 4.5 kg per hectare of arable land (Table 10).
Pesticide consumption
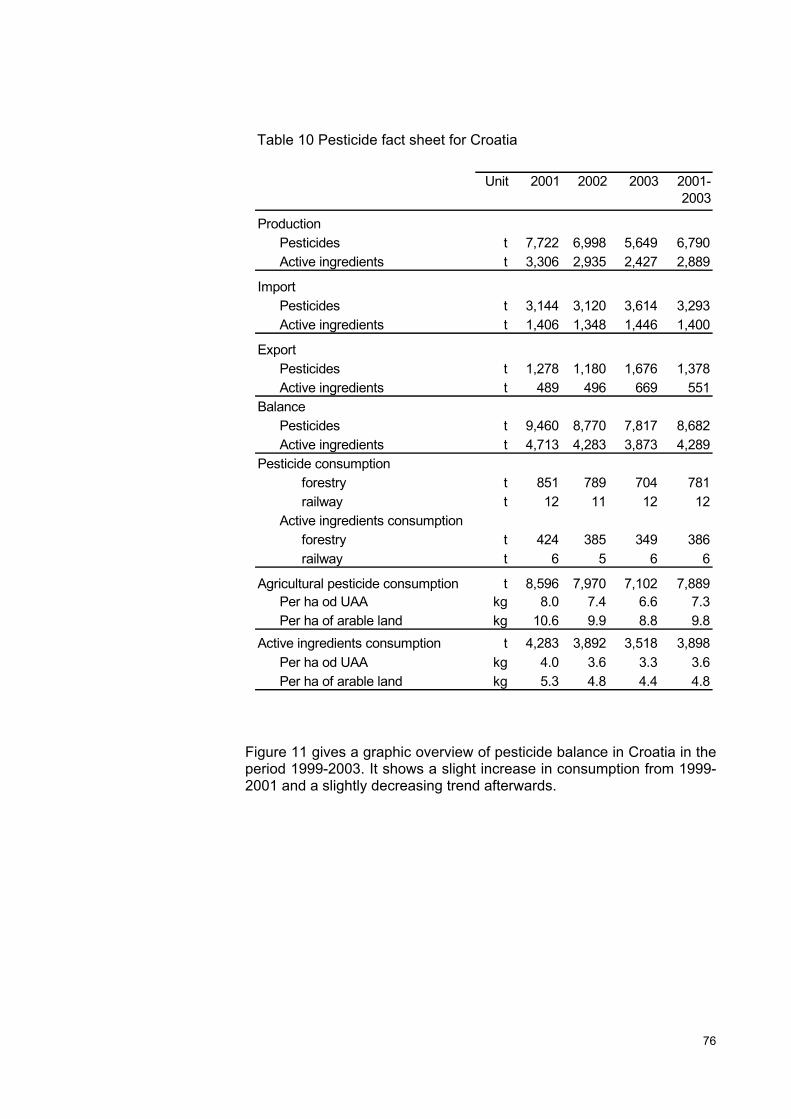
76
Unit 2001 2002 2003 2001-2003
ProductionPesticides t 7,722 6,998 5,649 6,790Active ingredients t 3,306 2,935 2,427 2,889
ImportPesticides t 3,144 3,120 3,614 3,293Active ingredients t 1,406 1,348 1,446 1,400
ExportPesticides t 1,278 1,180 1,676 1,378Active ingredients t 489 496 669 551
BalancePesticides t 9,460 8,770 7,817 8,682Active ingredients t 4,713 4,283 3,873 4,289
Pesticide consumptionforestry t 851 789 704 781railway t 12 11 12 12
Active ingredients consumptionforestry t 424 385 349 386railway t 6 5 6 6
Agricultural pesticide consumption t 8,596 7,970 7,102 7,889Per ha od UAA kg 8.0 7.4 6.6 7.3Per ha of arable land kg 10.6 9.9 8.8 9.8
Active ingredients consumption t 4,283 3,892 3,518 3,898Per ha od UAA kg 4.0 3.6 3.3 3.6Per ha of arable land kg 5.3 4.8 4.4 4.8
Table 10 Pesticide fact sheet for Croatia
Figure 11 gives a graphic overview of pesticide balance in Croatia in the period 1999-2003. It shows a slight increase in consumption from 1999-2001 and a slightly decreasing trend afterwards.
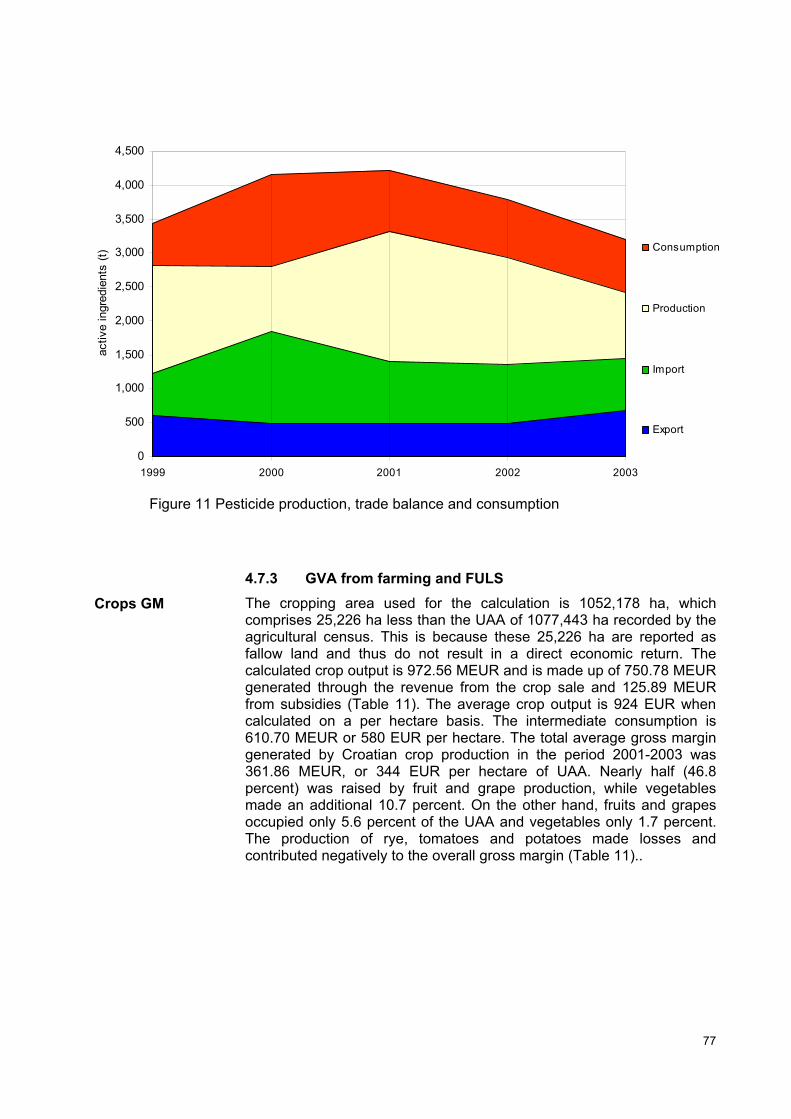
77
0
500
1,000
1,500
2,000
2,500
3,000
3,500
4,000
4,500
1999 2000 2001 2002 2003
activ
e in
gred
ient
s (t)
Consumption
Production
Import
Export
Figure 11 Pesticide production, trade balance and consumption
4.7.3 GVA from farming and FULS The cropping area used for the calculation is 1052,178 ha, which comprises 25,226 ha less than the UAA of 1077,443 ha recorded by the agricultural census. This is because these 25,226 ha are reported as fallow land and thus do not result in a direct economic return. The calculated crop output is 972.56 MEUR and is made up of 750.78 MEUR generated through the revenue from the crop sale and 125.89 MEUR from subsidies (Table 11). The average crop output is 924 EUR when calculated on a per hectare basis. The intermediate consumption is 610.70 MEUR or 580 EUR per hectare. The total average gross margin generated by Croatian crop production in the period 2001-2003 was 361.86 MEUR, or 344 EUR per hectare of UAA. Nearly half (46.8 percent) was raised by fruit and grape production, while vegetables made an additional 10.7 percent. On the other hand, fruits and grapes occupied only 5.6 percent of the UAA and vegetables only 1.7 percent. The production of rye, tomatoes and potatoes made losses and contributed negatively to the overall gross margin (Table 11)..
Crops GM
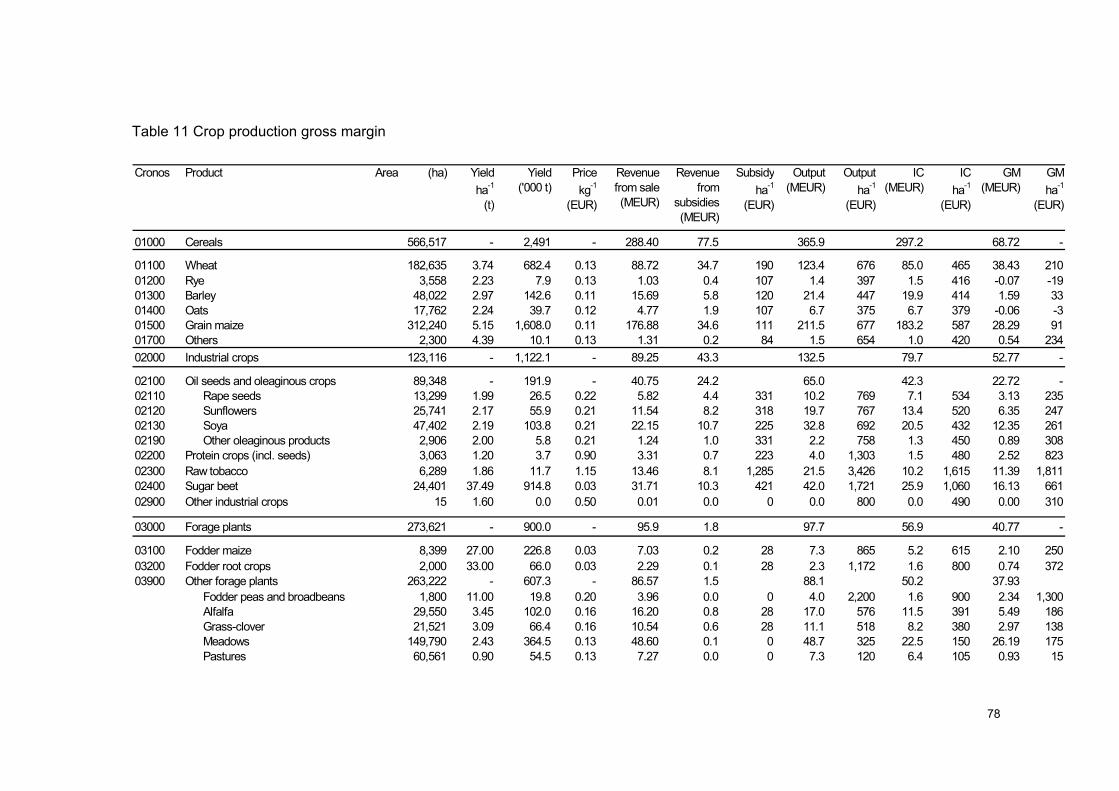
78
Cronos Product Area (ha) Yield ha-1
(t)
Yield ('000 t)
Price kg-1
(EUR)
Revenue from sale (MEUR)
Revenue from
subsidies (MEUR)
Subsidy ha-1
(EUR)
Output (MEUR)
Output ha-1
(EUR)
IC (MEUR)
IC ha-1
(EUR)
GM (MEUR)
GM ha-1
(EUR)
01000 Cereals 566,517 - 2,491 - 288.40 77.5 365.9 297.2 68.72 -
01100 Wheat 182,635 3.74 682.4 0.13 88.72 34.7 190 123.4 676 85.0 465 38.43 21001200 Rye 3,558 2.23 7.9 0.13 1.03 0.4 107 1.4 397 1.5 416 -0.07 -1901300 Barley 48,022 2.97 142.6 0.11 15.69 5.8 120 21.4 447 19.9 414 1.59 3301400 Oats 17,762 2.24 39.7 0.12 4.77 1.9 107 6.7 375 6.7 379 -0.06 -301500 Grain maize 312,240 5.15 1,608.0 0.11 176.88 34.6 111 211.5 677 183.2 587 28.29 9101700 Others 2,300 4.39 10.1 0.13 1.31 0.2 84 1.5 654 1.0 420 0.54 23402000 Industrial crops 123,116 - 1,122.1 - 89.25 43.3 132.5 79.7 52.77 -
02100 Oil seeds and oleaginous crops 89,348 - 191.9 - 40.75 24.2 65.0 42.3 22.72 -02110 Rape seeds 13,299 1.99 26.5 0.22 5.82 4.4 331 10.2 769 7.1 534 3.13 23502120 Sunflowers 25,741 2.17 55.9 0.21 11.54 8.2 318 19.7 767 13.4 520 6.35 24702130 Soya 47,402 2.19 103.8 0.21 22.15 10.7 225 32.8 692 20.5 432 12.35 26102190 Other oleaginous products 2,906 2.00 5.8 0.21 1.24 1.0 331 2.2 758 1.3 450 0.89 30802200 Protein crops (incl. seeds) 3,063 1.20 3.7 0.90 3.31 0.7 223 4.0 1,303 1.5 480 2.52 82302300 Raw tobacco 6,289 1.86 11.7 1.15 13.46 8.1 1,285 21.5 3,426 10.2 1,615 11.39 1,81102400 Sugar beet 24,401 37.49 914.8 0.03 31.71 10.3 421 42.0 1,721 25.9 1,060 16.13 66102900 Other industrial crops 15 1.60 0.0 0.50 0.01 0.0 0 0.0 800 0.0 490 0.00 310
03000 Forage plants 273,621 - 900.0 - 95.9 1.8 97.7 56.9 40.77 -
03100 Fodder maize 8,399 27.00 226.8 0.03 7.03 0.2 28 7.3 865 5.2 615 2.10 25003200 Fodder root crops 2,000 33.00 66.0 0.03 2.29 0.1 28 2.3 1,172 1.6 800 0.74 37203900 Other forage plants 263,222 - 607.3 - 86.57 1.5 88.1 50.2 37.93
Fodder peas and broadbeans 1,800 11.00 19.8 0.20 3.96 0.0 0 4.0 2,200 1.6 900 2.34 1,300Alfalfa 29,550 3.45 102.0 0.16 16.20 0.8 28 17.0 576 11.5 391 5.49 186Grass-clover 21,521 3.09 66.4 0.16 10.54 0.6 28 11.1 518 8.2 380 2.97 138Meadows 149,790 2.43 364.5 0.13 48.60 0.1 0 48.7 325 22.5 150 26.19 175Pastures 60,561 0.90 54.5 0.13 7.27 0.0 0 7.3 120 6.4 105 0.93 15
Table 11 Crop production gross margin
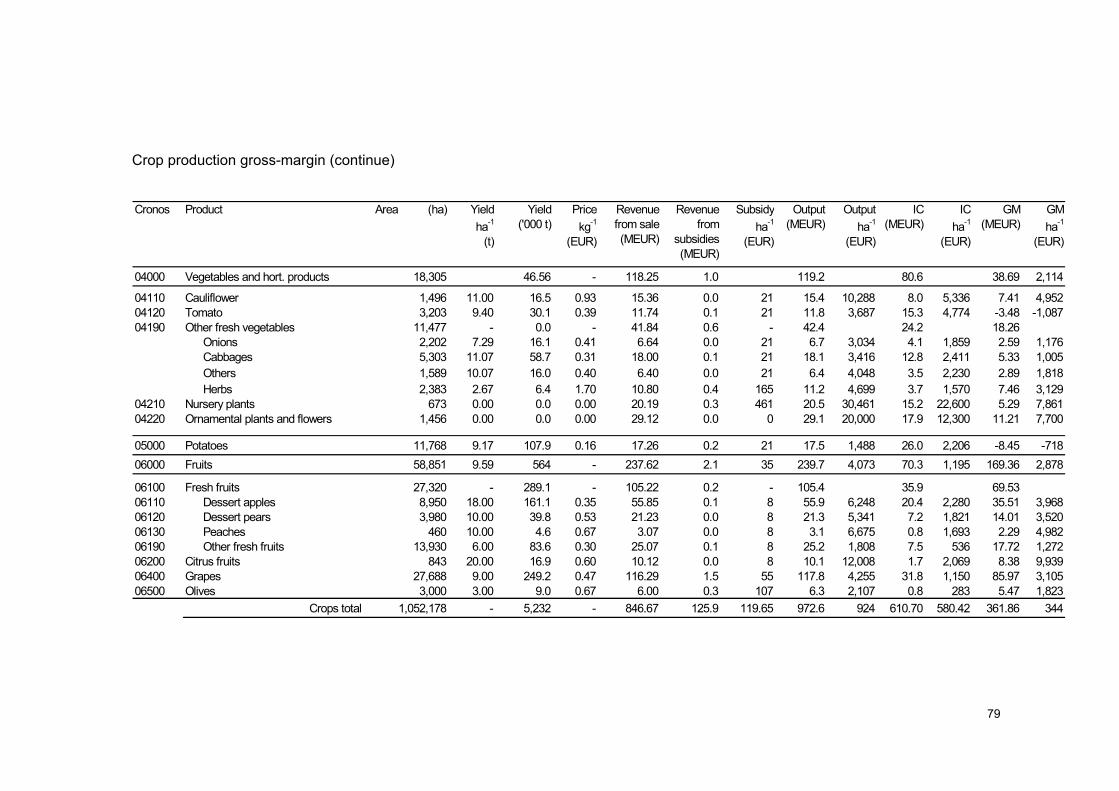
79
Cronos Product Area (ha) Yield ha-1
(t)
Yield ('000 t)
Price kg-1
(EUR)
Revenue from sale (MEUR)
Revenue from
subsidies (MEUR)
Subsidy ha-1
(EUR)
Output (MEUR)
Output ha-1
(EUR)
IC (MEUR)
IC ha-1
(EUR)
GM (MEUR)
GM ha-1
(EUR)
04000 Vegetables and hort. products 18,305 46.56 - 118.25 1.0 119.2 80.6 38.69 2,114
04110 Cauliflower 1,496 11.00 16.5 0.93 15.36 0.0 21 15.4 10,288 8.0 5,336 7.41 4,95204120 Tomato 3,203 9.40 30.1 0.39 11.74 0.1 21 11.8 3,687 15.3 4,774 -3.48 -1,08704190 Other fresh vegetables 11,477 - 0.0 - 41.84 0.6 - 42.4 24.2 18.26
Onions 2,202 7.29 16.1 0.41 6.64 0.0 21 6.7 3,034 4.1 1,859 2.59 1,176Cabbages 5,303 11.07 58.7 0.31 18.00 0.1 21 18.1 3,416 12.8 2,411 5.33 1,005Others 1,589 10.07 16.0 0.40 6.40 0.0 21 6.4 4,048 3.5 2,230 2.89 1,818Herbs 2,383 2.67 6.4 1.70 10.80 0.4 165 11.2 4,699 3.7 1,570 7.46 3,129
04210 Nursery plants 673 0.00 0.0 0.00 20.19 0.3 461 20.5 30,461 15.2 22,600 5.29 7,86104220 Ornamental plants and flowers 1,456 0.00 0.0 0.00 29.12 0.0 0 29.1 20,000 17.9 12,300 11.21 7,700
05000 Potatoes 11,768 9.17 107.9 0.16 17.26 0.2 21 17.5 1,488 26.0 2,206 -8.45 -71806000 Fruits 58,851 9.59 564 - 237.62 2.1 35 239.7 4,073 70.3 1,195 169.36 2,878
06100 Fresh fruits 27,320 - 289.1 - 105.22 0.2 - 105.4 35.9 69.5306110 Dessert apples 8,950 18.00 161.1 0.35 55.85 0.1 8 55.9 6,248 20.4 2,280 35.51 3,96806120 Dessert pears 3,980 10.00 39.8 0.53 21.23 0.0 8 21.3 5,341 7.2 1,821 14.01 3,52006130 Peaches 460 10.00 4.6 0.67 3.07 0.0 8 3.1 6,675 0.8 1,693 2.29 4,98206190 Other fresh fruits 13,930 6.00 83.6 0.30 25.07 0.1 8 25.2 1,808 7.5 536 17.72 1,27206200 Citrus fruits 843 20.00 16.9 0.60 10.12 0.0 8 10.1 12,008 1.7 2,069 8.38 9,93906400 Grapes 27,688 9.00 249.2 0.47 116.29 1.5 55 117.8 4,255 31.8 1,150 85.97 3,10506500 Olives 3,000 3.00 9.0 0.67 6.00 0.3 107 6.3 2,107 0.8 283 5.47 1,823
Crops total 1,052,178 - 5,232 - 846.67 125.9 119.65 972.6 924 610.70 580.42 361.86 344
Crop production gross-margin (continue)
80
The livestock output is 1,300.55 MEUR and is made up of 1,208.35 MEUR sale revenue and 92.20 MEUR from the received subsidies (
Table 12). The intermediate consumption is 998.96 MEUR and the gross margin is 301.59 MEUR. Exclusion of the value of newly-born animals from the milk sale revenue would result in a negative gross margin for milk production. However, as the value of these newly-born animals is again taken as an input (intermediate cost) in meat production, in the case of cattle this induced a negative gross margin.
Livestock GM
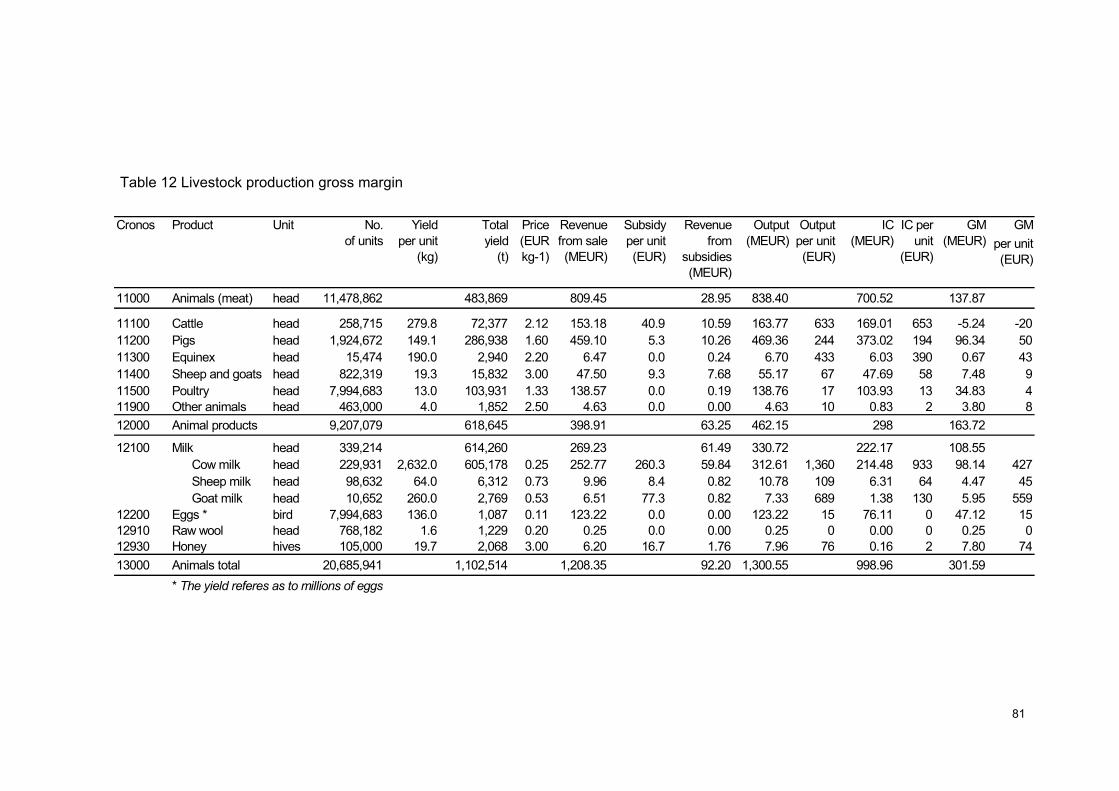
81
Cronos Product Unit No. of units
Yield per unit
(kg)
Total yield
(t)
Price (EUR kg-1)
Revenue from sale (MEUR)
Subsidy per unit (EUR)
Revenue from
subsidies (MEUR)
Output (MEUR)
Output per unit (EUR)
IC (MEUR)
IC per unit
(EUR)
GM (MEUR)
GM per unit (EUR)
11000 Animals (meat) head 11,478,862 483,869 809.45 28.95 838.40 700.52 137.87
11100 Cattle head 258,715 279.8 72,377 2.12 153.18 40.9 10.59 163.77 633 169.01 653 -5.24 -2011200 Pigs head 1,924,672 149.1 286,938 1.60 459.10 5.3 10.26 469.36 244 373.02 194 96.34 5011300 Equinex head 15,474 190.0 2,940 2.20 6.47 0.0 0.24 6.70 433 6.03 390 0.67 4311400 Sheep and goats head 822,319 19.3 15,832 3.00 47.50 9.3 7.68 55.17 67 47.69 58 7.48 911500 Poultry head 7,994,683 13.0 103,931 1.33 138.57 0.0 0.19 138.76 17 103.93 13 34.83 411900 Other animals head 463,000 4.0 1,852 2.50 4.63 0.0 0.00 4.63 10 0.83 2 3.80 812000 Animal products 9,207,079 618,645 398.91 63.25 462.15 298 163.72
12100 Milk head 339,214 614,260 269.23 61.49 330.72 222.17 108.55Cow milk head 229,931 2,632.0 605,178 0.25 252.77 260.3 59.84 312.61 1,360 214.48 933 98.14 427Sheep milk head 98,632 64.0 6,312 0.73 9.96 8.4 0.82 10.78 109 6.31 64 4.47 45Goat milk head 10,652 260.0 2,769 0.53 6.51 77.3 0.82 7.33 689 1.38 130 5.95 559
12200 Eggs * bird 7,994,683 136.0 1,087 0.11 123.22 0.0 0.00 123.22 15 76.11 0 47.12 1512910 Raw wool head 768,182 1.6 1,229 0.20 0.25 0.0 0.00 0.25 0 0.00 0 0.25 012930 Honey hives 105,000 19.7 2,068 3.00 6.20 16.7 1.76 7.96 76 0.16 2 7.80 7413000 Animals total 20,685,941 1,102,514 1,208.35 92.20 1,300.55 998.96 301.59
* The yield referes as to millions of eggs
Table 12 Livestock production gross margin
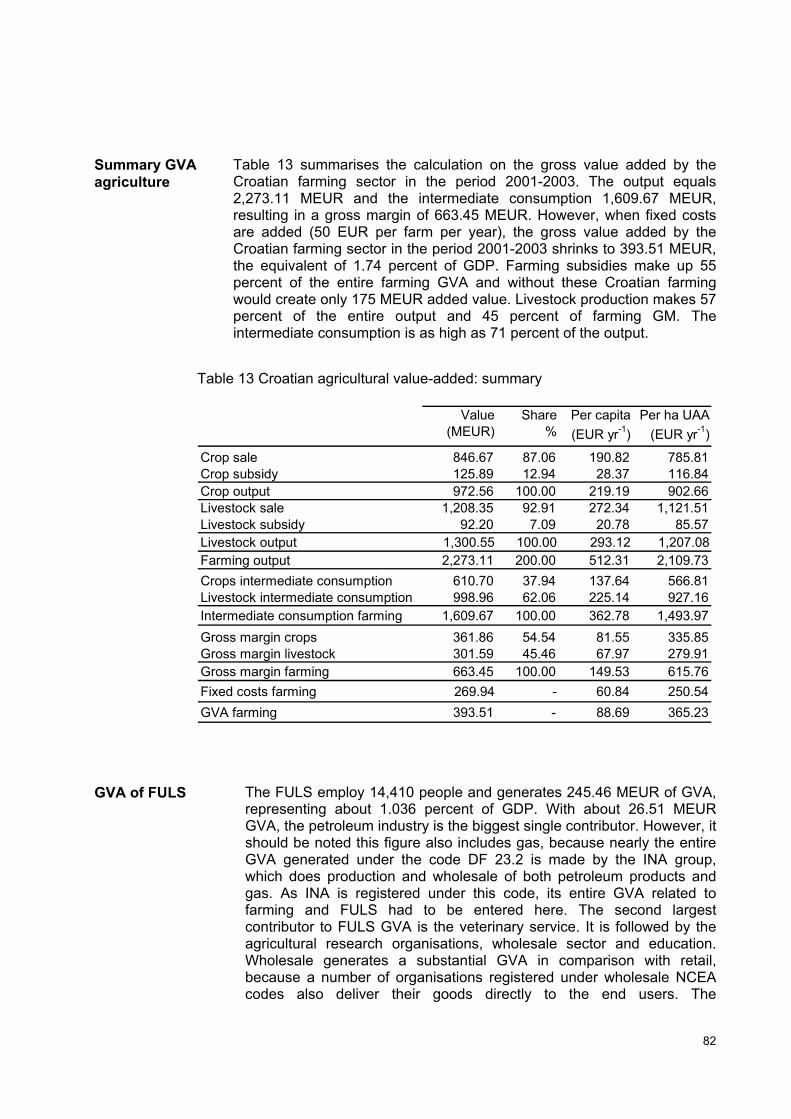
82
Value (MEUR)
Share %
Per capita (EUR yr-1)
Per ha UAA (EUR yr-1)
Crop sale 846.67 87.06 190.82 785.81Crop subsidy 125.89 12.94 28.37 116.84Crop output 972.56 100.00 219.19 902.66Livestock sale 1,208.35 92.91 272.34 1,121.51Livestock subsidy 92.20 7.09 20.78 85.57Livestock output 1,300.55 100.00 293.12 1,207.08Farming output 2,273.11 200.00 512.31 2,109.73Crops intermediate consumption 610.70 37.94 137.64 566.81Livestock intermediate consumption 998.96 62.06 225.14 927.16Intermediate consumption farming 1,609.67 100.00 362.78 1,493.97Gross margin crops 361.86 54.54 81.55 335.85Gross margin livestock 301.59 45.46 67.97 279.91Gross margin farming 663.45 100.00 149.53 615.76Fixed costs farming 269.94 - 60.84 250.54GVA farming 393.51 - 88.69 365.23
Table 13 summarises the calculation on the gross value added by the Croatian farming sector in the period 2001-2003. The output equals 2,273.11 MEUR and the intermediate consumption 1,609.67 MEUR, resulting in a gross margin of 663.45 MEUR. However, when fixed costs are added (50 EUR per farm per year), the gross value added by the Croatian farming sector in the period 2001-2003 shrinks to 393.51 MEUR, the equivalent of 1.74 percent of GDP. Farming subsidies make up 55 percent of the entire farming GVA and without these Croatian farming would create only 175 MEUR added value. Livestock production makes 57 percent of the entire output and 45 percent of farming GM. The intermediate consumption is as high as 71 percent of the output.
Table 13 Croatian agricultural value-added: summary
The FULS employ 14,410 people and generates 245.46 MEUR of GVA, representing about 1.036 percent of GDP. With about 26.51 MEUR GVA, the petroleum industry is the biggest single contributor. However, it should be noted this figure also includes gas, because nearly the entire GVA generated under the code DF 23.2 is made by the INA group, which does production and wholesale of both petroleum products and gas. As INA is registered under this code, its entire GVA related to farming and FULS had to be entered here. The second largest contributor to FULS GVA is the veterinary service. It is followed by the agricultural research organisations, wholesale sector and education. Wholesale generates a substantial GVA in comparison with retail, because a number of organisations registered under wholesale NCEA codes also deliver their goods directly to the end users. The
Summary GVA agriculture
GVA of FULS
83
manufacture of fertilisers and pesticides appear to be only the sixth and seventh single biggest GVA contributors in this chain.
Farming and FULS provide employment for 148,607 people and create GVA of 636.72 MEUR, or 2.84 percent of GDP. Farming accounts for 90.3 percent of the entire employment in Croatian farming and FULS. It also makes 61.45 percent of the entire GVA generated thought these sectors

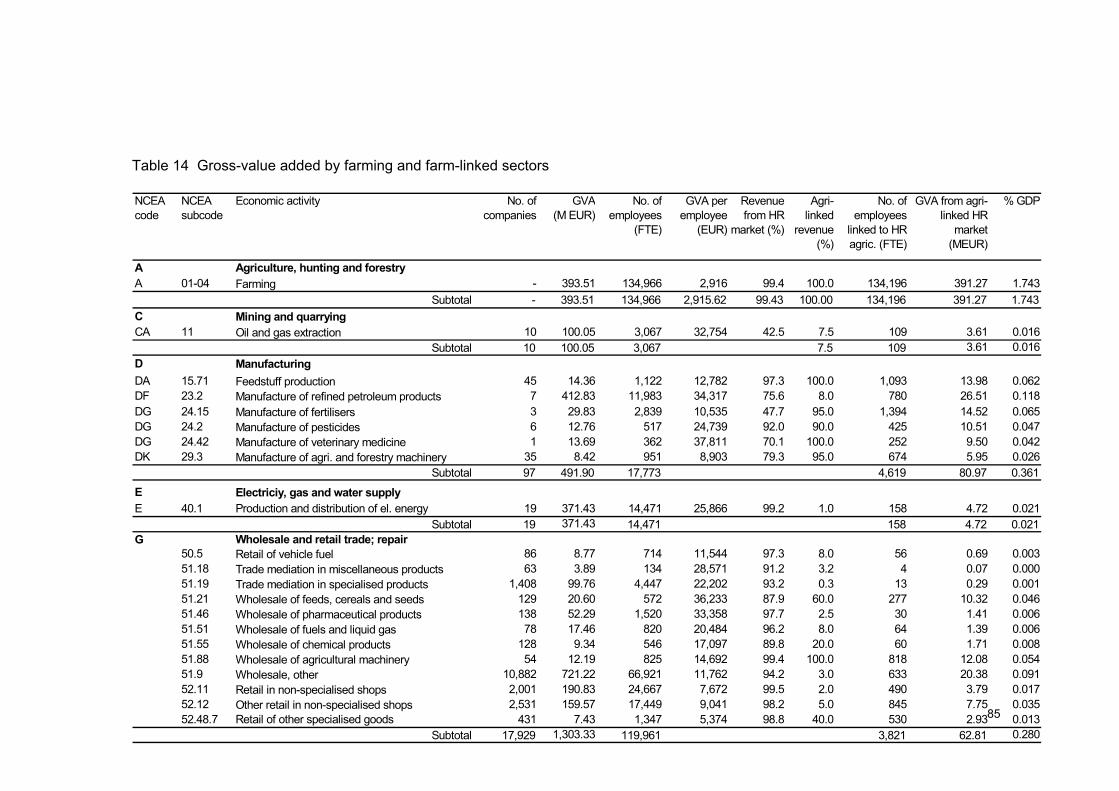
85
NCEA code
NCEA subcode
Economic activity No. of companies
GVA (M EUR)
No. of employees
(FTE)
GVA per employee
(EUR)
Revenue from HR
market (%)
Agri-linked
revenue (%)
No. of employees
linked to HR agric. (FTE)
GVA from agri-linked HR
market (MEUR)
% GDP
A Agriculture, hunting and forestryA 01-04 Farming - 393.51 134,966 2,916 99.4 100.0 134,196 391.27 1.743
Subtotal - 393.51 134,966 2,915.62 99.43 100.00 134,196 391.27 1.743C Mining and quarryingCA 11 Oil and gas extraction 10 100.05 3,067 32,754 42.5 7.5 109 3.61 0.016
Subtotal 10 100.05 3,067 7.5 109 3.61 0.016D ManufacturingDA 15.71 Feedstuff production 45 14.36 1,122 12,782 97.3 100.0 1,093 13.98 0.062DF 23.2 Manufacture of refined petroleum products 7 412.83 11,983 34,317 75.6 8.0 780 26.51 0.118DG 24.15 Manufacture of fertilisers 3 29.83 2,839 10,535 47.7 95.0 1,394 14.52 0.065DG 24.2 Manufacture of pesticides 6 12.76 517 24,739 92.0 90.0 425 10.51 0.047DG 24.42 Manufacture of veterinary medicine 1 13.69 362 37,811 70.1 100.0 252 9.50 0.042DK 29.3 Manufacture of agri. and forestry machinery 35 8.42 951 8,903 79.3 95.0 674 5.95 0.026
Subtotal 97 491.90 17,773 4,619 80.97 0.361
E Electriciy, gas and water supplyE 40.1 Production and distribution of el. energy 19 371.43 14,471 25,866 99.2 1.0 158 4.72 0.021
Subtotal 19 371.43 14,471 158 4.72 0.021G Wholesale and retail trade; repair
50.5 Retail of vehicle fuel 86 8.77 714 11,544 97.3 8.0 56 0.69 0.00351.18 Trade mediation in miscellaneous products 63 3.89 134 28,571 91.2 3.2 4 0.07 0.00051.19 Trade mediation in specialised products 1,408 99.76 4,447 22,202 93.2 0.3 13 0.29 0.00151.21 Wholesale of feeds, cereals and seeds 129 20.60 572 36,233 87.9 60.0 277 10.32 0.04651.46 Wholesale of pharmaceutical products 138 52.29 1,520 33,358 97.7 2.5 30 1.41 0.00651.51 Wholesale of fuels and liquid gas 78 17.46 820 20,484 96.2 8.0 64 1.39 0.00651.55 Wholesale of chemical products 128 9.34 546 17,097 89.8 20.0 60 1.71 0.00851.88 Wholesale of agricultural machinery 54 12.19 825 14,692 99.4 100.0 818 12.08 0.05451.9 Wholesale, other 10,882 721.22 66,921 11,762 94.2 3.0 633 20.38 0.09152.11 Retail in non-specialised shops 2,001 190.83 24,667 7,672 99.5 2.0 490 3.79 0.01752.12 Other retail in non-specialised shops 2,531 159.57 17,449 9,041 98.2 5.0 845 7.75 0.03552.48.7 Retail of other specialised goods 431 7.43 1,347 5,374 98.8 40.0 530 2.93 0.013
Subtotal 17,929 1,303.33 119,961 3,821 62.81 0.280
Table 14 Gross-value added by farming and farm-linked sectors
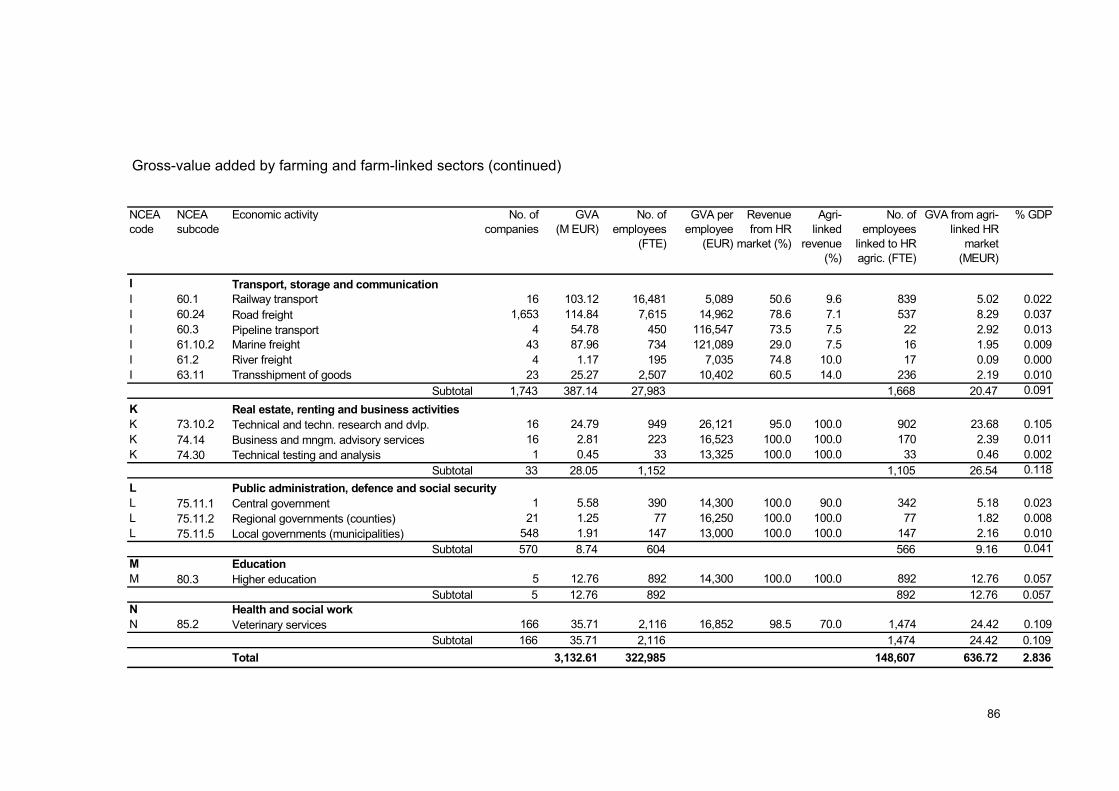
86
NCEA code
NCEA subcode
Economic activity No. of companies
GVA (M EUR)
No. of employees
(FTE)
GVA per employee
(EUR)
Revenue from HR
market (%)
Agri-linked
revenue (%)
No. of employees
linked to HR agric. (FTE)
GVA from agri-linked HR
market (MEUR)
% GDP
I Transport, storage and communicationI 60.1 Railway transport 16 103.12 16,481 5,089 50.6 9.6 839 5.02 0.022I 60.24 Road freight 1,653 114.84 7,615 14,962 78.6 7.1 537 8.29 0.037I 60.3 Pipeline transport 4 54.78 450 116,547 73.5 7.5 22 2.92 0.013I 61.10.2 Marine freight 43 87.96 734 121,089 29.0 7.5 16 1.95 0.009I 61.2 River freight 4 1.17 195 7,035 74.8 10.0 17 0.09 0.000I 63.11 Transshipment of goods 23 25.27 2,507 10,402 60.5 14.0 236 2.19 0.010
Subtotal 1,743 387.14 27,983 1,668 20.47 0.091K Real estate, renting and business activitiesK 73.10.2 Technical and techn. research and dvlp. 16 24.79 949 26,121 95.0 100.0 902 23.68 0.105K 74.14 Business and mngm. advisory services 16 2.81 223 16,523 100.0 100.0 170 2.39 0.011K 74.30 Technical testing and analysis 1 0.45 33 13,325 100.0 100.0 33 0.46 0.002
Subtotal 33 28.05 1,152 1,105 26.54 0.118L Public administration, defence and social securityL 75.11.1 Central government 1 5.58 390 14,300 100.0 90.0 342 5.18 0.023L 75.11.2 Regional governments (counties) 21 1.25 77 16,250 100.0 100.0 77 1.82 0.008L 75.11.5 Local governments (municipalities) 548 1.91 147 13,000 100.0 100.0 147 2.16 0.010
Subtotal 570 8.74 604 566 9.16 0.041M EducationM 80.3 Higher education 5 12.76 892 14,300 100.0 100.0 892 12.76 0.057
Subtotal 5 12.76 892 892 12.76 0.057N Health and social workN 85.2 Veterinary services 166 35.71 2,116 16,852 98.5 70.0 1,474 24.42 0.109
Subtotal 166 35.71 2,116 1,474 24.42 0.109Total 3,132.61 322,985 148,607 636.72 2.836
Gross-value added by farming and farm-linked sectors (continued)
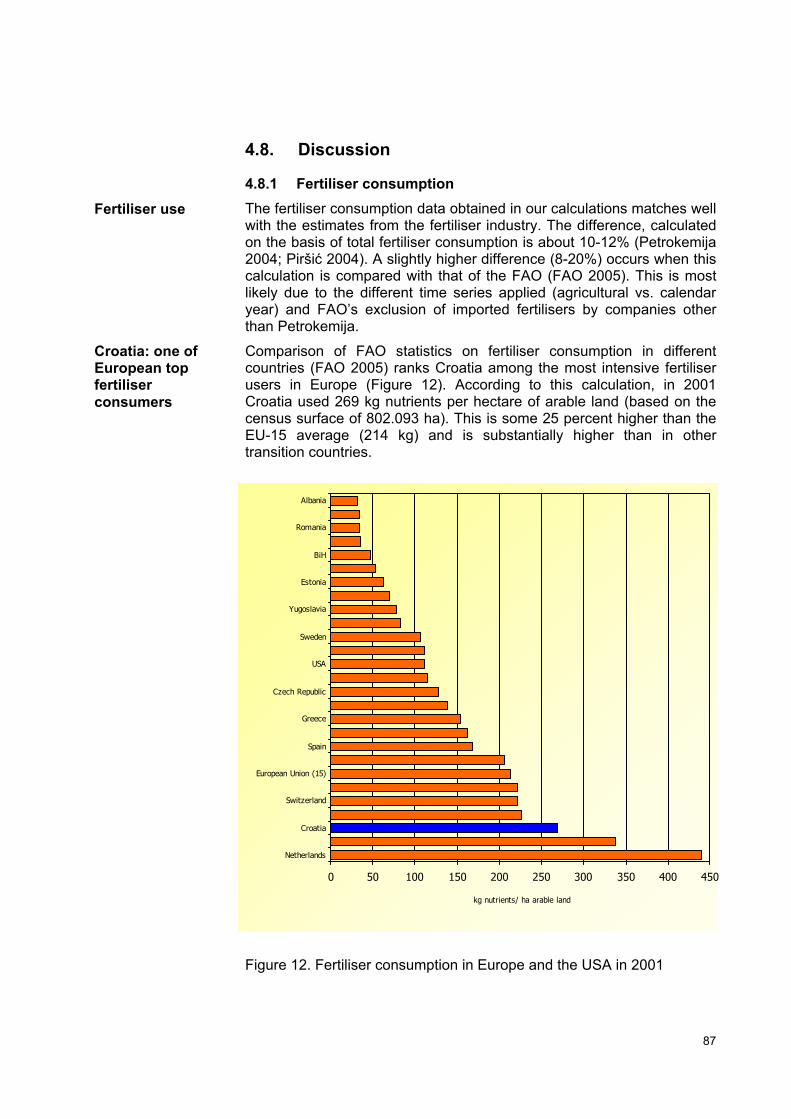
87
4.8. Discussion
4.8.1 Fertiliser consumption The fertiliser consumption data obtained in our calculations matches well with the estimates from the fertiliser industry. The difference, calculated on the basis of total fertiliser consumption is about 10-12% (Petrokemija 2004; Piršić 2004). A slightly higher difference (8-20%) occurs when this calculation is compared with that of the FAO (FAO 2005). This is most likely due to the different time series applied (agricultural vs. calendar year) and FAO’s exclusion of imported fertilisers by companies other than Petrokemija.
Comparison of FAO statistics on fertiliser consumption in different countries (FAO 2005) ranks Croatia among the most intensive fertiliser users in Europe (Figure 12). According to this calculation, in 2001 Croatia used 269 kg nutrients per hectare of arable land (based on the census surface of 802.093 ha). This is some 25 percent higher than the EU-15 average (214 kg) and is substantially higher than in other transition countries.
Figure 12. Fertiliser consumption in Europe and the USA in 2001
Fertiliser use
Croatia: one of European top fertiliser consumers
0 50 100 150 200 250 300 350 400 450
Netherlands
Croatia
Switzerland
European Union (15)
Spain
Greece
Czech Republic
USA
Sweden
Yugoslavia
Estonia
BiH
Romania
Albania
kg nutrients/ ha arable land
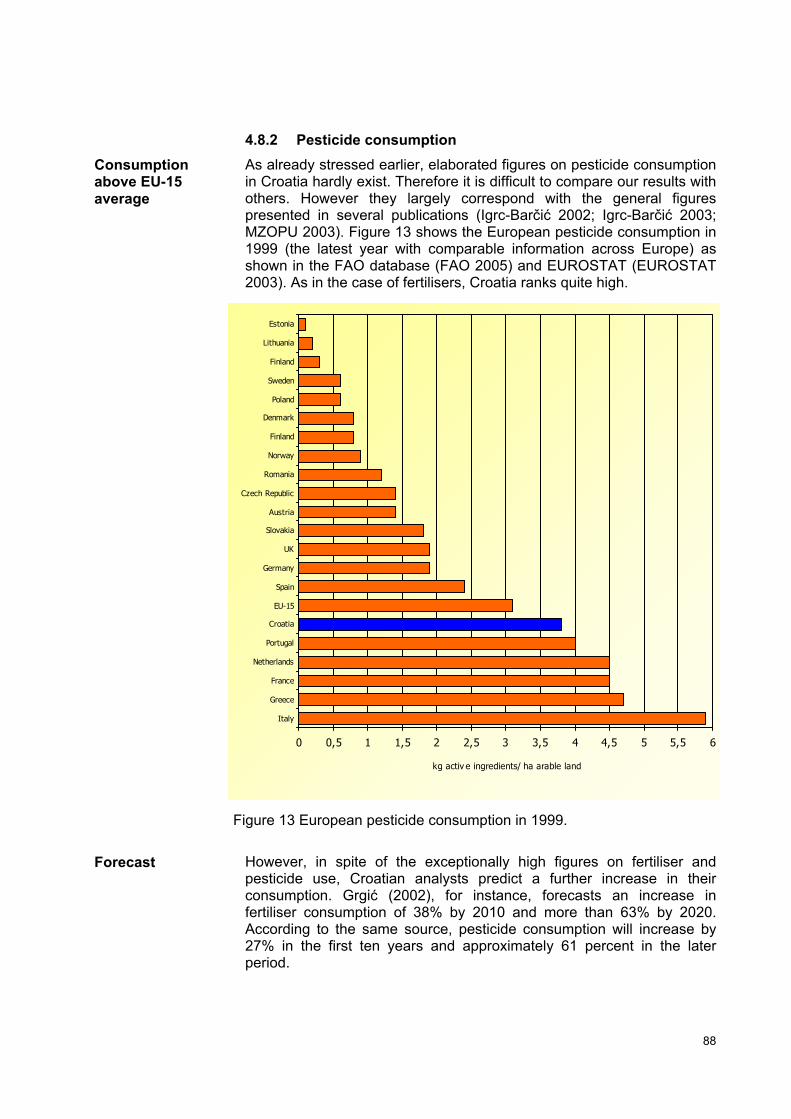
88
4.8.2 Pesticide consumption As already stressed earlier, elaborated figures on pesticide consumption in Croatia hardly exist. Therefore it is difficult to compare our results with others. However they largely correspond with the general figures presented in several publications (Igrc-Barčić 2002; Igrc-Barčić 2003; MZOPU 2003). Figure 13 shows the European pesticide consumption in 1999 (the latest year with comparable information across Europe) as shown in the FAO database (FAO 2005) and EUROSTAT (EUROSTAT 2003). As in the case of fertilisers, Croatia ranks quite high.
Figure 13 European pesticide consumption in 1999.
However, in spite of the exceptionally high figures on fertiliser and pesticide use, Croatian analysts predict a further increase in their consumption. Grgić (2002), for instance, forecasts an increase in fertiliser consumption of 38% by 2010 and more than 63% by 2020. According to the same source, pesticide consumption will increase by 27% in the first ten years and approximately 61 percent in the later period.
Consumption above EU-15 average
Forecast
0 0,5 1 1,5 2 2,5 3 3,5 4 4,5 5 5,5 6
Italy
Greece
France
Netherlands
Portugal
Croatia
EU-15
Spain
Germany
UK
Slovakia
Austria
Czech Republic
Romania
Norway
Finland
Denmark
Poland
Sweden
Finland
Lithuania
Estonia
kg activ e ingredients/ ha arable land
89
4.8.3 Efficiency of inputs If nutrient and pesticide per hectare rates recommended by the extension service (Mikšić, Murguić et al. 2004) are multiplied by the area under particular crops, it appears that in the period 2001-2003, Croatian farmers applied about 70 percent of the recommended fertilisers and 88 percent of recommended pesticides (Table 15). On the other hand, the yields obtained were about 50 percent lower on average than those anticipated in the extension service calculations. It is interesting to notice that the quantity of the applied nitrogen is exactly as recommended by the extension service. However, the composition of nitrogen fertilisers consumed is totally different from the recommendations. Croatian farmers seem to be fond of urea: they applied about 77 per cent more urea than needed - at the expense of CAN and nitrogen that should have been, according to the extension service, been added through NKP fertilisers. At the same time, there is an obvious deficiency of phosphorus and potassium: only about 47 percent of the recommended phosphorus and 35 percent of the recommended potassium was applied. So here, von Liebig´s “law of the minimum”, saying that the crop yield is proportional to the scarcest input available might have paid a role. Phosphorus and potassium seem indeed to be critical nutrients in Croatian farming. Kovačević (1993) for instance obtained an increased soybean yield of 34-40 percent when P and K fertilisers were added. Krištek et al. (2002) report on the increased yield of sugar beet due to P and K applications higher than typically applied by Croatian farmers.
Croatian farmers and agronomists do not seem to be sufficiently aware of the potential utilisation of nutrients in livestock manure (Moller 2003; Znaor and Karoglan Todorović 2004). Neither the application of fertilisers and manure is satisfactory, since it is often applied in inadequate formulations, quantities and time, as well as using inadequate technical equipment (Moller 2003; Sumelius, Mesić et al. 2005). The application of fertilisers is done without prior soil testing, mostly according to farmers’ experience and “feeling” of what is needed (Sumelius, Mesić et al. 2005). The soil nutrient application rates recommended by the extension service often double the recommendations in Denmark for instance and this is justified by the low utilisation rate of applied nutrients, particularly due to soil acidity (Moller 2003). However, it is not clear why liming, green manure, growing of crops whose root exudates are able to mobilise less available forms of P and K, as well as drainage is not recommended instead. All these are rather efficient measures to improve soil pH and mobilise inaccessible nutrients.
Recommended vs. actually consumed inputs
Poor nutrient management
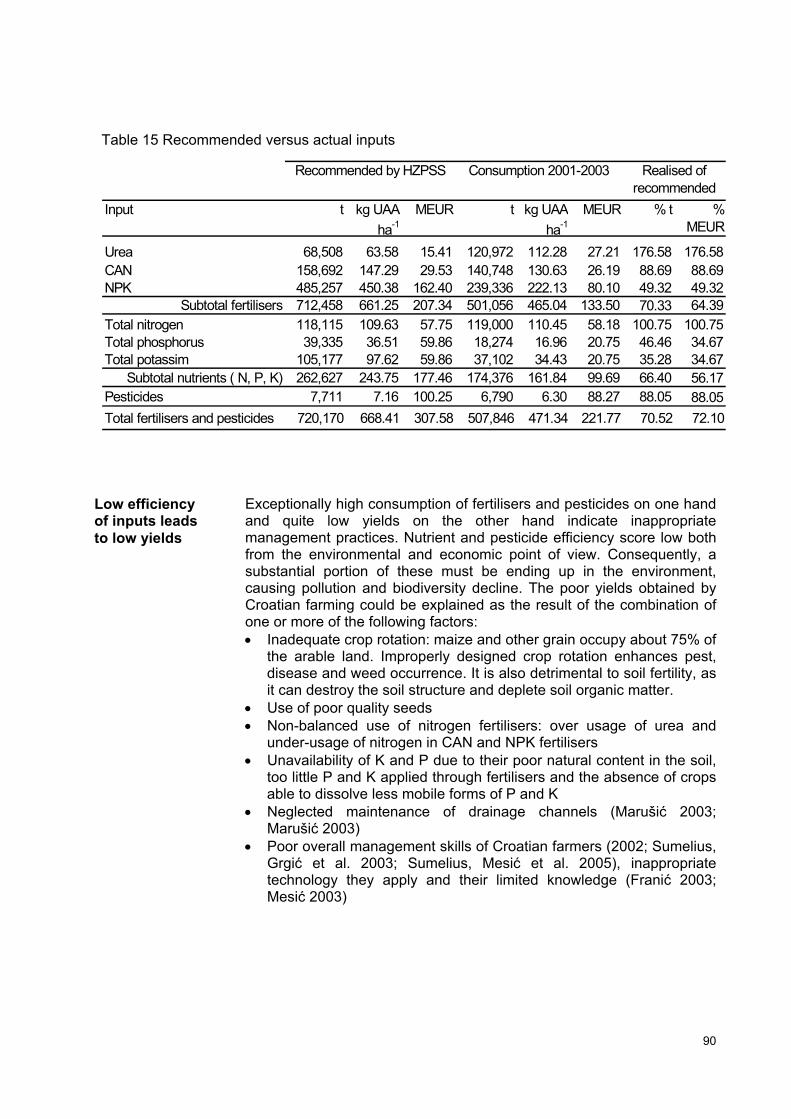
90
Input t kg UAA ha-1
MEUR t kg UAA ha-1
MEUR % t % MEUR
Urea 68,508 63.58 15.41 120,972 112.28 27.21 176.58 176.58CAN 158,692 147.29 29.53 140,748 130.63 26.19 88.69 88.69NPK 485,257 450.38 162.40 239,336 222.13 80.10 49.32 49.32
Subtotal fertilisers 712,458 661.25 207.34 501,056 465.04 133.50 70.33 64.39Total nitrogen 118,115 109.63 57.75 119,000 110.45 58.18 100.75 100.75Total phosphorus 39,335 36.51 59.86 18,274 16.96 20.75 46.46 34.67Total potassim 105,177 97.62 59.86 37,102 34.43 20.75 35.28 34.67
Subtotal nutrients ( N, P, K) 262,627 243.75 177.46 174,376 161.84 99.69 66.40 56.17Pesticides 7,711 7.16 100.25 6,790 6.30 88.27 88.05 88.05Total fertilisers and pesticides 720,170 668.41 307.58 507,846 471.34 221.77 70.52 72.10
Recommended by HZPSS Consumption 2001-2003 Realised of recommended
Table 15 Recommended versus actual inputs
Exceptionally high consumption of fertilisers and pesticides on one hand and quite low yields on the other hand indicate inappropriate management practices. Nutrient and pesticide efficiency score low both from the environmental and economic point of view. Consequently, a substantial portion of these must be ending up in the environment, causing pollution and biodiversity decline. The poor yields obtained by Croatian farming could be explained as the result of the combination of one or more of the following factors: • Inadequate crop rotation: maize and other grain occupy about 75% of
the arable land. Improperly designed crop rotation enhances pest, disease and weed occurrence. It is also detrimental to soil fertility, as it can destroy the soil structure and deplete soil organic matter.
• Use of poor quality seeds • Non-balanced use of nitrogen fertilisers: over usage of urea and
under-usage of nitrogen in CAN and NPK fertilisers • Unavailability of K and P due to their poor natural content in the soil,
too little P and K applied through fertilisers and the absence of crops able to dissolve less mobile forms of P and K
• Neglected maintenance of drainage channels (Marušić 2003; Marušić 2003)
• Poor overall management skills of Croatian farmers (2002; Sumelius, Grgić et al. 2003; Sumelius, Mesić et al. 2005), inappropriate technology they apply and their limited knowledge (Franić 2003; Mesić 2003)
Low efficiency of inputs leads to low yields
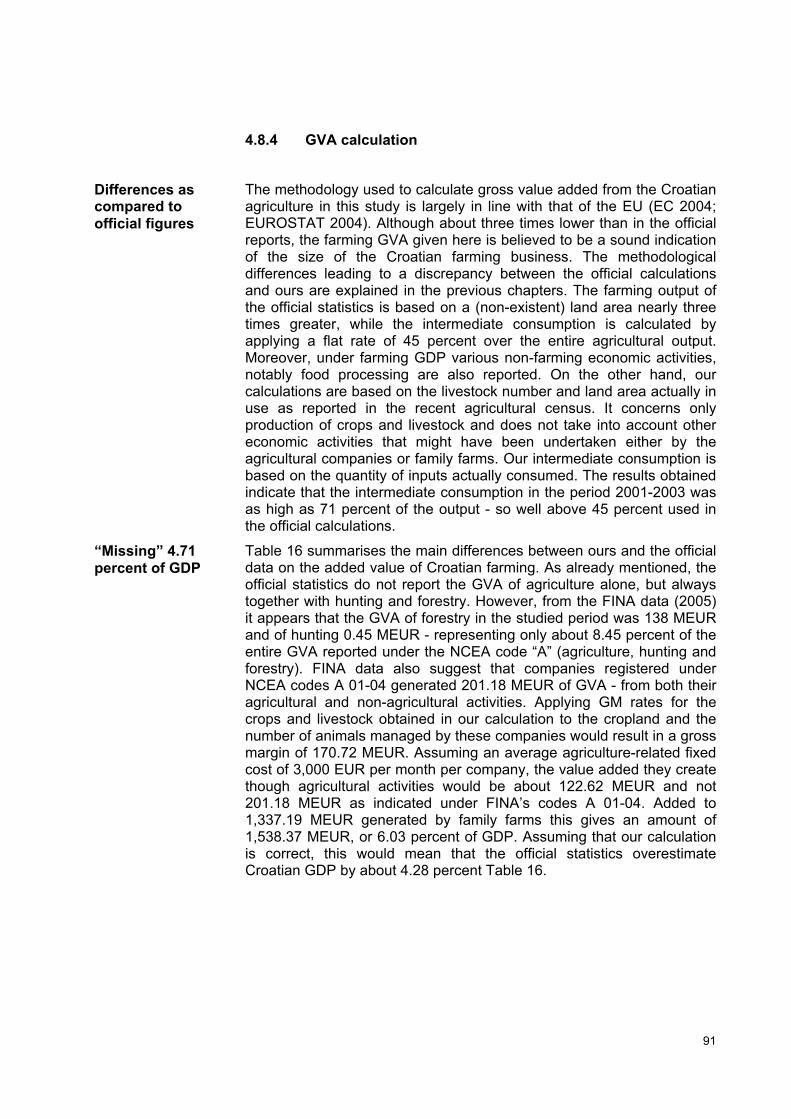
91
4.8.4 GVA calculation
The methodology used to calculate gross value added from the Croatian agriculture in this study is largely in line with that of the EU (EC 2004; EUROSTAT 2004). Although about three times lower than in the official reports, the farming GVA given here is believed to be a sound indication of the size of the Croatian farming business. The methodological differences leading to a discrepancy between the official calculations and ours are explained in the previous chapters. The farming output of the official statistics is based on a (non-existent) land area nearly three times greater, while the intermediate consumption is calculated by applying a flat rate of 45 percent over the entire agricultural output. Moreover, under farming GDP various non-farming economic activities, notably food processing are also reported. On the other hand, our calculations are based on the livestock number and land area actually in use as reported in the recent agricultural census. It concerns only production of crops and livestock and does not take into account other economic activities that might have been undertaken either by the agricultural companies or family farms. Our intermediate consumption is based on the quantity of inputs actually consumed. The results obtained indicate that the intermediate consumption in the period 2001-2003 was as high as 71 percent of the output - so well above 45 percent used in the official calculations.
Table 16 summarises the main differences between ours and the official data on the added value of Croatian farming. As already mentioned, the official statistics do not report the GVA of agriculture alone, but always together with hunting and forestry. However, from the FINA data (2005) it appears that the GVA of forestry in the studied period was 138 MEUR and of hunting 0.45 MEUR - representing only about 8.45 percent of the entire GVA reported under the NCEA code “A” (agriculture, hunting and forestry). FINA data also suggest that companies registered under NCEA codes A 01-04 generated 201.18 MEUR of GVA - from both their agricultural and non-agricultural activities. Applying GM rates for the crops and livestock obtained in our calculation to the cropland and the number of animals managed by these companies would result in a gross margin of 170.72 MEUR. Assuming an average agriculture-related fixed cost of 3,000 EUR per month per company, the value added they create though agricultural activities would be about 122.62 MEUR and not 201.18 MEUR as indicated under FINA’s codes A 01-04. Added to 1,337.19 MEUR generated by family farms this gives an amount of 1,538.37 MEUR, or 6.03 percent of GDP. Assuming that our calculation is correct, this would mean that the official statistics overestimate Croatian GDP by about 4.28 percent Table 16.
Differences as compared to official figures
“Missing” 4.71 percent of GDP
92
NCEA code
Subcode Activity Reported to FINA
DZS figures (MEUR)
Our figures (MEUR)
Difference (MEUR)
A01 01-04 Farming and non-farming activities of agricultural companies
Yes 201.18 121.62 79.56
A01 01-04 Farming by small-scale family farms
No 1,337.19 271.89 1,065.29
A01 05 Hunting Yes 0.41 0.00 0.41
A02 - Forestry Yes 138.02 0.00 138.02
1,676.80 393.51 1,283.29 GDP 24,185.00 22,450.00 1,735.00
6.93 1.75 5.18 6.03 1.75 4.28
"Agriculture" as % of GDP
Reported as to "agriculture"
Farming alone as % of GDP
Table 16 Differences between official farming GVA and data obtained in this study.
93
5. DAMAGE TO AIR
Atmospheric pollution consists of two major groups of pollutants: gases and solid particulates/aerosols. These substances change the natural composition of the atmosphere and can potentially damage human and other living organisms’ health and harm the environment. Atmospheric pollution comes from two major sources: natural and anthropogenic pollution. Natural pollution occurs from volcanoes, forest fires, oceanic sea salt, dust from space, plant pollen, swamps and wetlands. However the magnitude of such pollution is usually within the carrying capacity of the atmosphere. Today, most air pollution occurs through a wide range of human activities, notably the energy and manufacturing industry, agriculture and transport. The anthropogenic pollution often exceeds the absorption capacity of the atmosphere, leading to high concentrations that can occur on a regional or local scale.
5.1. Greenhouse gases
The greenhouse gases include carbon dioxide (CO2), methane (CH4), nitrous oxide (N2O), sulphur hexafluoride (SF6), perfluorocarbons (PFCs), chlorofluorocarbons (CFCs) and hydrofluorocarbons (HFCs). These gases affect the atmosphere on a global scale and are called “greenhouse” gases, because they cause global warming.
The United Nations Framework Convention on Climate Change sets an overall framework for intergovernmental efforts to tackle the challenge posed by climate change (UNFCCC 2005). Its addition, the 1997 Kyoto Protocol, commits a number of countries (Annex I Parties) to individual, legally-binding targets to limit or reduce their GHG emissions. These have to cut in GHGF emissions by at least 5% from 1990 levels in the commitment period 2008-2012. Croatia is one of the few signatory countries which still has not ratified the Kyoto Protocol. Its 2001 request for the exemption from its Kyoto targets (VRH 2001) and proposal to set its 1990 emissions of 39.4 Mt CO2 equivalent as the reference year is still pending, although its emissions in the last few years have been around 28 Mt CO2 .
By producing about 50-75 percent of anthropogenic methane and nitrous oxide emissions and about 5 percent of anthropogenic CO2 emissions, agriculture generates about 20 percent of the annual anthropogenic greenhouse effect globally (Cole 1996). In the period 2001-2003 agricultural activities accounted for 11.2 percent of the entire GHG emissions (CO2 equivalent) in Croatia (MZOPUG 2004; MZOPUG 2004; EKONERG 2005).
Natural and anthropogenic air pollution
Types of GHG
The UNFCCC and Kyoto Protocol
Share of agriculture
94
5.2. Regional and local air pollutants
Pollutants like sulphur dioxide (SO2), nitrogen oxides (NOx), carbon monoxide (CO), ammonia (NH3) persistent organic pollutants (POPs) and a wide range of hydrocarbons (VOCs), cause regional and local air pollution. Like most GHGs, these pollutants are mainly the product of the burning of fossil fuels. The presence of two or more of these substances in the air can be particularly harmful to human health, as these compounds can react chemically in the atmosphere, assisted by sunlight, high temperatures, and sometimes moisture, to form the secondary pollutant photochemical smog. Sulphur dioxide, nitrogen oxides and ammonia are also known as “acidic gases”, leading to the “acid rains” effect. Acid rain has an adverse effect on the environment and ecosystems and also affects human health and degrades many materials.
Particulate matter (PM) is a non-gaseous atmospheric pollutant consisting of a wide range of solid particles and liquid droplets. It can be suspended in the air for long periods of time and floating in the atmosphere as aerosols. These are the smallest size ranges of particulate matter made up of very fine particles. They pose the greatest hazard to human health and are generated by vehicles, factories, construction sites, cultivated land, unpaved roads, stone crushing and the burning of wood. The particulate matter known as PM-10 consists of particles with an aerodynamic diameter smaller than ten microns. These are responsible for most of the adverse human health effects because of their ability to reach the lower regions of the respiratory tract.
Heavy metals also belong to the group of non-gaseous atmospheric pollutants.
The 1979 Geneva Convention on Long-range Trans-boundary Air Pollution is the overall international legally binding instrument to deal with problems of air pollution on a broad regional basis. Croatia is a signatory of this Convention and regularly reports on the pollutants which are the subject of this convention. With the emission of some
50 000 t of ammonia, agriculture makes up some 44 percent of the entire Croatian acid gases equivalent (MZOPUG 2004).
5.3. Methodology
The methodology used to determine the damage caused by GHG and regional/local air pollutants generated by faming and FULS involved two steps:
• Quantification of GHG and regional/local air pollutants generated by Croatian farming and FULS
• Valuation of the damage cost caused by the determined quantities of GHG and regional/local air pollutants.
Gaseous pollutants
Particulate matter and aerosols
Heavy metals
CLRTAP Convention
95
5.3.1 Quantity of air pollutants arising from farming Since this study has been relying on the census data regarding land-use and the number of livestock, taking data on agricultural emissions from the existing national inventories (MZOPUG 2004; MZOPUG 2004; MZOPUG 2004; EKONERG 2005; MZOPUG 2005) that are based on three times as many hectares and a different number of livestock would not be methodologically correct. Therefore, the assessment of air pollution derived from the farming sector had to be performed from scratch.
The quantity of GHG arising from Croatian agriculture has been calculated according to the IPCC methodology (2001; 2001) for the inventory of GHG. This methodology has been widely used and is one of the most recognised. Its assessment takes into account the number of livestock, housing and manure handling details, information on crop residues, biological nitrogen fixation and the use of synthetic fertilisers.
The amount of local and regional pollutants has been assessed using the EU recommended EMEP/CORINAIR methodology (EEA 2004). With the input on the data on the land use, livestock number and grazing, fertiliser and pesticide application it enables calculation of agriculture related pollutants, such as ammonia, nitrogen oxides, carbon dioxide and NMVOCs.
Both the IPCC and EPEM/CORINAIRE methodology have a set of default regional values. In same cases, these have been slightly adapted to better reflect the Croatian situation and the corrections made were largely based on the values given for Croatia by RAIN, another international model used for the assessment of air pollution (IIASA 2003; Klimont and Brink 2004).
5.3.2 Quantity of air pollutants caused by FULS The emissions of pollutants of farm-upstream linked sectors have been quantified using data from the following sources:
Croatia has a well-established Cadastre of Emissions into the Environment. This national database was run by MZOPUG but was recently handed over to the Environmental Protection and Energy Efficiency Fund. The Cadastre contains air and wastewater emission data from point sources and data on industrial and municipal waste generation and treatment (Jurić, Burek et al. 2005; MZOPUG 2005). The primary data have been supplied by companies and other legal entities which are obliged to keep regular records and carry out annual reporting to the authorities. The Cadastre of Emissions into the Environment proved to be an important source of information, providing the type and quantity of pollutants of interest for the study from major companies. In cases of doubts and unclearness regarding the Cadastre data, additional consultations have been made with experts from MZOPUG (Kufrin 2004; Nećak 2004; Šolić-Gavranović 2004), and the Environmental Protection and Energy Efficiency Fund (Muškardin 2004; Muškardin 2005) and Agency for Environmental Protection (Kufrin 2004).
GHG from IPCC methodology
EMEP/ CORINAIR methodology
Cadastre of Emissions into the Environment
96
The project team contacted several companies in order to obtain additional or check already collected air pollution information. Most of these, especially agri-chemical companies have reacted positively to this request, providing various useful information: Herbos (Ivanković 2004; Smolčić 2004), Chromos (Čović 2004), Veterina (Benko Tomić 2004; Stilinović 2005) and Dalmed (Vujčić 2004). Petrokemija (Avirović 2004; Vešligaj 2004; Avirović 2005; Mesarić 2005) has submitted particularly detailed and useful environmental data.
Governmental reports on air pollution (MZOPU 2003; CCPC 2004; MZOPUG 2004; MZOPUG 2004; MZOPUG 2005) provided plentiful useful information needed to determine the quantity of air pollutants in various sectors.
Corporate environmental reports, such as (HŽ 2002; Petrokemija 2002; Petrokemija 2002; HEP 2003; INA 2004; Petrokemija 2004) proved to be a particularly important source of information for the pollutants generated by oil, gas and electricity industries and railways.
Three Croatian research and consultancy organisations dealing with air pollution and involved in the preparation of the key environmental analysis for national authorities and international projects provided various additional data and clarifications needed to complete the calculations: EKONERG (Fijan Parlov 2005; Jurić 2005; Vešligaj 2005), the Hrvoje Požar Energy Institute (Vuk 2005; Vuk 2005) and the Croatian Centre for Cleaner Production (Belamarić Šaravanja 2004; Horst 2004).
The National Energy Balance for 2001-2003 (Vuk 2005), data from the energy (HEP 2003; INA 2004; VRED 2004) and industry sector (Petrokemija 2005), together with transport statistics (DZS 2005; HŽ 2005) enabled a reliable calculation of FULS-generated pollutants and their separation from sometimes aggregated figures.
5.3.3 Valuation of air-related externalities The external cost for air has been determined applying the methodology developed by the ExternE (= Externalities of Energy) project series. The ExternE project (ExternE 2005) is the biggest and most comprehensive EU programme on external costs. It was launched in 1991 with financial support from the DG Research of the European Commission and has been running since (with a total budget of over ten million EUR). The programme has involved some fifty universities and research institutes from more than twenty European countries and encompasses over twenty research projects (ExternE 2005).
The core of the ExternE project is the EcoSense software - an integrated computer tool. It provides a harmonised air quality and impact assessment models together with a comprehensive set of relevant input data for some thirty European countries (but not Croatia). Using a bottom-up environmental impact pathway approach, EcoSense is capable of performing a highly standardised impact assessment, allowing a site specific bottom-up impact analysis (ExternE 2005; IER 2005)
Information provided by industry
GO reports
Corporate environmental reports
Research ad consultancy organisations
ExternE programme
EcoSense software
97
In determining the monetary value of an externality, the ExternE methodology takes into account fatal and non-fatal effects on human health; damage to crops and materials (buildings), as well as effects on global warming and ecosystems (Droste-Franke 2005; ExternE 2005). By following the entire path of an externality - from source emissions, quality changes of air, soil and water to physical impacts - the model links a ‘burden’ to an ‘impact’ and converts the impact into monetary value (IER 2004; ExternE 2005). The new generation of ExternE tools (NewExt) also analyses pollution in water and soil in addition to atmospheric pollution. The impact of heavy metals and some organic substances (e. g. dioxins), which accumulate in water and soil compartments and lead to significant exposure via the food chain are expected to be included in the ExternE model as well (ExternE 2005).
The calculation of external costs using the ExternE approach requires a well-defined reference situation regarding pollutants. This is important as the background concentration of pollutants in the reference situation has an influence on future (scenario) released pollutants with non-linear chemistry or non-linear dose-response functions (Droste-Franke 2005; ExternE 2005). The ExternE approach estimates the difference in air quality between the reference situation and a situation simulated through a scenario. The difference in the simulated air quality situation between the case and the reference situation is combined with exposure response functions to derive differences in physical impacts on public health, crops, buildings, global warming and ecosystems. Finally, the physical impacts are evaluated and converted in monetary terms applying concepts of welfare economics. For impacts on crops and materials market prices are used to evaluate the damages. However, for non-market goods (especially damage to human health), the damage is assessed on the basis of the willingness-to-pay or willingness-to-accept approach. The monetary values recommended in ExternE have been derived on the basis of informal meta-analysis (in the case of mortality values) and most recent robust estimates from welfare-based valuation studies (ExternE 2005). In cases of high uncertainties (e.g. for ecosystem damage resulting from acidification and eutrophication, or damage caused by global warming), avoidance costs are calculated. This approach deviates from the pure welfare economic paradigm followed by ExternE, but it allows a more complete estimation of damage caused by the same pollutants already included in the calculation on public health, materials and crops.
The ExternE model takes into account both local and transboundary impacts because air pollutants are transformed and transported over long distances, causing considerable damage hundreds of kilometres away form the source (ExternE 2005). Extensive information on the methodological framework used in ExternE and EcoSense can be obtained from the several sources (EC 1995; EC 1999; Friedrich and Bickel 2001; EC 2003; IER 2004; ExternE 2005).
The ExternE model actually does take into account positive effect of CO2 and other "pollutants" on crops. Nitrous gases and SO2 can sometimes be beneficial as they act as fertilisers. In the ExternE model, the positive
ExternE methodology
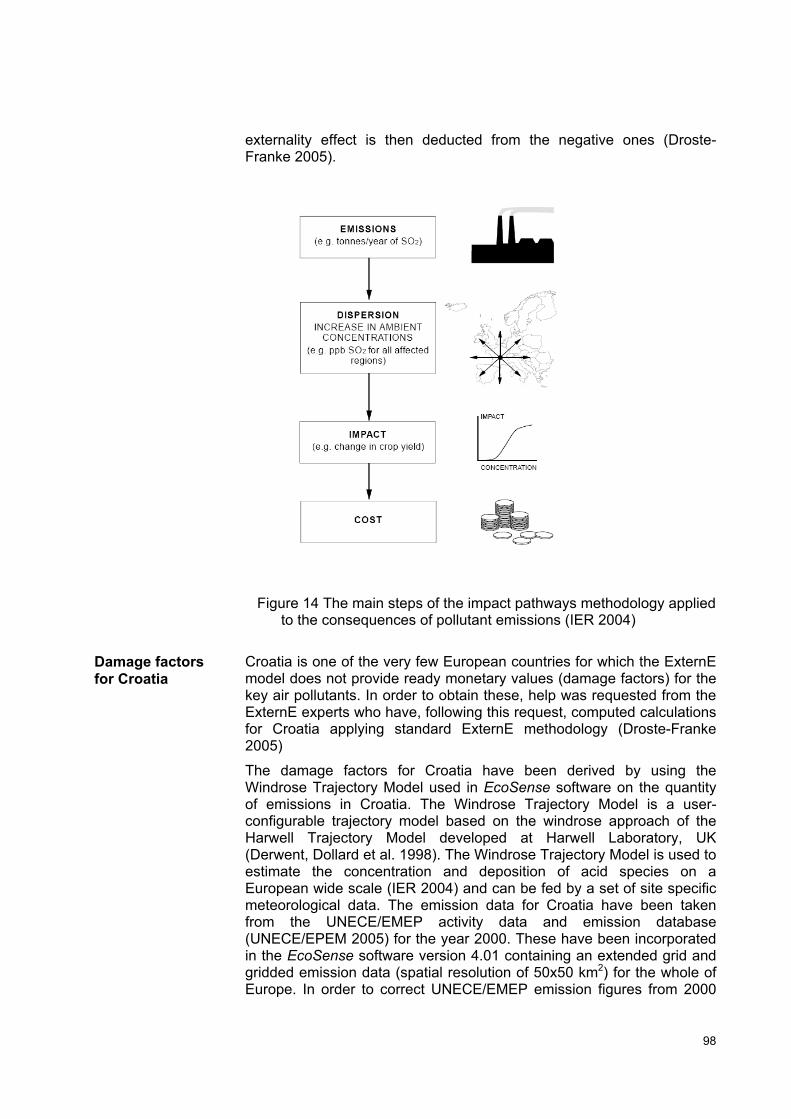
98
externality effect is then deducted from the negative ones (Droste-Franke 2005).
Figure 14 The main steps of the impact pathways methodology applied to the consequences of pollutant emissions (IER 2004)
Croatia is one of the very few European countries for which the ExternE model does not provide ready monetary values (damage factors) for the key air pollutants. In order to obtain these, help was requested from the ExternE experts who have, following this request, computed calculations for Croatia applying standard ExternE methodology (Droste-Franke 2005)
The damage factors for Croatia have been derived by using the Windrose Trajectory Model used in EcoSense software on the quantity of emissions in Croatia. The Windrose Trajectory Model is a user-configurable trajectory model based on the windrose approach of the Harwell Trajectory Model developed at Harwell Laboratory, UK (Derwent, Dollard et al. 1998). The Windrose Trajectory Model is used to estimate the concentration and deposition of acid species on a European wide scale (IER 2004) and can be fed by a set of site specific meteorological data. The emission data for Croatia have been taken from the UNECE/EMEP activity data and emission database (UNECE/EPEM 2005) for the year 2000. These have been incorporated in the EcoSense software version 4.01 containing an extended grid and gridded emission data (spatial resolution of 50x50 km2) for the whole of Europe. In order to correct UNECE/EMEP emission figures from 2000
Damage factors for Croatia
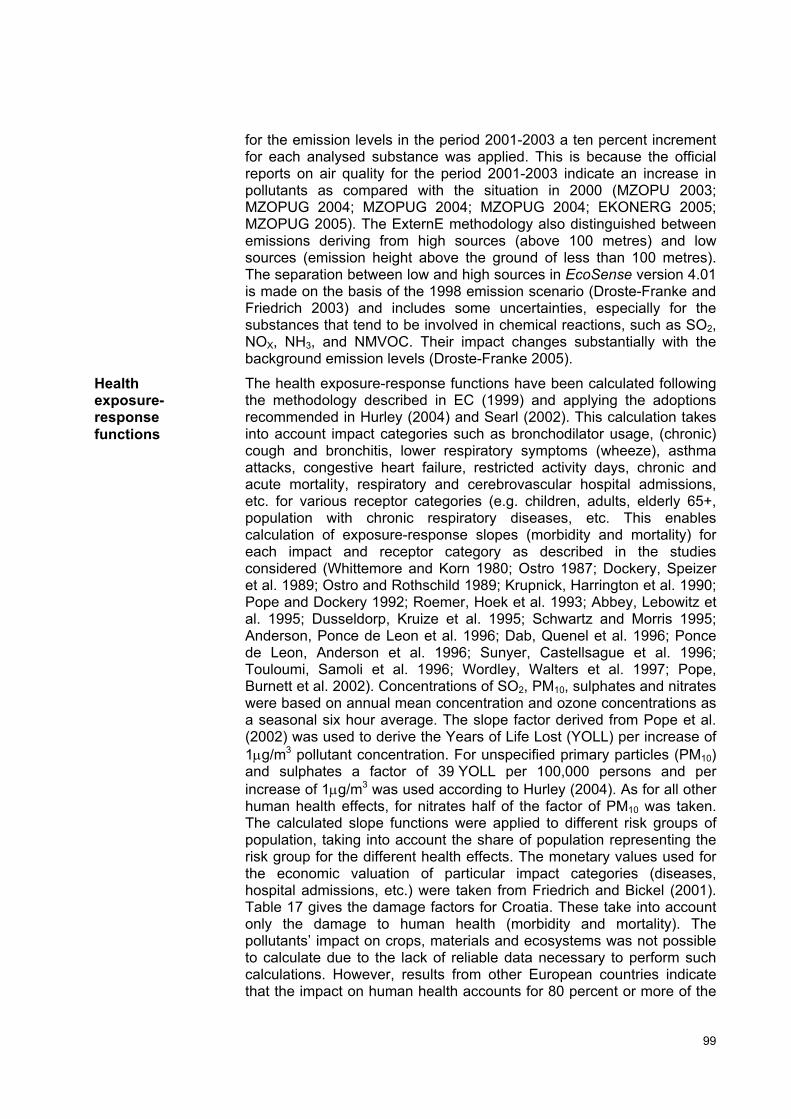
99
for the emission levels in the period 2001-2003 a ten percent increment for each analysed substance was applied. This is because the official reports on air quality for the period 2001-2003 indicate an increase in pollutants as compared with the situation in 2000 (MZOPU 2003; MZOPUG 2004; MZOPUG 2004; MZOPUG 2004; EKONERG 2005; MZOPUG 2005). The ExternE methodology also distinguished between emissions deriving from high sources (above 100 metres) and low sources (emission height above the ground of less than 100 metres). The separation between low and high sources in EcoSense version 4.01 is made on the basis of the 1998 emission scenario (Droste-Franke and Friedrich 2003) and includes some uncertainties, especially for the substances that tend to be involved in chemical reactions, such as SO2, NOX, NH3, and NMVOC. Their impact changes substantially with the background emission levels (Droste-Franke 2005).
The health exposure-response functions have been calculated following the methodology described in EC (1999) and applying the adoptions recommended in Hurley (2004) and Searl (2002). This calculation takes into account impact categories such as bronchodilator usage, (chronic) cough and bronchitis, lower respiratory symptoms (wheeze), asthma attacks, congestive heart failure, restricted activity days, chronic and acute mortality, respiratory and cerebrovascular hospital admissions, etc. for various receptor categories (e.g. children, adults, elderly 65+, population with chronic respiratory diseases, etc. This enables calculation of exposure-response slopes (morbidity and mortality) for each impact and receptor category as described in the studies considered (Whittemore and Korn 1980; Ostro 1987; Dockery, Speizer et al. 1989; Ostro and Rothschild 1989; Krupnick, Harrington et al. 1990; Pope and Dockery 1992; Roemer, Hoek et al. 1993; Abbey, Lebowitz et al. 1995; Dusseldorp, Kruize et al. 1995; Schwartz and Morris 1995; Anderson, Ponce de Leon et al. 1996; Dab, Quenel et al. 1996; Ponce de Leon, Anderson et al. 1996; Sunyer, Castellsague et al. 1996; Touloumi, Samoli et al. 1996; Wordley, Walters et al. 1997; Pope, Burnett et al. 2002). Concentrations of SO2, PM10, sulphates and nitrates were based on annual mean concentration and ozone concentrations as a seasonal six hour average. The slope factor derived from Pope et al. (2002) was used to derive the Years of Life Lost (YOLL) per increase of 1µg/m3 pollutant concentration. For unspecified primary particles (PM10) and sulphates a factor of 39 YOLL per 100,000 persons and per increase of 1µg/m3 was used according to Hurley (2004). As for all other human health effects, for nitrates half of the factor of PM10 was taken. The calculated slope functions were applied to different risk groups of population, taking into account the share of population representing the risk group for the different health effects. The monetary values used for the economic valuation of particular impact categories (diseases, hospital admissions, etc.) were taken from Friedrich and Bickel (2001). Table 17 gives the damage factors for Croatia. These take into account only the damage to human health (morbidity and mortality). The pollutants’ impact on crops, materials and ecosystems was not possible to calculate due to the lack of reliable data necessary to perform such calculations. However, results from other European countries indicate that the impact on human health accounts for 80 percent or more of the
Health exposure-response functions
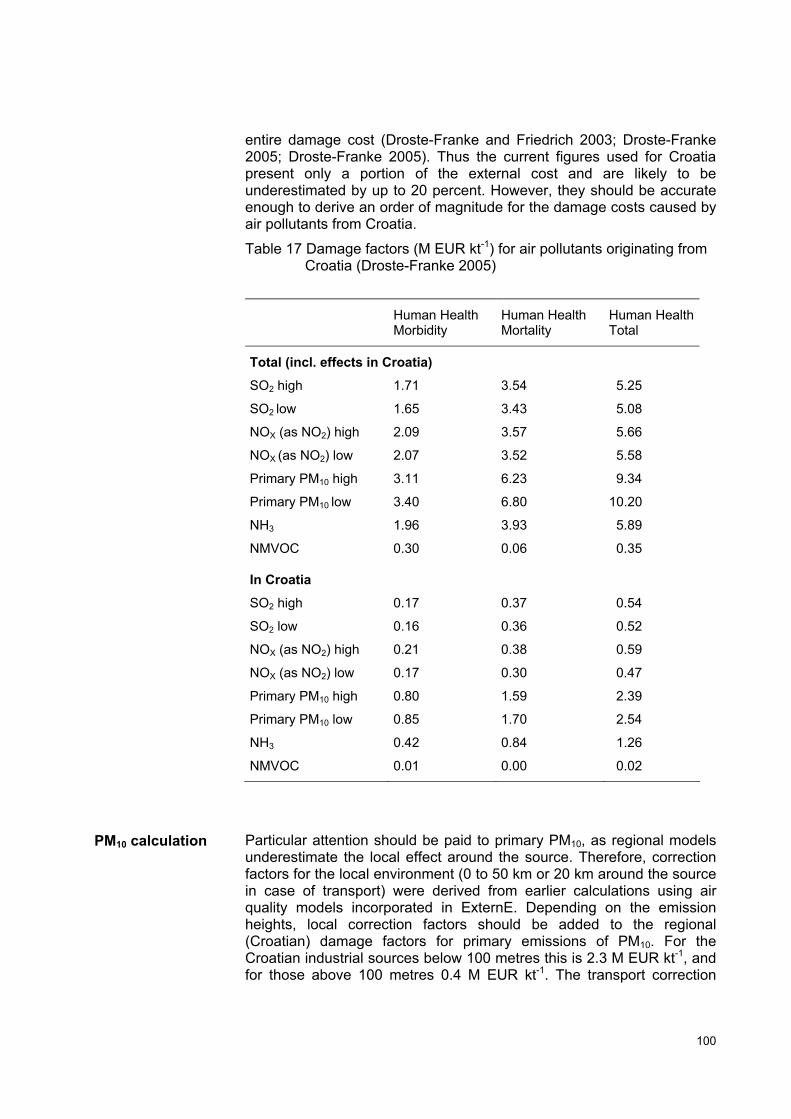
100
entire damage cost (Droste-Franke and Friedrich 2003; Droste-Franke 2005; Droste-Franke 2005). Thus the current figures used for Croatia present only a portion of the external cost and are likely to be underestimated by up to 20 percent. However, they should be accurate enough to derive an order of magnitude for the damage costs caused by air pollutants from Croatia.
Table 17 Damage factors (M EUR kt-1) for air pollutants originating from Croatia (Droste-Franke 2005)
Human Health Morbidity
Human Health Mortality
Human Health Total
Total (incl. effects in Croatia)
SO2 high 1.71 3.54 5.25
SO2 low 1.65 3.43 5.08
NOX (as NO2) high 2.09 3.57 5.66
NOX (as NO2) low 2.07 3.52 5.58
Primary PM10 high 3.11 6.23 9.34
Primary PM10 low 3.40 6.80 10.20
NH3 1.96 3.93 5.89
NMVOC 0.30 0.06 0.35
In Croatia
SO2 high 0.17 0.37 0.54
SO2 low 0.16 0.36 0.52
NOX (as NO2) high 0.21 0.38 0.59
NOX (as NO2) low 0.17 0.30 0.47
Primary PM10 high 0.80 1.59 2.39
Primary PM10 low 0.85 1.70 2.54
NH3 0.42 0.84 1.26
NMVOC 0.01 0.00 0.02
Particular attention should be paid to primary PM10, as regional models underestimate the local effect around the source. Therefore, correction factors for the local environment (0 to 50 km or 20 km around the source in case of transport) were derived from earlier calculations using air quality models incorporated in ExternE. Depending on the emission heights, local correction factors should be added to the regional (Croatian) damage factors for primary emissions of PM10. For the Croatian industrial sources below 100 metres this is 2.3 M EUR kt-1, and for those above 100 metres 0.4 M EUR kt-1. The transport correction
PM10 calculation
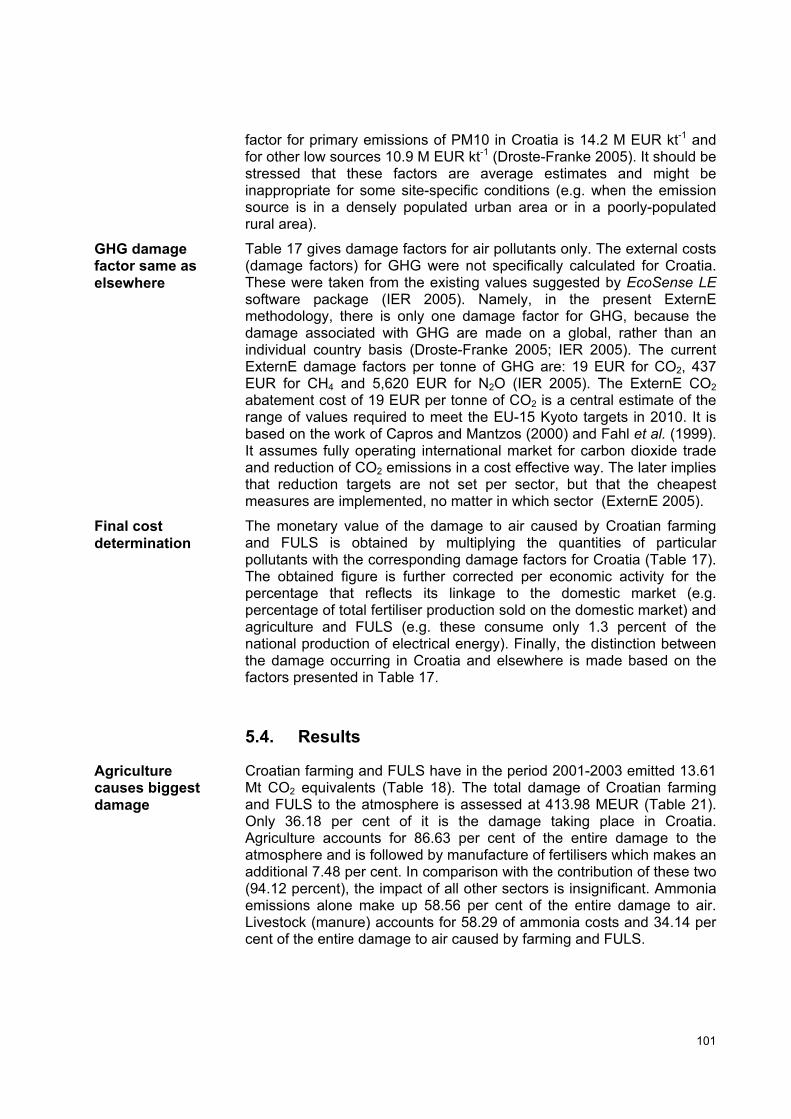
101
factor for primary emissions of PM10 in Croatia is 14.2 M EUR kt-1 and for other low sources 10.9 M EUR kt-1 (Droste-Franke 2005). It should be stressed that these factors are average estimates and might be inappropriate for some site-specific conditions (e.g. when the emission source is in a densely populated urban area or in a poorly-populated rural area).
Table 17 gives damage factors for air pollutants only. The external costs (damage factors) for GHG were not specifically calculated for Croatia. These were taken from the existing values suggested by EcoSense LE software package (IER 2005). Namely, in the present ExternE methodology, there is only one damage factor for GHG, because the damage associated with GHG are made on a global, rather than an individual country basis (Droste-Franke 2005; IER 2005). The current ExternE damage factors per tonne of GHG are: 19 EUR for CO2, 437 EUR for CH4 and 5,620 EUR for N2O (IER 2005). The ExternE CO2 abatement cost of 19 EUR per tonne of CO2 is a central estimate of the range of values required to meet the EU-15 Kyoto targets in 2010. It is based on the work of Capros and Mantzos (2000) and Fahl et al. (1999). It assumes fully operating international market for carbon dioxide trade and reduction of CO2 emissions in a cost effective way. The later implies that reduction targets are not set per sector, but that the cheapest measures are implemented, no matter in which sector (ExternE 2005).
The monetary value of the damage to air caused by Croatian farming and FULS is obtained by multiplying the quantities of particular pollutants with the corresponding damage factors for Croatia (Table 17). The obtained figure is further corrected per economic activity for the percentage that reflects its linkage to the domestic market (e.g. percentage of total fertiliser production sold on the domestic market) and agriculture and FULS (e.g. these consume only 1.3 percent of the national production of electrical energy). Finally, the distinction between the damage occurring in Croatia and elsewhere is made based on the factors presented in Table 17.
5.4. Results
Croatian farming and FULS have in the period 2001-2003 emitted 13.61 Mt CO2 equivalents (Table 18). The total damage of Croatian farming and FULS to the atmosphere is assessed at 413.98 MEUR (Table 21). Only 36.18 per cent of it is the damage taking place in Croatia. Agriculture accounts for 86.63 per cent of the entire damage to the atmosphere and is followed by manufacture of fertilisers which makes an additional 7.48 per cent. In comparison with the contribution of these two (94.12 percent), the impact of all other sectors is insignificant. Ammonia emissions alone make up 58.56 per cent of the entire damage to air. Livestock (manure) accounts for 58.29 of ammonia costs and 34.14 per cent of the entire damage to air caused by farming and FULS.
GHG damage factor same as elsewhere
Final cost determination
Agriculture causes biggest damage
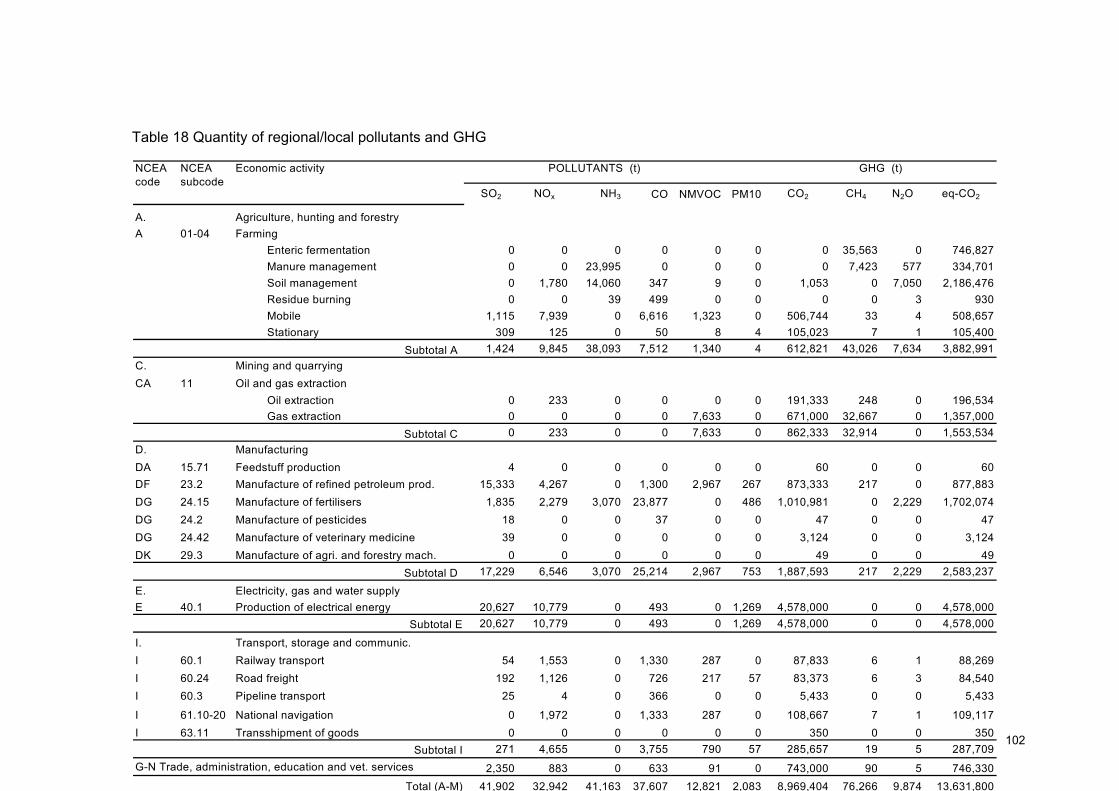
102
SO2 NOx NH3 CO NMVOC PM10 CO2 CH4 N2O eq-CO2
A. Agriculture, hunting and forestryA 01-04 Farming
Enteric fermentation 0 0 0 0 0 0 0 35,563 0 746,827Manure management 0 0 23,995 0 0 0 0 7,423 577 334,701Soil management 0 1,780 14,060 347 9 0 1,053 0 7,050 2,186,476Residue burning 0 0 39 499 0 0 0 0 3 930Mobile 1,115 7,939 0 6,616 1,323 0 506,744 33 4 508,657Stationary 309 125 0 50 8 4 105,023 7 1 105,400
Subtotal A 1,424 9,845 38,093 7,512 1,340 4 612,821 43,026 7,634 3,882,991C. Mining and quarryingCA 11 Oil and gas extraction
Oil extraction 0 233 0 0 0 0 191,333 248 0 196,534Gas extraction 0 0 0 0 7,633 0 671,000 32,667 0 1,357,000
Subtotal C 0 233 0 0 7,633 0 862,333 32,914 0 1,553,534D. ManufacturingDA 15.71 Feedstuff production 4 0 0 0 0 0 60 0 0 60DF 23.2 Manufacture of refined petroleum prod. 15,333 4,267 0 1,300 2,967 267 873,333 217 0 877,883DG 24.15 Manufacture of fertilisers 1,835 2,279 3,070 23,877 0 486 1,010,981 0 2,229 1,702,074DG 24.2 Manufacture of pesticides 18 0 0 37 0 0 47 0 0 47DG 24.42 Manufacture of veterinary medicine 39 0 0 0 0 0 3,124 0 0 3,124DK 29.3 Manufacture of agri. and forestry mach. 0 0 0 0 0 0 49 0 0 49
Subtotal D 17,229 6,546 3,070 25,214 2,967 753 1,887,593 217 2,229 2,583,237
E. Electricity, gas and water supplyE 40.1 20,627 10,779 0 493 0 1,269 4,578,000 0 0 4,578,000
Subtotal E 20,627 10,779 0 493 0 1,269 4,578,000 0 0 4,578,000
I. Transport, storage and communic.I 60.1 Railway transport 54 1,553 0 1,330 287 0 87,833 6 1 88,269I 60.24 Road freight 192 1,126 0 726 217 57 83,373 6 3 84,540I 60.3 Pipeline transport 25 4 0 366 0 0 5,433 0 0 5,433
I 61.10-20 National navigation 0 1,972 0 1,333 287 0 108,667 7 1 109,117I 63.11 0 0 0 0 0 0 350 0 0 350
Subtotal I 271 4,655 0 3,755 790 57 285,657 19 5 287,709G-N Trade, administration, education and vet. services 2,350 883 0 633 91 0 743,000 90 5 746,330
Total (A-M) 41,902 32,942 41,163 37,607 12,821 2,083 8,969,404 76,266 9,874 13,631,800
Transshipment of goods
Production of electrical energy
Economic activity GHG (t)NCEA code
POLLUTANTS (t)NCEA subcode
Table 18 Quantity of regional/local pollutants and GHG
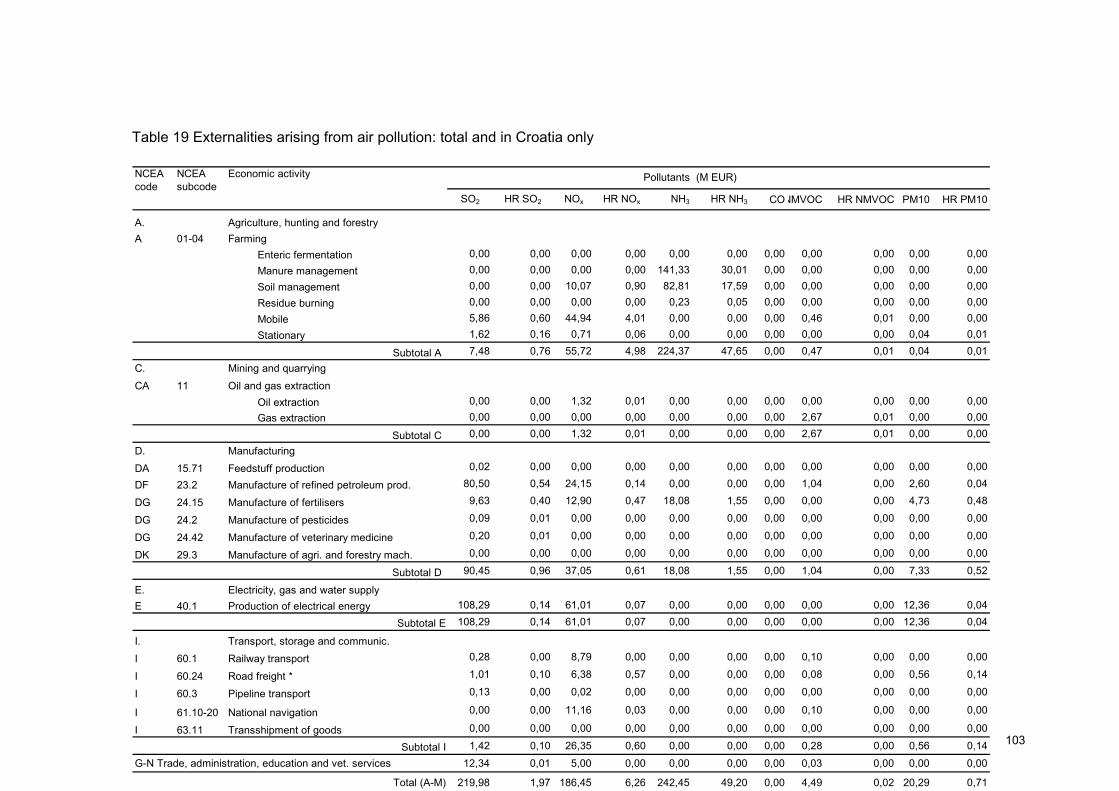
103
SO2 HR SO2 NOx HR NOx NH3 HR NH3 CONMVOC HR NMVOC PM10 HR PM10
A. Agriculture, hunting and forestryA 01-04 Farming
Enteric fermentation 0,00 0,00 0,00 0,00 0,00 0,00 0,00 0,00 0,00 0,00 0,00Manure management 0,00 0,00 0,00 0,00 141,33 30,01 0,00 0,00 0,00 0,00 0,00Soil management 0,00 0,00 10,07 0,90 82,81 17,59 0,00 0,00 0,00 0,00 0,00Residue burning 0,00 0,00 0,00 0,00 0,23 0,05 0,00 0,00 0,00 0,00 0,00Mobile 5,86 0,60 44,94 4,01 0,00 0,00 0,00 0,46 0,01 0,00 0,00Stationary 1,62 0,16 0,71 0,06 0,00 0,00 0,00 0,00 0,00 0,04 0,01
Subtotal A 7,48 0,76 55,72 4,98 224,37 47,65 0,00 0,47 0,01 0,04 0,01C. Mining and quarrying
CA 11 Oil and gas extractionOil extraction 0,00 0,00 1,32 0,01 0,00 0,00 0,00 0,00 0,00 0,00 0,00Gas extraction 0,00 0,00 0,00 0,00 0,00 0,00 0,00 2,67 0,01 0,00 0,00
Subtotal C 0,00 0,00 1,32 0,01 0,00 0,00 0,00 2,67 0,01 0,00 0,00D. ManufacturingDA 15.71 Feedstuff production 0,02 0,00 0,00 0,00 0,00 0,00 0,00 0,00 0,00 0,00 0,00
DF 23.2 Manufacture of refined petroleum prod. 80,50 0,54 24,15 0,14 0,00 0,00 0,00 1,04 0,00 2,60 0,04
DG 24.15 Manufacture of fertilisers 9,63 0,40 12,90 0,47 18,08 1,55 0,00 0,00 0,00 4,73 0,48
DG 24.2 Manufacture of pesticides 0,09 0,01 0,00 0,00 0,00 0,00 0,00 0,00 0,00 0,00 0,00
DG 24.42 Manufacture of veterinary medicine 0,20 0,01 0,00 0,00 0,00 0,00 0,00 0,00 0,00 0,00 0,00
DK 29.3 Manufacture of agri. and forestry mach. 0,00 0,00 0,00 0,00 0,00 0,00 0,00 0,00 0,00 0,00 0,00
Subtotal D 90,45 0,96 37,05 0,61 18,08 1,55 0,00 1,04 0,00 7,33 0,52
E. Electricity, gas and water supplyE 40.1 108,29 0,14 61,01 0,07 0,00 0,00 0,00 0,00 0,00 12,36 0,04
Subtotal E 108,29 0,14 61,01 0,07 0,00 0,00 0,00 0,00 0,00 12,36 0,04
I. Transport, storage and communic.I 60.1 Railway transport 0,28 0,00 8,79 0,00 0,00 0,00 0,00 0,10 0,00 0,00 0,00
I 60.24 Road freight * 1,01 0,10 6,38 0,57 0,00 0,00 0,00 0,08 0,00 0,56 0,14
I 60.3 Pipeline transport 0,13 0,00 0,02 0,00 0,00 0,00 0,00 0,00 0,00 0,00 0,00
I 61.10-20 National navigation 0,00 0,00 11,16 0,03 0,00 0,00 0,00 0,10 0,00 0,00 0,00
I 63.11 0,00 0,00 0,00 0,00 0,00 0,00 0,00 0,00 0,00 0,00 0,00
Subtotal I 1,42 0,10 26,35 0,60 0,00 0,00 0,00 0,28 0,00 0,56 0,14
G-N Trade, administration, education and vet. services 12,34 0,01 5,00 0,00 0,00 0,00 0,00 0,03 0,00 0,00 0,00
Total (A-M) 219,98 1,97 186,45 6,26 242,45 49,20 0,00 4,49 0,02 20,29 0,71
NCEA code
Transshipment of goods
Production of electrical energy
NCEA subcode
Economic activity Pollutants (M EUR)
Table 19 Externalities arising from air pollution: total and in Croatia only
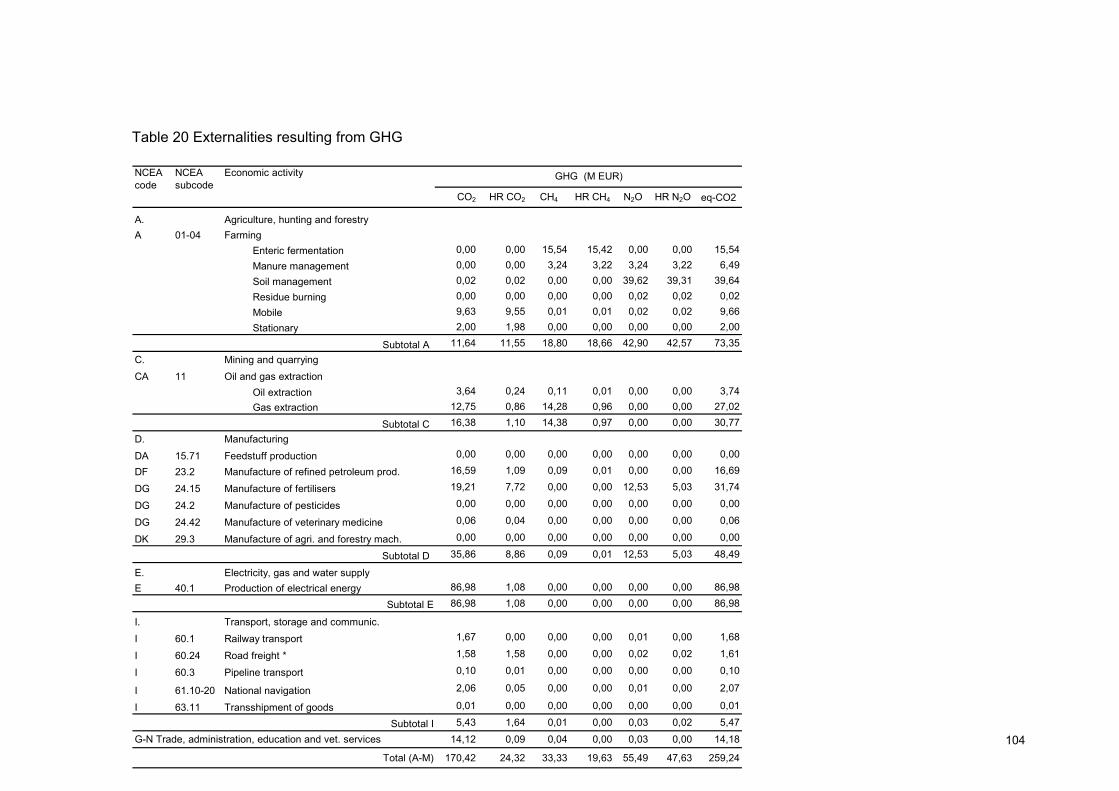
104
CO2 HR CO2 CH4 HR CH4 N2O HR N2O eq-CO2
A. Agriculture, hunting and forestryA 01-04 Farming
Enteric fermentation 0,00 0,00 15,54 15,42 0,00 0,00 15,54Manure management 0,00 0,00 3,24 3,22 3,24 3,22 6,49Soil management 0,02 0,02 0,00 0,00 39,62 39,31 39,64Residue burning 0,00 0,00 0,00 0,00 0,02 0,02 0,02Mobile 9,63 9,55 0,01 0,01 0,02 0,02 9,66Stationary 2,00 1,98 0,00 0,00 0,00 0,00 2,00
Subtotal A 11,64 11,55 18,80 18,66 42,90 42,57 73,35C. Mining and quarryingCA 11 Oil and gas extraction
Oil extraction 3,64 0,24 0,11 0,01 0,00 0,00 3,74Gas extraction 12,75 0,86 14,28 0,96 0,00 0,00 27,02
Subtotal C 16,38 1,10 14,38 0,97 0,00 0,00 30,77D. Manufacturing
DA 15.71 Feedstuff production 0,00 0,00 0,00 0,00 0,00 0,00 0,00
DF 23.2 Manufacture of refined petroleum prod. 16,59 1,09 0,09 0,01 0,00 0,00 16,69
DG 24.15 Manufacture of fertilisers 19,21 7,72 0,00 0,00 12,53 5,03 31,74
DG 24.2 Manufacture of pesticides 0,00 0,00 0,00 0,00 0,00 0,00 0,00
DG 24.42 Manufacture of veterinary medicine 0,06 0,04 0,00 0,00 0,00 0,00 0,06
DK 29.3 Manufacture of agri. and forestry mach. 0,00 0,00 0,00 0,00 0,00 0,00 0,00
Subtotal D 35,86 8,86 0,09 0,01 12,53 5,03 48,49
E. Electricity, gas and water supplyE 40.1 86,98 1,08 0,00 0,00 0,00 0,00 86,98
Subtotal E 86,98 1,08 0,00 0,00 0,00 0,00 86,98
I. Transport, storage and communic.
I 60.1 Railway transport 1,67 0,00 0,00 0,00 0,01 0,00 1,68
I 60.24 Road freight * 1,58 1,58 0,00 0,00 0,02 0,02 1,61
I 60.3 Pipeline transport 0,10 0,01 0,00 0,00 0,00 0,00 0,10
I 61.10-20 National navigation 2,06 0,05 0,00 0,00 0,01 0,00 2,07
I 63.11 0,01 0,00 0,00 0,00 0,00 0,00 0,01
Subtotal I 5,43 1,64 0,01 0,00 0,03 0,02 5,47
G-N Trade, administration, education and vet. services 14,12 0,09 0,04 0,00 0,03 0,00 14,18
Total (A-M) 170,42 24,32 33,33 19,63 55,49 47,63 259,24
NCEA code
Transshipment of goods
Production of electrical energy
NCEA subcode
Economic activity GHG (M EUR)
Table 20 Externalities resulting from GHG
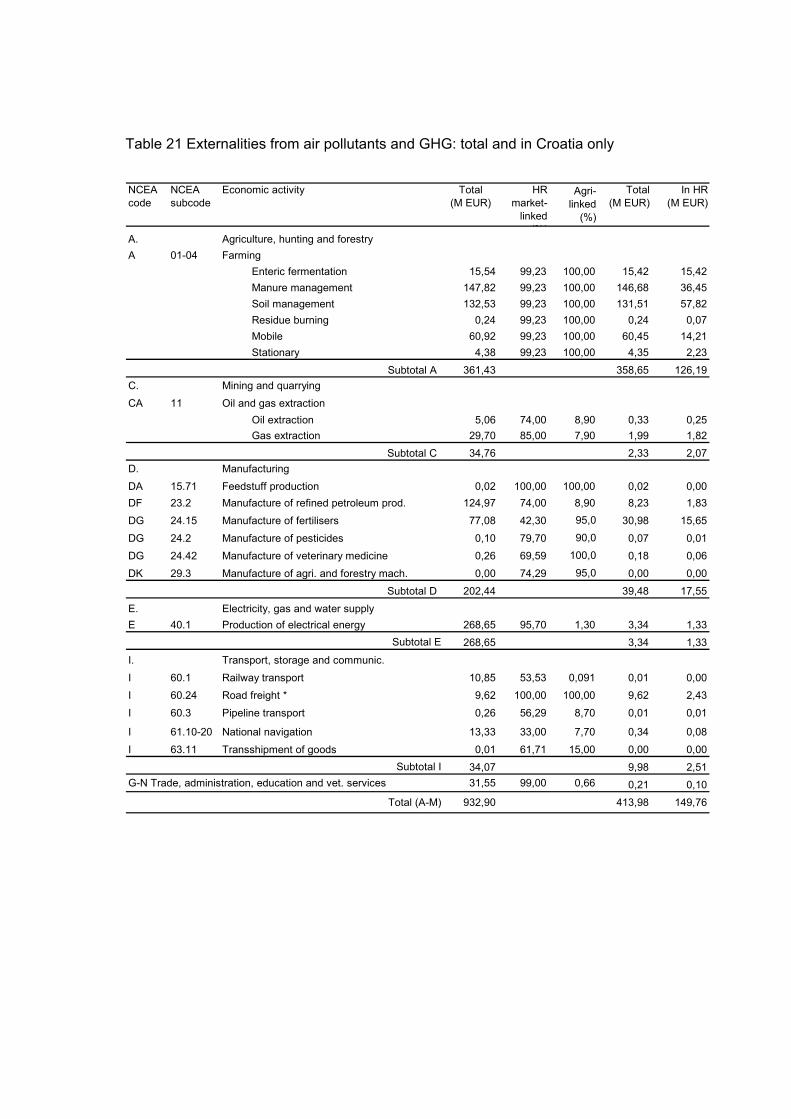
Table 21 Externalities from air pollutants and GHG: total and in Croatia only
A. Agriculture, hunting and forestryA 01-04 Farming
Enteric fermentation 15,54 99,23 100,00 15,42 15,42Manure management 147,82 99,23 100,00 146,68 36,45Soil management 132,53 99,23 100,00 131,51 57,82Residue burning 0,24 99,23 100,00 0,24 0,07Mobile 60,92 99,23 100,00 60,45 14,21Stationary 4,38 99,23 100,00 4,35 2,23
Subtotal A 361,43 358,65 126,19C. Mining and quarrying
CA 11 Oil and gas extractionOil extraction 5,06 74,00 8,90 0,33 0,25Gas extraction 29,70 85,00 7,90 1,99 1,82
Subtotal C 34,76 2,33 2,07D. ManufacturingDA 15.71 Feedstuff production 0,02 100,00 100,00 0,02 0,00DF 23.2 Manufacture of refined petroleum prod. 124,97 74,00 8,90 8,23 1,83
DG 24.15 Manufacture of fertilisers 77,08 42,30 95,0 30,98 15,65
DG 24.2 Manufacture of pesticides 0,10 79,70 90,0 0,07 0,01DG 24.42 Manufacture of veterinary medicine 0,26 69,59 100,0 0,18 0,06
DK 29.3 Manufacture of agri. and forestry mach. 0,00 74,29 95,0 0,00 0,00
Subtotal D 202,44 39,48 17,55E. Electricity, gas and water supplyE 40.1 268,65 95,70 1,30 3,34 1,33
Subtotal E 268,65 3,34 1,33
I. Transport, storage and communic.
I 60.1 Railway transport 10,85 53,53 0,091 0,01 0,00I 60.24 Road freight * 9,62 100,00 100,00 9,62 2,43
I 60.3 Pipeline transport 0,26 56,29 8,70 0,01 0,01
I 61.10-20 National navigation 13,33 33,00 7,70 0,34 0,08
I 63.11 0,01 61,71 15,00 0,00 0,00Subtotal I 34,07 9,98 2,51
G-N Trade, administration, education and vet. services 31,55 99,00 0,66 0,21 0,10
Total (A-M) 932,90 413,98 149,76
NCEA code
Transshipment of goods
Production of electrical energy
NCEA subcode
Economic activity In HR (M EUR)
Agri-linked
(%)
Total (M EUR)
Total (M EUR)
HR market-
linked (%)
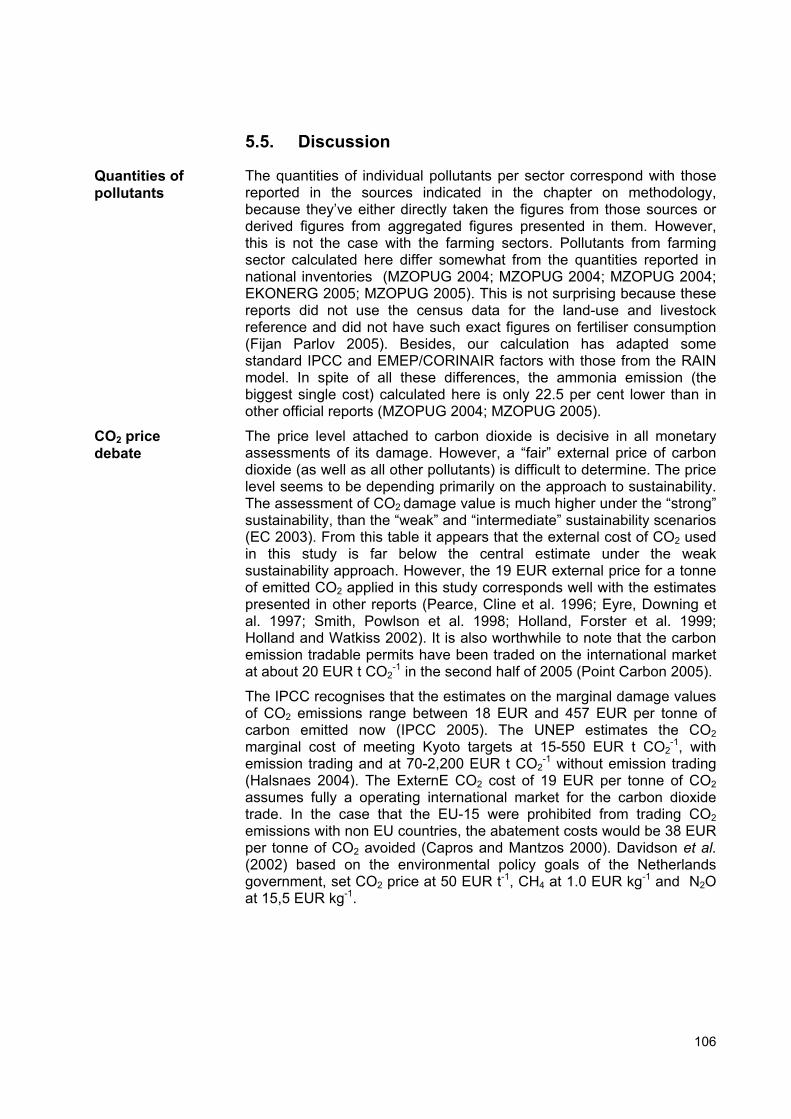
106
5.5. Discussion
The quantities of individual pollutants per sector correspond with those reported in the sources indicated in the chapter on methodology, because they’ve either directly taken the figures from those sources or derived figures from aggregated figures presented in them. However, this is not the case with the farming sectors. Pollutants from farming sector calculated here differ somewhat from the quantities reported in national inventories (MZOPUG 2004; MZOPUG 2004; MZOPUG 2004; EKONERG 2005; MZOPUG 2005). This is not surprising because these reports did not use the census data for the land-use and livestock reference and did not have such exact figures on fertiliser consumption (Fijan Parlov 2005). Besides, our calculation has adapted some standard IPCC and EMEP/CORINAIR factors with those from the RAIN model. In spite of all these differences, the ammonia emission (the biggest single cost) calculated here is only 22.5 per cent lower than in other official reports (MZOPUG 2004; MZOPUG 2005).
The price level attached to carbon dioxide is decisive in all monetary assessments of its damage. However, a “fair” external price of carbon dioxide (as well as all other pollutants) is difficult to determine. The price level seems to be depending primarily on the approach to sustainability. The assessment of CO2 damage value is much higher under the “strong” sustainability, than the “weak” and “intermediate” sustainability scenarios (EC 2003). From this table it appears that the external cost of CO2 used in this study is far below the central estimate under the weak sustainability approach. However, the 19 EUR external price for a tonne of emitted CO2 applied in this study corresponds well with the estimates presented in other reports (Pearce, Cline et al. 1996; Eyre, Downing et al. 1997; Smith, Powlson et al. 1998; Holland, Forster et al. 1999; Holland and Watkiss 2002). It is also worthwhile to note that the carbon emission tradable permits have been traded on the international market at about 20 EUR t CO2
-1 in the second half of 2005 (Point Carbon 2005).
The IPCC recognises that the estimates on the marginal damage values of CO2 emissions range between 18 EUR and 457 EUR per tonne of carbon emitted now (IPCC 2005). The UNEP estimates the CO2 marginal cost of meeting Kyoto targets at 15-550 EUR t CO2
-1, with emission trading and at 70-2,200 EUR t CO2
-1 without emission trading (Halsnaes 2004). The ExternE CO2 cost of 19 EUR per tonne of CO2 assumes fully a operating international market for the carbon dioxide trade. In the case that the EU-15 were prohibited from trading CO2 emissions with non EU countries, the abatement costs would be 38 EUR per tonne of CO2 avoided (Capros and Mantzos 2000). Davidson et al. (2002) based on the environmental policy goals of the Netherlands government, set CO2 price at 50 EUR t-1, CH4 at 1.0 EUR kg-1 and N2O at 15,5 EUR kg-1.
Quantities of pollutants
CO2 price debate
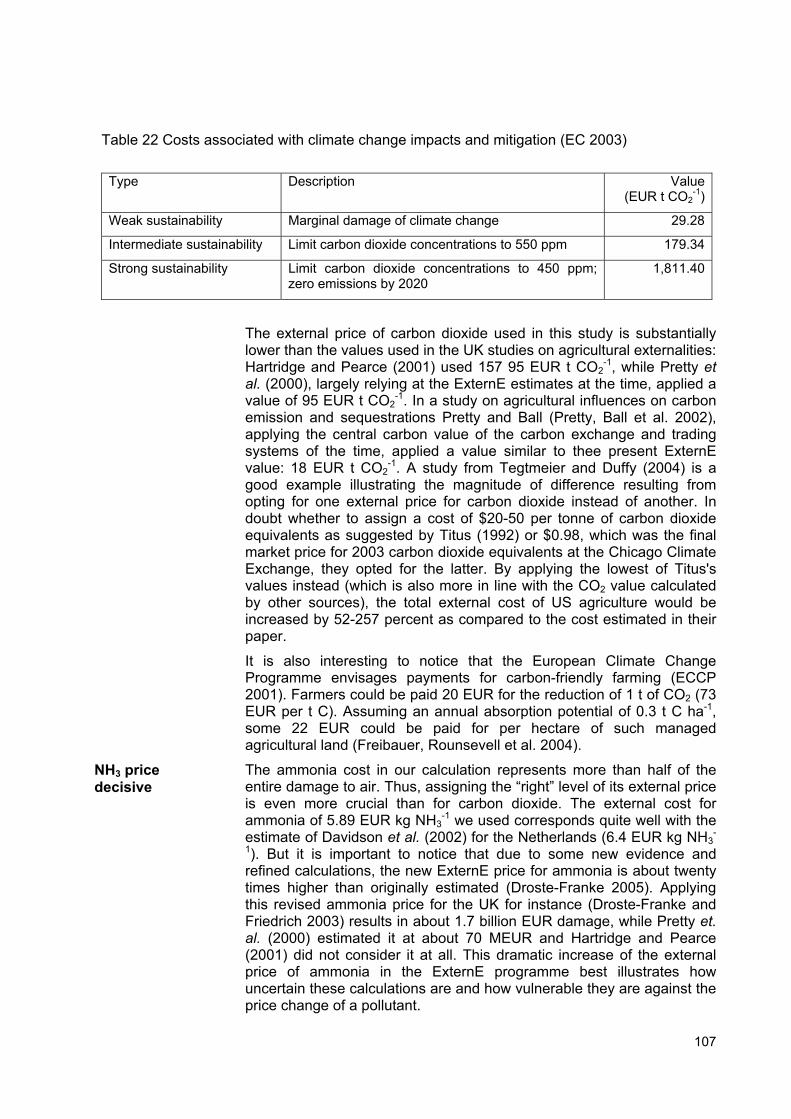
107
Table 22 Costs associated with climate change impacts and mitigation (EC 2003)
Type Description Value (EUR t CO2
-1)
Weak sustainability Marginal damage of climate change 29.28
Intermediate sustainability Limit carbon dioxide concentrations to 550 ppm 179.34
Strong sustainability Limit carbon dioxide concentrations to 450 ppm; zero emissions by 2020
1,811.40
The external price of carbon dioxide used in this study is substantially lower than the values used in the UK studies on agricultural externalities: Hartridge and Pearce (2001) used 157 95 EUR t CO2
-1, while Pretty et al. (2000), largely relying at the ExternE estimates at the time, applied a value of 95 EUR t CO2
-1. In a study on agricultural influences on carbon emission and sequestrations Pretty and Ball (Pretty, Ball et al. 2002), applying the central carbon value of the carbon exchange and trading systems of the time, applied a value similar to thee present ExternE value: 18 EUR t CO2
-1. A study from Tegtmeier and Duffy (2004) is a good example illustrating the magnitude of difference resulting from opting for one external price for carbon dioxide instead of another. In doubt whether to assign a cost of $20-50 per tonne of carbon dioxide equivalents as suggested by Titus (1992) or $0.98, which was the final market price for 2003 carbon dioxide equivalents at the Chicago Climate Exchange, they opted for the latter. By applying the lowest of Titus's values instead (which is also more in line with the CO2 value calculated by other sources), the total external cost of US agriculture would be increased by 52-257 percent as compared to the cost estimated in their paper.
It is also interesting to notice that the European Climate Change Programme envisages payments for carbon-friendly farming (ECCP 2001). Farmers could be paid 20 EUR for the reduction of 1 t of CO2 (73 EUR per t C). Assuming an annual absorption potential of 0.3 t C ha-1, some 22 EUR could be paid for per hectare of such managed agricultural land (Freibauer, Rounsevell et al. 2004).
The ammonia cost in our calculation represents more than half of the entire damage to air. Thus, assigning the “right” level of its external price is even more crucial than for carbon dioxide. The external cost for ammonia of 5.89 EUR kg NH3
-1 we used corresponds quite well with the estimate of Davidson et al. (2002) for the Netherlands (6.4 EUR kg NH3
-
1). But it is important to notice that due to some new evidence and refined calculations, the new ExternE price for ammonia is about twenty times higher than originally estimated (Droste-Franke 2005). Applying this revised ammonia price for the UK for instance (Droste-Franke and Friedrich 2003) results in about 1.7 billion EUR damage, while Pretty et. al. (2000) estimated it at about 70 MEUR and Hartridge and Pearce (2001) did not consider it at all. This dramatic increase of the external price of ammonia in the ExternE programme best illustrates how uncertain these calculations are and how vulnerable they are against the price change of a pollutant.
NH3 price decisive
108
Country Year CO2 SO2 NOx
Poland 2000 0.05 85.0 85.0 Lithuania 2000 5.50 56.3 105.5 Latvia 2000 12.62 17.9 17.9 Czech Republic 2000 26.69 28.0 22.0 Slovakia 2000 36.74 46.7 35.0 Denmark 2000 N/A 1,340.0 N/AFrance 2000 N/A 27.4 22.9 Italy 2000 N/A 53.2 105.0 Norway 2000 N/A 2,100.0 N/ASpain (Galicia only) 2000 N/A 33.0 33.0 Sweden 2000 N/A 6,940.0 4,630.0 Croatia, maximum 2005 1.60 25.6 25.6 Croatia "discounted" 2005 1.00 15.9 15.9
Current Croatian charges for the emission of air pollutants (N.N. 2004) are generally below those applied in other European counties in 2000, as seen in Table 23, which is based of the figures presented by the REC (2001). Their level is just some 1-7 percent of the value of air pollutant tradable permits currently traded on the international market (Evomarkets 2005; Point Carbon 2005).
Table 23 Emission taxes/charges for selected countries (in EUR)
Last but not least - it is worthwhile to mention that the damage factors for air pollutants used in our study are some 30-50% lower than the damage factors used by the Croatian institute EKONERG in a recent feasibility study on Croatian public heating plants (Vešligaj 2005).
Croatian charges for air pollutants
109
6. DAMAGE TO WATER
6.1. Water and agriculture
Agriculture consumes about 70% of fresh water used worldwide (Postel 2001; Pimentel, Berger et al. 2004). Agricultural operations, such as soil tillage, manuring, grazing, spraying and irrigation, pose a serious threat to water quality and water habitats (Pretty, Mason et al. 2003) and agriculture is the largest single source of nutrients in the waters of many countries (ECE 1992; Quiang 1992; Rekolainen and Kauppi 1993; RIVM 1993; Haskoning 1994; Znaor and Bošnjaković 1998; Znaor 1999; Yin, Yang et al. 2001; EPA 2002; Stalnacke, Vandsemb et al. 2004; Granlund, Raike et al. 2005; Kronvang, Jeppesen et al. 2005; Norse 2005; Oenema, van Liere et al. 2005). As well as agricultural practices, the agri-chemical industry that serves agriculture also causes significant levels of pollution. In Romania, for instance, a single fertiliser producer contributes 14 percent to the total Romanian phosphate discharge into the Danube river (Toma 1999).
Unlike other economic sectors, notably industry, agriculture is not only a source of water pollution and over-usage - it is also a victim of such pollution. Water availability and water quality are among the most essential factors in the cultivation of plants and the rearing of livestock (Znaor 1999). Environmental problems related to water pollution are amplified by consumption patterns particularly the increase of animal protein consumption (Haskoning 1994; Vollenbroek and Csikós 1995). The quantity of water required to produce one kg of dry yield ranges from about 300 to 2,000 L per kg dry crop yield (Pimentel, Berger et al. 2004), while beef production requires up to 16,000 L (Chapagain and Hoekstra 2003; Hoekstra 2003) and sheep up to 50,000 L per kilogram (Pimentel 2005).
6.2. Pathways of entering water and type of pollutants
Agricultural pollutants (fertilizers, pesticides, silage effluent, organic manures and other farm wastes) enter the water through runoff, erosion, leaching, base-flow and direct inputs such as manure discharge and pesticide drift (Haskoning 1994; Wit, Posma et al. 1999; Znaor 1999; Delgado 2002; Kronvang, Grant et al. 2002).
The most important water pollutants that originate in agriculture are: nutrients, pesticides, pathogens, heavy metals, oxygen-demanding (depleting) substances, fats and oil, radioactive substances and GMOs (Haskoning 1994; Vollenbroek and Csikós 1995; Znaor and Bošnjaković 1998).
6.2.1 Nitrogen balance and losses to water Nitrogen is dynamic and mobile. Its fate and transport in agricultural systems is affected by management and unpredictable events. The average global efficiency of nitrogen use has been reported to be about 50 percent and even as low as 33 percent for cereals. (Delgado 2002; Delgado, Dillon et al. 2004). Similar nitrogen efficiency rates have been reported by other authors too (SOS 2002; Leach, Allingham et al. 2004).
Agriculture as threat to water
Agriculture as water victim
Pathways
Type of pollutants
Nitrogen efficiency in agriculture
110
The nitrogen cost, defined as the ratio between fertilizer N-input (including animal manure) and the nitrogen in products, is around 3 for wheat, 14 for dairy products and 21 for meat (Bleken and Bakken 1997).
The nitrogen surplus is the difference between the sum of nitrogen supplied to agricultural land (fertilisers, livestock manures, biological N fixation, atmospheric deposition) and nitrogen withdrawn by harvested crops and animal production (OECD 2001). The nitrogen surplus indicates the nitrogen pollution potential. A negative balance over time can cause soil fertility loss, while a large surplus indicates a potential environmental risk due to nutrient loss to water and the atmosphere. The average nitrogen surplus in the period 1995-97 for the OECD countries was 23 kg N ha-1, for the USA 31 kg N ha-1 and for the EU 58 kg N ha-1 of agricultural land (OECD 2001). According to Brouwer, et al. (1999) the nitrogen surplus remains below 50 kg N ha-1 on almost 50% of the agricultural land in the EU. It exceeds 100 kg N ha-1 on a further 22%, and is in excess of 200 kg N ha-1 on only 2% of agricultural land. According to Terres (2002) the average nitrogen surplus in the EU is 60 kg N ha-1, but the distribution of the balances shows high surplus amounts in regions of intensive livestock farming (Flanders, the Netherlands and Brittany), and low or deficit values in the central areas of Spain, France and Italy. The national annual nitrogen balance of agriculture in the Netherlands shows a surplus of 213 kg N ha-1, while the surplus of Luxemburg is 121 kg N ha-1 (EEA 2000) The Swedish Bureau of Statistics (SOS 2002) reported an agricultural annual nitrogen budget of 70 kg N ha-1, while the N balance of the Baltic States in the mid nineties was 5-75 kg N ha-1 (Vagstad, Stalnacke et al. 2004). The annual agricultural nitrogen balance of Slovenia is estimated at 73.6 kg N ha-1 and for Serbia & Montenegro at 11.9 kg N ha-1 (Redman 2003).
Stringent (agri)environmental policy in the EU countries has caused considerable changes in agricultural practices, leading to a reduction of the net N-surpluses. In Denmark for instance, the annual N surplus decreased from 136 to 88 kg N ha-1 (41 percent reduction) and the net P-surplus from 19 to 11 kg P ha-1 (42 percent reduction) during the period 1985-2002. (Kronvang, Jeppesen et al. 2005).
The UK figures on nitrogen balance of agriculture are a good example of the questionable reliability of data on national agricultural nitrogen balances loss pathways even in the countries with well-organised statistics. These data are often scarce, old and remain arbitrary. The nitrogen balance for the UK in the mid nineties varies from source to source. According to the UK Ministry of Agriculture (MAAF 2000) nitrate losses to water in the mid nineties were approximately 35 kg N ha-1. The OECD indicates that the total UK agricultural nitrogen balance (N inputs minus N plant uptake) in the period 1994-95 was 35 kg N ha-1 (Parris 1999), in 93 kg N ha-1 in 1994 (OECD 2000) and 86 kg N ha-1 in the period 1995-1997 (OECD 2001). However, according to Lord et al. (Lord, Anthony et al. 2002), the agricultural nitrogen balance for the UK in 1995 was 115 kg N ha-1, while a national inventory of the mass nitrogen balance suggests that the UK nitrogen surplus from agriculture in 1998 was 166 kg N ha-1 (HRI 2002). These differences are not surprising, taking into account that some of the basic input data for such calculations are also controversial. DEFRA (2002) for instance estimates
National and regional N surpluses
Even the UK N balance questionable
111
that UK figures for the production of manure “range from 90 to 170 million tonnes/year, around 90% of all organic 'waste' production”, while in another document (DEFRA 2002) it says that British farmers “every year spread about 80 million tonnes of animal manures onto the land as fertiliser”. A national nitrogen balance for the UK that is more recent than 1995-1998 doesn’t seem to exist.
In spite of the several calculation models that are available, the reliability of nitrogen budgeting still remains arbitrary. Watson and Atkinson (1999) compared three approaches to nitrogen budgeting. Depending on the complexity of the method and calculation objectives, the three approaches resulted in a nitrogen surplus of 188, 212 and 285 kg N ha-1 year-1.
Nutrient efficiency, defined as the percentage of outgoing over incoming nutrients, ranged from 11% (N) and 21% (P) on cattle and sheep farms in less favoured areas to 54% (both N and P) on cereal farms. The contribution from cropping versus livestock farming in the total efficiency varied widely between farm types. On the catchment scale the surplus associated with grassland and livestock (225 and 37 kg ha-1 of N and P) clearly exceeded that associated with arable crops (44 and 19 kg ha-1 of N and P) (Domburg, Edwards et al. 2000).
Nitrogen loss depends on several factors among which soil type and climate seem to dominate (SUM 2000). These determine precipitation and thus influence drainage and percolation, while temperature greatly influences plant growth, soil ecology, nitrogen utilization and atmospheric processes. In addition, management practices such as the type, timing and method of nutrient application also play an important role in nutrient losses (Goulding 2004).
The excess nitrogen, or surplus, is washed out into groundwater in the form of nitrate, eliminated through microbial denitrification and degassing of ammonia or stored in the organic soil fraction until a new balance is reached between nitrogen mineralisation and organic nitrogen input (OECD 2001; Schweigert and van der Ploeg 2002; Watson, Bengtsson et al. 2002). Duxbury et al. (1993) made an attempt to describe a typical nitrogen pathway once it has been applied in the form of fertiliser. Fifty percent is harvested in the crop and the other 50 percent is lost by a combination of leaching (25 percent), surface runoff (5 percent) and gaseous loss (20 percent), primarily denitrification. According to Layers (2001) for every 100 kg of fertilizer N applied 50 kg is taken up by the crop, leaving 50 kg to go elsewhere. Typically, 20 kg remains in soil organic matter, 10 kg is lost to drainage water and 20 kg is lost to the atmosphere. Other authors, however, report on different patterns of N loss pathways. The nitrogen balance for Sweden for instance indicates that 15.5 percent of the nitrogen surplus remains in the soil, while in the case of Germany this is as high as 28 percent (Isermann 1990; Isermann 1994).
Nitrate leaching is notoriously difficult to estimate and losses can vary from zero to 60 percent of the applied nitrogen. The losses from common grain-production systems would range from 10% to 30% of N added through fertilisers and manure (Gast, Nelson et al. 1978; McNeil and Pratt 1978; Legg and Meisinger 1982; Pratt 1984; Randall and
Problems with nutrient balances calculations
Losses depend on numerous factors
N loss pathways
Average leaching 10-50 percent of N applied
112
Iragavarapo 1995; Delgado 2002; Meisinger and Delgado 2002; Maene 2004). According to Mosier et al. (1998) some 30 percent of the nitrogen applied to agricultural fields is lost through leaching and runoff, of which about 2.5 percent is converted to N2O in aquatic systems. Some authors, however, report on slightly higher (30-50 percent) average nitrogen leaching losses (Bouwer 1987; Goderya, Dahab et al. 1996; Shamrukh, Corapcioglu et al. 2001). In an experiment during a wet season Allingham et al. (2003) reported N leaching of 70% of N applied on grass ley, 80% on forage maize and 380% on stubble turnips. Nitrogen loss is difficult to reduce without drastic reductions in fertiliser inputs or stocking rates (Leach, Allingham et al. 2004). Nitrogen loss to water can be greatly reduced through judicious feeding (type of feeds and ratio change), an improved utilization of manure and good balance between grassland and arable area. Following this policy Dutch experimental farms managed to reduce nitrate concentration in the upper groundwater from 200 to 50 mg NO3 L-1 within a few years (Aarts, Habekotté et al. 2000).
Silgram et al. (2001) made a comparison between the standard IPCC model for calculating national nitrate leaching, and two other approaches, a modified IPCC and NEAP-N, a UK simulation model. Their results showed large differences between the estimates for total leaching, ranging between 39 and 88 kg N ha-1. In the case of the UK, this would mean that the total annual nitrogen loss to water could be in the range between 455,064 and 1,026,810 tonnes of nitrogen (HRI 2002). Lord et al. (2002) omitted nitrogen input through aerial deposition in their calculation, but in spite of this arrived at a higher figure. According to them some 1,341,855 tonnes of nitrogen derived from UK agriculture enters water resources. The OECD estimates that nitrogen loss to water in the UK is approximately 40 percent of the surplus (OECD 2000). A similar figure (32-44 percent) has been reported also for Denmark (Kronvang, Grant et al. 2002).
6.3. Environmental problems
Pollution from agriculture causes serious environmental problems especially because aquifers have a slow rate of renewal (a long time is needed to restore the previous quality level) (OECD 1986; Pimentel, Berger et al. 2004).
Pesticides exceeding the maximum admissible concentrations are found in numerous ground water supplies in the EU (OECD 1986; Znaor and Bošnjaković 1998; Pretty and Hine 2005) causing a threat to human health and water ecosystems.
Agriculture-induced sedimentation takes place when wind, water, gravity or ice, transports soil particles and organic material from agricultural land to streams or lakes. Excessive sedimentation clouds the water reducing the amount of sunlight reaching aquatic plants; covering fish spawning areas and food supplies; and clogging the gills of fish (Brusven, Walker et al. 1995; Znaor 1999). The soil particles that enter water bodies in this way also carry nutrients (particularly phosphorus), pathogens, and heavy metals. Solids deposited in water bodies can accelerate eutrophication
National estimates on N ending in water depend on calculation method
Pesticides in water
Sedimentation
113
through the release of nutrients over extended periods of time, and decrease not only the overall productivity of waters but have a negative effect on their other functions (e.g recreational uses) as well (Pretty, Mason et al. 2003). In the US sediment forming (siltation) was found to be the most important environmental problem associated with rivers and streams and agriculture was responsible for almost 50% of the total sediment load (EPA 1998). Eroded soil particles have a negative impact on dams and other hydraulic structures and decrease the retention volume of water-bodies (Znaor 1999).
Eutrophication causes serious implications for the ecological balance in rivers, lakes and coastal water and can seriously affect drinking water quality. It results in excessive aquatic weed growth and algae bloom, reducing swimming and boating opportunities, and disrupting ecosystem equilibrium (ECE 1992; Vollenbroek and Csikós 1995; Pretty, Mason et al. 2003). High nutrient concentrations deplete oxygen and cause toxicity to aquatic fauna, and foul taste and odour in drinking water (Znaor 1999).
In addition, water pollution generated by agriculture raises a number of additional concerns because:
• the migration period for nitrates (also other nutrients) and pesticides to be washed out of the topsoil and leached into groundwater amounts to 10-20 years. This means that the groundwater pollution measured now reflects the grade of pollution which existed 10-20 years ago (RIVM/RIZA 1991);
• pesticide metabolites and "cocktails" may be more hazardous, more persistent or more toxic than the use of a single pesticide. Most of the sprays used in today agriculture are pesticide "cocktails" (Evans, Jevel et al. 1992)
• impurities in pesticides are usually not controlled and monitored and are often a greater hazard than that of the pesticides themselves (OECD 1986)
• existing analytical methods can detect only about half the active ingredients in pesticides today and monitoring programmes in many countries are limited or non-existent (RIVM/RIZA 1991).
• use of phosphorus fertilisers raises the radioactivity of soils and water (Barišić, Lulić et al. 1992; Znaor 1999)
• only a few countries have regulations with regard to the use and disposal of Baciloviruses and genetically modified organisms. Most of the regulations don't allow these organisms to be used in water catchments, although sometimes inactivated formulations (unable to multiply) are allowed (Znaor 1999).
Eutrophication
Wider problems
114
6.4. Impact on human health
6.4.1 Pesticides Pesticides cause various public health problems, although their effects are not widely recognised and their true extent remains unknown (Kishi 2005; Pretty, Heffron et al. 2005; Pretty and Waibel 2005). Globally, pesticides are estimated to cause 26 million human poisonings and 220,000 deaths each year (Richter 2002).
Pesticides are associated with cancer, neurological and reproductive effects, respiratory and skin disorders and impaired immune functions (Keifer 1997; Kreiger 2001; Kishi 2005). Many of the pesticide-related health problems are linked with water containing pesticides above the admissible levels. Exposure to pesticides raises the risk of cancer (Ejaz, Akram et al. 2004) and is associated with Parkinson’s disease (Seidler, Hellenbrand et al. 1996; Priyadarshi, Khuder et al. 2000; Priyadarshi, Khuder et al. 2001). Pesticides are found to activate human androgen receptors (Lemaire, Terouanne et al. 2004), and disturb metabolic processes in the blood (Ledirac, Antherieu et al. 2005). A study from Croatia suggests that 2,4-dichlorophenoxyacetic acid pesticides cause an increase in chromatid and chromosome breaks, a number of micronuclei and number of nuclear buds (Željezić and Garaj-Vrhovac 2004)
Nitroaromatic herbicides (e.g., dinitrophenol, dinoseb, dinitrocresol formulations) affect cellular metabolism and have been associated with hyperthermia (high body temperature), rapid breathing, dehydration, liver and kidney degeneration, and neutropenia (low numbers of immune system cells called neutrophils) following overexposure (Morgan 1989). Atrazine has been known to have adverse environmental and health impacts. It is categorised as a high environmental risk to ground water, a medium risk to surface water, aquatic species, acute and chronic health, and a low-risk to birds, mammals and non-target organisms (Mullen, Norton et al. 1997; Brethour and Weersink 2001). Atrazine present at low concentrations was found to be a strong inducer of homologous recombination (Besplug, Filkowski et al. 2004) and to contribute to dopaminergic system disorders (Rodriguez, Thiruchelvam et al. 2005). The herbicide, 2,4,5-T is believed to develop a skin condition called chloracne, resulting from low level contamination of this product with tetrachlorodibenzodioxin (TCDD, called dioxin) (Kimbrough 1990). Paraquat has resulted in fatal pulmonary edema following intentional and accidental overexposure (Klaassen, Amdur et al. 1986; Morgan 1989).
A number of fungicides are believed to cause respiratory and dermal irritation and/or sensitization (Morgan 1989).
Pesticides also cause endocrine disruption in wildlife (Gies 2003).
Croatian authorities consider organochlorinated pesticides, DDT and lindane as compounds of “high toxicity and proven tetragenic and carcinogenic properties” (Hrvatske vode 2002).
Global problem
Cause a range of health problems
Herbicides
115
6.4.2 Nitrates Higher nitrate concentrations in water are associated with a risk of coronary heart disease (Cerhan, Weyer et al. 2001) and cancer mortality (Criss and Davisson 2004). Nitrates are found to have a positive correlation with the development of various forms of cancer, such as: gastric cancer (Sandor, Kiss et al. 2001), esophageal cancer (Zhang, Zhang et al. 2003), urothelial cancer (Volkmer, Ernst et al. 2005), bladder and ovarian cancer (Weyer, Cerhan et al. 2001), non-Hodgkin lymphoma and colorectal cancer (Gulis, Czompolyova et al. 2002), as well as childhood brain tumours (Mueller, Nielsen et al. 2004). Nitrates impair thyroid function (Follett and Follett 2001; Eskiocak, Dundar et al. 2005) and are believed to cause intrauterine growth restriction and prematurity (Bukowski, Somers et al. 2001), as well as respiratory infection (Follett and Follett 2001). Nitrates and nitrites react with secondary amines in food, forming nitrosamines- compounds that have been demonstrated to cause a variety of adverse effects when administered to laboratory animals in high doses. These effects include liver and lung damage, convulsions, birth defects, and cancer (NRC 1981; EPA 1987).
The use of nitrate-contaminated drinking water to prepare infant formula causes a potentially fatal methemoglobinemia. This disorder is better known as the “blue baby syndrome”, deriving its name from skin colour. It develops as a result of nitrate conversion to nitrite, resulting in the compromised ability of haemoglobin to reversibly interact with oxygen, thus depriving tissues of oxygen. Nitrate-nitrogen concentrations as low as 30 mg L-1 have been found to cause methemoglobinemia (Knobeloch, Salna et al. 2000), which can be developed by children up to 8 years of age (Gupta, Gupta et al. 2000). Besides babies and children, people who receive kidney dialysis treatment are also very susceptible to methemoglobinemia (Follett and Follett 2001).
Studies from Campagnolo et al (2002) and Belilage et al., (2002) demonstrate that higher nitrate concentrations in drinking water can cause health problems and mortality by livestock. Water high in nitrate can also have detrimental effects on the health of farm animals, resulting in weight loss and poor feed conversion (Carter and Sneed 1987).
However, the level at which nitrate becomes toxic for humans and livestock remains a matter of harsh debate between scientists advocating the precautionary principle and scientists challenging the epidemiological evidence for direct relationships between nitrate and health (Boink and Speijers 2001; L’Hirondel and L’Hirondel 2002; Schroder, Scholefield et al. 2004).
6.4.3 Other water pollutants Pathogens (viruses and bacteria) as well as heavy metals (Cd, Cu, Zn) deriving from agricultural inputs and operations can also cause water pollution and consequently severe health problems for humans, livestock and wildlife
Associated with numerous health problems
Can cause mortality of infants
... and animals
116
6.5. Water valuation methods
Although the studies on water valuation and water externalities date from as early as the mid eighties (Radford 1983) no uniformed approach has been developed yet. Instead a variety of methods are employed. Methodological difficulties, lack of data and a high degree of uncertainly have been reported as key difficulties in assessing water-related externalities (Forster, Watkiss et al. 2003; Pretty, Mason et al. 2003; von Blottnitz, Rabl et al. 2004). A comprehensive overview on water functions and water valuation methods is given in (FAO 2004).
Pretty et. al. (2003) stress that externalities in the water sector have four features: • their costs are often neglected • they often occur with a time lag • they often damage groups whose interests are not well represented • the identity of the source of the externality is not always known.
According to van Beukering et al. (1998) in the water sector many effects cannot be estimated in monetary terms and it is necessary to estimate certain externalities using non-monetary evaluation methods. Poe (1999) stresses that water-related externalities (costs and benefits) are large, concurrent and widely varying by location and affected population. Agriculture’s contribution to the pollution of surface water and contamination of groundwater is particularly difficult as the share of this sector in the degradation of water quality is difficult to determine and quantify (Ongley 1996). A particular problem is the valuation of nitrates and pesticides impacts. These are very difficult to quantify, because both pollutants are largely controlled through drinking water regulations (Forster, Watkiss et al. 2003).
Although water pollution is primarily associated with costs, Pretty at al. (2003) stress that there also might be some benefits of water pollution. In the case of eutrophication the benefits include: • Increased productivity of some fisheries • Positive fertilisation effect on farmland through the use of nutrient-
enriched irrigation water • Improved sources of food for some wild birds.
In order to obtain the true cost of pollution these benefits should be assessed against the costs.
Pretty et al. (2003) distinguish between two main cost categories and several sub-cost categories relating to water nutrient enrichment:
1. Damage (or value loss) costs arising from reductions in the value of clean or non-nutrient enriched water. These are further subdivided into:
a. Use values: private benefits gained from ecosystem services. These include private uses (e.g. agriculture, industry), recreation benefits (e.g. fishing, water sports, bird watching), education benefits, general amenity benefits, and option values (the desire of an individual to maintain the choice to use an ecosystem’s services in the future).
No standard valuation method available
Water externality features
Difficulties and limitations
Water pollution benefits
Cost categories
117
b. Non-use values comprise existence values (preservation of an asset, even though individuals do not envisage using it) and bequest values (attached to preservation so that a future generation has an option for use.
2. Policy costs incurred in responding to eutrophication damage plus the costs of changing practices to meet legal obligations
Figure 15 outlines the key cost categories as used in some recent studies on water valuation and water externalities.
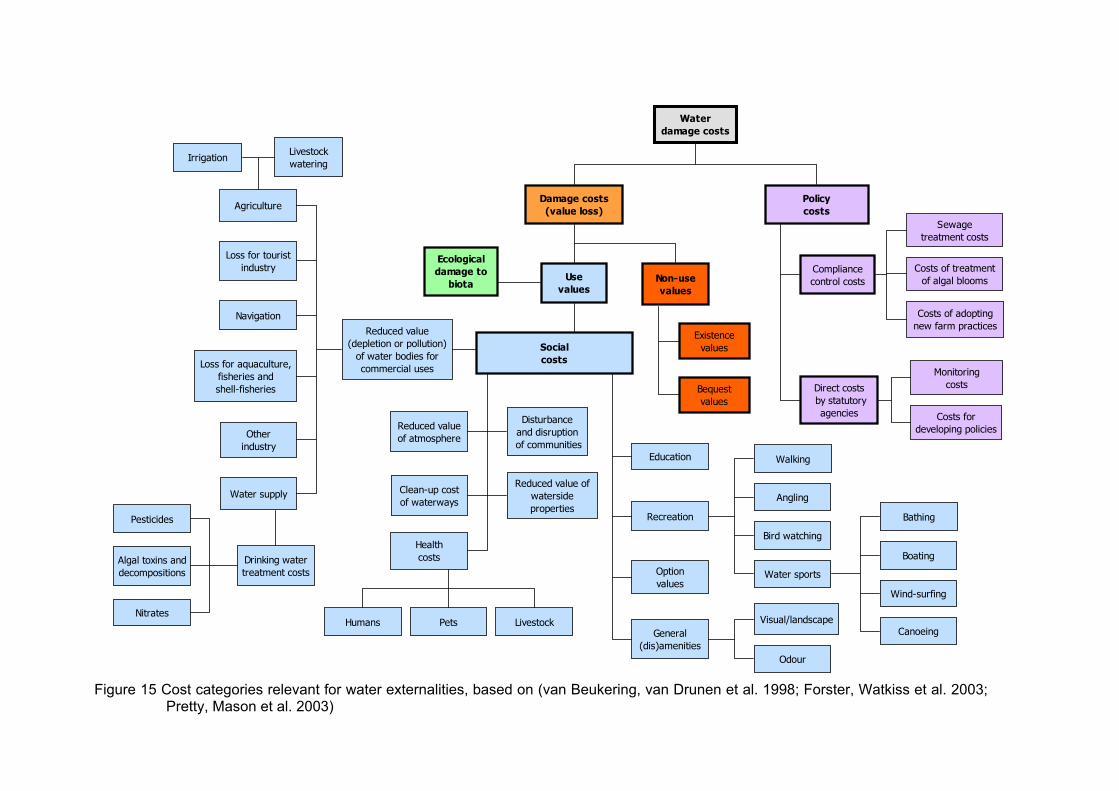
Waterdamage costs
Damage costs(value loss)
Policycosts
Socialcosts
Optionvalues
Recreation
Education
General(dis)amenities
Usevalues
Non-usevalues
Existencevalues
Bequestvalues
Reduced value(depletion or pollution)
of water bodies forcommercial uses
Water supply
Agriculture
Navigation
Otherindustry
Drinking watertreatment costs
Algal toxins anddecompositions
Clean-up costof waterways
Walking
Bird watching
Reduced value ofwatersideproperties
Reduced valueof atmosphere
Loss for touristindustry
Loss for aquaculture,fisheries andshell-fisheries
Healthcosts
IrrigationLivestockwatering
Water sports
Visual/landscape
Odour
LivestockPetsHumans
Disturbanceand disruption
of communities
Ecologicaldamage to
biotaCompliancecontrol costs
Direct costs by statutory
agencies
Sewagetreatment costs
Costs of treatmentof algal blooms
Costs of adoptingnew farm practices
Monitoringcosts
Costs fordeveloping policies
Nitrates
Pesticides Bathing
Boating
Wind-surfing
Canoeing
Angling
Figure 15 Cost categories relevant for water externalities, based on (van Beukering, van Drunen et al. 1998; Forster, Watkiss et al. 2003; Pretty, Mason et al. 2003)
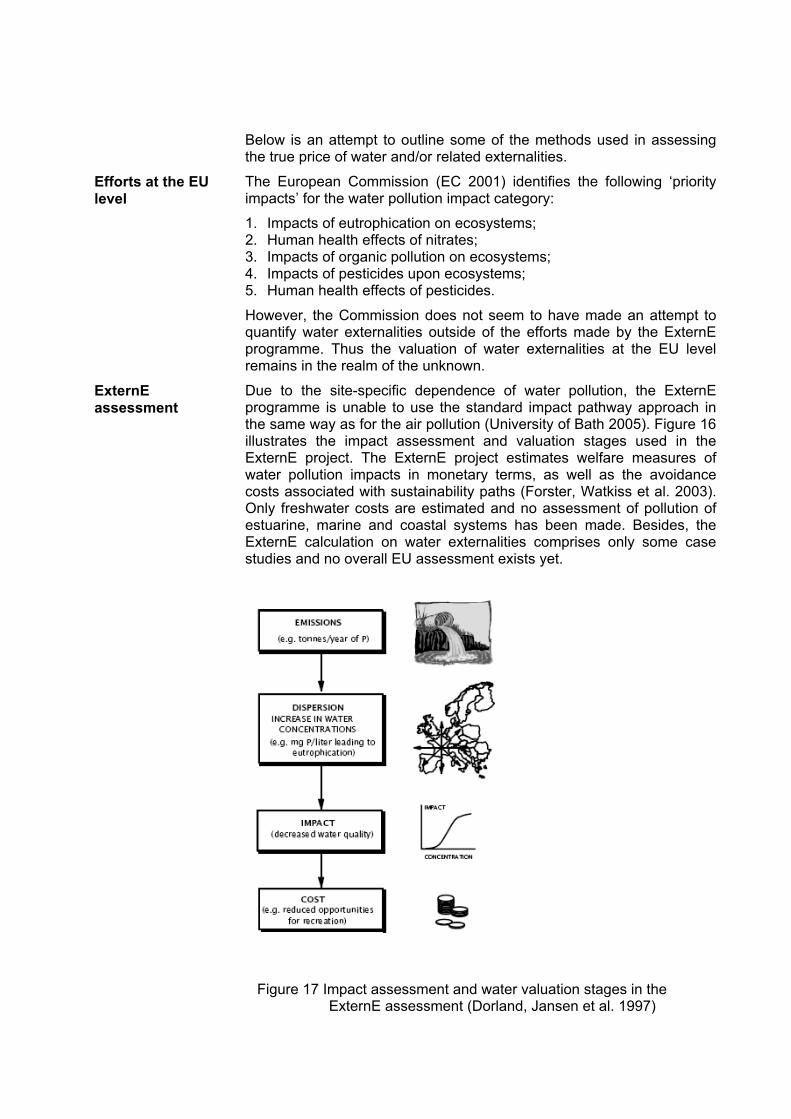
Below is an attempt to outline some of the methods used in assessing the true price of water and/or related externalities.
The European Commission (EC 2001) identifies the following ‘priority impacts’ for the water pollution impact category:
1. Impacts of eutrophication on ecosystems; 2. Human health effects of nitrates; 3. Impacts of organic pollution on ecosystems; 4. Impacts of pesticides upon ecosystems; 5. Human health effects of pesticides.
However, the Commission does not seem to have made an attempt to quantify water externalities outside of the efforts made by the ExternE programme. Thus the valuation of water externalities at the EU level remains in the realm of the unknown.
Due to the site-specific dependence of water pollution, the ExternE programme is unable to use the standard impact pathway approach in the same way as for the air pollution (University of Bath 2005). Figure 16 illustrates the impact assessment and valuation stages used in the ExternE project. The ExternE project estimates welfare measures of water pollution impacts in monetary terms, as well as the avoidance costs associated with sustainability paths (Forster, Watkiss et al. 2003). Only freshwater costs are estimated and no assessment of pollution of estuarine, marine and coastal systems has been made. Besides, the ExternE calculation on water externalities comprises only some case studies and no overall EU assessment exists yet.
Figure 17 Impact assessment and water valuation stages in the
ExternE assessment (Dorland, Jansen et al. 1997)
Efforts at the EU level
ExternE assessment
120
6.5.1 Contingent valuation Contingent valuation measuring citizens’ WTP for an improvement in water quality has widely been used to value water and related externalities (Bockstael, Hanemann et al. 1987; Bockstael, McConnell et al. 1989; Choe, Whittington et al. 1994; Zylicz, Bateman et al. 1995; Brouwer, Langford et al. 1997; Bockstael, Freeman et al. 2000). Depending on the region and the extent of the problem, households seem to be willing to pay monthly 3.8 EUR in Greece (Kontogianni, Langford et al. 2003), 5.3 EUR in Latvia (Ready, Malzubris et al. 2002) and 7.8-9.7 EUR in the USA (Kramer and Eisen-Hecht 2002; Mathews, Homans et al. 2002) for the water cleanup programmes. Besides WTP for the cleanup operations, residents are also willing to contribute in non-monetary ways (mainly their time), which can represent 60% of the total value for the non-marketed benefits (Alam and Marinova 2003). Another contingent valuation method is willingness to accept (WTA) compensation to tolerate environmental damage. This method has also widely been used to assess external costs of pollution (Carson 2000; Pretty, Mason et al. 2003; Perman 2004).
However, the applicability of the contingent valuation method in assessing water pollution caused by adverse agricultural practices seems to be limited as hardy any of such studies seemed to have used this method.
6.5.2 Pollution abatement and shadow prices method A shadow price derived from the pollution abatement costs is another known method to valuate water pollution. This method is mostly used to assess the cost of water pollution generated through the excessive use of nitrogen. Studies on the costs involved in abating nitrogen entering water exist in several countries. Although these studies do not necessarily apply the same theoretical framework and calculation methods, a number of them have obtained similar value ranges for nitrogen shadow prices.
Table 24 outlines the results of some of these studies. In order to make a better comparison between the studies, the nitrogen shadow price from the reference year has been updated to the 2005 value by applying an annual price increase of 5%. The average 2005 nitrogen shadow price based on these studies would be 3.1 EUR per kg of nitrogen.
Widely used
N shadow price similar in several studies
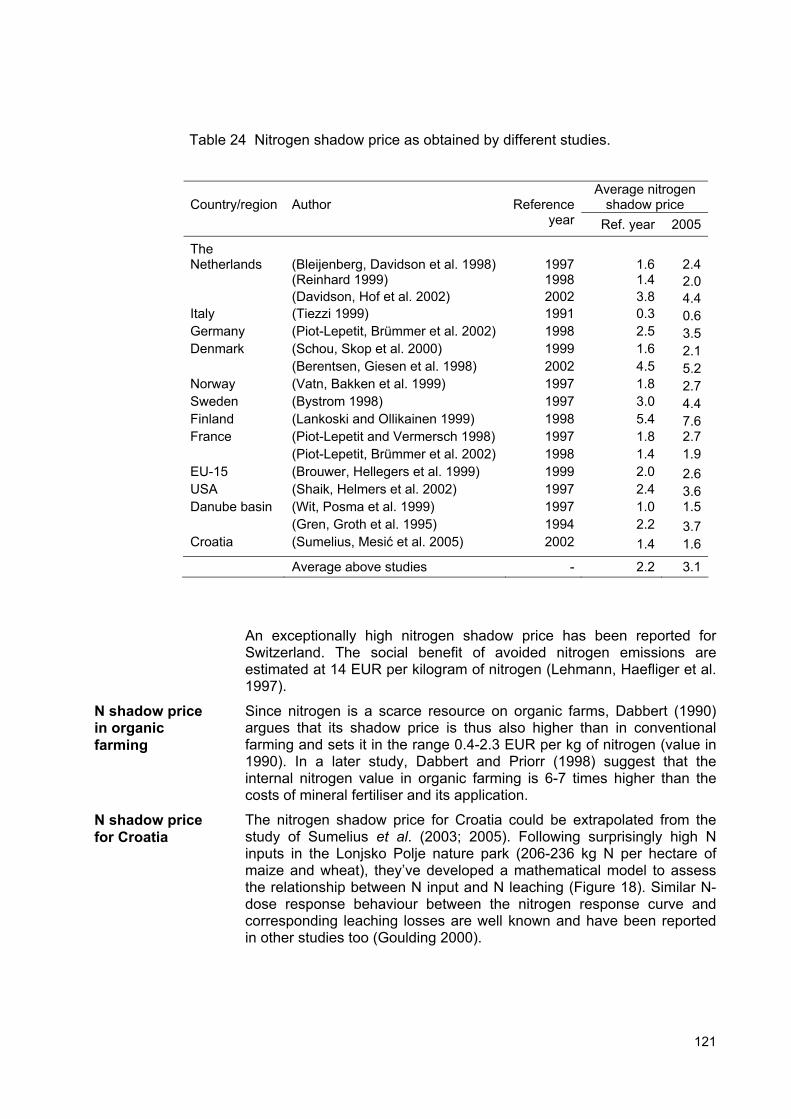
121
Table 24 Nitrogen shadow price as obtained by different studies.
Average nitrogen
shadow price Country/region
Author
Reference
year Ref. year 2005
The Netherlands (Bleijenberg, Davidson et al. 1998) 1997 1.6 2.4 (Reinhard 1999) 1998 1.4 2.0 (Davidson, Hof et al. 2002) 2002 3.8 4.4Italy (Tiezzi 1999) 1991 0.3 0.6Germany (Piot-Lepetit, Brümmer et al. 2002) 1998 2.5 3.5Denmark (Schou, Skop et al. 2000) 1999 1.6 2.1 (Berentsen, Giesen et al. 1998) 2002 4.5 5.2Norway (Vatn, Bakken et al. 1999) 1997 1.8 2.7Sweden (Bystrom 1998) 1997 3.0 4.4Finland (Lankoski and Ollikainen 1999) 1998 5.4 7.6France (Piot-Lepetit and Vermersch 1998) 1997 1.8 2.7 (Piot-Lepetit, Brümmer et al. 2002) 1998 1.4 1.9EU-15 (Brouwer, Hellegers et al. 1999) 1999 2.0 2.6USA (Shaik, Helmers et al. 2002) 1997 2.4 3.6Danube basin (Wit, Posma et al. 1999) 1997 1.0 1.5 (Gren, Groth et al. 1995) 1994 2.2 3.7Croatia (Sumelius, Mesić et al. 2005) 2002 1.4 1.6
Average above studies - 2.2 3.1
An exceptionally high nitrogen shadow price has been reported for Switzerland. The social benefit of avoided nitrogen emissions are estimated at 14 EUR per kilogram of nitrogen (Lehmann, Haefliger et al. 1997).
Since nitrogen is a scarce resource on organic farms, Dabbert (1990) argues that its shadow price is thus also higher than in conventional farming and sets it in the range 0.4-2.3 EUR per kg of nitrogen (value in 1990). In a later study, Dabbert and Priorr (1998) suggest that the internal nitrogen value in organic farming is 6-7 times higher than the costs of mineral fertiliser and its application.
The nitrogen shadow price for Croatia could be extrapolated from the study of Sumelius et al. (2003; 2005). Following surprisingly high N inputs in the Lonjsko Polje nature park (206-236 kg N per hectare of maize and wheat), they’ve developed a mathematical model to assess the relationship between N input and N leaching (Figure 18). Similar N-dose response behaviour between the nitrogen response curve and corresponding leaching losses are well known and have been reported in other studies too (Goulding 2000).
N shadow price in organic farming
N shadow price for Croatia
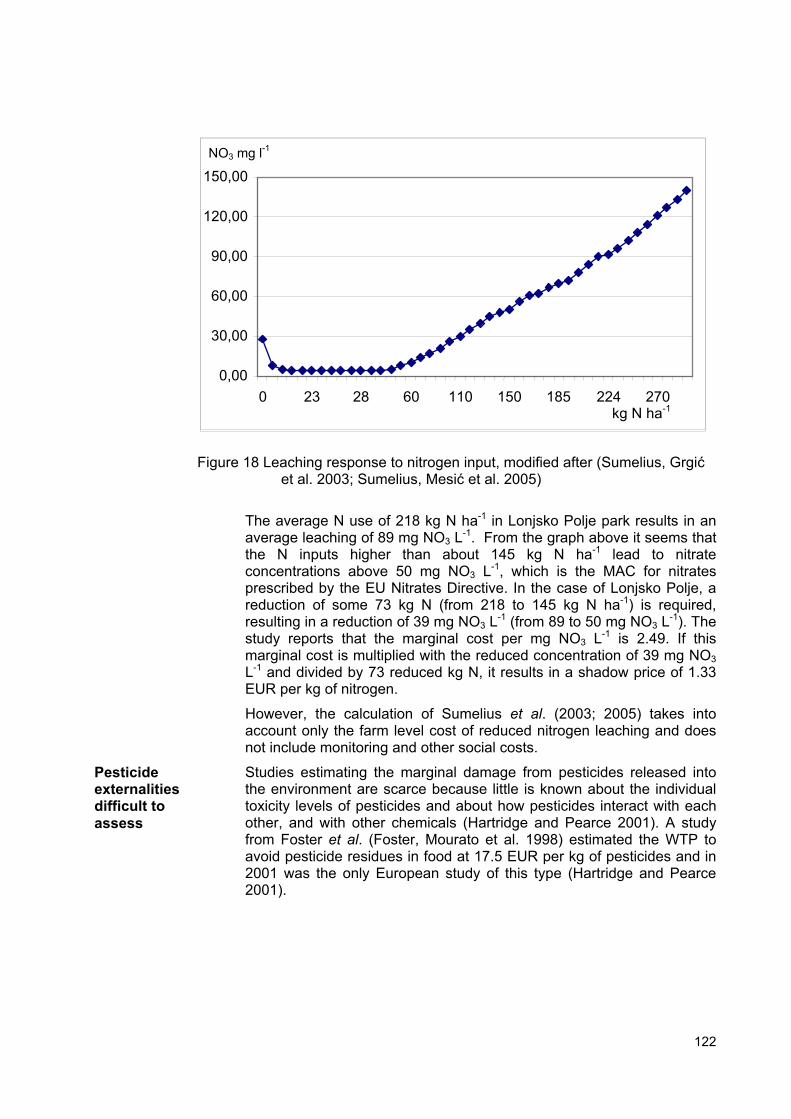
122
Figure 18 Leaching response to nitrogen input, modified after (Sumelius, Grgić et al. 2003; Sumelius, Mesić et al. 2005)
The average N use of 218 kg N ha-1 in Lonjsko Polje park results in an average leaching of 89 mg NO3 L-1. From the graph above it seems that the N inputs higher than about 145 kg N ha-1 lead to nitrate concentrations above 50 mg NO3 L-1, which is the MAC for nitrates prescribed by the EU Nitrates Directive. In the case of Lonjsko Polje, a reduction of some 73 kg N (from 218 to 145 kg N ha-1) is required, resulting in a reduction of 39 mg NO3 L-1 (from 89 to 50 mg NO3 L-1). The study reports that the marginal cost per mg NO3 L-1 is 2.49. If this marginal cost is multiplied with the reduced concentration of 39 mg NO3 L-1 and divided by 73 reduced kg N, it results in a shadow price of 1.33 EUR per kg of nitrogen.
However, the calculation of Sumelius et al. (2003; 2005) takes into account only the farm level cost of reduced nitrogen leaching and does not include monitoring and other social costs.
Studies estimating the marginal damage from pesticides released into the environment are scarce because little is known about the individual toxicity levels of pesticides and about how pesticides interact with each other, and with other chemicals (Hartridge and Pearce 2001). A study from Foster et al. (Foster, Mourato et al. 1998) estimated the WTP to avoid pesticide residues in food at 17.5 EUR per kg of pesticides and in 2001 was the only European study of this type (Hartridge and Pearce 2001).
Pesticide externalities difficult to assess
0,00
30,00
60,00
90,00
120,00
150,00
0 23 28 60 110 150 185 224 270
NO3 mg l-1
kg N ha-1
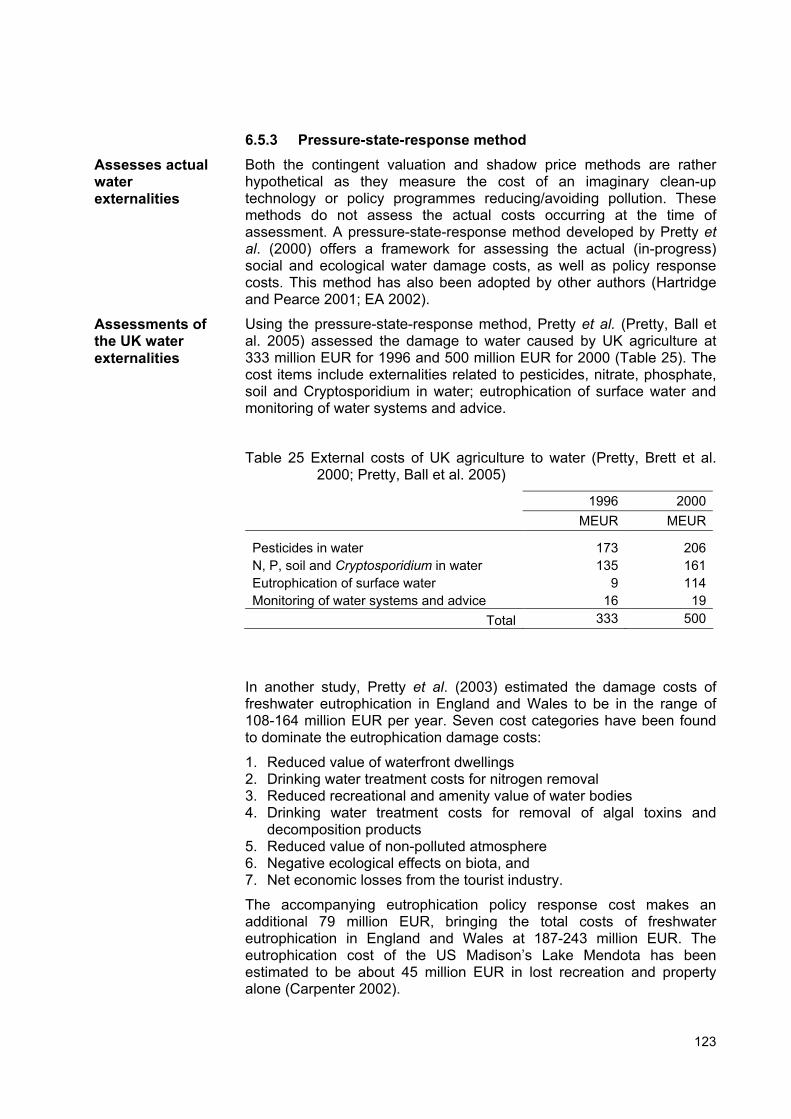
123
6.5.3 Pressure-state-response method Both the contingent valuation and shadow price methods are rather hypothetical as they measure the cost of an imaginary clean-up technology or policy programmes reducing/avoiding pollution. These methods do not assess the actual costs occurring at the time of assessment. A pressure-state-response method developed by Pretty et al. (2000) offers a framework for assessing the actual (in-progress) social and ecological water damage costs, as well as policy response costs. This method has also been adopted by other authors (Hartridge and Pearce 2001; EA 2002).
Using the pressure-state-response method, Pretty et al. (Pretty, Ball et al. 2005) assessed the damage to water caused by UK agriculture at 333 million EUR for 1996 and 500 million EUR for 2000 (Table 25). The cost items include externalities related to pesticides, nitrate, phosphate, soil and Cryptosporidium in water; eutrophication of surface water and monitoring of water systems and advice.
Table 25 External costs of UK agriculture to water (Pretty, Brett et al. 2000; Pretty, Ball et al. 2005)
1996 2000 MEUR MEUR
Pesticides in water 173 206N, P, soil and Cryptosporidium in water 135 161Eutrophication of surface water 9 114Monitoring of water systems and advice 16 19
Total 333 500
In another study, Pretty et al. (2003) estimated the damage costs of freshwater eutrophication in England and Wales to be in the range of 108-164 million EUR per year. Seven cost categories have been found to dominate the eutrophication damage costs:
1. Reduced value of waterfront dwellings 2. Drinking water treatment costs for nitrogen removal 3. Reduced recreational and amenity value of water bodies 4. Drinking water treatment costs for removal of algal toxins and
decomposition products 5. Reduced value of non-polluted atmosphere 6. Negative ecological effects on biota, and 7. Net economic losses from the tourist industry.
The accompanying eutrophication policy response cost makes an additional 79 million EUR, bringing the total costs of freshwater eutrophication in England and Wales at 187-243 million EUR. The eutrophication cost of the US Madison’s Lake Mendota has been estimated to be about 45 million EUR in lost recreation and property alone (Carpenter 2002).
Assesses actual water externalities
Assessments of the UK water externalities
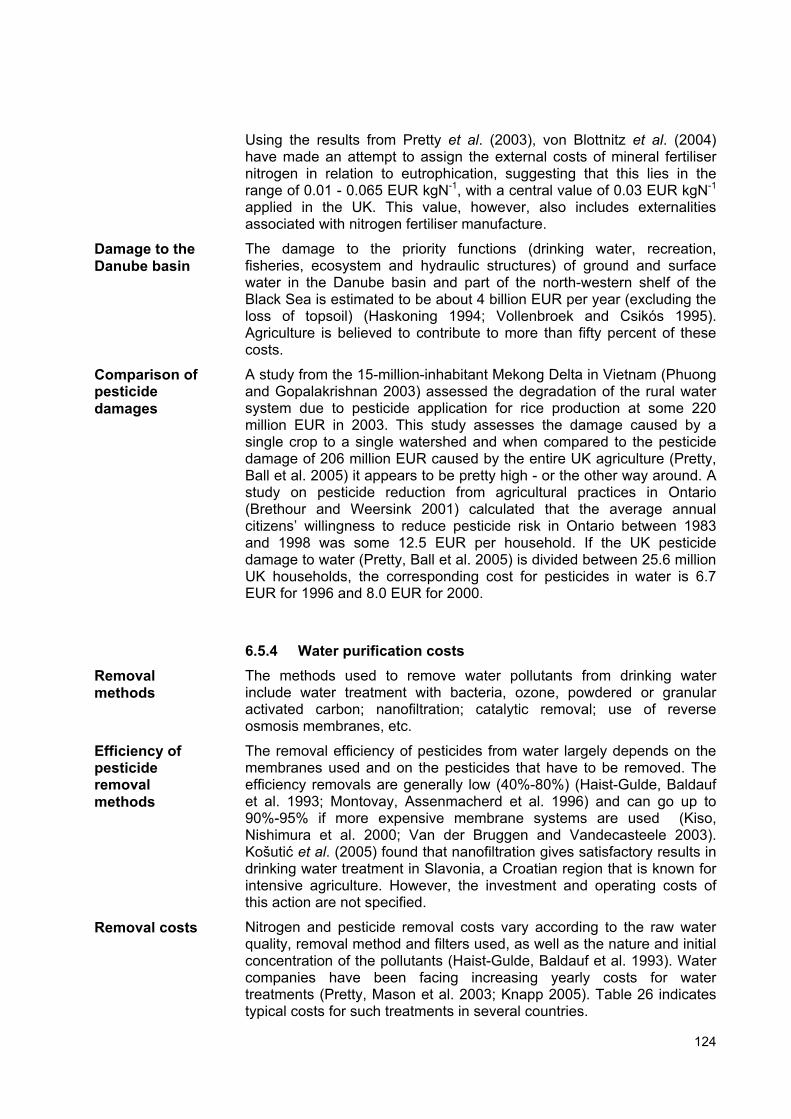
124
Using the results from Pretty et al. (2003), von Blottnitz et al. (2004) have made an attempt to assign the external costs of mineral fertiliser nitrogen in relation to eutrophication, suggesting that this lies in the range of 0.01 - 0.065 EUR kgN-1, with a central value of 0.03 EUR kgN-1 applied in the UK. This value, however, also includes externalities associated with nitrogen fertiliser manufacture.
The damage to the priority functions (drinking water, recreation, fisheries, ecosystem and hydraulic structures) of ground and surface water in the Danube basin and part of the north-western shelf of the Black Sea is estimated to be about 4 billion EUR per year (excluding the loss of topsoil) (Haskoning 1994; Vollenbroek and Csikós 1995). Agriculture is believed to contribute to more than fifty percent of these costs.
A study from the 15-million-inhabitant Mekong Delta in Vietnam (Phuong and Gopalakrishnan 2003) assessed the degradation of the rural water system due to pesticide application for rice production at some 220 million EUR in 2003. This study assesses the damage caused by a single crop to a single watershed and when compared to the pesticide damage of 206 million EUR caused by the entire UK agriculture (Pretty, Ball et al. 2005) it appears to be pretty high - or the other way around. A study on pesticide reduction from agricultural practices in Ontario (Brethour and Weersink 2001) calculated that the average annual citizens’ willingness to reduce pesticide risk in Ontario between 1983 and 1998 was some 12.5 EUR per household. If the UK pesticide damage to water (Pretty, Ball et al. 2005) is divided between 25.6 million UK households, the corresponding cost for pesticides in water is 6.7 EUR for 1996 and 8.0 EUR for 2000.
6.5.4 Water purification costs The methods used to remove water pollutants from drinking water include water treatment with bacteria, ozone, powdered or granular activated carbon; nanofiltration; catalytic removal; use of reverse osmosis membranes, etc.
The removal efficiency of pesticides from water largely depends on the membranes used and on the pesticides that have to be removed. The efficiency removals are generally low (40%-80%) (Haist-Gulde, Baldauf et al. 1993; Montovay, Assenmacherd et al. 1996) and can go up to 90%-95% if more expensive membrane systems are used (Kiso, Nishimura et al. 2000; Van der Bruggen and Vandecasteele 2003). Košutić et al. (2005) found that nanofiltration gives satisfactory results in drinking water treatment in Slavonia, a Croatian region that is known for intensive agriculture. However, the investment and operating costs of this action are not specified.
Nitrogen and pesticide removal costs vary according to the raw water quality, removal method and filters used, as well as the nature and initial concentration of the pollutants (Haist-Gulde, Baldauf et al. 1993). Water companies have been facing increasing yearly costs for water treatments (Pretty, Mason et al. 2003; Knapp 2005). Table 26 indicates typical costs for such treatments in several countries.
Damage to the Danube basin
Comparison of pesticide damages
Removal methods
Efficiency of pesticide removal methods
Removal costs
125
Table 26 Costs of nitrogen and pesticide removals from water
Country
Author
Pollutant
Removal method
Average price per cubic meter
(EUR)
Austria (Lughofer and Kratochvil 1997) Nitrates Various 0.33 (Lughofer and Kratochvil 1997) Atrazine Various 0.12Germany (Gorenflo, Velazquez-Padron et al.
2003) Pesticides Nanofiltration 0.23
(Horold, Tacke et al. 1993) Nitrates Catalitic 0.25 (Rutten and Schnoor 1992) Autotrophic
bacteria 0.24
France (Rapinat 1993) Nitrates Ion exchange, Biological
0.38
W. Europe (Van der Bruggen and Vandecasteele 2003)
Pesticides Nanofiltration 0.26
Turkey (Koyuncu, Topacik et al. 2001) Ammonium Reverse osmosis membranes
0.75
(Eroglu, Sarikaya et al. 2001) Nutrients Not specified 0.80
Generally speaking, the prevention of pesticide and nitrate pollution of groundwater is more cost-effective than treatment (Smit and Laeven 1998). Purification plants are effective tools to clean water but their construction and maintenance is expensive and most countries require loans for such operations (Znaor 1999). Investing in prevention of pollution at source is cheaper than investing in water-purification plants, notably in agriculture, which is the sector with the most favourable cost:benefit ratio in prevention of water pollution (Haskoning 1994).
Several German companies have been supporting organic farming in their water harvesting regions. In 1998, out of 1,300 water companies in Germany, 26 had programmes for supporting organic farming, while an additional 98 were considering starting such a programme (AGÖL/BUND 1997; Hermanowski and A 1997; Krug 1997). The investment in organic farming programmes per cubic metre of water has been found to be about seven times cheaper than the cost of nitrogen removal (Schirmer and Fleischer 1995; Kratochvil 2002). The support water companies offer to organic farmers include economic and informative instruments such as area payments, land lease, marketing promotion, extension, demonstration and information services (Kratochvil, Lindenthal et al. 1999; Kratochvil 2002).
6.6. Quality of Croatian water resources
6.6.1 General In Croatia only 75 per cent of the population is connected to the public water supply system and the average water use per inhabitant is 120-150 litres per day (MZOPU 2003). Some 85% of water for the public water supply system is obtained from groundwater reserves (CCPC 2004). Due to its unsatisfactory microbiological and chemical properties,
Prevention cheaper than removal
German water companies pay for organic farming
Public water supply system
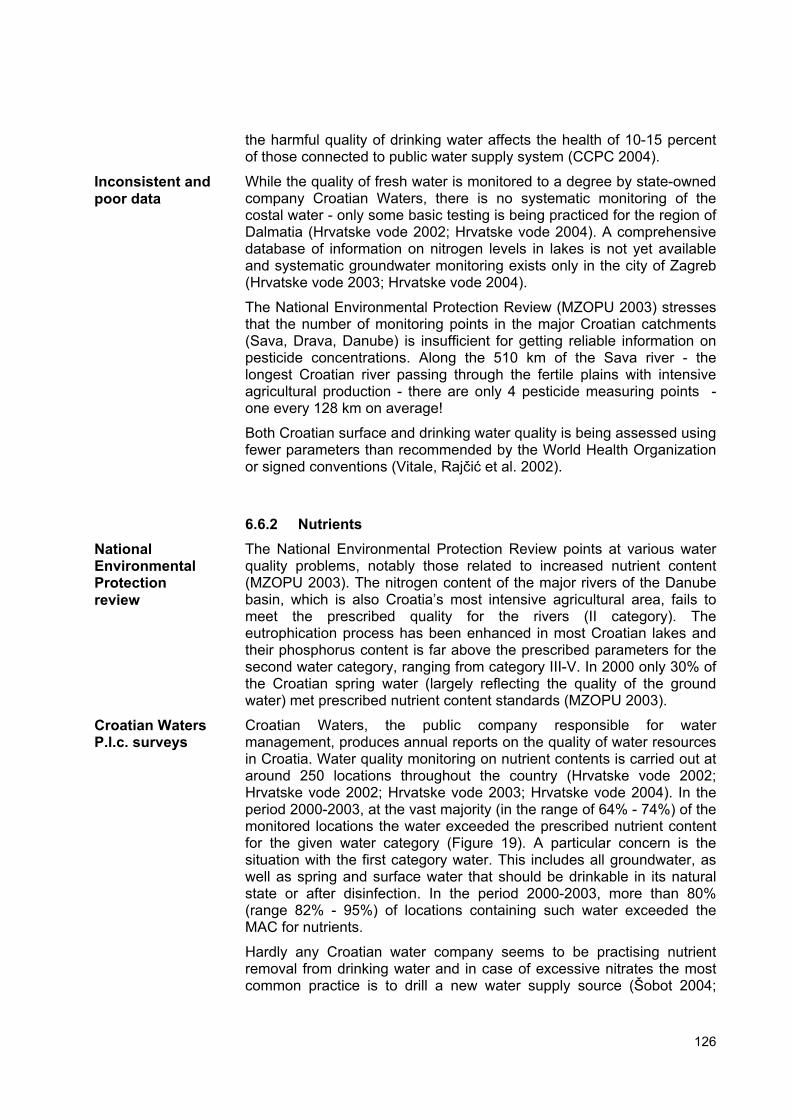
126
the harmful quality of drinking water affects the health of 10-15 percent of those connected to public water supply system (CCPC 2004).
While the quality of fresh water is monitored to a degree by state-owned company Croatian Waters, there is no systematic monitoring of the costal water - only some basic testing is being practiced for the region of Dalmatia (Hrvatske vode 2002; Hrvatske vode 2004). A comprehensive database of information on nitrogen levels in lakes is not yet available and systematic groundwater monitoring exists only in the city of Zagreb (Hrvatske vode 2003; Hrvatske vode 2004).
The National Environmental Protection Review (MZOPU 2003) stresses that the number of monitoring points in the major Croatian catchments (Sava, Drava, Danube) is insufficient for getting reliable information on pesticide concentrations. Along the 510 km of the Sava river - the longest Croatian river passing through the fertile plains with intensive agricultural production - there are only 4 pesticide measuring points - one every 128 km on average!
Both Croatian surface and drinking water quality is being assessed using fewer parameters than recommended by the World Health Organization or signed conventions (Vitale, Rajčić et al. 2002).
6.6.2 Nutrients The National Environmental Protection Review points at various water quality problems, notably those related to increased nutrient content (MZOPU 2003). The nitrogen content of the major rivers of the Danube basin, which is also Croatia’s most intensive agricultural area, fails to meet the prescribed quality for the rivers (II category). The eutrophication process has been enhanced in most Croatian lakes and their phosphorus content is far above the prescribed parameters for the second water category, ranging from category III-V. In 2000 only 30% of the Croatian spring water (largely reflecting the quality of the ground water) met prescribed nutrient content standards (MZOPU 2003).
Croatian Waters, the public company responsible for water management, produces annual reports on the quality of water resources in Croatia. Water quality monitoring on nutrient contents is carried out at around 250 locations throughout the country (Hrvatske vode 2002; Hrvatske vode 2002; Hrvatske vode 2003; Hrvatske vode 2004). In the period 2000-2003, at the vast majority (in the range of 64% - 74%) of the monitored locations the water exceeded the prescribed nutrient content for the given water category (Figure 19). A particular concern is the situation with the first category water. This includes all groundwater, as well as spring and surface water that should be drinkable in its natural state or after disinfection. In the period 2000-2003, more than 80% (range 82% - 95%) of locations containing such water exceeded the MAC for nutrients.
Hardly any Croatian water company seems to be practising nutrient removal from drinking water and in case of excessive nitrates the most common practice is to drill a new water supply source (Šobot 2004;
Inconsistent and poor data
National Environmental Protection review
Croatian Waters P.l.c. surveys
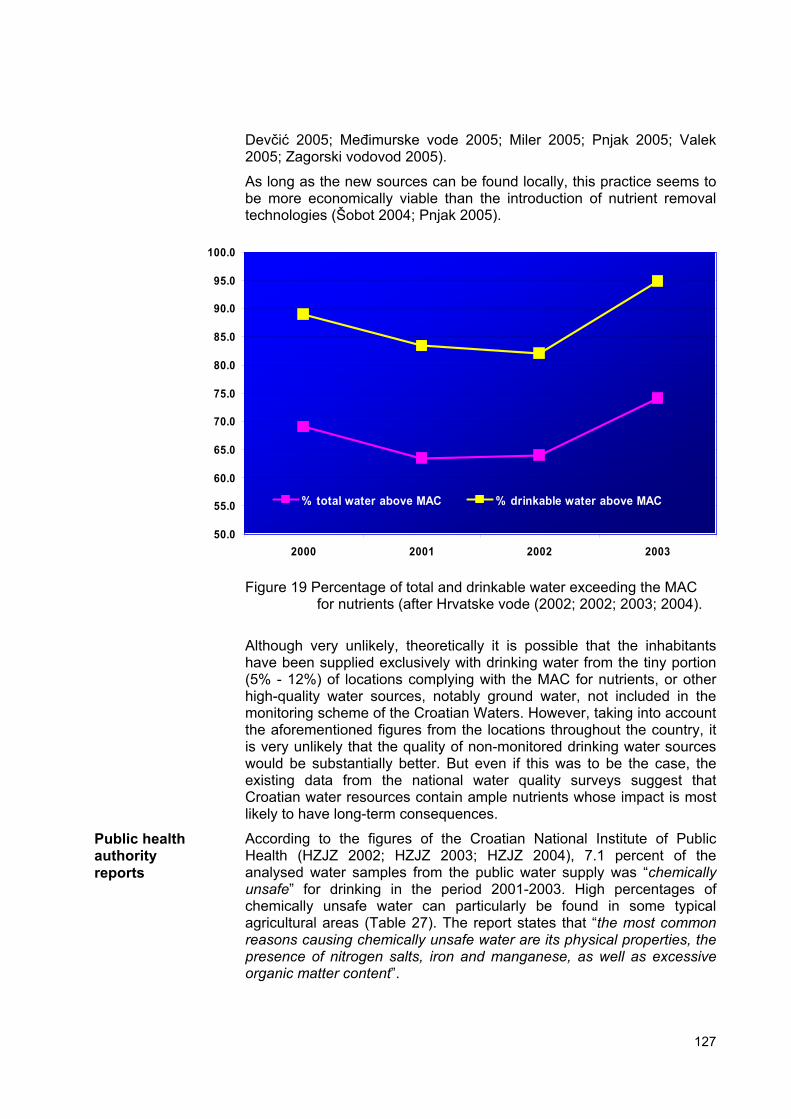
127
50.0
55.0
60.0
65.0
70.0
75.0
80.0
85.0
90.0
95.0
100.0
2000 2001 2002 2003
% total water above MAC % drinkable water above MAC
Devčić 2005; Međimurske vode 2005; Miler 2005; Pnjak 2005; Valek 2005; Zagorski vodovod 2005).
As long as the new sources can be found locally, this practice seems to be more economically viable than the introduction of nutrient removal technologies (Šobot 2004; Pnjak 2005).
Figure 19 Percentage of total and drinkable water exceeding the MAC for nutrients (after Hrvatske vode (2002; 2002; 2003; 2004).
Although very unlikely, theoretically it is possible that the inhabitants have been supplied exclusively with drinking water from the tiny portion (5% - 12%) of locations complying with the MAC for nutrients, or other high-quality water sources, notably ground water, not included in the monitoring scheme of the Croatian Waters. However, taking into account the aforementioned figures from the locations throughout the country, it is very unlikely that the quality of non-monitored drinking water sources would be substantially better. But even if this was to be the case, the existing data from the national water quality surveys suggest that Croatian water resources contain ample nutrients whose impact is most likely to have long-term consequences.
According to the figures of the Croatian National Institute of Public Health (HZJZ 2002; HZJZ 2003; HZJZ 2004), 7.1 percent of the analysed water samples from the public water supply was “chemically unsafe” for drinking in the period 2001-2003. High percentages of chemically unsafe water can particularly be found in some typical agricultural areas (Table 27). The report states that “the most common reasons causing chemically unsafe water are its physical properties, the presence of nitrogen salts, iron and manganese, as well as excessive organic matter content”.
Public health authority reports
128
Table 27 Number of samples and percentage of chemically unsafe water in the period 2001-2002 (after (HZJZ 2002; HZJZ 2003; HZJZ 2004).
2001 2002 2003
n %
chemically unsafe
n
% chemically
unsafe
n
% chemically
unsafe
Brodsko-posavska 492 38.8 277 29.6 229 35.8Varaždinska 523 24.9 248 33.9 697 28.5Vukovarsko-srijemska 223 1.3 960 44.8 340 14.1Bjelovarsko-bilogorska 838 8.6 941 13.5 815 8.7Požeško-slavonska 383 26.9 458 13.8 429 6.1Osječko-baranjska 2,504 6.7 1,956 12.7 2,285 11.3Sisačko-moslavačka 1,253 3.3 1,391 1.4 1,475 9.4
Total Croatia 23,287 7.2 22,791 8.1 25,010 6.1
Unfortunately, the exact percentage of chemically unsafe water due to excessive concentrations of nitrogen compounds, phosphorus and pesticides is virtually impossible to obtain. This is because the central national register receives from the county offices only figures on total chemically unsafe water, without further details regarding the causes and frequency of their occurrence (Šobot 2004). The latest systematic information on the nitrate content in drinking water at the national level seems to be from the mid seventies (HZJZ 2005). Experts from the Croatian National Institute of Public Health estimate that currently 1%-2% of the entire water from the public water supply system contains nitrates above the MAC (Šobot 2004; Valek 2005). However, the percentage of the population exposed to an excessive concentration of nitrates in water is substantially higher. Namely, 25 percent of the Croatian population is supplied by drinking water from private wells and other non-public water supply sources, and this percentage is even higher (32%) in the Danube basin, the most intensive agricultural area (MZOPU 2003). The majority of these non-public water supply systems face severe problems with nitrates and concentrations often exceed the MAC (Šobot 2004; Devčić 2005; Valek 2005), as shown on Figure 20.
129
0
10
20
30
40
50
60
70
2000 2001 2002 2003 2004
Private wells Other public water sources Public water supply system
Figure 20. Percentage of water supply sources with excessive nitrates in Bjelovarsko-Bilogorska County, after (Devčić 2005)
Vitale et al. (2002) have performed a detailed survey of the existing water quality analysis for the Drava river in the period 1992-2000. Both nitrates and nitrites have been increasing over the time, with nitrates often exceeding the guideline values.
Algal bloom in Croatia is a severe problem, particularly in the northern part of the Adriatic Sea, a very popular tourist destination (IRB 2004; IRB 2004; IRB 2004). Algal blooms, red tides, and fish and bottom fauna mortality have been reported with concentration levels of 1.6-59 µM NO3 and 0.6a-2.9 µM PO4 (EEA 1999). The algal bloom causes economic damage to fisheries and the tourist industry (IRB 2004; Ured Turističke zajednice grada Poreča 2004).
A nitrogen budget of Croatian agriculture still does not exist. However, within the framework of two recent regional studies on the protection of the Danube River (2003; Redman 2003; Schreiber, Behrendt et al. 2003; Schreiber, Behrendt et al. 2003; Zessner, Gabriel et al. 2005), the nitrogen balance and load to water was also calculated for the Croatian part of the Danube basin. The nitrogen balance was calculated using standard OECD soil surface nitrogen balance methodology (OECD 2001). Data on nitrogen inputs, outputs and emissions were derived by GIS-analysis, from digital maps of land use, elevation, soil types and hydrogeology, figures on point source pollution, FAOSTAT and information provided by national consultants. The estimated total annual nitrogen loss to water resources of the Croatian part of the Danube basin is about 35,000 tonnes of nitrogen (Schreiber, Behrendt et al. 2003), similar to the previous estimates of Mesić et al. (1994). Some 42.5 percent (14,886 t N) of this loss is due to diffuse pollution (agriculture), resulting in a nitrogen surplus of 39.2 kg N ha-1 of agricultural land and nitrogen loss of 8.3 kg N ha-1 of agricultural land
Algal bloom
N balance of the Croatian part of the Danube basin
130
(Redman 2003). An earlier report from the World Bank (1992), similarly to Zessner (2005), points out that 51 per cent of the nitrogen loss to the surface water of the Danube Basin area of Croatia is derived from agriculture,.
According to the Croatian Water Resources Management Plan, the nitrogen load from Croatian settlements, industry, and the tourism sector is approximately 20,000 tonnes of nitrogen per year (2003). From the calculation presented in this study, agriculture contributes an additional load of 215,416 tonnes, representing 91.5 percent of the total national nitrogen load and consequently most likely also a similar share of the total nitrogen losses to water resources.
Most of the nutrient problems in waters are associated with excessive concentrations of nitrogen. Phosphorus is believed not to be a significant water pollutant in Croatia. It is far less mobile than nitrogen, the majority of Croatian soils have poor phosphorus content and figures on phosphorus fertiliser use suggest that its application is in quantities below the crop requirements.
6.6.1.2 Nitrates deriving from Croatian agriculture Data from the Croatian Water Resources Management Plan indicate that agriculture accounts for more than 90% of the total nitrogen pressure on Croatian water resources(1999; 2000; 2001; 2001; 2002; 2002; 2003; 2003; 2003; 2003; 2003; 2005).
The relationship between agricultural practices and nitrogen concentration in water has been subject to several experiments in Croatia. However, nearly all relevant data from the last 15-20 years seem to be derived from the three experimental sites in central Croatia: Popovača, Karašica and Kutina. Too few data seems to exist for the karst region. This area covers some 50 percent of Croatian territory and due to its hydro-geological structure it is particularly prone to nitrate leaching.
A five-year experiment on nitrate leaching was carried out at the experimental field in Popovača in the period 1996-2000. Its results have been widely reported in various publications by Mesić et. al. (2002; 2003; 2005) and Sumelius et al. (2002; 2003; 2005). The experiment involved ten variants receiving different applications of nitrogen, from zero to 300 kg N ha-1. Depending on the year and the amount of nitrogen applied, the experiment recorded a leaching range from 7.1 kg NO3-N ha-1 for plots receiving no nitrogen, up to 64.2 kg NO3-N ha-1 at the input level of 300 kg N ha-1. The later leaching corresponds to 21.3 percent of the nitrogen amount applied by fertilisers. Treatments with nitrogen input up to 150 kg N ha-1 basically recorded nitrogen concentrations below the admissible level of 10 mg NO3-N L-1, while other treatments exhibited much higher nitrogen concentrations - up to 28.7 mg NO3-N L-1. The loss of ammonia nitrogen in all treatments was found to be negligible, below 1 kg N ha-1.
Agriculture makes >90% of the total N load
P loss is not a problem
Agriculture: main source of nitrogen load
Three major experimental sites
Popovača site experiments
131
Based on the results from the Popovača experiments, Sumelius et al. (2002; 2003; 2005) have developed a mathematical model which enabled them to determine nitrogen leaching for the family farms in Lonjsko Polje nature park. These have been found to be applying 206-230 kg N ha-1 (fertilisers plus manure) on maize and 234-236 kg N ha-1
on wheat. The corresponding leaching levels as determined by the mathematic model were in the range 82-96 mg NO3-N L-1, some 1.6-1.9 times higher than the critical maximum level defined by the EU Nitrate Directive (50 mg NO3 L-1).
Šimunić et al. (1996; 1998; 1998; 2002; 2002; 2002; 2003) have performed a ten year experiment (1991-2000) in the vicinity of Petrokemija fertiliser plant. The crop rotation included maize and winter wheat (a common crop rotation in Croatia) and received fertiliser application of 145-200 kg N ha-1. The average NO3-N concentration in drainage water was found to be 12.7 mg NO3-N L-1, which is above the maximum allowable concentration of 10 mg NO3-N L-1. Similar results were also reported by Klačić et al. (Klačić, Petošić et al. 1998). The average ammonia nitrogen levels at the Kutina experiments were also above the MAC, typically ranging from 0.7-1.9 mg NH4-N L-1. The highest leaching recorded was 20 kg N ha-1, corresponding to 10 percent of the fertiliser nitrogen applied.
In the Karašica and Vučica catchment Vidaček et al. (1999; 2002; 2003) ran a seven year experiment measuring the environmental impact of different fertilisation levels. The crops included were maize (173 kg N ha-
1), winter wheat (199 kg N ha-1), winter barley (110 kg N ha-1) and oilseed rape (128 kg N ha-1). In spite of these - by the standards of Croatian farming - modest nitrogen levels, typical nitrate concentrations in ground water were in the range of 12.0-97.9 mg NO3 L-1, sometimes reaching levels up to 147 mg NO3 L-1 in ground water and 171 mg NO3 L-1 in drainage water.
Excessive nitrate concentrations found in Croatian drainage and groundwater have also been reported by several other authors (Romić, Romić et al. 1997; Tomić, Šimunić et al. 1997; Grgić, Mesić et al. 2002).
So far Croatia does not have any calculation on the national nitrogen balance for agriculture.
6.6.3 Pesticides Croatia does not have systematic monitoring of pesticide presence in water. Croatian Waters measures the presence of DDT and lindane but does hardly any herbicide monitoring. DDT has been found (Hrvatske vode 2002; Hrvatske vode 2002): Of the water samples tested in 2000, 41 percent contained DDT and 12 percent lindane in higher than allowed concentrations, while other organochlorinated pesticides remained within the prescribed limits (Hrvatske vode 2002). The situation in 2001 was much better: DDT was found in 14 percent of samples and lindane in only 5 percent of samples, most probably due to its ban in mid 2001. The reports for 2002 and 2003 do mention problems with both DDT and lindane, but unfortunately do not present aggregated data at the national level (Hrvatske vode 2003; Hrvatske vode 2004).
... also used for mathematic models
Kutina site experiments
Karašica site experiments
Other findings
N balance and losses
Data from Croatian Waters P.l.c.
132
The National Environmental Protection Review (MZOPU 2003) stresses the problems with lindane and DDT concentrations in surface water, notably in those of the Mura and Drava catchments.
The Croatian National Institute of Public Health does not have systematic monitoring of pesticides in drinking water (Šobot 2004). Some county offices do not practice this analysis at all (Devčić 2005), while others do it occasionally (Šobot 2004; Valek 2005).
6.6.1.3 Excessive herbicide concentrations in water Studies investigating the link between agricultural use of pesticides and their impact on water were mainly performed at the above-mentioned experimental sites in Kutina and Karašica.
Results from the experiments in Kutina (Šimunić, Tomić et al. 1999; Šimunić 2002; Šimunić, Tomić et al. 2002; Šimunić, Tomić et al. 2002; Šimunić 2003) indicate high leaching and excessive presence of herbicides in water. Atrazine levels in nearly all drainage water samples were higher than 100 ŋg L-1, reaching levels up to 478 ŋg L-1, while chlortoluron reached levels up to 486 ŋg L-1. These results suggest that some 0.05% of the initially applied herbicide quantities were leached. Excessive concentrations (up to 332 ŋg L-1) of atrazine and chlortoluron were also occasionally found in the experiments at Karašica (Vidaček, Sraka et al. 1999; Vidaček, Racz et al. 2003).
Atrazine is routinely applied on Croatian maize fields and 87-100 percent of maize fields seem to be receiving atrazine treatment (Neumeister 2003). This poses a severe treat for water resources since maize occupies some 37 percent of Croatian arable land in use. Application of fertilizers, especially on soil with low clay and low organic matter content was found to enhance the mobility of some herbicides (Horvat, Kaštelan-Macan et al. 2003).
At three out of the five monitoring stations on the Sava river, atrazine was found in concentrations higher than the MAC (Hrvatske vode 2004). High levels of atrazine and simazine have also been reported by Stipčević et al. (2002). According to Šarić (1996), in the period 1992-1995, atrazine concentrations in waters of many parts of Croatia were above the MAC. In a review of the Croatian research on pesticide content in water prepared by Igrc-Barčić, (2002) the findings of several other studies have been discussed. Many of these also point at increased content (often above the MAC) of pesticides in Croatian water resources, with atrazine again being the main problem.
The environmental concerns relate not only to the quantity, but also to the type of pesticides used in Croatia. Atrazine seems to account for as much as 30% of all pesticide consumption in Croatia (Znaor and Karoglan Todorović 2004). This environmentally unfriendly herbicide has been banned in most EU countries. Officially, the use of atrazine has been restricted to certain crops and geographical areas, but in practice, there is virtually no control over the (im)proper use of atrazine and other pesticides(Znaor 2002). Igrc (Igrc-Barčić 2002) gives an overview of results from studies that have measured atrazine concentration in Croatian water. From this inventory it is visible that the excessive
Other data
Herbicides at Kutina and Karašica experiments
Mass use of atrazine
Other data on atrazine
Atrazine: 30% of all pesticides
133
concentration of atrazine in water is more the rule than exception (atrazine was found in concentrations up to 390 times above the maximum allowed quantities). According to the same source (Igrc-Barčić 2002) the use of atrazine is widespread in Croatia and this herbicide is applied on nearly all Croatian maize fields.
Its use is forbidden in water harvesting zones and karst water storage fields (areas) and should not be applied at least 20 meters from the water bodies. The use of atrazine is also banned in vineyards, orchards (apples and pears) and on light soils and slopes and should not be used on the same filed and crop for more than two subsequent years.
Drevenkar et al. (2002; 2004) measured the presence of triazine herbicides atrazine and simazine in 477 samples of surface, ground, drinking and rain/snow waters collected in the 1992-2001 period. Atrazine was detected in 77 percent and simazine in 8.4 percent of samples. The study found no great differences in atrazine concentrations in drinking waters from rural and urban areas. The atrazine concentration exceeded the MAC of 0.1 microgram per litre in 29% of drinking water samples, reflecting the contamination of ground waters serving as drinking water supply.
In Osječko-Baranjska County, atrazine above the MAC has been found in drinking water samples: 4 percent in 2003 and 15 percent in 2004 (Valek 2005). High concentrations of atrazine in drinking water have also been recorded both in rural areas and in the vicinity of big cities (ZJZGZ 2004).
A study assessing organic pollutants in sediment samples (Francisković-Bilinski, Bilinski et al. 2005) of the Kupa basin found that 52 percent of samples contained phenols and 16 percent of samples contained polychlorinated biphenyls (PCBs) above toxic levels.
Some Croatian bottled waters also fail to meet requirements for drinking water (ZJZGZ 2004).
6.6.4 Heavy metals and radioactivity Cadmium, as well as most other heavy metals have been reported to be mostly below the MAC for soil and water and thus do not seem to pose an environmental problem (Čoga, Vidaček et al. 1998; Šimunić, Tomić et al. 2002). The low cadmium content of the raw phosphates used by Petrokemija contributes positively to this trend.
A study from the Kanovci area in Eastern Slavonia (Barišić, Lulić et al. 1992) found high concentrations of radioactive elements 226Ra, 228Ra, 235U, 238U and 137Cs in the surface, shallow ground and water from drainage channels. This effect has been attributed to phosphate fertiliser application. More recent information on this topic is not available since no new studies of this kind have been performed (Barišić 2005).
6.6.5 Conclusions From the aforementioned section, the following conclusions can be drawn as to regard to the quality of Croatian water resources:
Restrictions in karst region
Nearly 30% drinking water with atrazine above MAC
Low concentrations of heavy metals
Possible radioactivity problems
134
Most nitrate and pesticide leaching studies have been performed on three experimental sites in Central Croatia, on gley and pseudogley soils which are known for their limited water permeability. Experiments on pesticide and nitrate leaching in the Croatian karst regions hardly exist. The karst area covers some fifty percent of Croatian territory and its soils are known as problematic in terms of leaching. The data obtained by the experiments in Central Croatia therefore cannot be representative for the entire country and the average national leaching both for pesticides and nitrates is most likely to be higher due to leaching in karst areas.
The present national monitoring of nitrates and pesticides in water resources is poor. Analysis of the coastal water doesn’t exist, while the quality of the ground water is sufficiently monitored only in Zagreb. Surface water is hardly analysed for herbicides and there are no data on the nutrient status of lakes. The extent of nitrate presence in drinking water from the public water supply system is not precisely known and this water is only occasionally analysed for herbicides.
Croatian agriculture threatens water resources primarily through the use of atrazine and nitrogen applications above 150 kg N ha-1. Both atrazine and nitrates are regularly found in excessive concentrations in Croatian water resources. The national nitrogen balance from agriculture is not available.
Very few Croatian water companies seem to be removing pesticides and nitrates from drinking water. In case of excessive concentrations, most companies simply drill new wells. Thus no removal cost for pesticides and nitrates can be obtained.
In spite of quite dramatic figures with regard to the presence of nutrients and pesticides, the Croatian authorities do not seem to be worried about the current situation. Ćosić-Flajsig and Lukšić (2003) for instance declare that surface and spring water quality in Croatia is in “good or reasonably good state” and a similar attitude prevails in the annual reports of Croatian Waters (Hrvatske vode 2002; Hrvatske vode 2002; Hrvatske vode 2003; Hrvatske vode 2004). Franić (2003), also stresses that the State Water Directorate, at the time the highest national authority, did not recognise agriculture as a significant source of water pollution.
6.7. Water valuation methodology for Croatia
As already mentioned earlier, there is still no standard methodology that could be applied to assess externalities of water resources. The existing studies used mostly contingent valuation and the pressure-state-response method has also been emerging. Unfortunately, studies on willingness to pay for water quality improvement in Croatia, as well as figures needed to quantify the actual social costs and ecological damage do not exist. On the other hand, from the data on water quality it is evident that Croatian water resources and subsequently Croatian society suffer from the excessive nitrogen and pesticides in water. The following steps have been undertaken to assess these costs in monetary terms:
National leaching likely higher than in experiments
Poor pollutants monitoring
Nitrates and atrazine: key pollutants
No pesticide and nitrate removal
Authorities not worried
No standard method that can be applied
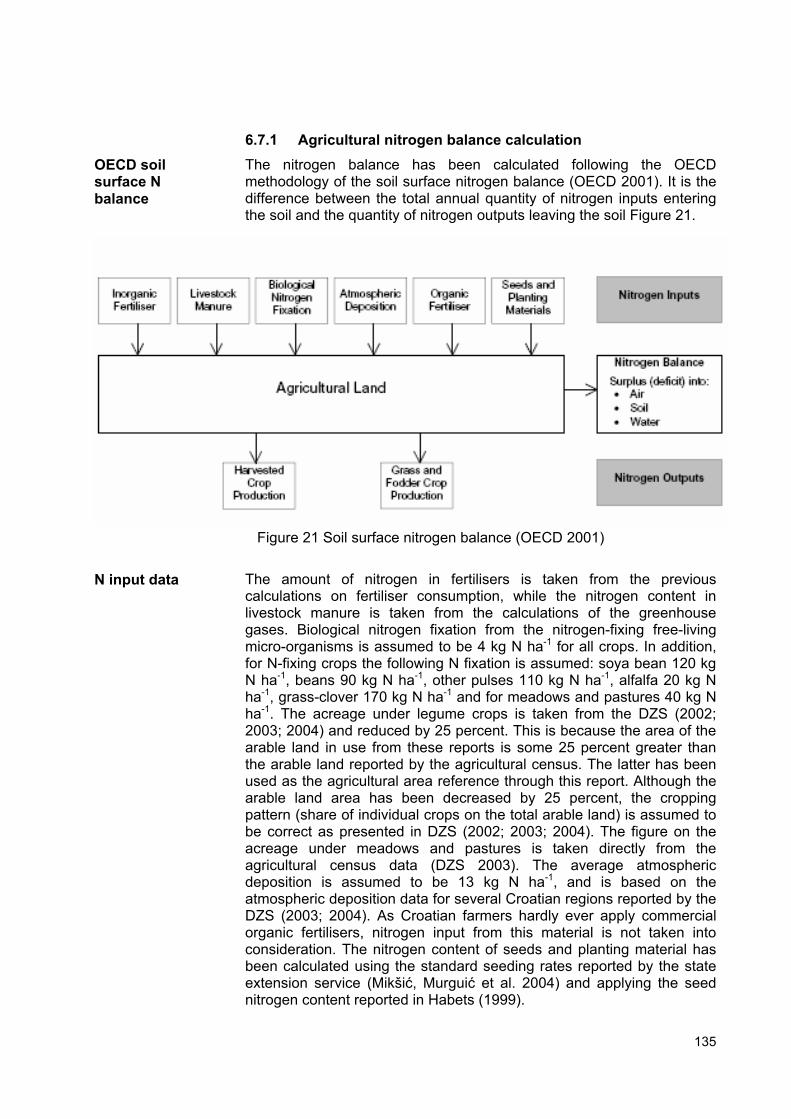
135
6.7.1 Agricultural nitrogen balance calculation The nitrogen balance has been calculated following the OECD methodology of the soil surface nitrogen balance (OECD 2001). It is the difference between the total annual quantity of nitrogen inputs entering the soil and the quantity of nitrogen outputs leaving the soil Figure 21.
Figure 21 Soil surface nitrogen balance (OECD 2001)
The amount of nitrogen in fertilisers is taken from the previous calculations on fertiliser consumption, while the nitrogen content in livestock manure is taken from the calculations of the greenhouse gases. Biological nitrogen fixation from the nitrogen-fixing free-living micro-organisms is assumed to be 4 kg N ha-1 for all crops. In addition, for N-fixing crops the following N fixation is assumed: soya bean 120 kg N ha-1, beans 90 kg N ha-1, other pulses 110 kg N ha-1, alfalfa 20 kg N ha-1, grass-clover 170 kg N ha-1 and for meadows and pastures 40 kg N ha-1. The acreage under legume crops is taken from the DZS (2002; 2003; 2004) and reduced by 25 percent. This is because the area of the arable land in use from these reports is some 25 percent greater than the arable land reported by the agricultural census. The latter has been used as the agricultural area reference through this report. Although the arable land area has been decreased by 25 percent, the cropping pattern (share of individual crops on the total arable land) is assumed to be correct as presented in DZS (2002; 2003; 2004). The figure on the acreage under meadows and pastures is taken directly from the agricultural census data (DZS 2003). The average atmospheric deposition is assumed to be 13 kg N ha-1, and is based on the atmospheric deposition data for several Croatian regions reported by the DZS (2003; 2004). As Croatian farmers hardly ever apply commercial organic fertilisers, nitrogen input from this material is not taken into consideration. The nitrogen content of seeds and planting material has been calculated using the standard seeding rates reported by the state extension service (Mikšić, Murguić et al. 2004) and applying the seed nitrogen content reported in Habets (1999).
OECD soil surface N balance
N input data
136
The per hectare output data for individual crops have been taken from DZS (DZS 2002; DZS 2003; DZS 2004) and multiplied by the UAA reported in the agricultural census (DZS 2003). The nitrogen content of crops has been taken from the OECD Nitrogen Balance Database (OECD 2005). Since Croatia is not included in this database and lacks its own statistics on the issue, the nitrogen content of crops has been calculated from the database figures for Austria, Italy and Hungary. This was necessary because figures on the nitrogen content of crops differ substantially from one country to another. Taking the average from the three nearby countries is believed to give more representative values. The nitrogen content of crops from Habets (1999) was used as an additional reference in case of doubts.
6.7.2 Calculation of N loss to water The OECD soil surface nitrogen balance gives only an indication of the nitrogen balance/surplus. It still does not give an answer to the amount of nitrogen lost into the water. In order to determine this, the surface nitrogen balance was further split to the fractions lost to the atmosphere and water and retained in the soil. The quantity of nitrogen lost to atmosphere is taken from the previous calculation on the atmospheric pollution and GHG. The amount of nitrogen retained in soil is calculated according to the nitrogen mineralization rates for organic matter presented in van der Werff (1992) and Janssen (1984). It is assumed that the average mineralization rate of nitrogen contained in the livestock manure is 35 percent and 65 percent for crop residues. The nitrogen added by fertilisers is in easily soluble forms and for this reason we assumed that no nitrogen added by fertilisers is retained in the soil. The difference between nitrogen lost in the atmosphere and nitrogen retained in the soil gives the quantity of nitrogen lost into water.
Of the economic sectors considered in this study, it appears that only the fertiliser industry discharges substantial quantities of nitrogen. The environmental performance data provided by Petrokemija (2005) indicate an average annual nitrogen discharge (ammonium and nitrate nitrogen) of approximately 171 t N for the period 2001-2003. However, applying EFMA BAT (EFMA 2001) figures for the nitrogen released into water by the ammonia, urea, CAN and NPK plants results in an average annual emission of 401 t N. As this quantity is trivial in comparison with the nitrogen derived from farming (less than 1 percent), it has not been considered in the calculation.
6.7.3 Costing the damage The human health and ecological damage arising from the use of nitrates and pesticides in the Croatian agricultural sector is notoriously difficult to determine. There are too few systematic data on the presence of these substances in water, notably the drinking water.
Numerous aforementioned Croatian studies and official statistics point at high concentrations of nutrients, notably nitrates, in water. The nitrogen balance obtained in our study also indicates that the agricultural nitrogen input in Croatia is above the level of 140-150 kg N ha-1, which is believed to be the upper input level ensuring nitrate concentration below the MAC in Central Croatia (Mesić, Bašić et al. 2003; Sumelius, Grgić et al. 2003;
N output data
Portions lost into water, soil and retained in soil
N loss to water from other sectors
All water in Croatia is enriched by excessive N
137
Mesić, Bašić et al. 2005; Sumelius, Mesić et al. 2005). Taking into account that about half of the Croatian territory is in the karst area which is highly susceptible to leaching, the average national nitrogen input leading to nitrate concentration below the MAC is certainly much lower than 140-150 kg N ha-1. From our calculation it appears that the average nitrogen input in the period 2001-2003 was 200 kg N ha-1 UAA-1. For this reason we assume that all the country’s water resources are enriched by nitrogen derived from agricultural practices above the MAC.
Externalities resulting from the excessive nitrogen concentration in water are calculated in two ways: by applying a shadow price to nitrogen causing the concentration of nitrates above the MAC and by calculating water treatment costs ensuring nitrogen removal from the drinking water.
1. Shadow price method
In the absence of reliable statistics and assessment methods, we assume that the external cost caused by the excessive concentration of nitrogen in water is equal to the shadow price of 1 EUR per kilogram of nitrogen causing the increase of concentration above the MAC. Similar methodology has been advocated by Hanley (1991). The shadow price of 1 EUR kg N-1 applied is some three times lower than the average shadow price extrapolated from the studies for other countries (Table XY). It is also some ten times lower than the marginal damage estimated for the discharge of nitrogen by Hartridge and Pearce (2001). Finally, the shadow price of 1 EUR kg N-1 is also some 35 percent below the shadow price for Croatia that can be extrapolated from the work of Sumelius et al. (2003; 2005). This approach ensures a conservative estimate of the damage. The nitrogen dose-response curve for Croatia (Sumelius, Grgić et al. 2003; Sumelius, Mesić et al. 2005) indicates that the nitrogen loss above MAC appears at N inputs higher than 145 kg N ha-1. Our N balance calculation shows that the average N input per ha of UAA in Croatia is 200 kg N. Theoretically a reduction of 55 kg N ha-1 (27.5 percent of the N input) would be needed to ensure that the MAC for nitrogen in drinking water is not exceeded. Applying this rule to the nitrogen input across the entire UAA (215,417 t N), the required reduction is equal to 59,162 t of nitrogen.
2. Nitrate removal method
In order to get an indication of the cost of nitrogen and pesticide removal under Croatian circumstances a survey has been made among nearly eighty Croatian water companies. Only five of these have replied, stating that they do not have any significant problem with these substances and/or do not practice their removal. Therefore a hypothetical nitrate removal cost had to be derived from data from other countries.
The typical nitrate removal costs in Austria, Germany and France range from 0.25 to 0.38 EUR per cubic metre of water (Lughofer and Kratochvil 1997; Gorenflo, Velazquez-Padron et al. 2003; Van der Bruggen and Vandecasteele 2003). The average nitrate removal cost per cubic metre of water from these reports appears to be 0.32 EUR and this value has been taken for Croatia too. The average daily consumption of water in Croatia is 135 l per capita (MZOPU 2003). The multiplication of the annual water consumption per capita with the number or inhabitants (DZS 2003) results in an annual consumption of 218,633 million litres of
N damage
138
water for the entire Croatian population. A further multiplication with the nitrate treatment cost per cubic metre gives the indication of the hypothetical external cost. A further adjustment is made for the share of agriculture in the total N load to the Croatian water resources (91.5 percent).
The mean value of the damages obtained by these two methods has been taken as the final damage caused by the excessive nitrogen in water.
In addition to this, another external nitrogen-related cost has been added. It is the cost of the lost nitrogen resources from the farming system. In the period 2001-2003 on average some 49.1 Mt of nitrogen was washed into water annually. This lost nitrogen represents inefficient resource use. If farmers had to purchase this nitrogen and apply it, it would cost them additional money. One could however, argue that this is neither an environmental nor a social cost because the nitrogen inefficiency has already been included in the price of the agricultural produce. However, it is a cost of insufficient resource use leading to environmental pollution. For this reason we consider it as an externality. Each kilogram of nitrogen washed into water is multiplied by 0.5 EUR. This was its average commercial value in the studied period (Mikšić, Murguić et al. 2004). The same source indicates the application cost of 0.01 EUR per kg N per hectare.
The pesticide damage is assessed by applying a flat rate of 0.2 EUR for the treatment of one cubic metre of water and represents the average treatment costs reported for Austria, Germany and the EU-15 (Rapinat 1993; Lughofer and Kratochvil 1997; Van der Bruggen and Vandecasteele 2003). This cost is multiplied with the annual use of drinking water by the population and as in the case of nitrogen, is assumed to be equal to the damage.
In the period 2001-2003, Petrokemija annually released on average 16.93 tonnes of fluorides into the water (Petrokemija 2005). This is a highly toxic substance and the new water permit issued in 2004 requires Petrokemija to reduce the emission of fluoride beyond levels that seem to be possible to reach with its present technology (Vešligaj 2004). The literature on the shadow price of fluoride is scarce. However, the Netherlands Ministry of the Environment (VROM 1999) and the Centre for Energy and Technology from the Netherlands (Davidson, Hof et al. 2002) set a shadow price per kilogram of discharged fluoride at 1.840 EUR in 1999. Updating this value by a 5 percent compounded rate annually would result in 2.348 EUR per kilogram of fluoride value in 2005. However, because of the high uncertainty we applied half the price of the Netherlands 1999 value. This allows for a more conservative estimate and possibility that the shadow price of fluoride under Croatian circumstances is cheaper than in the Netherlands (although it might be also the other way around).
Pesticides damage
Fluoride from fertiliser production
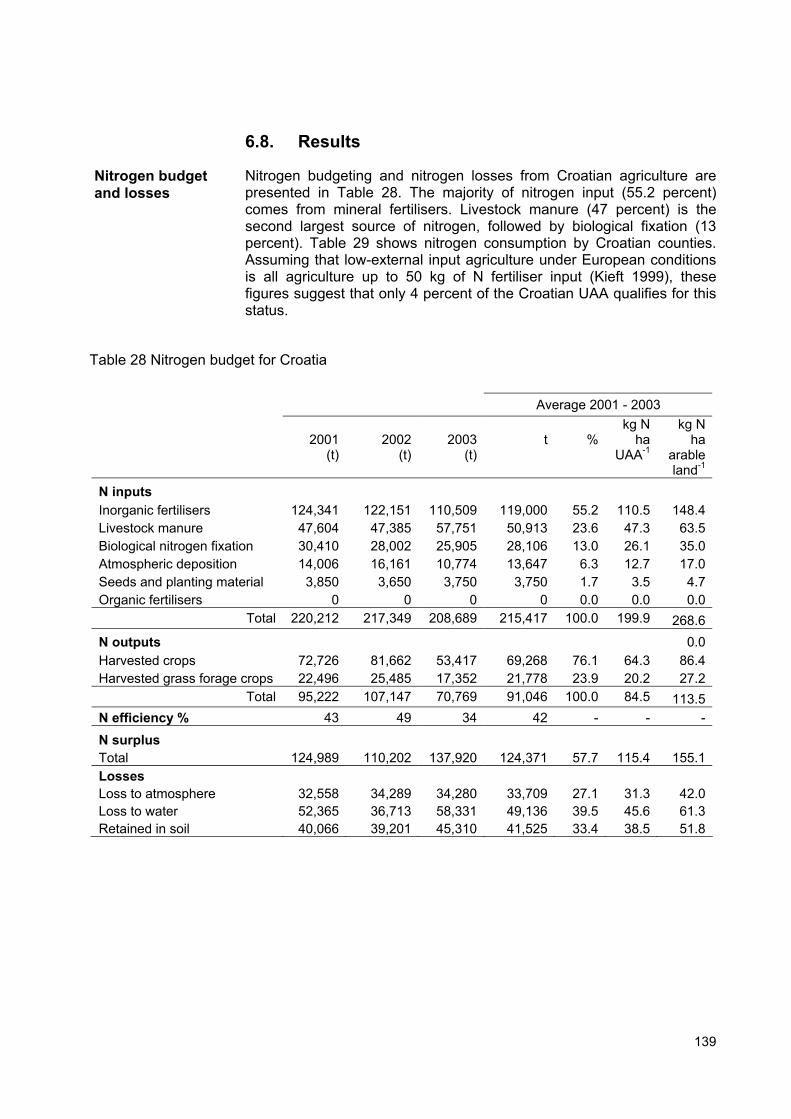
139
6.8. Results
Nitrogen budgeting and nitrogen losses from Croatian agriculture are presented in Table 28. The majority of nitrogen input (55.2 percent) comes from mineral fertilisers. Livestock manure (47 percent) is the second largest source of nitrogen, followed by biological fixation (13 percent). Table 29 shows nitrogen consumption by Croatian counties. Assuming that low-external input agriculture under European conditions is all agriculture up to 50 kg of N fertiliser input (Kieft 1999), these figures suggest that only 4 percent of the Croatian UAA qualifies for this status.
Table 28 Nitrogen budget for Croatia
Average 2001 - 2003
2001
(t)
2002
(t)
2003
(t)
t
%
kg N ha
UAA-1
kg N ha
arable land-1
N inputs Inorganic fertilisers 124,341 122,151 110,509 119,000 55.2 110.5 148.4Livestock manure 47,604 47,385 57,751 50,913 23.6 47.3 63.5Biological nitrogen fixation 30,410 28,002 25,905 28,106 13.0 26.1 35.0Atmospheric deposition 14,006 16,161 10,774 13,647 6.3 12.7 17.0Seeds and planting material 3,850 3,650 3,750 3,750 1.7 3.5 4.7Organic fertilisers 0 0 0 0 0.0 0.0 0.0
Total 220,212 217,349 208,689 215,417 100.0 199.9 268.6N outputs 0.0Harvested crops 72,726 81,662 53,417 69,268 76.1 64.3 86.4Harvested grass forage crops 22,496 25,485 17,352 21,778 23.9 20.2 27.2
Total 95,222 107,147 70,769 91,046 100.0 84.5 113.5N efficiency % 43 49 34 42 - - -
N surplus Total 124,989 110,202 137,920 124,371 57.7 115.4 155.1Losses Loss to atmosphere 32,558 34,289 34,280 33,709 27.1 31.3 42.0Loss to water 52,365 36,713 58,331 49,136 39.5 45.6 61.3Retained in soil 40,066 39,201 45,310 41,525 33.4 38.5 51.8
Nitrogen budget and losses
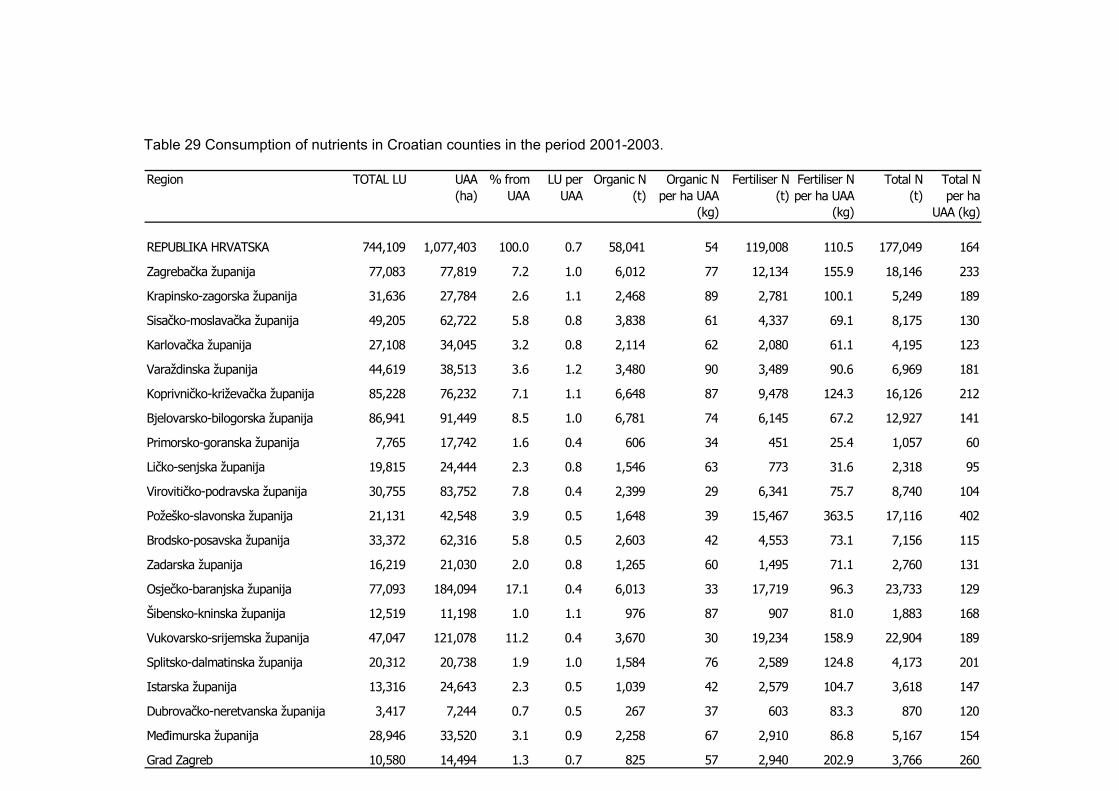
Region TOTAL LU UAA (ha)
% from UAA
LU per UAA
Organic N (t)
Organic N per ha UAA
(kg)
Fertiliser N (t)
Fertiliser N per ha UAA
(kg)
Total N (t)
Total N per ha
UAA (kg)
REPUBLIKA HRVATSKA 744,109 1,077,403 100.0 0.7 58,041 54 119,008 110.5 177,049 164
Zagrebačka županija 77,083 77,819 7.2 1.0 6,012 77 12,134 155.9 18,146 233
Krapinsko-zagorska županija 31,636 27,784 2.6 1.1 2,468 89 2,781 100.1 5,249 189
Sisačko-moslavačka županija 49,205 62,722 5.8 0.8 3,838 61 4,337 69.1 8,175 130
Karlovačka županija 27,108 34,045 3.2 0.8 2,114 62 2,080 61.1 4,195 123
Varaždinska županija 44,619 38,513 3.6 1.2 3,480 90 3,489 90.6 6,969 181
Koprivničko-križevačka županija 85,228 76,232 7.1 1.1 6,648 87 9,478 124.3 16,126 212
Bjelovarsko-bilogorska županija 86,941 91,449 8.5 1.0 6,781 74 6,145 67.2 12,927 141
Primorsko-goranska županija 7,765 17,742 1.6 0.4 606 34 451 25.4 1,057 60
Ličko-senjska županija 19,815 24,444 2.3 0.8 1,546 63 773 31.6 2,318 95
Virovitičko-podravska županija 30,755 83,752 7.8 0.4 2,399 29 6,341 75.7 8,740 104
Požeško-slavonska županija 21,131 42,548 3.9 0.5 1,648 39 15,467 363.5 17,116 402
Brodsko-posavska županija 33,372 62,316 5.8 0.5 2,603 42 4,553 73.1 7,156 115
Zadarska županija 16,219 21,030 2.0 0.8 1,265 60 1,495 71.1 2,760 131
Osječko-baranjska županija 77,093 184,094 17.1 0.4 6,013 33 17,719 96.3 23,733 129
Šibensko-kninska županija 12,519 11,198 1.0 1.1 976 87 907 81.0 1,883 168
Vukovarsko-srijemska županija 47,047 121,078 11.2 0.4 3,670 30 19,234 158.9 22,904 189
Splitsko-dalmatinska županija 20,312 20,738 1.9 1.0 1,584 76 2,589 124.8 4,173 201
Istarska županija 13,316 24,643 2.3 0.5 1,039 42 2,579 104.7 3,618 147
Dubrovačko-neretvanska županija 3,417 7,244 0.7 0.5 267 37 603 83.3 870 120
Međimurska županija 28,946 33,520 3.1 0.9 2,258 67 2,910 86.8 5,167 154
Grad Zagreb 10,580 14,494 1.3 0.7 825 57 2,940 202.9 3,766 260
Table 29 Consumption of nutrients in Croatian counties in the period 2001-2003.
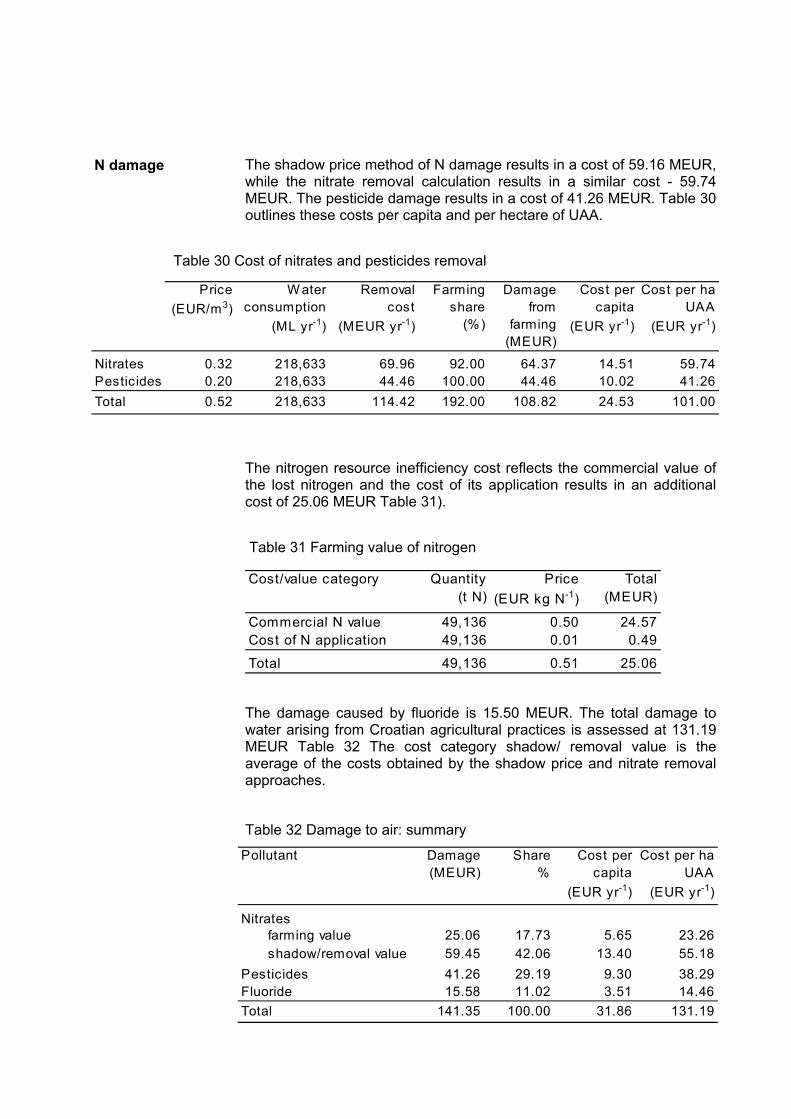
Pollutant Damage (MEUR)
Share %
Cost per capita
(EUR yr-1)
Cost per ha UAA
(EUR yr-1)
Nitratesfarming value 25.06 17.73 5.65 23.26shadow/removal value 59.45 42.06 13.40 55.18
Pesticides 41.26 29.19 9.30 38.29Fluoride 15.58 11.02 3.51 14.46Total 141.35 100.00 31.86 131.19
Cost/value category Quantity (t N)
Price (EUR kg N-1)
Total (MEUR)
Commercial N value 49,136 0.50 24.57Cost of N application 49,136 0.01 0.49
Total 49,136 0.51 25.06
Price (EUR/m3)
W ater consumption
(ML yr-1)
Removal cost
(MEUR yr-1)
Farming share
(%)
Damage from
farming (MEUR)
Cost per capita
(EUR yr-1)
Cost per ha UAA
(EUR yr-1)
Nitrates 0.32 218,633 69.96 92.00 64.37 14.51 59.74Pesticides 0.20 218,633 44.46 100.00 44.46 10.02 41.26Total 0.52 218,633 114.42 192.00 108.82 24.53 101.00
The shadow price method of N damage results in a cost of 59.16 MEUR, while the nitrate removal calculation results in a similar cost - 59.74 MEUR. The pesticide damage results in a cost of 41.26 MEUR. Table 30 outlines these costs per capita and per hectare of UAA.
Table 30 Cost of nitrates and pesticides removal
The nitrogen resource inefficiency cost reflects the commercial value of the lost nitrogen and the cost of its application results in an additional cost of 25.06 MEUR Table 31).
Table 31 Farming value of nitrogen
The damage caused by fluoride is 15.50 MEUR. The total damage to water arising from Croatian agricultural practices is assessed at 131.19 MEUR Table 32 The cost category shadow/ removal value is the average of the costs obtained by the shadow price and nitrate removal approaches.
Table 32 Damage to air: summary
N damage
142
6.9. Discussion
From the calculations of this study it appears that the Croatian nitrogen balance is higher than the nitrogen balance of the EU-15 (Brouwer, Hellegers et al. 1999; Terres 2002) and substantially higher than in other Danube basin countries (Redman 2003). Consequently, nitrogen losses to water are also higher than in many other countries.
The nitrogen recovery by crops (efficiency) of 42 percent is within the typical ranges of 30-40 percent reported in other studies (Delgado 2002; 2002; SOS 2002; Delgado, Dillon et al. 2004; Leach, Allingham et al. 2004). Coincidentally, it is exactly the same as the nitrogen efficiency for the UK as reported by HRI (2002).
Results on nitrogen losses that are similar to those obtained here have been reported by Kolbe (1990) for intensive conventional arable farming in Germany. The nitrogen input was 234 kg N-1, while the surplus was 112 kg N ha-1, of which 60 kg N has been leached, resulting in nitrogen concentration of 79 mg NO3 mg L-1. The share of nitrogen lost into the atmosphere, water and stored in soil is also very similar to those reported by Isermann (2003).
Nitrogen washed into water has been determined as the difference between nitrogen lost in the atmosphere and nitrogen retained in the soil. Instead, we could have also used the methodology suggested by the IPCC (2001; 2001). It recommends a 30 percent flat rate to be applied over the nitrogen amount added in the form of fertilisers and livestock manure in order to determine nitrogen leaching. But this simplified approach does not take into account nitrogen inputs through biological fixation, atmospheric deposition and seeds and planting material. Interestingly, the nitrogen loss to water obtained through both calculation methods differs only by some two percent. The IPCC method would result in an average nitrogen loss to water of 50,250 t N for the period 2001-2003, while our approach gives a loss of 49,136 t N.
The nitrogen surplus and nitrogen loss to water per hectare of UAA presented in this study is substantially higher than those presented by Redman (2003) and Schreiber et al. (2003) for the Croatian part of the Danube basin (surplus of 39.2 kg N ha-1 and nitrogen loss of 8.3 kg N ha-1 of agricultural land). But this is easy to explain. Their calculation is based on a much greater agricultural area than is in use. Their estimate is that the farmland of the Croatian Danube basin is 1.8 million hectares, while the UAA of the entire country is some 1.1 million hectares as explained in the earlier chapters of this study. This huge gap in land use area leads to crucial differences in their calculation and the one provided in this study. Besides, the nitrogen fertiliser consumption data by Redman (2003) and Schreiber et al. are taken from the FAOSTAT and Croatian experts. These do not take into account imported fertilisers, resulting in a lower nitrogen load to farmland. Redman (2005) has also assumed N inputs of 100-120 kg N ha-1 for wheat, which is some 50 percent lower than the application rates found by Sumelius et al. (2003; 2003; 2005) and the average per hectare N input obtained in this study. Some of these problems have been recognised by Schreiber et al. (Schreiber, Behrendt et al. 2003) who clearly stress that their nitrogen
N balance
N efficiency
N losses
N losses differ from the Danube basin studies
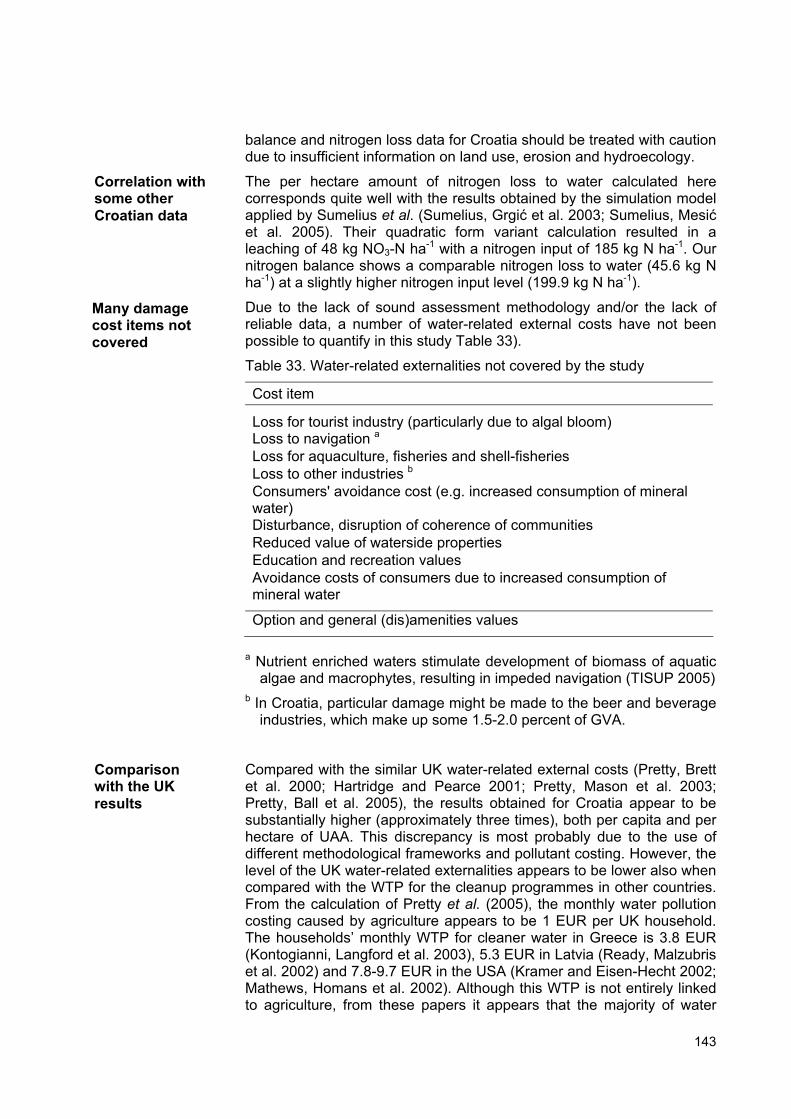
143
balance and nitrogen loss data for Croatia should be treated with caution due to insufficient information on land use, erosion and hydroecology.
The per hectare amount of nitrogen loss to water calculated here corresponds quite well with the results obtained by the simulation model applied by Sumelius et al. (Sumelius, Grgić et al. 2003; Sumelius, Mesić et al. 2005). Their quadratic form variant calculation resulted in a leaching of 48 kg NO3-N ha-1 with a nitrogen input of 185 kg N ha-1. Our nitrogen balance shows a comparable nitrogen loss to water (45.6 kg N ha-1) at a slightly higher nitrogen input level (199.9 kg N ha-1).
Due to the lack of sound assessment methodology and/or the lack of reliable data, a number of water-related external costs have not been possible to quantify in this study Table 33).
Table 33. Water-related externalities not covered by the study
Cost item
Loss for tourist industry (particularly due to algal bloom) Loss to navigation a Loss for aquaculture, fisheries and shell-fisheries Loss to other industries b Consumers' avoidance cost (e.g. increased consumption of mineral water) Disturbance, disruption of coherence of communities Reduced value of waterside properties Education and recreation values Avoidance costs of consumers due to increased consumption of mineral water
Option and general (dis)amenities values
a Nutrient enriched waters stimulate development of biomass of aquatic algae and macrophytes, resulting in impeded navigation (TISUP 2005)
b In Croatia, particular damage might be made to the beer and beverage industries, which make up some 1.5-2.0 percent of GVA.
Compared with the similar UK water-related external costs (Pretty, Brett et al. 2000; Hartridge and Pearce 2001; Pretty, Mason et al. 2003; Pretty, Ball et al. 2005), the results obtained for Croatia appear to be substantially higher (approximately three times), both per capita and per hectare of UAA. This discrepancy is most probably due to the use of different methodological frameworks and pollutant costing. However, the level of the UK water-related externalities appears to be lower also when compared with the WTP for the cleanup programmes in other countries. From the calculation of Pretty et al. (2005), the monthly water pollution costing caused by agriculture appears to be 1 EUR per UK household. The households’ monthly WTP for cleaner water in Greece is 3.8 EUR (Kontogianni, Langford et al. 2003), 5.3 EUR in Latvia (Ready, Malzubris et al. 2002) and 7.8-9.7 EUR in the USA (Kramer and Eisen-Hecht 2002; Mathews, Homans et al. 2002). Although this WTP is not entirely linked to agriculture, from these papers it appears that the majority of water
Correlation with some other Croatian data
Many damage cost items not covered
Comparison with the UK results
144
pollution problems considered are linked to agriculture. The UK studies also largely rely on the actual water pollution incidents, which seem to be rare, while in the case of Croatia, it has been assumed that the majority of water does not meet water quality standards for nitrates and pesticides.
Nitrate concentrations in the UK drinking water above 50 mg NO3 L-1 are infrequent and Hartridge and Pearce (2001) were not able to assess damage to water caused by excessive nitrogen in UK water. However, from the work of Pretty et al. (2000; 2005) the damage to UK water attributed to nitrogen seems to be about 108 MEUR. However, the nitrogen removal cost of the UK water companies remains modest, some 28 million EUR per year (Pretty, Mason et al. 2003), corresponding to 0.5 EUR per capita. On the other hand, the average nitrate removal cost in the EU countries is reported to be in the range of 0.25 to 0.38 EUR per cubic metre of water (Lughofer and Kratochvil 1997; Gorenflo, Velazquez-Padron et al. 2003; Van der Bruggen and Vandecasteele 2003). Assuming that all drinking water in the UK would have to be treated under this cost, the present UK nitrate removal expenditure would suffice for 13 days only. Relatively high nitrogen damage in Croatia can also be defended from the impact on health point of view. The agricultural nitrogen input is 200 kg N ha-1 of UAA, i.e. some 30 per cent above the nitrate levels ensuring nitrate-safe drinking water in Central Croatia. However, about half of the Croatian territory lies in nitrogen-leaching-prone karst regions. This means that the population is already or will soon be exposed to an excessive concentration of nitrates in water. As only few (or no) water companies seem to be practicing nitrate removal, it is logical that the UK nitrate prevention (removal) cost per capita is much cheaper than the health damage occurring in Croatia due to the lack of nitrate removal.
The UK uses some 25,000 t of pesticides per year (Hartridge and Pearce 2001), which divided between 18.5 million hectares of UAA (DEFRA 2005) gives a consumption rate of 1.4 kg pesticides per hectare. The calculation from this study shows that Croatia uses six times more pesticides - 8.1 kg per hectare. Thus it is no wonder that water-related pesticide costs per capita and per ha of UAA is higher in Croatia. Besides, the most pronounced problem with pesticides in Croatia relates to the excessive presence of triazine herbicides in water. However, in the UK, both atrazine and simazine have been banned since 1993 (Hartridge and Pearce 2001) and thus do not pose a threat as in the case of Croatia. The per capita pesticide costs reported in the UK studies are also substantially lower than elsewhere in Europe (Foster, Mourato et al. 1998), the USA (Brethour and Weersink 2001) and Vietnam (Phuong and Gopalakrishnan 2003). Charging a rate of 17.5 EUR per kg of pesticide applied, as done by Hartridge and Pearce (2001) for the UK, would result in a damage cost of 117,3 MEUR. However, our calculation results in a cost some three times lower. This is not surprising, because Hartridge and Pearce’s (2001) pesticide cost estimate derives from the research of Foster et al. (1998). Their estimates do not relate to the pesticide discharge in water, but to the WTP to avoid pesticide residues in food, and besides the concern for human health also included concern for the safety of birds.
145
7. DAMAGE TO SOIL
7.1. Soil-related external costs and valuation methods
Soil related externalities, notably those of erosion, have been the subject of debate for some time (Conway and Pretty 1991; Pimentel, Harvey et al. 1995; Pretty 1995; Znaor 1995; Pretty 1998; Volker 1998; Knowler 2004). Estimates of soil-related external costs exist for several countries and are usually part of the overall assessment of agricultural externalities (Pretty, Brett et al. 2000; Hartridge and Pearce 2001; Tegtmeier and Duffy 2004). According to the European Conservation Agriculture Federation, soil erosion increases EU-15 annual agricultural production costs by about 53 EUR per hectare, representing some 25 per cent of the direct production costs (ECAF 2000). Further, if on-site and off-site costs are combined, the total annual cost of erosion from EU agriculture can be estimated at about 85.5 EUR per hectare (Pimentel, Harvey et al. 1995; ECAF 2000). The off-site soil erosion economic damage is nearly 40 percent of the total cost of the erosion (Pimentel, Harvey et al. 1995). The cost of erosion, evaluated as the cost of the operations necessary to redistribute the sediment/soil over the field and to repair the hillside ditches, equal some 5 per cent of the farm income in Spain (Martinez-Casasnovas, Ramos et al. 2005). The on-site soil erosion highly depends on the rotation and in some parts of the USA ranges from 3-20 EUR ha-1 (Brusven, Walker et al. 1995). The World Bank (1992) has calculated the total off-site costs of soil erosion in the United States to be approximately 17 billion EUR per year. According to these estimates, the off-site damage and on-site costs of soil erosion together cost the United States some 44 billion EUR every year, resulting in about 26 EUR ha-1 of cropland. However, these calculations do not include offsite costs such as reservoir infilling, river sedimentation, damage to irrigation systems, etc. (Holland and Watkiss 2002). A comprehensive assessment of the damage to soil in the USA has been made by Tegtmeier and Duffy (Tegtmeier and Duffy 2004), resulting in a cost of 13-80 EUR per hectare of cropland. The soil damage from UK agriculture (off-site soil erosions and organic matter loses) is estimated at 85 MEUR (Pretty, Brett et al. 2000). The exact figures for the so-called developing world are not available, but the estimates from eight countries indicate that the cost of soil erosion is 0.9-17.4% of the GNP with an average of 8.33% (Barbier and Bishop 1995). However, the World Bank (1992) reported that extrapolation from test-plots of impacts of soil loss on agricultural productivity, results in a 0.5-1.5% loss of GDP annually for countries such as Costa Rica, Malawi, Mali and Mexico.
Soil conservation measures taken in fields are effective means in reducing on-site soil loss and in drastically reducing sediment yield. Off-site sediment control measures appear to be much less effective (Verstraeten, Van Oost et al. 2002). Knowler (2004) compiled data from 67 studies of the financial attractiveness of conservation technologies and found that 64 percent of these can provide positive net returns at the farm level.
Estimates on soil damage costs
On-site protection most effective
146
7.1.1 Soil carbon Due to international concerns about greenhouse gas emissions and global climate change, the international community has increasingly been placing emphasis on the need to sequester carbon from atmospheric carbon dioxide into soil organic matter (Lal 2003; Smith 2004; Machado 2005). A reduction in CO2-carbon emissions and sink growth will be key to meeting Europe's Kyoto targets and agricultural practices will play an important role in this process (Smith, Powlson et al. 1997; Smith, Powlson et al. 2000; Pretty and Ball 2001; Smith 2004). The carbon sink capacity of the world's agricultural and degraded soils is 50 to 65 percent of the historic carbon loss of 42 to 78 GT of carbon (Lal 2004). Agricultural soils in the EU-15 are believed to be able to sequester up to 16-19 Mt C year-1 during the first Kyoto commitment period (2008-2012), representing less than one fifth of the theoretical potential and equivalent to 2% of European anthropogenic emissions (Freibauer, Rounsevell et al. 2004). As agriculture is capable of reducing greenhouse-gas emissions and increasing carbon sinks, the carbon mitigation potential of the so called less developed countries might yield a financially interesting reward (Pretty, Ball et al. 2002) and trading mitigation gains due to “carbon faming” might in the near future represent a substantial share of the national income of these counties (Smith, Mulongoy et al. 2000; Pretty and Ball 2001; Znaor 2005).
Carbon makes some fifty percent of the SOM on average (Bauder 1999; Pretty, Brett et al. 2000). The building up of carbon stocks in the soil is enhanced by the increased input of organic matter to the soil, and/or decreased rate of soil organic matter decomposition (Smith, Powlson et al. 1997; Smith, Powlson et al. 2000; Renwick, Ball et al. 2002; Smith 2004). SOM has a stabilising effect on soil structure, increases water and air holding capacity, protects soil against erosion and enhances soil biological activity (Grandy, Porter et al. 2002; Mäder, Fliessbach et al. 2002; Pulleman, Jongmans et al. 2003; Mäder 2004; Six, Bossuyt et al. 2004). SOM content is determined by a variety of factors, such as soil moisture, temperature, oxygen supply, drainage, soil acidity, nutrient supply, clay content and mineralogy (Pretty and Ball 2001).
Most of the today’s agricultural practices result in a loss of soil carbon. Expert opinions indicate that in about 20-50 years of intense tillage most European agricultural soils lost 50-65 percent of soil carbon (Davidson and I.L. Ackerman 1993; González-Fernández 1997; Matson, Parton et al. 1997; EEA 1998; ECAF 2000). This is undesirable not only from the climate change point of view but also from the soil fertility point of view, because 45-58 percent of stable soil organic matter is carbon, while nitrogen makes up 4-5 percent (Bauder 1999).
There are only few studies estimating the agricultural soil carbon sequestration potential for Europe (Freibauer, Rounsevell et al. 2004). The average carbon content in European arable soils is about 53 t C ha-1 at 30 cm depth (Smith, Smith et al. 2001). However, there are great regional variations, depending on the climatic conditions and soil types. The average carbon content of the UK soils is for instance much higher than the European average: 162 t C ha-1 for arable soils, 207 t C ha-1 for
Soil carbon sequestration potential
Importance of SOM
Carbon losses
Rate of carbon sequestration
147
permanent pastures and 350 t C ha-1 for soils under semi-natural vegetation (Pretty, Brett et al. 2000). A mineral soil with 4 percent organic matter contains as much as 90 t of organic matter per hectare at a depth of 0-15 cm; 36-47 t of carbon, and 468 t of nitrogen per hectare (Bauder 1999). Intensive soil cultivation and notably conversion of grassland into arable land enhances mineralisation, leading to the loss of SOM and soil carbon (Znaor 1995; Pretty and Ball 2001). The efficiency of conversion of residue carbon to soil organic matter is 10-18 percent, depending on the crop rotation and fertilisation level (Campbell, Zentner et al. 2000; Gregorich, Drury et al. 2001). The sequestration rates of soil organic carbon depend on soil texture and structure, rainfall, temperature, farming system, and soil management (Lal 2004; Lal 2004). Zero tillage with mixed rotations and cover crops can accumulate 0.66-1.3 t C ha-1 year-1 (Pretty and Ball 2001) or maximum up to 0.8 t C ha-1 year-1 under European conditions (Freibauer, Rounsevell et al. 2004). However, the uncertainties regarding the contribution of different farming practices to the increase of soil carbon stocks in European agricultural soils are still great, as well as the potential of the annual sequestration rates per hectare (Freibauer, Rounsevell et al. 2004). The sequestration effect of the application of the added soil organic matter under European conditions is still a matter of debate (Freibauer, Rounsevell et al. 2004). Vleeshouwers and Verhagen (2002) for instance estimate that the incorporation of 10 tonnes fresh matter of farmyard manure results in an increase of 1.5 t C ha-1, while the calculation from Smith et al. (2000; 2000; 2001), using the same amount of manure and similar humification rates results in a gain of only 0.4 t C ha-1. Other authors (Jenkinson, Bradbury et al. 1994; Powlson 1994) argue that the application of manure can double soil carbon (or nitrogen) levels in about forty years. An extensive study on carbon sequestration in Europe (Freibauer, Rounsevell et al. 2004) concludes that the application of organic matter (crop residues, cover crops, farmyard-manure, compost, etc.) on arable land leads to a sequestration rate of 0.3-0.8 t C ha-1. An increase of one ton of soil carbon may increase crop yields by 20-40 kg ha-1 for wheat, 10-20 kg ha-1 for maize and 0.5 to 1 kg ha-1 for cowpeas (Lal 2004).
The estimates for the value of the soil carbon range from some 5 EUR t-1 (Pretty, Ball et al. 2002) to 10 EUR t-1 (Niles, Brown et al. 2002), up to some 70 EUR t-1 (Smith, Powlson et al. 1998; IER 2004; IER 2004; IER 2005).
7.1.2 Soil erosion Soil erosion moves soil particles and associated agricultural pollutants into watercourses, resulting in the sedimentation of watercourses and dams and leading to decreased retention volume of water-bodies and more likely flooding (Znaor 1999). Erosion silts hydraulic structures and damages irrigation systems, disrupts the ecosystems of lakes and contaminates drinking water. Roadside ditches and irrigation channels clogged with eroded soil require sediment removal and maintenance to prevent local flooding (Tegtmeier and Duffy 2004). Runoff of soil particles from the land increases water turbidity, smothering the bed of rivers and lakes. Particles also carry phosphorus, pesticides, faecal pathogens and other pollutants into surface waters. Fine particles clog
Soil carbon value
Soil erosion impacts
148
coarse river gravels, reducing water flow and aeration of the river bed, reducing the survival of fish eggs and fry, invertebrates and plants such as water crowfoot (Znaor 1999). In addition to productivity losses, soil erosion causes damages to field structures, such as conservation structures, roads, bunds, and fences.
Soil-related externalities basically concern on-site and off site soil erosion costs and the loss of soil carbon. The on-site cost of soil erosion is defined as the value of lost future productivity due to current cultivation (Burt 1981; Gunatilake and Vieth 2000). These costs are imposed on farmers themselves and comprise (Pretty, Brett et al. 2000): • the loss of organic matter, leading to decreased water holding
capacity of soils and increased run-off • reduced yields because crops germinate and develop more slowly
due to the loss of organic matter-rich soils • loss of nutrients and crops themselves in water and wind erosion.
The off-site soil erosion costs relate to public and private expenditure arising from blockage of roads and ditches, damage to property, induction of traffic accidents, increased risk of flooding and water pollution (Pretty, Brett et al. 2000).
Average soil erosion rates at national and regional levels are rare and contradictory. Pimentel suggests the average soil erosion for Europe to be 17 t ha-1, (Pimentel, Harvey et al. 1995), although the method by which this figure was derived was later challenged by some authors (Crosson 1997; Boardman 1998; Trimble and Crosson 2000). Seven year plot data from central Italy indicate an average annual soil erosion of 5.6 t ha-1 for wheat, 18.7 ha-1 for maize and 2.2 t ha-1 for pastures (Zanchi 1988).
A common problem associated with valuing the cost of soil erosion is the assessment of the national soil erosion. Too few countries seem to have reliable data on this. Soil erosion on a national scale is difficult to assess and extrapolation from field data does not give accurate results, particularly because the scale factor is poorly understood. Calibration and validation of spatially distributed soil erosion models is associated with difficulties and is subject to errors (Jetten, Govers et al. 2003). In twenty one catchments in central Belgium, for instance, the mean error on computed sediment yield, using sediment deposits in small ponds, was estimated to range between 40 and 50 per cent (Verstraeten and Poesen 2002). A paper from Boardman (Boardman 1998) discusses at length the limits and pitfalls regarding calculations of the soil erosion rates and their extrapolations for various objectives, stressing that converting plot experiments is a poor basis for regional or national determination of soil erosion.
7.2. State of Croatian soils
Data on the soil damages in Croatia are incomplete, not well organized and not systematised in a database enabling sound damage assessments (Kisić, Bašić et al. 2001; Kisić, Bašić et al. 2002). Soil testing and monitoring is inadequate and insufficient too (Bašić 2002;
On-site soil erosion costs
Off-site soil erosion costs
Soil erosion rates
Problems with assessing soil erosion at national levels
Poor data on soil damage

149
Vidaček, Bogunović et al. 2005). Water sediment testing is unsystematic and is done at nine sites only (Musić, Pojatina Basta et al. 2003).
Data on soil pollution with pesticides is scarce, while heavy metals are reported to be within tolerable limits (Čoga, Vidaček et al. 1998).
More than 90 percent of Croatian soils are subject to various degrees of erosion (UN-ECE, 1999; Grgić et al., 1999). Although there seems to be a national consensus about this high figure, several authors stress that on approximately 70 percent of the area this process is still within “tolerable limits” (Petraš, Bašić et al. 1994). The most critical situation is in the region of central Istria where erosion rates as high as 100-200 tonnes of soil per hectare of agricultural land have been recorded (UN-ECE 1999). Several studies have assessed potential and actual risk of soil erosion in Croatia and sophisticated maps indicating these risks exist (Husnjak, Bogunović et al. 2000; Husnjak, Bogunović et al. 2000). However, these studies just analyse the soil erosion risks and do not quantify the national soil erosion from agricultural land. The improved digital soil mapping information doesn’t give this answer either (Husnjak 2005). However, Kisić et al. (Kisić, Bašić et al. 2003) have estimated the soil erosion from agricultural land in Croatia at 3.8 million tonnes, and the average soil erosion rate at 1.21 t ha-1.
Recent soil erosion trials in Croatia have been undertaken at four sites in different regions: Butoniga (Istria), Mali Vrh (Hrvatsko Zagorje), Klačine (Dalmatia) and Daruvar (Slavonia). The results from the latter trial have been widely published (Bašić, Kisić et al. 2000; Bašić, Kisić et al. 2002; Bašić, Kisić et al. 2002; Bašić, Kisić et al. 2002; Kisić, Bašić et al. 2002; Kisić, Bašić et al. 2002; Kisić, Bašić et al. 2003; Kisić, Bašić et al. 2003; Kisić, Bašić et al. 2003; Bašić, Kisić et al. 2004; Kisić, Bašić et al. 2004; Kisić, Bašić et al. 2004) and used to assess the soil erosion at the national scale (Kisić, Bašić et al. 2003). The experiment was run from 1995-1999 on stagnic luvisols soil and included maize (Zea mays L.), soybean (Glycine hyspida L.), winter wheat (Triticum aestivum L.), oil-seed rape (Brassica napus var. oleifera L.), spring barley (Hordeum vulgare L.), double-cropped soybean/spring barley and black fallow. Several tillage treatments including across, up and down-slope tillage as well as the no-tillage method were tested. The no-tillage system was found to be superior over the others and reduced soil erosion in maize and soybean 40-65 percent compared to ploughing up and downhill. A standard depth of ploughing across a slope (the most common practice in Croatia) resulted in average erosion rates of 11.7 t ha-1 for maize, 5.4 t ha-1 for soybean; 0.1 t ha-1 for winter wheat and oil-seed rape; and 0.2 t for ha-1 spring barley and double cropping barley-soybean. The eroded soil was found to be richer in organic matter and contain more available phosphorus and potassium than the plot soil.
There has been no systematic monitoring of soil organic matter loss at the national level. Thus the available estimates are based on expert opinion, rather than on the actual national measurements over a period of time. The most fertile Croatian soil types (chernozem and eutric brown soil) have in the last hundred years of cultivation lost 50-70 percent of SOM and the humus content has dropped from 4-6 percent to 1-2 percent on average (Vidaček, Bogunović et al. 2005). The soil organic matter loss of various types of Croatian soil has also been reported by
Soil pollution
National soil erosion estimates
Soil erosion trials
SOM losses
150
Martinović (1997) and these analyses suggest that the most important Croatian agricultural soils have lost 2.1-2.8 percent of soil organic matter in the last 50 years. Reclaimed soils have in the period of about 20 years lost humus levels from 6-10 percent to 4-5 percent and most Croatian agricultural soils currently have a humus level of 1.5-2.5 per cent. (Vidaček, Bogunović et al. 2005).
The carbon dioxide emitted by the Croatian agricultural sector (livestock, fertilisers, manure and residues burning) in the mid nineties has been estimated at 723,00 t CO2 equivalent per year (Mesić et al. 2000). However, according to Bašić (2002), 723,00 t CO2 derives from agricultural soils alone. If divided on 3.15 m ha taken as the agricultural area in use, it corresponds to 63 kg C ha-1. The same source estimates that approximately 225,000 t of carbon is stored in Croatian agricultural soils in the form of stable humus, corresponding to 0.2 t C ha-1.
Soil compaction is another pronounced problem in Croatian soils and the reported loss of air/water porosity is in the range of 3-9 percent (Vidaček, Bogunović et al. 2005).
So far there has been no attempt to assess soil damage costs in Croatia. However, Marušić (2003; 2003) has highlighted the economic loss due to neglected drainage, irrigation and other channels on agricultural land. The maintenance cost of these hydraulic systems costs some 54 MEUR. However, an additional cost relates to the yield reduction of agricultural crops. According to Marušić’s hypothetical calculations, the yields on the agricultural land along neglected channels are dramatically lower: 60-66 percent for maize and 57-60 percent for wheat. Wheat grown on this land is calculated to be lower by 1.7-2.3 t ha-1, resulting in a revenue loss of 200-300 EUR ha-1 or some 100 MEUR for maize and wheat alone.
7.3. Methodology
The soil erosion has been calculated using the following estimates and assumptions:
• the cropping pattern is taken from DZS (2002; 2003; 2004) and adjusted to the total UAA reported by the agricultural census (DZS 2003).
• soil erosion rates for individual crops are taken from the results for standard depth ploughing across the hill from the Daruvar experiments (Kisić, Bašić et al. 2002; Bašić, Kisić et al. 2004) and adjusted for some crops to the rates that are believed to better reflect the national average.
• the average soil organic matter content is assumed to be 1.8 percent based on the estimates by Vidaček et al. (2005)
• the average carbon content in the SOM is assumed to be 50 percent and is based on Bauder (1999) and Pretty et al. (Pretty, Brett et al. 2000)
• the average content of nitrogen, phosphorus and potassium in Croatian soils is estimated from the data of Martinović (1997).
CO2 emissions
Soil compaction
Damage due to neglected channels maintenance
Soil erosion estimate
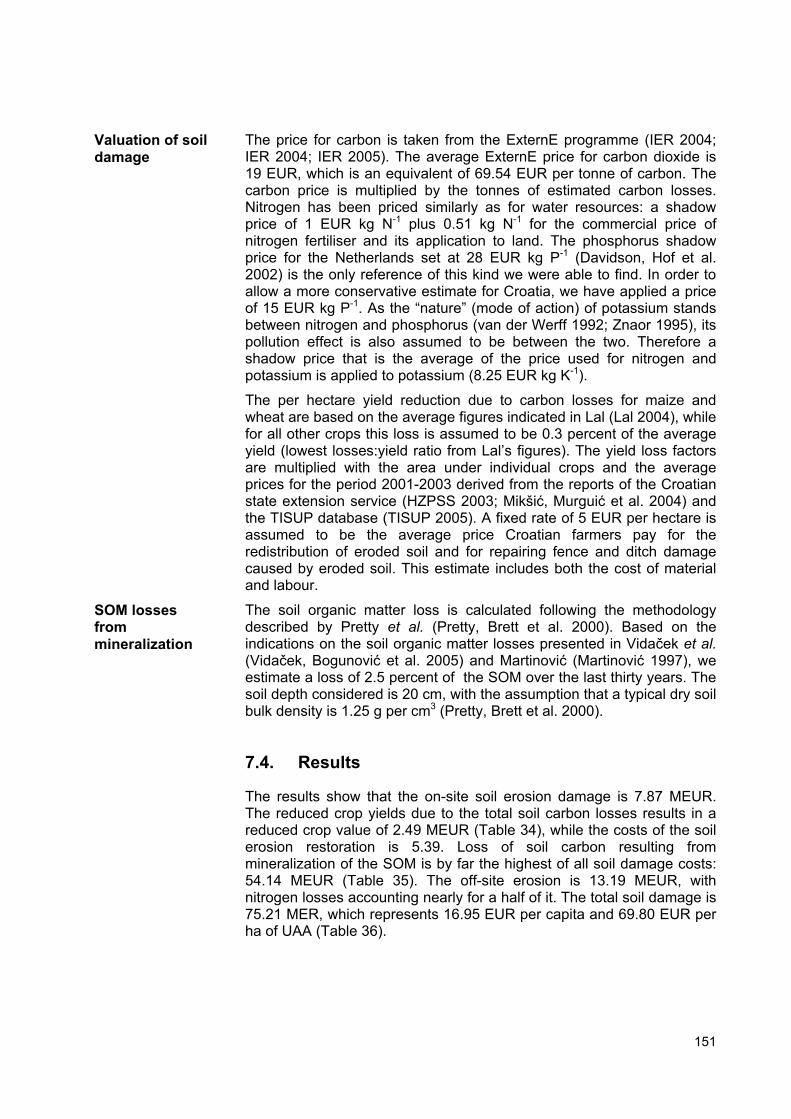
151
The price for carbon is taken from the ExternE programme (IER 2004; IER 2004; IER 2005). The average ExternE price for carbon dioxide is 19 EUR, which is an equivalent of 69.54 EUR per tonne of carbon. The carbon price is multiplied by the tonnes of estimated carbon losses. Nitrogen has been priced similarly as for water resources: a shadow price of 1 EUR kg N-1 plus 0.51 kg N-1 for the commercial price of nitrogen fertiliser and its application to land. The phosphorus shadow price for the Netherlands set at 28 EUR kg P-1 (Davidson, Hof et al. 2002) is the only reference of this kind we were able to find. In order to allow a more conservative estimate for Croatia, we have applied a price of 15 EUR kg P-1. As the “nature” (mode of action) of potassium stands between nitrogen and phosphorus (van der Werff 1992; Znaor 1995), its pollution effect is also assumed to be between the two. Therefore a shadow price that is the average of the price used for nitrogen and potassium is applied to potassium (8.25 EUR kg K-1).
The per hectare yield reduction due to carbon losses for maize and wheat are based on the average figures indicated in Lal (Lal 2004), while for all other crops this loss is assumed to be 0.3 percent of the average yield (lowest losses:yield ratio from Lal’s figures). The yield loss factors are multiplied with the area under individual crops and the average prices for the period 2001-2003 derived from the reports of the Croatian state extension service (HZPSS 2003; Mikšić, Murguić et al. 2004) and the TISUP database (TISUP 2005). A fixed rate of 5 EUR per hectare is assumed to be the average price Croatian farmers pay for the redistribution of eroded soil and for repairing fence and ditch damage caused by eroded soil. This estimate includes both the cost of material and labour.
The soil organic matter loss is calculated following the methodology described by Pretty et al. (Pretty, Brett et al. 2000). Based on the indications on the soil organic matter losses presented in Vidaček et al. (Vidaček, Bogunović et al. 2005) and Martinović (Martinović 1997), we estimate a loss of 2.5 percent of the SOM over the last thirty years. The soil depth considered is 20 cm, with the assumption that a typical dry soil bulk density is 1.25 g per cm3 (Pretty, Brett et al. 2000).
7.4. Results
The results show that the on-site soil erosion damage is 7.87 MEUR. The reduced crop yields due to the total soil carbon losses results in a reduced crop value of 2.49 MEUR (Table 34), while the costs of the soil erosion restoration is 5.39. Loss of soil carbon resulting from mineralization of the SOM is by far the highest of all soil damage costs: 54.14 MEUR (Table 35). The off-site erosion is 13.19 MEUR, with nitrogen losses accounting nearly for a half of it. The total soil damage is 75.21 MER, which represents 16.95 EUR per capita and 69.80 EUR per ha of UAA (Table 36).
Valuation of soil damage
SOM losses from mineralization
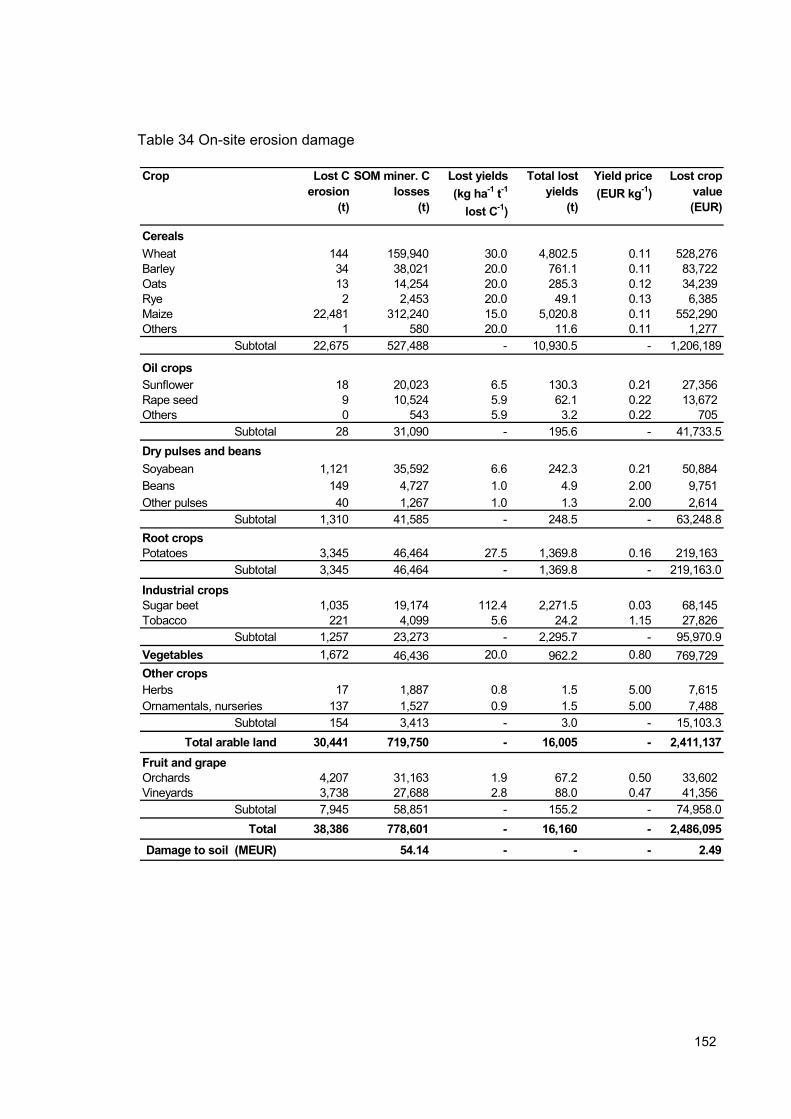
152
Crop Lost C erosion
(t)
SOM miner. C losses
(t)
Lost yields (kg ha-1 t-1
lost C-1)
Total lost yields
(t)
Yield price (EUR kg-1)
Lost crop value (EUR)
CerealsWheat 144 159,940 30.0 4,802.5 0.11 528,276 Barley 34 38,021 20.0 761.1 0.11 83,722 Oats 13 14,254 20.0 285.3 0.12 34,239 Rye 2 2,453 20.0 49.1 0.13 6,385 Maize 22,481 312,240 15.0 5,020.8 0.11 552,290 Others 1 580 20.0 11.6 0.11 1,277
Subtotal 22,675 527,488 - 10,930.5 - 1,206,189
Oil cropsSunflower 18 20,023 6.5 130.3 0.21 27,356 Rape seed 9 10,524 5.9 62.1 0.22 13,672 Others 0 543 5.9 3.2 0.22 705
Subtotal 28 31,090 - 195.6 - 41,733.5Dry pulses and beansSoyabean 1,121 35,592 6.6 242.3 0.21 50,884 Beans 149 4,727 1.0 4.9 2.00 9,751 Other pulses 40 1,267 1.0 1.3 2.00 2,614
Subtotal 1,310 41,585 - 248.5 - 63,248.8Root cropsPotatoes 3,345 46,464 27.5 1,369.8 0.16 219,163
Subtotal 3,345 46,464 - 1,369.8 - 219,163.0
Industrial cropsSugar beet 1,035 19,174 112.4 2,271.5 0.03 68,145 Tobacco 221 4,099 5.6 24.2 1.15 27,826
Subtotal 1,257 23,273 - 2,295.7 - 95,970.9Vegetables 1,672 46,436 20.0 962.2 0.80 769,729 Other cropsHerbs 17 1,887 0.8 1.5 5.00 7,615 Ornamentals, nurseries 137 1,527 0.9 1.5 5.00 7,488
Subtotal 154 3,413 - 3.0 - 15,103.3Total arable land 30,441 719,750 - 16,005 - 2,411,137
Fruit and grapeOrchards 4,207 31,163 1.9 67.2 0.50 33,602 Vineyards 3,738 27,688 2.8 88.0 0.47 41,356
Subtotal 7,945 58,851 - 155.2 - 74,958.0Total 38,386 778,601 - 16,160 - 2,486,095
Damage to soil (MEUR) 54.14 - - - 2.49
Table 34 On-site erosion damage
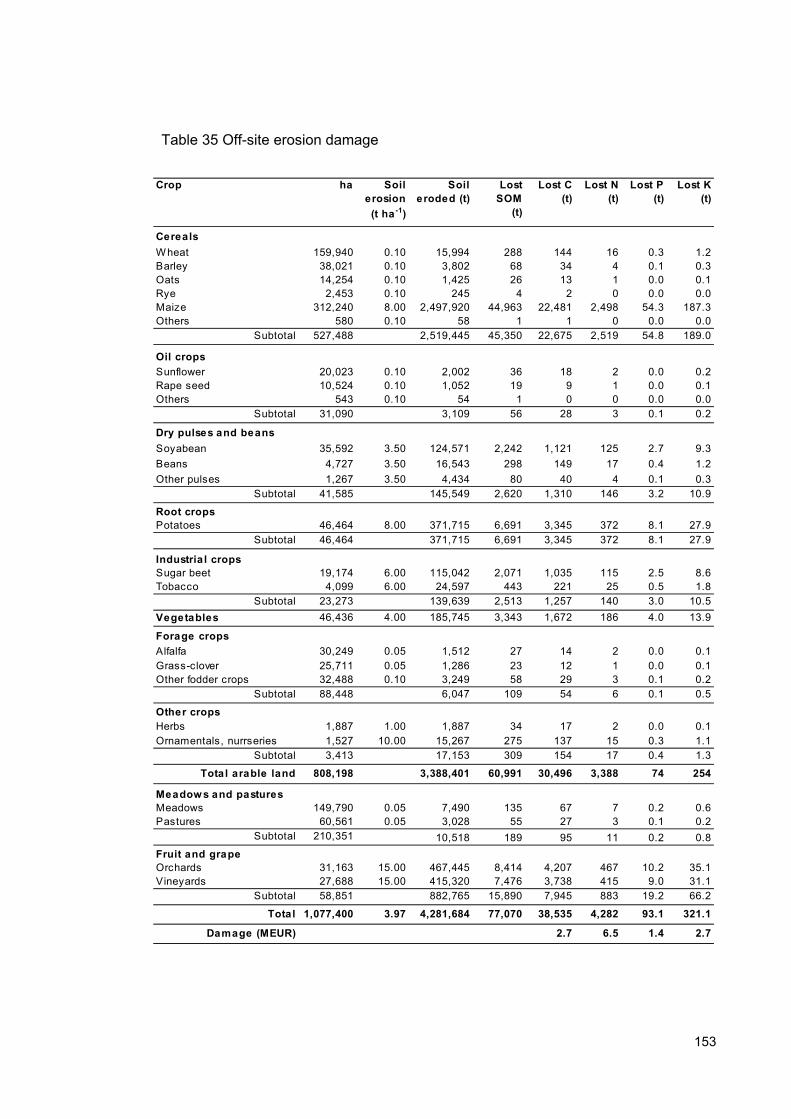
153
Crop ha Soil erosion
(t ha-1)
Soil eroded (t)
Lost SOM
(t)
Lost C (t)
Lost N (t)
Lost P (t)
Lost K (t)
CerealsWheat 159,940 0.10 15,994 288 144 16 0.3 1.2Barley 38,021 0.10 3,802 68 34 4 0.1 0.3Oats 14,254 0.10 1,425 26 13 1 0.0 0.1Rye 2,453 0.10 245 4 2 0 0.0 0.0Maize 312,240 8.00 2,497,920 44,963 22,481 2,498 54.3 187.3Others 580 0.10 58 1 1 0 0.0 0.0
Subtotal 527,488 2,519,445 45,350 22,675 2,519 54.8 189.0
Oil cropsSunflower 20,023 0.10 2,002 36 18 2 0.0 0.2Rape seed 10,524 0.10 1,052 19 9 1 0.0 0.1Others 543 0.10 54 1 0 0 0.0 0.0
Subtotal 31,090 3,109 56 28 3 0.1 0.2
Dry pulses and beansSoyabean 35,592 3.50 124,571 2,242 1,121 125 2.7 9.3Beans 4,727 3.50 16,543 298 149 17 0.4 1.2Other pulses 1,267 3.50 4,434 80 40 4 0.1 0.3
Subtotal 41,585 145,549 2,620 1,310 146 3.2 10.9
Root cropsPotatoes 46,464 8.00 371,715 6,691 3,345 372 8.1 27.9
Subtotal 46,464 371,715 6,691 3,345 372 8.1 27.9
Industria l cropsSugar beet 19,174 6.00 115,042 2,071 1,035 115 2.5 8.6Tobacco 4,099 6.00 24,597 443 221 25 0.5 1.8
Subtotal 23,273 139,639 2,513 1,257 140 3.0 10.5Vegetables 46,436 4.00 185,745 3,343 1,672 186 4.0 13.9
Forage cropsAlfalfa 30,249 0.05 1,512 27 14 2 0.0 0.1Grass-clover 25,711 0.05 1,286 23 12 1 0.0 0.1Other fodder crops 32,488 0.10 3,249 58 29 3 0.1 0.2
Subtotal 88,448 6,047 109 54 6 0.1 0.5
Other cropsHerbs 1,887 1.00 1,887 34 17 2 0.0 0.1Ornamentals, nurrseries 1,527 10.00 15,267 275 137 15 0.3 1.1
Subtotal 3,413 17,153 309 154 17 0.4 1.3
Total arable land 808,198 3,388,401 60,991 30,496 3,388 74 254
Meadow s and pasturesMeadows 149,790 0.05 7,490 135 67 7 0.2 0.6Pastures 60,561 0.05 3,028 55 27 3 0.1 0.2
Subtotal 210,351 10,518 189 95 11 0.2 0.8Fruit and grapeOrchards 31,163 15.00 467,445 8,414 4,207 467 10.2 35.1Vineyards 27,688 15.00 415,320 7,476 3,738 415 9.0 31.1
Subtotal 58,851 882,765 15,890 7,945 883 19.2 66.2
Total 1,077,400 3.97 4,281,684 77,070 38,535 4,282 93.1 321.1
Damage (MEUR) 2.7 6.5 1.4 2.7
Table 35 Off-site erosion damage
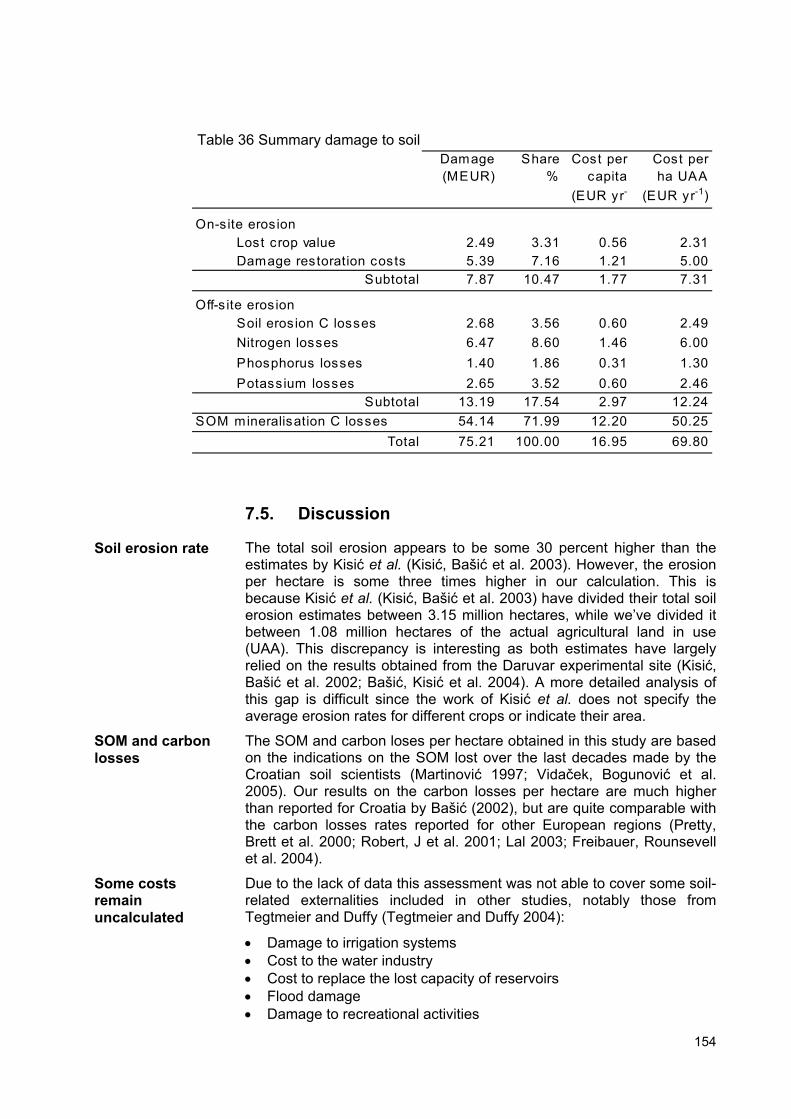
154
Damage (MEUR)
Share %
Cost per capita
(EUR yr-
1
Cost per ha UAA
(EUR yr-1)
On-site erosionLost crop value 2.49 3.31 0.56 2.31Damage restoration costs 5.39 7.16 1.21 5.00
Subtotal 7.87 10.47 1.77 7.31
Off-s ite eros ionSoil erosion C losses 2.68 3.56 0.60 2.49Nitrogen losses 6.47 8.60 1.46 6.00Phosphorus losses 1.40 1.86 0.31 1.30Potassium losses 2.65 3.52 0.60 2.46
Subtotal 13.19 17.54 2.97 12.24SOM mineralisation C losses 54.14 71.99 12.20 50.25
Total 75.21 100.00 16.95 69.80
Table 36 Summary damage to soil
7.5. Discussion
The total soil erosion appears to be some 30 percent higher than the estimates by Kisić et al. (Kisić, Bašić et al. 2003). However, the erosion per hectare is some three times higher in our calculation. This is because Kisić et al. (Kisić, Bašić et al. 2003) have divided their total soil erosion estimates between 3.15 million hectares, while we’ve divided it between 1.08 million hectares of the actual agricultural land in use (UAA). This discrepancy is interesting as both estimates have largely relied on the results obtained from the Daruvar experimental site (Kisić, Bašić et al. 2002; Bašić, Kisić et al. 2004). A more detailed analysis of this gap is difficult since the work of Kisić et al. does not specify the average erosion rates for different crops or indicate their area.
The SOM and carbon loses per hectare obtained in this study are based on the indications on the SOM lost over the last decades made by the Croatian soil scientists (Martinović 1997; Vidaček, Bogunović et al. 2005). Our results on the carbon losses per hectare are much higher than reported for Croatia by Bašić (2002), but are quite comparable with the carbon losses rates reported for other European regions (Pretty, Brett et al. 2000; Robert, J et al. 2001; Lal 2003; Freibauer, Rounsevell et al. 2004).
Due to the lack of data this assessment was not able to cover some soil-related externalities included in other studies, notably those from Tegtmeier and Duffy (Tegtmeier and Duffy 2004):
• Damage to irrigation systems • Cost to the water industry • Cost to replace the lost capacity of reservoirs • Flood damage • Damage to recreational activities
Soil erosion rate
SOM and carbon losses
Some costs remain uncalculated
155
• Cost to navigation: shipping damages, dredging • In-stream impacts: commercial fisheries, preservation values • Off-stream impacts: industrial users, steam power plants • Value of non-carbon substances and biota lost in SOM
The above costs are most likely to be substantial. As some 15 per cent of Croatian territory is prone to flooding and flooding risk is high due to the only partially completed protection systems (MZOPU 2003), this cost category deserves a special attention.
The damage costs arising from the reduced yields (some 100 MEUR) resulting from the neglected maintenance of the hydraulic systems on agricultural land as suggested by Marušić (2003; 2003) are not taken into account. This is because the reduction of crop yields is dependent on a number of agro-ecological factors and management techniques and cannot be attributed solely to the regime of hydrological systems. However, as eroded agricultural soil does diminish the retention capacity of the channels and by enhancing eutrophication accelerates the growth of the riverbed and bank vegetation, this topic deserves further attention.
Comparison with similar studies from other countries is difficult due to the different methodological framework, valuation of carbon and other pollutants, and the cost categories included. The per hectare damage to soil resources calculated here is some 13 percent lower than the damage obtained in the calculations for the EU (Pimentel, Harvey et al. 1995; ECAF 2000). It is also similar to the upper estimate from recent study for the USA (Tegtmeier and Duffy 2004). However our damage cost per hectare is nearly four times higher than the cost reported for the UK by Pretty et al. (2000) - if calculated on the base of the UK arable land. This difference comes because Pretty et al. have, due to the specific conditions in the UK, calculated soil carbon losses resulting from mineralization on only 20 percent of UK arable land. However, as Croatian estimates of the SOM losses relate primarily to the arable land under intensive agricultural use (Martinović 1997; Vidaček, Bogunović et al. 2005), we have calculated carbon losses only for the utilised agricultural area under vineyards, orchards and arable land. The rest of the UAA- arable land under forage crops and permanent grassland is assumed to be carbon neutral or positive. The inclusion of the area under these crops would due to the carbon sequestration effect to a degree counterbalance the carbon losses presented here. It would result in a total carbon loss of some 510.000 t C, instead of the 821.665 t C presented here. However, as this effect is considered to be a positive externality, it is outside the research boundaries of this study, and as such not taken into account.
As with the assessment of the damage to air, carbon pricing remains a key factor in valuation of the damage to soil. The problems regarding a “fair” price for carbon have been discussed in the chapter on the damage to air.
The shadow prices applied to phosphorus and especially potassium are subject to further inspection. The phosphorus price has been derived from a single reference (although the value used has been reduced by 50 percent), while the potassium shadow price remains questionable,
Comparison with studies for other countries
Question of pricing
156
because it is assumed to be in between those for nitrogen and phosphorus.
157
8. PUBLIC INVESTMENTS
8.1. General
Agriculture and FULS benefit from certain public investments and at the same time are the causes of some other ones. The best known public investments in the agricultural sector are the various forms of agricultural subsidies. Economically speaking, agricultural subsidies are not externalities, but as payments from taxpayers to farmers are an integral part of the full cost of agriculture (Pretty, Ball et al. 2005). Besides these regular agricultural subsidies, there are a number of hidden public investments providing farming and FULS with an extra income/profit. These are brought about as the result of the agricultural and economic policies of a country, aimed at providing a better income of those directly or indirectly involved in farming, with the final objective to produce cheap food. In spite of criticism regarding the high cost of agricultural policies (subsidies), taxpayers’ money has been returned back to the taxpayers (consumers) in many countries. Agricultural prices of the EU-15 in real terms have fallen fourfold since 1950 and this economic benefit has been passed on to consumers (Boussard 2003). However, this enormous economic success has been made at the expense of the environment/nature, which farmers have not returned to the taxpayers in the same or a better state.
Croatian agricultural and economic policies also provide direct and hidden subsidies to farming and FULS and this chapter presents an attempt to quantify the Croatian public investments associated with farming and FULS.
8.2. Investment to public institutions providing service to agricultural sector
As already mentioned in the chapter on value added, a number of administrative, research, education and advisory organisations provide services to the Croatian agricultural sector. These organisations are financed by public money, and their average annual expenditure in the period 2001-2003 was 50.77 MEUR.
8.3. Farming subsidies
Subsidies run by MPŠ included direct payments (production subsidies) and various other supports to agriculture, rural development, marketing, etc. The exact total annual amount of these subsidies is difficult to estimate, since actual annual expenditures differed from the planned budgets and because there were some retroactive payments for the claims from the previous years. Therefore official reports give slightly different figures on these (MF 2003; MPŠ 2003; MPŠ 2003; VRH 2003; AZZTN 2004; MPŠVG 2004). The agricultural subsidies issued by the MPŠ in 2002 and 2003 were assessed from the Ministry of Finance data on the state budget (MF 2002; MF 2003), while for 2001 we relied on the figures provided by MPŠ (2003). Only agriculture-related subsidies, aids and programmes were taken into account, leaving aside those directed
Public investments enable cheaper food
Regular MPŠ subsidies
158
Cost (MEUR)
Share %
Cost per capita (EUR
yr-1)
Cost per ha UAA
(EUR yr-1)
Ministry of agriculture 245.14 90.15 55.25 227.52"Blue diesel" 14.84 5.46 3.34 13.77Counties 8.83 3.25 1.99 8.20Cities and municipalities 3.10 1.14 0.70 2.88
Subtotal 271.91 100.00 61.28 252.37
to forestry, fisheries, hunting and other non-agricultural activities. The average annual agriculture-related subsidies in the period 2001-2003 run by the MPŠ were 245.15 MEUR.
Croatian farmers have been entitled to subsidised fuel, so called “blue” diesel. This fuel is exempted from road tax and special fuel tax (N.N. 2002) worth 0.33 EUR per litre. A per hectare quota of 80 litres has been set for cereals, oil crops and sugar beet, while tobacco producers are entitled to only 40 litres per hectare. Multiplication of the area under these crops as reported by MPŠ (2003; 2003; 2004) with the prescribed per hectare fuel quota results in an average annual quantity of 45.6 ML in the period 2001-2003. If each litre was subsidised with 0.33 EUR (N.N. 2002), the total average annual subsidy was 14.84 MEUR (Table 37). This subsidy was paid by the Ministry of Finance and this support scheme was not deducted from the MPŠ budget.
Several counties, cities and municipalities run their own support programmes for agriculture. These also include subsidies and various loans and/or co-financing for capital investments. Farmers from these regions are entitled to such subsidies in addition to those issued by the Ministry of Agriculture. This practice seems to be against WTO rules, but is still ongoing. The biggest single regional agricultural support programme is run by the city of Zagreb. Based on the figures for 2003 (Grad Zagreb), and applying a discounted rate of 7 per cent for the other two years, we have assessed the average annual support given in the period 2001-2003 at some 1.6 MEUR. Similarly, the agricultural support scheme of Zagrebačka county (Glasnik Zagrebačke županije 2004) is estimated at 0.95 MEUR. Average annual subsidies in the period 2001-2003 for all other counties are estimated at 0.13 MEUR per county, resulting in an amount of 2.34 MEUR. Additionally, counties seem to have invested annually on average some 3.93 MEUR in various loans and/or co-financing for capital investments (MPŠ 2003). In total, counties on average spent 8.83 MEUR per year on all their support programmes to agriculture (Table 37).
We have assumed that the average annual agricultural expenditure in the period 2001-2003 per city was 26.774 EUR and 40.016 EUR per municipality, resulting in the total average annual subsidy of 3.10 MEUR (Table 37).
Table 37. National, regional and local farming subsidies
Agricultural diesel
County subsidies
Local subsidies
159
8.4. Subsidies to agri-industrial complexes
In December 2000 the government decided to write off the debts of eight agri-industrial complexes: PIK Vrbovec, Vupik Vukovar, Đakovština Đakovo, PPK Kutjevo, PP Orahovica, PIK Jasinje Slavonski Brod, PIK Belje Darda i IPK Osijek (VRH 2000). These organisations were the remains of the former big state co-operatives and the government was their major shareholder. Their cumulative debt by the end of 2000 was 508 MEUR (VRH 2000; Šimić 2001) Apart from primary agricultural production they are engaged in food processing: they own a substantial portion of the food-processing capacities of the country and employ thousands of people. It is against this background that the government decided to assist in their financial “revitalisation”.
However, the government intervention in their economic «recovery» hasn’t been transparent and the exact amount of public money invested in this project remains a puzzle. The Ministry of Finance does not have a sound overview on the magnitude of this operation since its expenditures seem to be not well recorded and are dispersed among various cost categories of the state budget (Karačić 2005). A recent report from the State Auditing Agency (DUR 2005) - the highest state authority for financial auditing - also points at a number of irregularities and inaccurate book-keeping regarding financial arrangements between the State and agri-industrial companies.
Through various financial arrangements, the government has written off substantial parts, and most likely all the debts of these companies. According to Lončar (Andrijanić 2003; Lončar 2004), an independent member of Parliament and vice-chairman of the parliamentary agricultural committee, in the period 2001-2003, the Croatian government spent some 535 MEUR on various financial “revitalisation” schemes of the big agri-industrial companies. The Croatian Legal Party has the same estimate (HSP 2003). However, according to the deputy prime minister at the time, Linić, in 2002 the government spent only 268 MEUR for this expenditure (Bankamagazine 2002). On the other hand, 535 million EUR was reported to have been invested in PIK Vrbovec alone (Pulić 2002). As it is quite difficult to obtain reliable figures on the magnitude of this support, we assume it to be equal to 508 MEUR, the amount of the debt reported by the end of 2000 (VRH 2000; Šimić 2001). As these companies practice both primary agricultural production and processing, we estimate that only some 20 percent of the support relates to the primary agricultural production, resulting in a support of 101.61 MEUR. Assuming that this amount was equally distributed in the period 2001-2003, the average annual cost was 33.87 MEUR.
The need for revitalisation
Non-transparent operation
Amount unknown
160
8.5. Public investments in water and road conveyance systems
According to the data from the Croatian Roads, the public company responsible for road maintenance (Hrvatske ceste 2005), as well as those from the Croatian Highways (Hrvatske autoceste 2005), the public company maintaining highways, the cleaning of the road conveyance system (channels, ditches, etc.) from eroded soil represents some 3.5-4.5 per cent of the regular road maintenance costs. From the figures provided by the same sources, we calculated that the average annual cost for the removal of eroded soil and damage reparation in the period 2001-2003 was 2.5 MEUR. Assuming that 50 percent of the eroded deposits originate from agriculture, the cost is 1.25 MEUR. However, according to the national roads maintenance programme (VRH 2001; VRH 2003), the budget made available for road maintenance in the period 2001-2004 is far below the minimum requirements. Assuming that 4 per cent of the costs for regular road maintenance relates to eroded soil, from the figures presented in this programme it can be calculated that some 7 MEUR per year is needed for this operation, of which 3.5 MEUR goes to agriculture. Since the actual expenditure of 1.25 EUR was sufficient to remove only a portion of eroded soil, we took the figure of 3.5 MEUR as the external cost, because the remaining eroded soil deposits still cause damage. Even if soon removed, it is a cost that was caused by the agricultural practices of the period 2001-2003. From the methodological point of view, the removal of eroded soil should be included in the cost category damage to soil. However, as this is at the same time a public investment, we have included it in this calculation instead.
According to Croatian Waters (Biondić 2005) the average annual cost spent on bank restoration and removal of eroded soil from the water conveyance systems classified as state water courses in the period 2001-2004 was 9.10 MEUR. An additional amount of 14.20 MEUR was spent for the same purpose for local watercourses. However, as this cost was paid by farmers and not from public money, we do not take it into account. Assuming that 50 percent of the indicated cost for the state water conveyance systems relates to removal of eroded soil and that 50 percent of this soil derives from agriculture, the average annual cost is 2.28 MEUR. However, similarly as for roads, this cost represents only a portion of what was required to remove all eroded soil. Biondić et al. (2003) indicate that some 43.65 MEUR is needed for the regular maintenance of the state watercourses. Assuming that 50 percent of this is required to remove eroded soil and that 50 percent of the soil derives from agriculture the cost needed was 10.19 MEUR - an amount that we reckon to be the external cost.
Roads
Water
161
8.6. Transport subsidies
In 2002 Croatian ports received a subsidy of 11.25 MEUR (AZZTN 2004). From the transport statistics (DZS 2004; DZS 2005) it appears that that agricultural inputs (genetic material, feeds, raw phosphates, fertilisers, pesticides and veterinary medicine) and petroleum products consumed by farming and FULS in the period 2001-2003 accounted for 15 percent of all goods handled by the Croatian ports. Therefore we assign 15 percent of the above-mentioned subsidy (1.57 MEUR) as external costs. In the absence of data for other two years, we take this amount as the average annual subsidy for the period 2001-2003.
From the statistical data provided by Croatian railways (HŽ 2005), it appears that agricultural inputs and petroleum products consumed by farming and FULS account for 14.6 percent of all t-km carried by the Croatian Railways in the period 2001-2003. In the same period, through regular subsidies, written-off loans and subsidies for capital investments for the freight transport alone, Croatian railways received an amount of 373.60 MEUR, or 124.54 MEUR on average per year. Assuming that farming and FULS account for 14.6 percent of this subsidy, we set the average annual cost at 18.16 MEUR.
8.7. Subsidy to fertiliser production
Until 2000 the fertiliser price in Croatia was prescribed by the government and the sole Croatian fertiliser manufacturer Petrokemija was prohibited from establishing its own, market driven prices (Mesarić 2005). While the fertiliser price was artificially kept low, gas prices substantially increased and Petrokemija ended up in debt. In 2001 the government-owned gas company INA wrote off 50 percent of Petrokemija’s gas debt for 1999 (Petrokemija 2003). The written-off amount was 41.34 MEUR, made of 25.01 MEUR debt and 16.33 MEUR accompanying interest (Table 38), which according to the Croatian law of that time, had to be calculated with an annual interest rate of 18 percent. It was agreed that the remaining 50 percent of the debt was to be paid over the next five years with the annual interest rate of 6 percent. However, Petrokemija so far has not repaid anything and has instead filed a request to the government for total debt forgiveness (Mesarić 2005). The government decision is still pending, but INA hasn’t taken any legal or political action against this request. Since this debt has not been repaid and because it very unlikely that it will ever be paid, we take it as a public investment. However, one could argue that the gas debt from 1999 should not be the subject of a study assessing impacts of 2001-2003 agriculture and thus should be excluded from the calculation. However, as this cost was imposed on Croatian society in 2001 and was decisive for Petrokemija’s future existence, enabling it to play a major role in supplying Croatian agriculture in the period 2001-2003 with (cheaper) fertilisers, we think it is fair to include this hidden subsidy in the assessment.
If the remaining 50 percent of the debt is updated to its 2001-2003 value applying the interest rates for late payments prescribed by the Croatian regulations (N.N. 1996; N.N. 2002), the average annual cost amounts
Port subsidies
Railway subsidies
Written-off debts
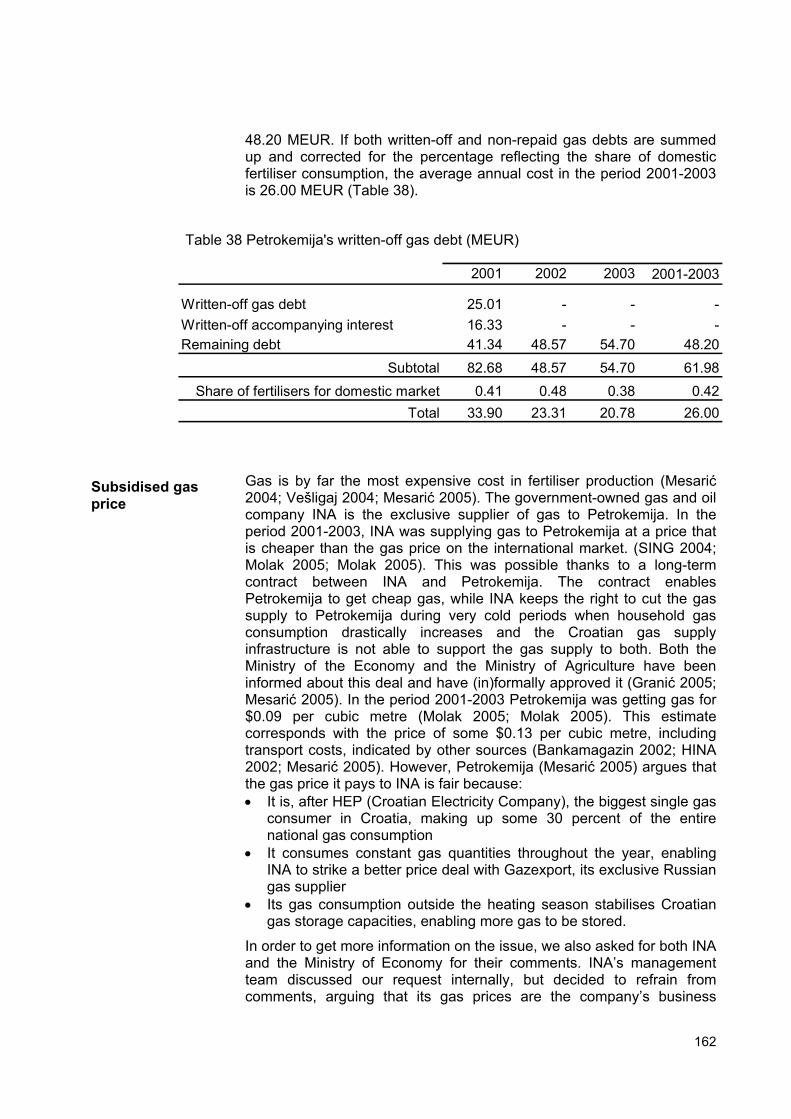
162
2001-2003
Written-off gas debt 25.01 - - -Written-off accompanying interest 16.33 - - -Remaining debt 41.34 48.57 54.70 48.20
Subtotal 82.68 48.57 54.70 61.98Share of fertilisers for domestic market 0.41 0.48 0.38 0.42
Total 33.90 23.31 20.78 26.00
2001 2002 2003
48.20 MEUR. If both written-off and non-repaid gas debts are summed up and corrected for the percentage reflecting the share of domestic fertiliser consumption, the average annual cost in the period 2001-2003 is 26.00 MEUR (Table 38).
Table 38 Petrokemija's written-off gas debt (MEUR)
Gas is by far the most expensive cost in fertiliser production (Mesarić 2004; Vešligaj 2004; Mesarić 2005). The government-owned gas and oil company INA is the exclusive supplier of gas to Petrokemija. In the period 2001-2003, INA was supplying gas to Petrokemija at a price that is cheaper than the gas price on the international market. (SING 2004; Molak 2005; Molak 2005). This was possible thanks to a long-term contract between INA and Petrokemija. The contract enables Petrokemija to get cheap gas, while INA keeps the right to cut the gas supply to Petrokemija during very cold periods when household gas consumption drastically increases and the Croatian gas supply infrastructure is not able to support the gas supply to both. Both the Ministry of the Economy and the Ministry of Agriculture have been informed about this deal and have (in)formally approved it (Granić 2005; Mesarić 2005). In the period 2001-2003 Petrokemija was getting gas for $0.09 per cubic metre (Molak 2005; Molak 2005). This estimate corresponds with the price of some $0.13 per cubic metre, including transport costs, indicated by other sources (Bankamagazin 2002; HINA 2002; Mesarić 2005). However, Petrokemija (Mesarić 2005) argues that the gas price it pays to INA is fair because: • It is, after HEP (Croatian Electricity Company), the biggest single gas
consumer in Croatia, making up some 30 percent of the entire national gas consumption
• It consumes constant gas quantities throughout the year, enabling INA to strike a better price deal with Gazexport, its exclusive Russian gas supplier
• Its gas consumption outside the heating season stabilises Croatian gas storage capacities, enabling more gas to be stored.
In order to get more information on the issue, we also asked for both INA and the Ministry of Economy for their comments. INA’s management team discussed our request internally, but decided to refrain from comments, arguing that its gas prices are the company’s business
Subsidised gas price
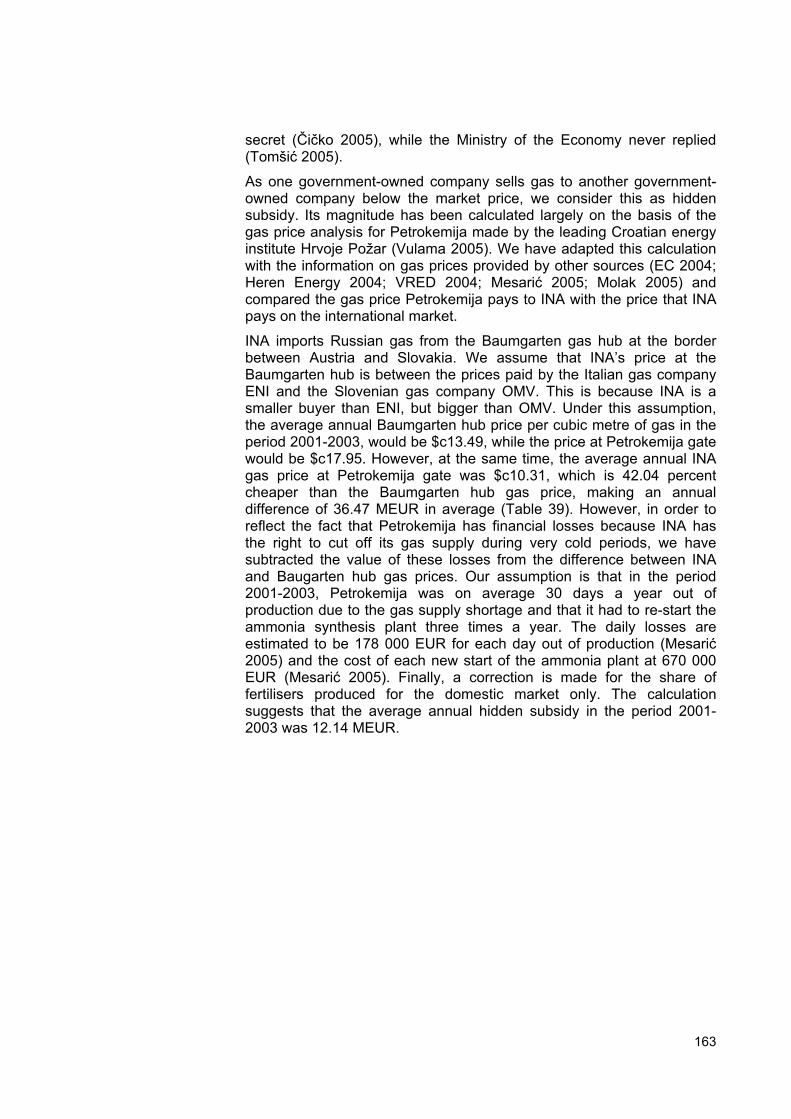
163
secret (Čičko 2005), while the Ministry of the Economy never replied (Tomšić 2005).
As one government-owned company sells gas to another government-owned company below the market price, we consider this as hidden subsidy. Its magnitude has been calculated largely on the basis of the gas price analysis for Petrokemija made by the leading Croatian energy institute Hrvoje Požar (Vulama 2005). We have adapted this calculation with the information on gas prices provided by other sources (EC 2004; Heren Energy 2004; VRED 2004; Mesarić 2005; Molak 2005) and compared the gas price Petrokemija pays to INA with the price that INA pays on the international market.
INA imports Russian gas from the Baumgarten gas hub at the border between Austria and Slovakia. We assume that INA’s price at the Baumgarten hub is between the prices paid by the Italian gas company ENI and the Slovenian gas company OMV. This is because INA is a smaller buyer than ENI, but bigger than OMV. Under this assumption, the average annual Baumgarten hub price per cubic metre of gas in the period 2001-2003, would be $c13.49, while the price at Petrokemija gate would be $c17.95. However, at the same time, the average annual INA gas price at Petrokemija gate was $c10.31, which is 42.04 percent cheaper than the Baumgarten hub gas price, making an annual difference of 36.47 MEUR in average (Table 39). However, in order to reflect the fact that Petrokemija has financial losses because INA has the right to cut off its gas supply during very cold periods, we have subtracted the value of these losses from the difference between INA and Baugarten hub gas prices. Our assumption is that in the period 2001-2003, Petrokemija was on average 30 days a year out of production due to the gas supply shortage and that it had to re-start the ammonia synthesis plant three times a year. The daily losses are estimated to be 178 000 EUR for each day out of production (Mesarić 2005) and the cost of each new start of the ammonia plant at 670 000 EUR (Mesarić 2005). Finally, a correction is made for the share of fertilisers produced for the domestic market only. The calculation suggests that the average annual hidden subsidy in the period 2001-2003 was 12.14 MEUR.
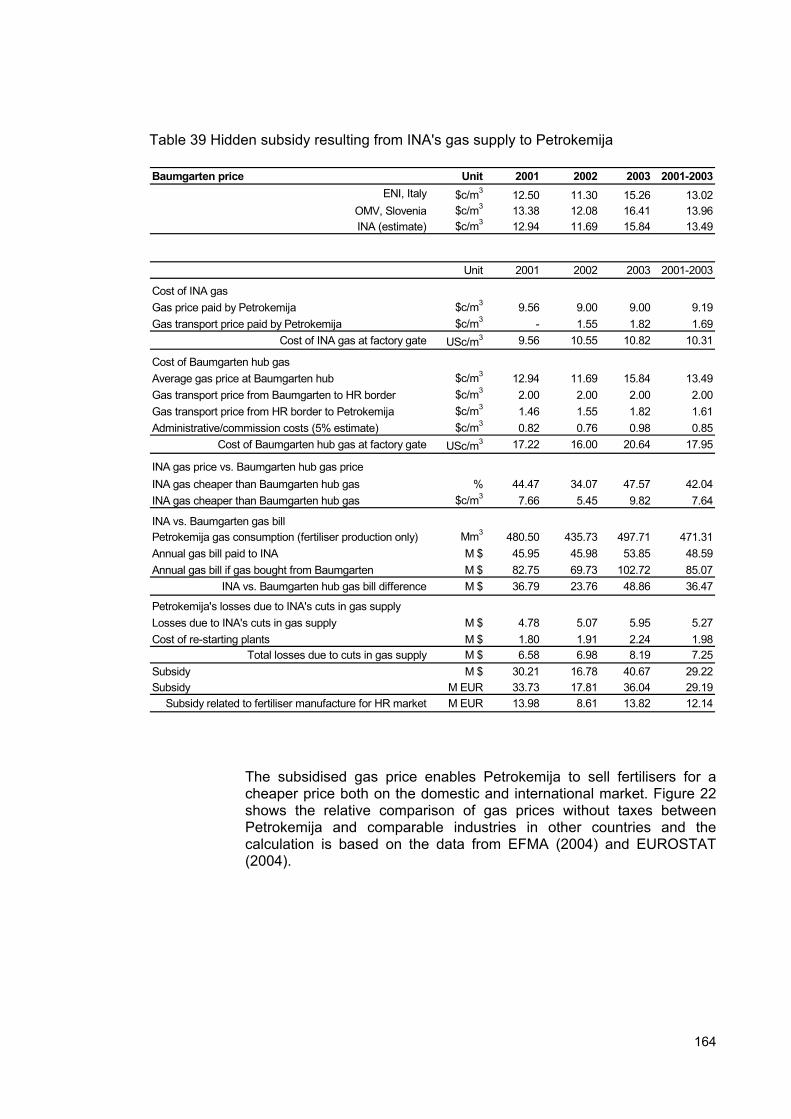
164
Baumgarten price Unit 2001 2002 2003 2001-2003ENI, Italy $c/m3 12.50 11.30 15.26 13.02
OMV, Slovenia $c/m3 13.38 12.08 16.41 13.96INA (estimate) $c/m3 12.94 11.69 15.84 13.49
Unit 2001 2002 2003 2001-2003
Cost of INA gasGas price paid by Petrokemija $c/m3 9.56 9.00 9.00 9.19Gas transport price paid by Petrokemija $c/m3 - 1.55 1.82 1.69
Cost of INA gas at factory gate USc/m3 9.56 10.55 10.82 10.31
Cost of Baumgarten hub gasAverage gas price at Baumgarten hub $c/m3 12.94 11.69 15.84 13.49Gas transport price from Baumgarten to HR border $c/m3 2.00 2.00 2.00 2.00Gas transport price from HR border to Petrokemija $c/m3 1.46 1.55 1.82 1.61Administrative/commission costs (5% estimate) $c/m3 0.82 0.76 0.98 0.85
Cost of Baumgarten hub gas at factory gate USc/m3 17.22 16.00 20.64 17.95
INA gas price vs. Baumgarten hub gas priceINA gas cheaper than Baumgarten hub gas % 44.47 34.07 47.57 42.04INA gas cheaper than Baumgarten hub gas $c/m3 7.66 5.45 9.82 7.64
INA vs. Baumgarten gas billPetrokemija gas consumption (fertiliser production only) Mm3 480.50 435.73 497.71 471.31Annual gas bill paid to INA M $ 45.95 45.98 53.85 48.59Annual gas bill if gas bought from Baumgarten M $ 82.75 69.73 102.72 85.07
INA vs. Baumgarten hub gas bill difference M $ 36.79 23.76 48.86 36.47
Petrokemija's losses due to INA's cuts in gas supplyLosses due to INA's cuts in gas supply M $ 4.78 5.07 5.95 5.27Cost of re-starting plants M $ 1.80 1.91 2.24 1.98
Total losses due to cuts in gas supply M $ 6.58 6.98 8.19 7.25Subsidy M $ 30.21 16.78 40.67 29.22Subsidy M EUR 33.73 17.81 36.04 29.19
Subsidy related to fertiliser manufacture for HR market M EUR 13.98 8.61 13.82 12.14
Table 39 Hidden subsidy resulting from INA's gas supply to Petrokemija
The subsidised gas price enables Petrokemija to sell fertilisers for a cheaper price both on the domestic and international market. Figure 22 shows the relative comparison of gas prices without taxes between Petrokemija and comparable industries in other countries and the calculation is based on the data from EFMA (2004) and EUROSTAT (2004).
165
Figure 22 Relative comparison of gas prices between Petrokemija and comparable industries in selected countries as per July 1st, 2004.
8.7.1 Allergy-related public investments A vast area of Croatian agricultural land remains uncultivated. This situation enhances the development of some plant species causing allergy to humans. Seven of the highly allergenic plant species (Alnus sp., Ambrosia sp., Betula sp., Carpinus sp., Poaceae, Quercus sp. and Taxus/Juniperus) producing the greatest amount of pollen in Croatia (Peternel, Culig et al. 2003; Peternel, Culig et al. 2005) are typical for the vegetation of uncultivated agricultural land. Public investments related to allergy-causing plant species include: • Cost of medical drugs (in Croatia most drugs are covered by the
obligatory medical insurance) • Cost of medical treatments (also largely covered by the obligatory
medical insurance) • Monitoring, research and public awareness programmes • Local and regional combat programmes against allergenic plant
species • Reduced working activity of the population The public investments associated with allergy in Croatia are still not known, although there is an on-going project recording the quantity of medicine used by allergic patients (Peternel 2005).
Besides the public, allergies lead to substantial private costs: expenditures for drugs and medical treatments not covered by the
Allergenic plants on uncultivated land
Type of public costs
-
20
40
60
80
100
120
140
160
180
200
220
Slovakianind.
Hungarianind.
Czech ind. Polish ind. Spanish ind.German ind. Finish ind. EU-25fertilisermanuf.
Bulgarianind.
Latvian ind. Romanianind.
UK ind. Estonianind.
Indianfertilisermanuf.
Russianfertilisermanuf.
Petro
kem
ija =
100
166
obligatory medical insurance and in some cases a forced stay in the pollen-free coastal region.
Reliable statistics on the number of people suffering from pollen allergies do not exist (Stevanović 2005), but expert opinions indicate that some 10-15 percent of the Croatian adult population suffers from pollen allergies, while the percentage of the affected children and youth is most likely to be higher (Peternel 2005).
Assuming that 0.5 million people (11.3 percent of the population) suffer from pollen allergies and that each person on average gets drugs worth 10 EUR and medical service (examination, laboratory testing, advice, etc.) worth another 10 EUR per person, it results in a cost of 10 MEUR. The average GDP per capita in the period 2001-2003 was 5,400 EUR. Allergic people have to adjust their outdoor activities to avoid contact with the allergen (Peternel, Culig et al. 2005), which reduces their working abilities. The pollen allergy season in Croatia starts in March and ends in October (Peternel, Culig et al. 2005). If the average duration of pollen allergies is 45 days (MZSS 2005), and working ability during these days reduced by only 10 percent, the GDP loss is 66.58 EUR per person, or 33.29 MEUR for the whole country. The public health service in Croatia has been providing information to individuals allergic to pollen (Peternel, Culig et al. 2005) and there is some research ongoing in this field. We assess the provision of pollen-related information and research costs at an additional 3 MEUR. Besides, some regional and local authorities also run programmes to combat plant species causing allergy, of which those targeted at ragweed (Ambrosia Artemisiifolia) are most massive (Gorjanski 2005; Stevanović 2005). Ragweed is particularly widespread in the Croatian Pannonian plain and has been rapidly expanding. In the Hungarian part of the Pannonian plain, the number of the population with asthma has increased four-fold in ten years and this development has been associated with the spread of ragweed (Járai-Komlódi 1998). Experiences from the Osijek region indicate that total land abandonment suppresses ragweed, while occasionally cultivated, semi-abandoned agricultural land drastically encourages its distribution (Gorjanski 2005). A calculation from the Association for Combating Allergic Diseases in Osijek (UBPABO 2001) indicates that a cost of 1.1 EUR per inhabitant is required for successfully combatting ragweed, in addition to some voluntary work of the local communities (NGOs, citizens, schools, etc.). We take half of their estimate for the combat of ragweed, assuming that this lower per capita investment would be more representative for the country average.
Percentage of the affected population
Costs estimate
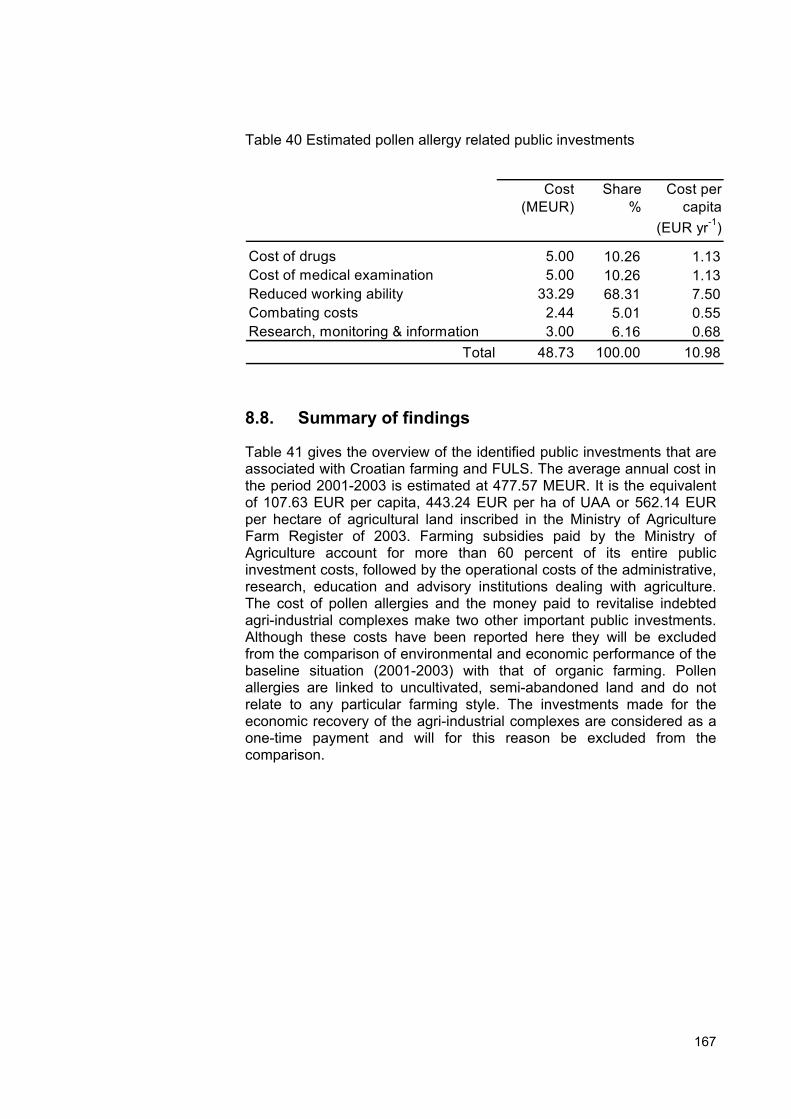
167
Cost (MEUR)
Share %
Cost per capita
(EUR yr-1)
Cost of drugs 5.00 10.26 1.13Cost of medical examination 5.00 10.26 1.13Reduced working ability 33.29 68.31 7.50Combating costs 2.44 5.01 0.55Research, monitoring & information 3.00 6.16 0.68
Total 48.73 100.00 10.98
Table 40 Estimated pollen allergy related public investments
8.8. Summary of findings
Table 41 gives the overview of the identified public investments that are associated with Croatian farming and FULS. The average annual cost in the period 2001-2003 is estimated at 477.57 MEUR. It is the equivalent of 107.63 EUR per capita, 443.24 EUR per ha of UAA or 562.14 EUR per hectare of agricultural land inscribed in the Ministry of Agriculture Farm Register of 2003. Farming subsidies paid by the Ministry of Agriculture account for more than 60 percent of its entire public investment costs, followed by the operational costs of the administrative, research, education and advisory institutions dealing with agriculture. The cost of pollen allergies and the money paid to revitalise indebted agri-industrial complexes make two other important public investments. Although these costs have been reported here they will be excluded from the comparison of environmental and economic performance of the baseline situation (2001-2003) with that of organic farming. Pollen allergies are linked to uncultivated, semi-abandoned land and do not relate to any particular farming style. The investments made for the economic recovery of the agri-industrial complexes are considered as a one-time payment and will for this reason be excluded from the comparison.
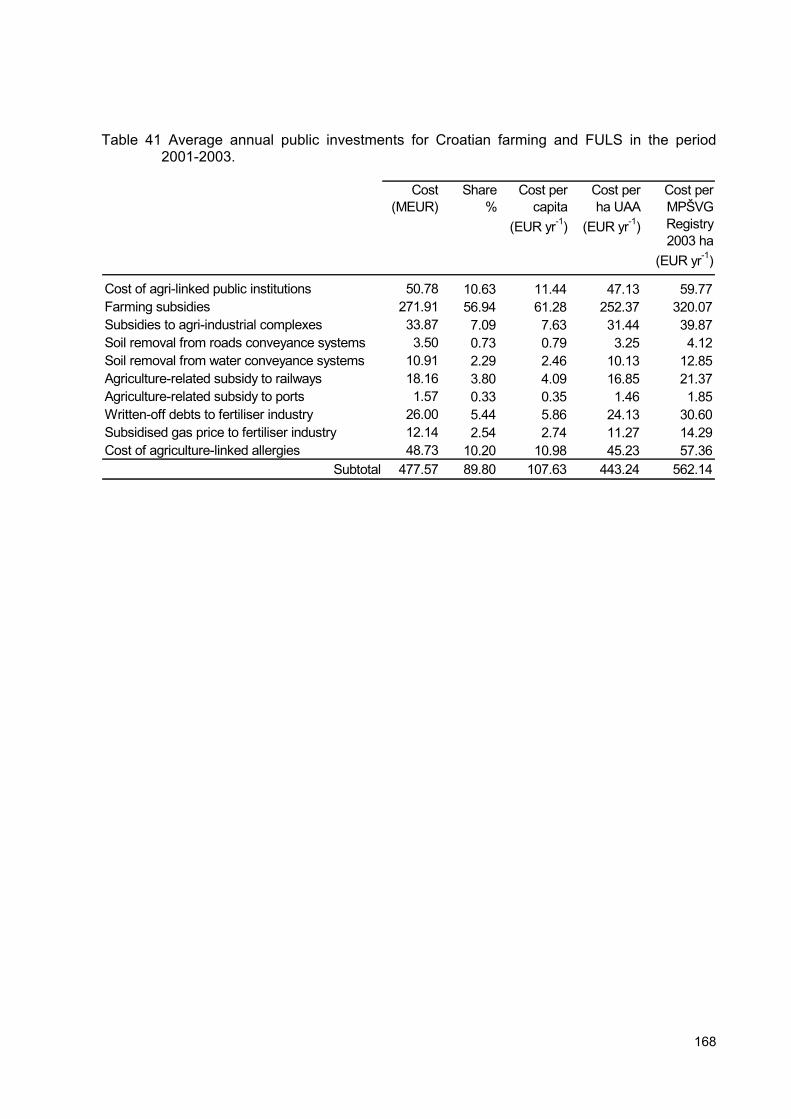
168
Cost (MEUR)
Share %
Cost per capita
(EUR yr-1)
Cost per ha UAA
(EUR yr-1)
Cost per MPŠVG Registry 2003 ha
(EUR yr-1)
Cost of agri-linked public institutions 50.78 10.63 11.44 47.13 59.77Farming subsidies 271.91 56.94 61.28 252.37 320.07Subsidies to agri-industrial complexes 33.87 7.09 7.63 31.44 39.87Soil removal from roads conveyance systems 3.50 0.73 0.79 3.25 4.12Soil removal from water conveyance systems 10.91 2.29 2.46 10.13 12.85Agriculture-related subsidy to railways 18.16 3.80 4.09 16.85 21.37Agriculture-related subsidy to ports 1.57 0.33 0.35 1.46 1.85Written-off debts to fertiliser industry 26.00 5.44 5.86 24.13 30.60Subsidised gas price to fertiliser industry 12.14 2.54 2.74 11.27 14.29Cost of agriculture-linked allergies 48.73 10.20 10.98 45.23 57.36
Subtotal 477.57 89.80 107.63 443.24 562.14
Table 41 Average annual public investments for Croatian farming and FULS in the period 2001-2003.
169
9. BASELINE SCENARIO: SUMMARY
In the period 2001-2003 Croatian farming and FULS created the average annual value added of 636.72 MEUR. However, this economic chain also generated substantial external costs: 1,107.91 MEUR ( Table 42). The external costs are made up of the environmental damage caused to air, water and soil and public investments. The net (real) value added is (external costs subtracted from value added) is -471.18 MEUR, suggesting that in the period 2001-2003, Croatian farming and FULS even created a negative value to society.
Public investments are the highest single external cost, accounting for 43.11 percent of the total external costs. With a share of 37.37 percent, damage to air comes second and is followed by damage to water and (12.76 percent) and damage to soil (6.79 percent). Of all environmental costs, damage to air is the most significant as it accounts for 65.66 percent of the total environmental damage to air, water and soil. Damage to water makes up 22.42 percent and damage to soil 11.93 percent of the environmental costs.
Among all economic activities considered, farming generates the most external costs. This is because farming consumes 77.25 percent of all public investments and 76.83 percent of all damage to air, water and soil. It accounts for 83.81 percent of all external costs. With a share of 7.64 percent, fertiliser manufacture is the second largest single contributor to external costs.
Externalities higher than value-added
Costly farming sector
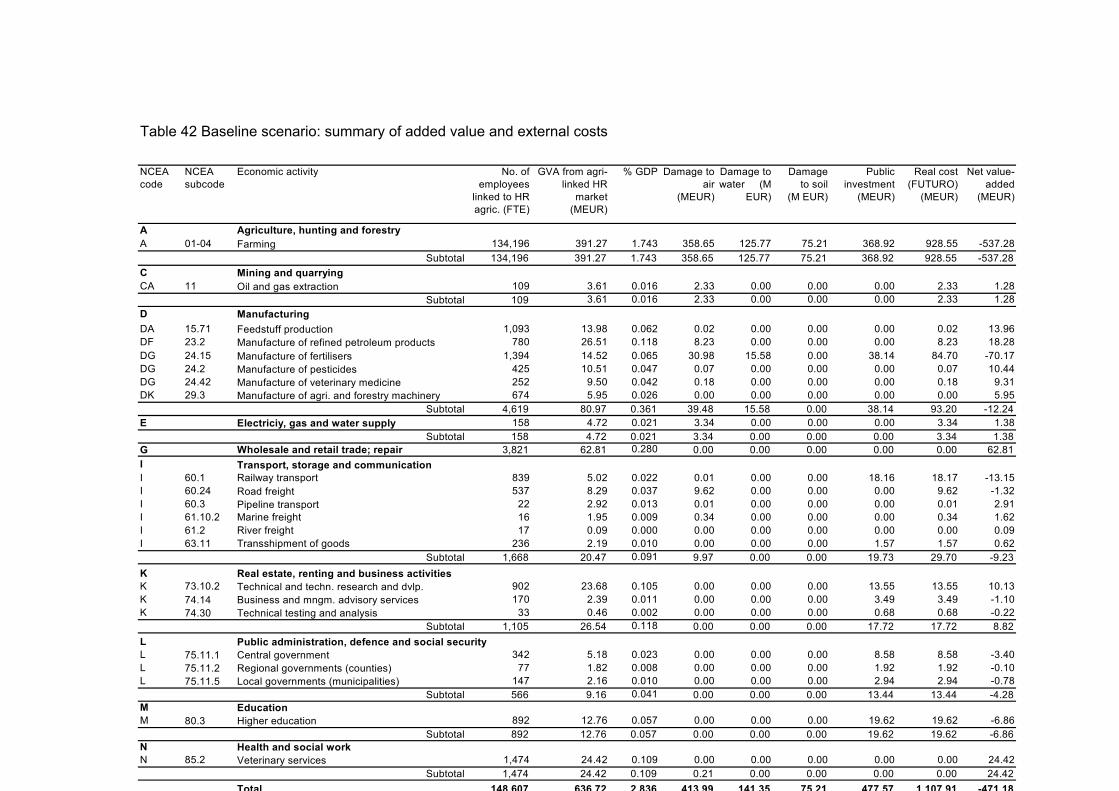
NCEA code
NCEA subcode
Economic activity No. of employees
linked to HR agric. (FTE)
GVA from agri-linked HR
market (MEUR)
% GDP Damage to air
(MEUR)
Damage to water (M
EUR)
Damage to soil
(M EUR)
Public investment
(MEUR)
Real cost (FUTURO)
(MEUR)
Net value-added
(MEUR)
A Agriculture, hunting and forestryA 01-04 Farming 134,196 391.27 1.743 358.65 125.77 75.21 368.92 928.55 -537.28
Subtotal 134,196 391.27 1.743 358.65 125.77 75.21 368.92 928.55 -537.28C Mining and quarryingCA 11 Oil and gas extraction 109 3.61 0.016 2.33 0.00 0.00 0.00 2.33 1.28
Subtotal 109 3.61 0.016 2.33 0.00 0.00 0.00 2.33 1.28D ManufacturingDA 15.71 Feedstuff production 1,093 13.98 0.062 0.02 0.00 0.00 0.00 0.02 13.96DF 23.2 Manufacture of refined petroleum products 780 26.51 0.118 8.23 0.00 0.00 0.00 8.23 18.28DG 24.15 Manufacture of fertilisers 1,394 14.52 0.065 30.98 15.58 0.00 38.14 84.70 -70.17DG 24.2 Manufacture of pesticides 425 10.51 0.047 0.07 0.00 0.00 0.00 0.07 10.44DG 24.42 Manufacture of veterinary medicine 252 9.50 0.042 0.18 0.00 0.00 0.00 0.18 9.31DK 29.3 Manufacture of agri. and forestry machinery 674 5.95 0.026 0.00 0.00 0.00 0.00 0.00 5.95
Subtotal 4,619 80.97 0.361 39.48 15.58 0.00 38.14 93.20 -12.24E Electriciy, gas and water supply 158 4.72 0.021 3.34 0.00 0.00 0.00 3.34 1.38
Subtotal 158 4.72 0.021 3.34 0.00 0.00 0.00 3.34 1.38G Wholesale and retail trade; repair 3,821 62.81 0.280 0.00 0.00 0.00 0.00 0.00 62.81I Transport, storage and communicationI 60.1 Railway transport 839 5.02 0.022 0.01 0.00 0.00 18.16 18.17 -13.15I 60.24 Road freight 537 8.29 0.037 9.62 0.00 0.00 0.00 9.62 -1.32I 60.3 Pipeline transport 22 2.92 0.013 0.01 0.00 0.00 0.00 0.01 2.91I 61.10.2 Marine freight 16 1.95 0.009 0.34 0.00 0.00 0.00 0.34 1.62I 61.2 River freight 17 0.09 0.000 0.00 0.00 0.00 0.00 0.00 0.09I 63.11 Transshipment of goods 236 2.19 0.010 0.00 0.00 0.00 1.57 1.57 0.62
Subtotal 1,668 20.47 0.091 9.97 0.00 0.00 19.73 29.70 -9.23K Real estate, renting and business activitiesK 73.10.2 Technical and techn. research and dvlp. 902 23.68 0.105 0.00 0.00 0.00 13.55 13.55 10.13K 74.14 Business and mngm. advisory services 170 2.39 0.011 0.00 0.00 0.00 3.49 3.49 -1.10K 74.30 Technical testing and analysis 33 0.46 0.002 0.00 0.00 0.00 0.68 0.68 -0.22
Subtotal 1,105 26.54 0.118 0.00 0.00 0.00 17.72 17.72 8.82L Public administration, defence and social securityL 75.11.1 Central government 342 5.18 0.023 0.00 0.00 0.00 8.58 8.58 -3.40L 75.11.2 Regional governments (counties) 77 1.82 0.008 0.00 0.00 0.00 1.92 1.92 -0.10L 75.11.5 Local governments (municipalities) 147 2.16 0.010 0.00 0.00 0.00 2.94 2.94 -0.78
Subtotal 566 9.16 0.041 0.00 0.00 0.00 13.44 13.44 -4.28M EducationM 80.3 Higher education 892 12.76 0.057 0.00 0.00 0.00 19.62 19.62 -6.86
Subtotal 892 12.76 0.057 0.00 0.00 0.00 19.62 19.62 -6.86N Health and social workN 85.2 Veterinary services 1,474 24.42 0.109 0.00 0.00 0.00 0.00 0.00 24.42
Subtotal 1,474 24.42 0.109 0.21 0.00 0.00 0.00 0.00 24.42Total 148,607 636.72 2.836 413.99 141.35 75.21 477.57 1,107.91 -471.18
Table 42 Baseline scenario: summary of added value and external costs
10. LARGE-SCALE ORGANIC FARMING SCENARIOS
10.1. Comparison issues
The comparison of environmental and economic performance between organic and conventional farming is difficult and requires some methodological clarifications. Lampkin (Lampkin 1992), based on the arguments from organic agriculture pioneers (Koepf 1983; Lockeretz 1989; Vogtmann 1990) stresses that the problem arises at the level of definition of agricultural systems, the objectives and design of the study, the methods and standards used for comparison, as well as the need to isolate performance indicators, which are not necessarily part of the system being compared. An additional problem is that a number of comparison studies indicate that the difference within the organic and conventional groups is greater than the average difference between the groups (Lampkin 1992; van Mansvelt and Mulder 1993). This can be explained by the physical and financial constraints of the examined farms as well as the management ability of the individual farmer. Management skills, which are difficult to evaluate, seem to play a crucial role in any comparison (Oenema and Pietrzak 2002). Skilled, well trained, hard-working farmers tend to be successful regardless whether they are organic or conventional. These are most likely to out-compete less skilled and trained farmers regardless the farming style these practice (Znaor 1995). Another important aspect is whether the comparison between high-external input and organic farming is fair at this point in time. This is because the comparison of the two is the comparison of the potential of an immature system with the achievements of a mature one in which decades of research and billions of dollars have been invested (Lampkin 1992).
In the beginning of the nineties van Mansvelt and Mulder (van Mansvelt and Mulder 1993) published an overview of the performance of organic farming. Based on the available literature at the time it concluded (van Mansvelt and Mulder 1993; van Mansvelt and Znaor 1999) that in comparison with conventional, organic farming:
1. results in less nutrient leaching into the water, largely complying with the requirements of the EU for drinking water.
2. does not cause the loading of synthetic pesticides into soil, water and air
3. results in lower yields 4. is more favourable for genetic, species and habitat diversity 5. is economically as attractive as conventional farming.
Methodological problems
General results
172
10.2. Environmental and economic performance of organic farming
Any form of agriculture means intervention and the alteration of processes occurring in (natural) eco-systems by a human being (van Mansvelt and Znaor 1999). Therefore such intervention always involves a certain disturbance of natural processes and the possible initiation of environmentally undesirable processes. Organic faming strives to operate under minimum environmental damage (Lampkin 1990; Znaor 1995; Scialabba El-Hage and Hattam 2002). This is not easy to achieve - certainly not under present macro-economic circumstances. However, there is ample evidence that organic farming can contribute to environmental protection and to the rational use of natural resources (Lampkin 1990; van Mansvelt and Mulder 1993; Pretty 1995; Alföldi, Lockeretz et al. 2000). Following the report by Stolze et al.(2000), Mäder (2004), made an updated comparison between the environmental performance of organic and conventional farming systems, making a review of some 400 studies. The subjective confidence interval of the final assessment showed that the environmental performance of organic farming systems is better than that of conventional farming in most aspects.
Data on yields obtained under ecological management show great variation in yields. Most studies report 20-40% lower average yields than those under conventional management (Lampkin 1990; Lampkin 1992; van Mansvelt and Mulder 1993; Lampkin 1999) (Goewie 2002). However, there are also studies showing far less significant differences. Among the most comprehensive seems to be the one from Stanhill (Stanhill 1990) who evaluated the results of 205 reports on yield comparisons of 26 different crops, milk and eggs. More than half of these reports showed higher yields on ecological farms. Thus the overall calculation showed that organic farms obtained only 9% less yields than conventional counterparts. In a 21-year study of the agronomic and ecological performance of biodynamic, organic, and conventional farming systems in Switzerland, the crop yields in biodynamic and organic systems were found to be 20 per cent lower than in conventional, although input of fertilizer and energy was reduced by 34 to 53 per cent and pesticide input by 97 per cent (Mäder, Fliessbach et al. 2002). A 22-year trial study by Cornell University in the USA proved that organic farming produces the same corn and soybean yields as conventional farms, but consumes less energy and utilizes no pesticides (Lang 2005).
The assumption is often made that the yield reductions associated with organic farming in western Europe will also apply in other parts of the world (Lampkin 1999). However, the evidence from the so called less developed countries indicate the contrary – organic yield levels are often very similar to those achieved in conventional systems (van Elzakker, Witte et al. 1992; Pretty 1998; Lampkin 1999; Znaor and Kieft 2000). Several authors suggest that in the so called less developed countries and Eastern Europe, organic yields can even be higher than conventional (Buys 1993; Busemann and Heusinger 1999; Lampkin 1999).
Environmental impact
Yields somewhat lower or same
... but not necessarily in less developed countries
173
Although organic farming systems are often perceived to require both livestock and crop production enterprises to form a viable agronomic and economic unit, there may be economic and other circumstances leading to stockless farming production (Philipps, Welsh et al. 1999). The stockless organic farming systems have proved to be capable of supporting soil fertility in several European regions (Philipps, Welsh et al. 1999; Schmidt, Philipps et al. 1999; Robson, Fowler et al. 2002; Sorensen and Thorup-Kristensen 2003; Mäder 2004). The yields obtained are comparable with those achieved by other organic farms and organic stockless systems seem to be economically viable (Bulson, Welsh et al. 1996; Philipps, Welsh et al. 1999; Huxham, Sparkes et al. 2005). Stockless organic farming is becoming increasingly important in Europe since the introduction of agri-environment measures (Huxham, Sparkes et al. 2005). In the mid nineties the proportion of stockless farms in Germany varied between 20 and 50 per cent (von Fragstein 1966) while France and the U.K also recorded a substantial portion of stockless farms (Stopes, Bulson et al. 1966; David, Fabre et al. 1996).
Most available studies report similar or better economic performance than conventional farms, even without taking into account external costs of production (Böckenhoff, Hamm et al. 1986; LEI 1990; Lampkin 1992; Reganold, Palmer et al. 1993; van Mansvelt and Mulder 1993) (Onstad, 1999). This is mainly due to the lower production (especially input) costs and the premium price ecological products attract (on average a 20-50% higher price than conventional products).
Several authors suggest that organic farming is a promising solution for Central and Eastern Europe, both from the economic and environmental point of view (Buys 1993; Znaor 1994; Znaor 1997; Znaor 2002; Meeusen, Bont et al. 2004). Options and implications of converting to organic (and other more sustainable farming practices) in the so-called less developed countries have been considered and positively assessed in several studies (van Elzakker, Witte et al. 1992; Funes, García et al. 2002; Pretty, Ball et al. 2002; Pretty 2003; Pretty, Morison et al. 2003). Besides, studies about national food security and sufficiency show that, based on the WHO recommended daily nutrient intake, organic agriculture can well feed the populations of less developed countries (Van Mansvelt and Mulder, 1993).
The studies on the widespread conversion to organic farming are scarce and suffer from serious problems regarding underlying assumptions, availability of data and the limited range of factors analysed (Lampkin 1999). The available studies on the consequences of large-scale conversion to organic farming suggest considerable environmental gains (Bechmann, Meier-Schaidnagel et al. 1993; Bechmann and Meier-Schaidnagel 1996; Halberg and Kristensen 1997; Hansen, Alroe et al. 2001; Bechmann and Meier-Schaidnagel 2004; Pretty, Ball et al. 2005). Pretty et al. (2005) compared the external costs of the current UK agricultural system with those that would arise if the whole country were farmed organically. Their results indicate that a 100 per cent shift to organic farming would generate only about 25 per cent of the current external costs of the UK agriculture.
Stockless organic systems
Profitability
Promising for less developed countries
Large-scale conversion
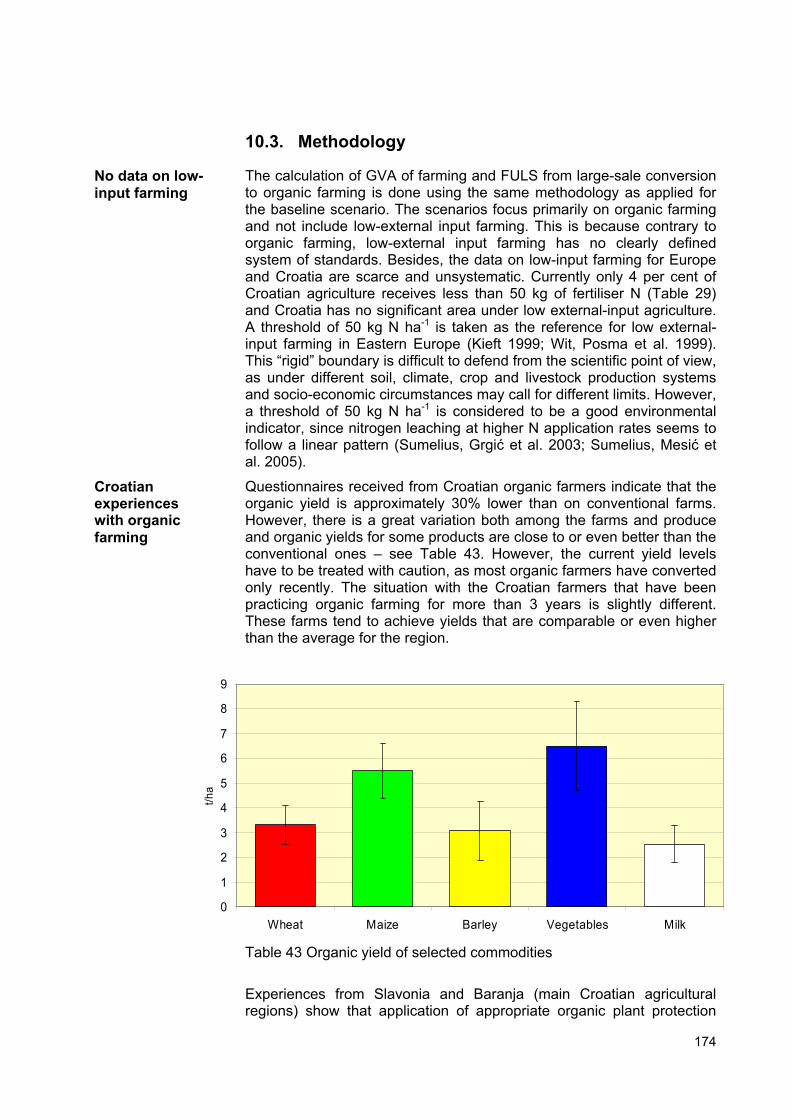
174
10.3. Methodology
The calculation of GVA of farming and FULS from large-sale conversion to organic farming is done using the same methodology as applied for the baseline scenario. The scenarios focus primarily on organic farming and not include low-external input farming. This is because contrary to organic farming, low-external input farming has no clearly defined system of standards. Besides, the data on low-input farming for Europe and Croatia are scarce and unsystematic. Currently only 4 per cent of Croatian agriculture receives less than 50 kg of fertiliser N (Table 29) and Croatia has no significant area under low external-input agriculture. A threshold of 50 kg N ha-1 is taken as the reference for low external-input farming in Eastern Europe (Kieft 1999; Wit, Posma et al. 1999). This “rigid” boundary is difficult to defend from the scientific point of view, as under different soil, climate, crop and livestock production systems and socio-economic circumstances may call for different limits. However, a threshold of 50 kg N ha-1 is considered to be a good environmental indicator, since nitrogen leaching at higher N application rates seems to follow a linear pattern (Sumelius, Grgić et al. 2003; Sumelius, Mesić et al. 2005).
Questionnaires received from Croatian organic farmers indicate that the organic yield is approximately 30% lower than on conventional farms. However, there is a great variation both among the farms and produce and organic yields for some products are close to or even better than the conventional ones – see Table 43. However, the current yield levels have to be treated with caution, as most organic farmers have converted only recently. The situation with the Croatian farmers that have been practicing organic farming for more than 3 years is slightly different. These farms tend to achieve yields that are comparable or even higher than the average for the region.
Table 43 Organic yield of selected commodities
Experiences from Slavonia and Baranja (main Croatian agricultural regions) show that application of appropriate organic plant protection
No data on low-input farming
Croatian experiences with organic farming
0
1
2
3
4
5
6
7
8
9
Wheat Maize Barley Vegetables Milk
t/ha
175
measures gives good results in protecting organic crops against pest and diseases (Šamota and Brkić 2002), including the greenhouse production (Parađiković, Milaković et al. 2002).
In the comparison scenarios, the following assumptions have been made: • The surface area of UAA remains the same as in the baseline scenario • The crop and livestock mix remains the same as in the baseline
scenario. This assumption, however, might be problematic. The current crop mixture (cropping pattern) in Croatia is certainly not in line with a number of organic farming principles (Figure 6). Organic farming is most likely to have a different cropping pattern. However, comparing a different cropping pattern than that of the baseline scenario would create an unjustified comparison. The same goes for the livestock mix. A greater share of more profitable crops or livestock for instance would immediately lead to a better result for the organic scenario. We have therefore in spite of these shortcomings decided to compare the organic potential of the current crop and livestock mix.
• The current share of nitrogen-fixing crops in Croatia is low. Organic farming is most likely to require a greater surface area under legumes and more livestock. However, the inclusion of more legumes and livestock would again create an unfair position for comparison.
• Crop and livestock subsidies remain the same per crop and livestock category as in the baseline scenario.
The scenarios involve the following areas under organic management: 10, 25, 50 and 100 per cent of UAA. For each of these, a simulation has been made for the hypothetical yield of 100, 75 and 50 per cent as compared with the baseline scenario. Except in the two scenarios of 10 and 25 per cent organic area, which include a 10 per cent premium price, organic products are assumed to obtain no premium price. This enables the same purchasing power and does not put an additional financial strain on Croatian consumers.
10.4. Results
Table 44 shows the GVA that would be generated through 100 per cent conversion, assuming the same yield levels as in the baseline scenario. This scenario achieves an output of 970.58 MEUR and has the intermediate consumption of 443.83 MEUR, resulting into a gross margin of 526.75 MEUR - an amount that is 164.89 MEUR better than the baseline scenario. Table 45 gives the gross margin that would be achieved if all Croatian livestock were raised organically, assuming however, the same yield level as in the baseline scenario. It suggests a gross margin of 539.44 MEUR, which is 237.85 MEUR better than the baseline situation. The GVA obtained through a 100 per cent organic crop and livestock production with the same yield level as the baseline scenario is presented in Table 46. The scenario results in an output of 2,271.13 MEUR, intermediate consumption of 1,204.94 and GVA of 796.25 MEUR. Finally, Table 47shows the consequence for the national economy of a 100 per cent conversion to organic farming with the same yield levels as in the baseline scenario. Farming and FULS generate a GVA of 915.81 MEUR, which is 276.85 MEUR more than in the baseline
Assumptions
100% area and 100% yield
176
scenario. Since this sector implies a reduction in energy use and refraining from the use of nearly all agri-industrial inputs, it creates substantially less GVA in the FULS than the baseline scenario (119.56 MEUR vs. 245.46 MEUR). However, due to the added value created by farming (accounts for 86.94 per cent of the entire GVA of this scenario), this scenario still results in a 276.85 MEUR higher GVA than the baseline scenario. It also generates less external costs than the baseline scenario: 658.89 MEUR vs. 1,107.91 MEUR. Due to the lower emissions into the environment as compared with the baseline scenario, the damage to air, water and soil is 283.95 MEUR, which is about three times lower than the environmental damage caused by the baseline scenario (630.55 MEUR). A low N input of 100 per cent organic scenario results in a nitrogen balance 8 kg N ha-1, leading to practically no leaching and damage to water. Since this scenario implies no use of fertilisers, its public investments in fertiliser manufacturing and railway transport are close to zero.
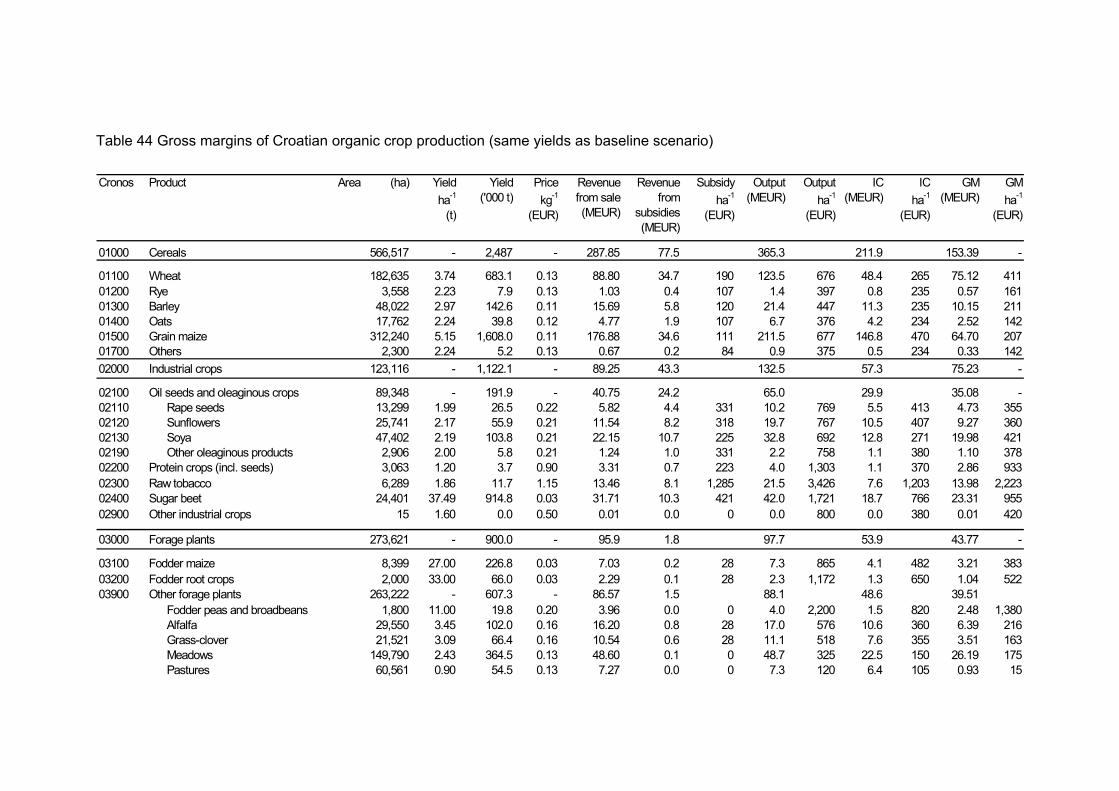
Cronos Product Area (ha) Yield ha-1
(t)
Yield ('000 t)
Price kg-1
(EUR)
Revenue from sale (MEUR)
Revenue from
subsidies (MEUR)
Subsidy ha-1
(EUR)
Output (MEUR)
Output ha-1
(EUR)
IC (MEUR)
IC ha-1
(EUR)
GM (MEUR)
GM ha-1
(EUR)
01000 Cereals 566,517 - 2,487 - 287.85 77.5 365.3 211.9 153.39 -
01100 Wheat 182,635 3.74 683.1 0.13 88.80 34.7 190 123.5 676 48.4 265 75.12 41101200 Rye 3,558 2.23 7.9 0.13 1.03 0.4 107 1.4 397 0.8 235 0.57 16101300 Barley 48,022 2.97 142.6 0.11 15.69 5.8 120 21.4 447 11.3 235 10.15 21101400 Oats 17,762 2.24 39.8 0.12 4.77 1.9 107 6.7 376 4.2 234 2.52 14201500 Grain maize 312,240 5.15 1,608.0 0.11 176.88 34.6 111 211.5 677 146.8 470 64.70 20701700 Others 2,300 2.24 5.2 0.13 0.67 0.2 84 0.9 375 0.5 234 0.33 14202000 Industrial crops 123,116 - 1,122.1 - 89.25 43.3 132.5 57.3 75.23 -
02100 Oil seeds and oleaginous crops 89,348 - 191.9 - 40.75 24.2 65.0 29.9 35.08 -02110 Rape seeds 13,299 1.99 26.5 0.22 5.82 4.4 331 10.2 769 5.5 413 4.73 35502120 Sunflowers 25,741 2.17 55.9 0.21 11.54 8.2 318 19.7 767 10.5 407 9.27 36002130 Soya 47,402 2.19 103.8 0.21 22.15 10.7 225 32.8 692 12.8 271 19.98 42102190 Other oleaginous products 2,906 2.00 5.8 0.21 1.24 1.0 331 2.2 758 1.1 380 1.10 37802200 Protein crops (incl. seeds) 3,063 1.20 3.7 0.90 3.31 0.7 223 4.0 1,303 1.1 370 2.86 93302300 Raw tobacco 6,289 1.86 11.7 1.15 13.46 8.1 1,285 21.5 3,426 7.6 1,203 13.98 2,22302400 Sugar beet 24,401 37.49 914.8 0.03 31.71 10.3 421 42.0 1,721 18.7 766 23.31 95502900 Other industrial crops 15 1.60 0.0 0.50 0.01 0.0 0 0.0 800 0.0 380 0.01 420
03000 Forage plants 273,621 - 900.0 - 95.9 1.8 97.7 53.9 43.77 -
03100 Fodder maize 8,399 27.00 226.8 0.03 7.03 0.2 28 7.3 865 4.1 482 3.21 38303200 Fodder root crops 2,000 33.00 66.0 0.03 2.29 0.1 28 2.3 1,172 1.3 650 1.04 52203900 Other forage plants 263,222 - 607.3 - 86.57 1.5 88.1 48.6 39.51
Fodder peas and broadbeans 1,800 11.00 19.8 0.20 3.96 0.0 0 4.0 2,200 1.5 820 2.48 1,380Alfalfa 29,550 3.45 102.0 0.16 16.20 0.8 28 17.0 576 10.6 360 6.39 216Grass-clover 21,521 3.09 66.4 0.16 10.54 0.6 28 11.1 518 7.6 355 3.51 163Meadows 149,790 2.43 364.5 0.13 48.60 0.1 0 48.7 325 22.5 150 26.19 175Pastures 60,561 0.90 54.5 0.13 7.27 0.0 0 7.3 120 6.4 105 0.93 15
Table 44 Gross margins of Croatian organic crop production (same yields as baseline scenario)
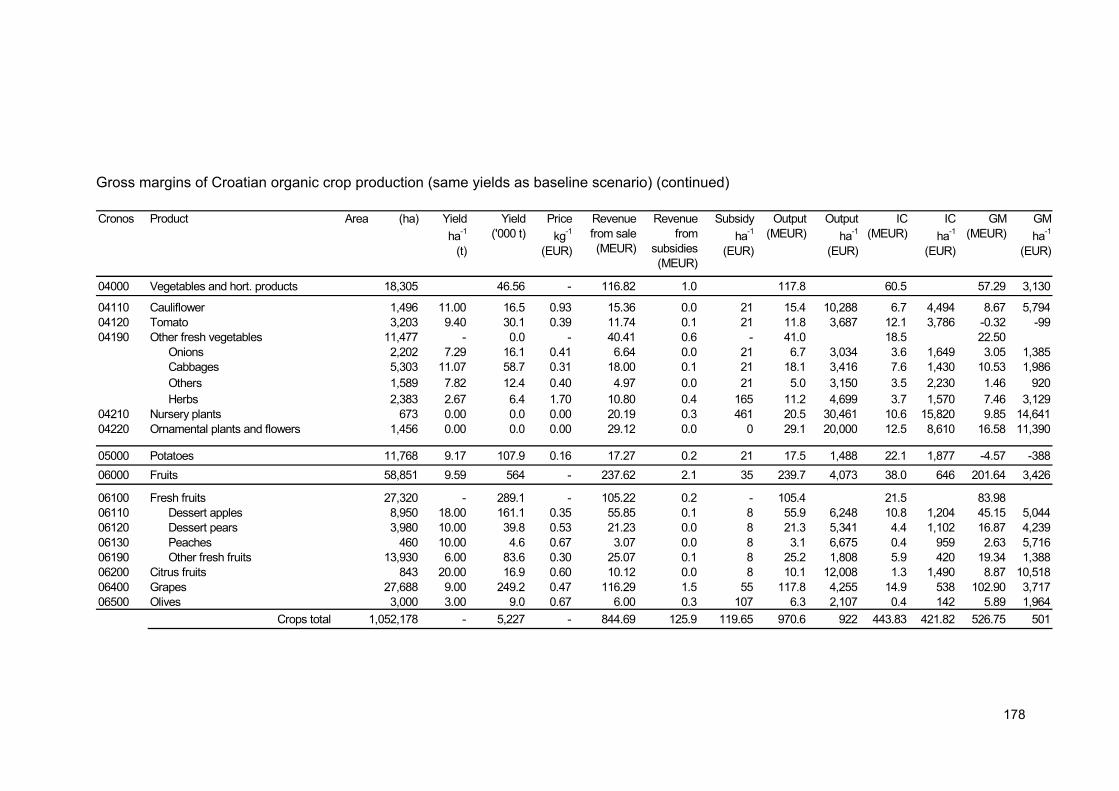
178
Cronos Product Area (ha) Yield ha-1
(t)
Yield ('000 t)
Price kg-1
(EUR)
Revenue from sale (MEUR)
Revenue from
subsidies (MEUR)
Subsidy ha-1
(EUR)
Output (MEUR)
Output ha-1
(EUR)
IC (MEUR)
IC ha-1
(EUR)
GM (MEUR)
GM ha-1
(EUR)
04000 Vegetables and hort. products 18,305 46.56 - 116.82 1.0 117.8 60.5 57.29 3,130
04110 Cauliflower 1,496 11.00 16.5 0.93 15.36 0.0 21 15.4 10,288 6.7 4,494 8.67 5,79404120 Tomato 3,203 9.40 30.1 0.39 11.74 0.1 21 11.8 3,687 12.1 3,786 -0.32 -9904190 Other fresh vegetables 11,477 - 0.0 - 40.41 0.6 - 41.0 18.5 22.50
Onions 2,202 7.29 16.1 0.41 6.64 0.0 21 6.7 3,034 3.6 1,649 3.05 1,385Cabbages 5,303 11.07 58.7 0.31 18.00 0.1 21 18.1 3,416 7.6 1,430 10.53 1,986Others 1,589 7.82 12.4 0.40 4.97 0.0 21 5.0 3,150 3.5 2,230 1.46 920Herbs 2,383 2.67 6.4 1.70 10.80 0.4 165 11.2 4,699 3.7 1,570 7.46 3,129
04210 Nursery plants 673 0.00 0.0 0.00 20.19 0.3 461 20.5 30,461 10.6 15,820 9.85 14,64104220 Ornamental plants and flowers 1,456 0.00 0.0 0.00 29.12 0.0 0 29.1 20,000 12.5 8,610 16.58 11,390
05000 Potatoes 11,768 9.17 107.9 0.16 17.27 0.2 21 17.5 1,488 22.1 1,877 -4.57 -38806000 Fruits 58,851 9.59 564 - 237.62 2.1 35 239.7 4,073 38.0 646 201.64 3,426
06100 Fresh fruits 27,320 - 289.1 - 105.22 0.2 - 105.4 21.5 83.9806110 Dessert apples 8,950 18.00 161.1 0.35 55.85 0.1 8 55.9 6,248 10.8 1,204 45.15 5,04406120 Dessert pears 3,980 10.00 39.8 0.53 21.23 0.0 8 21.3 5,341 4.4 1,102 16.87 4,23906130 Peaches 460 10.00 4.6 0.67 3.07 0.0 8 3.1 6,675 0.4 959 2.63 5,71606190 Other fresh fruits 13,930 6.00 83.6 0.30 25.07 0.1 8 25.2 1,808 5.9 420 19.34 1,38806200 Citrus fruits 843 20.00 16.9 0.60 10.12 0.0 8 10.1 12,008 1.3 1,490 8.87 10,51806400 Grapes 27,688 9.00 249.2 0.47 116.29 1.5 55 117.8 4,255 14.9 538 102.90 3,71706500 Olives 3,000 3.00 9.0 0.67 6.00 0.3 107 6.3 2,107 0.4 142 5.89 1,964
Crops total 1,052,178 - 5,227 - 844.69 125.9 119.65 970.6 922 443.83 421.82 526.75 501
Gross margins of Croatian organic crop production (same yields as baseline scenario) (continued)
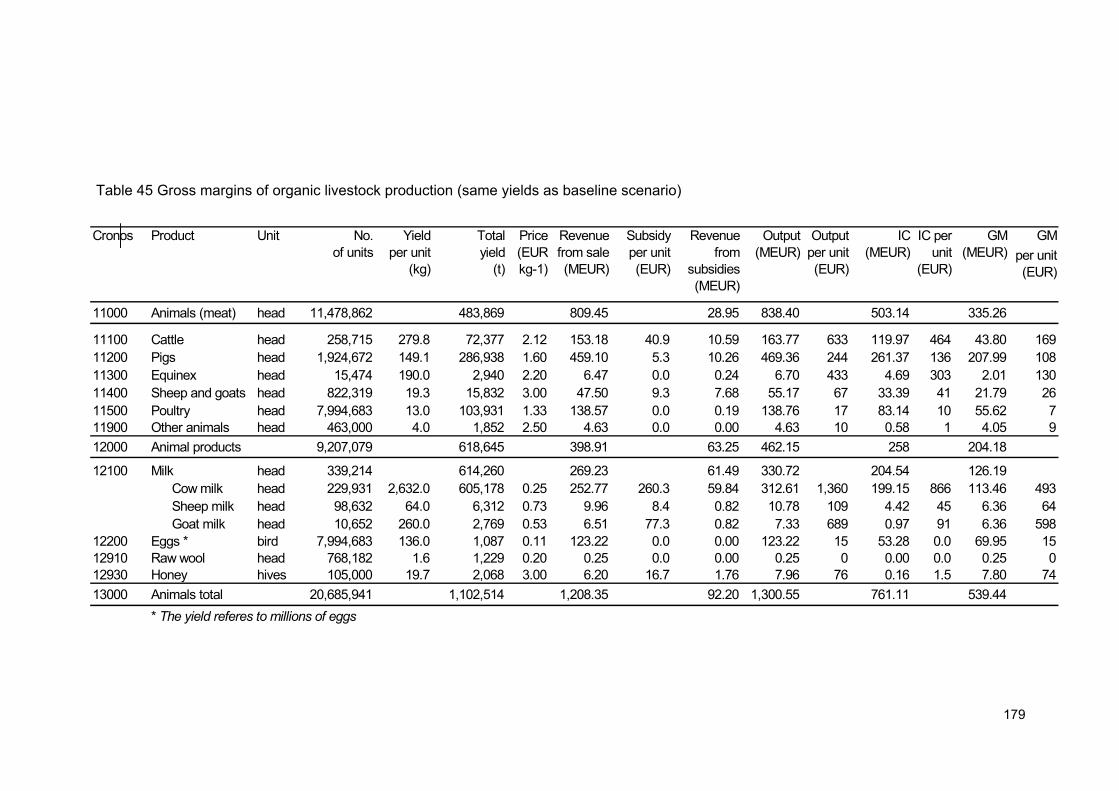
179
Cronos Product Unit No. of units
Yield per unit
(kg)
Total yield
(t)
Price (EUR kg-1)
Revenue from sale (MEUR)
Subsidy per unit (EUR)
Revenue from
subsidies (MEUR)
Output (MEUR)
Output per unit (EUR)
IC (MEUR)
IC per unit
(EUR)
GM (MEUR)
GM per unit (EUR)
11000 Animals (meat) head 11,478,862 483,869 809.45 28.95 838.40 503.14 335.26
11100 Cattle head 258,715 279.8 72,377 2.12 153.18 40.9 10.59 163.77 633 119.97 464 43.80 16911200 Pigs head 1,924,672 149.1 286,938 1.60 459.10 5.3 10.26 469.36 244 261.37 136 207.99 10811300 Equinex head 15,474 190.0 2,940 2.20 6.47 0.0 0.24 6.70 433 4.69 303 2.01 13011400 Sheep and goats head 822,319 19.3 15,832 3.00 47.50 9.3 7.68 55.17 67 33.39 41 21.79 2611500 Poultry head 7,994,683 13.0 103,931 1.33 138.57 0.0 0.19 138.76 17 83.14 10 55.62 711900 Other animals head 463,000 4.0 1,852 2.50 4.63 0.0 0.00 4.63 10 0.58 1 4.05 912000 Animal products 9,207,079 618,645 398.91 63.25 462.15 258 204.18
12100 Milk head 339,214 614,260 269.23 61.49 330.72 204.54 126.19Cow milk head 229,931 2,632.0 605,178 0.25 252.77 260.3 59.84 312.61 1,360 199.15 866 113.46 493Sheep milk head 98,632 64.0 6,312 0.73 9.96 8.4 0.82 10.78 109 4.42 45 6.36 64Goat milk head 10,652 260.0 2,769 0.53 6.51 77.3 0.82 7.33 689 0.97 91 6.36 598
12200 Eggs * bird 7,994,683 136.0 1,087 0.11 123.22 0.0 0.00 123.22 15 53.28 0.0 69.95 1512910 Raw wool head 768,182 1.6 1,229 0.20 0.25 0.0 0.00 0.25 0 0.00 0.0 0.25 012930 Honey hives 105,000 19.7 2,068 3.00 6.20 16.7 1.76 7.96 76 0.16 1.5 7.80 7413000 Animals total 20,685,941 1,102,514 1,208.35 92.20 1,300.55 761.11 539.44
* The yield referes to millions of eggs
Table 45 Gross margins of organic livestock production (same yields as baseline scenario)
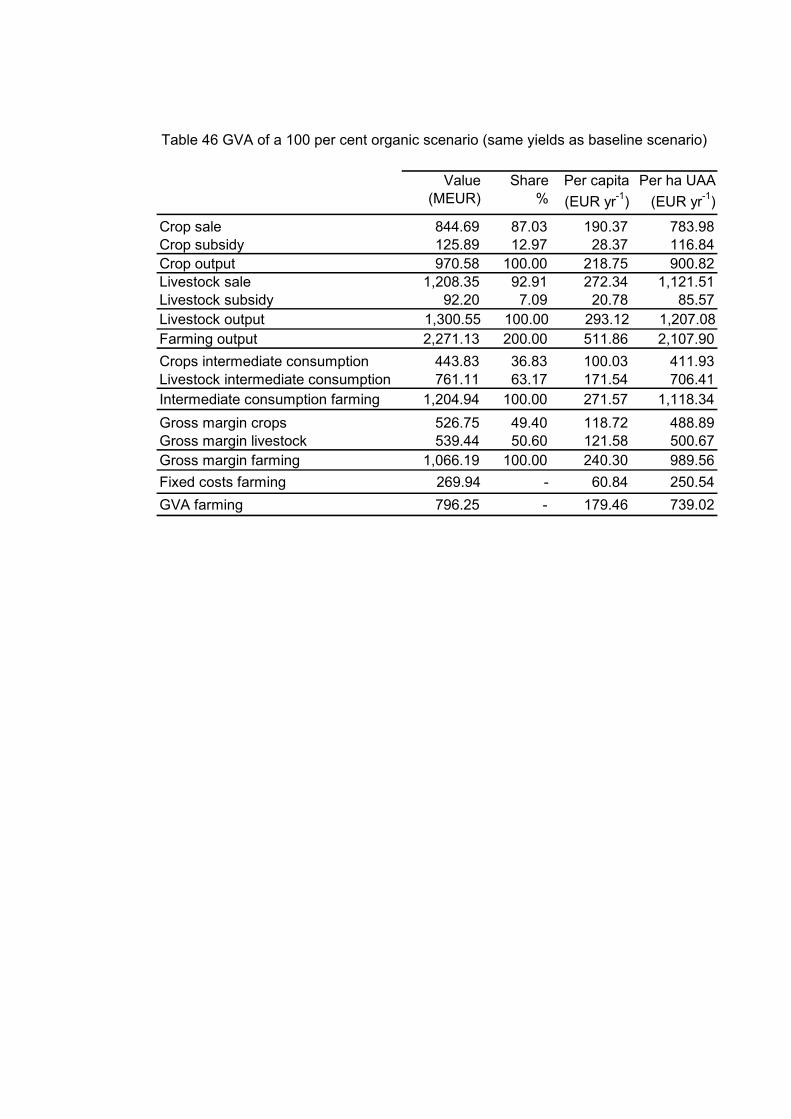
Value (MEUR)
Share %
Per capita (EUR yr-1)
Per ha UAA (EUR yr-1)
Crop sale 844.69 87.03 190.37 783.98Crop subsidy 125.89 12.97 28.37 116.84Crop output 970.58 100.00 218.75 900.82Livestock sale 1,208.35 92.91 272.34 1,121.51Livestock subsidy 92.20 7.09 20.78 85.57Livestock output 1,300.55 100.00 293.12 1,207.08Farming output 2,271.13 200.00 511.86 2,107.90Crops intermediate consumption 443.83 36.83 100.03 411.93Livestock intermediate consumption 761.11 63.17 171.54 706.41Intermediate consumption farming 1,204.94 100.00 271.57 1,118.34Gross margin crops 526.75 49.40 118.72 488.89Gross margin livestock 539.44 50.60 121.58 500.67Gross margin farming 1,066.19 100.00 240.30 989.56Fixed costs farming 269.94 - 60.84 250.54GVA farming 796.25 - 179.46 739.02
Table 46 GVA of a 100 per cent organic scenario (same yields as baseline scenario)
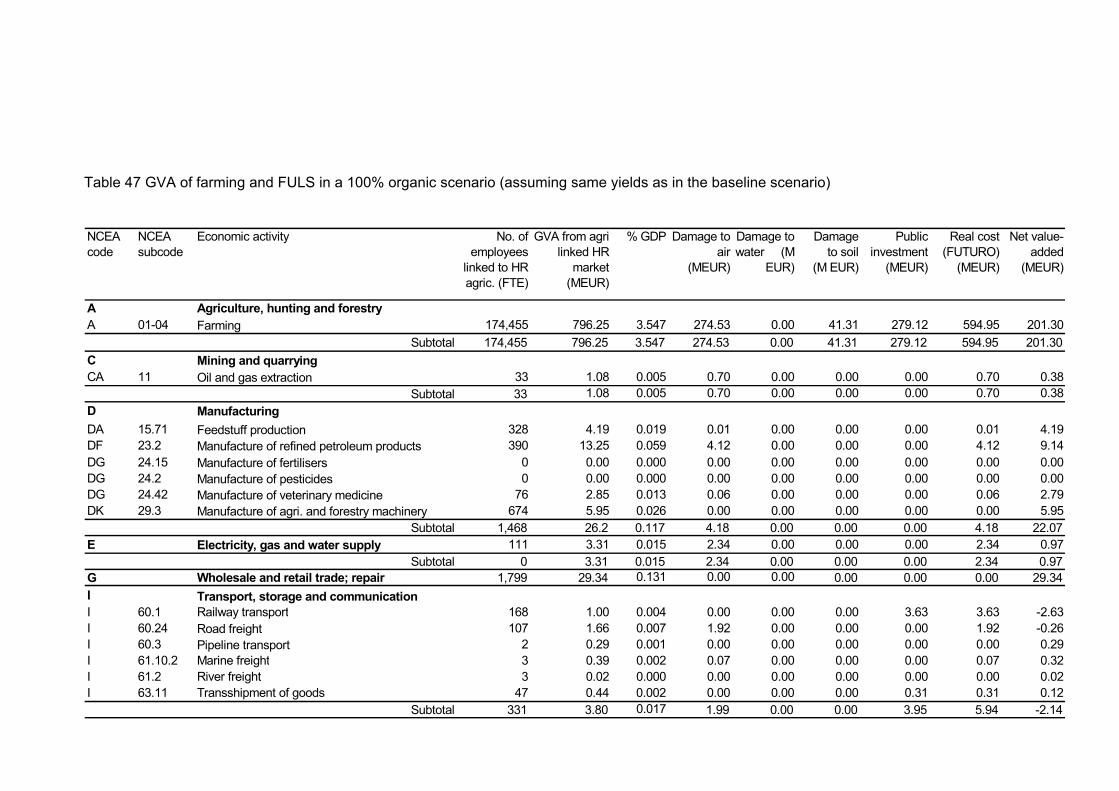
NCEA code
NCEA subcode
Economic activity No. of employees
linked to HR agric. (FTE)
GVA from agri-linked HR
market (MEUR)
% GDP Damage to air
(MEUR)
Damage to water (M
EUR)
Damage to soil
(M EUR)
Public investment
(MEUR)
Real cost (FUTURO)
(MEUR)
Net value-added
(MEUR)
A Agriculture, hunting and forestryA 01-04 Farming 174,455 796.25 3.547 274.53 0.00 41.31 279.12 594.95 201.30
Subtotal 174,455 796.25 3.547 274.53 0.00 41.31 279.12 594.95 201.30C Mining and quarryingCA 11 Oil and gas extraction 33 1.08 0.005 0.70 0.00 0.00 0.00 0.70 0.38
Subtotal 33 1.08 0.005 0.70 0.00 0.00 0.00 0.70 0.38D ManufacturingDA 15.71 Feedstuff production 328 4.19 0.019 0.01 0.00 0.00 0.00 0.01 4.19DF 23.2 Manufacture of refined petroleum products 390 13.25 0.059 4.12 0.00 0.00 0.00 4.12 9.14DG 24.15 Manufacture of fertilisers 0 0.00 0.000 0.00 0.00 0.00 0.00 0.00 0.00DG 24.2 Manufacture of pesticides 0 0.00 0.000 0.00 0.00 0.00 0.00 0.00 0.00DG 24.42 Manufacture of veterinary medicine 76 2.85 0.013 0.06 0.00 0.00 0.00 0.06 2.79DK 29.3 Manufacture of agri. and forestry machinery 674 5.95 0.026 0.00 0.00 0.00 0.00 0.00 5.95
Subtotal 1,468 26.2 0.117 4.18 0.00 0.00 0.00 4.18 22.07E Electricity, gas and water supply 111 3.31 0.015 2.34 0.00 0.00 0.00 2.34 0.97
Subtotal 0 3.31 0.015 2.34 0.00 0.00 0.00 2.34 0.97G Wholesale and retail trade; repair 1,799 29.34 0.131 0.00 0.00 0.00 0.00 0.00 29.34I Transport, storage and communicationI 60.1 Railway transport 168 1.00 0.004 0.00 0.00 0.00 3.63 3.63 -2.63I 60.24 Road freight 107 1.66 0.007 1.92 0.00 0.00 0.00 1.92 -0.26I 60.3 Pipeline transport 2 0.29 0.001 0.00 0.00 0.00 0.00 0.00 0.29I 61.10.2 Marine freight 3 0.39 0.002 0.07 0.00 0.00 0.00 0.07 0.32I 61.2 River freight 3 0.02 0.000 0.00 0.00 0.00 0.00 0.00 0.02I 63.11 Transshipment of goods 47 0.44 0.002 0.00 0.00 0.00 0.31 0.31 0.12
Subtotal 331 3.80 0.017 1.99 0.00 0.00 3.95 5.94 -2.14
Table 47 GVA of farming and FULS in a 100% organic scenario (assuming same yields as in the baseline scenario)
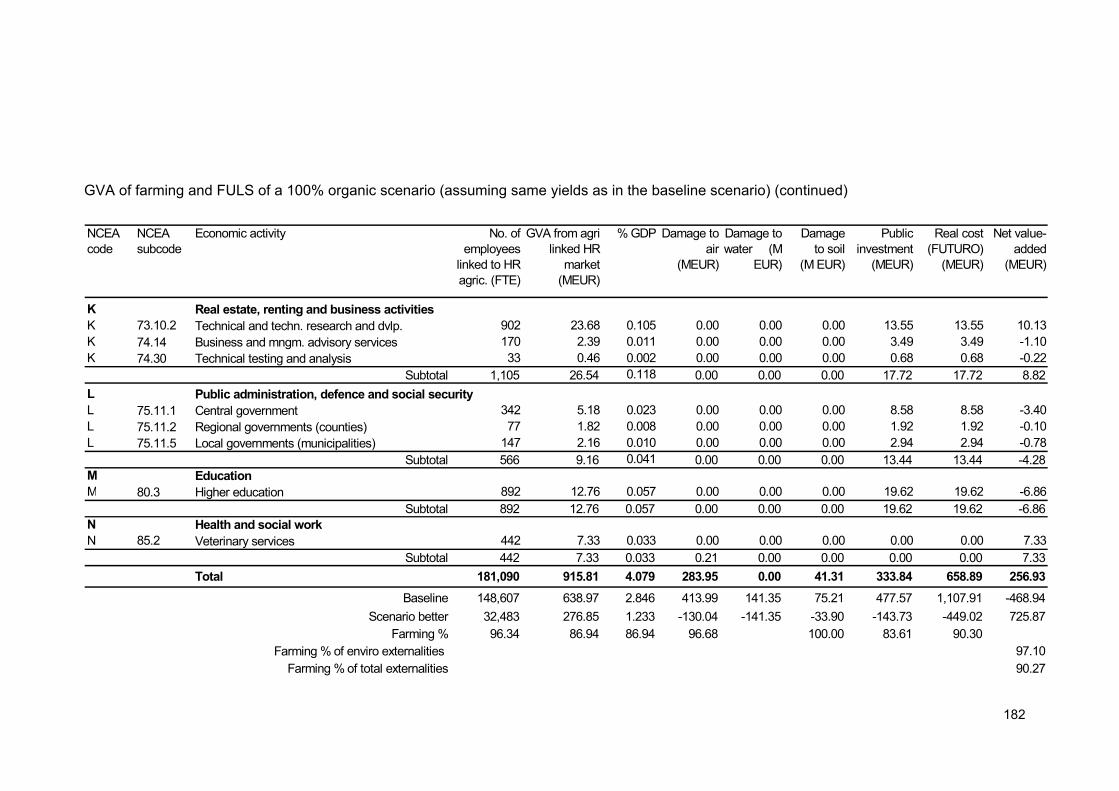
182
NCEA code
NCEA subcode
Economic activity No. of employees
linked to HR agric. (FTE)
GVA from agri-linked HR
market (MEUR)
% GDP Damage to air
(MEUR)
Damage to water (M
EUR)
Damage to soil
(M EUR)
Public investment
(MEUR)
Real cost (FUTURO)
(MEUR)
Net value-added
(MEUR)
K Real estate, renting and business activitiesK 73.10.2 Technical and techn. research and dvlp. 902 23.68 0.105 0.00 0.00 0.00 13.55 13.55 10.13K 74.14 Business and mngm. advisory services 170 2.39 0.011 0.00 0.00 0.00 3.49 3.49 -1.10K 74.30 Technical testing and analysis 33 0.46 0.002 0.00 0.00 0.00 0.68 0.68 -0.22
Subtotal 1,105 26.54 0.118 0.00 0.00 0.00 17.72 17.72 8.82L Public administration, defence and social securityL 75.11.1 Central government 342 5.18 0.023 0.00 0.00 0.00 8.58 8.58 -3.40L 75.11.2 Regional governments (counties) 77 1.82 0.008 0.00 0.00 0.00 1.92 1.92 -0.10L 75.11.5 Local governments (municipalities) 147 2.16 0.010 0.00 0.00 0.00 2.94 2.94 -0.78
Subtotal 566 9.16 0.041 0.00 0.00 0.00 13.44 13.44 -4.28M EducationM 80.3 Higher education 892 12.76 0.057 0.00 0.00 0.00 19.62 19.62 -6.86
Subtotal 892 12.76 0.057 0.00 0.00 0.00 19.62 19.62 -6.86N Health and social workN 85.2 Veterinary services 442 7.33 0.033 0.00 0.00 0.00 0.00 0.00 7.33
Subtotal 442 7.33 0.033 0.21 0.00 0.00 0.00 0.00 7.33Total 181,090 915.81 4.079 283.95 0.00 41.31 333.84 658.89 256.93
Baseline 148,607 638.97 2.846 413.99 141.35 75.21 477.57 1,107.91 -468.94Scenario better 32,483 276.85 1.233 -130.04 -141.35 -33.90 -143.73 -449.02 725.87
Farming % 96.34 86.94 86.94 96.68 100.00 83.61 90.30Farming % of enviro externalities 97.10
Farming % of total externalities 90.27
GVA of farming and FULS of a 100% organic scenario (assuming same yields as in the baseline scenario) (continued)
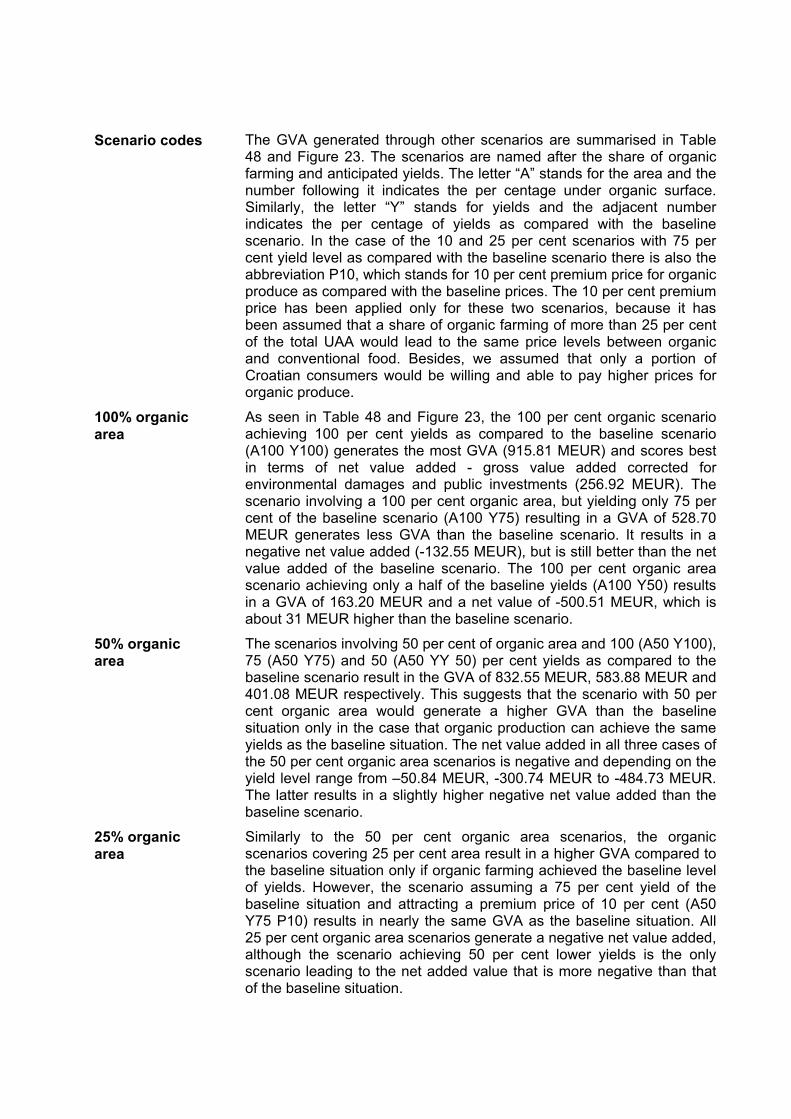
The GVA generated through other scenarios are summarised in Table 48 and Figure 23. The scenarios are named after the share of organic farming and anticipated yields. The letter “A” stands for the area and the number following it indicates the per centage under organic surface. Similarly, the letter “Y” stands for yields and the adjacent number indicates the per centage of yields as compared with the baseline scenario. In the case of the 10 and 25 per cent scenarios with 75 per cent yield level as compared with the baseline scenario there is also the abbreviation P10, which stands for 10 per cent premium price for organic produce as compared with the baseline prices. The 10 per cent premium price has been applied only for these two scenarios, because it has been assumed that a share of organic farming of more than 25 per cent of the total UAA would lead to the same price levels between organic and conventional food. Besides, we assumed that only a portion of Croatian consumers would be willing and able to pay higher prices for organic produce.
As seen in Table 48 and Figure 23, the 100 per cent organic scenario achieving 100 per cent yields as compared to the baseline scenario (A100 Y100) generates the most GVA (915.81 MEUR) and scores best in terms of net value added - gross value added corrected for environmental damages and public investments (256.92 MEUR). The scenario involving a 100 per cent organic area, but yielding only 75 per cent of the baseline scenario (A100 Y75) resulting in a GVA of 528.70 MEUR generates less GVA than the baseline scenario. It results in a negative net value added (-132.55 MEUR), but is still better than the net value added of the baseline scenario. The 100 per cent organic area scenario achieving only a half of the baseline yields (A100 Y50) results in a GVA of 163.20 MEUR and a net value of -500.51 MEUR, which is about 31 MEUR higher than the baseline scenario.
The scenarios involving 50 per cent of organic area and 100 (A50 Y100), 75 (A50 Y75) and 50 (A50 YY 50) per cent yields as compared to the baseline scenario result in the GVA of 832.55 MEUR, 583.88 MEUR and 401.08 MEUR respectively. This suggests that the scenario with 50 per cent organic area would generate a higher GVA than the baseline situation only in the case that organic production can achieve the same yields as the baseline situation. The net value added in all three cases of the 50 per cent organic area scenarios is negative and depending on the yield level range from –50.84 MEUR, -300.74 MEUR to -484.73 MEUR. The latter results in a slightly higher negative net value added than the baseline scenario.
Similarly to the 50 per cent organic area scenarios, the organic scenarios covering 25 per cent area result in a higher GVA compared to the baseline situation only if organic farming achieved the baseline level of yields. However, the scenario assuming a 75 per cent yield of the baseline situation and attracting a premium price of 10 per cent (A50 Y75 P10) results in nearly the same GVA as the baseline situation. All 25 per cent organic area scenarios generate a negative net value added, although the scenario achieving 50 per cent lower yields is the only scenario leading to the net added value that is more negative than that of the baseline situation.
Scenario codes
100% organic area
50% organic area
25% organic area
184
The organic scenarios occupying only 10 per cent of the UAA result in a fairly similar GVA and net added value as the baseline scenario. However, the scenario assuming the same yields level as the baseline situation (A10 Y100), is the only one that is better than the baseline situation both in terms of GVA and net added value. Similarly, the scenario with 50 per cent lower yields (A10 Y50) is the only scenario that leads to a lower result of both GVA and net added value as compared to the baseline scenario. It is interesting that the scenario including a 10 per cent premium price and 75 per cent yields (A10 Y75 P10) also results in worse results both in terms of GVA and net value added than the baseline scenario.
10% organic area
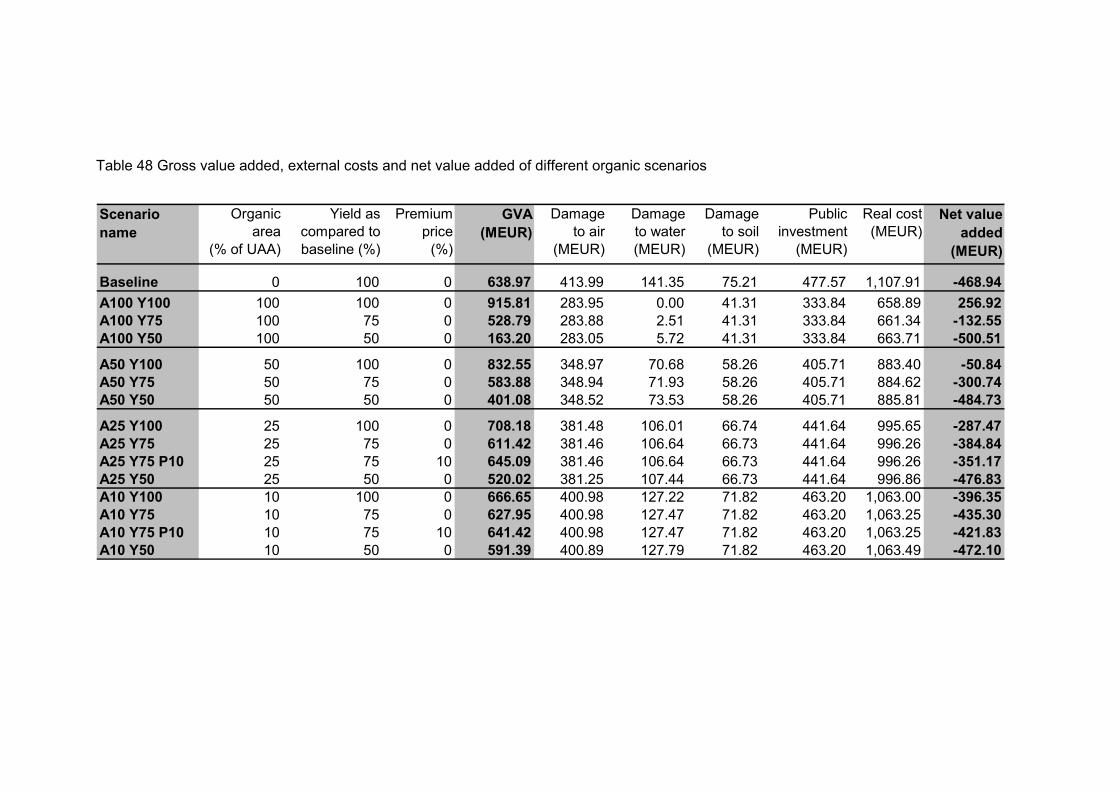
Scenario name
Organic area
(% of UAA)
Yield as compared to baseline (%)
Premium price
(%)
GVA (MEUR)
Damage to air
(MEUR)
Damage to water (MEUR)
Damage to soil
(MEUR)
Public investment
(MEUR)
Real cost (MEUR)
Net value added
(MEUR)
Baseline 0 100 0 638.97 413.99 141.35 75.21 477.57 1,107.91 -468.94A100 Y100 100 100 0 915.81 283.95 0.00 41.31 333.84 658.89 256.92A100 Y75 100 75 0 528.79 283.88 2.51 41.31 333.84 661.34 -132.55A100 Y50 100 50 0 163.20 283.05 5.72 41.31 333.84 663.71 -500.51
A50 Y100 50 100 0 832.55 348.97 70.68 58.26 405.71 883.40 -50.84A50 Y75 50 75 0 583.88 348.94 71.93 58.26 405.71 884.62 -300.74A50 Y50 50 50 0 401.08 348.52 73.53 58.26 405.71 885.81 -484.73
A25 Y100 25 100 0 708.18 381.48 106.01 66.74 441.64 995.65 -287.47A25 Y75 25 75 0 611.42 381.46 106.64 66.73 441.64 996.26 -384.84A25 Y75 P10 25 75 10 645.09 381.46 106.64 66.73 441.64 996.26 -351.17A25 Y50 25 50 0 520.02 381.25 107.44 66.73 441.64 996.86 -476.83A10 Y100 10 100 0 666.65 400.98 127.22 71.82 463.20 1,063.00 -396.35A10 Y75 10 75 0 627.95 400.98 127.47 71.82 463.20 1,063.25 -435.30A10 Y75 P10 10 75 10 641.42 400.98 127.47 71.82 463.20 1,063.25 -421.83A10 Y50 10 50 0 591.39 400.89 127.79 71.82 463.20 1,063.49 -472.10
Table 48 Gross value added, external costs and net value added of different organic scenarios
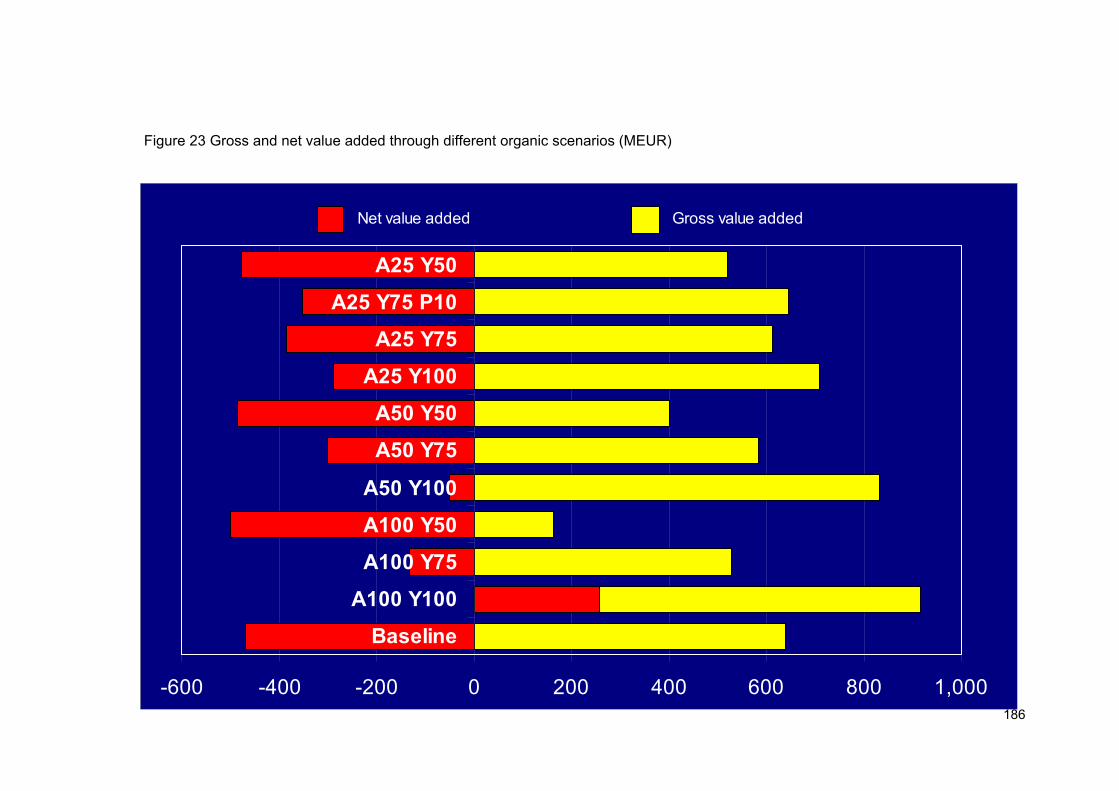
186
-600 -400 -200 0 200 400 600 800 1,000
Baseline
A100 Y100
A100 Y75
A100 Y50
A50 Y100
A50 Y75
A50 Y50
A25 Y100
A25 Y75
A25 Y75 P10
A25 Y50
Net value added Gross value added
Figure 23 Gross and net value added through different organic scenarios (MEUR)
11. CONCLUSIONS
The results of this study suggest that in the period 2001-2003 Croatian farming and FULS caused considerable damage to the environment (630.55 MEUR yr-1) and consumed 477.57 MEUR yr-1 of public investment money. When the GVA generated by farming and FULS is corrected for the environmental damage and public investments, the real (“net”) value added turns to be negative, about - 468.94 MEUR per year.
As elsewhere, the damage to the environment has not been internalised in the price of the Croatian agricultural commodities or farm inputs. Although it is difficult to assess and allocate them, these costs are real! They affect human health, damage materials (buildings, etc.) and ecosystems and raise public investments (e.g. cleaning of water and road conveyance systems from eroded soil). However, the current economic assessments do not take into account these costs, while any public investment strengthens the GDP by adding to the output side of the GDP equation. The adjustment of Croatian farming and FULS GVA for the environmental damage and public investments results in a negative added value. However, as long as the external costs are not recognised as an integral part of the GDP account, neither Croatia nor any other country will gear its policies towards more sustainable economics. The recent boom in international carbon emission trading marks a turning point in this respect. Both governments and businesses have begun to recognise and started paying for externalities. Due to the trans-boundary character of air pollution, only 41 per cent of all environmental damage caused by Croatian farming and FULS occurs in Croatia (260.54 MEUR out of 630.55 MEUR). The fact that the majority of external costs are imposed outside the country might make this concept even less attractive for the policy makers. However, this should not be the case as on the other hand the trans boundary pollution from other countries imposes costs in Croatia. The compulsory inclusion of environmental damages in the standard GDP calculation might lead to some kind of environmental debts of one country to another country. In the foreseeable future this might lead to economic swaps between the governments, similarly to the carbon credits trade of today.
A 100 per cent conversion to organic farming in Croatia, provided this could ensure the same yields, would result in a higher annual gross and net value added than achieved on average in the period 2001-2003. However, if such conversion would imply a 25 per cent reduction in yields as compared to the 2001-2003 yields, it would result in a somewhat lower GVA, but still higher net value added. This would pose an interesting but very difficult dilemma for the policy makers. They would have to choose whether to trade the somewhat higher (12 per cent) GVA achieved in the baseline scenario for the substantially better (3.6 times) net value added from the 100 per cent organic scenario providing only 75 per cent of food (Table 48 and Figure 23).
Negative net value added
External costs not yet fully recognised
Organic with lower yields: a Faustian bargain?
188
As it can be seen from Table 48, all scenarios involving an increase of area under organic farming decrease the current environmental damage. This is because organic farming has a better environmental performance than the baseline situation and provokes less environmental burden (emissions) in the FULS.
Organic scenarios require seem to result in lower public investments than the baseline scenario, mostly due to the omission of public investments related to fertiliser manufacturing and the railway freight of agricultural inputs. Besides, organic farming would provide more employment (see
Table 47).
A fair comparison between the baseline and organic scenarios is most probably the most critical methodological aspect of the calculations presented in this study. As already explained in the previous Chapter, it is nearly impossible to make a “fair” comparison between the present situation and large-scale organic scenarios. The concept and practice of organic farming differs fundamentally from those of conventional farming. Large-scale organic farming is most likely to lead to a quite different crop and livestock mix than that of the baseline scenario. It would require a greater area under legumes or grass-clover mixtures in order to provide enough nitrogen for crops and own animal feedstuff. A greater surface under grassland/legume crops would most probably lead towards an increase in the number of livestock. In the case of Croatia, this would not pose any (environmental) problem, since the current stocking rate is low anyhow (0.69 LU ha-1). However, an increased number of animals in the organic scenarios would result in an increase of the agricultural physical output and inevitably favour the organic scenarios. But at the same time, it would also require substantial initial investments in livestock, stables and related machinery.
A similar dilemma exists for the premium prices. One could argue that organic produce is most likely to attain some higher prices than the conventional products, because these products are often associated with various environmental merits, better quality (taste, shelf-life) and a number of people believe that they are “healthier”. However, in the case of a greater supply, the prices of organic products are most likely to level out with those of conventional farming, especially because of the limited purchasing power of Croatian consumers.
The yield level seems to be the main key determining the result of each scenario presented in this study. As already explained in the previous Chapter, in the case of countries with less developed agriculture, the organic yields are most likely not to substantially differ from the current yields. Moreover, as the organic farming management should go hand in hand with careful stewardship, organic yields might even increase. However, this assumption implies an improved management, which again creates injustice to the baseline situation, as an improved farm management would also lead to a better result of the baseline scenario.
Organic better for the environment
Organic farming lowers public investments
A fair comparison is (in)possible?
189
Conversion to large-scale organic farming requires high human and social capital. Organic farming is low-input from the point of view of the use of external farming inputs, but is high-input from the point of view of the knowledge and skills needed (Lampkin 1990; Lampkin 1992; Znaor 1994; Pretty and Ward 2001). In the case of Croatia and other countries where farmers (and some other stakeholders) have a relatively low level of general education and hardly any agricultural training, this point will certainly be of the main obstacle preventing a greater spread of organic-like farming systems (Znaor and Karoglan Todorović 2004).
.
Human and social capital
12. REFERENCES
Aarts, H. F. M., B. Habekotté, et al. (2000). "Nitrogen (N) management in the De
Marke dairy farming system." Nutrient Cycling in Agroecosystems 56(3): 231 - 240. Abbey, D. E., M. D. Lebowitz, et al. (1995). "Long-term ambient concentrations of
particulates and oxidants and development of chronic disease in a cohort of nonsmoking California residents." Inhalation Toxicology 7: 19-34.
AF (2002). Family Farm Survey. Zagreb, University of Zagreb, Faculty of Agriculture. AF (2004). Godišnje izvješće 1. lipnja 2003. do 31. svibnja 2004 [Annual report June
1, 2003 - May 31, 2004]. Zagreb, Agronomski fakultet Sveučilišta u Zagrebu: 198. AGÖL/BUND (1997). Wasserschutz durch Ökologischen Landbau. Leitfaden für die
Wasserwirtschaft. Osnabrück, AGÖL/BUND. Alam, M. K. and D. Marinova (2003). "Measuring the total value of a river cleanup."
Water Science And Technology 48(7): 149-156. Alföldi, T., W. Lockeretz, et al., Eds. (2000). Proceedings of the 13th International
IFOAM Scientific Conference. Basel, FIBL. Allingham, K. D., R. Cartwright, et al. (2003). "Nitrate leaching losses and their
controls in a mixed farm system in the Cotswold Hills, England." Soil Use & Management 18: 421-427.
Anderson, H. R., A. Ponce de Leon, et al. (1996). "Air pollution and daily mortality in London: 1987-92." BMJ 312: 665-669.
Andrijanić, G. (2003). Strance zanima samo hrvatska zemlja [Foreigners only interested in Croatian land]. Focus, February 28, 2003.
Avirović, G. (2004). Petrokemija d.d. Avirović, G. (2005). Petrokemija d.d. AZZTN (2004). Godišnje izvješće o radu Agencije za zaštitu tržišnog natjecanja u
odnosu na državne potpore i godišnje izvješće o državnim potporama za 2003. godinu [Annual report on the work of the Agency for market competition protection regarding state subsidies and annual report on state subsidies for 2003]. Zagreb, Agencija za zaštitu tržišnog natjecanja.
Bankamagazin (2002). INA i kutinska Petrokemija potpisali ugovor o isporuci plina [INA and Petrokemija from Kutina signed contract on gas supply]. Bankamagazin, 08.02.2002.
Bankamagazine (2002). Vlada: Šest PIK-ova spremno za privatizaciju, specijalni aranžmani za za PIK Vrbovec i IPK Osijek [Government: six agri-combinates ready for privatisation, special arrangements for PIK Vrbovec and IPK Osijek], Bankamagazine.
Barbier, E. B. and J. T. Bishop (1995). "Economic Values And Incentives Affecting Soil And Water Conservation In Developing-Countries." Journal Of Soil And Water Conservation 50(2): 133-137.
Barišić, D. (2005). Institute "Ruđer Bošković". Barišić, D., S. Lulić, et al. (1992). "Radium and Uranium in Phosphate Fertilizers and
Their Impact on the Radioactivities of Waters." Water Research 26(5): 607-611. Bašić, F. (2002). Obilježja talnog pokrova (pedosfere) Hrvatske [Croatian soil
(pedoshpere) characteristics]. In: Mesić, M., Bašić, F., Grgić, Z., Igrc-Barčić., J., Kisić, I., Petošić, D., Posavi, M., Romić, D., Šimunić, I. (eds.). Procijena stanja, uzroka i veličine pritisaka poljoprivrede na vodne resurse i more na području
191
Republike Hrvatske [Assessment of the Situation, Causes and Magnitude of Agricultural Environmental Pressure on Water Resources and Sea in the Republic of Croatia]. Zagreb, Agronomski fakultet.
Bašić, F. (2002). Tlo kao izvor pritiska [Soil as source of environmental pressure]. In: Mesić, M., Bašić, F., Grgić, Z., Igrc-Barčić., J., Kisić, I., Petošić, D., Posavi, M., Romić, D., Šimunić, I. (eds.). Procijena stanja, uzroka i veličine pritisaka poljoprivrede na vodne resurse i more na području Republike Hrvatske [Assessment of the Situation, Causes and Magnitude of Agricultural Environmental Pressure on Water Resources and Sea in the Republic of Croatia]. Zagreb, Agronomski fakultet.
Bašić, F., I. Kisić, et al. (2004). "Tillage and crop management effects on soil erosion in central Croatia." Soil & Tillage Research 78(2): 197-206.
Bašić, F., I. Kisić, et al. (2000). "Water erosion in differnt crop development stages and tillage practices on luvic stagnosol of Central Croatia." JCEA 1(1): 26-40.
Bašić, F., I. Kisić, et al. (2002). Erozija tla vodom pri različitim načinima obrade tla [Water-induced soil erosion from different soil tillage systems]. Alps-Adria Scientific Workshop, Opatija, Hungarian Academy of Sciences.
Bašić, F., I. Kisić, et al. (2002). Soil erosion in different tillage systems in agroecological conditions of central Croatia. Procceedings of the Alps Adria Scientific Workshop, Opatija, Hungarian Academy of Sciences.
Bašić, F., I. Kisić, et al. (2002). "Particle size distribution (texture) of eroded soil material." Journal Of Agronomy And Crop Science 188(5): 311-322.
Bauder, J. (1999). When is Organic Matter Built Up or Used Up? Montana State University Communications Services: 6.
Bechmann, A. and R. Meier-Schaidnagel (1996). Zukunftsfähige Landwirtschaft-Ökologischer Landbau flächendeckend: Gute Argumente für die Welt Morgen. Barsinghausen, Zukunfts-Instituut.
Bechmann, A. and R. Meier-Schaidnagel (2004). Zum Leistungspotenzial des Ökologischen Landbaus. Barsinghausen, Zukunfts Zentrum.
Bechmann, A., R. Meier-Schaidnagel, et al. (1993). Landwirtschaft 2000- Die Zukunft gehört dem Ökologischen Landbau. Scenarien für die Umstellungskosten der Landwirtschaft in Deutchland. Barsinghäuser Berichte, Heft 27. Barsinghausen, Zukunfts-Instituut.
Beilage, E. G., J. Zentek, et al. (2002). "Acute nitrite toxicosis in fattening pigs." Tierarztliche Praxis Ausgabe Grosstiere Nutztiere 30(1): 32-38.
Belamarić Šaravanja, M. (2004). Croatian Centre for Greener Production. Belamarić Šaravija, M. (2004). Benko Tomić, V. (2004). Veterina d.d. Benko Tomić, V. (2005). Veterina d.o.o. Berentsen, P. B. M., G. W. J. Giesen, et al. (1998). "Conversion from conventional to
biological dairy farming: Economic and environmental consequences at farm level." Biological Agriculture & Horticulture 16(3): 311-328.
Besplug, J., J. Filkowski, et al. (2004). "Atrazine induces homologous recombination but not point mutation in the transgenic plant-based biomonitoring assay." Archives Of Environmental Contamination And Toxicology 46(3): 296-300.
Biondić, D. (2005). Croatian Waters P.l.c. Hrvatske vode: časopis za vodno gospodarstvo. Vol. 11.
192
Biondić, D., B. Milović, et al. (2003). "Systematic approach to flood control in Croatia." Hrvatske vode: časopis za vodno gospodarstvo Vol. 11(45): 45:445-458.
Bleijenberg, A. N., M. D. Davidson, et al. (1998). The price of pollution. Delft, Cente for Energy Conservation and Environmental Technology: 19.
Bleken, M. A. and L. R. Bakken (1997). "The nitrogen cost of food production: Norwegian society." Ambio 26(3): 134-142.
Boardman, J. (1998). "An average soil erosion rate for Europe: Myth or reality?" Journal Of Soil And Water Conservation 53(1): 46-50.
Böckenhoff, E., U. Hamm, et al. (1986). "Analyse der Betriebs-und Produktionsstrukturen sowie der Naturalertrage im Alternativen Landbau." Berichte über Landwirtschaft 64(1): 1-39.
Bockstael, N. E., A. M. Freeman, et al. (2000). "On measuring economic values for nature." Environmental Science & Technology 34(8): 1384-1389.
Bockstael, N. E., W. M. Hanemann, et al. (1987). "Estimating the value of water quality improvements in a recreational demand framework." Water Resources Research 23(5): 951-960.
Bockstael, N. E., K. E. McConnell, et al. (1989). "Measuring the benefits of improvements in water quality: the Chesapeake Bay." Marine Resources Economics 6(1): 1-18.
Boink, A. and G. Speijers (2001). "Health effects of nitrate, a review." Acta Horticulturae 563: 29-36.
Boussard, J. M. (2003). "Is agricultural policy aiming at the wrong target?" Eurochoices 2(1): 32-34.
Bouwer, H. (1987). "Effect of irrigated agriculture on groundwater." Journal of Irrigation and Drainage Engineering 113(1): 4-15.
Brethour, C. and A. Weersink (2001). "An economic evaluation of the environmental benefits from pesticide reduction." Agricultural Economics 25(2-3): 219-226.
Brouwer, F., P. Hellegers, et al. (1999). Managing nitrogen pollution from intensive livestock production in the EU Economic and environmental benefits of reducing nitrogen pollution by nutritional management in relation to the changing CAP regime and the Nitrates Directive. The Hague, Agricultural Economics Research Institute: 129.
Brouwer, R., I. H. Langford, et al. (1997). A meta-analysis of wetland contingent valuation studies. Working Paper GEC 97-20. London and Norwich, Centre for Social and Economic Research on the Global Environment.
Brstilo, M. (2005). Ministry of Agriculture, Forestry and Water Management. Letters sent on January 12th and May 8th, 2005.
Brusven, M. A., D. J. Walker, et al. (1995). "Ecological-Economic Assessment Of A Sediment-Producing Stream Behind Lower-Granite Dam On The Lower Snake River, USA." Regulated Rivers-Research & Management 10(2-4): 373-387.
Bukowski, J., G. Somers, et al. (2001). "Agricultural contamination of groundwater as a possible risk factor for growth restriction or prematurity." Journal Of Occupational And Environmental Medicine 43(4): 377-383.
Bulson, H. A. J., J. P. Welsh, et al. (1996). "Agronomic viability and potential economic performance of three organic four year rotations without livestock, 1988-1995." Aspects of Applied Biology 47: 277-286.
Burt, O. R. (1981). "Farm Level Economics Of Soil Conservation In The Palouse Area Of The Northwest." American Journal Of Agricultural Economics 63(1): 83-92.
193
Busemann, C. and E. Heusinger (1999). "Ernährungssicherung durch ökologischen Landbau?" Ökologie und Landbau(110): 28-31.
Buys, J. (1993). "Conversion Towards Organic Agriculture In Russia - A Preliminary Study." Biological Agriculture & Horticulture 10(2): 125-140.
Bystrom, O. (1998). "The nitrogen abatement cost in wetlands." Ecological Economics 26(3): 321.
Campagnolo, E. R., S. Kasten, et al. (2002). "Accidental ammonia exposure to county fair show livestock due to contaminated drinking water." Veterinary And Human Toxicology 44(5): 282-285.
Campbell, C. A., R. P. Zentner, et al. (2000). "Organic C accumulation in soil over 30 years in semiarid southwestern Saskatchewan - Effect of crop rotations and fertilizers." Canadian Journal Of Soil Science 80(1): 179-192.
Capros, P. and L. Mantzos (2000). "Kyoto and technology at the European Union: costs of emission reduction under flexibility mechanisms and technology progress." International Journal of Global Energy Issues 14: 169-183.
Carpenter, S. R. (2002). "P Soup: It's green, but it's not good for you." World Watch 3(1).
Carson, R. T. (2000). "Contingent Valuation: A User's Guide." Environ. Sci. Technol. 34(8): 1413 -1418.
Carter, T. A. and R. E. Sneed (1987). Poultry Science and Technology Guide. PS&T No. 42. Extension Poultry Science Publication. Raleigh, North Carolina State University.
CCPC (2004). National Implementation Plan for the Stockholm Convention. Zagreb, Croatian Cleaner Production Centre.
Cerhan, J. R., P. J. Weyer, et al. (2001). "Association of nitrate levels in municipal drinking water and diet with risk of coronary heart disease mortality: The Iowa women's health study." Epidemiology 12(4): S84-S84.
Chapagain, A. K. and A. Y. Hoekstra (2003). Virtual water trade: a quantification of virtual water flows between nations in relation to international trade of livestock and livestock products. Virtual water trade, Delft, IHE Delft.
Choe, K., D. Whittington, et al. (1994). "The economic benefits of surface water quality improvements in developing countries: a case study of Davao, Philippines." Land Economics 72(4): 519-537.
Chromos Agro (2003). Skraćeni prospekt uvrštenja u Kotaciju javnih dioničkih društava Chromos Agro d.d. [Shortened brochure for the inclusion of Chromos Agro PLC in the public shareholder companies list].
Cole, C. V. (1996). Agricultural options for mitigation of greenhouse gas emissions. Climate Change 1995: Impacts, Adaptation and Mitigation of Climate Change: Scientific Technical Analyses. IPCC. Cambrige, Cambridge University Press: 745-771.
Conway, G. R. and J. N. Pretty (1991). Unwelcome Harvest: Agriculture and Pollution. London, Earthscan.
Criss, R. E. and M. L. Davisson (2004). "Fertilizers, water quality, and human health." Environmental Health Perspectives 112(10): A536-A536.
Crnogorac, M. (2004). Central Bureau of Statistics. Crnogorac, M. (2005). Central Bureau of Statistics. Crnogorac, M. (2005). Pozicije za obračun bruto domaćeg proizvoda iz Godišnjeg
financijskog izvještaja za velike, srednje velike i male poduzetnike [Methodology
194
for calculating GDP from Annual financial reports of small, medium and large businesses], Central Bureau of Statistics, Zagreb.
Crosson, P. (1997). "Soil erosion." Environment 39(10): 5-5. Černjul, Z. (2004). Croatian Association of Plant Protection Manufacturers and
Distributors. Čičko, A. (2005). E-mail from March the 18th, 2005, with c.c. to Vujec Nataša. Čoga, L., Ž. Vidaček, et al. (1998). Cadmium and lead in the system drained soil -
plant - water in the Drava and Danube catchment area. 16th World Congress of Soil Science. Summaries, Vol. I, Montpellier, France.
Čović, K. (2004). Chromos d.o.o. Čović, K. (2004). HRT 1, Plodovi zemlje, 25.01.2004. Čulo, A. (2005). Ministry of Agriculture, Forestry and Water Management. Zagreb. Čuljak, L. (2005). Croatian Agricultural State Extension Service. Ćosić Flajsig, G. and M. Lukšić (2003). "Implementation of measures for water
protection against agricultural impacts- today and tomorrow." Hrvatske vode: časopis za vodno gospodarstvo Vol. 11(45): 45:427-432.
Dab, W., S. M. P. Quenel, et al. (1996). "Short term respiratory health effects of ambient air pollution results of the APHEA project in Paris." In. (suppl 1), J Epidem Comm Health 50.
Dabbert, S. (1990). Zur optimalen Organisation alternativer landwirtschaftlicher Betriebe- untersucht am Beispiel organisch-biologischer Haupterwerbsbetriebe in Baden-Württemberg. Stuttgart, PhD. thesis. University of Hohenheim.
Dabbert, S. and A. Priorr (1998). Ökologischer Landbau. Handbuch zum Gewässerschutz in der Landwirtschaft. H. Frede and S. Dabbert. Landberg, Ecomed: 280-296.
David, C., B. Fabre, et al. (1996). Towards modelling the conversion of stockless farming to organic farming. On-farm research in South East of France. In New Research in Organic Agriculture. N. H. Kristensen and H. Høgh-Jensen, pp. 23-27. Tholey-Theley., IFOAM: 23-27.
Davidson, E. A. and I.L. Ackerman (1993). Changes in soil carbon inventories following cultivation of previously untilled soils. Biogeochemistry. 20: 161-193.
Davidson, M. D., A. H. Hof, et al. (2002). Update schaduwprijzen: Financiële waardering van milieuemissies op basis van Nederlandse overheidsdoelen [Updated shadow prices: financial rating of environmental emissions on the bassis of Netherlands government targets], CE, Delft.
DEFRA (2002). The Government's Strategic Review of diffuse water pollution from agriculture in England. Paper 1: Agriculture and water: a diffuse pollution review. London, Department for Food, Environment and Rural Affairs.
DEFRA (2002). Minimising Water Pollution: Farm Waste and Manures. London, Department for Food, Environment and Rural Affairs.
DEFRA (2005). Agricultural land use: 1986-2003. London, Department for Food, Environment and Rural Affairs.
Delgado, J. A. (2002). "Principles for managing nitrogen leaching." Journal of Soil and Water Conservation 11(1): 67-75.
Delgado, J. A. (2002). "Quantifying the loss mechanisms of nitrogen." Journal Of Soil And Water Conservation 57(6): 389-398.
195
Delgado, J. A., M. A. Dillon, et al. (2004). "Tracing the fate of N-15 in a small-grain potato rotation to improve accountabitity of nitrogen budgets." Journal Of Soil And Water Conservation 59(6): 271-276.
Derwent, R. G., G. J. Dollard, et al. (1998). "On the nitrogen budget for the United Kingdom and north-west Europe." Quarterly Journal of Royal Meteorological Society 114(114): 1127-1152.
Deur, M. (2004). Ministry of Agriculture, Foresty and Water Management. Devčić, M. (2005). Croatian National Institute of Public Health, Bjelovarsko-Bilogorska
County. Dockery, D. W., F. E. Speizer, et al. (1989). "Effects of inhalable particles on
respiratory health of children." Am Rev Respir Dis 139: 587-594. Domburg, P., A. C. Edwards, et al. (2000). "Assessing nitrogen and phosphorus
efficiency at farm and catchment scale using nutrient budgets." Journal of the Science of Food and Agriculture 80(13): 1946 - 1952.
Dorland, C., H. M. A. Jansen, et al. (1997). ExternE National Implementation: The Netherlands. Draft report, September 1997, Institute for Environmental Studies, Amsterdam.
Drevenkar, V., S. Fingler, et al. (2004). "Levels of atrazine and simazine in waters in the rural and urban areas of north-west Croatia." International Journal Of Environmental Analytical Chemistry 84(1-3): 207-216.
Drevenkar, V., S. Fingler, et al. (2002). Levels of atrazine and simazine in waters in the rural and urban areas in the north-west Croatia. 2nd European Conference on Pesticides and Related Organic Micropollutants in the Environment, Ioannina, Greece.
Droste-Franke, B. (2005). Damage Factors for Croatia, Institute of Energy Economics and the Rational Use of Energy, University of Stuttgart, Stuttgart.
Droste-Franke, B. (2005). Institute of Energy Economics and the Rational Use of Energy, University of Stuttgart.
Droste-Franke, B. and R. Friedrich (2003). Air Pollution. In European Commission: An applied integrated environmental impact assessment framework for the European Union (GREENSENSE), European Commission DG Research, Energy Environment and Sustainable Development Programme, 5th Framework Programme, Brussels.
DUR (2005). Izvješće o državnom proračunu Republike Hrvatske [Report on the state budget of the Republic of Croatia]. Zagreb, Državni ured za reviziju.
Dusseldorp, A., H. Kruize, et al. (1995). "Associations of PM10 and airborne iron with respiratory health of adults near a steel factory." Am J Respir Crit Care Med 152: 1932-1939.
Duxbury, J. M., L. A. Harper, et al. (1993). Contributions of agroecosystems to global climate change. Agroecosystem Effects on Radiatively Important Trace Gases and Global Climate Change. Special Publication no. 55. L. A. Harper, A. R. Mosier, J. M. Duxbury and D. E. Rolston. Madison, WI, Agronomy Society of America: 1-18.
DUZPO (1999). An Overview of the State of Biological and Landscape Diversity in Croatia. Zagreb, State Directorate for Environmental and Nature Protection.
DZS (1996). Statistical Yearbook 1996. Zagreb, Central Bureau of Statistics. DZS (2002). Agricultural Production in 2001. Zagreb, Central Bureau of Statistics. DZS (2003). Agricultural Census 2003. Zagreb, Central Bureau of Statistics. DZS (2003). Agricultural Production in 2002. Zagreb, Central Bureau of Statistics.
196
DZS (2003). Census of Population, Household and Dwellings of March 31, 2001. Edition from September the 17th 2003. Zagreb, Central Bureau of Statistics.
DZS (2003). Methodology for the Agricultural Census 2003- Instructions. Zagreb, Central Bureau of Statistics.
DZS (2003). Statistical Yearbook 2003. Zagreb, Central Bureau of Statistics. DZS (2004). Agricultural Production in 2003. Zagreb, Central Bureau of Statistics. DZS (2004). Statistical Yearbook 2004. Zagreb, Central Bureau of Statistics. DZS (2005). Data sets on feedstuff production, import and export (provided for the
project purpose). Zagreb, Central Bureau of Statistics. DZS (2005). Data sets on fertiliser and pesticide production, import and export, E-mail
of April 20th. Zagreb, Central Bureau of Statistics. DZS (2005). Transport statistics datasets provided for the purpose of this project.
Zagreb, Central Bureau of Statistics. DZZP (2004). Habitats Mapping of the Republic of Croatia. Zagreb, State Institute for
Nature Protection. EA (2002). Agriculture and Natural Resources: Benefits, Costs and Potential
Solutions. Bristol, Economic Policy Unit, Environment Agency. EC (1995). ExternE- Externalities of Energy. Volume 2: Methodology. JOULE project
EUR 16521, 1995, European Commission, DG XII, Science, Research and Development, Brussels.
EC (1999). ExternE- Externalities of Energy. Volume 7: Methodology 1998 update. JOULE project EUR 19083, 1999, European Commission, DG XII, Science, Research and Development, Brussels.
EC (2001). Towards Environmental Pressure Indicators for the EU. Brussels, European Commission.
EC (2003). An applied integrated environmental impact assessment framework for the European Union (GREENSENSE), European Commission DG Research, Energy Environment and Sustainable Development Programme, 5th Framework Programme, Brussels.
EC (2004). European Commission Country Strategy Paper for Croatia 2002-2006, Cards. Brusseles, European Commision.
EC (2004). European Union Energy & Transport in Figures 2004. Brussels, European Commission Directorate-General for Energy and Transport: 254.
EC (2004). Opinion on Croatia's Application for Membership of the European Union. COM(2004) 257 final, 20 April 2004. Brussels, European Commission.
EC (2004). Regulation (EC) No 138/2004 of the European Parliament and of the Council of 5 December 2003 on the economic accounts for agriculture in the Community, Official Journal of the European Union, L33/1 from 5th of February 2004.
ECAF (2000). Conservation Agriculture in Europe, European Conservation Agriculture Conservation: 18.
ECCP (2001). European Climate Change Programme (ECCP). Working Group 7 Agriculture. Mitigation potential of Greenhouse Gases in the Agricultural Sector.
ECE (1992). Protection of Inland Waters Against Eutrophication. United Nations Economic Commission for Europe, Paper # ECE/ENVWA/26, Geneva.
EEA (1998). Europe´s Environment: The Second Assessment. European Environment Agency. London, Elsevier Science.
197
EEA (1999). State and pressures of the marine and coastal Mediterranean environment. Environmental issues series No.5. Copenhagen, European Environment Agency: 137.
EEA (2000). Environmental Signals 2000. Environmental Assessment Report No.6. Copenhagen, European Environment Agency.
EEA (2004). EMEP/CORINAIR Emission Inventory Guidebook - 2004. Technical report No 30. Copenhagen, European Environment Agency.
EFMA (2001). BAP publications. Paris, European Fertilsier Manfactures Association. EFMA (2004). Press release from May the 24th, 2004. Paris, European Fertilsier
Manfactures Association. Ejaz, S., W. Akram, et al. (2004). "Endocrine disrupting pesticides: A leading cause of
cancer among rural people in Pakistan." Experimental Oncology 26(2): 98-105. EKONERG (2005). National Inventory report of anthropogenic emissions by sources
and removals by sinks of all greenhouse gases not controlled by the Montreal protocol for the period 1990-2003, Ekonerg, Zagreb.
EPA (1987). Nitrate/nitrite health advisory. Washington, DC, U.S. Environmental Protection Agency: 18.
EPA (1998). National Water Quality Inventory: Report to Congress Office of Water 841-F-97-003. Washington, DC, United States Environmental Protection Agency.
EPA (2002). National Management Measures to Control Nonpoint Source Pollution from Agriculture. Washington, DC, US Environmental Protection Agency, Office of Wetlands, Oceans, and Watersheds.
Eroglu, V., H. Z. Sarikaya, et al. (2001). "Planning of wastewater treatment and disposal systems of Istanbul metropolitan area." Water Science & Technology 44(2-3): 31-38.
Eskiocak, S., C. Dundar, et al. (2005). "The effects of taking chronic nitrate by drinking water on thyroid functions and morphology." Clinical And Experimental Medicine 5(2): 66-71.
EUROSTAT (2003). The Use of Plant Protection Products in the European Union. Luxembourg, Statistical Office of the European Communities. Office for Official Publications of the European Communities.
EUROSTAT (2004). Gas prices for EU industry on 1 July 2004. Luxembourg, Office for Official Publications of the European Communities: 12.
EUROSTAT (2004). The Manual on the Economic Accounts for Agriculture and Forestry EAA/EAF 97. Last update September 2004, EUROSTAT, Luxemburg.
Evans, H., T. Jevel, et al. (1992). Green Fields, Grey Future: EC Agricultural Policy at the Crossroads. Amsterdam, Greenpeace International.
Evomarkets (2005). SO2 market data. ExternE (2005). ExternE- Externalities on Energy. A research project of the European
Commission. Eyre, N., T. Downing, et al. (1997). Global Warming Damages. ExternE Global
Warming Sub-Task, Final Report, European Commission JOS3-CT95-0002, Brussels.
Fahl, U., E. Läge, et al., Eds. (1999). E3Net: Forum für Energiemodelle und Energiewirtschaftliche Systemanalysen in Deutschland. Heidelberg, Physica-Verlag.
FAO (2003). FAOSTAT agriculture data.
198
FAO (2004). Economic valuation of water resources in agriculture: from the sectoral to a functional perspective of natural resource management. FAO Water Reports 27, FAO- Food and Agriculture Organisation of the United Nations, Rome.
FAO (2004). A strategy for rural development in Croatia (2004-2010). Rome, Food And Agriculture Organisation of the United Nations.
FAO (2005). FAOSTAT agriculture data. FAO (2005). Rport on organic farming inspection and certification for Croatia. Rome,
Food And Agriculture Organisation of the United Nations. FAO/MPŠVG (2004). Strategy for development of organic farming in Croatia,
FAO/MPŠVG. Fesbach, M. and O. Friendly (1992). Ecocide in the USSR. London, Aurum Press. Fijan Parlov, S. (2005). Ekonerg d.o.o. FINA (2005). Financial datasets (provided on several occasions following requests of
the project team). Zagreb, Financial Agency. Follett, J. R. and R. F. Follett (2001). Utilization and metabolism of nitrogen by
humans. Nitrogen in the environment: Sources, Problems and Management. R. F. Follett and J. L. Hartfield. Amsterdam, Elsevier: 65-92.
Forster, D., P. Watkiss, et al. (2003). Water Pollution. In European Commission: An applied integrated environmental impact assessment framework for the European Union (GREENSENSE), European Commission DG Research, Energy Environment and Sustainable Development Programme, 5th Framework Programme, Brussels.
Foster, V., S. Mourato, et al. (1998). Incorporating external impacts in pest management choices. Bugs in the System: Redesigning the Pesticide Industry for Sustainable Agriculture. W. Vorley and D. Keeney. London, Earthscan: 94-106.
Francisković-Bilinski, S., H. Bilinski, et al. (2005). "Organic pollutants in stream sediments of Kupa River drainage basin." Fresenius Environmental Bulletin 14(4): 282-290.
Franić, R. (2003). Review of Agricultural Water Pollution Control Policy and Practice in the Danube River Basin. Policy review questionnaire for Croatia for the IPCDR project No. 01/G32. Zagreb, Faculty of Agriculture: 26.
Franić, R. (2005). Faculty of Agriculture, University of Zagreb. Freibauer, A., M. D. A. Rounsevell, et al. (2004). "Carbon sequestration in the
agricultural soils of Europe." Geoderma 122(1): 1-23. Friedrich, R. and P. Bickel, Eds. (2001). Environmental cost of transport, Springer-
Verlag, Berlin. Funes, F., L. García, et al. (2002). Sustainable Agriculture and Resistance:
Transforming Food Production in Cuba. Havana, First Books/ACTAF/CEAS. Garnett, T. (2003). Wise moves: Exploring the relationship between food, road
transport and CO2. London, Transport2000. Gast, R. G., W. W. Nelson, et al. (1978). "Nitrate accumulation in soils and loss in tile
drainage following nitrogen application to continuous corn." Journal of Environmental Quality 7: 258-261.
Gelo, R. (2005). Croatian Chamber of Economy. Gies, A. (2003). "Government view of endocrine disruption in wildlife." Pure And
Applied Chemistry 75(11-12): 2563-2574. Glasnik Zagrebačke županije (2004). Proračun Zagrebačke županije za 2005. godinu
[Zagrebačka-County budget for 2005], Glasnik Zagrebačke županije, broj 23.
199
Goderya, F. S., M. F. Dahab, et al. (1996). "Incorporation of spatial variability in modeling non-point source groundwater nitrate pollution." Water Science and Technology. 33(4-5): 233-240.
Goewie, E. A. (2002). "Organic agriculture in the Netherlands; developments and challenges." Netherlands Journal Of Agricultural Science 50(2): 153-169.
González-Fernández, P. (1997). Effect of soil tillage on organic matter and chemical properties. Conservation agriculture: agronomic, environmental and economic bases (in Spanish), Córdoba, Spain, Spanish Association for Conservation Agriculture (AEAC/SV).
Gorenflo, A., D. Velazquez-Padron, et al. (2003). "Nanofiltration of a German groundwater of high hardness and NOM content: performance and costs." Desalination 151(3): 253-265.
Gorjanski, D. (2005). Association for combating allergic diseases Osijek. Gorša, D. (2005). Independent veterinary consultant. Goulding, K. (2004). Minimising losses of nitrogen from UK agriculture. Annual
Scientific Lecture held at 11th February 2004 at the Royal Agricultural Society of England.
Goulding, K. W. T. (2000). "Nitrate leaching from arable and horticultural land." Soil Use & Management 16 (Supplement): 145-151.
Grad Zagreb (2003). Proračun Grada Zagreba za 2003. godinu [City of Zagreb budget 2003]. Zagreb, City of Zagreb.
Grandy, A. S., G. A. Porter, et al. (2002). "Organic amendment and rotation crop effects on the recovery of soil organic matter and aggregation in potato cropping systems." Soil Science Society Of America Journal 66(4): 1311-1319.
Granić, G. (2005). Energy Institute Hrvoje Požar and former vice-prime minister. Granlund, K., A. Raike, et al. (2005). "Assessment of water protection targets for
agricultural nutrient loading in Finland." Journal Of Hydrology 304(1-4): 251-260. Grbeša, D. (2005). Faculty of Agriculture, University of Zagreb. Gregorich, E. G., C. F. Drury, et al. (2001). "Changes in soil carbon under long-term
maize in monoculture and legume-based rotation." Canadian Journal Of Soil Science 81(1): 21-31.
Gren, I. M., K. H. Groth, et al. (1995). "Economic Values Of Danube Floodplains." Journal Of Environmental Management 45(4): 333-345.
Grgić, Z. (2002). Agroekonomska ocjena razvitka poljoprivredne proizvodnje do 2020 [Agro-economic Assessment of Agricultural Production Development by 2020]. In: Mesić, M., Bašić, F., Grgić, Z., Igrc-Barčić., J., Kisić, I., Petošić, D., Posavi, M., Romić, D., Šimunić, I. (eds.). Procijena stanja, uzroka i veličine pritisaka poljoprivrede na vodne resurse i more na području Republike Hrvatske [Assessment of the Situation, Causes and Magnitude of Agricultural Environmental Pressure on Water Resources and Sea in the Republic of Croatia]. Zagreb, Agronomski fakultet.
Grgić, Z. (2005). Faculty of Agriculture, University of Zagreb. Grgić, Z., R. Franić, et al. (1999). Country Report on the Present Environmental
Situation in Agriculture- Croatia. Rome, Food and Agriculture Organisation of the United Nations.
Grgić, Z. and M. Mesić (2001). Land use, soil degradation and water pollution in farming systems in Croatia. Report for the EU 5th Framework Programme project
200
Sustainable Agriculture in Central and Eastern European Countries (CEESA). Contract No. QLK5-1999-01611.
Grgić, Z., M. Mesić, et al. (2002). Excessive nitrogen use and leakage of nitrates in Croatian farming systems. Farming and Rural Systems Research and Extension, Local Identities and Globalisation. Florence.
Grgurić, V. (2004). HRT 1, Plodovi zemlje, 25.01.2004. Gulis, G., M. Czompolyova, et al. (2002). "An ecologic study of nitrate in municipal
drinking water and cancer incidence in Trnava District, Slovakia." Environmental Research 88(3): 182-187.
Gunatilake, H. M. and G. R. Vieth (2000). "Estimation of on-site cost of soil erosion: A comparison of replacement and productivity change methods." Journal Of Soil And Water Conservation 55(2): 197-204.
Gupta, S. K., R. C. Gupta, et al. (2000). "Recurrent acute respiratory tract infections in areas with high nitrate concentrations in drinking water." Environmental Health Perspectives 108(4): 363-366.
Habets, F. (1999). FARM: farm balances software for mixed farms. Wageningen, Department of Ecological Agriculture, Wageningen Agricultural University.
Haist-Gulde, B., G. Baldauf, et al. (1993). "Removal of pesticides from raw waters." Water Supply 11(187-196): 1.
Halberg, N. and I. S. Kristensen (1997). "Expected crop yield loss when converting to organic dairy farming in Denmark." Biological Agriculture & Horticulture 14(1): 25-41.
Halsnaes, K. (2004). IPCC Conclusions on on Mitigation Policies- The Challenge for for Energy Sector Development. Geneva, UNEP Collaborating Centre on Energy and Environment.
Hanley, N. (1991). The economics of nitrate pollution control in the UK. Farming and the Countryside: An Economic Analysis of External Costs and Benefits. N. Hanley. Reading, CABI: 91-116.
Hansen, B., H. F. Alroe, et al. (2001). "Approaches to assess the environmental impact of organic farming with particular regard to Denmark." Agriculture Ecosystems & Environment 83(1-2): 11-26.
Hartridge, O. and D. Pearce (2001). Is UK Agriculture Sustainable? Environmentally Adjusted Economic Accounts for UK Agriculture. London, CSERGE, University College.
Haskoning (1994). Danube Integrated Environmental Study. Final Report of the EU-PHARE Environmental Programme for the Danube Basin. Nijmegen, Haskoning Royal Dutch Consulting Engineers and Architects, Nijmegen: 176.
HDBZ (2001). Pregled sredstava za zaštitu bilja u Republici Hrvatskoj [Overview of the plant protection agents in the Republic of Croatia]. Glasilo biljne zaštite. Zagreb. I: 123-238.
HDBZ (2004). Pregled sredstava za zaštitu bilja u Republici Hrvatskoj [Overview of the plant protection agents in the Republic of Croatia]. Glasilo biljne zaštite. Zagreb. IV: 73-212.
Hedl, D. (2001). The Collapse of Croatian Agriculture, Alternativna Informativna Mreža, December the 7th, 2001.
HEP (2003). HEP and Environment 2001-2002, Hrvatska elektroprivreda, Zagreb.
201
Herbos (2003). Skraćeni prospekt za uvrštenje u kotaciju javnih dioničkih društava [Shortened brochure for the inclusion in the public shareholders stock exchange list]. Sisak, Herbos d.d.
Heren Energy (2004). European Gas Marktes 2004, Heren Energy. Hermanowski, R. and K. A (1997). Wasserschutz durch Ökologischen Landbau,
Leitfaden für die Landwirtschaft, AGÖL and BUND, Darmstadt/Bonn. HGK (2004). Croatian companies register. Zagreb, Croatian Chamber of Economy. HINA (2002). INA i kutinska Petrokemija potpisali ugovor o isporuci plina [INA and
Petrokemija from Kutina signed a contract on gas supply]. HNB (2005). Zagreb, Croatian National Bank. Hoekstra, A. Y. (2003). Virtual water: An introduction. Virtual water trade, Delft, IHE
Delft. Holland, M., D. Forster, et al. (1999). Economic Evaluation of Proposals for Emission
Ceilings for Atmospheric Pollutants (Interim report for DG X1 of the European Com-
mission). Culham, Oxon, AEA Technology. Holland, M. and P. Watkiss (2002). BeTa Version E1.02a. Benefits Table database:
estimates of the marginal external costs of air pollution in Europe, Netcen. Horold, S., T. Tacke, et al. (1993). "Catalytic removal of nitrate and nitrite from drinking
water." Environmental Technology 14(10): 931-939. Horst, M. (2004). Croatian Centre for Greener Production. Horvat, A. J. M., M. Kaštelan-Macan, et al. (2003). "Study of MCPA and MCPP
herbicides mobility in soils from North- West Croatia as affected by presence of fertilizers." Journal Of Environmental Science And Health Part B-Pesticides Food Contaminants And Agricultural Wastes 38(3): 305-316.
HRI (2002). Mass balance of nitrogen in the UK: Section A- Agriculture, Hunting & Forestry. Warwick, Horticulture Research International.
Hrvatske autoceste (2005). E-mail message of March 15, 2005. Hrvatske ceste (2005). Letter from March 21, 2005. Hrvatske šume (2005). Letter sent on on 4th April, 2005. Hrvatske vode (2002). Izvještaj o ispitivanju kakvoće voda u Republici Hrvatskoj u
2001. godini [Report on the analysis of water quality in the Republic of Croatia in 2001]. Zagreb, Hrvatske vode.
Hrvatske vode (2002). Sažetak izvještaja o ispitivanju kakvoće voda u Republici Hrvatskoj u 2000. godini [Summary report on the analysis of water quality in the Republic of Croatia in 2000]. Zagreb, Hrvatske vode.
Hrvatske vode (2003). Sažetak izvještaja o ispitivanju kakvoće voda u Republici Hrvatskoj u 2002. godini [Summary report on the analysis of water quality in the Republic of Croatia in 2002]. Zagreb, Hrvatske vode.
Hrvatske vode (2004). Sažetak izvještaja o ispitivanju kakvoće voda u Republici Hrvatskoj u 2003. godini [Summary report on the analysis of water quality in the Republic of Croatia in 2003]. Zagreb, Htrvatske vode.
Hrvatsko tloznanstveno društvo (2004). Letter sent to MPŠVG on., Hrvatsko tloznanstveno društvo, Zagreb.
HSP (2003). Press conference held in Hvar on January the 7th, Croatian Legal Party. Hurley, F. (2004). Recommendation on Exposure-Response Functions used for the
EC NewExt project (Contract ENG1-CT2000-00129).
202
Husnjak, S. (2005). Faculty of Agriculture, University of Zagreb. Husnjak, S., M. Bogunović, et al. (2000). "Istraživanje rizika od erozije tla vodom u
Hrvatskoj- II faza: Potencijalni i stvarni rizik [Research on Water Soil Erosion Risk in Croatia, Phase II- Potential and Actual Risk]." Hrvatske vode 34.
Husnjak, S., M. Bogunović, et al. (2000). Procijena rizika erozije tla vodom metodom kartiranja u Hrvatskoj [Assessment of hte Soil Erosion Risk in Croatia Using Mapping Method]. PhD. dissertation. Zagreb, Faculty of Agriculture, University of Zagreb.
Huxham, S. K., D. L. Sparkes, et al. (2005). "The effect of conversion strategy on the yield of the first organic crop." Agriculture Ecosystems & Environment 106(4): 345-357.
HZJZ (2002). Croatian Health Service Yearbook 2001. Zagreb, Hrvatski zavod za javno zdravstvo.
HZJZ (2003). Croatian Health Service Yearbook 2002. Zagreb, Hrvatski zavod za javno zdravstvo.
HZJZ (2004). Croatian Health Service Yearbook 2003. Zagreb, Hrvatski zavod za javno zdravstvo.
HZJZ (2005). Letter sent on the 15th of March, 2005. Zagreb, Hrvatski zavod za javno zdravstvo.
HZPSS (2003). Katalog kalkulacija poljoprivredne proizvodnje [Catalogue of agricultural production calculations]. Zagreb, Hrvatski zavod za poljoprivrednu savjetodavnu službu.
HŽ (2001). Ekološke prednosti željeznice [Environmental advantages of railways], HŽ- Hrvatske željeznice, Zagreb.
HŽ (2002). Ekološke prednosti željeznice [Environmental advantages of railways], HŽ- Hrvatske željeznice, Zagreb.
HŽ (2005). Data sets on goods transported provided for the purpose of the project, HŽ- Hrvatske željeznice, Zagreb.
ICID (2001). Country Report Croatia. New Delhi, International Commission on Irrigation and Drainage.
IER (2004). Ecosense 4.0. User's Manual, Institute of Energy Economics and the Rational Use of Energy, University of Stuttgart, Stuttgart.
IER (2004). Externe methodology report, Institute of Energy Economics and the Rational Use of Energy, University of Stuttgart, Stuttgart.
IER (2005). EcoSense LE, Institute of Energy Economics and the Rational Use of Energy, University of Stuttgart, Stuttgart.
Igrc-Barčić, J. (2002). Korištenje sredstava za zaštitu bilja [The Use of Plant Protection Agents]. In: Mesić, M., Bašić, F., Grgić, Z., Igrc-Barčić., J., Kisić, I., Petošić, D., Posavi, M., Romić, D., Šimunić, I. (eds.). Procijena stanja, uzroka i veličine pritisaka poljoprivrede na vodne resurse i more na području Republike Hrvatske [Assessment of the Situation, Causes and Magnitude of Agricultural Environmental Pressure on Water Resources and Sea in the Republic of Croatia]. Zagreb, Agronomski fakultet.
Igrc-Barčić, J. (2003). Pesticide usage in Croatia. Report for the IPCDR project No. 01/G32. Zagreb, Faculty of Agriculture: 6.
IIASA (2003). Review of the RAINS ammonia module: Country and emission category specific data. Laxenburg, International Institute for Applied Systems Analysis.
INA (2004). Health, safety and environment report 2003, INA- industrija nafte, Zagreb.
203
IPCC (2001). Revised 1996 IPCC Guidelines for National Greenhouse Gas Inventories: Reference Manual. Chapter 4 Agriculture. Paris, Organisation for Co-operation and Development.
IPCC (2001). Revised 1996 IPCC Guidelines for National Greenhouse Gas Inventories: Workbook. Chapter 4 Agriculture. Paris, Organisation for Co-operation and Development.
IPCC (2005). Summary for Policymakers: The Economic and Social Dimensions of Climate Change -IPCC Working Group III.
IRB (2004). Letak o cvjetanju mora [Leaflet on Algal Bloom]. Rovinj, Centar za istraživanje mora, Institut "Ruđer Bošković".
IRB (2004). Pojava cvjetanja mora: drugo izvješće 22.-28. lipnja, 2004 [Algal Bloom Occurence: Second Report, June 22-28, 2004]. Rovinj, Centar za istraživanje mora, Institut "Ruđer Bošković".
IRB (2004). Pojava cvjetanja mora: prvo izvješće 11.svibnja- 21 lipnja, 2004 [Algal Bloom Occurence: First Report, May 11- June 21, 2004]. Rovinj, Centar za istraživanje mora, Institut "Ruđer Bošković".
IRB (2004). Pojava cvjetanja mora: treće izvješće 29.06.- 02.07.2004. [Algal Bloom Occurence: Third Report, June 29- July 02, 2004]. Rovinj, Centar za istraživanje mora, Institut "Ruđer Bošković".
Isermann, K. (1990). Stickstoff- und Phosphor-Bilanzierung der Landwirtschaft im Vergleich westeuropäischer Länder. 102. VDLUFA-Kongreß "Landwirtschaft im Spannungsfeld von Belastungsfaktoren und gesellschaftlichen Ansprüchen". Berlin.
Isermann, K. (1994). Stickstoff-Emissionen - Immissionen der Landwirtschaft vor dem Hintergrund ihrer Stickstoffbilanzen. Verminderung des Stickstoffaustrags aus landwirtschaftlich genutzten Flächen in das Grundwasser- Grundlagen und Fallbeispiele. DVWK Schriften 106. Deutscher Verband für Wasserwirtschaft und Kulturbau e.V.: 59-94.
Ivanković, M. (2004). Herbos d.o.o. Janssen, B. H. (1984). "A simple method of calculating decomposition and
accumulation of "young" organic matter." Plant And Soil 76: 297-304. Járai-Komlódi, M. (1998). Ragweed in Hungary- Ten Years Results. 6th International
Congress On Aerobiology. Perugia. Jenkinson, D. S., N. J. Bradbury, et al. (1994). In Long-term Experiments in
Agricultural and Ecological Sciences. R. A. Leigh and A. E. Johnston. Wallingford, UK, CAB International: 117-138.
Jetten, V., G. Govers, et al. (2003). "Erosion models: quality of spatial predictions." Hydrological Processes 17(5): 887-900.
Jurić, Ž. (2005). Ekonerg d.o.o. Jurić, Ž., J. Burek, et al. (2005). "Croatian aspect of emission inventory." WIT
Transactions on Ecology and the Environment Vol. 82: 661-670. Jurić, Ž., J. Burek, et al. (2005). "Croatian aspect of emission inventory." WIT
Transactions on Ecology and the Environment 82: 661-670. Jurišić, Ž. (2005). Ministry of Agriculture, Forestry and Water Management. Karačić, M. (2005). State Treasury, Ministry of Finance. Karoglan Todorović, S. and D. Znaor (2005). Organic farming in Croatia (forthcoming).
Bad Dürkheim, Stiftung Ökologie & Landbau.
204
Karoglan Todorović, S., D. Znaor, et al. (2000). Guidelines for strategic development of organic agriculture in Croatia. Annual conference of Croatian agricultural economists, Hrvatsko agroekonomsko društvo, Zagreb.
Keifer, M., Ed. (1997). Human health effects of pesticides. Occupational Medicine: State of the Art Reviews.
Kieft, H. (1999). Agricultural sustainability in Central and Eastern Europe: Rural Production and Environment. Leusden, ETC Netherlands, Leusden: 67.
Kieft, H. (1999). Strategy and Recommendations for low-input sustainable agriculture on a larger scale in the Danube River Basin. Final report of the Phare project EU 301/91, ETC Netherlands, Leusden.
Kimbrough, R. D. (1990). How toxic is 2,3,7,8- tetrachlorodibenzodioxin to humans? Journal of Toxicology and Environmental Health. 30: 261-271.
Kishi, M. (2005). The health impact of pesticides: what do we know? The pesticide detox: towards a more sustainable agriculture. J. Pretty. London, Earthscan Publications Ltd.: 23-38.
Kisić, I., F. Bašić, et al. (2001). Soil Damages in Croatia and the Actual Problems in its Protection. Assessment of the Quality of Contaminated Soils and Sites in Central and Eastern European Countries (CEEC) and New Independent States (NIS), Sofia, Institute for Sustainable Development, 2002.
Kisić, I., F. Bašić, et al. (2002). Oštećenja tla i aktualni problemi u njihovoj zaštiti [Soil degradation and protection related problems]. Assessment of the Quality of Contaminated Soils and Sites in Central and Eastern European Countries (CEEC) and New Independent States (NIS), Sofia.
Kisić, I., F. Bašić, et al. (2004). The soil redistribution by different tillage systems. III. Alps-Adria Scientific Workshop, Dubrovnik, Akaprint.
Kisić, I., F. Bašić, et al. (2003). Erozija tla vodom pri različitim načinima obrade tla (Soil erosion under different tillage systems). 38. znanstveni skup hrvatskih agronoma, Opatija, Agronomski fakultet.
Kisić, I., F. Bašić, et al. (2003). Influence of Soil Tillage on the Characteristics of Erosional Drift. 16 Triennial Conference - Soil Management for Sustainability, Brisbane, Australia, International Soil Tillage Research Organisation.
Kisić, I., F. Bašić, et al. (2003). Procjena erozije tla vodom prema vodnim slivovima Republike Hrvatske (Estimation of Soil Erosion by Water in River Basins of Republic Croatia). Hrvatske vode u 21. stoljeću, 3. hrvatska konferencija o vodama, Osijek, Hrvatske vode.
Kisić, I., F. Bašić, et al. (2003). Erozija tla vodom pri različitim načinima obrade. Soil in the Environment, Krakow, Polish Soil Science Society.
Kisić, I., F. Bašić, et al. (2004). Tillage erosion under different tillage systems. 4th International Congress of the European Society for Soil Conservation, Budapest, Hungarian Academy of Sciences.
Kisić, I., F. Bašić, et al. (2002). "Chemical properties of eroded soil material." Journal Of Agronomy And Crop Science 188(5): 323-334.
Kisić, I., F. Bašić, et al. (2002). "Soil erosion under different tillage methods in Central Croatia." Bodenkultur 53(4): 199-206.
Kiso, Y., Y. Nishimura, et al. (2000). "Rejection properties of non-phenylic pesticides with nanofiltration membranes." Journal of Membrane Science 171: 229-237.
Kiš, J. (2005). Central Bureau of Statistics.
205
Klaassen, C. D., M. O. Amdur, et al., Eds. (1986). Casarett and Doulls Toxicology. New York, Macmillan Publishing Co.
Klačić, Ž., D. Petošić, et al. (1998). "Ispiranje dušika pri različitim sustavima cijevne drenaže [Nitrogen leaching from different drainage systems]." Poljoprivredna znanstvena smotra 63: 4:331-338.
Klimont, Z. and C. Brink (2004). Modelling of Emissions of Air Pollutants and Greenhouse Gases from Agricultural Sources in Europe. Laxenburg, International Institute for Applied Systems Analysis.
Klopček, N. (2005). E-mail communication from 05.01.2005. Knapp, M. F. (2005). "Diffuse pollution threats to groundwater: a UK water company
perspective." Quarterly Journal Of Engineering Geology And Hydrogeology 38: 39-51.
Knobeloch, L., B. Salna, et al. (2000). "Blue babies and nitrate-contaminated well water." Environmental Health Perspectives 108(7): 675-678.
Knowler, D. J. (2004). "The economics of soil productivity: Local, national and global perspectives." Land Degradation & Development 15(6): 543-561.
Knjaz, V. (2005). Croatian Chamber of Economy. Koepf, H. H. (1983). Comparison Between Farming Systems. In: Dlouhy J., and
Nilsson G. (eds.), Swedish University of Agricultural Sciences, Report No. 124 Upsalla.
Kolbe, H. (2002). Wasserbelastung in Abhängigkeit von der Landnutzung. Ökologie und Landbau. 122: 34-35.
Kontogianni, A., I. H. Langford, et al. (2003). "Social preferences for improving water quality: An economic analysis of benefits from wastewater treatment." Water Resources Management 17(5): 317-336.
Košutić, K., L. Furač, et al. (2005). "Removal of arsenic and pesticides from drinking water by nanofiltration membranes." Separation And Purification Technology 42(2): 137-144.
Kovačević, V. (1993). "Phosphorus And Potassium-Deficiency In Soybeans On Gleysol Of Croatia." Rostlinna Vyroba 39(4): 345-352.
Koyuncu, I., D. Topacik, et al. (2001). Application of the membrane technology to control ammonia in surface water. 6. International Conference of the IAWQ-IWSA Particle Separation Specialist Group, Durban.
Kramer, R. A. and J. I. Eisen-Hecht (2002). "Estimating the economic value of water quality protection in the Catawba River basin." Water Resources Research 38(9): art. no.-1182.
Kratochvil, R. (2002). The Contribution of Organic Agriculture for Ground and Drinking Water Conservation- Background Paper. OECD Workshop on Organic Agriculture. Washington D.C., USA.
Kratochvil, R., T. Lindenthal, et al. (1999). Versuch der monetären Bewertung ökologischer Leistungen des Biologischen Landbaus im Bereich Grund- und Trinkwasser am Beispiel des Einzugsgebietes der Fernwasserversorgung Mühlviertel/OÖ. Beiträge zur 5. Wissenschaftstagung zum Ökologischen Landbau, Berlin, Köster.
Kreiger, R., Ed. (2001). Handbook of Pesticide Toxicology. San Diego, Academic Press.
Krištek, A., S. Brkić, et al. (2002). "Nutritional unbalances of soils using for sugarbeet growing in Croatia." Listy Cukrovarnicke A Reparske 118(5-6): 129-130.
206
Kronvang, B., R. Grant, et al. (2002). Quantifying sediment and nutrient pathways within Danish agricultural catchments. Agriculture, Hydrology and Water Quality. P. M. Haygarth and S. Jarvis, CAB International: 281-301.
Kronvang, B., E. Jeppesen, et al. (2005). "Nutrient pressures and ecological responses to nutrient loading reductions in Danish streams, lakes and coastal waters." Journal Of Hydrology 304(1-4): 274-288.
Krug, A. (1997). Vorstellung des AGÖL/BUND-Wasserprojektes. In: Grundwasserschutz und Landwirtschaft in Hessen. Zusammenfassung der Vorträge zur Fachtagung des BUNDLandesverbandes Hessen. Mörfelden-Walldorf, BUND.
Krupnick, A. J., W. Harrington, et al. (1990). "Ambient ozone and acute health effects: Evidence from daily data." J. Environ Econ Manage 18: 1-18.
Kubiček, V. (2005). Ministry of Agriculture, Forestry and Water Management. Kufrin, J. (2004). L’Hirondel, J. and J. L. L’Hirondel (2002). Nitrate and Man; Toxic, Harmless or
Beneficial. Wallingford/New York, CABI Publishing. Lal, R. (2003). "Global potential of soil carbon sequestration to mitigate the
greenhouse effect." Critical Reviews In Plant Sciences 22(2): 151-184. Lal, R. (2003). "Offsetting global CO2 emissions by restoration of degraded soils and
intensification of world agriculture and forestry." Land Degradation & Development 14(3): 309-322.
Lal, R. (2004). "Soil carbon sequestration impacts on global climate change and food security." Science 304(5677): 1623-1627.
Lal, R. (2004). "Soil carbon sequestration to mitigate climate change." Geoderma 123(1-2): 1-22.
Lampkin, N. (1990). Organic Farming. Ipswich, Farming Press Books. Lampkin, N. (1992). The Economic Implications of Conversion from Conventional to
Organic Farming Systems, PhD thesis, Department of Economics and Agricultural Economics, University of Wales, Aberystwyth.
Lampkin, N. (1999). Converting Europe - the potential for organic farming as mainstream. Paper presented to 11th National Organic Farming Conference. Cirencester.
Lang, S. S. (2005). Organic farming produces same corn and soybean yields as conventional farms, but consumes less energy and no pesticides, Cornell University News Service.
Lankoski, J. and M. Ollikainen (1999). "The environmental effectiveness of alternative agri-environmental policy reforms: theoretical and empirical analysis." Agriculture and Food Science in Finland 8: 321-331.
Layers, B. (2001). "N and P grassland cycles under scrutiny." Fertilizer International 1(1): 23-25.
Leach, K. A., K. D. Allingham, et al. (2004). "Nitrogen Management for Profitable Farming with Minimal Environmental Impact: The Challenge for Mixed Farms in the Cotswold Hills, England." International Journal of Agricultural Sustainability 2(1): 21–32.
Ledirac, N., S. Antherieu, et al. (2005). "Effects of organochlorine insecticides on MAP kinase pathways in human HaCaT keratinocytes: Key role of reactive oxygen species." Toxicological Sciences 86(2): 444-452.
207
Legg, J. O. and J. J. Meisinger (1982). Soil nitrogen budgets. Nitrogen in agricultural soils. Agronomy No. 22. F. J. Stevenson. Madison, WI., ASA: 503-566.
Lehmann, B., M. Haefliger, et al. (1997). "Stickstoffemissionsreduktion und volkswirtschaftliche Kosten." Agrarforschung 45: 205-208.
LEI (1990). Productie en afzet van BD- en EKO- produkten [Production end economics of bio-dynamic and organic food], National Agro-Economic Institute of the Netherlands, Band 2. LEI Mededelingen 425, Den Haag, 89 p.
Lemaire, G., B. Terouanne, et al. (2004). "Effect of organochlorine pesticides on human androgen receptor activation in vitro." Toxicology And Applied Pharmacology 196(2): 235-246.
Lockeretz, W. (1989). "Problems in evaluating the economics of ecological agriculture." Agriculture, Ecosystems and Environment 27: 67-75.
Lončar, I. (2004). Committee for Agriculture and Rural Areas, Croatian Parliament. Lord, E. I., S. G. Anthony, et al. (2002). "Agricultural nitrogen balance and water
quality in the UK." Soil Use And Management 18(4): 363-369. Lughofer, S. and R. Kratochvil (1997). Kosten der Grundwasser-Verschmutzung.
WWF-Studie Nr. 30. Wien, World Wild Fund. Ljubetić, V. (2004). E-mail communication from 09.11.2004. MAAF (2000). Towards Sustainable Agriculture— A Pilot Set of Indicators. London,
Ministry of Agricultural Affairs and Food. Maceljski, M. (2004). Letter sent to MPŠVG on., Maceljski, M. Maceljski, M. (2005). Croatian Academy of Science and Arts. Machado, P. (2005). "Soil carbon and the mitigation of global climate change."
Quimica Nova 28(2): 329-334. Mäder, P. (2004). "Soil fertility in sustainable farming systems." KSALT, Journal of the
Royal Swedish Academy of Agriculture and Forestry 143(1): 37-40. Mäder, P., A. Fliessbach, et al. (2002). "Soil fertility and biodiversity in organic
farming." Science 296(5573): 1694-1697. Maene, L. (2004). "How to boost nitrogen use efficiency." Fertilizer International 5(1):
8-10. Marinić, K. (2005). Croatian Railways. Martinez-Casasnovas, J. A., M. C. Ramos, et al. (2005). "On-site effects of
concentrated flow erosion in vineyard fields: some economic implications." Catena 60(2): 129-146.
Martinović, J. (1997). Tloznanstvo u zaštiti okoliša [Soil science in the service of environmental protection]. Zagreb, Pokret prijatelja prirode “Lijepa naša”.
Marušić, J. (2003). "Construction and management of land drainage system in Croatia." Hrvatske vode: časopis za vodno gospodarstvo Vol. 11(45): 45:433-444.
Marušić, J. (2003). Ekonomske posljedice stanja hidromelioracijskih sustava za odvodnju u Hrvatskoj (Economic consequences of the situation in the hydromelioration systems in Croatia). Hrvatske vode u 21. stoljeću, 3. hrvatska konferencija o vodama, Osijek, Hrvatske vode.
Mathews, L. G., F. R. Homans, et al. (2002). "Estimating the benefits of phosphorus pollution reductions: An application in the Minnesota River." Journal Of The American Water Resources Association 38(5): 1217-1223.
Matson, P. A., W. J. Parton, et al. (1997). Science 277: 504-509.
208
McNeil, B. L. and P. F. Pratt (1978). Leaching of nitrate from soils. National conference on management of nitrogen in irrigated agriculture, Sacramento, California, University of California, Riverside, CA.
Međimurske vode (2005). E-mail from the 17th of May. Čakovec, Water company Međimurske vode.
Meeusen, M. J. G., C. J. A. M. d. Bont, et al. (2004). Biologische landbouw in Midden- en Oost-Europa [Organic farming in Central and Eastern Europe]. Projectcode 30089, Augustus 2004, Rapport 5.04.07. Den Haag, LEI, National Agro-Economic Institute of the Netherlands.
Meisinger, J. J. and J. A. Delgado (2002). "Principles for managing nitrogen leaching." Journal Of Soil And Water Conservation 57(6): 485-498.
Mesarić, B. (2003). Quoted in HINA, 2003k. Mesarić, B. (2004). Petrokemija d.d. Mesarić, B. (2005). Letter sent on March 7th, 2005. Mesarić, B. (2005). Petrokemija d.d. Mesić et al. (2000). Quoted in Bašić, 2002. Mesić, M. (2002). Potrošnja gnojiva [Fertiliser Consumption]. In: Mesić, M., Bašić, F.,
Grgić, Z., Igrc-Barčić., J., Kisić, I., Petošić, D., Posavi, M., Romić, D., Šimunić, I. (eds.). Procijena stanja, uzroka i veličine pritisaka poljoprivrede na vodne resurse i more na području Republike Hrvatske [Assessment of the Situation, Causes and Magnitude of Agricultural Environmental Pressure on Water Resources and Sea in the Republic of Croatia]. Zagreb, Agronomski fakultet.
Mesić, M. (2003). Review of Mineral Fertiliser Use in the Danube River Countries. Policy review questionnaire for Croatia for the IPCDR project No. 1/G32. Zagreb, Faculty of Agriculture: 11.
Mesić, M., F. Bašić, et al. (2002). NO3-N leaching with Subsurface Drainage Water in Central Croatia. Prve podoznalecke dni v SR, Visoke Tatre, Slovakia.
Mesić, M., F. Bašić, et al. (2001). Utjecaj gnojidbe mineralnim dušikom na sadržaj nitrata u tlu i na koncentraciju NO3-N u vodi iz lizimetara (Influence of Mineral Nitrogen Fertilization on Nitrate Content in Soil and on NO3-N Lysimeter Concentration). Kako zaštiti vode Hrvatske s gledišta vodoopskrbe i odvodnje. Pula: 381-386.
Mesić, M., F. Bašić, et al. (2002). Gubici NO3-N pod utjecajem različtih količina dušika primijenjenih u gnojidbi (NO3-N losses influenced by different nitrogen rates applied in fertilization). I. Hrvatska konferencija za ekoinženjerstvo, Plitvička Jezera, Hrvatsko društvo kemijskih inženjera i tehnologa.
Mesić, M., F. Bašić, et al. (2003). Utjecaj gnojidbe mineralnim dušikom na sadržaj nitrata u tlu i na koncentraciju NO3-N u vodi iz drenskih cijevi (Influence of Mineral Nitrogen Fertilization on Nitrate Content in Soil and on NO3-N Concentration in Drainpipe Water). 3. Hrvatska konferencija o vodama, zbornik radova.
Mesić, M., F. Bašić, et al. (2003). Nitrate nitrogen leaching at different nitrogen fertilization levels. II Alps-Adria Scientific Workshop, Trogir, Akarprint, Budapest.
Mesić, M., F. Bašić, et al. (2003). Nitrogen leaching with subsurface drainage water. III Novenytemesztesi tudomanyos nap "Szantofoldi novenyek tapanyagellatasa, Godollo, Akaprint.
Mesić, M., F. Bašić, et al. (2005). Losses of Nitrogen with Drainage Water in a Field Trial with Different Nitrogen Rates. Integrated Land and Water Management: Towards Sustainable Rural Development. J. Quast. Slubice, Poland, International Commission on Irrigation and Drainage.
209
Mesić, M., A. Butorac, et al. (2001). Influence of nitrogen fertilisation on NO3-N concentrations in lysimeter water. The Second International Nitrogen Conference, Potomac, Maryland.
Mesić, M., A. Butorac, et al. (1999). Efficiency of mineral nitrogen rates applied in maize fertilisation. 10th Nitrogen Workshop. Copenhagen.
Mesić, M., A. Butorac, et al. (2000). Influence of Black Fallow on Nitrate Leaching. Proceedings of 15th ISTRO Conference, CD, p. 7. Fort Worth, Dallas, USA.
Mesić, M., A. Butorac, et al. (2003). Effect of Nitrogen Fertilization for Oilseed Rape on Nitrogen Leaching with Subsurface Drainage Water. Fertilization in the Third Millenium - Fertilizer, Food Security and Environmental Protection, Bejin.
Mesić, M., G. Ćosić Flajsig, et al. (2003). Pokazatelji onečišćenja vode iz poljoprivrede (Indicators of water pollution from agricultural activities). 3. hrvatska konferencija o vodama: zbornik radova, Osijek, Hrvatske vode.
Mesić, M., M. Prpić, et al. (1994). AssesSment of nitrogen balance for Croatian part of Danube River catchment area. Poljoprivreda i gospodarenje vodama, Bizovačke Toplice.
Mesić, S. (2004). Opening Address at the International Symposium on Introduction of Agri-Environment Programme for Croatia held on February the 24th in Zagreb. Zagreb, Office of the President of the Republic of Croatia.
MF (2002). Državni proračun RH za 2002. godinu po programima, aktivnostima i projektima [State budget for 2002. according to programmes, activities and projects]. Zagreb, Ministry of Finance.
MF (2003). Državni proračun RH za 2003. godinu po programima, aktivnostima i projektima [State budget for 2003. according to programmes, activities and projects]. Zagreb, Ministry of Finance.
Mikšić, M., N. Murguić, et al. (2004). Katalog kalkulacija poljoprivredne proizvodnje [Manual for calculations in agricultural production]. Zagreb, Hrvatski zavod za poljoprivrednu savjetodavnu službu: 186.
Miler, Č. (2005). Water company Ponikve, Krk. Molak, B. (2005). Ministry of Defence. Molak, B. (2005). Plinski vašar [Gas circus]. Molak, B. (2005). Quoted in "Cilj je oguliti građane skupim plinom" [The goal is to
stripp-off citizens through the high gas prices]", Glas Slavonije 11.03.2005. Molak, B. (2005). Quoted in "Građani plaćaju plin i deset puta više od njegove
proizvodne cijene [Citizens pay gas ten times higher than it is its produciton price]", Novi list 04.03.2005.
Moller, P. (2003). Agri-environmental Support Policy. Report made to the World Bank’s Project “Farmers Services Support Policy in Croatia”. Copenhagen., Scanagri.
Montovay, T., M. Assenmacherd, et al. (1996). "Elimination of pesticides from aqueous solution by nanofiltration." Magyar Kemiai Folyoirat 102(5): 241-247.
Morgan, D. P. (1989). Recognition and management of pesticide poisoning. Washington, DC, Health Effects Division, Office of Pesticide Programs. U.S. Environmental Protection Agency: 207.
Morgan, F. (1996). Cited in Summers, 1996. Mosier, A. R., C. Kroeze, et al. (1998). "Closing the global N2O budget: Nitrous oxide
emissions through the agricultural nitrogen cycle." Nutrient Cycling in Agroecosystems 521(2-3): 225-248.
210
MPŠ (1996). Croatian Agriculture at the Crossroads: the Country Position Paper of the Republic of Croatia prepared for the World Summit. Zagreb, Ministry of Agriculture and Forestry.
MPŠ (2000). Proizvodno-potrošne bilance poljoprivrednih proizvoda u Hrvatskoj [Production and consumption balances of of agricultural commodities in Croatia]. Zagreb, Ministry of Agriculture and Forestry.
MPŠ (2003). Godišnje izvješće o stanju poljoprivrede u 2002. godini [Annual agricultural report for 2002]. Zagreb, Ministry of Agriculture and Forestry: 166.
MPŠ (2003). Nacionalani program za poljoprivredu i seoska područja- nacrt [National Programme for Agriculture and Rural Areas- Draft]. Zagreb, Ministry of Agriculture and Forestry.
MPŠVG (2004). Godišnje izvješće o stanju poljoprivrede u 2003. godini [Annual agricultural report for 2003]. Zagreb, Ministry of Agriculture, Forestry and Water Management: 153.
Mueller, B. A., S. S. Nielsen, et al. (2004). "Household water source and the risk of childhood brain tumours: results of the SEARCH International Brain Tumor Study." International Journal Of Epidemiology 33(6): 1209-1216.
Mullen, J. D., G. W. Norton, et al. (1997). "Economic analysis of environmental benefits of integrated pest management." Journal of Agricultural Applied Economics 29(2): 243–254.
Musić, V., L. Pojatina Basta, et al. (2003). Oblikovanje i provedba monitoringa kakvoće voda u Republici Hrvatskoj (Designing and water quality monitoring in the Republic of Croatia). 3. Hrvatska konferencija o vodama, zbornik radova.
Muškardin, S. (2004). Muškardin, S. (2005). MZOPU (2002). Priority Action Plan Projects, January, 2002. PAP No.21, Ministry of
Environment and Spatial Planning, Zagreb. MZOPU (2003). Nacrt izvješća o stanju okoliša 2002 [Draft National Environmental
Protection Report], Ministry of Environmental Protection and Spatial Planning, Zagreb.
MZOPU (2003). Nacrt izvješća o stanju okoliša 2002 [Draft National Environmental Protection Review], Ministry of Environmental Protection and Spatial Planning, Zagreb.
MZOPUG (2004). Emisija onečiščujućih tvari u zrak na području Republike Hrvatske za 2001. godinu [Emissions of air pollutants in the Republic of Croatia in 2001], Ministry of Environment, Spatial Planing and Constructions, Zagreb.
MZOPUG (2004). National Inventory report of anthropogenic emissions by sources and removals by sinks of all greenhouse gases not controlled by the Montreal protocol for the period 1990-2001, Ministry of Environment and Spatial Planning, Zagreb.
MZOPUG (2004). National Inventory report of anthropogenic emissions by sources and removals by sinks of all greenhouse gases not controlled by the Montreal protocol for the period 1990-2002, Ministry of Environment and Spatial Planning, Zagreb.
MZOPUG (2004b). National Inventory report of anthropogenic emissions by sources and removals by sinks of all greenhouse gases not controlled by the Montreal protocol for the period 1990-2002, Ministry of Environment and Spatial Planning, Zagreb.
211
MZOPUG (2005). Environmental Emission Cadastre, Ministry of Environment, Spatial Planing and Constructions, Zagreb.
MZOPUG (2005). Podaci o vrstama i količinama emisija u zrak za razdoblje 1999-2002 [Data on type and quantities of air emissions for the period 1999-2002]. For the project purpose, Ministry of Environment, Spatial Planing and Constructions, Zagreb.
MZSS (2005). Kalendar peludinh alergija [Pollen allergy calendar]. Zagreb, Ministarstvo zdravstva i socijalne skrbi.
N.N. (1996). Uredba o visini stope zatezne kamate [Directive on the late payment interest rate], Official Gazette 76/1996.
N.N. (2002). Uredba o visini stope zatezne kamate [Directive on the late payment interest rate], Official Gazette 72/2002.
N.N. (2002). Zakon o državnoj potpori u poljoprivredi, ribarstvu i šumarstvu [Law on State Support in Agriculture, Fishery and Forestry], Official Gazzette, No. 87.
N.N. (2002). Zakon o posebnom porezu na naftne derivate [Law on special tax for petroleum derivates], Official Gazette, No. 136.
N.N. (2003). Pravilnik of razvrstavanju poslovnih subjekata prema nadionalnoj klasifikaciji djelatnosti, NKD-2002, Official Gazette 123/2003.
N.N. (2003). Zakon o izmjenama i dopunama Zakona o državnoj potpori u poljoprivredi, ribarstvu i šumarstvu [Law on Amendments of the Law on State Support in Agriculture, Fishery and Forestry], Official Gazzette, No. 117.
N.N. (2004). Uredba o jediničnim naknadama, korektivnim koeficijentima i pobližim kriterijima i mjerilima za utvrđivanje naknade na emisiju u okoliš oksida sumpora izraženih kao sumporov dioksid i oksida dušika izraženih kao dušikov dioksid [Directive on charges and corrective coeficients, criteria and measurements for determination of emission charges to the environment of sulphur oxide, expressed as sulpur dioxide and nitrous oxide expressed as nitrous dioxide], Official Gazzette, No. 71.
Nećak, J. (2004). Ministry of Environmental Protection, Spatial Planning and Construction.
Neumeister, L. (2003). Inventory of Agricultural Pesticide Use in the Central and Lower Danube River Countries: Summary Report for the UNDP Danube Regional Project- Project RER/01/G32. Hamburg, GFA Terra Systems.
Niles, J. O., S. Brown, et al. (2002). "Potential carbon mitigation and income in developing countries from changes in use and management of agricultural and forest lands." Philosophical Transactions Of The Royal Society Of London Series A-Mathematical Physical And Engineering Sciences 360(1797): 1621-1639.
Norse, D. (2005). "Non-point pollution from crop production: Global, regional and national issues." Pedosphere 15(4): 499-508.
NRC (1981). The Health Effects of Nitrate, Nitrite, and N-nitroso Compounds. Washington, D.C., National Research Council.
Njavro, M. (2005). Faculty of Agriculture, University of Zagreb. OECD (1986). Water Pollution by Fertilizers and Pesticides. Paris, Organisation for
Economic Co-Operation and Development. OECD (2000). Agri-Environmental Indicators: Water Quality. Paris, Organization for
Economic Co-Operation and Development: 32. OECD (2000). Water quality.
212
OECD (2001). Environmental Indicators for Agriculture, Volume 3 - Methods and Results. Paris, Organisation for Economic Development and Co-operation: 123.
OECD (2001). National soil surface nitrogen balances: explanatory notes. Paris, Organisation of economic Co-operation and Development.
OECD (2005). OECD Nitrogen Balance Database, Paris. http://www.oecd.org/document/29/0,2340,fr_2649_33795_1890205_1_1_1_1,00.html.
Oenema, O. and S. Pietrzak (2002). "Nutrient management in food production: achieving agronomic and environmental targets." Ambio 31(2): 159-168.
Oenema, O., L. van Liere, et al. (2005). "Effects of lowering nitrogen and phosphorus surpluses in agriculture on the quality of groundwater and surface water in the Netherlands." Journal Of Hydrology 304(1-4): 289-301.
Ongley, E. D. (1996). Control of water pollution from agriculture. Rome, Food and Agriculture Organisation of the United Nations.
Ostro, B. D. (1987). "Air pollution and morbidity revisited: A specification test." J Environ Econ Manage 14: 87-98.
Ostro, B. D. and S. Rothschild (1989). "Air pollution and acute respiratory morbidity: An observational study of multiple pollutants." Environ Res 50: 238-247.
Parađiković, N., Z. Milaković, et al. (2002). Organic biological production of sweet pepper (Capsicum Annumm L.). Energy efficiency and agricultural engineering. Rousse.
Parris, K. (1999). OECD agri-environmental indicators: work in progress. Information Paper provided to the Joint ECE/Eurostat Work Session on Methodological Issues of Environment Statistics. Information Paper No.2. Paris, Organization for Economic Co-Operation and Development.
Pearce, D. W., W. R. Cline, et al. (1996). The social costs of climate change. Climate Change 1995. B. et.al. Cambridge, Cambridge University Press.
Perman, J. (2004). Environmental Accounting. Peternel, R. (2005). Croatian Institute of Public Health. Peternel, R., J. Culig, et al. (2005). "Aeropalynologic calendars for inland Croatia
2003." Periodicum Biologorum 107(1): 27-32. Peternel, R., J. Culig, et al. (2003). "Analysis of airborne pollen concentrations in
Zagreb, Croatia, 2002." Annals Of Agricultural And Environmental Medicine 10(1): 107-112.
Peternel, R., J. Culig, et al. (2005). "Variation in ragweed (Ambrosia artemishfolia L.) pollen concentration in central Croatia, 2002-2003." Annals Of Agricultural And Environmental Medicine 12(1): 11-16.
Petraš, J., F. Bašić, et al. (1994). Phenomenology of Water Erosion in Croatia. Conference Proceedings "Agriculture and Water Management", Bizovačke Toplice.
Petrokemija (2002). Zaštita okoliša- izvješće za 2001 [Environmental protection- report for 2001]. Kutina, Petrokemija, Kutina.
Petrokemija (2002). Završno izvješće o projektu čistije proizvodnje u Petrokemiji d.d. Kutina [Petrokemija's cleaner production project- final report], Petrokemija, Kutina.
Petrokemija (2002b). Završno izvješće o projektu čistije proizvodnje u Petrokemiji d.d. Kutina [Petrokemija's cleaner production project- final report], Petrokemija, Kutina.
Petrokemija (2003). Uvrštenje svih redovnih dionica izdavatelja Petrokemija dioničko društvo tvornica gnojiva u kotaciju Javnih dioničkih društava Zagrebačke burze d.d. [Inclusion of regular shares of Petrokemija shareholding fertiliser company in
213
the list of public shareholding companies of the Zagreb stock exchange]. Kutina, Petrokemija.
Petrokemija (2004). Hrvatska potrošnja gnojiva znatno manja od europske [Croatian fertiliser consumption substantially lower than in Europe]. Petrokemija novosti, 17.02.2004.
Petrokemija (2004). Letter sent to the Minister of Agriculture, Forestry and Water Management. March 3rd, 2004. Kutina, Petrokemija d.d.
Petrokemija (2004). Zaštita okoliša- izvješće za 2003 [Environmental protection- report for 2003]. Kutina, Petrokemija, Kutina.
Petrokemija (2004b). Zaštita okoliša- izvješće za 2003 [Environmental protection- report for 2003]. Kutina, Petrokemija, Kutina.
Petrokemija (2005). Environmental performance data submited to the project. Kutina, Petrokemija.
Petrokemija/AF (2004). Quoted in Pasarić, 2004. Philipps, L., J. P. Welsh, et al. (1999). Ten years experience of all-arable rotations.
Designing and testing crop rotations for organic farming, Foulum, Danish Research Centre for Organic Farming.
Phuong, D. M. and C. Gopalakrishnan (2003). "An application of the contingent valuation method to estimate the loss of value of water resources due to pesticide contamination: The case of the Mekong Delta, Vietnam." International Journal Of Water Resources Development 19(4): 617-633.
Pimentel, D. (2005). "Aquatic nuisance species in the New York State Canal and Hudson River systems and the Great Lakes Basin: An economic and environmental assessment." Environmental Management 35(5): 692-701.
Pimentel, D., B. Berger, et al. (2004). "Water resources: Agricultural and environmental issues." Bioscience 54(10): 909-918.
Pimentel, D., C. Harvey, et al. (1995). "Environmental and Economic Costs of Soil Erosion and Conservation Benefits." Science 267: 1117-1121.
Piot-Lepetit, I., B. Brümmer, et al. (2002). "Régulation environnementale et efficacité des exploitations en Allemagne et en France." Économie Rurale 268-269: 119-129.
Piot-Lepetit, I. and D. Vermersch (1998). "Pricing organic nitrogen under the weak disposability assumption: an application to the French pig sector." Journal-of-Agricultural-Economics Vol. 49: 1:85-99.
Piršić, D. (2004). Petrokemija d.d. Piršić, D. (2005). Petrokemija d.d. Pnjak, D. (2005). Water Company Park, Donji Miholjac. Poe, G. L. (1999). "Maximizing the environmental benefits per dollar expended: An
economic interpretation and review of agricultural environmental benefits and costs." Society & Natural Resources 12(6): 571-598.
Point Carbon (2005). Carbon market. Ponce de Leon, A., H. R. Anderson, et al. (1996). "Effects of air pollution on daily
hospital admissions for respiratory disease in London between 1987-88 and 1991-92." J Epidem Comm Health 50, suppl 1: 63-70.
Pope, C. A., R. T. Burnett, et al. (2002). "Lung Cancer, Cardiopulmonary Mortality, and Long-term Exposure to Fine Particulate Air Pollution." JAMA 287(1132-1141).
Pope, C. A. and D. W. Dockery (1992). "Acute health effects of PM10 pollution on symptomatic and asymptomatic children." Am Rev Respir Dis 145: 1123-1126.
214
Postel, S. (2001). "Growing more food with less water." Scientific American 284(2): 46-+.
Powlson, D. S. (1994). In Long-term Experiments in Agricultural and Ecological Sciences. R. A. Leigh and A. E. Johnston. Wallingford, UK, CAB International: 97-115.
Pratt, P. F. (1984). Nitrogen use and nitrate leaching in irrigated agriculture. Nitrogen in crop production. R. D. Hauck. Madison, WI, ASA: 319-333.
Pretty, J. (1998). The Living Land. London, Earthscan. Pretty, J. (2003). "Agroecology in developing countries - The promise of a sustainable
harvest." Environment 45(9): 8-20. Pretty, J. and A. Ball (2001). Agricultural influences on carbon emissions and
sequestration: a review of evidence and the emerging trading options. Centre for Environment and Society Occasional Paper 2001-03, University of Essex.
Pretty, J., L. Heffron, et al. (2005). An Assesment of the Costs of Nitrogen Enrichment. Colchester, Department of Biological Sciences, University of Essex: 13.
Pretty, J. and R. Hine (2005). Pesticide use and the environment. The pesticide detox: towards a more sustainable agriculture. J. Pretty. London, Earthscan Publications Ltd.: 1-22.
Pretty, J. and H. Waibel (2005). Paying the price: the full cost of pesticides. The pesticide detox: towards a more sustainable agriculture. J. Pretty. London: 39-54.
Pretty, J. and H. Ward (2001). "Social capital and the environment." World Development 29(2): 209-227.
Pretty, J. N. (1995). Regenerating Agriculture: Policies and Practice for Sustainability and Self-Reliance. London, Washington, Bangalore, Earthscan, National Academy Press, ActionAid and Vikas.
Pretty, J. N., A. S. Ball, et al. (2005). "Farm costs and food miles: An assessment of the full cost of the UK weekly food basket." Food Policy 30(1): 1-19.
Pretty, J. N., A. S. Ball, et al. (2002). "The role of sustainable agriculture and renewable-resource management in reducing greenhouse-gas emissions and increasing sinks in China and India." Philosophical Transactions Of The Royal Society Of London Series A-Mathematical Physical And Engineering Sciences 360(1797): 1741-1761.
Pretty, J. N., C. Brett, et al. (2000). "An assessment of the total external costs of UK agriculture." Agricultural Systems 65(2): 113-136.
Pretty, J. N., C. F. Mason, et al. (2003). "Environmental costs of freshwater eutrophication in England and Wales." Environmental Science & Technology 37(2): 201-208.
Pretty, J. N., J. I. L. Morison, et al. (2003). "Reducing food poverty by increasing agricultural sustainability in developing countries." Agriculture Ecosystems & Environment 95(1): 217-234.
Priyadarshi, A., S. A. Khuder, et al. (2001). "Environmental risk factors and Parkinson's disease: A metaanalysis." Environmental Research 86(2): 122-127.
Priyadarshi, A., S. A. Khuder, et al. (2000). "A meta-analysis of Parkinson's disease and exposure to pesticides." Neurotoxicology 21(4): 435-440.
Pulić, M. (2002). Komunalci prebacuju neučinkovitost na potrošače [Local authorities accuse citizens for inefficiency]. Vjesnik on-line.
215
Pulleman, M., A. Jongmans, et al. (2003). "Effects of organic versus conventional arable farming on soil structure and organic matter dynamics in a marine loam in the Netherlands." Soil Use And Management 19(2): 157-165.
Quiang, D. (1992). Agricultural Pollution and its Effect on the Rhine Water, Delft University of Technology, Delft.
Radford, A. F. (1983). quoted in Turner, R. K. and Postle, M. (1994) Valuing the water environment: an economic perspective. CSERGE Working Paper WM 94-08, Norwich.
Randall, G. W. and T. K. Iragavarapo (1995). "Impact of long-term tillage systems for continuous corn and nitrate leaching to tile drainage." Journal of Environmental Quality (24): 360-366.
Rapinat, M. (1993). "Evolution of water treatment in the 1990s - what can be said of costs?" Water Supply 11(1): 231-236.
Ready, R. C., J. Malzubris, et al. (2002). "The relationship between environmental values and income in a transition economy: surface water quality in Latvia." Environment And Development Economics 7: 147-156.
REC (2001). Environmental Taxes in an Enlarged Europe, The Regional Environmental Centre for Central and Eastern Europe, Szentender.
Redman, M. (2003). Inventory of Mineral Fertiliser Use in the Central and Lower Danube River Countries with Reference to Manure and Land Management Practices: Summary Report for the UNDP Danube Regional Project, RER/01/G32. Hamburg, GFA Terra Systems, Hamburg.
Reganold, J. P., A. S. Palmer, et al. (1993). "Soil Quality And Financial Performance Of Biodynamic And Conventional Farms In New-Zealand." Science 260(5106): 344-349.
Reinhard, S. (1999). Econometric analysis of economic and environmental efficiency of Dutch dairy farms. PhD. thesis, Wageningen Agricultural University, Wageningen.
Rekolainen, S. and L. Kauppi (1993). Agricultural Contribution to Nutrient Loading of Surface Waters in Finland. Energy, Environment and Natural Resources Management in the Baltic Sea Region, 4th International Conference on System Analysis, Copenhagen, The Nordic Council of Ministers.
Renwick, A., A. S. Ball, et al. (2002). "Economic, biological and policy constraints on the adoption of carbon farming in temperate regions." Philosophical Transactions Of The Royal Society Of London Series A-Mathematical Physical And Engineering Sciences 360(1797): 1721-1740.
RH (1998). Stanje okoliša [State of the Environment Report]. Official Gazette, 2002. Nr. 23/1998, Zagreb.
RH (2002). Nacionalna strategija zaštite okoliša [National Environmental Protection Strategy], Official Gazette, 2002. Nr. 46/2002, Zagreb.
RH (2002). Nacionalni plan zaštite okoliša [National Plan for Environmental Protection], Official Gazette, 2002. Nr. 46/2002, Zagreb.
Richter, E. D. (2002). Acute human pesticide poisonings. Encyclopedia of Pest Management. D. Pimentel. New York, Dekker: 3-6.
RIVM (1993). Nationale Milieuverkenning 3, 1993-2015 [National Environmental Reconnaissance 3, 1003-2015]. Alphen aan den Rijn, National Institute for Public Health and Environmental Protection.
RIVM/RIZA (1991). Sustainable Use of Groundwater: Problems and Threats in the European Communities, Report No. 600025001, National Institute for Public
216
Health and Environmental Protection (RIVM) and the National Institute for Inland Water Management and Waste Water Treatement (RIZA) of the Netherlands.
Robert, M., A. J, et al. (2001). Carbon sequestration in soils. Proposal for land management in arid areas and the tropics. Rome, Food and Agriculture Organisation of the United Nations.
Robson, M. C., S. M. Fowler, et al. (2002). The agronomic and economic potential of break crops for ley/arable rotations in temperate organic agriculture. Advances In Agronomy, Vol 77. 77: 369-427.
Rodriguez, V. M., M. Thiruchelvam, et al. (2005). "Sustained exposure to the widely used herbicide atrazine: Altered function and loss of neurons in brain monoamine systems." Environmental Health Perspectives 113(6): 708-715.
Roemer, W., G. Hoek, et al. (1993). "Effect of ambient winter air pollution on respiratory health of children with chronic respiratory symptoms." Am Rev Respir Dis 147: 118-124.
Romić, D., M. Romić, et al. (1997). Effect of land use upon the leaching of nitrogen into groundwater in the area of the future water pumping station. Bal Gumpenstein, Austria, 7. Gumpensteiner Lysimetertagung Lysimeter und Nachhaltige Landnutzung.
Rutten, P. and G. Schnoor (1992). "Five years' experience of nitrate removal from drinking water." Water Supply 10(3): 183-190.
RZS (1964). Reports, Volume 14. Zagreb, Statistical Office of the Socialist Republic of Croatia.
Sandor, J., I. Kiss, et al. (2001). "Association between gastric cancer mortality and nitrate content of drinking water: Ecological study on small area inequalities." European Journal Of Epidemiology 17(5): 443-447.
Schirmer, G. and H. Fleischer (1995). Förderung des ökologischen Landbaus in Wasserschutzgebieten durch die Kommunalen Wasserwerke Leipzig GmbH. Ökologischer Landbau und Wasserschutz: Ergebnisse einer Fachtagung in Hannover, Visselhövede/Hamm/Göppingen/Walsrode.
Schmidt, H., L. Philipps, et al. (1999). "Legume breaks in stockless organic farming rotations: Nitrogen accumulation and influence on the following crops." Biological Agriculture & Horticulture 17(2): 159-170.
Schou, J. S., E. Skop, et al. (2000). "Integrated agri-environmental modelling: A cost-effectiveness analysis of two nitrogen tax instruments in the Vejle Fjord watershed, Denmark." Journal of Environmental Management (58): 199–212.
Schreiber, H., H. Behrendt, et al. (2005). "Nutrient emissions from diffuse and point sources into the River Danube and its main tributaries for the period of 1998- 2000 - results and problems." Water Science And Technology 51(3-4): 283-290.
Schreiber, H., H. Behrendt, et al. (2003). Harmonised Inventory of point an diffuse Emissions of Nitrogen and Phosphorus in the Danube Basin. Final Report. Berlin, Institute of Freshwater Ecology and Inland Fisheries, Berlin: 158.
Schreiber, H., H. Behrendt, et al. (2003). Nutrient emissions from diffuse and point sources into the River Danube and its main tributaries for the period of 1998- 2000 - results and problems. Diffuse Pollution and Basin Management. Proceedings of the 7th International Specialised IWA Conference, Dublin, Ireland, University College Dublin, Dublin and International Water Association, London.
Schroder, J. J., D. Scholefield, et al. (2004). "The effects of nutrient losses from agriculture on ground and surface water quality: the position of science in developing indicators for regulation." Environmental Science & Policy 7(1): 15.
217
Schwartz, J. and R. Morris (1995). "Air pollution and hospital admissions for cardiovascular disease in Detroit." Michigan. Epidem 137: 701-705.
Schweigert, P. and R. R. van der Ploeg (2002). "Nitrogen use efficiency in German agriculture since 1950: Facts and evaluation." Berichte Uber Landwirtschaft 80(2): 185-212.
Scialabba El-Hage, N. and C. Hattam, Eds. (2002). Organic agriculture, environment and food security. Environment and Natural Resources Series No. 4. Rome, Food And Agriculture Organisation of the United Nations.
Searl, A. (2002). Quantification of health impacts associated with secondary nitrates. Internal paper for the Green Sense project, Institute for Occupational Medicine, Edinburgh.
Seidler, A., W. Hellenbrand, et al. (1996). "Possible environmental, occupational, and other etiologic factors for Parkinson's disease: A case-control study in Germany." Neurology 46(5): 1275-1284.
Sever, M. (2005). Organic Family Farm Sever. Shaik, S., G. A. Helmers, et al. (2002). "Direct and indirect shadow price and cost
estimates of nitrogen pollution abatement." Journal Of Agricultural And Resource Economics 27(2): 420-432.
Shamrukh, M., M. Y. Corapcioglu, et al. (2001). "Modeling the Effect of Chemical Fertilizers on Ground Water Quality in the Nile Valley Aquifer, Egypt." Ground Water 1(1): 23-28.
Silgram, M., R. Waring, et al. (2001). "Intercomparison of national & IPCC methods for estimating N loss from agricultural land." Nutrient Cycling in Agroecosystems, 60(1-3): 189-195.
SING (2004). Priopćenje sredstvima javnog komuniciranja od 25. veljače, 2000 [Press release from February 25th, 2000].
Six, J., H. Bossuyt, et al. (2004). "A history of research on the link between (micro)aggregates, soil biota, and soil organic matter dynamics." Soil & Tillage Research 79(1): 7-31.
Službene novine Primorsko-goranske županije (2003). Proračun Primorsko-goranske županije za 2004. godinu [Budget of Primorsko-Goranska County for 2004], Službene novine Primorsko-goranske županije, broj 33.
Smit, M. J. and M. P. Laeven (1998). "Prevention of pollution at source: how do we decide whether preventive or curative measures are more effective in the quest for compliance with drinking water standards?" Water Supply 16(1/2): 390-393.
Smith, J., K. Mulongoy, et al. (2000). "Harnessing carbon markets for tropical forest conservation: towards a more realistic assessment." Environmental Conservation 27(3): 300-311.
Smith, P. (2004). "Carbon sequestration in croplands: the potential in Europe and the global context." European Journal Of Agronomy 20(3): 229-236.
Smith, P., K. W. Goulding, et al. (2001). "Enhancing the carbon sink in European agricultural soils: Including trace gas fluxes in estimates of carbon mitigation potential." Nutr. Cycl. Agroecosyst 60: 237-252.
Smith, P., D. S. Powlson, et al. (1998). "Preliminary estimates of the potential for carbon mitigation in European soils through no-till farming." Global Change Biology 4: 679-685.
Smith, P., D. S. Powlson, et al. (1997). "Potential for carbon sequestration in European soils: Preliminary estimates for five scenarios using results from long-term experiments." Global Change Biology(3): 67-79.
218
Smith, P., D. S. Powlson, et al. (2000). "Meeting Europe's climate change commitments: quantitative estimates of the potential for carbon mitigation by agriculture." Global Change Biology 6(5): 525-539.
Smith, P., J. U. Smith, et al. (2001). Soil Organic Matter Network (SOMNET): 2001 Model and Experimental Metadata. GCTE Report 7, Second Edition. GCTE Focus 3. Oxon, Wallingford: 223.
Smith, W. N., R. L. Desjardins, et al. (2000). "The net flux of carbon from agricultural soils in Canada 1970-2010." Glob. Chang. Biol. 6: 557-568.
Smolčić, I. (2004). Herbos d.o.o. Sorensen, J. N. and K. Thorup-Kristensen (2003). "Undersowing legume crops for
green manuring of lettuce." Biological Agriculture & Horticulture 21(4): 399-414. SOS (2002). Nitrogen and phosphorus balances in arable land and agricultural sector
in Sweden 1999. Stocholm, Sveriges Officiella Statistik. Stalnacke, P., S. M. Vandsemb, et al. (2004). "Changes in nutrient levels in some
Eastern European rivers in response to large-scale changes in agriculture." Water Science And Technology 49(3): 29-36.
Stanhill, G. (1990). "The Comparative Productivity of Organic Agriculture." Agriculture, Ecosystems and Environment Vol. 30: 1:1-26.
Stevanović, R. (2005). Croatian Institute of Public Health. Stilinović, I. (2005). Veterina d.o.o. Stipetić, I. (1991). Crop Production in Croatia 1885-1990. Zagreb, Faculty of
Economics of the University of Zagreb. Stipičević, S., S. Fingler, et al. (2002). Determination of triazine herbicides and their
metabolites in soil. 7th International Symposium Advances in Analytical Separation Science,Chromatography and Electrophoresis, Pörtschach/Wörthersee, Austria, Slovensko kemijsko društvo.
Stolze, M., A. Piorr, et al. (2000). The environmental impacts of organic farming in Europe. Stuttgart, University of Stuttgart-Hohenheim.
Stopes, C., H. Bulson, et al. (1966). Stockless Organic Farming - Research Review 1987-1995. Hamstead Marshall, Elm Farm Research Centre.
SUM (2000). "Tackling nitrate from agriculture." Soil Use & Management Vol 16, Supplement.
Sumelius, J., Z. Grgić, et al. (2002). Farm level cost of reducing nitrate leaching by economic instruments in Croatian farming systems. CEESA Discussion Paper No. 11. Berlin, Humboldt University of Berlin, Chair of Resource Economics.
Sumelius, J., Z. Grgić, et al. (2003). Marginal abatement costs for reducing leaching of nitrates in Croatian farming systems. Proceedings of the 25th International Conference of Agricultural Economists (IAAE). Durban, South Africa.
Sumelius, J., M. Mesić, et al. (2005). "Marginal abatement costs for reducing leaching of nitrates in Croatian agriculture." Forthcoming in Agricultural and Food Science.
Sunyer, J., J. Castellsague, et al. (1996). "Air pollution and mortality in Barcelona." J Epidem Comm Health 50 (suppl 1): 76-80.
Sviržnjak, K. (2001). Zemljišna politika u službi dinamičnog razvitka hrvatske poljoprivrede, [Land use policy in service of a more dynamic development of Croatian Agriculture]. Master of Science Thesis. Faculty of Agronomy, University of Zagreb. Zagreb.
219
Šamota, D. and R. Brkić (2002). "Iskustva ekološke proizvodnje povrća u Slavoniji i Baranji (Experience of organic vegetables production in Slavonija and Baranja)." Glasilo biljne zaštite (1332-9545) 1(1): 10.
Šarić, M. (1996). Environmental exposure assessment and health effects studies in the Republic of Croatia (1980-1995), HAZU: prilozi za strategiju razvooja 1-153.
Šimić, Z. (2001). Nitko u Vladi ne želi priznati da je sanacija kombinata propala zbog državnih poduzeća [The government unwilling to admit that the revitalisation of agri-combinates failed because of the state-owned companies]. Jutarnji list, July 13, 2001.
Šimunić, I. (2002). Postojeće stanje i procijena kakvoće drenažnih voda [Current state and assessment of water drainage water quality]. In: Mesić, M., Bašić, F., Grgić, Z., Igrc-Barčić., J., Kisić, I., Petošić, D., Posavi, M., Romić, D., Šimunić, I. (eds.). Procijena stanja, uzroka i veličine pritisaka poljoprivrede na vodne resurse i more na području Republike Hrvatske [Assessment of the Situation, Causes and Magnitude of Agricultural Environmental Pressure on Water Resources and Sea in the Republic of Croatia]. Zagreb, Agronomski fakultet.
Šimunić, I. (2003). "Soil and water contamination by drainage systems." Hrvatske vode: časopis za vodno gospodarstvo Vol. 11(45): 45:541-545.
Šimunić, I., F. Tomić, et al. (2002). "The content of Pb, Zn and Cd in hydroameliorated soil and drainage water and their uptake by plants." Rostlinna Vyroba 48(9): 401-406.
Šimunić, I., F. Tomić, et al. (1998). "Djelovanje drenaži na koncentraciju dušika u drenažnoj vodi [Impact of drainage on nitrogen concentration in drainage water]." Hrvatske vode: časopis za vodno gospodarstvo(1): 107-110.
Šimunić, I., F. Tomić, et al. (1998). Stupanj onečišćenja drenažnih voda na hidormelioriranom presudogle-glejnom tlu srednje Posavine [Drainage water pollution on hydromeliorated pesudogley-gley soils of mid Posavina region]. XXXV Znanstveni skup hrvatskih agronoma. Opatija.
Šimunić, I., F. Tomić, et al. (1996). Drnänabfluß und Stickstoffaustrag bei den verschindenen Systemen derr Detaile-nentwässerung. XVIIIth Conference of the Danube Countries on Hydrological Forecasting un Hydrological Bases of Water Management, Graz.
Šimunić, I., F. Tomić, et al. (2002). "Nitrogen leaching from meliorated soil." Bodenkultur 53(2): 73-81.
Šimunić, I., F. Tomić, et al. (1999). Ostaci atrazina u drenažnim vodama i tlu srednje Posavine [Atrazine concentrations in drainage water and soil of mid Posavina region]. II Hrvatska konferencija o vodama. Dubrovnik.
Šimunić, I., F. Tomić, et al. (2002). "Concentration and leaching of atrazine into drainage water in Gleyic Podzoluvisol." Rostlinna Vyroba 48(4): 167-174.
Šimunić, I., F. Tomić, et al. (2002). Quality of drainage waters of the Danube catchment area in the Republic of Croatia (Quality of drainage waters of the Danube catchment area in the Republic of Croatia). XXI Conference of the Danubian Countries, Bucharest.
Šobot, S. (2004). Croatian National Institute of Public Health. Šolić-Gavranović, M. (2004). Šutalo, I. (2004). Central Bureau of Statistics. Šutalo, I. (2005). Central Bureau of Statistics. Tegtmeier, E. M. and M. D. Duffy (2004). "External Cost of Agricultural Production in
the United States." International Journal of Agricultural Sustainability 2(1): 1-19.
220
Terres, J. M. (2002). Calculation of Agricultural Nitrogen Quantity for EU15: spatialisation of the results to river basins using CORINE Land Cover.
Tiezzi, S. (1999). "External effects of agricultural production in Italy and environmental accounting." Environmental & Resource Economics 13(4): 459-472.
TISUP (2005). Agribusiness price database run by the Ministry of Agriulture, Forestry and Water Management.
TISUP (2005). Maloprodajne cijene gnojiva od 2001 do 2004. godine [Mineral fertiliser retail price in the period 2001-2004]. Zagreb, Ministarstvo poljoprivrede, šumarstva i vodnoga gospodarstva.
Titus, J. G. (1992). The costs of climate change to the United States. Global Climate Change: Implications, Challenges, and Mitigation Measures, East Stroudsburg, Pennsylvania, Pennsylvania Academy of Sciences.
Toma, L. (1999). Country report on the present environmental situation in agriculture- Romania. FAO REU Technical Series 61. Rome, Food And Agriculture Organisation of the United Nations.
Tomić, F., I. Šimunić, et al. (1997). Utjecaj cijevne drenaže na ispiranje dušika iz tla. 4. stručna sjednica Radne skupine "Zaštita tla " Podunavskih zemalja [The effect of pipe drainage on nitrogen leaching. 4th expert committee meeting of the Danube Basin Task Force "Soil Protection"], Osijek.
Tomšić, Ž. (2005). Unanswered E-mail message sent on March the 18th, 2005 at 22:42.
Touloumi, G., E. Samoli, et al. (1996). "Daily mortality and 'winter type' air pollution in Athens, Greece - a time series analysis within the APHEA project." J Epidem Comm Health 50 suppl 1: 47-51.
Trimble, S. W. and P. Crosson (2000). "Land use - US soil erosion rates - Myth and reality." Science 289(5477): 248-250.
Trninić, S. (2004). Zagrebačka County. UBPABO (2001). Sažetak projektnog prijedloga "Osijek bez ambrozije" [Osijek without
ragweed- project proposal summary]. Osijek, UBPABO, Udruga za borbu protiv alergijskih bolesti Osijek.
UN-ECE (1999). Environmental Performance Reviews: Croatia, United Nations Economic Commission for Europe, New York and Geneva: 196.
UN (2002). Johannesburg Summit 2002: Croatia Country Profile. New York, United Nations.
UNECE/EPEM (2005). UNECE/EMEP activity data and emission database, WebDab 2005.
UNFCCC (2005). The United Nations Framework Convention on Climate Change. University of Bath (2005). Grensense: A Research Project of the European
Commission. UPR (2000). Development Strategy for Agriculture and Areas of Special State
Concern: Proposal. Working Group of the President of the Republic of Croatia for the Preparation of the Development Strategy for Agriculture and Areas of Special State Concern. Zagreb, Office of the President of the Republic of Croatia.
Ured Turističke zajednice grada Poreča (2004). Poruka Ureda Turističke zajednice Grada Poreča [City of Poreč Tourist Office Announcement]. Poreč, Ured Turističke zajednice grada Poreča.
221
USDA (2000). Croatian Agricultural Situation: Situation and Outlook 2000. Global Agriculture Information Network (GAIN) Report #HR0012. Washington, D.C., United States Department of Agriculture.
USDA (2002). Croatia Agriculture/Agribusiness Assessment. Washington, D.C., United States Department of Agriculture, Office of Economic Growth.
Vagstad, N., P. Stalnacke, et al. (2004). "Regional variations in diffuse nitrogen losses from agriculture in the Nordic and Baltic regions." Hydrology And Earth System Sciences 8(4): 651-662.
Valek, M. (2005). Croatian National Institute of Public Health, Osječko-Baranjska County.
van Beukering, P., M. van Drunen, et al. (1998). External Economic Benefits and Costs in Water and Solid Waste Investments: Methodology, Guidelines and Case Studies, Institute for Environmental Studies, Vrije Universiteit, Amsterdam.
Van der Bruggen, B. and C. Vandecasteele (2003). "Removal of pollutants from surface water and groundwater by nanofiltration: overview of possible applications in the drinking water industry." Environmental Pollution 122(3): 435-445.
van der Werff, P. A. (1992). Applied Soil Ecology in Ecological Agriculture, Department of Ecological Agriculture, Wageningen Agricultural University: 109.
van Elzakker, B., R. Witte, et al. (1992). Benefits of Diversity. New York, UNDP- United Nations Development Programme.
van Mansvelt, J. D. and J. A. Mulder (1993). "European Features for Sustainable Development: a contribution to the dialogue." Landscape and Urban Planning: 27:67-90.
van Mansvelt, J. D. and D. Znaor (1999). Criteria for the a-biotic and biotic realm: environment and ecology. Checklist for Sustainable Landscape Management. J. D. van Mansvelt and M. J. Lubbe. Amsterdam-Lausanne-New York-Oxford-Shannon-Singapore-Tokio, Elsevier.
Vatn, A., L. Bakken, et al. (1999). "ECECMOD: an interdisciplinary modelling system for analyzing nutrient and soil losses from agriculture." Ecological Economics 30(2): 189.
Verstraeten, G. and J. Poesen (2002). "Using sediment deposits in small ponds to quantify sediment yield from small catchments: Possibilities and limitations." Earth Surface Processes And Landforms 27(13): 1425-1439.
Verstraeten, G., K. Van Oost, et al. (2002). "Evaluating an integrated approach to catchment management to reduce soil loss and sediment pollution through modelling." Soil Use And Management 18(4): 386-394.
Vešligaj, A. (2004). Petrokemija d.o.o. Vešligaj, D. (2005). Ekonerg d.o.o. Vidaček, Ž., M. Bogunović, et al. (2005). Aktualno stanje zaštite tla u Hrvatskoj (Actual
situation of soil protection in Croatia). Gazophylacium, in print. Vidaček, Ž., Z. Racz, et al. (2003). "Efficiency of land reclamation and soil-
improvement systems in the Vučica and Karašica catchment." Hrvatske vode: časopis za vodno gospodarstvo Vol. 11(45): 45:507-513.
Vidaček, Ž., M. Sraka, et al. (2002). Utjecaj hidromelioracija na režim vlažnosti tla i ispiranje nitrata. Soil Science: Confronting New Realities in the 21st Century, Bangkok, Thailand, Society of Soil Science of Thailand.
Vidaček, Ž., M. Sraka, et al. (1999). "Nitrati, teški metali i herbicidi u tlu i vodama sliva Karašica- [Vučica Nitrates, Heavy Metals and Herbicides in Soil and Waters of
222
Karašica- Vučica Catchment Area]." Poljoprivredna znanstvena smotra 64(2): 143-150.
Viduka, B. (2005). Financial Agency. Zagreb. Vitale, K., M. M. Rajčić, et al. (2002). "Waters in Croatia between practice and needs:
Public health challenge." Croatian Medical Journal 43(4): 485-492. Vlasta (2005). Zagrebačka County. Vleeshouwers, L. M. and A. Verhagen (2002). "Carbon emission and sequestration by
agricultural land use: a model study for Europe." Glob. Chang. Biol. 8: 519� 530. Vogtmann, H. (1990). Research Structure in Biological Farming General View,
Justifications, Development. In: Besson (ed.): Biological Farming in Europe: Challenges and Opportunities. Food and Agriculture Organisation of the United Nations- REUR Technical Series 12, Rome.
Volker, T. (1998). The Economics of Soil Erosion: An Assessment of the On-site and Off-site Costs of Soil Erosion in England and Wales. MSc. Dissertation, Department of Economics. London, University College.
Volkmer, B. G., B. Ernst, et al. (2005). "Influence of nitrate levels in drinking water on urological malignancies: a community-based cohort study." Bju International 95(7): 972-976.
Vollenbroek, J. and I. Csikós (1995). The Danube Blues: a case for sustainable river basin development. Nijmegen, Haskoning- Royal Dutch Consulting Engineers and Architects: p. 222.
von Blottnitz, H., A. Rabl, et al. (2004). Damage Costs of Nitrogen Fertiliser and Their Internalization. SusTools Tools for Sustainability: Development and Application of an Integrated Framework (Contract N° EVG3-CT-2002-80010). Final Report on Work Package 4, ARMINES/Ecoles des Mines, Paris.
von Fragstein, P. (1966). Organic arable farming - a contradiction? Fourth Congress of the ESA - Book of Abstracts, Colmar Cedex, European Society for Agronomy.
VRED (2004). Izvješće o radu Vijeća za regulaciju energetskih djelatnosti i o zapažanjima od značaja za razvoj energetskog tržišta i javnih usluga u 2003. godini [Report on the activities of the Council for the regulation of energy activities and on the observations important for the development of energy markets and public services in 2003]. Zagreb, Vijeće za regulaciju energetskih djelatnosti: 49.
VRH (2000). Croatian Agriculture Development Strategy. In: Croatian Development Strategy - Croatia in the 21st Century, Food Sector- part on Agriculture. Zagreb, Government of the Republic of Croatia.
VRH (2000). Tematska sjednica Vlade Republike Hrvatske, 21. prosinca, 2000. Poljoprivreda [Thematic meeting of the Government of the Republic of Croatia, December 21, 2000. Agriculture]. Zagreb, Government of the Republic of Croatia.
VRH (2001). Letter dated 11 October 2001 from the Republic of Croatia to the Executive Secretary of the United Nations Framework Convention on Climate Change. Zagreb, Government of the Republic of Croatia.
VRH (2001). Program građenja i održavanja javnih cesta za razdoblje od 2001. do 2004. godine [Programme for construction and maintenance of the public roads 2001-2004]. Zagreb, Government meeting from February 22, 2001. Government of the Republic of Croatia.
VRH (2002). Organic Food Production: Healthy Food from Minefields. Croatia- Croatian Government Bulletin. VI.
VRH (2003). Answers to the Questionnaire of the European Commission. Zagreb, Government of the Republic of Croatia.
223
VRH (2003). Izmjene i dopune Programa građenja i održavanja javnih cesta za razdoblje od 2001. do 2004. godine [Changes and ammendments to the Programme for construction and maintenance of the public roads 2001-2004]. Zagreb, Government meeting from December 18, 2003. Government of the Republic of Croatia.
VROM (1999). Stofen en normen [Substances and standards]. Den Haag, Ministry of Housing, Spatial Planning and the Environment.
Vujčić, A. (2004). Vujčić, A. (2004). Dalmed d.o.o. Vuk, B. (2005). Energy Institute Hrvoje Požar. Vuk, B. (2005). National Energy Balance Data. Zagreb, Energy Institute Hvoje Požar. Vulama, S. (2005). Izračun okvirne cijene za Petrokemiju Kutina [Approximative
assessment of the gas price for Petrokemija Kutina]. Zagreb, Energetski institut "Hrvoje Požar".
Watson, C. A. and D. Atkinson (1999). "Using nitrogen budgets to indicate nitrogen use efficiency and losses from whole farm systems: a comparison of three methodological approaches." Nutrient Cycling in Agroecosystems 53(3): 259 - 267.
Watson, C. A., H. Bengtsson, et al. (2002). "A review of farm-scale nutrient budgets for organic farms as a tool for management of soil fertility." Soil Use And Management 18: 264-273.
Weigant, Z. (2005). Krmiva d.o.o. Welp, M., D. Hamidović, et al. (2002). The Uncertain Role of Biodiversity Management
in Emerging Democracies. Biodiversity, Sustainability and Human Communities: Protecting Beyond the Protected. T. O’Riordan and S. Stoll-Kleemann. Cambridge, Cambridge University Press.
Weyer, P. J., J. R. Cerhan, et al. (2001). "Municipal drinking water nitrate level and cancer risk in older women: The Iowa Women's Health Study." Epidemiology 12(3): 327-338.
Whittemore, A. and E. Korn (1980). "Asthma and air pollution in the Los Angeles area." Am J Public Health 70: 687-696.
Wit, R., G. Posma, et al. (1999). Economic viability and environmental effects of large-scale conversion to sustainable agriculture in the Danube Basin, Centre for Energy Conservation and Environmental Technology, Delft: 99.
Wordley, J., S. Walters, et al. (1997). "Short term variations in hospital admissions and mortality and particulate air pollution." Occup Environ Med 54: 108-116.
World Bank (1992). Development and the Environment. World Development Report 1992. New York, Oxford University Press.
WRI (2003). Earth Trends: Country Profile Croatia. Washington, D.C., The World Resources Institute.
Yin, C. Q., C. F. Yang, et al. (2001). "Non-point pollution from China's rural areas and its countermeasures." Water Science And Technology 44(7): 123-128.
Zagorski vodovod (2005). E-mail message from the 6th of May. Zabok, Zagorski vodovod.
Zanchi, C. (1988). The cropping pattern and its role in determining erosion risk: experimental plot results from the Mugello valley (central Italy). In: Sediment Budgets. M.P. Bordas and D.E. Walling (eds.). IAHS Publication No. 174. M. P. B. a. D. E. Walling. Wallingford, UK, International Association of Hydrological Scientists.
224
Zessner, M., O. Gabriel, et al. (2005). Outlines of a Handbook for International Nutrient Balances on Catchment Scales including Minimum-Requirement-Data-List. Report for the EU 5th Framework Resaarch Programme., Institute for Water Quality and Wastemanagement, Vienna University; Leibnitz Institute of Freshwater Ecology and Inland Fisheries, Berlin; Institute of Land and Water Management, Petzenkirchen; Institute for Water Pollution Control � Vituki, Budapest.
Zhang, X. L., B. Zhang, et al. (2003). "Research and control of well water pollution in high esophageal cancer areas." World Journal Of Gastroenterology 9(6): 1187-1190.
ZJZGZ (2004). Zdravstveno stanje stanovništva izdravstvena djelatnost u gradu Zagrebu u 2003. godini [State of health of the population and health activities in the city of Zagreb in 2003.]. Zagreb, Zavod za javno zdravstvo grada Zagreba.
Znaor, D. (1994). Ecological Agriculture: Analysis of the Most Commonly Criticized Aspects. Why Shall Estonian Agriculture be Ecological? Proceedings of the International Conference held in Tartu, June 13, 1994., Center of Ecological Engineering Tartu.
Znaor, D., Ed. (1994). Proceedings of the International Seminar for Policy Makers on Contribution of Organic Farming to Sustainable Rural Development. Edens, Avalon Foundation.
Znaor, D. (1995). Ekološka poljoprivreda: poljoprivreda sutrašnjice [Ecological agriculture: agriculture of tomorrow]. Zagreb, Nakladni zavod Globus.
Znaor, D. (1997). "What Future for Sustainable Agriculture?" Danube Watch 3(2): 2-3. Znaor, D. (1999). Regulatory and policy instruments to protect European waters from
agricultural activities: status of their implementation, ETC, Leusden and UN Economic Commission for Europe, Geneva.
Znaor, D. (2001). "A focus on Central and Eastern Europe: Croatia." Ecology and Farming: the international magazine of International Federation of Organic Agriculture Movements No. 27.
Znaor, D. (2002). "Contribution of organic agriculture to macro-economic and environmental performance of the countries with economies in transition." Vagos research papers 53 (6). Lithuanian University of Agriculture, Akademija.
Znaor, D. (2002). Policies for the control of agricultural point and non-point sources of pollution: Country report Croatia. Inception Report for the UNDP Danube Regional Project- Project RER/01/G32, GFA Terra Systems, Hamburg.
Znaor, D. (2003). Povijest razvitka ekopoljoprivrede u Hrvatskoj [History of organic agriculture movement in Croatia]. Ecologica: hrvatski časopis za održivi ruralni razvitak, ekološku poljoprivredu i zaštitu okoliša. No. 6,7 and 10.
Znaor, D. (2005). Can we afford to abandon European abandoned land? A Pan-European view. European Nature Conference. Apeldoorn, The Netherlands.
Znaor, D. and B. Bošnjaković (1998). "Ecological agriculture as model of sustanable agriculture in countries with economies in transition." Hrvatske vode: časopis za vodno gospodarstvo 6(24): 215-232.
Znaor, D. and S. Karoglan Todorović (2004). Agri-Environment Programme for Croatia, Ecologica, Zagreb: 103.
Znaor, D. and H. Kieft (2000). Environmental impact and macro-economic feasibility of organic agriculture in the Danube River Basin. The World Grows Organic: Proceedings of the 13th International IFOAM Scientific Conference, Basel, Switzerland, Hochschulverlag AG an der ETH Zurich.
225
Zylicz, T., I. Bateman, et al. (1995). Contingent valuation of euthrophication damage in the Baltic Sea region. CSERGE Working Paper WM 95-03. London, Center for Social and Economic Research of the Global Environment (CSERGE), University College London.
Željezić, D. and V. Garaj-Vrhovac (2004). "Chromosomal aberrations, micronuclei and nuclear buds induced in human lymphocytes by 2,4-dichlorophenoxyacetic acid pesticide formulation." Toxicology 200(1): 39-47.
Žeželj, M. (2005). Financial Agency. Zagreb. Žimbrek, T. (2005). Faculty of Agriculture, University of Zagreb.