Embed Size (px)
Citation preview
Environmental and Social Monitoring Report
This report has been submitted to ADB by BP Berau Limited and is made publicly available in accordance with ADB’s public communications policy (2005). It does not necessarily reflect the views of ADB.
Project Number: 38919 October 2010 – April 2011
INDONESIA: Tangguh Liquefied Natural Gas Project Operator’s Environmental, Health and Safety Report
Prepared by BP Berau Limited Tangguh LNG Project Operator
� �
Operator’s Environmental, Health and Safety Report Tangguh LNG Project
October 2010 – April 2011
�
Environmental Health and Safety Report
Tangguh LNG Project
October 2010 - April 2011
1
TABLE OF CONTENTS
ENVIRONMENTAL AND HEALTH SAFETY REPORT TANGGUH LNG PROJECT
TABLE�OF�CONTENTS ................................................................................................................ 1
Figure�List ...................................................................................................................................... 2
Table�List ........................................................................................................................................ 2
EXECUTIVE�SUMMARY .............................................................................................................. 3
EXECUTIVE�SUMMARY .............................................................................................................. 3
1. Regulatory�Compliance ......................................................................................................... 4
1.1. Summary�Description...................................................................................................... 4
1.2. Implications�for�Tangguh ................................................................................................ 4
2. Environmental�Management�Plan ....................................................................................... 4
2.1. LNG�Plant�and�its�Supporting�Facilities�including�Marine�Facilities .......................... 5
2.1.1. Wastewater�Management ............................................................................. 5
2.1.2. Solid�Waste�Management.............................................................................. 8
2.1.3. Revegetation .................................................................................................. 11
2.1.4. Air�Emission.................................................................................................... 12
2.1.5. Water�Management ...................................................................................... 13
2.1.6. Fuel�Management ......................................................................................... 13
2.2. Gas�Production�Facilities�and�Gas�Transmission�(GPF)............................................ 15
2.3. Drilling�Activities............................................................................................................. 15
2.4. Environmental�Management�System ......................................................................... 15
3. Environmental�Monitoring�Plan .......................................................................................... 15
3.1. LNG�Plant�and�its�Supporting�Facilities�including�Marine�Facilities ........................ 16
3.1.1. Wastewater�Monitoring................................................................................ 16
3.1.2. Solid�Waste�Monitoring ................................................................................ 18
3.1.3. Revegetation .................................................................................................. 19
3.1.4. Air�Emission.................................................................................................... 19
3.1.5. Water�Supply.................................................................................................. 22
3.1.6. Fuel�Storage�and�Handling ........................................................................... 22
3.2. Gas�Production�Facilities�and�Gas�Transmission�(GPF)............................................ 23
3.3. Drilling�Activities............................................................................................................. 23
4. Environmental�Studies......................................................................................................... 23
5. Health�and�Safety ................................................................................................................. 23
6. Status�of�Non�Compliances ................................................................................................ 26
6.1. Level-1�Non�Compliances ............................................................................................. 27
6.2. Level-2�Non�Compliances ............................................................................................. 27
7. Additional�Information ......................................................................................................... 27
8. Evaluation�Results................................................................................................................ 27
�
Environmental Health and Safety Report
Tangguh LNG Project
October 2010 - April 2011
2
Figure List Figure�1.��LNG�Plant ........................................................................................................5�
Figure�2.��Progress�of�Produced�Water�Treatment�Plant�Construction�Project.................7�
Figure�3.�Plastic�Granulator�and�Can�Compactor..............................................................9�
Figure�4.�Wood�Chipper ..................................................................................................9�
Figure�5.�Organic�Waste�Landfill....................................................................................10�
Figure�6.�Organic�Waste�Composter .............................................................................10�
Figure��7.�Maintenance�of�Revegetated�Area ................................................................12�
Figure�8.�Siripa/Burma�Creek.........................................................................................12�
Figure�9.�Flaring�during�Operation�Period ......................................................................13�
Figure�10.�Secondary�Containment�Construction�at�CPI ................................................14�
Figure�11.�Fuel�Tank�at�Dormitory�Area .........................................................................14�
Figure�12.��Food�Waste�Profile ......................................................................................18�
Figure�13.�Solid�Non-Hazardous�Waste�Profile ..............................................................19�
Figure�14.�Oil�Spill�Drill�–�Oil�Boom�Deployment............................................................22�
Figure�15.�Industrial�Hygine�Activities ...........................................................................25�
Table List
Table�1.�Wastewater�Type�and�Debit ........................................................................................ 5
Table�2�Sewage�Analysis........................................................................................................... 16
Table�3�Produced�Water�Analysis ............................................................................................ 17
Table�4�Brine�Water�Analysis .................................................................................................... 17
Table�5�Chemically�Contaminated�Wastewater�Analysis ..................................................... 18
Table�6�Ambient�Air�Sampling�LNG�Tangguh ......................................................................... 20
Table�7�Result�of�Emission�Sampling�on�AGI ......................................................................... 20
Table�8�Result�of�Emission�Sampling�on�Boiler ..................................................................... 20
Table�9�Result�of�Gas�Turbine�Emission�Sampling ................................................................ 21
Table�10�Result�of�Flaring�Sampling ........................................................................................ 21
Table�11�Result�of�Generator�Set�Emission�Sampling .......................................................... 21
Table�12�Water�Usage ............................................................................................................... 22
Table�13.�Key�Indicators�on�Safety�Performance................................................................... 24
�
Environmental Health and Safety Report
Tangguh LNG Project
October 2010 - April 2011
3
EXECUTIVE SUMMARY
�
Tangguh� is� now� fully� in� operation.� In� 2010� it� produced� 90� LNG� and� 21� condensate�
cargoes.�By� the�end�of�April�2011� it�had�produced�26�LNG�cargoes�and�6�condensate�
cargoes.�
�
The� environmental� management� and� monitoring� programmes� continue� to� be�
implemented� in� line� with� the� approved� AMDAL� and� relevant� permits� granted� for�
Tangguh� as� well� as� the� Environmental� Management� System� ISO� 14001:2004� to�
maintain� certification� that� was� obtained� in� December� 2010.� The� produced� water�
treatment�plant�construction�is�on�going�and�targeted�to�be�completed�on�schedule�by�
end�2011.�
�
On�25th�April�2011,�Tangguh�issued�the�AMDAL�Implementation�report�for�the�period�of�
October�2010-April�2011�to�the�Minister�of�Environment�(MOE)�and�related�government�
institutions�including�the�local�Government�of�Bintuni,�Ditjen�MIGAS�and�BPMIGAS.�This�
report�is�developed�mainly�based�on�the�AMDAL�implementation�report.�
�
We� had� 4� recordable� injuries� between� October� 2010� –� April� 2011� which� have� been�
thoroughly� investigated� and� lessons� learned� have� been� circulated� internally.� � � We�
continue� to� focus�strongly�on�all� aspects�of�HSE.� � Journey� to�Zero� Incident�campaign�
series� has� been� started� in� 2011� early,� the� first� round� focused� on� PPE� compliance�
campaign.� � An� excellent� final� two� months� in� the� fourth� quarter� 2010,� with� zero�
recordable�injuries.��
�
Environmental Health and Safety Report
Tangguh LNG Project
October 2010 - April 2011
4
1. Regulatory Compliance
1.1. Summary Description
�
As� a� follow� up� to� the� issuance� of� the� new� Law� no� 32� year� 2009� regarding� the�
Environmental�Protection�and�Management,�Government�of�Indonesia�(GoI)�is�currently�
developing� related� implementation� regulations� including� AMDAL� and� Environmental�
Permitting�regulations,�and�these�are�expected�to�be�issued�before�end�of�this�year.�A�
series�of� new� regulations�have�been� issued,� and� the�one�most� related� to�Tangguh� is�
Ministry� of� Environment� Decree� no� 19� year� 2010� regarding� Wastewater� Discharge�
Standard�for�Oil,�Gas�and�Thermal�Industry�to�replace�the�Decree�no�4�year�2007�on�the�
same�subject.�
�
�
1.2. Implications for Tangguh
�
The�new�Law�no�32�year�2009�is�stricter�in�term�of�pollution�definition�and�consequence�
for�non-compliance.�Tangguh�maintains� its�commitment� to�comply�with� the�applicable�
regulatory�requirements�in�Indonesia.��
�
Based�on�new�Decree�no�19�year�2010,�basically�the�standard�is�still�the�same�with�the�
previous� standard� as�Tangguh� facility� is� considered� as�new� facility� (new� facility� in� the�
regulation� is� if� it�was�designed�or� in�operation�after�1996).�There� is�one�difference�for�
the�parameter�TDS�which�is�now�not�applicable�since�the�produced�water�is�discharged�
into�the�sea.�
�
2. Environmental Management Plan
�
This� six-monthly� report� covers� the� period� of� October� 2010� –� April� 2011� which� is�
consistent� with� Tangguh� AMDAL� reporting� period� to� the� Indonesian� Ministry� of�
Environment.�����
�
This� report�has�been�prepared�to�fulfil� the�Borrowers’�obligations�under:� �Section�1.12�
(Certain� Environmental,� Involuntary� Resettlement� and� Indigenous� Peoples� Matters),�
Paragraph�(B)�(Regular�Reports),�sub-paragraph�(a)(Environmental�and�Health�and�Safety�
Report)� of� the� ADB� Tranche� PSC� Parties� Agreement� dated� as� of� 31� July� 2006� and�
Section�1.18�(Certain�Environmental,�Involuntary�Resettlement�and�Indigenous�Peoples�
Matters),�Paragraph�(B)�(Regular�Reports),�sub-paragraph�(a)� (Environmental�and�Health�
and�Safety�Report)�of�the�Japanese�Tranche�PSC�Parties�Agreement"�dated�as�of�31�July�
2006.�
�
Tangguh�LNG�environmental,�health�and�safety�management�and�monitoring�activities�
during�the�6�month�period�from�October 2010 – April 2011�include�the�following:�
�
Environmental Health and Safety Report
Tangguh LNG Project
October 2010 - April 2011
5
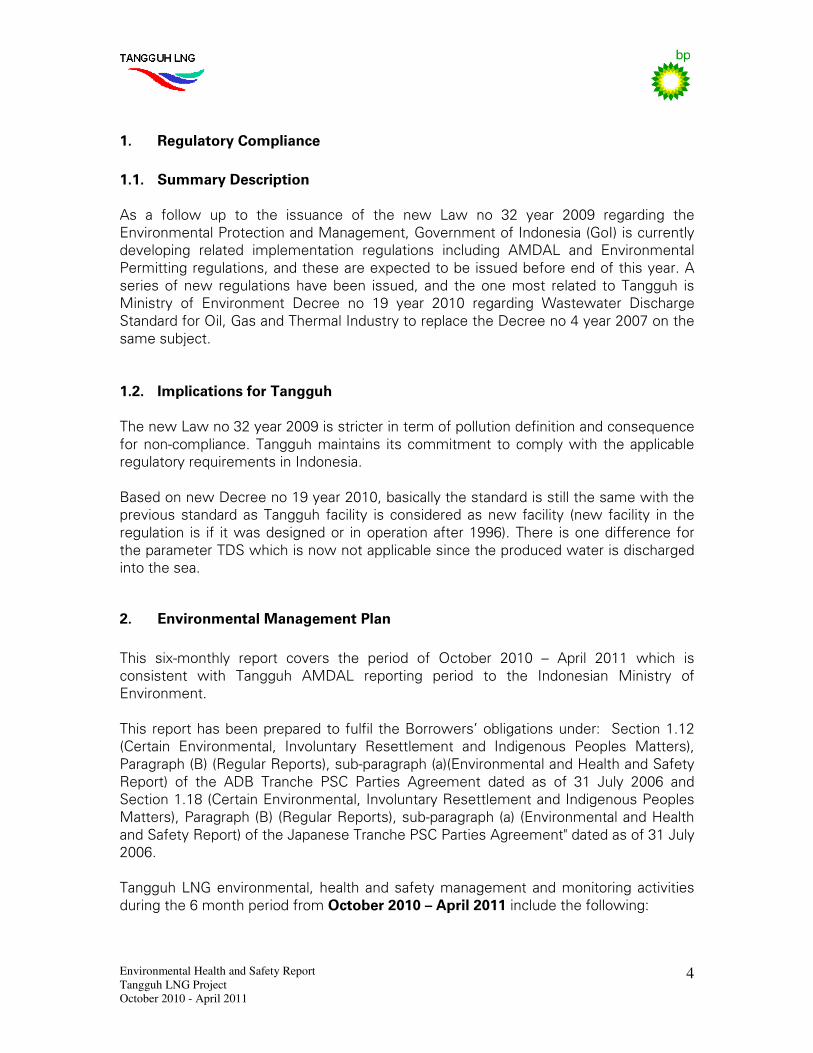
2.1. LNG Plant and its Supporting Facilities including Marine Facilities
�
The�average�personnel�on�board�during�the�reporting�period�are�about�2500.� In�March�
2011,�approximately�2900�personnel�on�board�accommodated�at�the�dormitory�A�and�B,�
Shorebase� camp� and� Step� 3� camp.� This� ramp� up� of� personnel� towards� the� end� of�
reporting�period�is�due�to�the�scheduled�Train�1�Turn�Around�(TAR)�Project,�Wastewater�
Treatment� Plant� Project,� Vapor� Return� Bypass� Line� (VRBL)� and� step� 3� camp�
refurbishment.�
�
�
Figure 1. LNG Plant
�2.1.1. Wastewater Management
�
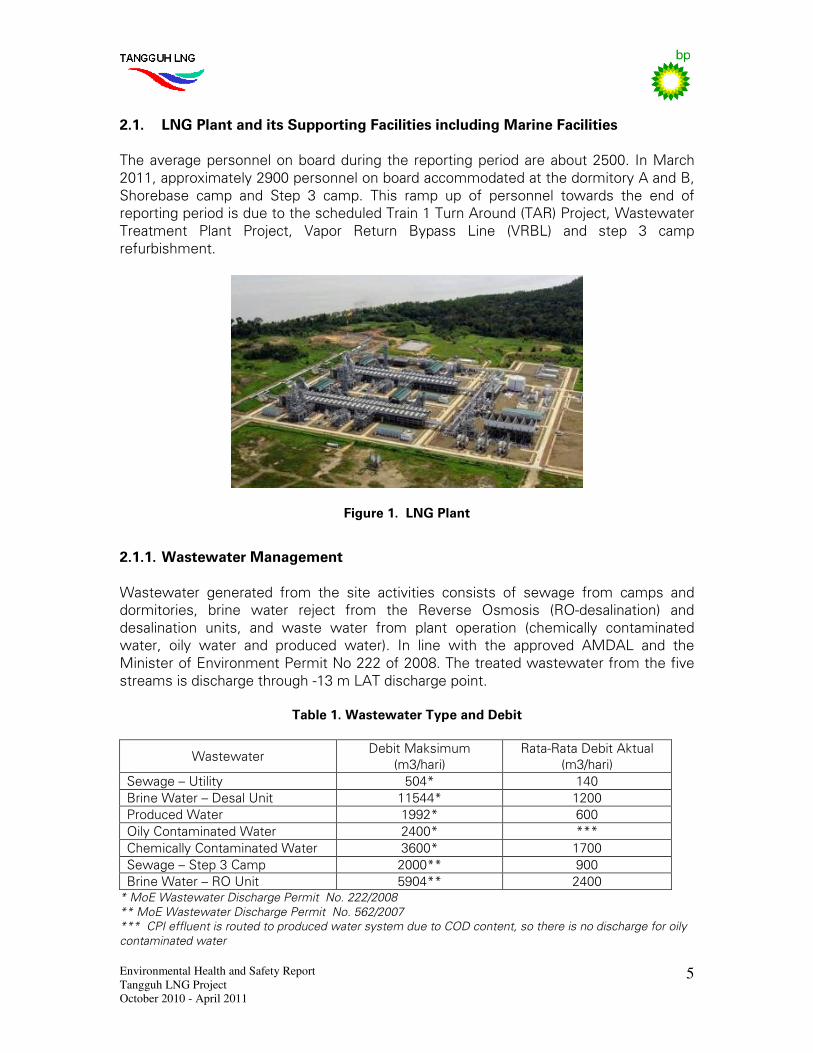
Wastewater� generated� from� the� site� activities� consists� of� sewage� from� camps� and�
dormitories,� brine� water� reject� from� the� Reverse� Osmosis� (RO-desalination)� and�
desalination� units,� and� waste� water� from� plant� operation� (chemically� contaminated�
water,� oily� water� and� produced� water).� In� line� with� the� approved� AMDAL� and� the�
Minister�of�Environment�Permit�No�222�of�2008.�The�treated�wastewater�from�the�five�
streams�is�discharge�through�-13�m�LAT�discharge�point.�
�Table 1. Wastewater Type and Debit
Wastewater�Debit�Maksimum�
(m3/hari)�
Rata-Rata�Debit�Aktual�
(m3/hari)�
Sewage�–�Utility��� 504*� 140�
Brine�Water�–�Desal�Unit�� 11544*� 1200�
Produced�Water� 1992*� 600�
Oily�Contaminated�Water� 2400*� ***�
Chemically�Contaminated�Water� 3600*� 1700�
Sewage�–�Step�3�Camp� 2000**� 900�
Brine�Water�–�RO�Unit� 5904**� 2400�
* MoE Wastewater Discharge Permit No. 222/2008
** MoE Wastewater Discharge Permit No. 562/2007
*** CPI effluent is routed to produced water system due to COD content, so there is no discharge for oily
contaminated water
�
Environmental Health and Safety Report
Tangguh LNG Project
October 2010 - April 2011
6
Sewage
Sewage� from� dormitory� A� and� B� as� well� as� from� Admin� building� and� Main� Control�
Building�is�processed�in�the�permanent�STP,�while�two�STPs�in�Step�3�(Zone�A�and�Zone�
C)�treat�sewage�from�Step�3�Camps�and�other�related�buildings.�One�STP�(Zone�B)�has�
been� dedicated� solely� to� treat� produced� water� from� plant� since� January� 2010.� The�
treated�waste�water�from�both�constructions�STP�and�permanent�STP�is�discharged�to�-
13m�LAT�outfall�line�at�the�LNG�jetty.��
�
Short� term� and� long� term� remediation� effort� is� currently� in� progress� to� rectify� an�
overflow�event�occurred�on�the�vent�line�of�treated�STP/WWTP�wastewater�located�at�
LNG�Tank�#2�in�December�2010.�Temporary�discharge�pipeline�at�the�construction�jetty�
which�was�built�as�a�temporary�discharge�line�during�construction�stage�before�the�-13�
LAT�pipeline�can�be�installed�at�the�LNG�jetty,�has�to�be�partially�opened�25%�in�order�to�
stop� the� vent� line� overflow.� Initially� it�was� suspected� that�wastewater� pressure� flow�
from�RO�was�much� larger� that� STP/WWTP�which� resulted�wastewater� flow�plugging�
from�STP/WWTP�to�-13�meter�LAT�common�outfall�pipeline.��
�
Further�rectification�efforts��will�be�performed�as�follows:�
1. Short� term:� to� install� vent� line�on�pipeline�A�spool� at�BOG�area� to� release�air� trap�
inside� the� spool.� � The� vent� line� installation�work�was� done� on� 13�April� 2011.� The�
ventline�so�far�working�well�and�continued�to�be�monitored.��
�
2. Long�term:�to�separate�STP/WWTP�and�reject�brine�discharge�line�by�disconnecting�
2�reject�brine�pipeline�on�pipeline�A.�Modification�of� reject�brine�collection�pond�at�
RO�unit�shall�be�done�in�order�to�prevent�overflow�by�expanding�collection�pond�to�a�
capacity�of�24�m3.�The�work�is�planned�to�complete�by�early�4th�quarter�2011.�After�
the� reject� brine� discharge� is� disconnected� and� necessary� technical� testing� is�
performed�to�the�system�integrity,�the�temporary�discharge�pipeline�at�construction�
jetty�will�be�removed�
�
About�40� cubic�meters�per�day� intermittently� of� the� combined� treated�wastewater� of�
STP/WWTP�and�reject�brine�is�currently�still�being�discharged�to�the�emergency�pipeline�
at�the�Construction�Jetty.�Wastewater�from�the�discharge�point�at�Construction�Jetty�is�
sampled�for�laboratory�analysis.�Analysis�result�by�external�laboratory�dated�15�February�
2011�shows�that�all�wastewater�parameters�are�in�compliance�with�regulations.�
�
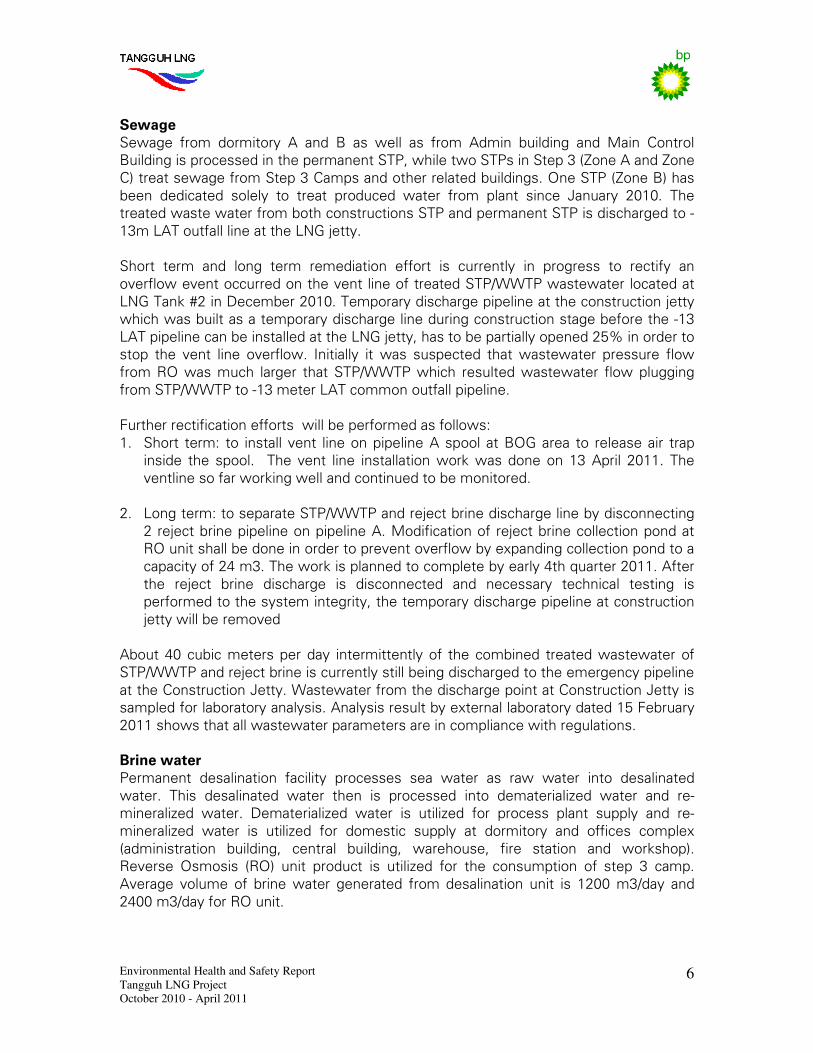
Brine water
Permanent� desalination� facility� processes� sea� water� as� raw� water� into� desalinated�
water.� This� desalinated� water� then� is� processed� into� dematerialized� water� and� re-
mineralized� water.� Dematerialized� water� is� utilized� for� process� plant� supply� and� re-
mineralized� water� is� utilized� for� domestic� supply� at� dormitory� and� offices� complex�
(administration� building,� central� building,� warehouse,� fire� station� and� workshop).�
Reverse� Osmosis� (RO)� unit� product� is� utilized� for� the� consumption� of� step� 3� camp.�
Average� volume� of� brine�water� generated� from� desalination� unit� is� 1200�m3/day� and�
2400�m3/day�for�RO�unit.����
�
�
Environmental Health and Safety Report
Tangguh LNG Project
October 2010 - April 2011
7
Produced water
In� this� reporting� period,� produced�water� has� been� implemented� and�managed� as� per�
Mekanisme� Pembinaan� Penaatan� PROPER� -� PROPER� Compliance� Assistance�
Mechanism� (MP3)� letter� from� the�Ministry� of� Environment.� As� stated� in� the� sewage�
section,�some�amount�of�treated�produced�water�from�WWTP�zone�B�discharges�to�the�
temporary�line�at�Construction�Jetty.���
�
Average� volume�of� treated� produced�water� generated� from�WWTP� zone�B� at� Step� 3�
camp�is�approximately�600�m3/day.�
�
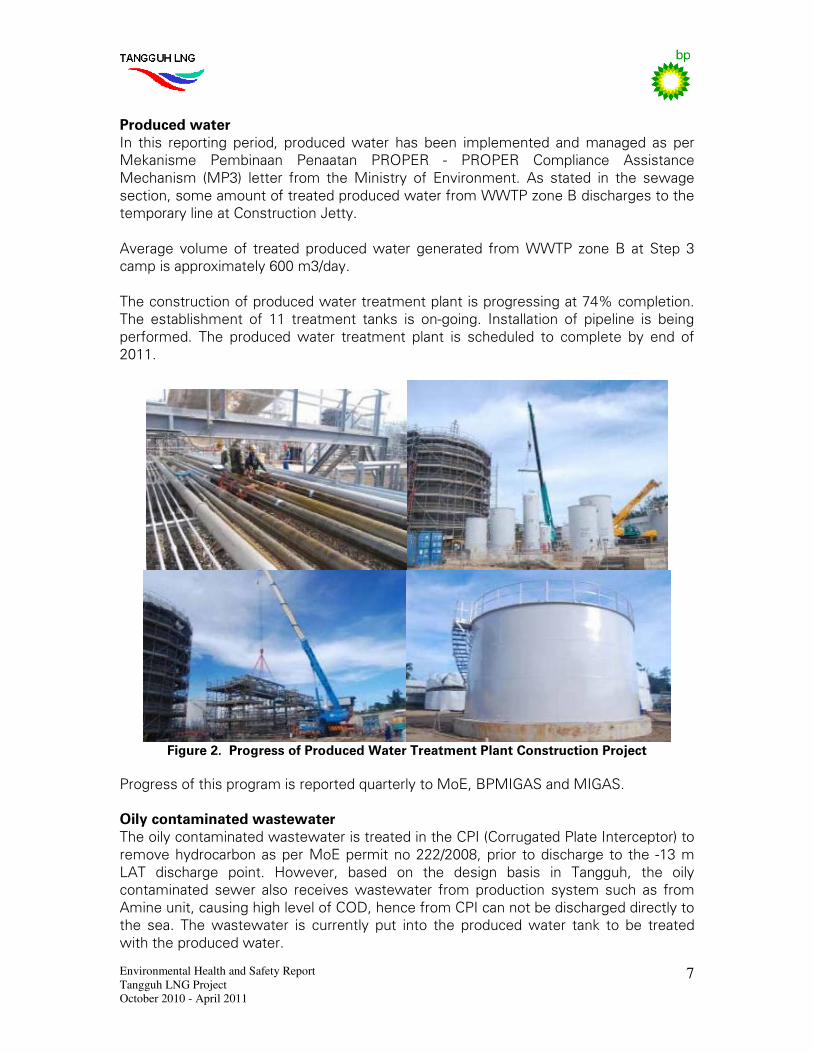
The�construction�of�produced�water�treatment�plant�is�progressing�at�74%�completion.�
The� establishment� of� 11� treatment� tanks� is� on-going.� Installation� of� pipeline� is� being�
performed.� The� produced�water� treatment� plant� is� scheduled� to� complete� by� end� of�
2011.��
Figure 2. Progress of Produced Water Treatment Plant Construction Project
Progress�of�this�program�is�reported�quarterly�to�MoE,�BPMIGAS�and�MIGAS.��
�
Oily contaminated wastewater
The�oily�contaminated�wastewater�is�treated�in�the�CPI�(Corrugated�Plate�Interceptor)�to�
remove�hydrocarbon�as�per�MoE�permit�no�222/2008,�prior� to�discharge� to� the� -13�m�
LAT� discharge� point.� However,� based� on� the� design� basis� in� Tangguh,� the� oily�
contaminated� sewer� also� receives�wastewater� from� production� system� such� as� from�
Amine�unit,�causing�high�level�of�COD,�hence�from�CPI�can�not�be�discharged�directly�to�
the� sea.� The�wastewater� is� currently� put� into� the� produced�water� tank� to� be� treated�
with�the�produced�water.��
�
Environmental Health and Safety Report
Tangguh LNG Project
October 2010 - April 2011
8
Chemically contaminated wastewater
The�chemically�contaminated�wastewater�is�treated�in�the�neutralization�pit�to�normalize�
the�pH�level�between�6-9�as�per�MoE�permit�no�222/2008�and�then�discharge�through�
the� -13m�LAT�discharge�point.� The� average�discharge� from� this� source� is� about�1700�
m3/day.�
2.1.2. Solid Waste Management
�
Non�Hazardous�Solid�Waste�
�
The�solid�waste�management�program�at�site�continues�to�improve.�The�activity�of�this�
solid�waste�management� includes�organic�waste� i.e.�food�waste;� recyclable�waste� i.e.�
cans,�bottles,�and�glass;� inert� landfill� i.e.� insulation,�and�Styrofoam;�reusable�waste� i.e.�
used� tyre� and� cement� bag;� and� burnable� waste� i.e.� paper,� cardbox� and� thin� plastic�
sheet.� The�waste�management� facility� at� Tangguh� include� � the� non-hazardous�waste�
incinerator,�wood�chipper�machine�and�composter,�plastic�shredder�and�can�compactor,�
as�well�as�the�operation�of�ex-construction�inert�landfill�and�new�organic�waste�landfill.�
The� waste� profile� generated� during� this� reporting� period� is� presented� in� Monitoring�
Section.�
�
Inert waste�is�disposed�off�to�dedicated�inert�landfill�located�in�the�eastern�side�of�step�3�
camp.�This�landfill�is�lined�with�HDPE�sheets�and�provided�leachate�collection�pit�which�
is� regularly� sampled� by� internal� and� external� laboratory.�Waste� to� be� disposed� off� to�
inert� landfill� shall�be�completed�with�waste� transfer�note�containing� type,�volume�and�
generator�of�waste.�The�report��of�the�inert�waste�is�updated�in�monthly�basis.���
�
The� reusable waste� such� as� tyre,� cement� bags� and� timber� waste� are� stockpiled� at�
Central�Waste�Accumulation�Area�(CWAA)�located�near�non�hazardous�waste�container.�
This�waste�is�available�for�other�contractors�wanting�to�reuse�it.�
�
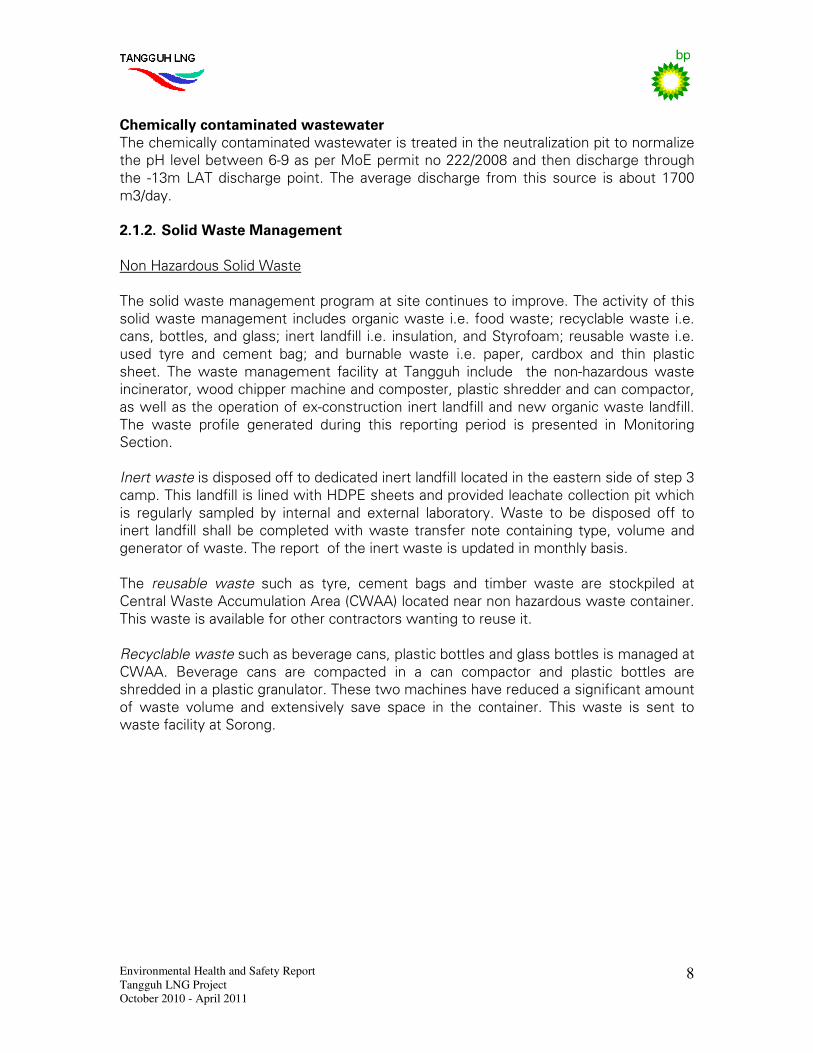
Recyclable waste�such�as�beverage�cans,�plastic�bottles�and�glass�bottles�is�managed�at�
CWAA.� Beverage� cans� are� compacted� in� a� can� compactor� and� plastic� bottles� are�
shredded�in�a�plastic�granulator.�These�two�machines�have�reduced�a�significant�amount�
of� waste� volume� and� extensively� save� space� in� the� container.� This�waste� is� sent� to�
waste�facility�at�Sorong.�
�
�
Environmental Health and Safety Report
Tangguh LNG Project
October 2010 - April 2011
9
� �Figure 3. Plastic Granulator and Can Compactor
�
Under� the�PSC�Scheme,� scrap�metals� are� categorized� as�national� asset�and�needs� to�
undergo�write�off�process�approval�prior�to�disposal.�This�waste� is�currently�stockpiled�
at�Shorebase�area�and�the�record�of�the�waste�is�maintained.�This�waste�is�contained�in�
wooden�boxes�until�the�write�off�process�finalized.��
�
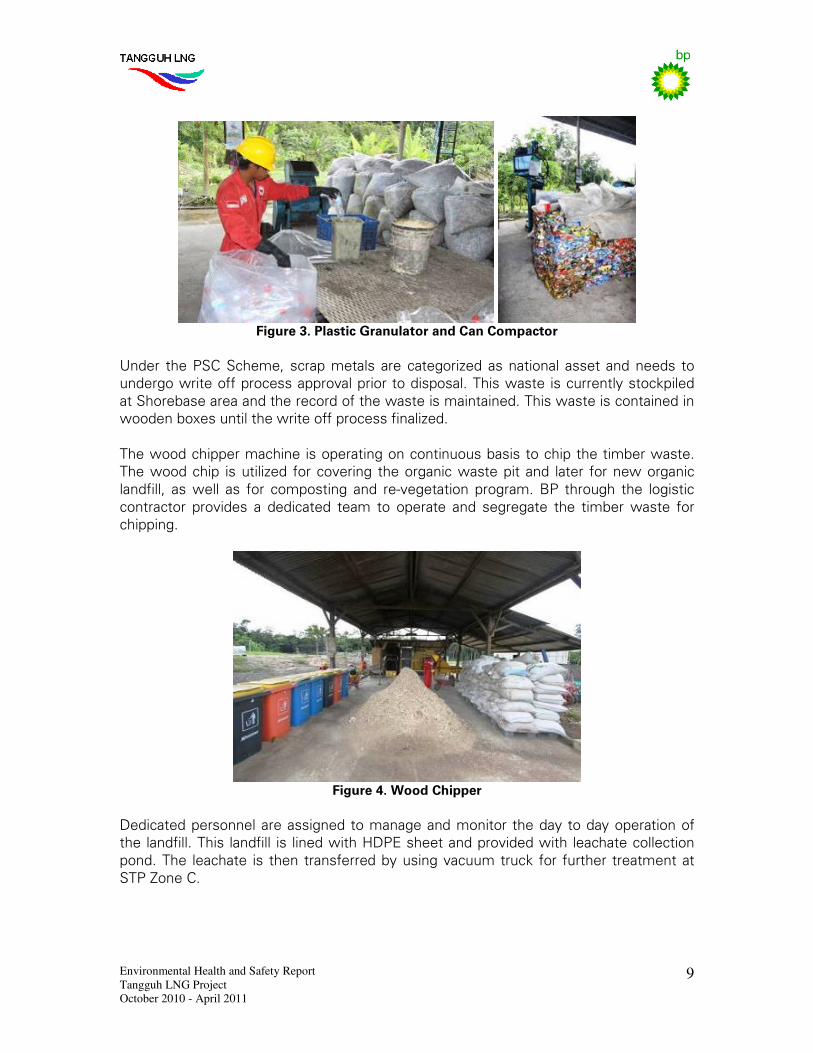
The�wood�chipper�machine�is�operating�on�continuous�basis�to�chip�the�timber�waste.�
The�wood�chip� is�utilized� for�covering� the�organic�waste�pit� and� later� for�new�organic�
landfill,� as�well� as� for� composting� and� re-vegetation� program.�BP� through� the� logistic�
contractor� provides� a� dedicated� team� to� operate� and� segregate� the� timber�waste� for�
chipping.�
�
�Figure 4. Wood Chipper
�
Dedicated�personnel�are�assigned�to�manage�and�monitor� the�day� to�day�operation�of�
the� landfill.�This� landfill� is� lined�with�HDPE�sheet�and�provided�with� leachate�collection�
pond.�The� leachate� is� then� transferred�by�using�vacuum�truck� for� further� treatment�at�
STP�Zone�C.��
�
�
Environmental Health and Safety Report
Tangguh LNG Project
October 2010 - April 2011
10
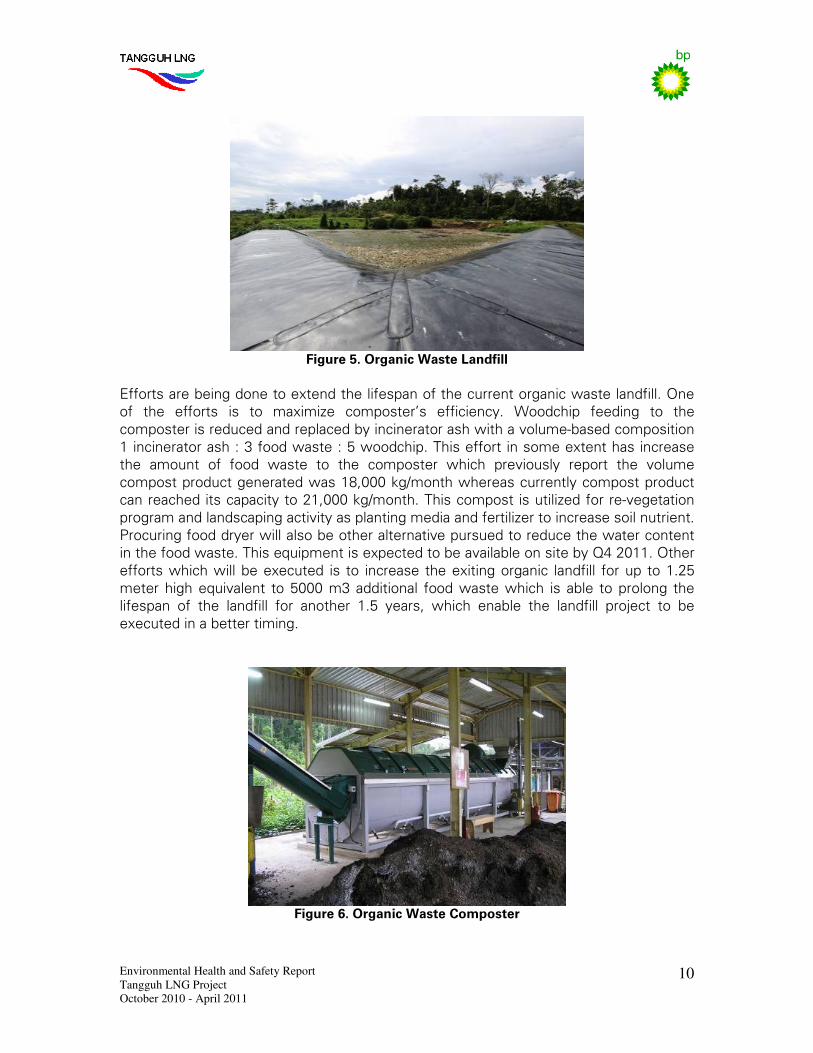
�Figure 5. Organic Waste Landfill
�
Efforts�are�being�done�to�extend�the�lifespan�of�the�current�organic�waste�landfill.�One�
of� the� efforts� is� to� maximize� composter’s� efficiency.� Woodchip� feeding� to� the�
composter�is�reduced�and�replaced�by�incinerator�ash�with�a�volume-based�composition�
1�incinerator�ash�:�3�food�waste�:�5�woodchip.�This�effort�in�some�extent�has�increase�
the� amount� of� food� waste� to� the� composter� which� previously� report� the� volume�
compost�product�generated�was�18,000�kg/month�whereas�currently�compost�product�
can�reached�its�capacity�to�21,000�kg/month.�This�compost� is�utilized�for�re-vegetation�
program�and�landscaping�activity�as�planting�media�and�fertilizer�to�increase�soil�nutrient.�
Procuring�food�dryer�will�also�be�other�alternative�pursued�to�reduce�the�water�content�
in�the�food�waste.�This�equipment�is�expected�to�be�available�on�site�by�Q4�2011.�Other�
efforts�which�will� be�executed� is� to� increase� the�exiting�organic� landfill� for�up� to�1.25�
meter�high�equivalent� to�5000�m3�additional� food�waste�which� is� able� to�prolong� the�
lifespan� of� the� landfill� for� another� 1.5� years,� which� enable� the� landfill� project� to� be�
executed�in�a�better�timing.����
�
�
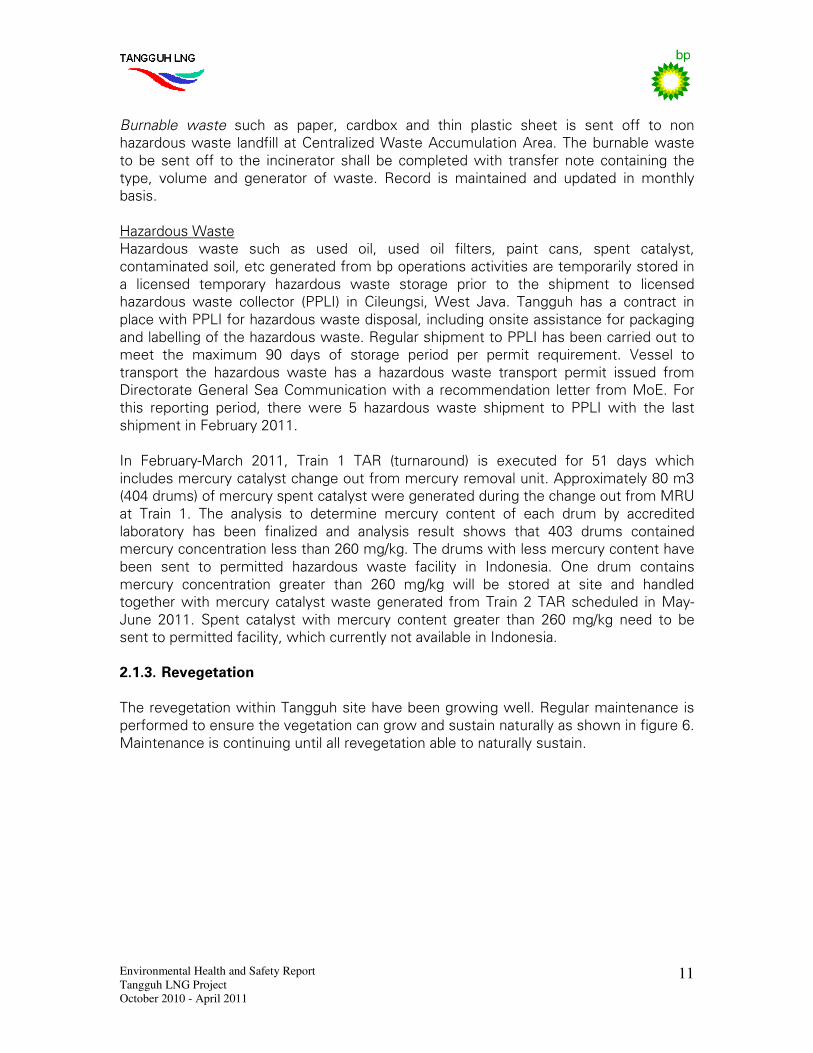
�Figure 6. Organic Waste Composter
�
�
Environmental Health and Safety Report
Tangguh LNG Project
October 2010 - April 2011
11
Burnable waste� such� as� paper,� cardbox� and� thin� plastic� sheet� is� sent� off� to� non�
hazardous�waste� landfill�at�Centralized�Waste�Accumulation�Area.�The�burnable�waste�
to�be� sent�off� to� the� incinerator� shall� be� completed�with� transfer� note� containing� the�
type,� volume� and� generator� of� waste.� Record� is� maintained� and� updated� in� monthly�
basis.��
�
Hazardous�Waste�
Hazardous� waste� such� as� used� oil,� used� oil� filters,� paint� cans,� spent� catalyst,�
contaminated�soil,�etc�generated�from�bp�operations�activities�are�temporarily�stored�in�
a� licensed� temporary� hazardous� waste� storage� prior� to� the� shipment� to� licensed�
hazardous� waste� collector� (PPLI)� in� Cileungsi,�West� Java.� Tangguh� has� a� contract� in�
place�with�PPLI�for�hazardous�waste�disposal,�including�onsite�assistance�for�packaging�
and�labelling�of�the�hazardous�waste.�Regular�shipment�to�PPLI�has�been�carried�out�to�
meet� the� maximum� 90� days� of� storage� period� per� permit� requirement.� Vessel� to�
transport� the� hazardous� waste� has� a� hazardous� waste� transport� permit� issued� from�
Directorate�General�Sea�Communication�with�a�recommendation� letter� from�MoE.�For�
this� reporting� period,� there� were� 5� hazardous� waste� shipment� to� PPLI� with� the� last�
shipment�in�February�2011.��
�
In� February-March� 2011,� Train� 1� TAR� (turnaround)� is� executed� for� 51� days� which�
includes�mercury�catalyst�change�out�from�mercury�removal�unit.�Approximately�80�m3�
(404�drums)�of�mercury�spent�catalyst�were�generated�during�the�change�out�from�MRU�
at� Train� 1.� The� analysis� to� determine� mercury� content� of� each� drum� by� accredited�
laboratory� has� been� finalized� and� analysis� result� shows� that� 403� drums� contained�
mercury�concentration�less�than�260�mg/kg.�The�drums�with�less�mercury�content�have�
been� sent� to� permitted� hazardous� waste� facility� in� Indonesia.� One� drum� contains�
mercury� concentration� greater� than� 260� mg/kg� will� be� stored� at� site� and� handled�
together�with�mercury� catalyst�waste�generated� from�Train�2�TAR�scheduled� in�May-
June� 2011.� Spent� catalyst�with�mercury� content� greater� than� 260�mg/kg� need� to� be�
sent�to�permitted�facility,�which�currently�not�available�in�Indonesia.��
�
2.1.3. Revegetation
�
The�revegetation�within�Tangguh�site�have�been�growing�well.�Regular�maintenance�is�
performed�to�ensure�the�vegetation�can�grow�and�sustain�naturally�as�shown�in�figure�6.�
Maintenance�is�continuing�until�all�revegetation�able�to�naturally�sustain.�
�
Environmental Health and Safety Report
Tangguh LNG Project
October 2010 - April 2011
12
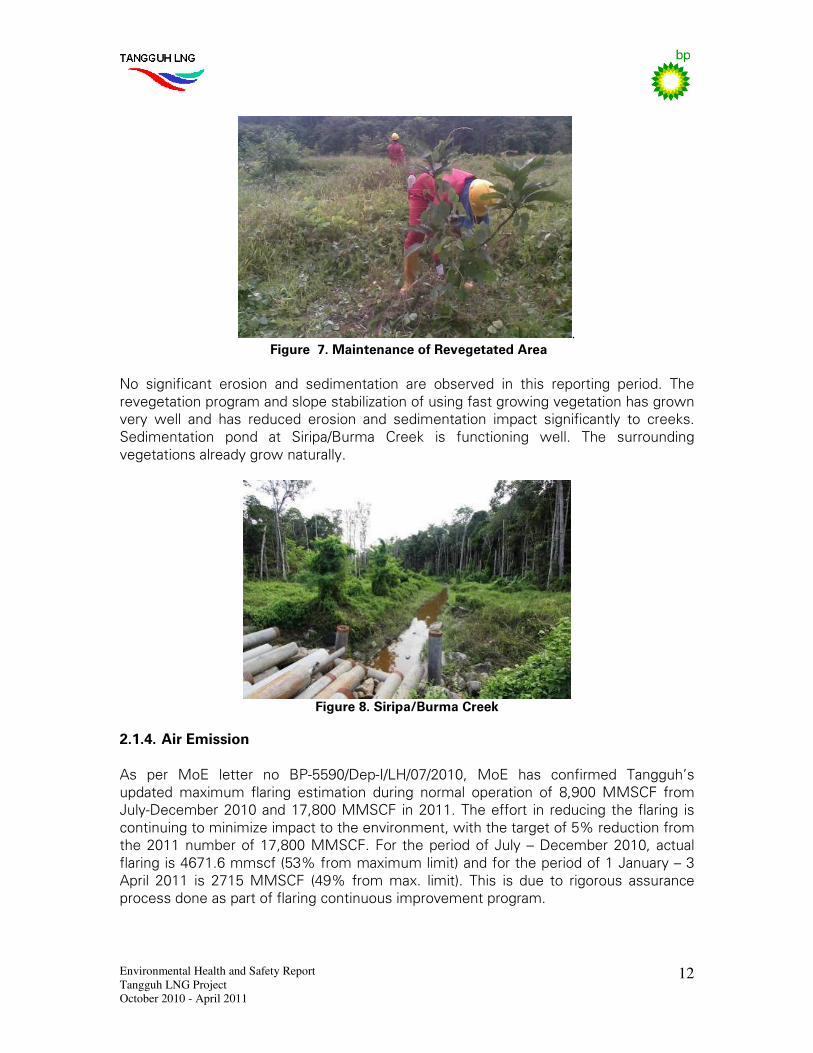
. Figure 7. Maintenance of Revegetated Area
No� significant� erosion� and� sedimentation� are� observed� in� this� reporting� period.� The�
revegetation�program�and�slope�stabilization�of�using�fast�growing�vegetation�has�grown�
very� well� and� has� reduced� erosion� and� sedimentation� impact� significantly� to� creeks.�
Sedimentation� pond� at� Siripa/Burma� Creek� is� functioning� well.� The� surrounding�
vegetations�already�grow�naturally.�
Figure 8. Siripa/Burma Creek
2.1.4. Air Emission
�
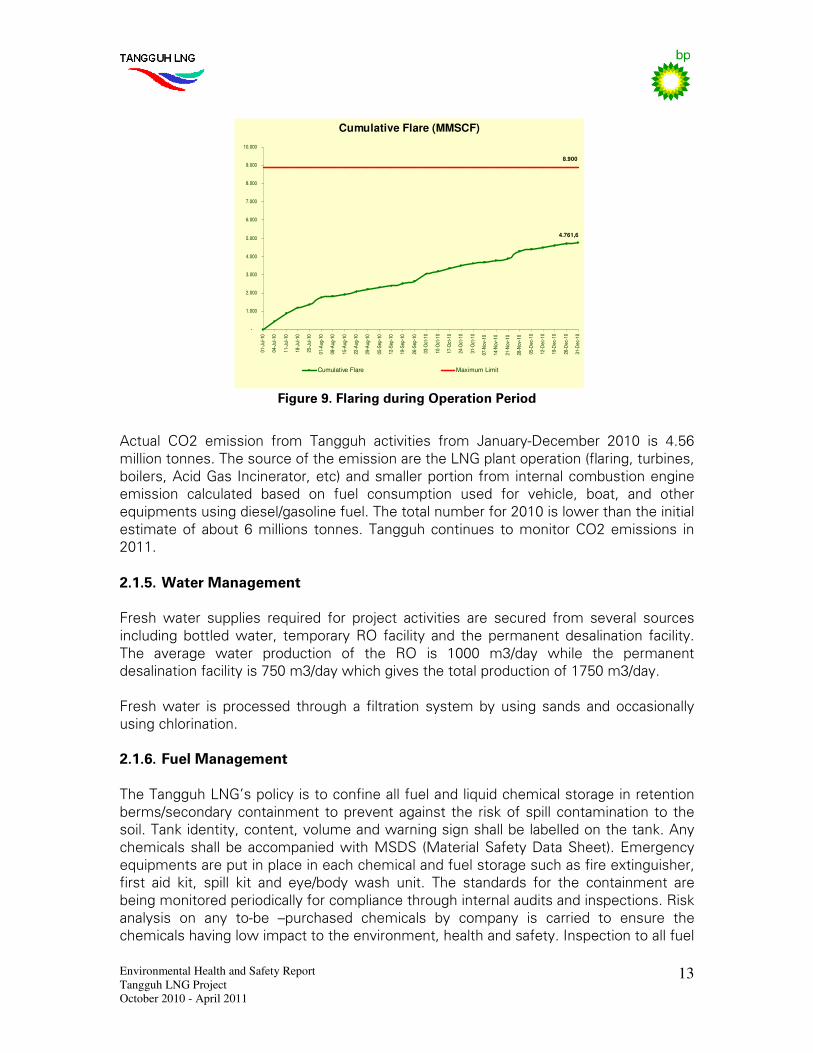
As� per� MoE� letter� no� BP-5590/Dep-I/LH/07/2010,� MoE� has� confirmed� Tangguh’s�
updated�maximum� flaring� estimation� during� normal� operation� of� 8,900�MMSCF� from�
July-December�2010�and�17,800�MMSCF� in�2011.�The�effort� in� reducing� the�flaring� is�
continuing�to�minimize�impact�to�the�environment,�with�the�target�of�5%�reduction�from�
the�2011�number�of�17,800�MMSCF.�For� the�period�of�July�–�December�2010,�actual�
flaring�is�4671.6�mmscf�(53%�from�maximum�limit)�and�for�the�period�of�1�January�–�3�
April� 2011� is� 2715�MMSCF� (49%� from�max.� limit).� This� is� due� to� rigorous� assurance�
process�done�as�part�of�flaring�continuous�improvement�program.��
�
�
Environmental Health and Safety Report
Tangguh LNG Project
October 2010 - April 2011
13
�
Cumulative Flare (MMSCF)
4.761,6
8.900
-
1.000
2.000
3.000
4.000
5.000
6.000
7.000
8.000
9.000
10.000
01-J
ul-1
0
04-J
ul-1
0
11-J
ul-1
0
18-J
ul-1
0
25-J
ul-1
0
01-A
ug-1
0
08-A
ug-1
0
15-A
ug-1
0
22-A
ug-1
0
29-A
ug-1
0
05-S
ep-1
0
12-S
ep-1
0
19-S
ep-1
0
26-S
ep-1
0
03-O
ct-1
0
10-O
ct-1
0
17-O
ct-1
0
24-O
ct-1
0
31-O
ct-1
0
07-N
ov-1
0
14-N
ov-1
0
21-N
ov-1
0
28-N
ov-1
0
05-D
ec-1
0
12-D
ec-1
0
19-D
ec-1
0
26-D
ec-1
0
31-D
ec-1
0
Cumulative Flare Maximum Limit
�Figure 9. Flaring during Operation Period
�
Actual� CO2� emission� from� Tangguh� activities� from� January-December� 2010� is� 4.56�
million�tonnes.�The�source�of�the�emission�are�the�LNG�plant�operation�(flaring,�turbines,�
boilers,�Acid�Gas� Incinerator,�etc)�and�smaller�portion�from�internal�combustion�engine�
emission� calculated� based� on� fuel� consumption� used� for� vehicle,� boat,� and� other�
equipments�using�diesel/gasoline�fuel.�The�total�number�for�2010�is�lower�than�the�initial�
estimate�of� about�6�millions� tonnes.� Tangguh�continues� to�monitor�CO2�emissions� in�
2011.�
2.1.5. Water Management
�
Fresh�water� supplies� required� for� project� activities� are� secured� from� several� sources�
including� bottled�water,� temporary�RO� facility� and� the� permanent� desalination� facility.�
The� average� water� production� of� the� RO� is� 1000� m3/day� while� the� permanent�
desalination�facility�is�750�m3/day�which�gives�the�total�production�of�1750�m3/day.�
�
Fresh�water� is� processed� through� a� filtration� system�by� using� sands� and� occasionally�
using�chlorination.��
�
2.1.6. Fuel Management
�
The�Tangguh�LNG’s�policy�is�to�confine�all�fuel�and�liquid�chemical�storage�in�retention�
berms/secondary�containment� to�prevent�against� the� risk�of�spill�contamination� to� the�
soil.�Tank�identity,�content,�volume�and�warning�sign�shall�be�labelled�on�the�tank.�Any�
chemicals�shall�be�accompanied�with�MSDS� (Material�Safety�Data�Sheet).�Emergency�
equipments�are�put�in�place�in�each�chemical�and�fuel�storage�such�as�fire�extinguisher,�
first� aid� kit,� spill� kit� and� eye/body�wash� unit.� The� standards� for� the� containment� are�
being�monitored�periodically�for�compliance�through�internal�audits�and�inspections.�Risk�
analysis� on� any� to-be� –purchased� chemicals� by� company� is� carried� to� ensure� the�
chemicals�having�low�impact�to�the�environment,�health�and�safety.�Inspection�to�all�fuel�
�
Environmental Health and Safety Report
Tangguh LNG Project
October 2010 - April 2011
14
storage�and�chemical�storage� is�conducted� regularly.�Any� findings�from�the� inspection�
recorded� in� the� inspection� checklist� and� followed� up� accordingly.� As� part� of� the�
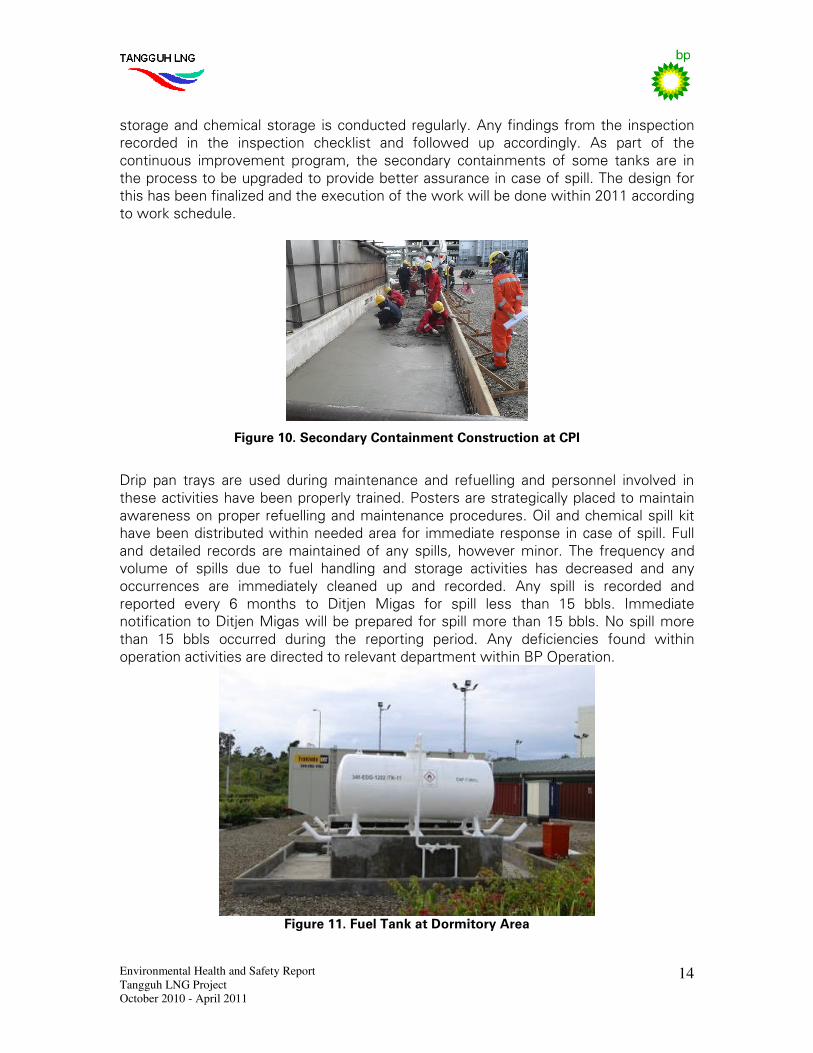
continuous� improvement� program,� the� secondary� containments� of� some� tanks� are� in�
the�process�to�be�upgraded�to�provide�better�assurance�in�case�of�spill.�The�design�for�
this�has�been�finalized�and�the�execution�of�the�work�will�be�done�within�2011�according�
to�work�schedule.�
�
Figure 10. Secondary Containment Construction at CPI
�
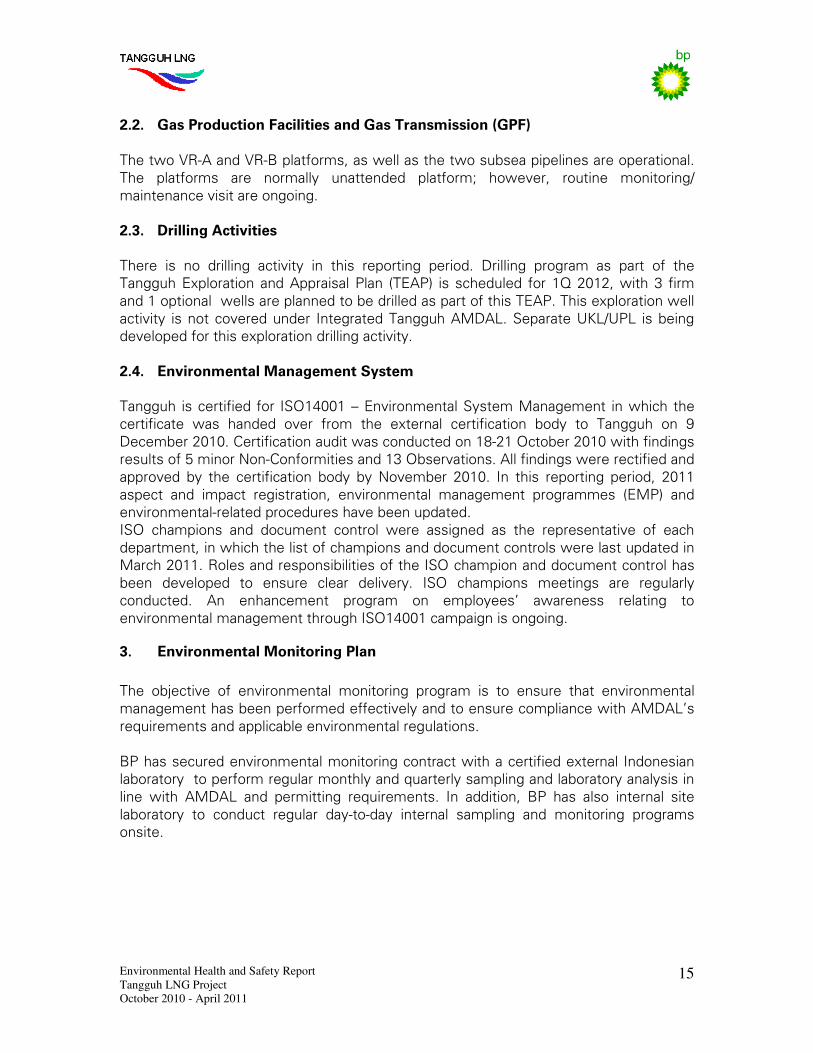
Drip� pan� trays� are� used� during�maintenance� and� refuelling� and� personnel� involved� in�
these�activities�have�been�properly�trained.�Posters�are�strategically�placed�to�maintain�
awareness�on�proper�refuelling�and�maintenance�procedures.�Oil�and�chemical�spill�kit�
have�been�distributed�within�needed�area�for� immediate�response� in�case�of�spill.�Full�
and� detailed� records� are�maintained� of� any� spills,� however�minor.� The� frequency� and�
volume� of� spills� due� to� fuel� handling� and� storage� activities� has� decreased� and� any�
occurrences� are� immediately� cleaned� up� and� recorded.� Any� spill� is� recorded� and�
reported� every� 6� months� to� Ditjen� Migas� for� spill� less� than� 15� bbls.� Immediate�
notification�to�Ditjen�Migas�will�be�prepared� for�spill�more�than�15�bbls.�No�spill�more�
than� 15� bbls� occurred� during� the� reporting� period.� Any� deficiencies� found� within�
operation�activities�are�directed�to�relevant�department�within�BP�Operation.���
Figure 11. Fuel Tank at Dormitory Area
�
Environmental Health and Safety Report
Tangguh LNG Project
October 2010 - April 2011
15
2.2. Gas Production Facilities and Gas Transmission (GPF)
�
The�two�VR-A�and�VR-B�platforms,�as�well�as�the�two�subsea�pipelines�are�operational.�
The� platforms� are� normally� unattended� platform;� however,� routine� monitoring/�
maintenance�visit�are�ongoing.�
�
2.3. Drilling Activities
There� is� no� drilling� activity� in� this� reporting� period.� Drilling� program� as� part� of� the�
Tangguh�Exploration� and�Appraisal�Plan� (TEAP)� is� scheduled� for� 1Q�2012,�with�3� firm�
and�1�optional��wells�are�planned�to�be�drilled�as�part�of�this�TEAP.�This�exploration�well�
activity� is�not�covered�under� Integrated�Tangguh�AMDAL.�Separate�UKL/UPL� is�being�
developed�for�this�exploration�drilling�activity.����
�
2.4. Environmental Management System
Tangguh� is�certified�for� ISO14001�–�Environmental�System�Management� in�which� the�
certificate� was� handed� over� from� the� external� certification� body� to� Tangguh� on� 9�
December�2010.�Certification�audit�was�conducted�on�18-21�October�2010�with�findings�
results�of�5�minor�Non-Conformities�and�13�Observations.�All�findings�were�rectified�and�
approved� by� the� certification� body� by� November� 2010.� In� this� reporting� period,� 2011�
aspect� and� impact� registration,� environmental� management� programmes� (EMP)� and�
environmental-related�procedures�have�been�updated.��
ISO� champions� and� document� control� were� assigned� as� the� representative� of� each�
department,�in�which�the�list�of�champions�and�document�controls�were�last�updated�in�
March�2011.�Roles�and�responsibilities�of�the�ISO�champion�and�document�control�has�
been� developed� to� ensure� clear� delivery.� ISO� champions� meetings� are� regularly�
conducted.� An� enhancement� program� on� employees’� awareness� relating� to�
environmental�management�through�ISO14001�campaign�is�ongoing.��
3. Environmental Monitoring Plan
�
The� objective� of� environmental� monitoring� program� is� to� ensure� that� environmental�
management�has�been�performed�effectively�and�to�ensure�compliance�with�AMDAL’s�
requirements�and�applicable�environmental�regulations.��
�
BP�has�secured�environmental�monitoring�contract�with�a�certified�external� Indonesian�
laboratory��to�perform�regular�monthly�and�quarterly�sampling�and�laboratory�analysis�in�
line� with� AMDAL� and� permitting� requirements.� In� addition,� BP� has� also� internal� site�
laboratory� to� conduct� regular� day-to-day� internal� sampling� and� monitoring� programs�
onsite.��
�
�
Environmental Health and Safety Report
Tangguh LNG Project
October 2010 - April 2011
16
3.1. LNG Plant and its Supporting Facilities including Marine Facilities
�
3.1.1. Wastewater Monitoring
Sewage
The� treated� effluent� from� Sewage� Treatment� Plants� is� sampled� and� analysed� at� the�
discharge�points�prior�to�discharge�into�the�seawater�at�the�common�outfall� -13�meter�
LAT�The�effluent�discharge�and�receiving�ambient�sea�water�are�monitored�weekly�and�
measured�against�the�prevailing�Indonesian�regulations�KEP-112/MENLH/2003�and�KEP�
51/2004�respectively�as�stipulated� in�AMDAL�and�applicable� Indonesian�regulation�and�
permit�no.562/2007,�permit�no.�222/2008.���
�
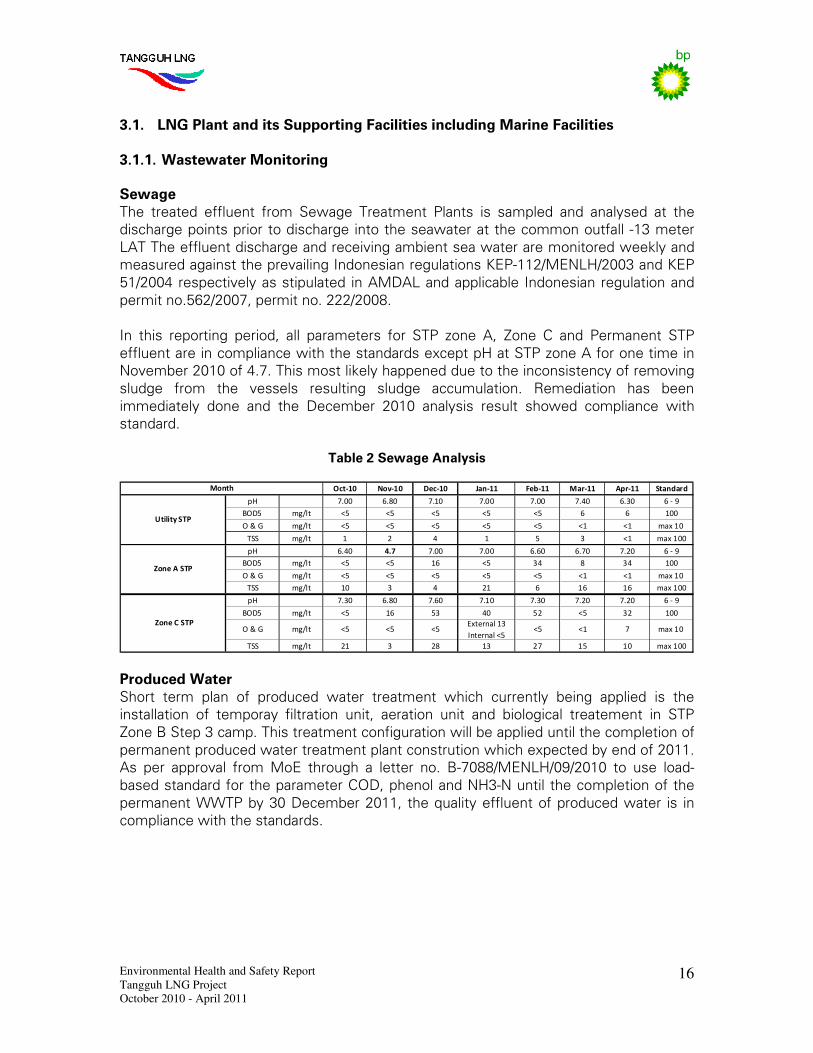
In� this� reporting� period,� all� parameters� for� STP� zone� A,� Zone� C� and� Permanent� STP�
effluent�are�in�compliance�with�the�standards�except�pH�at�STP�zone�A�for�one�time�in�
November�2010�of�4.7.�This�most�likely�happened�due�to�the�inconsistency�of�removing�
sludge� from� the� vessels� resulting� sludge� accumulation.� Remediation� has� been�
immediately� done� and� the� December� 2010� analysis� result� showed� compliance� with�
standard.��
�Table 2 Sewage Analysis
Oct-10 Nov-10 Dec-10 Jan-11 Feb-11 Mar-11 Apr-11 Standard
pH 7.00 6.80 7.10 7.00 7.00 7.40 6.30 6 - 9
BOD5 mg/lt <5 <5 <5 <5 <5 6 6 100
O & G mg/lt <5 <5 <5 <5 <5 <1 <1 max 10
TSS mg/lt 1 2 4 1 5 3 <1 max 100
pH 6.40 4.7 7.00 7.00 6.60 6.70 7.20 6 - 9
BOD5 mg/lt <5 <5 16 <5 34 8 34 100
O & G mg/lt <5 <5 <5 <5 <5 <1 <1 max 10
TSS mg/lt 10 3 4 21 6 16 16 max 100
pH 7.30 6.80 7.60 7.10 7.30 7.20 7.20 6 - 9
BOD5 mg/lt <5 16 53 40 52 <5 32 100
O & G mg/lt <5 <5 <5External 13
Internal <5<5 <1 7 max 10
TSS mg/lt 21 3 28 13 27 15 10 max 100
Month
Utility STP
Zone A STP
Zone C STP
��
Produced Water �
Short� term� plan� of� produced� water� treatment� which� currently� being� applied� is� the�
installation� of� temporay� filtration� unit,� aeration� unit� and� biological� treatement� in� STP�
Zone�B�Step�3�camp.�This�treatment�configuration�will�be�applied�until�the�completion�of�
permanent�produced�water�treatment�plant�constrution�which�expected�by�end�of�2011.�
As� per� approval� from�MoE� through� a� letter� no.� B-7088/MENLH/09/2010� to� use� load-
based�standard�for�the�parameter�COD,�phenol�and�NH3-N�until� the�completion�of�the�
permanent�WWTP�by�30�December�2011,� the�quality�effluent�of�produced�water� is� in�
compliance�with�the�standards.���
�
�
Environmental Health and Safety Report
Tangguh LNG Project
October 2010 - April 2011
17
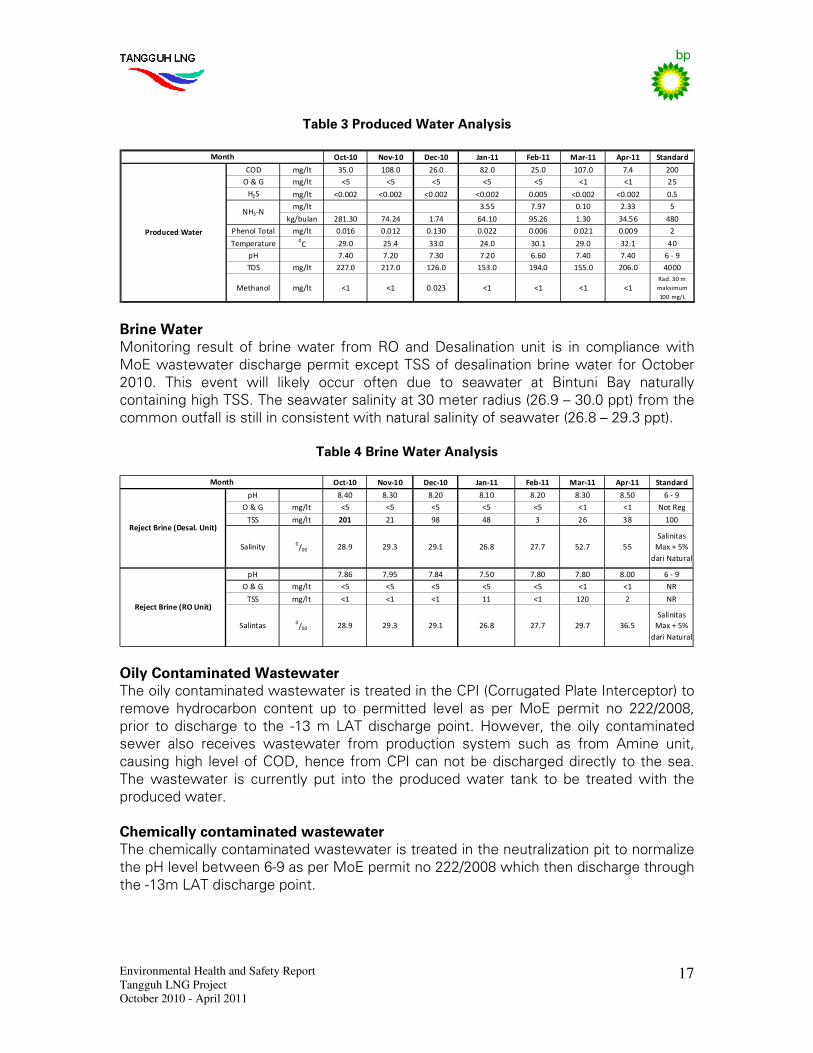
Table 3 Produced Water Analysis
�Oct-10 Nov-10 Dec-10 Jan-11 Feb-11 Mar-11 Apr-11 Standard
COD mg/lt 35.0 108.0 26.0 82.0 25.0 107.0 7.4 200
O & G mg/lt <5 <5 <5 <5 <5 <1 <1 25
H2S mg/lt <0.002 <0.002 <0.002 <0.002 0.005 <0.002 <0.002 0.5
mg/lt 3.55 7.97 0.10 2.33 5
kg/bulan 281.30 74.24 1.74 64.10 95.26 1.30 34.56 480
Phenol Total mg/lt 0.016 0.012 0.130 0.022 0.006 0.021 0.009 2
Temperature0C 29.0 25.4 33.0 24.0 30.1 29.0 32.1 40
pH 7.40 7.20 7.30 7.20 6.60 7.40 7.40 6 - 9
TDS mg/lt 227.0 217.0 126.0 153.0 194.0 155.0 206.0 4000
Methanol mg/lt <1 <1 0.023 <1 <1 <1 <1
Rad. 30 m
maksimum
100 mg/L
Produced Water
Month
NH3-N
� Brine Water
Monitoring� result� of� brine�water� from�RO� and�Desalination� unit� is� in� compliance�with�
MoE�wastewater�discharge�permit�except�TSS�of�desalination�brine�water�for�October�
2010.� This� event� will� likely� occur� often� due� to� seawater� at� Bintuni� Bay� naturally�
containing�high�TSS.�The�seawater�salinity�at�30�meter�radius�(26.9�–�30.0�ppt)�from�the�
common�outfall�is�still�in�consistent�with�natural�salinity�of�seawater�(26.8�–�29.3�ppt).���
�Table 4 Brine Water Analysis
Oct-10 Nov-10 Dec-10 Jan-11 Feb-11 Mar-11 Apr-11 Standard
pH 8.40 8.30 8.20 8.10 8.20 8.30 8.50 6 - 9
O & G mg/lt <5 <5 <5 <5 <5 <1 <1 Not Reg
TSS mg/lt 201 21 98 48 3 26 38 100
Salinity0/00 28.9 29.3 29.1 26.8 27.7 52.7 55
Salinitas
Max + 5%
dari Natural
pH 7.86 7.95 7.84 7.50 7.80 7.80 8.00 6 - 9
O & G mg/lt <5 <5 <5 <5 <5 <1 <1 NR
TSS mg/lt <1 <1 <1 11 <1 120 2 NR
Salintas0/00 28.9 29.3 29.1 26.8 27.7 29.7 36.5
Salinitas
Max + 5%
dari Natural
Reject Brine (RO Unit)
Reject Brine (Desal. Unit)
Month
��
Oily Contaminated Wastewater
The�oily�contaminated�wastewater�is�treated�in�the�CPI�(Corrugated�Plate�Interceptor)�to�
remove� hydrocarbon� content� up� to� permitted� level� as� per�MoE� permit� no� 222/2008,�
prior� to� discharge� to� the� -13�m�LAT�discharge� point.�However,� the� oily� contaminated�
sewer� also� receives� wastewater� from� production� system� such� as� from� Amine� unit,�
causing�high� level�of�COD,�hence�from�CPI�can�not�be�discharged�directly� to�the�sea.�
The�wastewater� is� currently� put� into� the� produced�water� tank� to� be� treated�with� the�
produced�water.��
�
Chemically contaminated wastewater
The�chemically�contaminated�wastewater�is�treated�in�the�neutralization�pit�to�normalize�
the�pH�level�between�6-9�as�per�MoE�permit�no�222/2008�which�then�discharge�through�
the�-13m�LAT�discharge�point.��
�
�
Environmental Health and Safety Report
Tangguh LNG Project
October 2010 - April 2011
18
Table 5 Chemically Contaminated Wastewater Analysis
Oct-10 Nov-10 Dec-10 Jan-11 Feb-11 Mar-11 Apr-11 Standard
pH 7.30 6.30 7.76 6.60 7.40 6.50 6.30 6 - 9
COD mg/lt <10 <10 15.0 <10 <10 40.0 <10 200
TSS mg/lt <1 <1 11 2 3 1 5 100
Toxic Metal mg/lt 0.02 0.05 0.002 0.03 0.2 0.05 0.1 5
Month
Chemically Contaminated
Water (Neut. Pit)
��
3.1.2. Solid Waste Monitoring
�
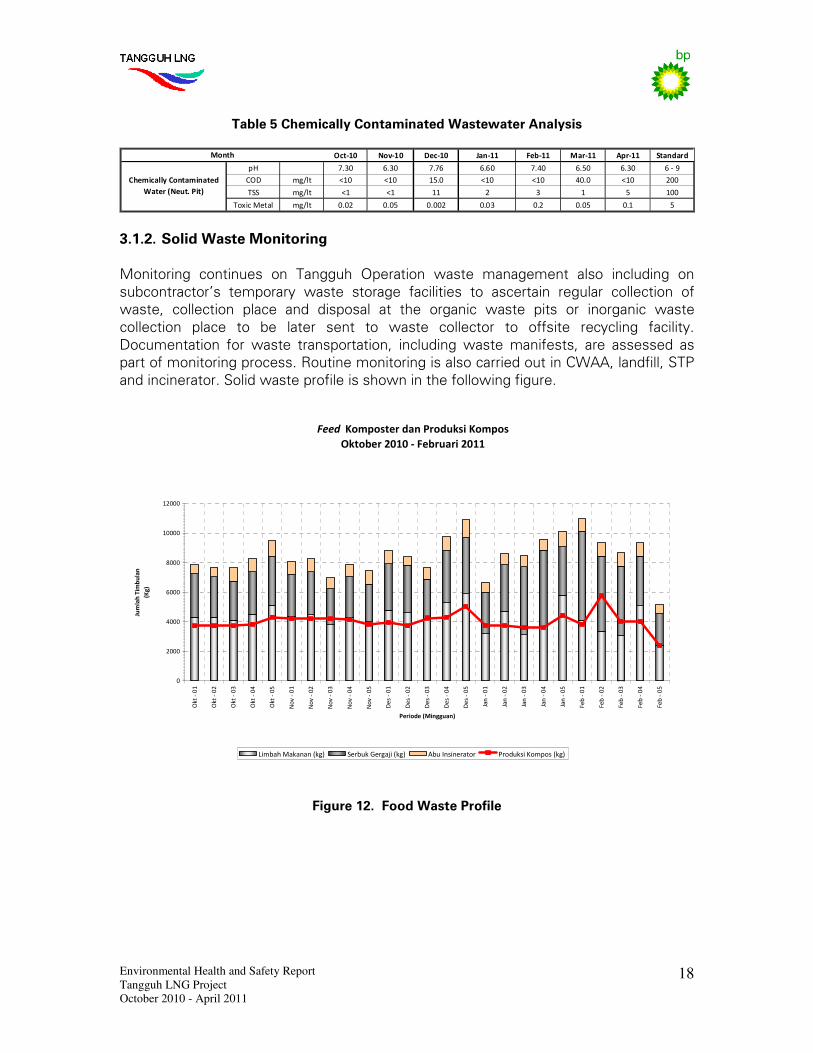
Monitoring� continues� on� Tangguh� Operation� waste� management� also� including� on�
subcontractor’s� temporary� waste� storage� facilities� to� ascertain� regular� collection� of�
waste,� collection� place� and� disposal� at� the� organic� waste� pits� or� inorganic� waste�
collection� place� to� be� later� sent� to� waste� collector� to� offsite� recycling� facility.�
Documentation� for� waste� transportation,� including�waste�manifests,� are� assessed� as�
part�of�monitoring�process.�Routine�monitoring�is�also�carried�out�in�CWAA,�landfill,�STP�
and�incinerator.�Solid�waste�profile�is�shown�in�the�following�figure.�
Feed Komposter dan Produksi Kompos
Oktober 2010 - Februari 2011
0
2000
4000
6000
8000
10000
12000
Okt
- 0
1
Okt
- 0
2
Okt
- 0
3
Okt
- 0
4
Okt
- 0
5
No
v -
01
No
v -
02
No
v -
03
No
v -
04
No
v -
05
De
s -
01
De
s -
02
De
s -
03
De
s -
04
De
s -
05
Jan
- 0
1
Jan
- 0
2
Jan
- 0
3
Jan
- 0
4
Jan
- 0
5
Fe
b -
01
Fe
b -
02
Fe
b -
03
Fe
b -
04
Fe
b -
05
Periode (Mingguan)
Jum
lah
Tim
bu
lan
(Kg
)
Limbah Makanan (kg) Serbuk Gergaji (kg) Abu Insinerator Produksi Kompos (kg)
Figure 12. Food Waste Profile
�
Environmental Health and Safety Report
Tangguh LNG Project
October 2010 - April 2011
19
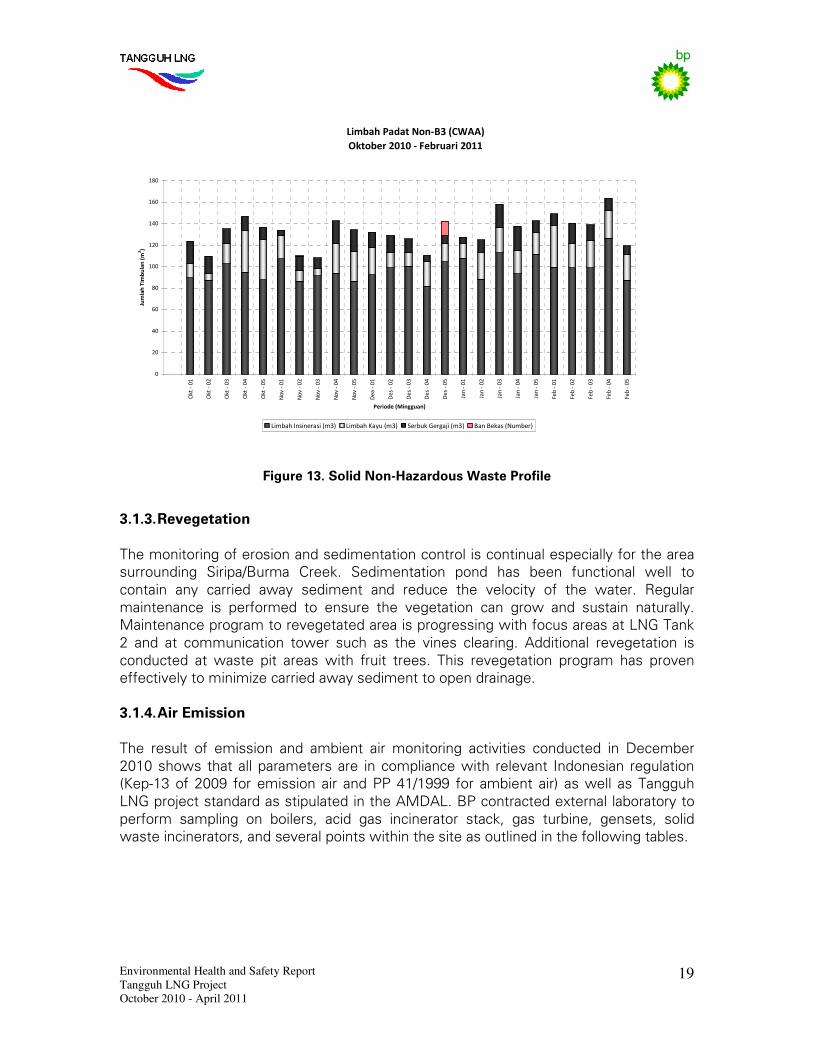
Limbah Padat Non-B3 (CWAA)
Oktober 2010 - Februari 2011
0
20
40
60
80
100
120
140
160
180
Okt
- 0
1
Okt
- 0
2
Okt
- 0
3
Okt
- 0
4
Okt
- 0
5
No
v -
01
No
v -
02
No
v -
03
No
v -
04
No
v -
05
De
a -
01
De
s -
02
De
s -
03
De
s -
04
De
s -
05
Jan
- 0
1
Jan
- 0
2
Jan
- 0
3
Jan
- 0
4
Jan
- 0
5
Fe
b -
01
Fe
b -
02
Fe
b -
03
Fe
b -
04
Fe
b -
05
Periode (Mingguan)
Jum
lah
Tim
bu
lan
(m
3)
Limbah Insinerasi (m3) Limbah Kayu (m3) Serbuk Gergaji (m3) Ban Bekas (Number)
Figure 13. Solid Non-Hazardous Waste Profile
3.1.3. Revegetation
�
The�monitoring�of�erosion�and�sedimentation�control�is�continual�especially�for�the�area�
surrounding� Siripa/Burma� Creek.� Sedimentation� pond� has� been� functional� well� to�
contain� any� carried� away� sediment� and� reduce� the� velocity� of� the� water.� Regular�
maintenance� is� performed� to� ensure� the� vegetation� can� grow� and� sustain� naturally.�
Maintenance�program�to�revegetated�area�is�progressing�with�focus�areas�at�LNG�Tank�
2� and� at� communication� tower� such� as� the� vines� clearing.� Additional� revegetation� is�
conducted� at�waste� pit� areas�with� fruit� trees.� This� revegetation� program� has� proven�
effectively�to�minimize�carried�away�sediment�to�open�drainage.��
�
3.1.4. Air Emission
�
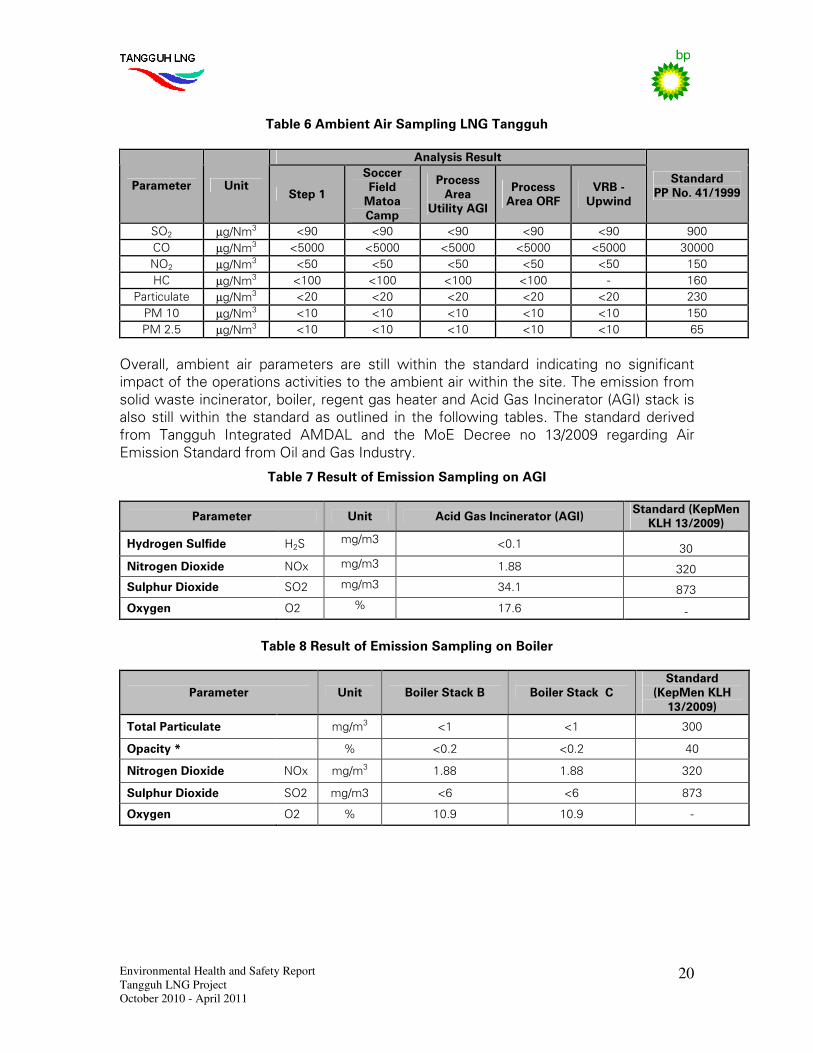
The� result� of� emission� and� ambient� air� monitoring� activities� conducted� in� December�
2010�shows�that�all� parameters�are� in�compliance�with� relevant� Indonesian� regulation�
(Kep-13�of� 2009� for� emission� air� and�PP�41/1999� for� ambient� air)� as�well� as�Tangguh�
LNG�project�standard�as�stipulated�in�the�AMDAL.�BP�contracted�external�laboratory�to�
perform� sampling� on� boilers,� acid� gas� incinerator� stack,� gas� turbine,� gensets,� solid�
waste�incinerators,�and�several�points�within�the�site�as�outlined�in�the�following�tables.��
�
Environmental Health and Safety Report
Tangguh LNG Project
October 2010 - April 2011
20
Table 6 Ambient Air Sampling LNG Tangguh
Analysis Result
Parameter Unit Step 1
Soccer Field
Matoa Camp
Process Area
Utility AGI
Process Area ORF
VRB - Upwind
Standard PP No. 41/1999
SO2� µg/Nm3� <90� <90� <90� <90� <90� 900�
CO� µg/Nm3� <5000� <5000� <5000� <5000� <5000� 30000�
NO2� µg/Nm3� <50� <50� <50� <50� <50� 150�
HC� µg/Nm3� <100� <100� <100� <100� -� 160�
Particulate� µg/Nm3� <20� <20� <20� <20� <20� 230�
PM�10� µg/Nm3� <10� <10� <10� <10� <10� 150�
PM�2.5� µg/Nm3� <10� <10� <10� <10� <10� 65�
Overall,� ambient� air� parameters� are� still� within� the� standard� indicating� no� significant�
impact�of�the�operations�activities�to�the�ambient�air�within�the�site.�The�emission�from�
solid�waste�incinerator,�boiler,�regent�gas�heater�and�Acid�Gas�Incinerator�(AGI)�stack�is�
also� still�within� the� standard� as�outlined� in� the� following� tables.� The� standard�derived�
from� Tangguh� Integrated� AMDAL� and� the� MoE� Decree� no� 13/2009� regarding� Air�
Emission�Standard�from�Oil�and�Gas�Industry.�
Table 7 Result of Emission Sampling on AGI
Parameter Unit Acid Gas Incinerator (AGI) Standard (KepMen
KLH 13/2009)
Hydrogen Sulfide H2S�mg/m3� <0.1� 30�
Nitrogen Dioxide NOx� mg/m3� 1.88� 320�
Sulphur Dioxide SO2� mg/m3� 34.1� 873�
Oxygen O2� %� 17.6� -�
Table 8 Result of Emission Sampling on Boiler
Parameter Unit Boiler Stack B Boiler Stack C Standard
(KepMen KLH
13/2009)
Total Particulate �� mg/m3� <1� <1� 300�
Opacity * �� %� <0.2� <0.2� 40�
Nitrogen Dioxide NOx� mg/m3� 1.88� 1.88� 320�
Sulphur Dioxide SO2� mg/m3� <6� <6� 873�
Oxygen O2� %� 10.9� 10.9� -�
�
Environmental Health and Safety Report
Tangguh LNG Project
October 2010 - April 2011
21
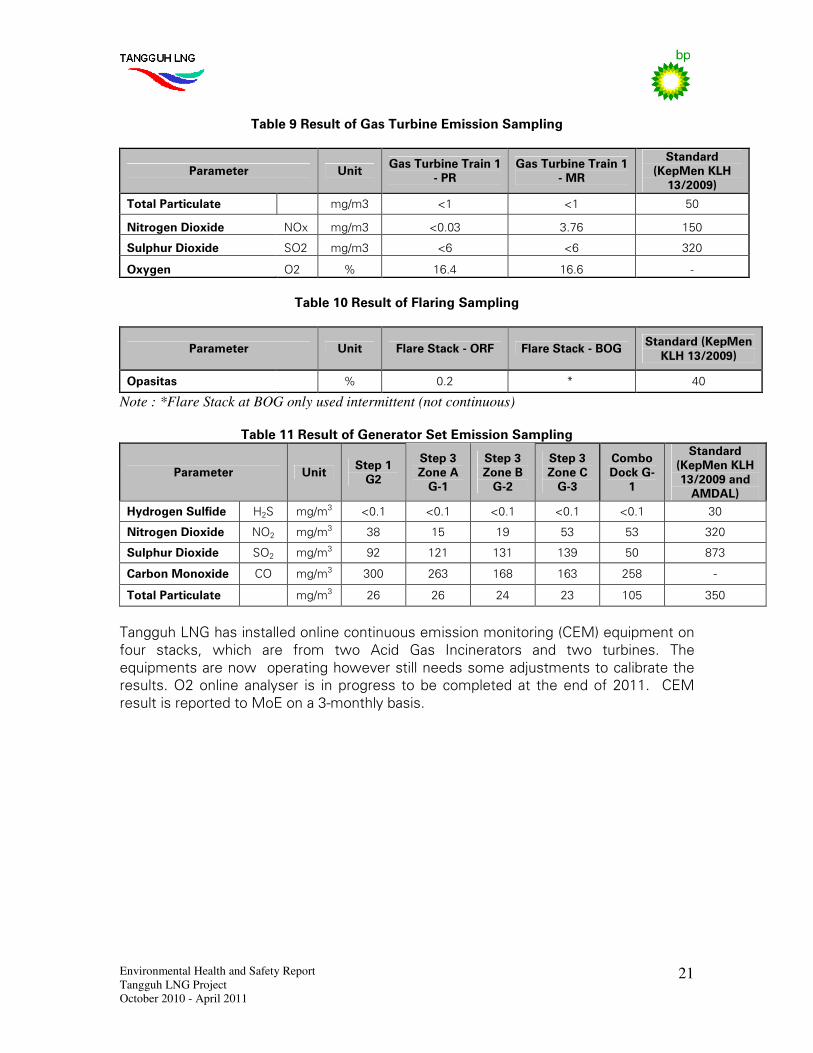
Table 9 Result of Gas Turbine Emission Sampling
Parameter Unit Gas Turbine Train 1
- PR Gas Turbine Train 1
- MR
Standard (KepMen KLH
13/2009)
Total Particulate �� mg/m3� <1� <1� 50�
Nitrogen Dioxide NOx� mg/m3� <0.03� 3.76� 150�
Sulphur Dioxide SO2� mg/m3� <6� <6� 320�
Oxygen O2� %� 16.4� 16.6� -�
Table 10 Result of Flaring Sampling
Parameter Unit Flare Stack - ORF Flare Stack - BOG Standard (KepMen
KLH 13/2009)
Opasitas �� %� 0.2� *�� 40�
Note : *Flare Stack at BOG only used intermittent (not continuous)
Table 11 Result of Generator Set Emission Sampling
Parameter Unit Step 1
G2
Step 3 Zone A
G-1
Step 3 Zone B
G-2
Step 3 Zone C
G-3
Combo Dock G-
1
Standard (KepMen KLH 13/2009 and
AMDAL)
Hydrogen Sulfide H2S� mg/m3� <0.1� <0.1� <0.1� <0.1� <0.1� 30�
Nitrogen Dioxide NO2� mg/m3� 38� 15� 19� 53� 53� 320�
Sulphur Dioxide SO2� mg/m3� 92� 121� 131� 139� 50� 873�
Carbon Monoxide CO� mg/m3� 300� 263� 168� 163� 258� -�
Total Particulate � mg/m3� 26� 26� 24� 23� 105� 350�
Tangguh�LNG�has�installed�online�continuous�emission�monitoring�(CEM)�equipment�on�
four� stacks,� which� are� from� two� Acid� Gas� Incinerators� and� two� turbines.� The�
equipments�are�now��operating�however�still�needs�some�adjustments�to�calibrate�the�
results.�O2�online� analyser� is� in� progress� to�be� completed� at� the�end�of� 2011.� �CEM�
result�is�reported�to�MoE�on�a�3-monthly�basis.��
�
Environmental Health and Safety Report
Tangguh LNG Project
October 2010 - April 2011
22
�
3.1.5. Water Supply
�
The�water�usage�is�monitored�as�per�following�table.�
�Table 12 Water Usage
No Period Average daily consumption(m3)
1� October�2010� 668�
2� November�2010� 770�
3� December�2010� 754�
4� January�2011� 744�
5� February�2011� 810�
6� March�2011� 836�
7� April�2011� 865�
��
3.1.6. Fuel Storage and Handling
�
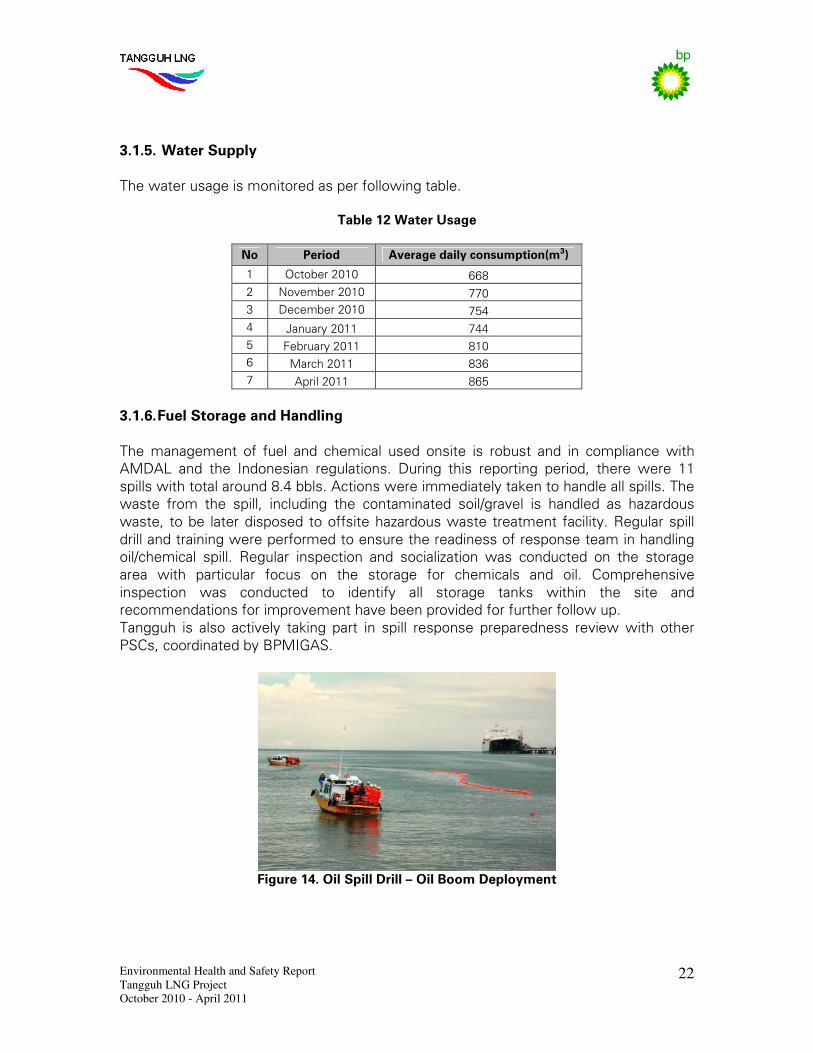
The�management� of� fuel� and� chemical� used� onsite� is� robust� and� in� compliance�with�
AMDAL� and� the� Indonesian� regulations.� During� this� reporting� period,� there� were� 11�
spills�with�total�around�8.4�bbls.�Actions�were�immediately�taken�to�handle�all�spills.�The�
waste� from� the� spill,� including� the� contaminated� soil/gravel� is� handled� as� hazardous�
waste,� to�be� later�disposed� to�offsite�hazardous�waste� treatment� facility.�Regular�spill�
drill�and�training�were�performed�to�ensure�the�readiness�of�response�team�in�handling�
oil/chemical� spill.� Regular� inspection� and� socialization� was� conducted� on� the� storage�
area� with� particular� focus� on� the� storage� for� chemicals� and� oil.� Comprehensive�
inspection� was� conducted� to� identify� all� storage� tanks� within� the� site� and�
recommendations�for�improvement�have�been�provided�for�further�follow�up.�
Tangguh� is� also� actively� taking� part� in� spill� response� preparedness� review�with� other�
PSCs,�coordinated�by�BPMIGAS.�
�
Figure 14. Oil Spill Drill – Oil Boom Deployment
�
Environmental Health and Safety Report
Tangguh LNG Project
October 2010 - April 2011
23
3.2. Gas Production Facilities and Gas Transmission (GPF)
�
The�GPF� construction� activities� are� completed� and� the�monitoring� of� the�GPF� area� is�
part�of�the�whole�BP�Operation�activities�as�outlined�in�the�previous�section�of�LNG�and�
its�supporting�facilities.��
�
3.3. Drilling Activities�
The�Drilling�activities�are�completed�and�the�monitoring�of�the�shorebase�area�is�part�of�
the�whole� BP�Operation� activities� as� outlined� in� the� previous� section� of� LNG� and� its�
supporting�facilities.��
4. Environmental Studies
During� the� reporting� period,� no� environmental� related� study� is� conducted.� Flora� and�
fauna�and�marine�mammal�monitoring�update�study�is�planned�in�the�Q3�2011�after�TAR�
activities.�
�
5. Health and Safety
�
Safety
�
Journey�to�Zero�Incident�campaign�series�has�been�started�in�early�2011,�the�first�round�
focused�on�PPE�compliance�campaign�covered�both�Tangguh�LNG�and�Babo�sites,� to�
ensure�that�work�force�learn�from�the�incident,�stay�focus��and�prevent�similar�incidents�
happened�in�the�future.�
�
The�BP�Control�of�Work�(CoW)�implementation�is�continuously�improving.��All�essential�
CoW�personnel�have�been�trained.��CoW�procedures�now�available�in�bilingual�version.�
Updating�CoW�procedures�to�incorporate�lessons�learned�now�in�progress.�Numbers�of�
CoW�audits�and�auditors�are�set�and�monitored�on�weekly�&�monthly�basis�where�each�
department�will� get� their�own�achievement�profiles.�CoW�Audit� target� for�2011� is�set�
higher� than� 2010� following� achievement� of�CoW�audit� in� 2010�much� higher� than� the�
target.� The� audit� findings� are� communicated� directly� to� respective� AA� &� SC� and�
discussed� during� PA� meeting� to� acknowledge� and� take� lessons� learned.� � � The�
effectiveness� of� the� CoW� audit� is� evident� as�major� significant� findings� are� now� very�
rare.� Since� its� introduction� in� Turn� ARound� -1� (TAR-1),� the� Guidance� on� Certification�
(GoC)�has�now�become�an� integrated�element�with�CoW�as�a� leak-� free�assurance� in�
Tangguh�for�maintenance�activities.��A�steering�committee�meeting�has�been�held�since�
March�2011�as�a�forum�to�discuss�concerns�and�issues�in�CoW�implementation�and�to�
decide�further�improvement.�.�
�
HSE�performance�for�the�period�is�outlined�in�the�following�table.��
�
�
�
�
�
Environmental Health and Safety Report
Tangguh LNG Project
October 2010 - April 2011
24
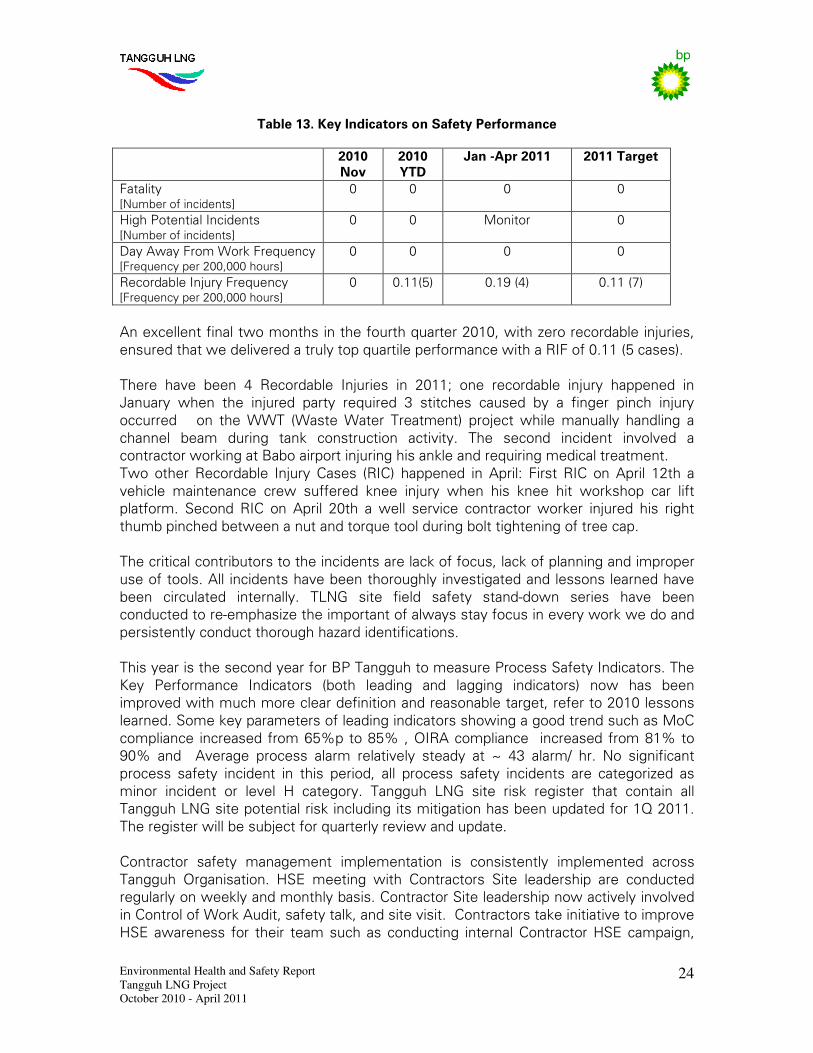
Table 13. Key Indicators on Safety Performance
� 2010 Nov�
2010 YTD �
Jan -Apr 2011� 2011 Target�
Fatality�[Number�of�incidents]�
0� 0� 0� 0�
High�Potential�Incidents�[Number�of�incidents]�
0� 0� Monitor� 0�
Day�Away�From�Work�Frequency�[Frequency�per�200,000�hours]�
0� 0� 0� 0�
Recordable�Injury�Frequency�[Frequency�per�200,000�hours]�
0� 0.11(5)� 0.19�(4)� 0.11�(7)�
�
An�excellent�final�two�months�in�the�fourth�quarter�2010,�with�zero�recordable�injuries,�
ensured�that�we�delivered�a�truly�top�quartile�performance�with�a�RIF�of�0.11�(5�cases).�
�
There� have� been� 4� Recordable� Injuries� in� 2011;� one� recordable� injury� happened� in�
January� when� the� injured� party� required� 3� stitches� caused� by� a� finger� pinch� injury�
occurred� � � on� the�WWT� (Waste�Water� Treatment)� project�while�manually� handling� a�
channel� beam� during� tank� construction� activity.� The� second� incident� involved� a�
contractor�working�at�Babo�airport�injuring�his�ankle�and�requiring�medical�treatment.�
Two� other� Recordable� Injury� Cases� (RIC)� happened� in� April:� First� RIC� on�April� 12th� a�
vehicle� maintenance� crew� suffered� knee� injury� when� his� knee� hit� workshop� car� lift�
platform.� Second� RIC� on� April� 20th� a�well� service� contractor�worker� injured� his� right�
thumb�pinched�between�a�nut�and�torque�tool�during�bolt�tightening�of�tree�cap.�
�
The�critical�contributors�to�the�incidents�are�lack�of�focus,�lack�of�planning�and�improper�
use�of�tools.�All� incidents�have�been�thoroughly�investigated�and�lessons�learned�have�
been� circulated� internally.� TLNG� site� field� safety� stand-down� series� have� been�
conducted�to�re-emphasize�the�important�of�always�stay�focus�in�every�work�we�do�and�
persistently�conduct�thorough�hazard�identifications.�
�
This�year�is�the�second�year�for�BP�Tangguh�to�measure�Process�Safety�Indicators.�The�
Key� Performance� Indicators� (both� leading� and� lagging� indicators)� now� has� been�
improved�with�much�more�clear�definition�and�reasonable�target,�refer�to�2010�lessons�
learned.�Some�key�parameters�of�leading�indicators�showing�a�good�trend�such�as�MoC�
compliance� increased�from�65%p�to�85%�,�OIRA�compliance� � increased� from�81%�to�
90%� and� � Average� process� alarm� relatively� steady� at� ~� 43� alarm/� hr.� No� significant�
process� safety� incident� in� this� period,� all� process� safety� incidents� are� categorized� as�
minor� incident� or� level� H� category.� Tangguh� LNG� site� risk� register� that� contain� all�
Tangguh�LNG�site�potential�risk�including�its�mitigation�has�been�updated�for�1Q�2011.�
The�register�will�be�subject�for�quarterly�review�and�update.�
�
Contractor� safety� management� implementation� is� consistently� implemented� across�
Tangguh� Organisation.� HSE� meeting� with� Contractors� Site� leadership� are� conducted�
regularly�on�weekly�and�monthly�basis.�Contractor�Site�leadership�now�actively�involved�
in�Control�of�Work�Audit,�safety�talk,�and�site�visit.��Contractors�take�initiative�to�improve�
HSE�awareness� for� their� team�such�as� conducting� internal�Contractor�HSE�campaign,�
�
Environmental Health and Safety Report
Tangguh LNG Project
October 2010 - April 2011
25
HSE� meeting� and� HSE� reward� program.� HSE� performances� for� Contractors� are�
monitored�on�monthly�basis�against�KPI�that�has�been�set�up�for�2011.��Quarterly�Audit�
also� conducted� on� quarterly� basis� to� provide� assurance� on� Contractor� HSE� Plan�
implementation.�Other�Audit�program�also�conducted�to�check�HSE�compliance�such�as�
PPE�compliance�audit.�Starting�early�2011,�Contractor�also�sent�their�HSE�officer�to�get�
professional�certification�(AK3�Migas)�from�government�body.�The�effectiveness�of�the�
program� is�evident�as� indicated�on�monthly�HSE�KPI� (Lagging/Leading� Indicators),� �no�
major�finding�on�PPE�Audit�compliance�,��positive�trend�of�CSMS�Audit�score�and�.�
Starting�April�2011,�all�contractors�are�engaged�to�start�the�implementation�of�Tangguh�
How�we�Operate,��that�will�be�reviewed�by�each�Department�on�monthly�basis.�
�
Industrial Hygiene
Continuous� improvement�of� industrial�hygiene�management�system�done�by� including�
lesson� learned� in� the� procedure’s� revision� and� development� of� new� procedures� to�
capture� all� identified� significant� health� risks� and� processes.� These� include� the�
development�of�Potable�Water�Quality�Management�and�Radiation�Safety�procedures,�
food� borne� illness� investigation� protocol� in� the� revised� Food� Safety� procedure,�
respiratory� fit� testing� protocol� in� the� revised� Personal� Protective� Equipment� (PPE)�
procedure,�etc.� �
Periodic�industrial�hygiene�monitoring�has�been�conducted�as�follow-up�of�baseline�data�
collected� previously.� The� monitoring� programs� include� BTEX� (Benzene,� Toluene,�
Ethylbenzene,� and� Xylene),� welding� fumes,� noise,� heat� or� thermal� environment,� and�
indoor�air�quality;�thus�more�clarity�of�risk�profiles�obtained�for�specific�activities�which�
have� been� fed� into� task� risk� assessment� process.� Inspections� and� reviews� activities�
performed�to�ensure�identified�risks�are�managed�appropriately.�These�are�expected�to�
comprehend�risk�assessment�and�management�processes.��
�
In�addition�to�the�risk�based�industrial�hygiene�trainings�(e.g.�PPE,�manual�handling�and�
chemical� handling� trainings),� a� quarterly� bulletin� launched� as� an� education� media� to�
increase� workers’� awareness� on� health� hazards� at� the� workplace,� socialization� of�
industrial�hygiene�procedures,�and�update�of�any�emerging�issue�at�site.�
�
��
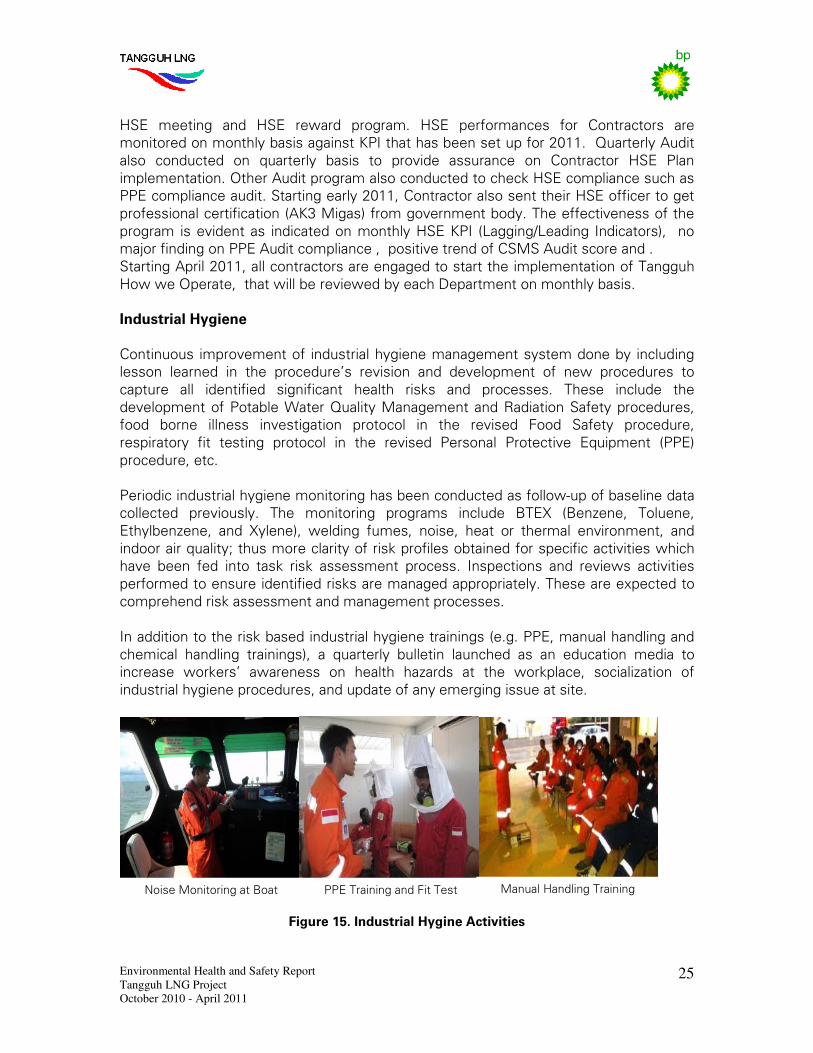
�Figure 15. Industrial Hygine Activities
�
Manual�Handling�Training�PPE�Training�and�Fit�Test�Noise�Monitoring�at�Boat�
�
Environmental Health and Safety Report
Tangguh LNG Project
October 2010 - April 2011
26
Occupational Health
Some� Occupational� Health� programs� have� been� delivered� to� ensure� that� people� can�
work�with�minimum�risks�to�themselves�and�others.�The�programs�which�implemented�
as�part�of�the�Operating�Management�System�include:�Fitness�to�work,�Fitness�for�task,�
Health� Surveillance,� Medical� Emergency� Response,� Health� Promotion� and� Malaria� &�
Communicable�diseases.�
�
Since�April�2011,�as�part�of�the�Health�Promotion�program,�Tangguh�have�commenced�a�
Quality�Life�Improvement�Program�which�was�marked�with�some�events,�such�as�BMI�
and�calorie�burning�competitions�and�the�opening�of�footsal�facility�onsite.�
�
To� ensure� the� readiness� and� improve� the� capability� of�medical� team� onsite,� first� aid�
trainings,�medical�emergency�drills�and�mass�casualty�drills�have�been�conducted�both�
at�Babo�and�LNG�sites.�
�
We� also� continue� performing� some� programs� on� Malaria� control� which� include�
screening�programs�at�entry�points�(1674�samples�taken�in�2010),�early�case�detection�
and� treatment,� improvement� of� self� protection� awareness,� elimination� &� control� of�
mosquito�breeding�sites,� fogging�at�some� locations�and�also�man�hour�density� (MHD)�
program.�
�
6. Status of Non Compliances
Tangguh�ADB�Loan�Tranche�Agreement�defines�non-compliance�as�follows:�
Level� 1� E&S� Non� Compliance:� “means� any� failure� to� comply� with,� or� any� action� or�
omission�which� is� inconsistent� with,� any� Environmental� and� Social� Requirement,� but�
which�failure,�action,�or�omission�does�not�constitute�a�Level�2�E&S�Non�Compliance.”�
�
Level� 2� E&S� Non� Compliance:� “means� any� failure� to� comply� with,� or� any� action� or�
omission�which� is� inconsistent� with,� any� Environmental� and� Social� Requirement,� but�
which� failure,� action,�or�omission� (considered�either�on� its�own�or� in�conjunction�with�
any�other�one�or�more�such�failure(s),�action(s)�or�omission(s)):�
• Has�resulted� in�or� is�reasonably� likely�to�result� in�material�damage�or�harm�to,�or�a�
material�and�adverse�impact�on,�the�environment;�
• Constitutes� or� is� reasonably� likely� to� constitute� a� “significant� impact”� for� the�
purposes�of�and�as�defined�in�the�Indonesian�Decree�Concerning�Guidelines�for�the�
Determination�of�Significant�Impacts�(BAPEDAL�Decree�No.�KEP056/1994);�
• Has�resulted� in�or� is�reasonably� likely�to�result� in�material�damage�or�harm�to,�or�a�
material� and� adverse� impact�on,� the� lives,� livelihood,� quality� of� life,� health,� safety,�
security,�property�or�cultural�heritage�of�affected�people;�or�
• Has�resulted�in�or�is�reasonably�likely�to�result�in�the�revocation�of,�or�the�refusal�to�
grant,� any� approval,� consent,� permit� or� other� authorization� required� for� the�
implementation� of� the� Tangguh� E&S� Project� (but� only� to� the� extent� that� such�
approval,�consent,�permit�or�other�authorization�is�required�for�implementation�o�the�
Tangguh�E&S�Project�at�that�time.”�
�
�
Environmental Health and Safety Report
Tangguh LNG Project
October 2010 - April 2011
27
6.1. Level-1 Non Compliances
�
There�is�no�Level-1�non�compliance�during�this�reporting�period.��
�
6.2. Level-2 Non Compliances
�There� is�no�environmental� incident�categorised�as�Level�2�Non�Compliance�during�this�
reporting�period.�
7. Additional Information�
�
8. Evaluation Results
There� were� continuous� improvements� in� the� environmental� management� practices�
across� the� Tangguh� LNG� activities� both� start� up� and� operation� phase� during� the�
reporting� period.� The� challenge� is� to� maintain� consistency� and� continuous�
implementation�of�the�environmental�management�programs.��
�
Flaring� reduction� initiative�where� Tangguh�managed� to� reduce� flaring� due� to� rigorous�
assurance�process�as�part�of�continuous�improvement�process.��For�the�period�of�July�–�
December�2010,�actual�flaring�is�4671.6�mmscf�(53%�from�maximum�limit)�and�for�the�
period�of�1�January�–�April�2011�is�2715�MMSCF�(49%�from�maximum�limit).�Another�
example� related� to� solid� waste� management� to� improve� composter� efficiency� from�
18,000�kg/month�to�21,000�kg/month.�
�
Tangguh�LNG�environmental�team�conducts�regular�discussions�with�other�departments�
as�well�as�with�the�operations’�contractors�to�review�any�issues�that�potentially�lead�to�a�
non-compliance� to� AMDAL� and� relevant� regulations.� Actions� to� prevent� the� non�
compliance�incident�is�discussed,�agreed�and�be�followed�up�with�the�relevant�team.��A�
weekly�Tangguh�Compliance�Tracking�Matrix�is�maintained.��
�
The�ISO14001�Environmental�Management�System�implementation�is�continuing.�With�
the� successful� implementation� of� the� certification� audit� in� October� 2010,� the� EMS�
implementation�is�ahead�of�target�to�achieve�ISO�14001�certification�which�was�planned�
in�Q1�2011�to�9�December�2010.��