Embed Size (px)
Citation preview

Dr Stephen P EtheridgeDr Stephen P Etheridge
CETESBCETESBEnergy From BiogasEnergy From BiogasApril 23April 23rdrd – 24 – 24thth 2003 2003
Biogas ApplicationsBiogas Applications
Environmental Biotechnology LimitedEnvironmental Biotechnology Limited

Climate ChangeClimate Change
!! Climate is changingClimate is changing
!! Not everyone agrees it is a result ofNot everyone agrees it is a result of
human activityhuman activity
!! Carbon reserves being rapidly releasedCarbon reserves being rapidly released
into the atmosphereinto the atmosphere

Different countries releaseDifferent countries releasedifferent amounts….different amounts….
0 2000 4000 6000 8000 10000 12000
B ras il
C hina
F ranc e
UK
G erm any
Aus tra lia
C anada
US A
C on sum ptio n p er p erson , kg coal eq u ivavlen t
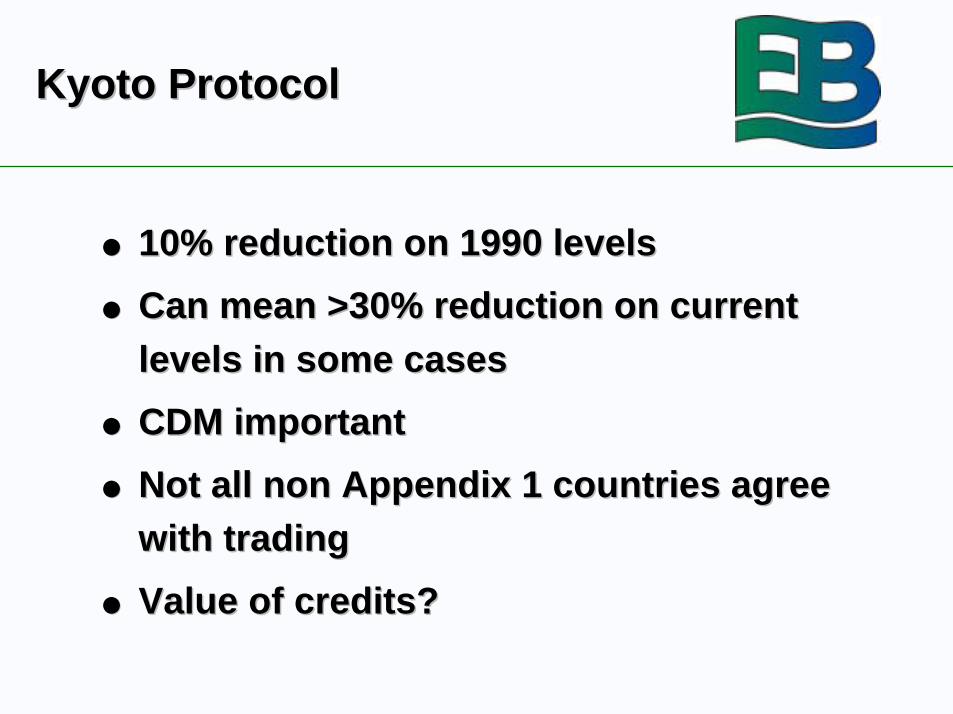
Kyoto ProtocolKyoto Protocol
!! 10% reduction on 1990 levels10% reduction on 1990 levels
!! Can mean >30% reduction on currentCan mean >30% reduction on currentlevels in some caseslevels in some cases
!! CDM importantCDM important
!! Not all non Appendix 1 countries agreeNot all non Appendix 1 countries agreewith tradingwith trading
!! Value of credits?Value of credits?

Mitigation and EnergyMitigation and Energy
Credits
Investment
21
1
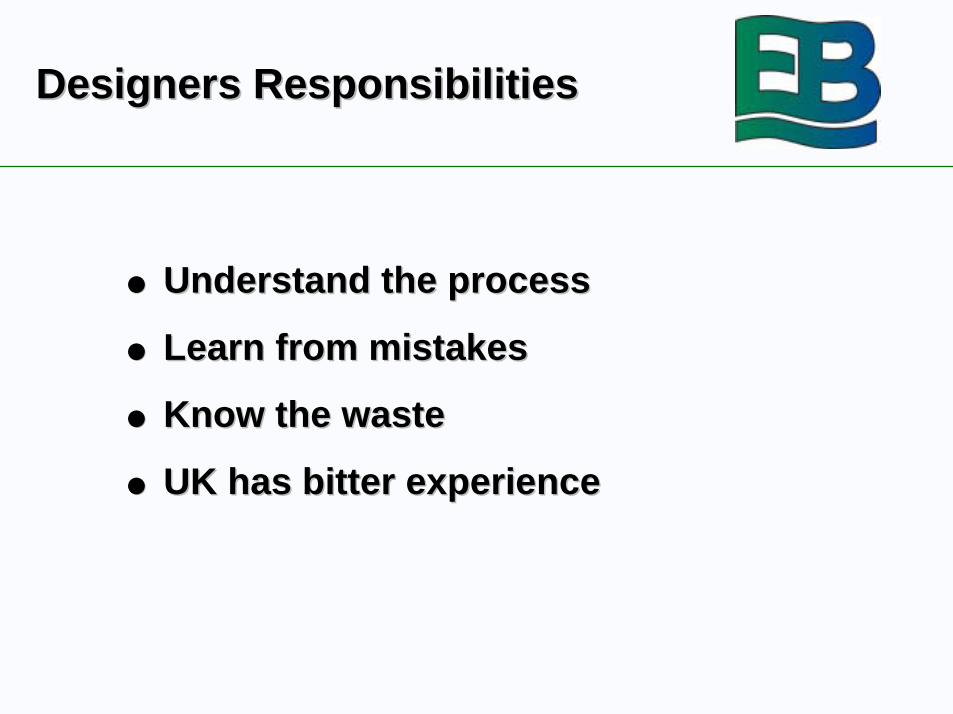
Designers ResponsibilitiesDesigners Responsibilities
!! Understand the processUnderstand the process
!! Learn from mistakesLearn from mistakes
!! Know the wasteKnow the waste
!! UK has bitter experienceUK has bitter experience
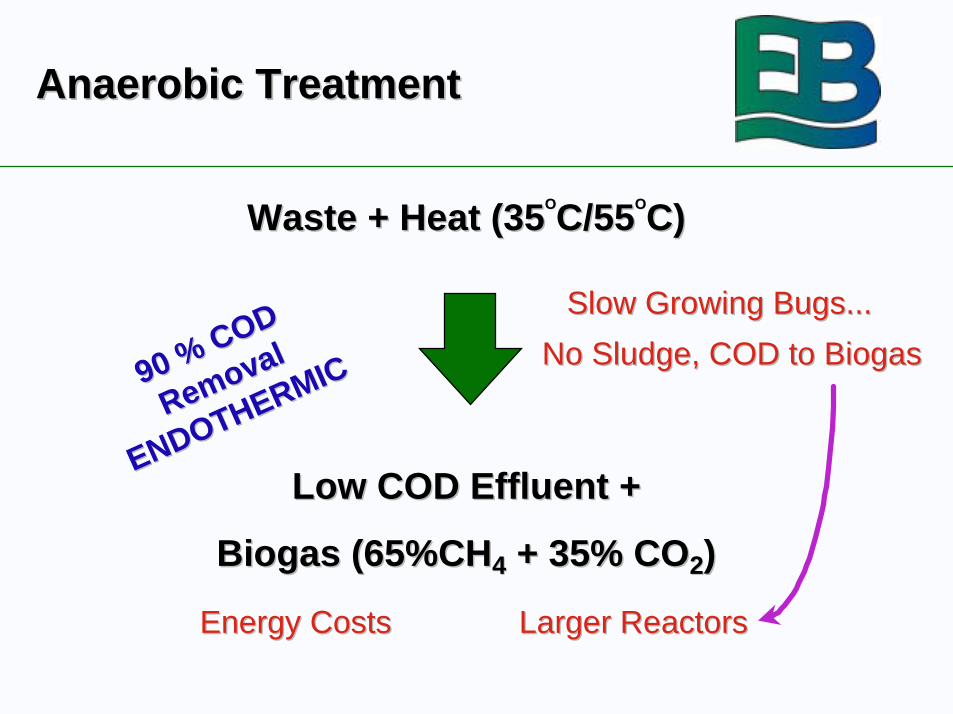
Anaerobic TreatmentAnaerobic Treatment
Waste + Heat (35Waste + Heat (35OO
C/55C/55OO
C)C)
Low COD Effluent +Low COD Effluent +
Biogas (65%CHBiogas (65%CH44 + 35% CO + 35% CO22))
Energy CostsEnergy Costs Larger ReactorsLarger Reactors
Slow Growing Bugs...Slow Growing Bugs...
No Sludge, COD to BiogasNo Sludge, COD to Biogas90 % COD
90 % COD
Removal
Removal
ENDOTHERMIC
ENDOTHERMIC
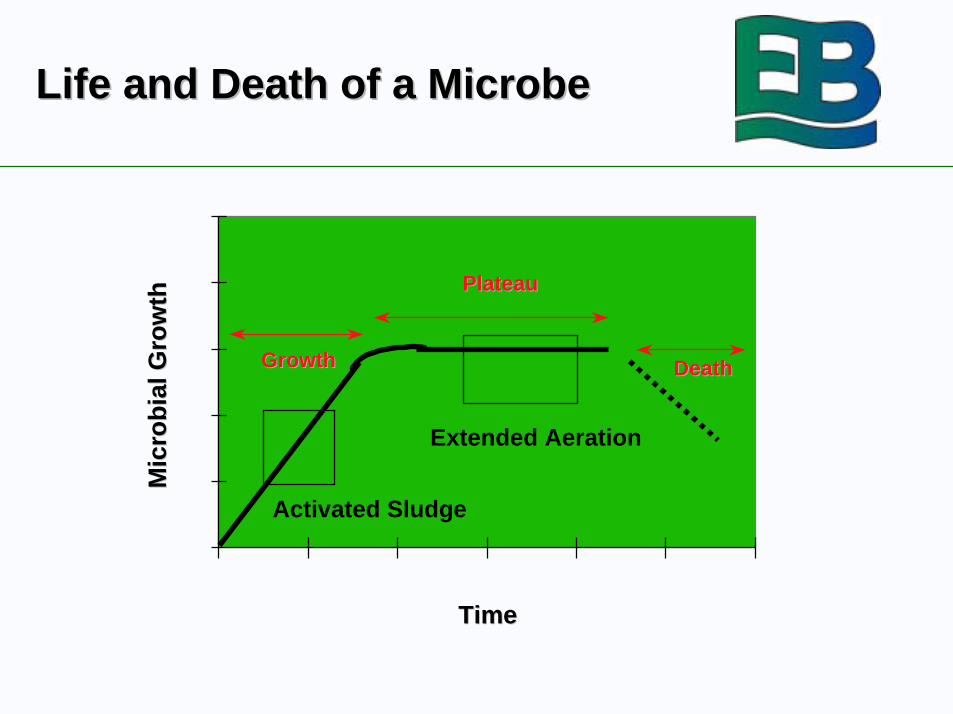
Life and Death of a MicrobeLife and Death of a Microbe
TimeTime
Mic
rob
ial G
row
thM
icro
bia
l Gro
wth
GrowthGrowth
PlateauPlateau
DeathDeath
Activated Sludge
Extended Aeration
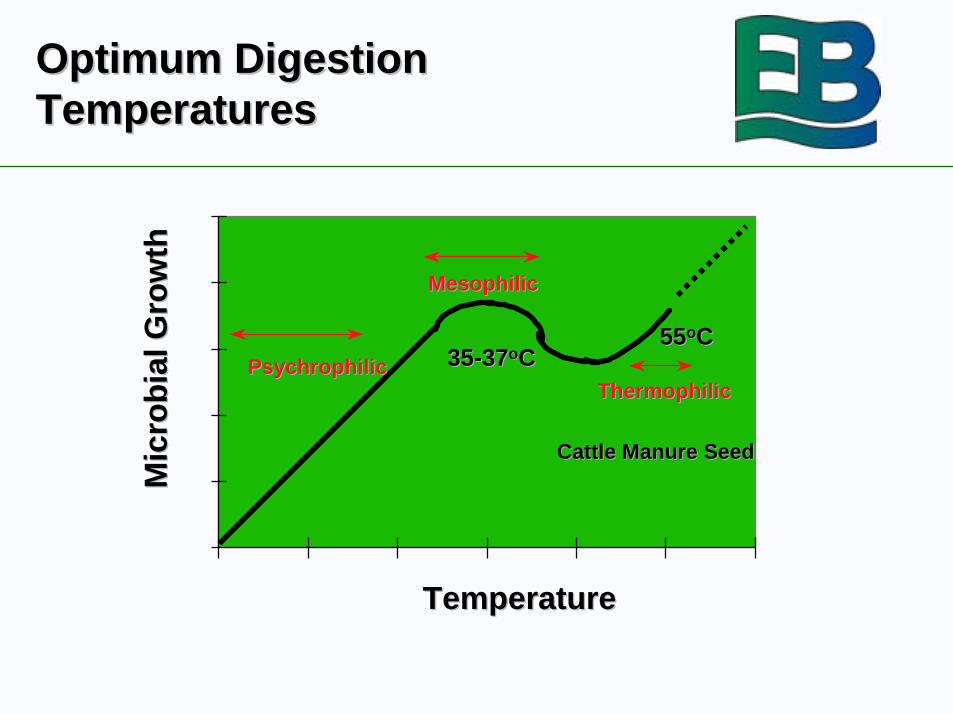
Optimum DigestionOptimum DigestionTemperaturesTemperatures
TemperatureTemperature
Mic
rob
ial G
row
thM
icro
bia
l Gro
wth
PsychrophilicPsychrophilic
MesophilicMesophilic
ThermophilicThermophilic35-3735-37ooCC
5555ooCC
Cattle Manure SeedCattle Manure Seed
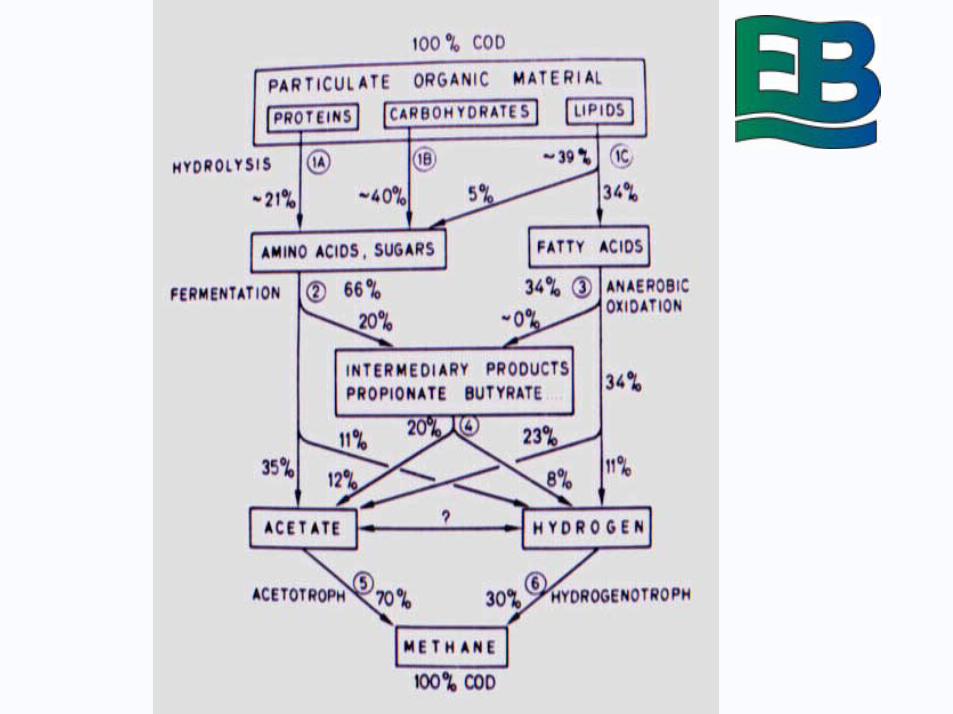

Simplified AD ProcessSimplified AD Process
Long Chain OrganicsLong Chain Organics
Volatile Fatty AcidsVolatile Fatty Acids
Methane + Carbon DioxideMethane + Carbon Dioxide
VFA TestVFA Test< 3,000 mg/l< 3,000 mg/l
Methane %Methane %
MethanogensMethanogens
AcetogensAcetogens
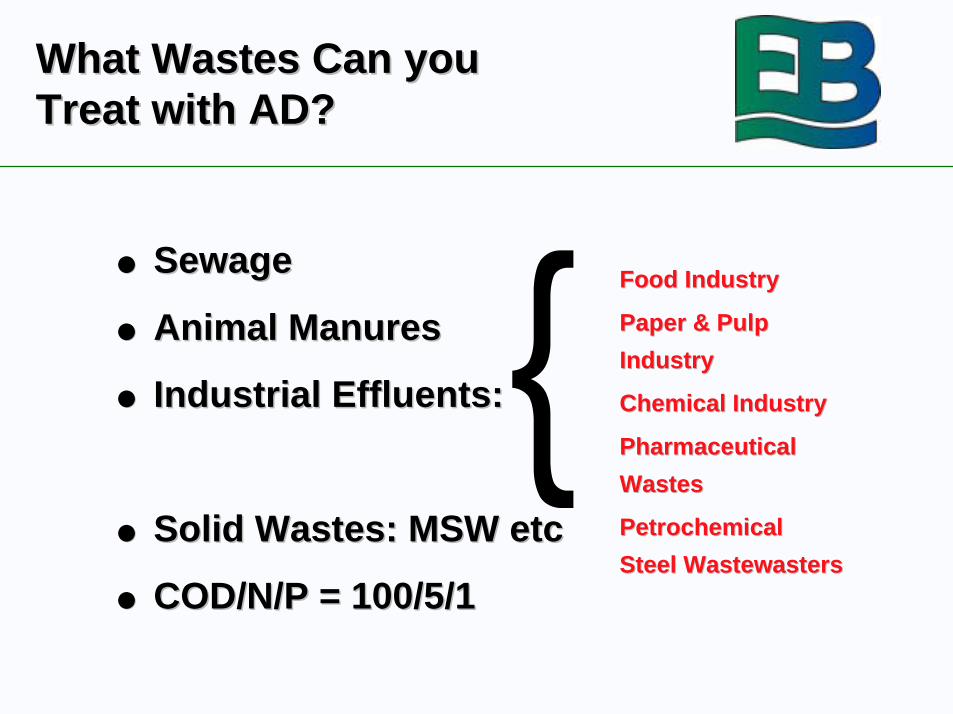
What Wastes Can youWhat Wastes Can youTreat with AD?Treat with AD?
!! SewageSewage
!! Animal ManuresAnimal Manures
!! Industrial Effluents:Industrial Effluents:
!! Solid Wastes: MSW etcSolid Wastes: MSW etc
!! COD/N/P = 100/5/1COD/N/P = 100/5/1
Food IndustryFood Industry
Paper & PulpPaper & Pulp
IndustryIndustry
Chemical IndustryChemical Industry
PharmaceuticalPharmaceutical
WastesWastes
PetrochemicalPetrochemical
Steel Steel WastewastersWastewasters
{
Digester DesignDigester Design
howhow do we do werealise realise thethepotential ofpotential of
biogas?biogas?
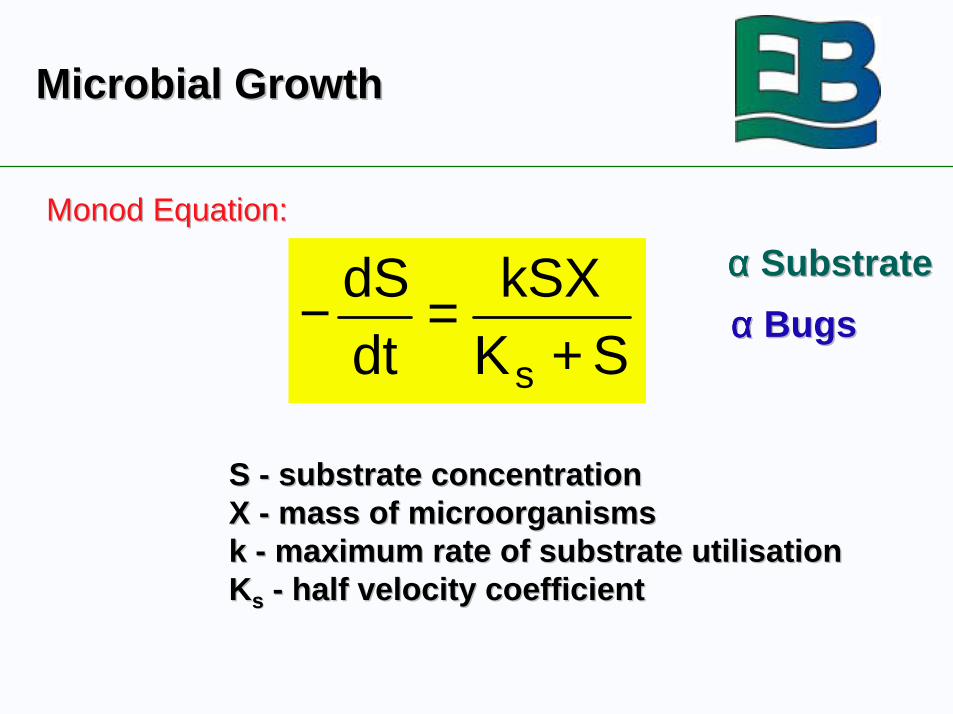
Microbial GrowthMicrobial Growth
− =+
dSdt
kSXK Ss
S - substrate concentrationS - substrate concentrationX - mass of X - mass of microorganismsmicroorganismsk - maximum rate of substrate utilisationk - maximum rate of substrate utilisationKKss - half velocity coefficient - half velocity coefficient
MonodMonod Equation: Equation:
α α α α α α α α SubstrateSubstrate
α α α α α α α α BugsBugs
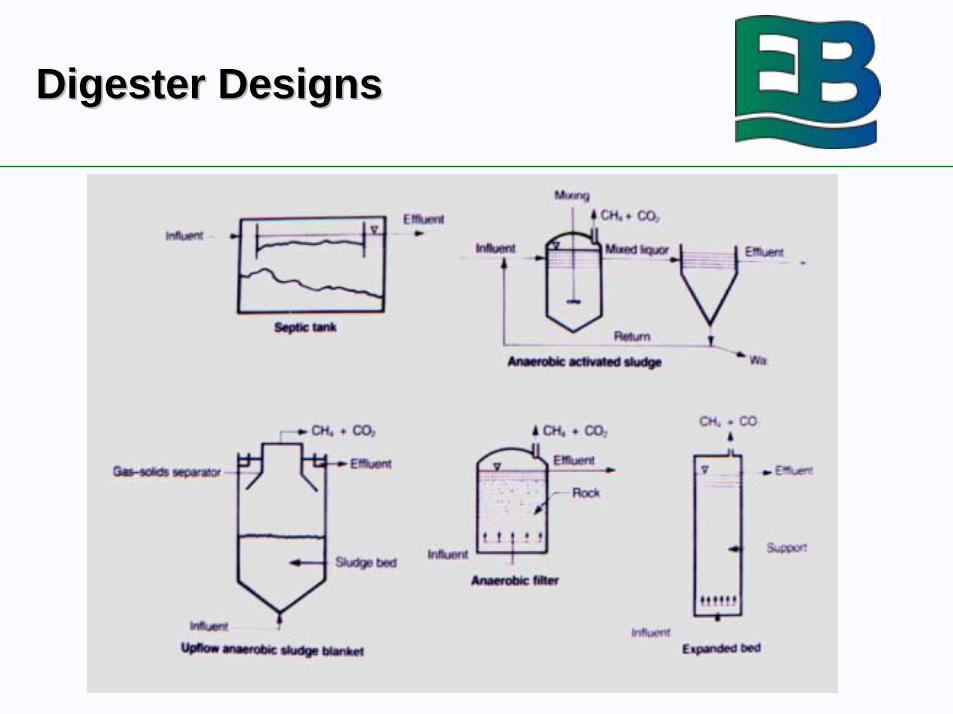
Digester DesignsDigester Designs
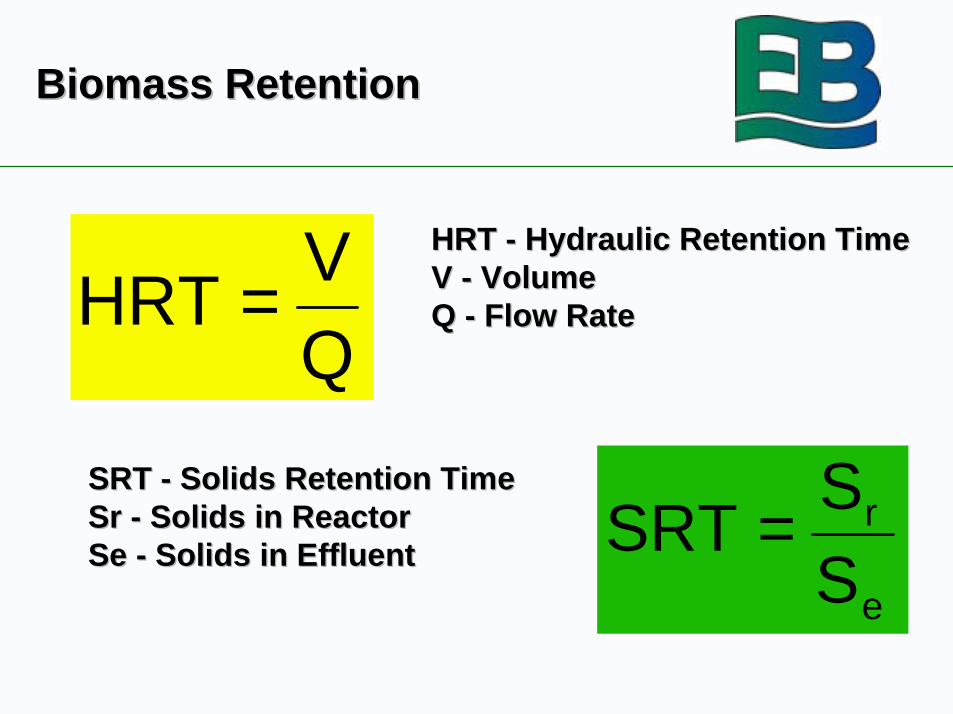
Biomass RetentionBiomass Retention
QV
HRT =
e
r
SS
SRT =
HRT - Hydraulic Retention TimeHRT - Hydraulic Retention TimeV - VolumeV - VolumeQ - Flow RateQ - Flow Rate
SRT - Solids Retention TimeSRT - Solids Retention TimeSr - Solids in ReactorSr - Solids in ReactorSe - Solids in EffluentSe - Solids in Effluent

Hydraulic LimitationsHydraulic Limitations
HRT (days)HRT (days)55
WA
SH
OU
T
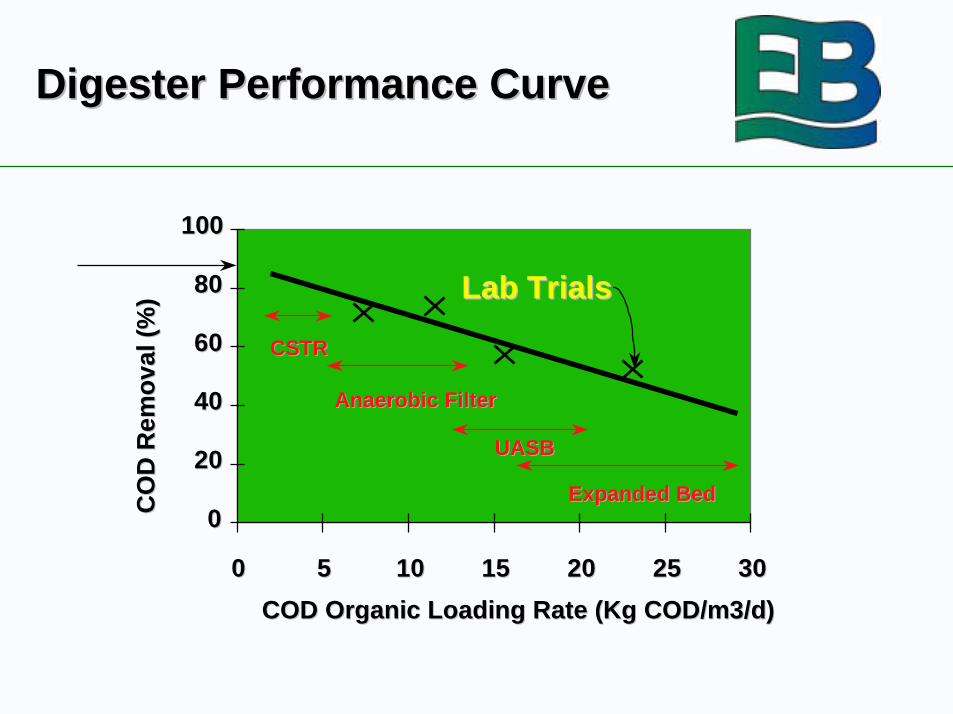
Digester Performance CurveDigester Performance Curve
00
2020
4040
6060
8080
100100
00 55 1010 1515 2020 2525 3030
COD Organic Loading Rate (Kg COD/m3/d)COD Organic Loading Rate (Kg COD/m3/d)
CO
D R
emo
val (
%)
CO
D R
emo
val (
%)
CSTRCSTR
Anaerobic FilterAnaerobic Filter
UASBUASB
Expanded BedExpanded Bed
Lab TrialsLab Trials

Laboratory EvaluationLaboratory Evaluation

Laboratory EvaluationLaboratory Evaluation
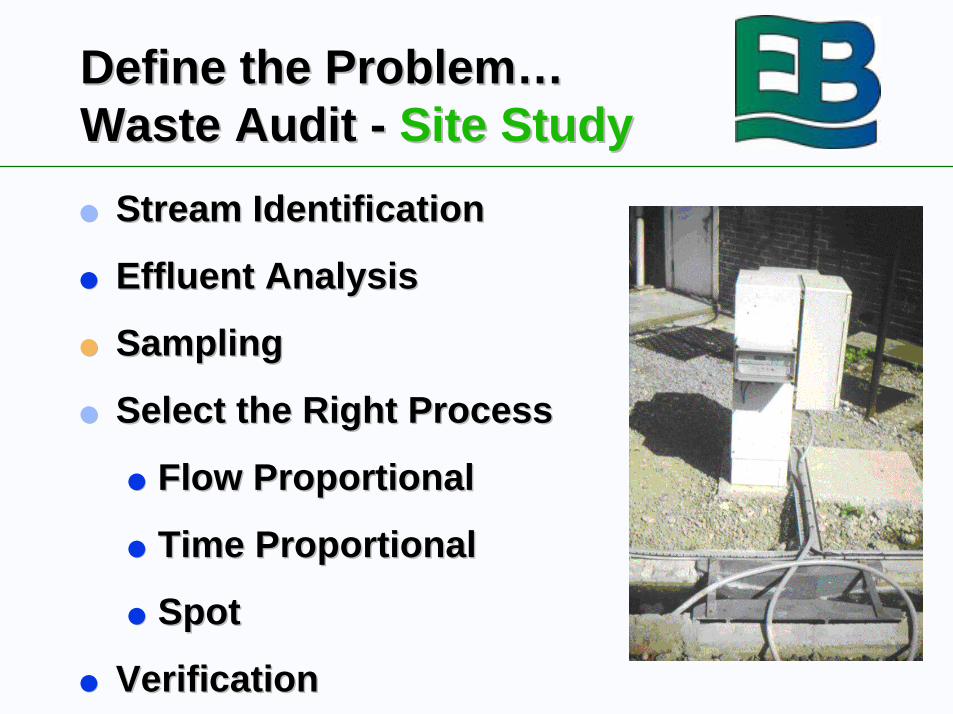
Define the Problem…Define the Problem…Waste Audit - Waste Audit - Site StudySite Study
!! Stream IdentificationStream Identification
!! Effluent AnalysisEffluent Analysis
!! SamplingSampling
!! Select the Right ProcessSelect the Right Process
!! Flow ProportionalFlow Proportional
!! Time ProportionalTime Proportional
!! SpotSpot
!! VerificationVerification

Confectionery PlantConfectionery Plant

Flexible Liner DigestionFlexible Liner DigestionSystemsSystems
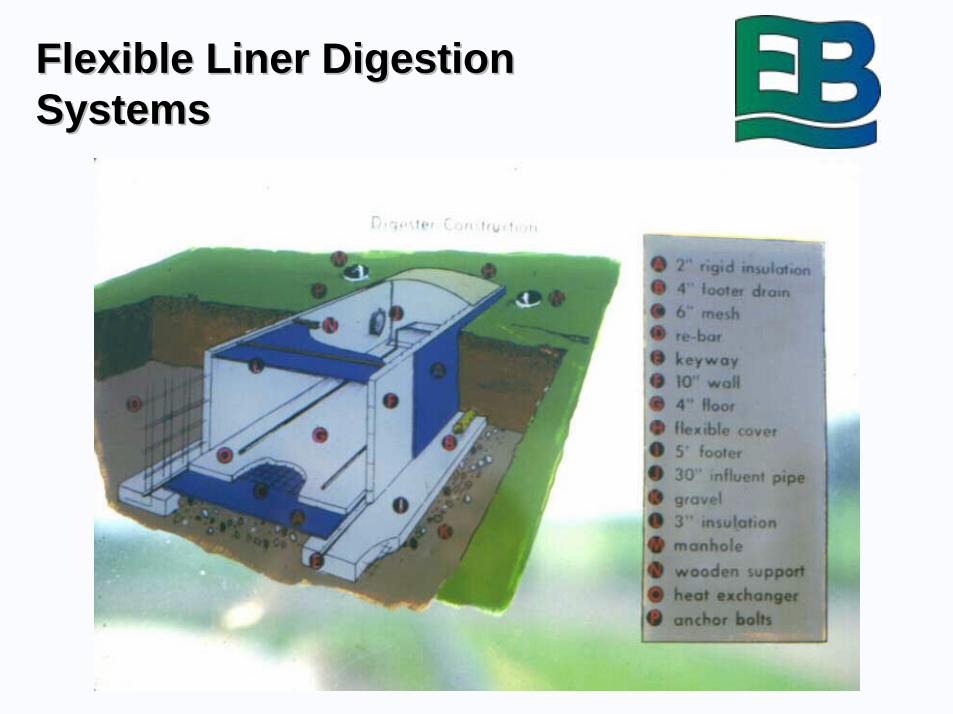
Flexible Liner DigestionFlexible Liner DigestionSystemsSystems


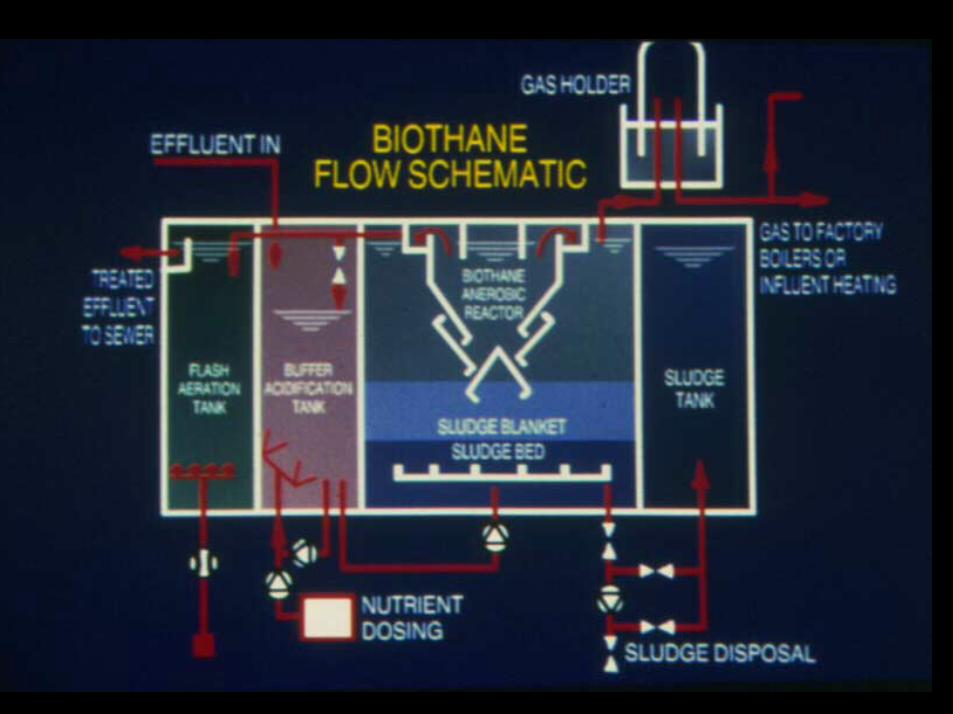
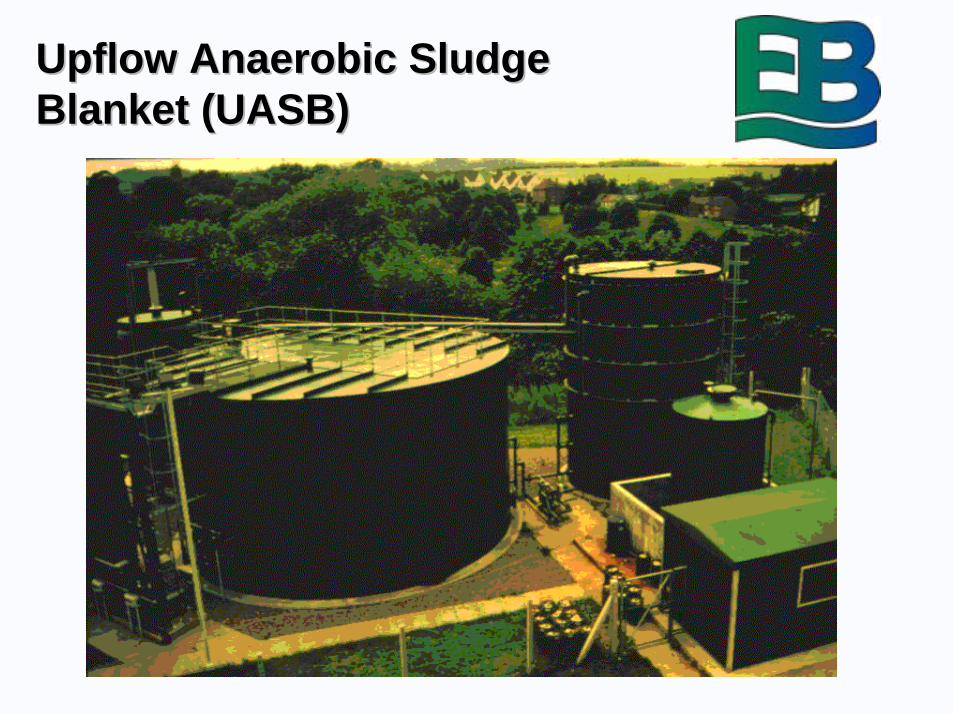
Upflow Anaerobic SludgeUpflow Anaerobic SludgeBlanket (UASB)Blanket (UASB)
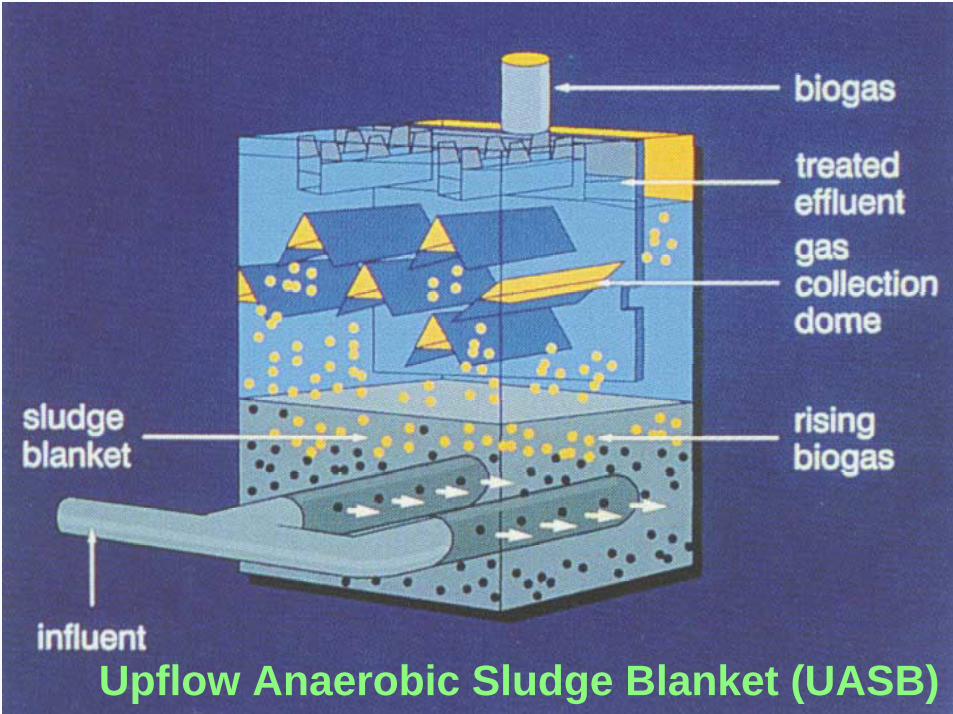
Upflow Anaerobic Sludge Blanket (UASB)
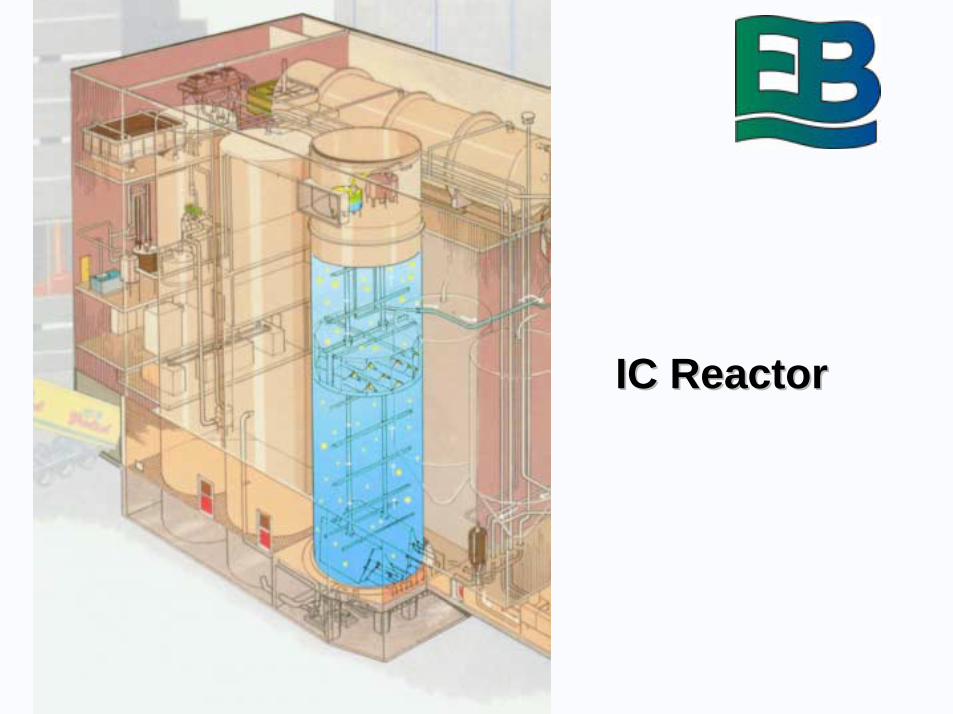
IC ReactorIC Reactor
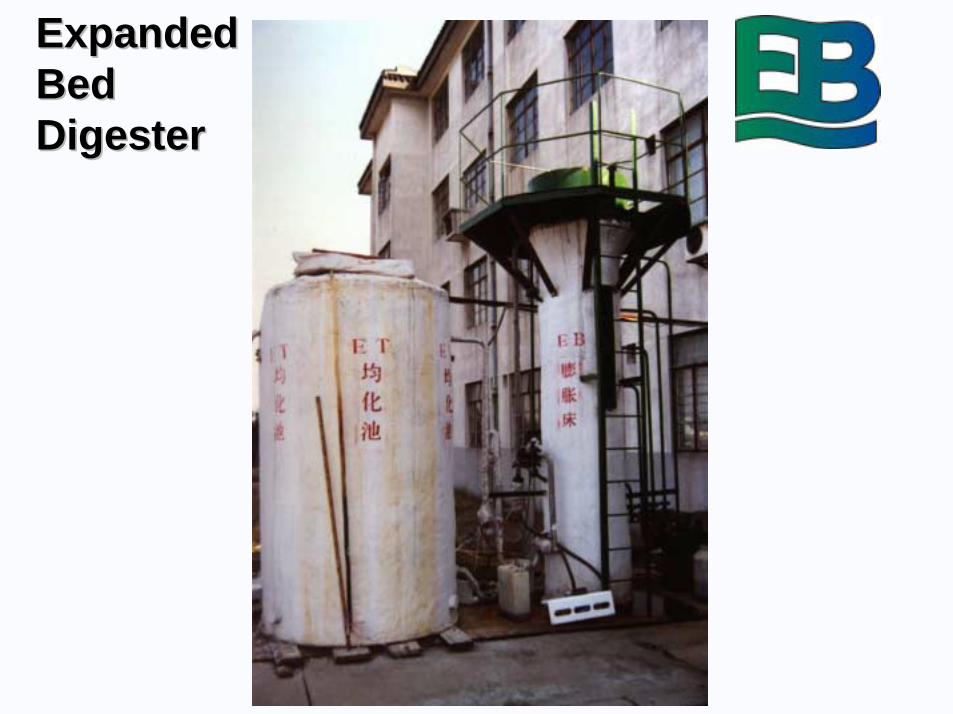
ExpandedExpandedBedBedDigesterDigester

CASE STUDY:CASE STUDY:Brewery and Soft DrinksBrewery and Soft DrinksEffluentEffluent
!! ProblemProblem!! Failed effluent treatment plantFailed effluent treatment plant!! Pressure from Water Company to reducePressure from Water Company to reduce
COD/SSCOD/SS!! Very high Very high MogdenMogden charges charges!! High variation in flow, COD, SSHigh variation in flow, COD, SS
!! Due toDue to!! Plant corrosionPlant corrosion!! Poor designPoor design!! Poor waste auditPoor waste audit
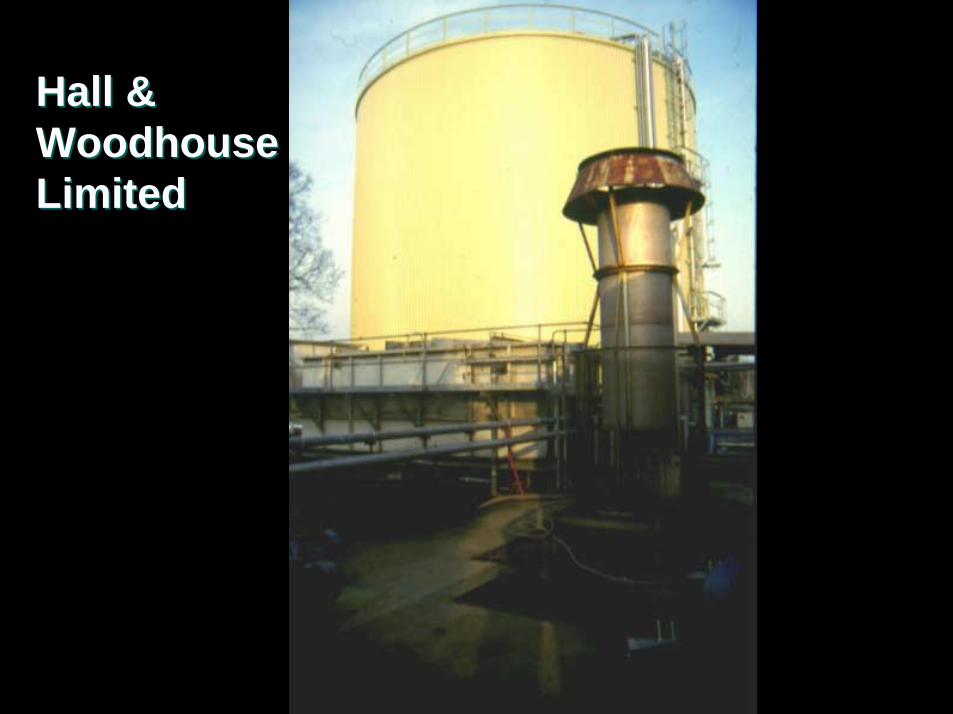
Hall &Hall &WoodhouseWoodhouseLimitedLimited
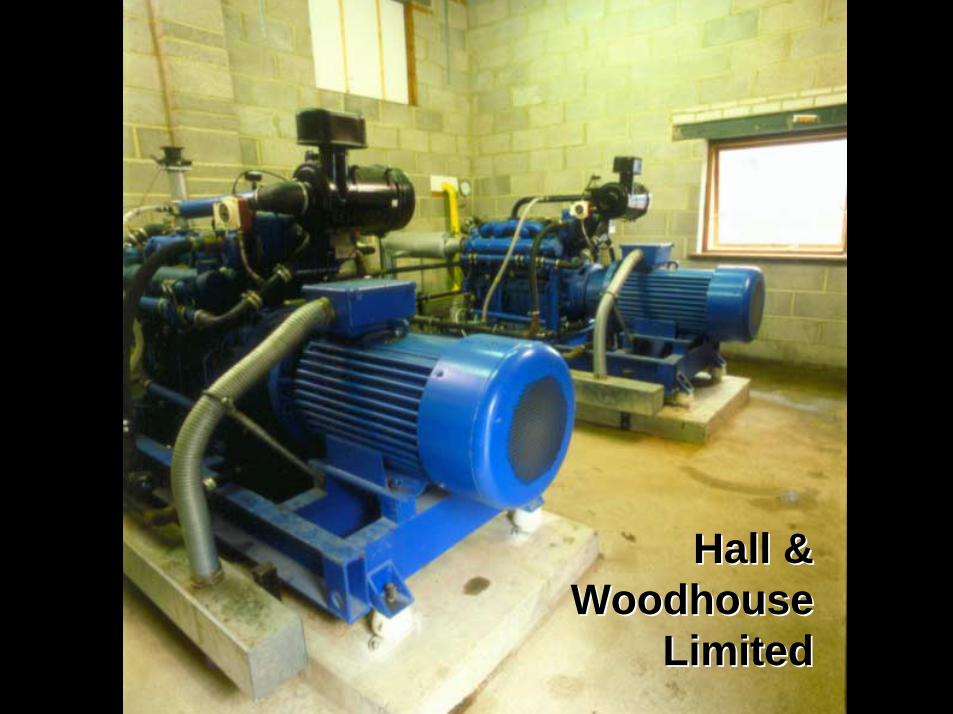
Hall &Hall &WoodhouseWoodhouse
LimitedLimited
CASE STUDY:CASE STUDY:Brewery and Soft DrinksBrewery and Soft DrinksEffluentEffluent!! SolutionSolution
!! Comprehensive waste audit (client owned)Comprehensive waste audit (client owned)!! Feasibility studyFeasibility study
!! sewer or riversewer or river!! aerobic or anaerobicaerobic or anaerobic!! new technologies/grantsnew technologies/grants
!! New treatment plantNew treatment plant!! Novel heating and mixing systemNovel heating and mixing system!! THERMIE GrantTHERMIE Grant!! EBL design & project managementEBL design & project management!! Client direct purchase of all equipmentClient direct purchase of all equipment
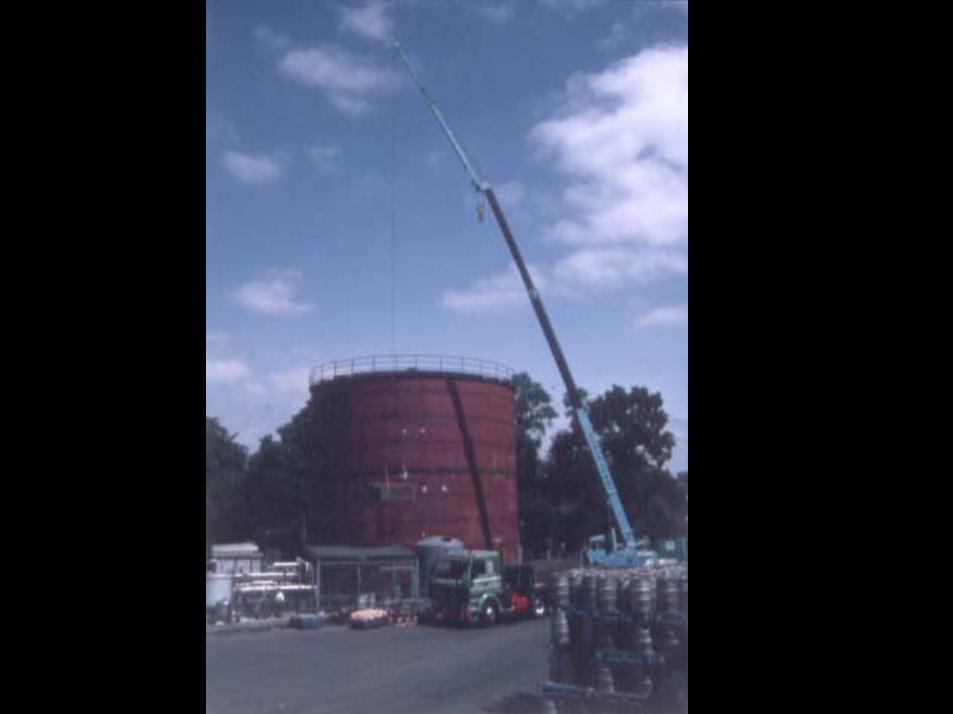
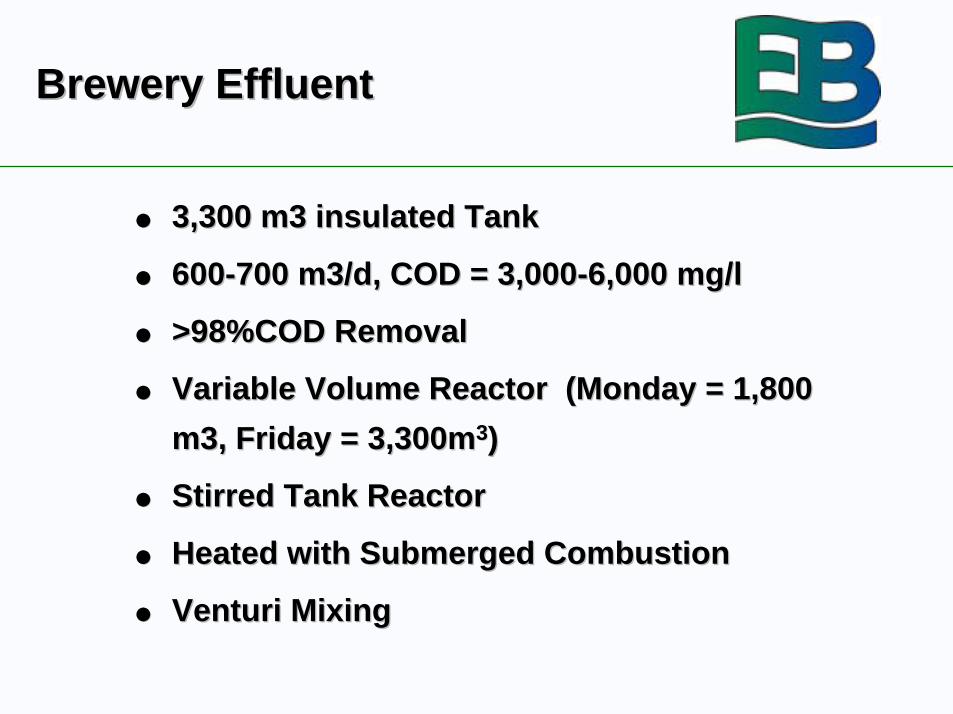
Brewery EffluentBrewery Effluent
!! 3,300 m3 insulated Tank3,300 m3 insulated Tank
!! 600-700 m3/d, COD = 3,000-6,000 mg/l600-700 m3/d, COD = 3,000-6,000 mg/l
!! >98%COD Removal>98%COD Removal
!! Variable Volume Reactor (Monday = 1,800Variable Volume Reactor (Monday = 1,800
m3, Friday = 3,300mm3, Friday = 3,300m33))
!! Stirred Tank ReactorStirred Tank Reactor
!! Heated with Submerged CombustionHeated with Submerged Combustion
!! VenturiVenturi Mixing Mixing
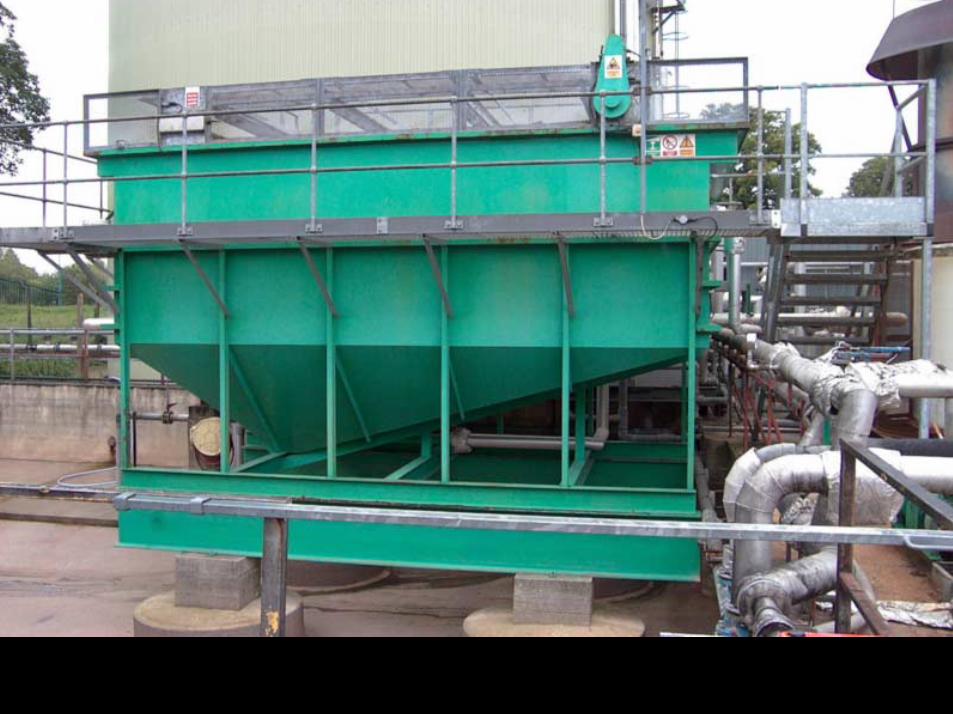
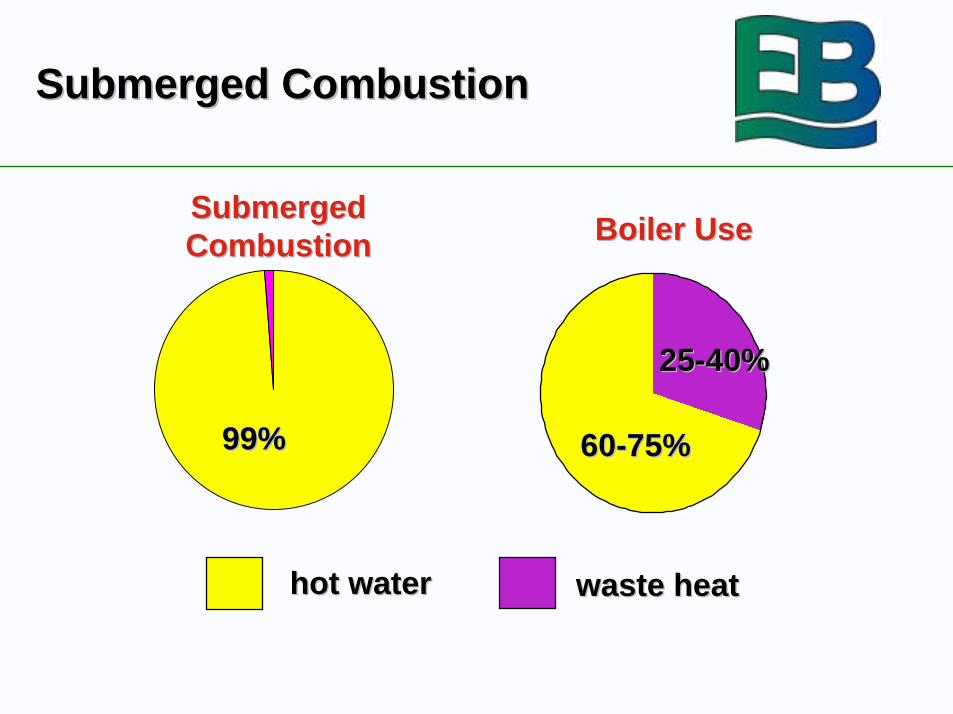
Submerged CombustionSubmerged Combustion
SubmergedSubmergedCombustionCombustion
60-75%60-75%
25-40%25-40%
waste heatwaste heathot waterhot water
Boiler UseBoiler Use
99%99%
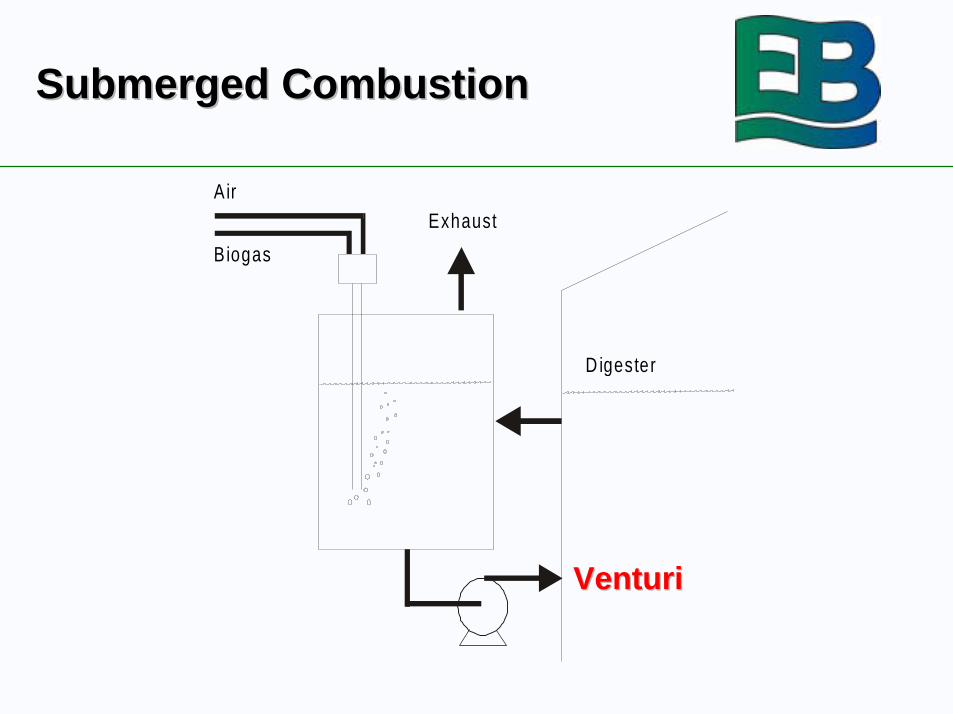
Submerged CombustionSubmerged Combustion
Air
B iogas
D igester
Exhaust
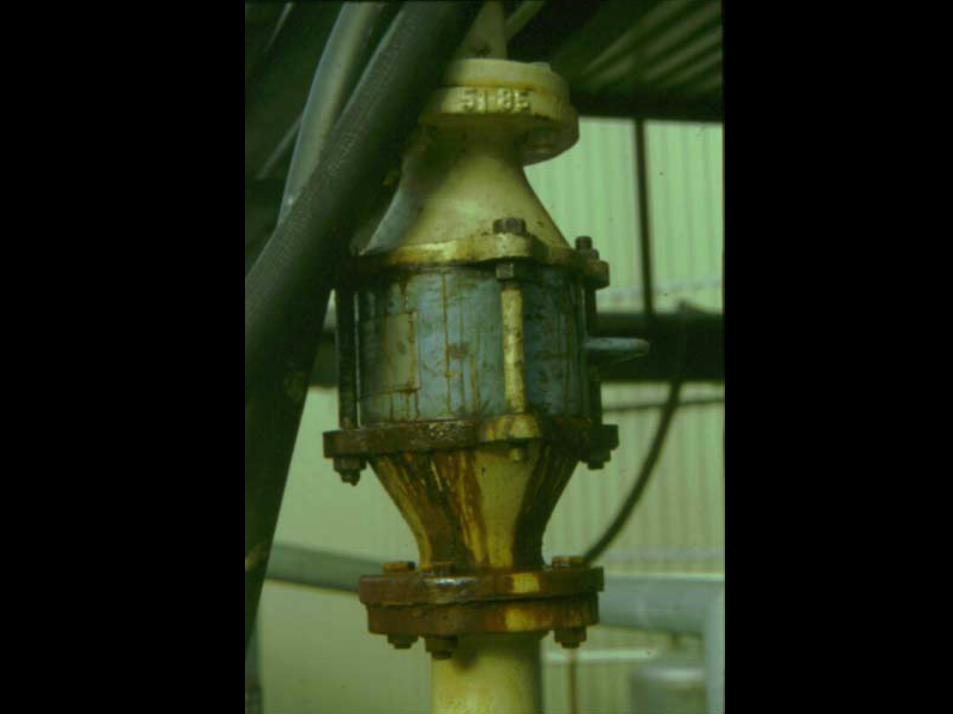
VenturiVenturi
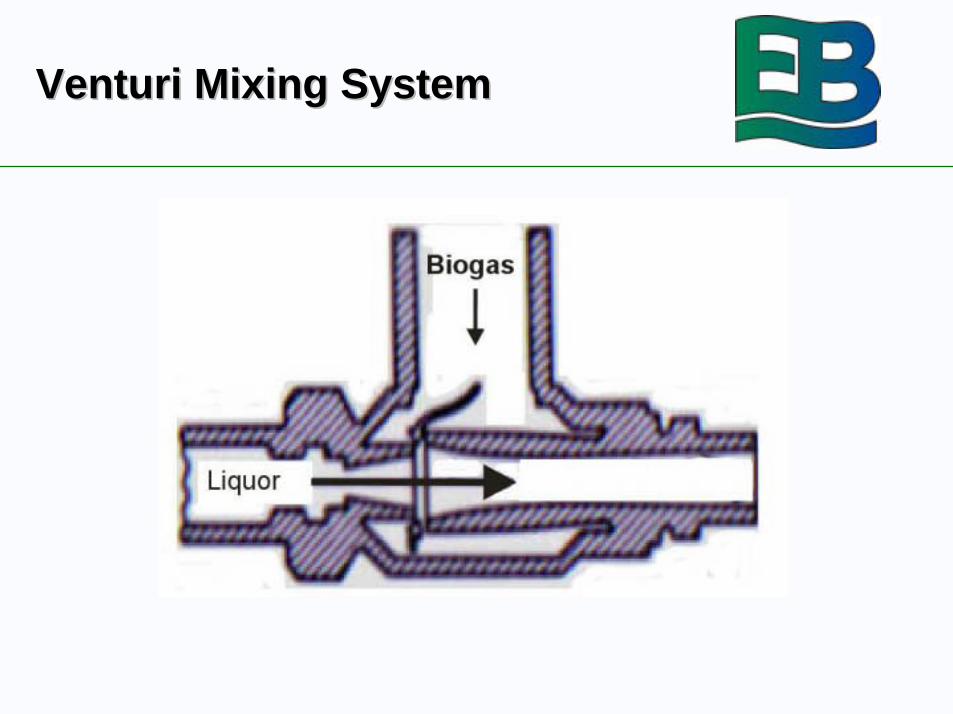
Venturi Mixing SystemVenturi Mixing System
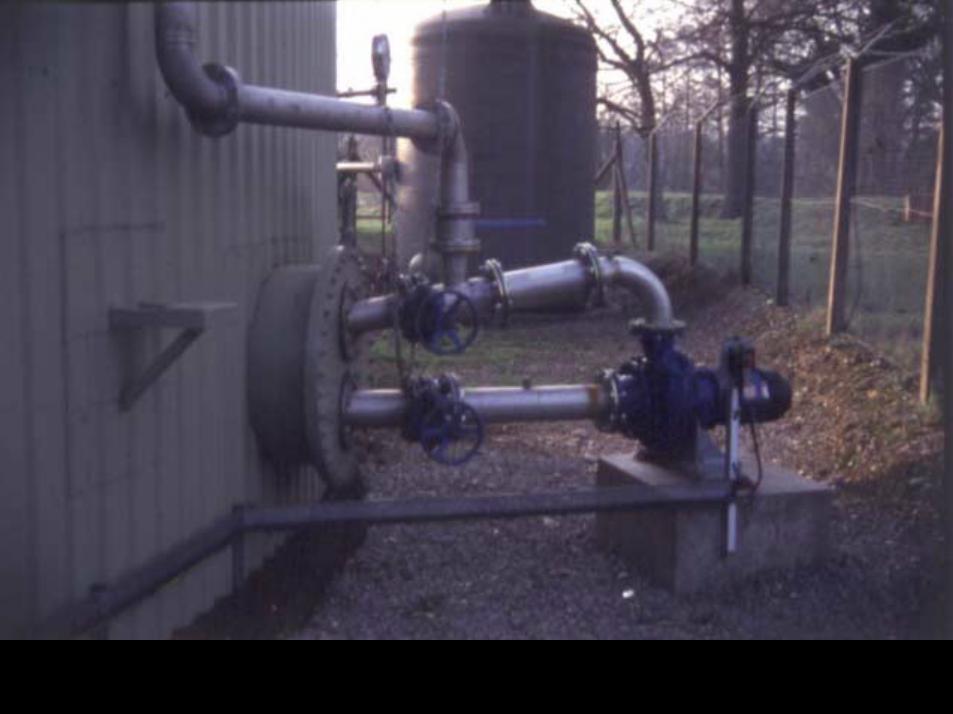
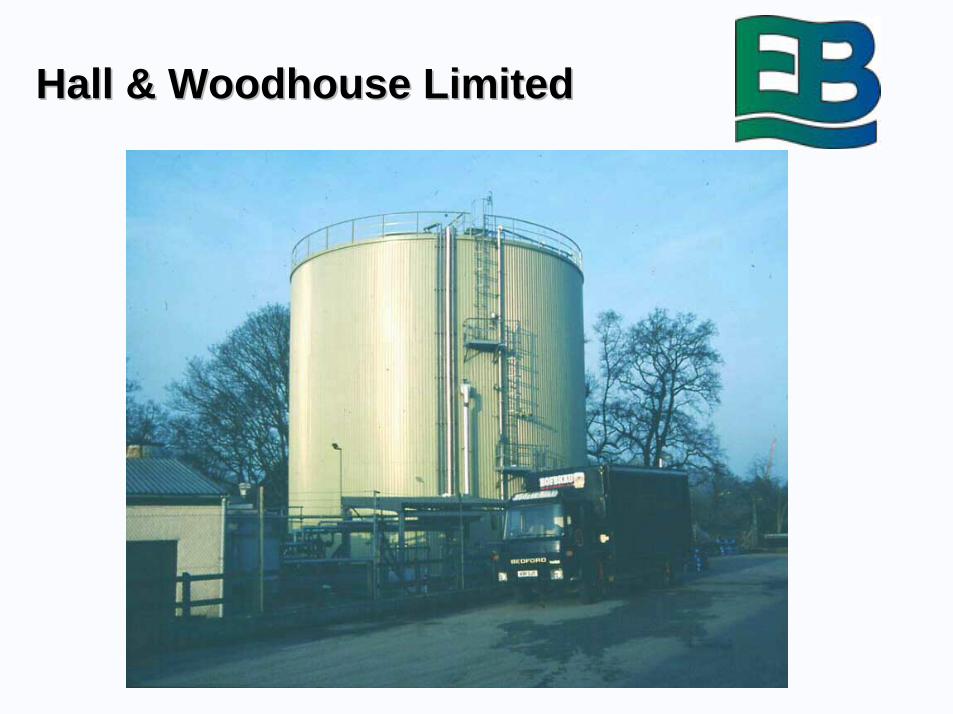
Hall & Woodhouse LimitedHall & Woodhouse Limited

CASE STUDY:CASE STUDY:Textile Industry EffluentTextile Industry Effluent
!! Mill on Site for more than 190 Years (PartMill on Site for more than 190 Years (Part
of of AxminsterAxminster Carpet Group) Carpet Group)
!! 140 Staff140 Staff
!! 2,900 tonnes Wool processed2,900 tonnes Wool processed
!! 2,000 tonnes Spun Yarn produced2,000 tonnes Spun Yarn produced
!! Lanolin wool grease and sheep dipLanolin wool grease and sheep dip
pesticides in the fleecespesticides in the fleeces
BuckfastBuckfast Spinning Limited Spinning Limited
!! BuckfastBuckfast Spinning has operated a Spinning has operated a
flocculation effluent treatment process forflocculation effluent treatment process for
25 years25 years
!! Wool scouring and dyeing effluentsWool scouring and dyeing effluents
combined to give overall discharge CODcombined to give overall discharge COD
of 4,000 mg/lof 4,000 mg/l

Effluent CharacteristicsEffluent Characteristics
!! High COD (3,500 mg/l)High COD (3,500 mg/l)
!! Flow 420 mFlow 420 m33/d/d
!! pH 6 - 8pH 6 - 8
!! High Temperature Effluent (25-40ºC)High Temperature Effluent (25-40ºC)
!! Trace Organophosphate PesticidesTrace Organophosphate Pesticides
!! ColourColour
!! Grease, Dirt, Sweat Salts, Trace Sheep Dip,Grease, Dirt, Sweat Salts, Trace Sheep Dip,Oils, Dyes, DetergentsOils, Dyes, Detergents

!! Effluent stored in Holding TanksEffluent stored in Holding Tanks
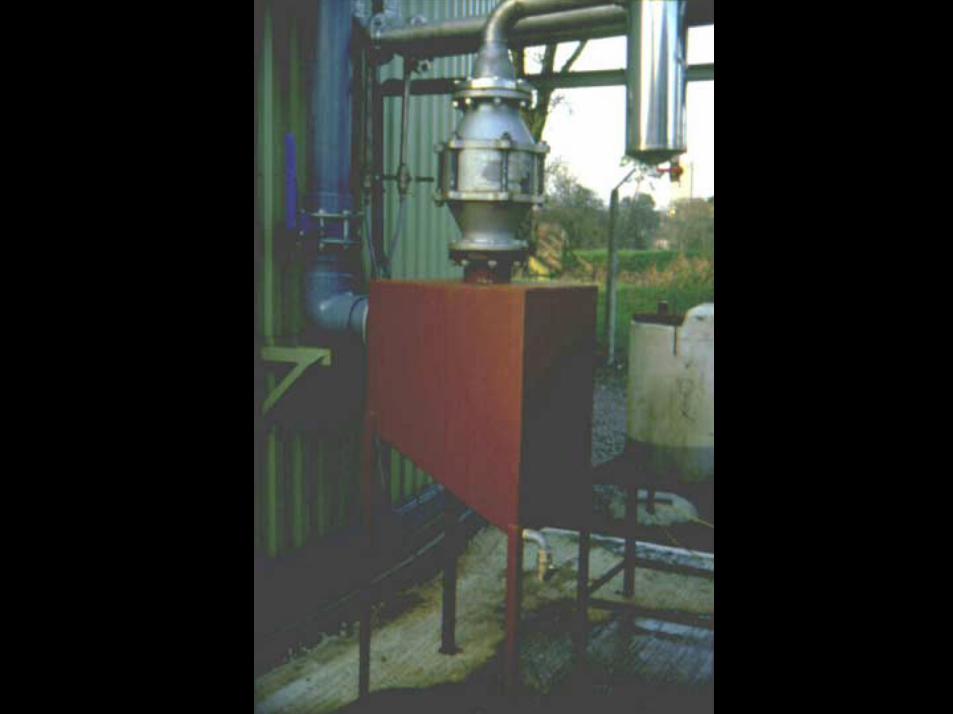
!! PretreatmentPretreatment by Acid Cracking/Flocculation by Acid Cracking/Flocculation
!! Effluent is Centrifuged and ResultingEffluent is Centrifuged and Resulting
Sludge is Sludge is LandfilledLandfilled
!! Final Effluent is Discharged to SewerFinal Effluent is Discharged to Sewer
!! COD and SS MonitoredCOD and SS Monitored
!! 70% of COD is removed by 70% of COD is removed by PretreatmentPretreatment
Pre-treatment of EffluentPre-treatment of Effluent

ProblemsProblems
!! £311,000 for Discharge of Effluent to Sewer in£311,000 for Discharge of Effluent to Sewer in
1997 (23% increase in last two years)1997 (23% increase in last two years)
!! £113,000 for on- site Effluent Treatment in£113,000 for on- site Effluent Treatment in
1997(excl. maintenance & parts)1997(excl. maintenance & parts)
!! Pesticide Emissions at least < 8.0 ppbPesticide Emissions at least < 8.0 ppb
!! Future Direct Toxicity AssessmentFuture Direct Toxicity Assessment
!! Sensitive LocationSensitive Location
Pilot PlantPilot Plant
!! Two 50mTwo 50m33 Reactors Reactors
!! De-gas Tank prior to DischargeDe-gas Tank prior to Discharge
!! Flare/Boiler for Biogas HandlingFlare/Boiler for Biogas Handling
!! pH ControlpH Control
!! Gas Compressor for MixingGas Compressor for Mixing

Pilot PlantPilot Plant

Pilot PlantPilot Plant

Pilot PlantPilot Plant
Status and ObjectivesStatus and Objectives
!! Biotechnology is the key to eliminating andBiotechnology is the key to eliminating anddegrading potentially harmful effluentdegrading potentially harmful effluent
!! Future ObjectivesFuture Objectives
-- Demonstrate successful Treatment of Demonstrate successful Treatment of Textile Effluent by Anaerobic DigestionTextile Effluent by Anaerobic Digestion
-- COD Removal (>50%)COD Removal (>50%)
-- Degradation of Toxic Organics and Degradation of Toxic Organics and Pesticide (40-80%)Pesticide (40-80%)
-- Colour ReductionColour Reduction
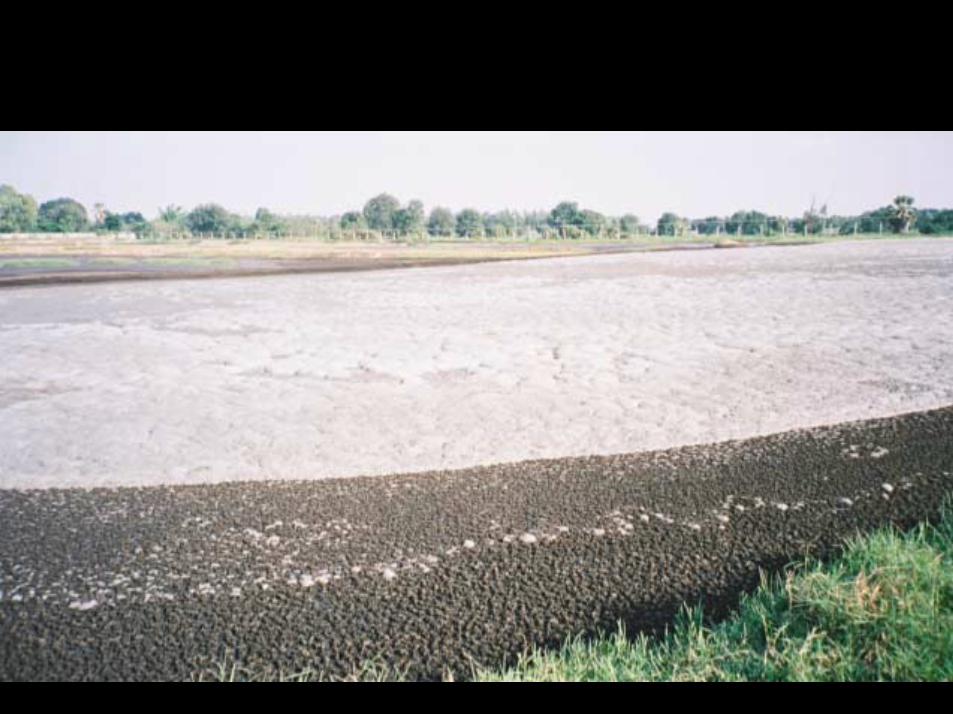
CASE STUDY:CASE STUDY:Cassava Processing in AsiaCassava Processing in Asia
!! ProblemProblem!! 6000m3/d effluent 6000m3/d effluent discahrgeddiscahrged to 72 open to 72 open
lagoonslagoons!! Massive methane emissions to atmosphereMassive methane emissions to atmosphere!! No energy captureNo energy capture
!! SolutionSolution!! New Flexible Liner DigesterNew Flexible Liner Digester!! Third Party design, install, own operateThird Party design, install, own operate!! Natural Gas to run plantNatural Gas to run plant!! Excess electricity to GridExcess electricity to Grid
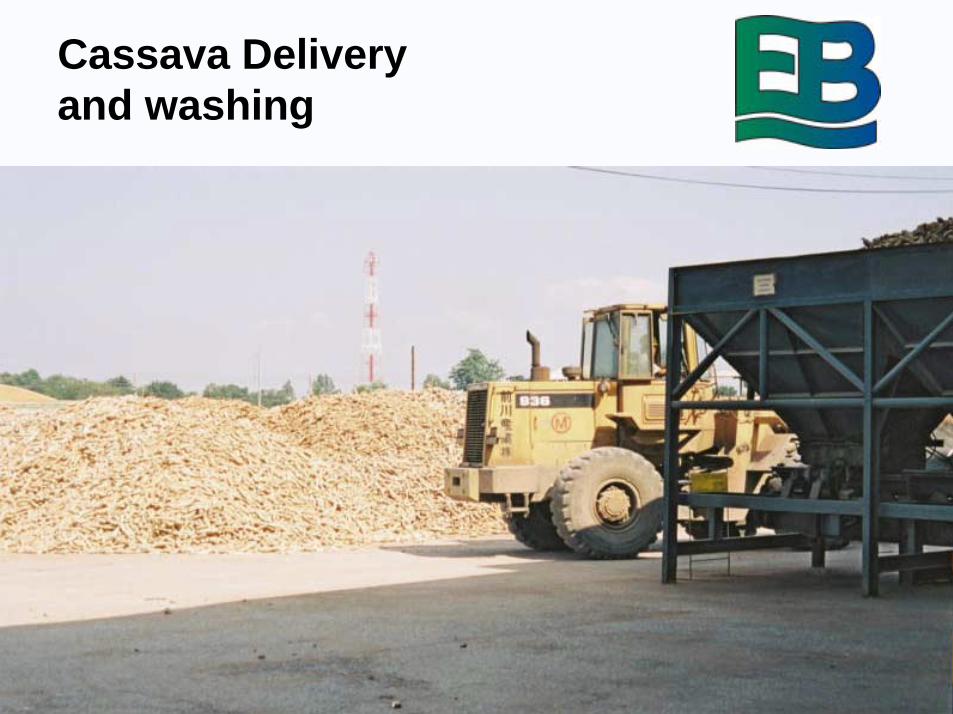
Cassava Deliveryand washing
Digester Volume = 100,000m3
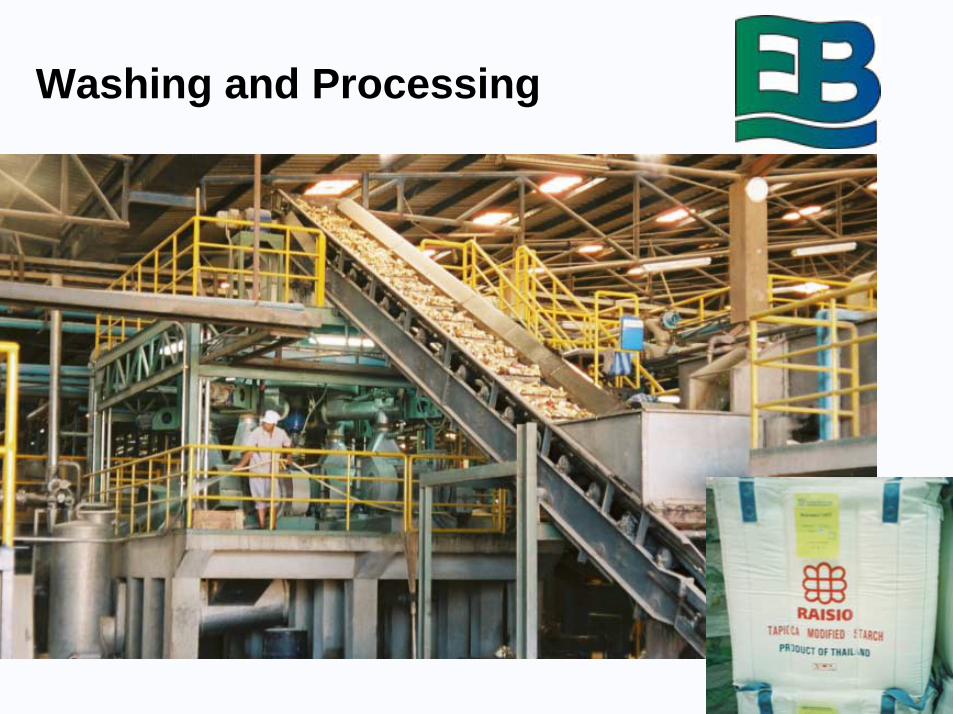
Washing and Processing

Pretreatment
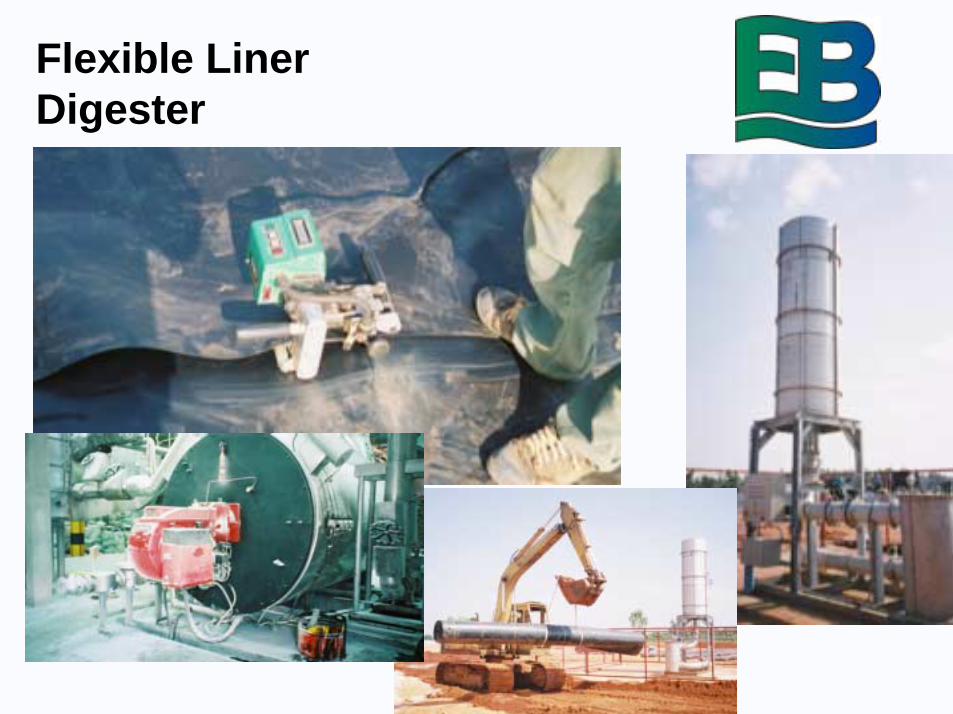
Flexible LinerDigester
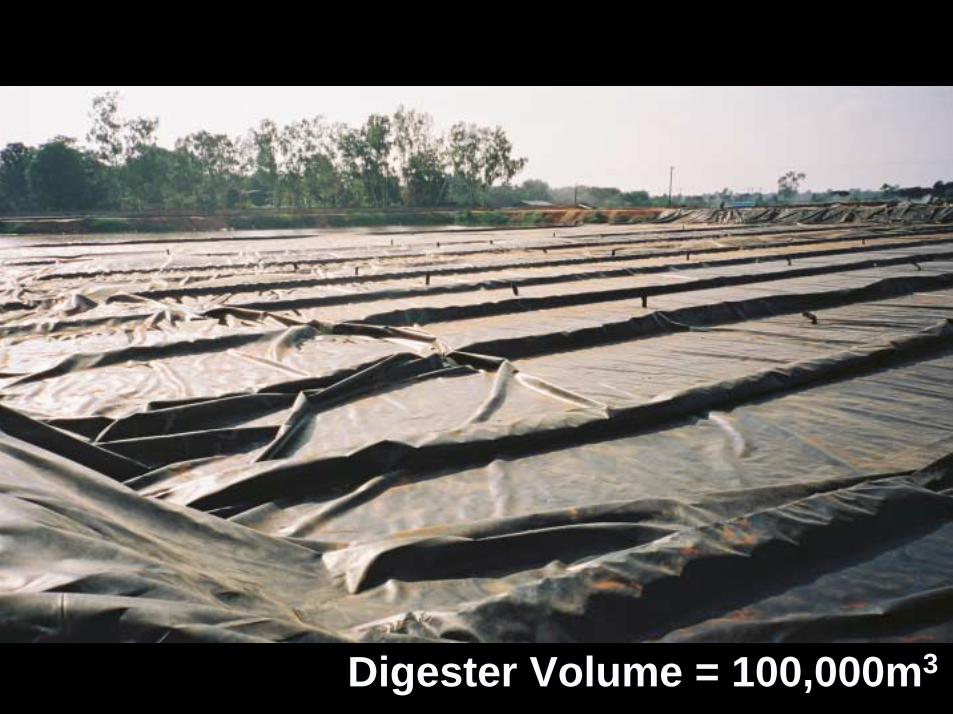
Digester Volume = 100,000m3
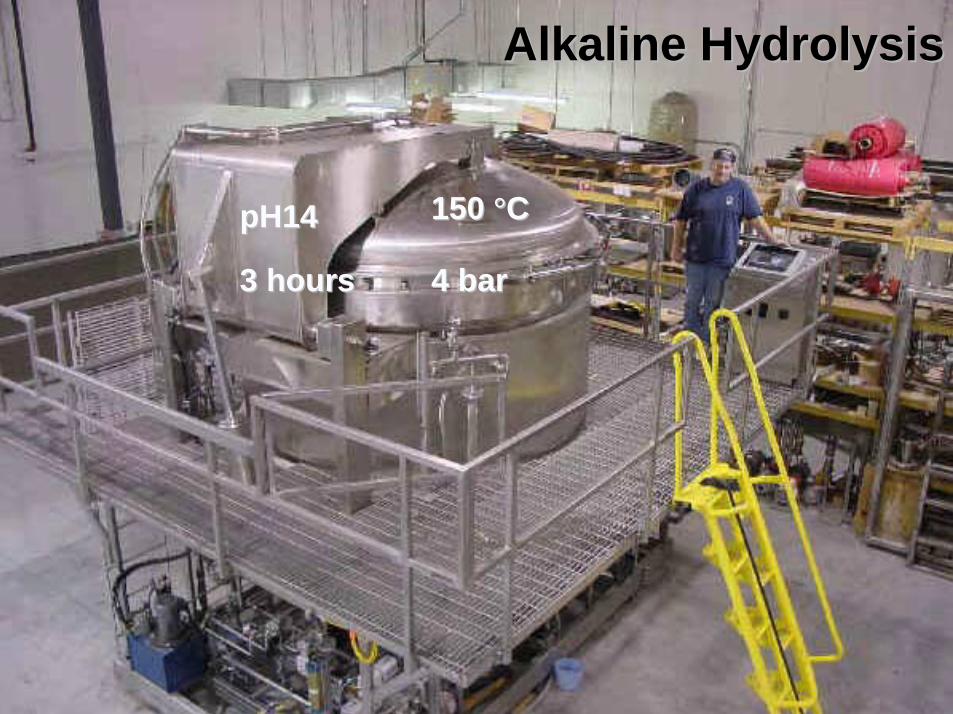
150 150 °°CC
3 hours3 hours 4 bar4 bar
pH14pH14
Alkaline HydrolysisAlkaline Hydrolysis
WRE SystemWRE System
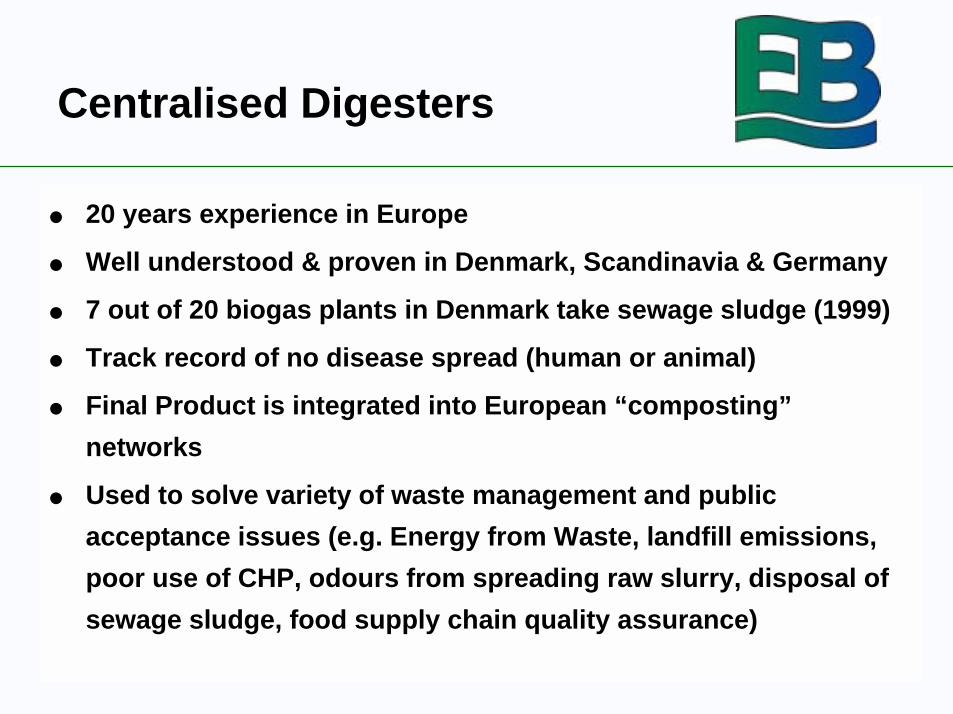
! 20 years experience in Europe
! Well understood & proven in Denmark, Scandinavia & Germany
! 7 out of 20 biogas plants in Denmark take sewage sludge (1999)
! Track record of no disease spread (human or animal)
! Final Product is integrated into European “composting”
networks
! Used to solve variety of waste management and public
acceptance issues (e.g. Energy from Waste, landfill emissions,
poor use of CHP, odours from spreading raw slurry, disposal of
sewage sludge, food supply chain quality assurance)
Centralised Digesters
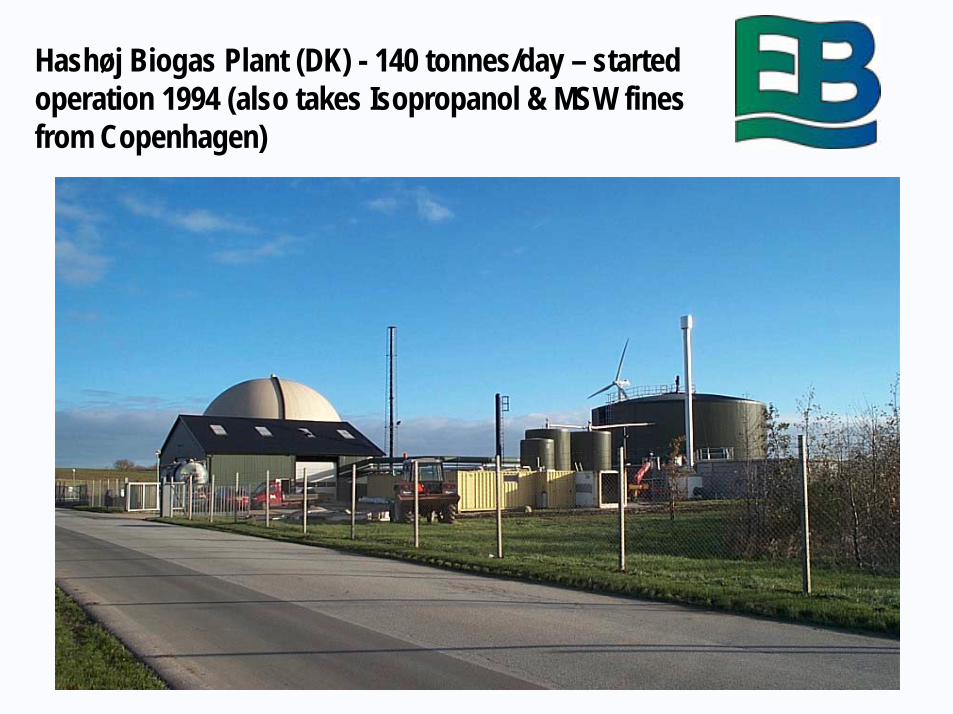
Hashøj Biogas Plant (DK) - 140 tonnes/day – startedoperation 1994 (also takes Isopropanol & MSW finesfrom Copenhagen)
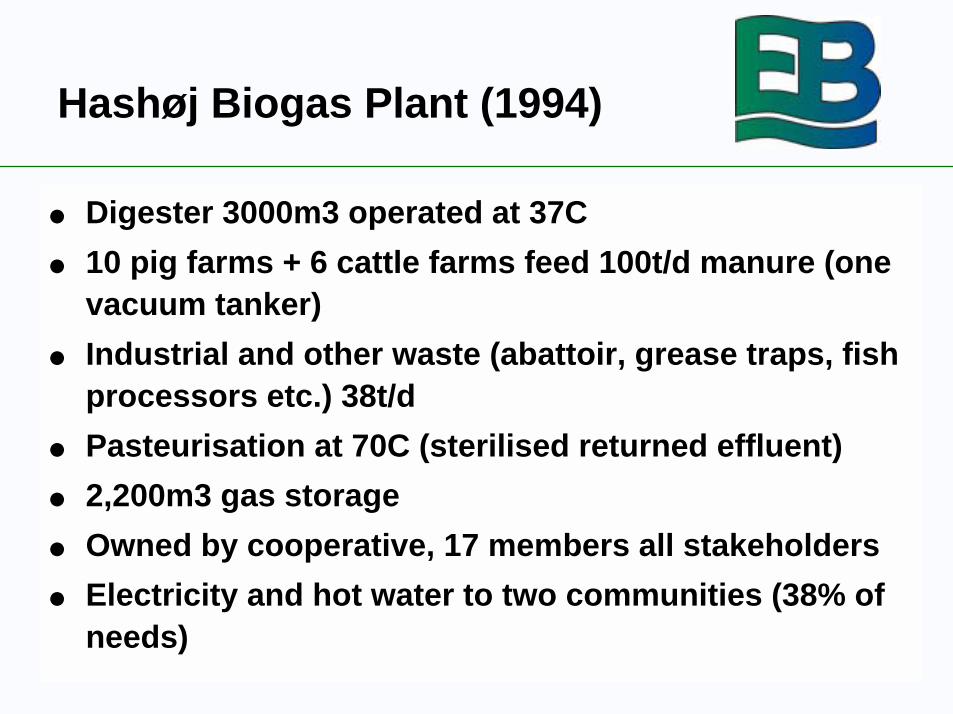
! Digester 3000m3 operated at 37C
! 10 pig farms + 6 cattle farms feed 100t/d manure (onevacuum tanker)
! Industrial and other waste (abattoir, grease traps, fishprocessors etc.) 38t/d
! Pasteurisation at 70C (sterilised returned effluent)
! 2,200m3 gas storage
! Owned by cooperative, 17 members all stakeholders
! Electricity and hot water to two communities (38% ofneeds)
Hashøj Biogas Plant (1994)

KristianstadKristianstad Biogas Plant (S) - 200 tonnes/day Biogas Plant (S) - 200 tonnes/day - started operation 1996 - started operation 1996(takes source separated kitchen wastes, manures)(takes source separated kitchen wastes, manures)

LoickLoick Digester Digester

! Digester 970m3 operated at 38C
! 35t/d @ 14% TS biomass from 700pigs, greasetraps, food processing wastes, corn and ryesilage
! 25-30 days HRT with 75% organic removalefficiency
! 2,640m3/d biogas to 249kWe CHP
Loick Digester (2001)


Witte Digester (1998)
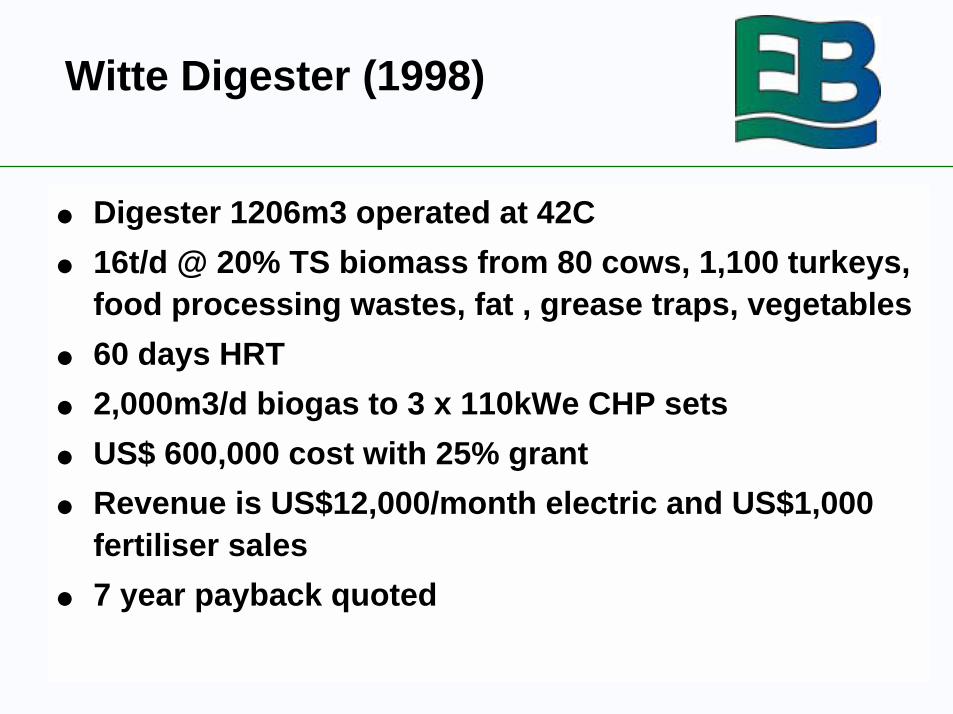
! Digester 1206m3 operated at 42C
! 16t/d @ 20% TS biomass from 80 cows, 1,100 turkeys,food processing wastes, fat , grease traps, vegetables
! 60 days HRT
! 2,000m3/d biogas to 3 x 110kWe CHP sets
! US$ 600,000 cost with 25% grant
! Revenue is US$12,000/month electric and US$1,000fertiliser sales
! 7 year payback quoted
Witte Digester (1998)
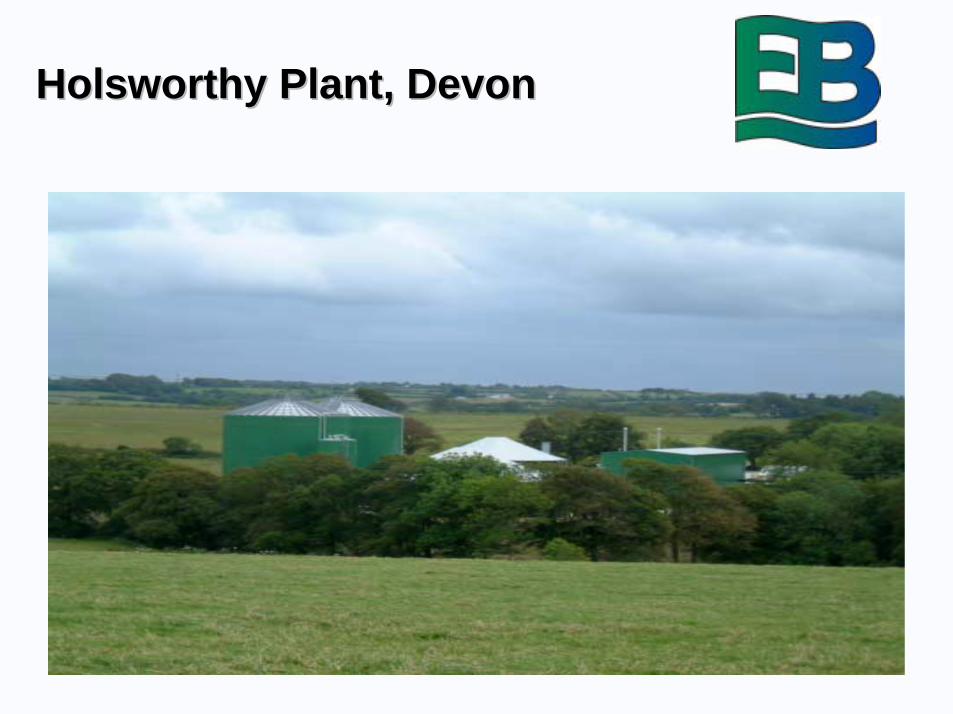
Holsworthy Plant, DevonHolsworthy Plant, Devon

•


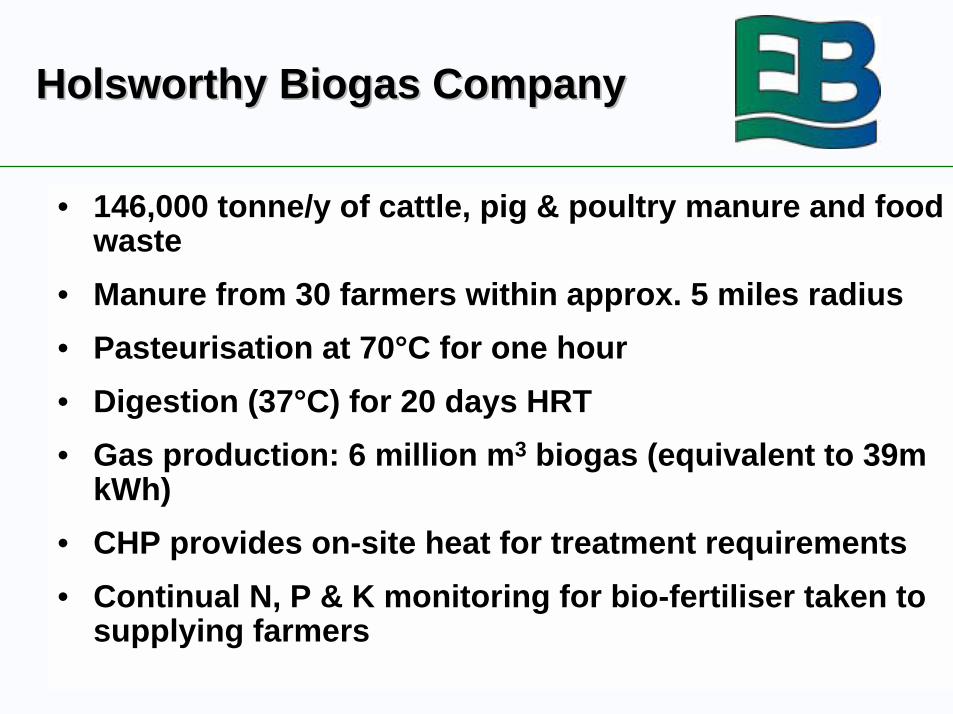
• 146,000 tonne/y of cattle, pig & poultry manure and foodwaste
• Manure from 30 farmers within approx. 5 miles radius
• Pasteurisation at 70°C for one hour
• Digestion (37°C) for 20 days HRT
• Gas production: 6 million m3 biogas (equivalent to 39mkWh)
• CHP provides on-site heat for treatment requirements
• Continual N, P & K monitoring for bio-fertiliser taken tosupplying farmers
Holsworthy Biogas CompanyHolsworthy Biogas Company
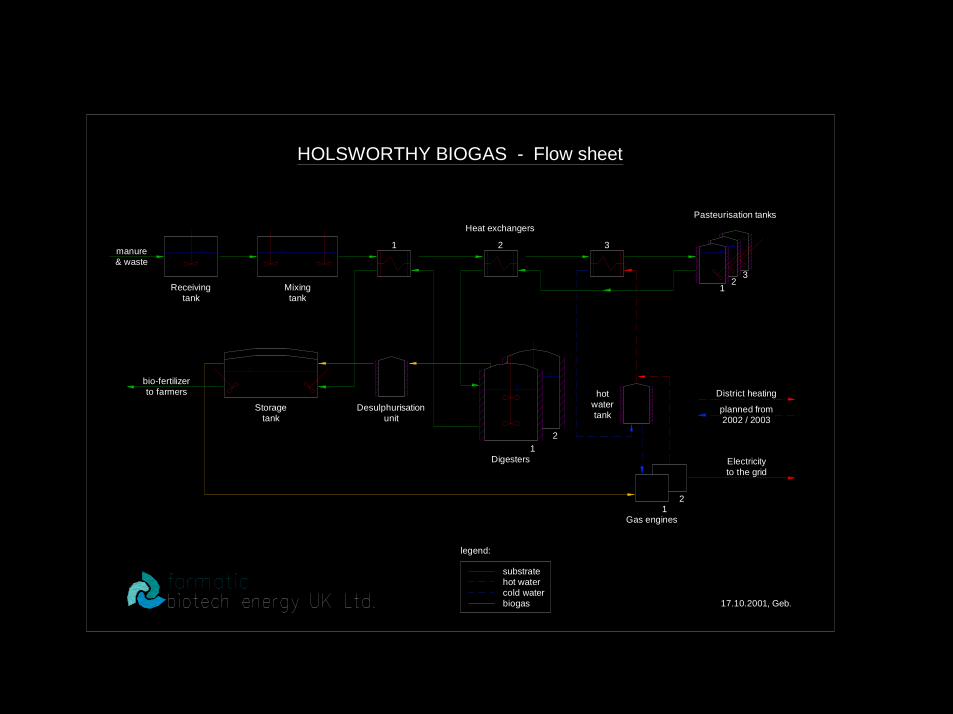
1 2 3
21
3
21
Heat exchangers
Pasteurisation tanks
Receivingtank
Mixingtank
hotwatertank
Gas engines
manure& waste
to farmersbio-fertilizer
2002 / 2003planned from
District heating
to the gridElectricity
HOLSWORTHY BIOGAS - Flow sheet
Storagetank unit
Desulphurisation
17.10.2001, Geb.
21
Digesters
substratehot watercold waterbiogas
legend:
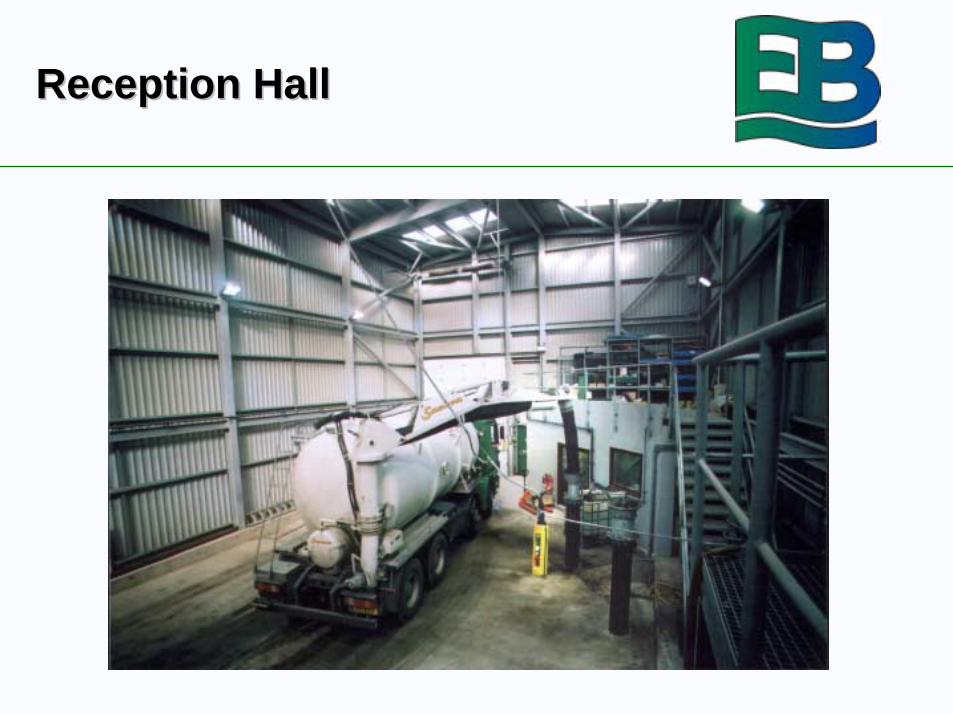
Reception HallReception Hall

!! Totally enclosed (& pressurised) system afterTotally enclosed (& pressurised) system after
unloadingunloading
!! Only manually controlled at point of ‘reception pit’ toOnly manually controlled at point of ‘reception pit’ to
ensure right mixture goes into ‘mixing tank’ viaensure right mixture goes into ‘mixing tank’ via
chopper pumpschopper pumps
!! Automatic return (re-start) if parameters ofAutomatic return (re-start) if parameters of
‘pasteurisation unit’ not reached‘pasteurisation unit’ not reached
!! Farmers usually operate 3 week no grazing systemFarmers usually operate 3 week no grazing system
!! Constant MonitoringConstant Monitoring
The ProcessThe Process
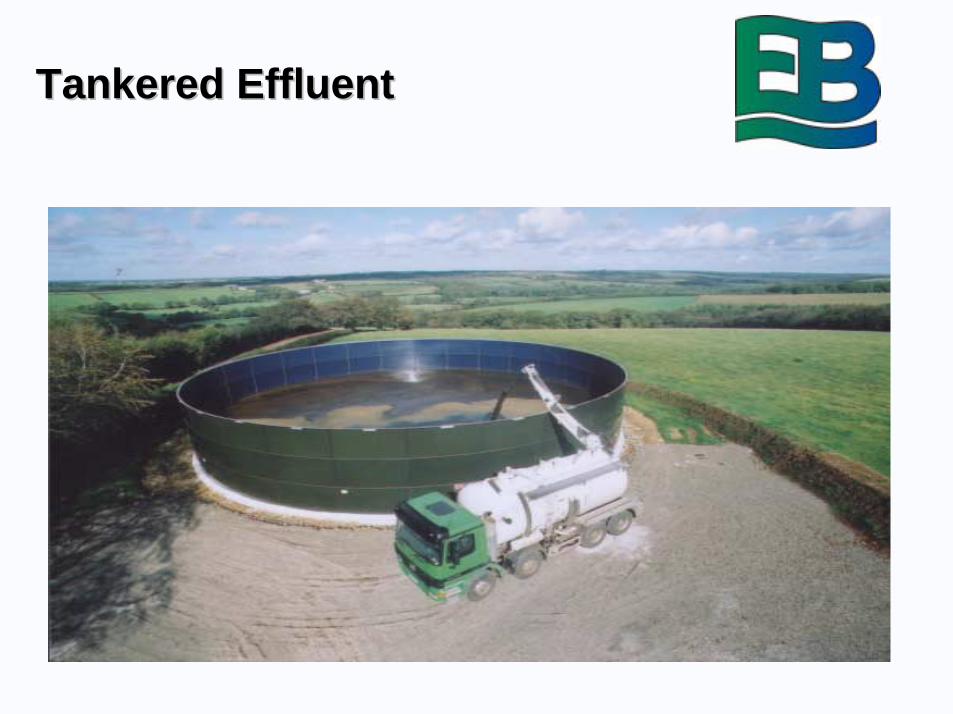
Tankered EffluentTankered Effluent

!! Complexity of legislation increasingComplexity of legislation increasing!! Limited understanding by Regulators of relativelyLimited understanding by Regulators of relatively
new conceptnew concept!! Increasing requirements for involvement withIncreasing requirements for involvement with
farmers and monitoring of spreading practicesfarmers and monitoring of spreading practices!! UK has narrow focus on “composting” industry –UK has narrow focus on “composting” industry –
poor awarenesspoor awareness!! Physical contamination problems when using sourcePhysical contamination problems when using source
separated kitchen wastes (MSW)separated kitchen wastes (MSW)!! Classification of what is a “waste” and when does itClassification of what is a “waste” and when does it
become a productbecome a product
Barriers to Co-Digestion inBarriers to Co-Digestion inthe UKthe UK
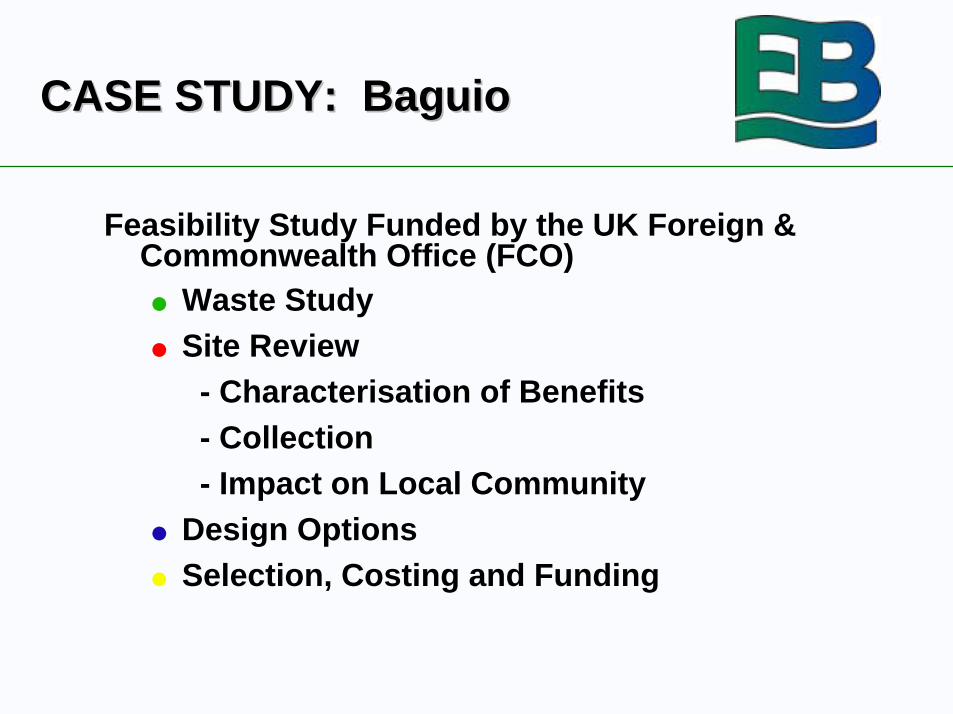
Feasibility Study Funded by the UK Foreign &Commonwealth Office (FCO)! Waste Study! Site Review
- Characterisation of Benefits- Collection- Impact on Local Community
! Design Options! Selection, Costing and Funding
CASE STUDY: CASE STUDY: BaguioBaguio

IrisanIrisan Dumpsite Dumpsite

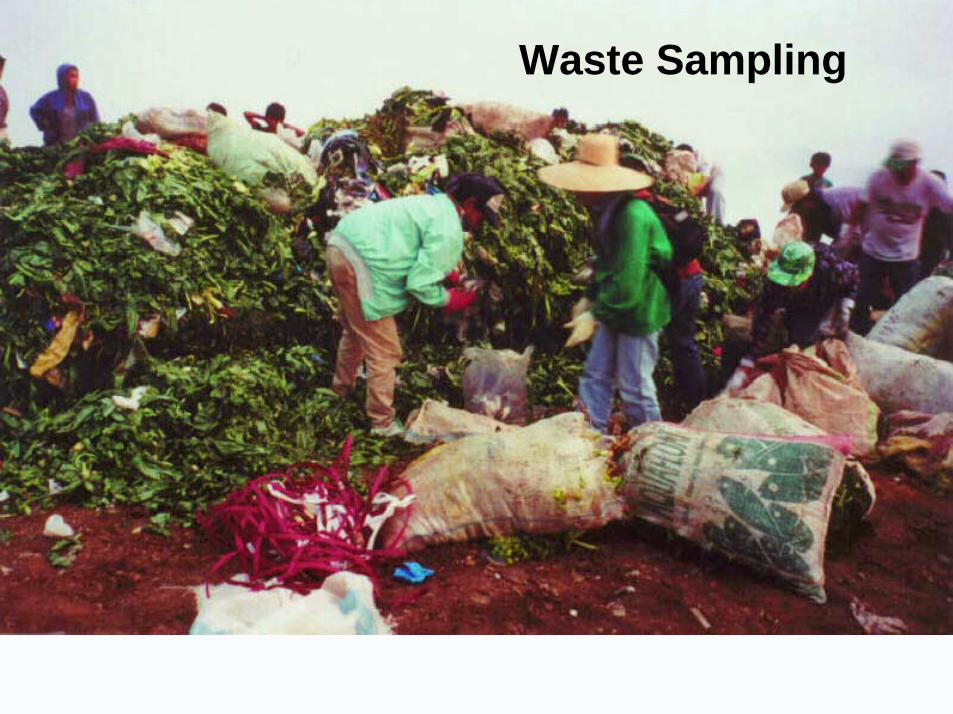
Waste Sampling

Waste CharacteristicsWaste Characteristics
Waste Category White Truck(kg) Yellow Truck (kg)Paper 37 146Plastic 53 479Rubber/Leather 0 0Vegetable/Organic Waste 4,564 1,193Food Waste 0 0Glass 14 2Metal/Tin Cans 8 12Textile 4 0Inert 0 0Wood 16 435Special Waste/Fish & Meat Waste 0 20Total 4,696 2,287Bulk Density 470 kg/m3 229 kg/m3
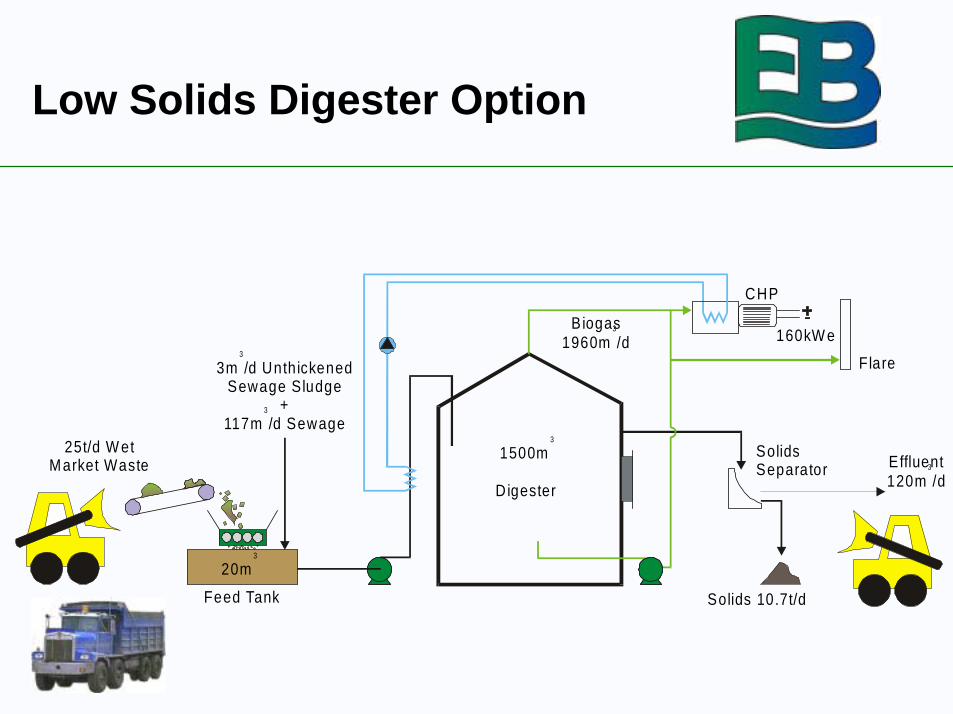
Low Solids Digester Option
Effluent120m /d
3
Flare
Solids 10.7t/d
3m /d UnthickenedSewage Sludge
+117m /d Sewage
3
3
20m 3
Feed Tank
1500m3
Digester
B iogas1960m /d
3
SolidsSeparator
25t/d W etMarket Waste
CHP
160kW e
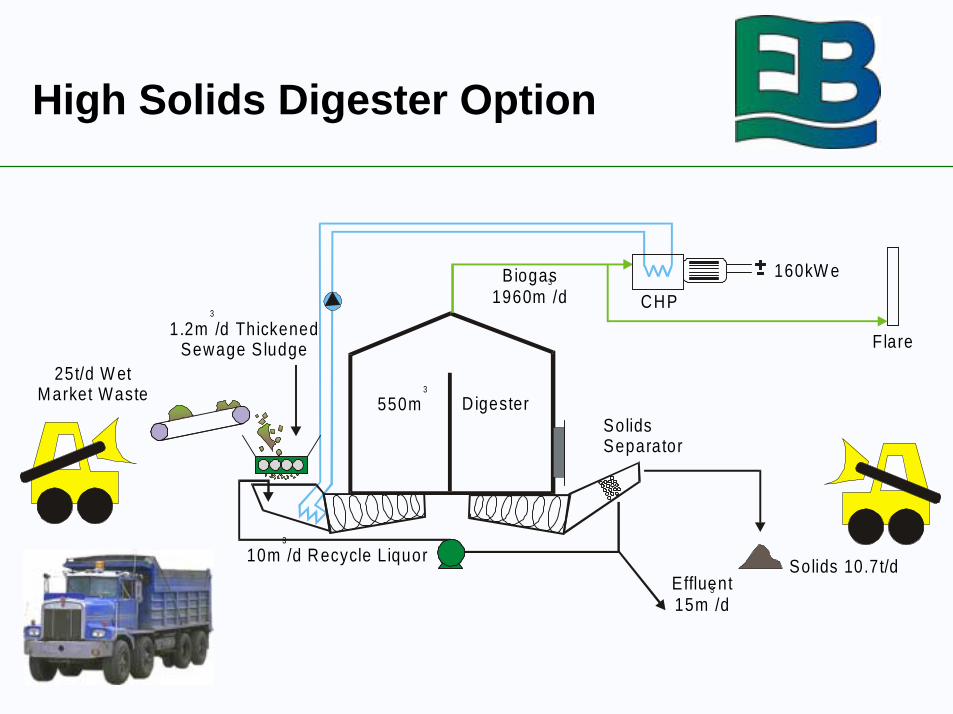
High Solids Digester Option
CHP
Effluent15m /d
3
F lare
Solids 10.7t/d
1.2m /d ThickenedSewage S ludge
3
550m3
D igester
B iogas1960m /d
3
SolidsSeparator
25t/d W etMarket Waste
10m /d Recycle Liquor3
160kW e
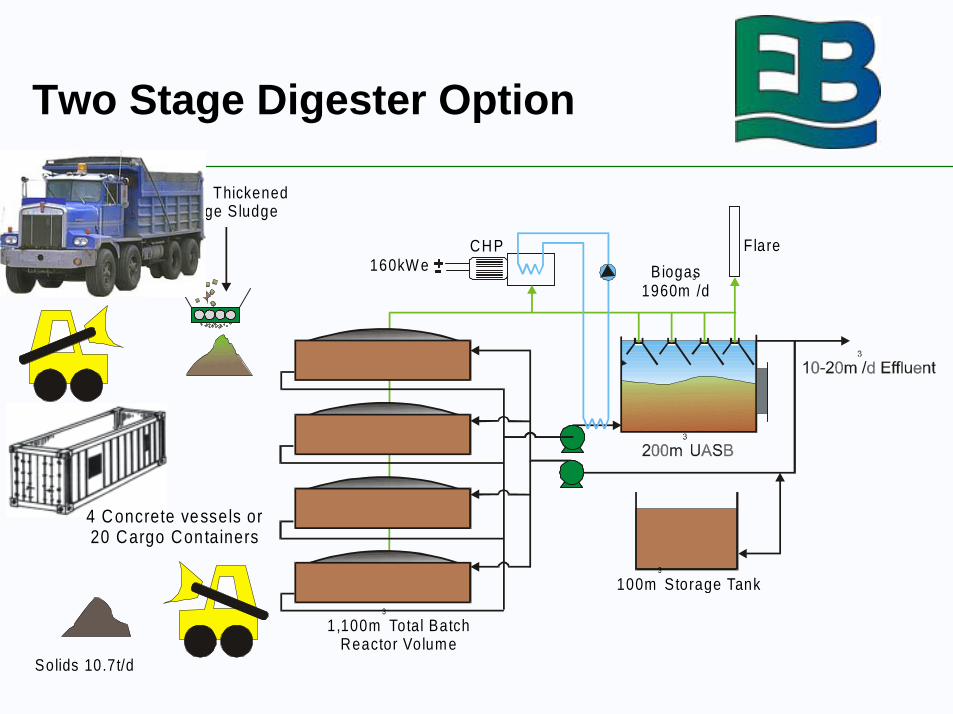
Two Stage Digester Option
100m3
S torage Tank
Solids 10.7t/d
Flare
1.2m /d ThickenedSewage S ludge
1,100m3
Total BatchReactor Volume
Biogas1960m /d
3
4 Concrete vessels or 20 Cargo Containers
CHP160kW e
25t/d W etMarket Waste

Oxidation D
itches
Ba lili R
ive r
InfluentPipe
Grit Chambers
PrimarySettlement
Tank
S ludge
Thickeners
F inalSedimen
-tation
Tanks
ControlRoom
M SW Digestion Area
New B ridgeand Roadway
Squatter Area
Site RoadBalili R iver
M a in E n trance to S ite
Hand Pick
Line
RejectsIncoming waste
Waste for D igestion
Static P ile Com postingSite for Phase 2Development?
1,500m d igester fo r Low Solids Option3
550m digester for H igh Solids Option3
220m digester for Two Stage Option3
Batch D igesters(8m x 17m x 2m deep) S
ite R
oad
Mai
n R
oad
CHP Unit and Control Room
Location atLocation atBaguioBaguio STW STW

Composting DigComposting Digesestatetate
A ir
M a tu re C om post
D igesta te and Bu lk in g Ag en t
A era tion P ipew o rkB low e rC o nd en sa te
Trap
F ilte r fromM atu re
C o m post
E xhaust A ir
R o ofed S lu dge D ry ing A re a
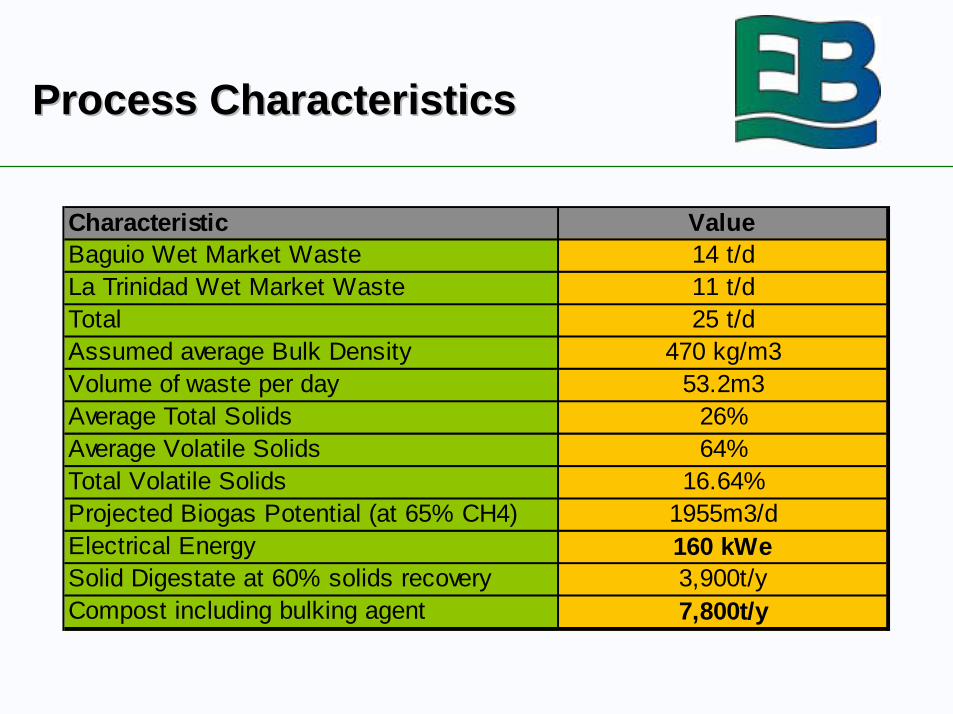
Process CharacteristicsProcess Characteristics
Characteristic ValueBaguio Wet Market Waste 14 t/dLa Trinidad Wet Market Waste 11 t/dTotal 25 t/dAssumed average Bulk Density 470 kg/m3Volume of waste per day 53.2m3Average Total Solids 26%Average Volatile Solids 64%Total Volatile Solids 16.64%Projected Biogas Potential (at 65% CH4) 1955m3/dElectrical Energy 160 kWeSolid Digestate at 60% solids recovery 3,900t/yCompost including bulking agent 7,800t/y
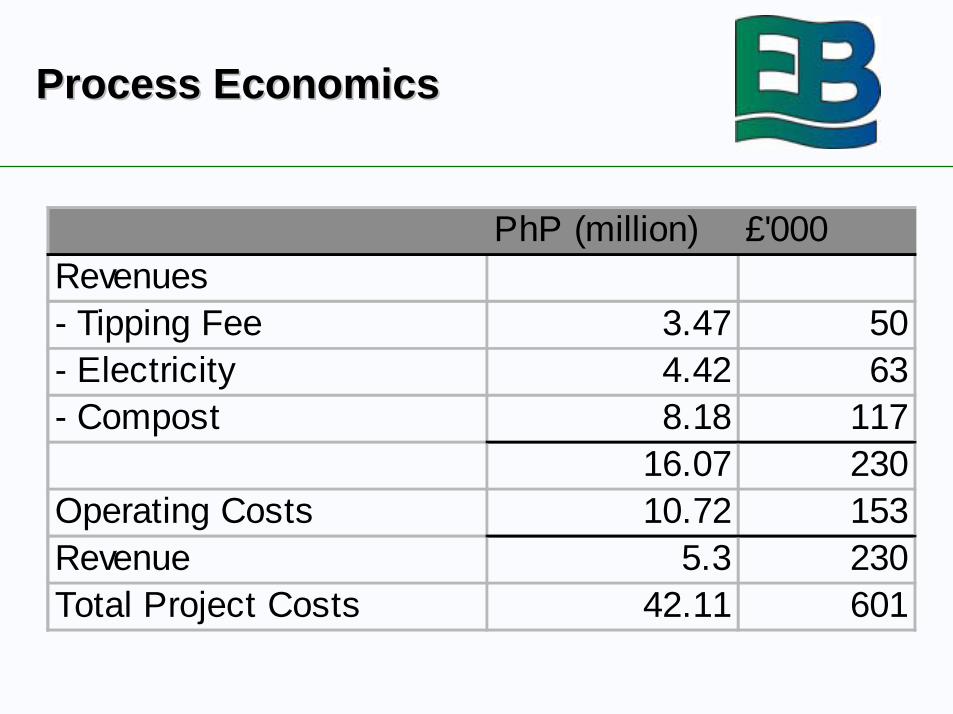
Process EconomicsProcess Economics
PhP (million) £'000Revenues- Tipping Fee 3.47 50- Electricity 4.42 63- Compost 8.18 117
16.07 230Operating Costs 10.72 153Revenue 5.3 230Total Project Costs 42.11 601

BaguioBaguio Project Development Project Development
Phase 1 : 25t/d Wet Market WastePhase 1 : 25t/d Wet Market Waste
Phase 2 : + 70t/d 50% Baguio MSWPhase 2 : + 70t/d 50% Baguio MSW
Phase 3 : +70t/d 50% Baguio MSWPhase 3 : +70t/d 50% Baguio MSW
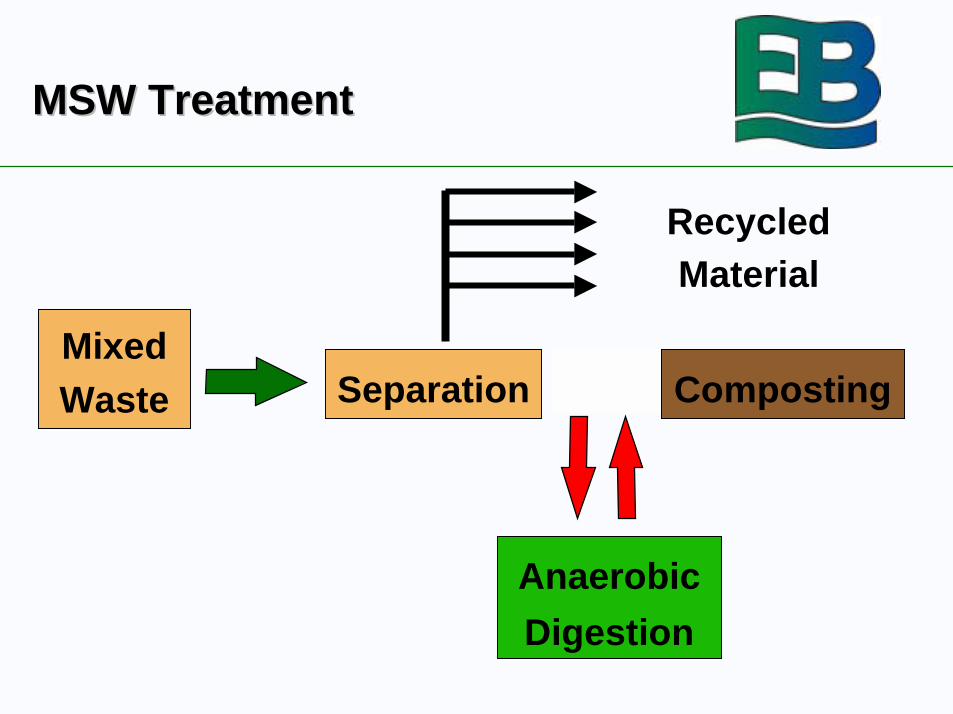
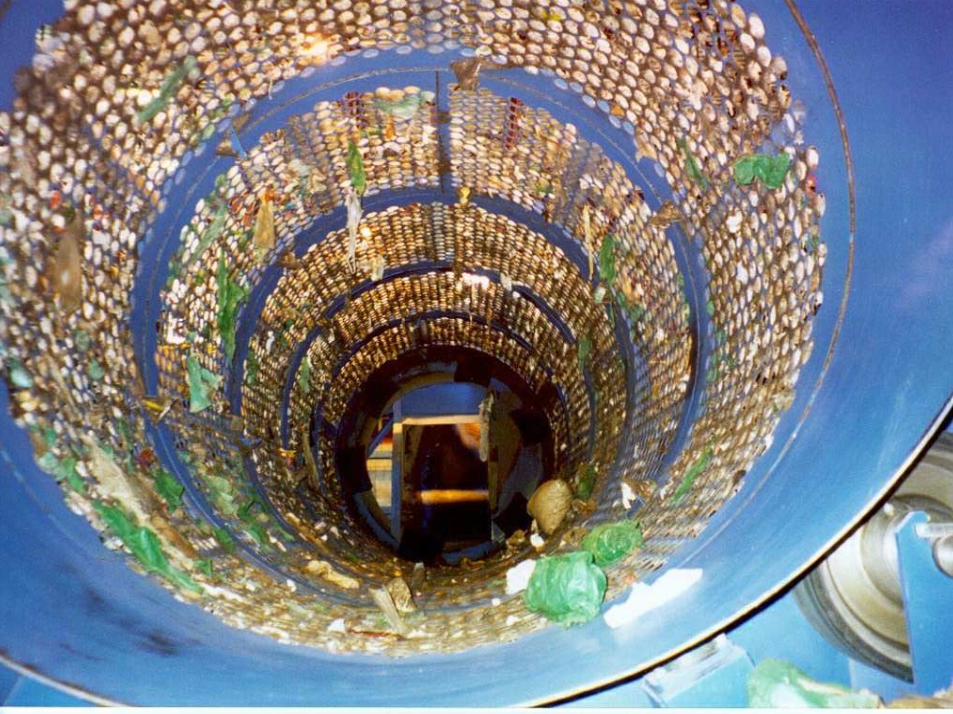
MSW TreatmentMSW Treatment
MixedWaste Separation Composting
RecycledMaterial
Anaerobic
Digestion
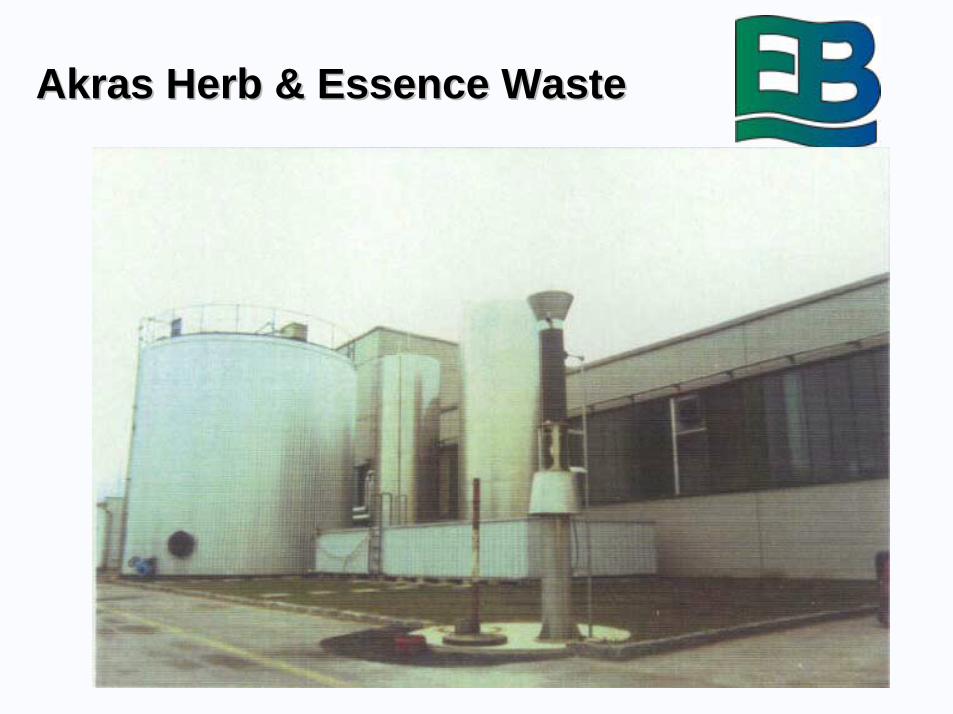
Akras Herb & Essence WasteAkras Herb & Essence Waste
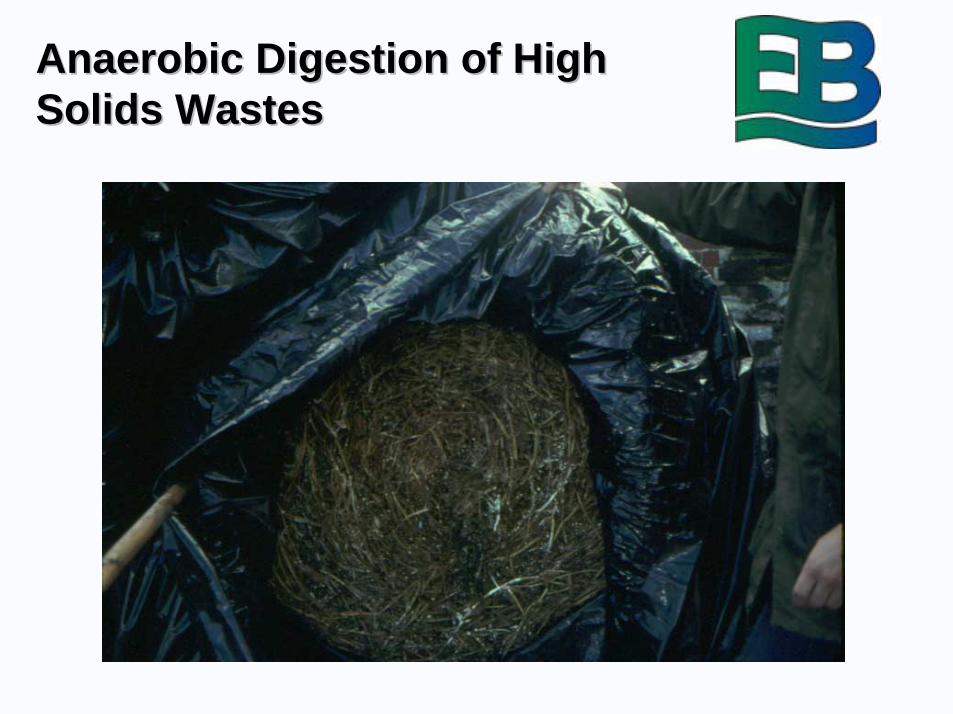
Anaerobic Digestion of HighAnaerobic Digestion of HighSolids WastesSolids Wastes
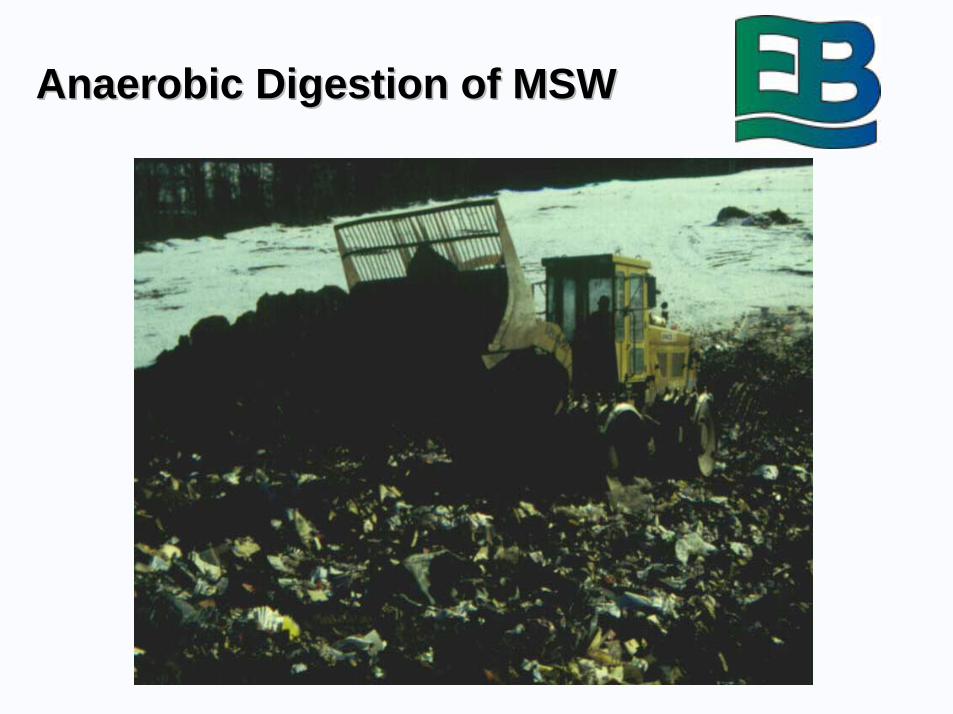
Anaerobic Digestion of MSWAnaerobic Digestion of MSW

Overview of renewables supportmeasures to date
! NFFO introduced in 1990 Electricity Act
! 5 Orders (& 3 in Scotland, 2 in NI)
! over 3600 MW contracted
! only 950 MW built so far
! low prices
! long period of consultation
! Start of Renewables Obligation
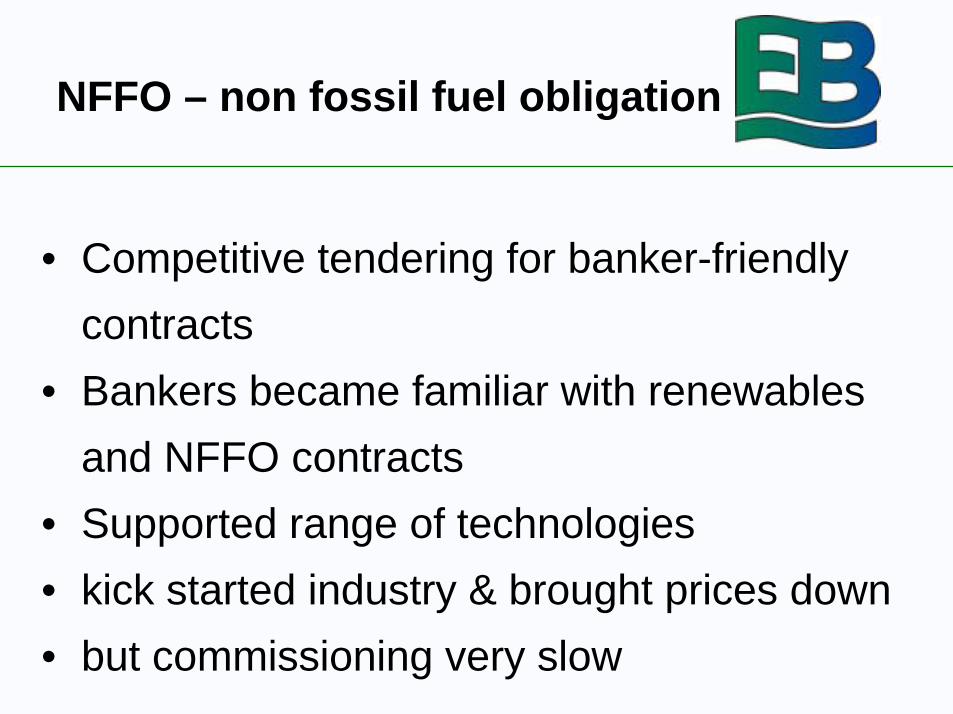
NFFO – non fossil fuel obligation
• Competitive tendering for banker-friendly
contracts
• Bankers became familiar with renewables
and NFFO contracts
• Supported range of technologies
• kick started industry & brought prices down
• but commissioning very slow
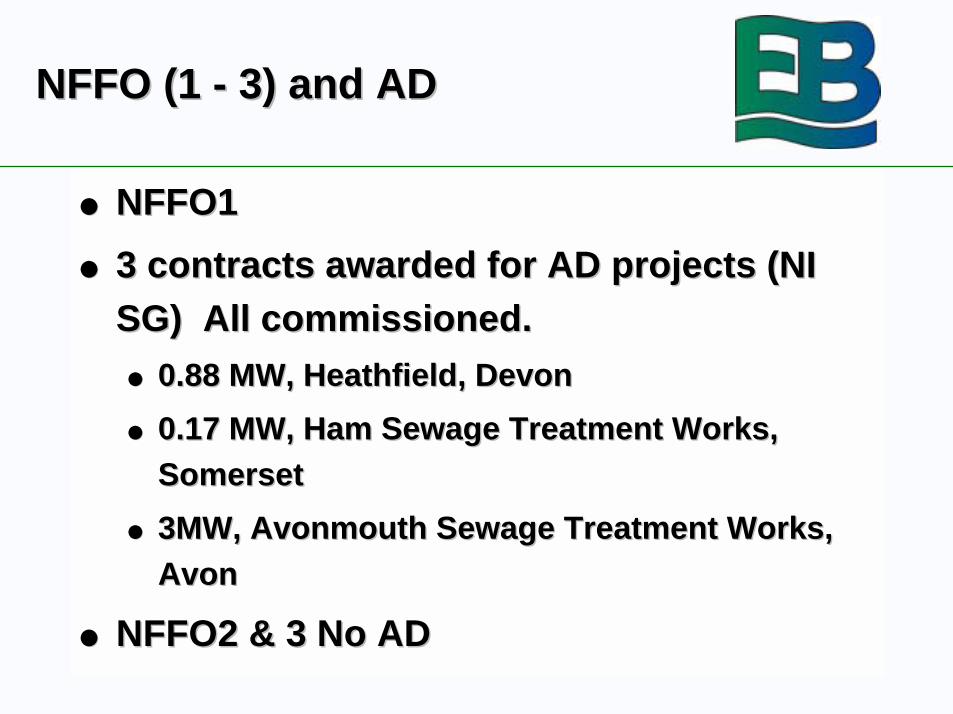
NFFO (1 - 3) and ADNFFO (1 - 3) and AD
!! NFFO1NFFO1
!! 3 contracts awarded for AD projects (NI3 contracts awarded for AD projects (NISG) All commissioned.SG) All commissioned.
!! 0.88 MW, Heathfield, Devon0.88 MW, Heathfield, Devon
!! 0.17 MW, Ham Sewage Treatment Works,0.17 MW, Ham Sewage Treatment Works,SomersetSomerset
!! 3MW, Avonmouth Sewage Treatment Works,3MW, Avonmouth Sewage Treatment Works,AvonAvon
!! NFFO2 & 3 No ADNFFO2 & 3 No AD

!! NFFO4, 6 contracts awarded for AD projectsNFFO4, 6 contracts awarded for AD projects
Status as of April 2002Status as of April 2002!! LRZ LtdLRZ Ltd
!! Eye AirfieldEye Airfield 1.051.05 No PA madeNo PA made
!! AGTEC LtdAGTEC Ltd
!! Spalford ADS, LincsSpalford ADS, Lincs 11 No PA madeNo PA made
!! Whitchurch Hydro ADS, ShropshireWhitchurch Hydro ADS, Shropshire 22 No PA madeNo PA made
!! Hydro Leeming AD, N. YorkshireHydro Leeming AD, N. Yorkshire 0.50.5 PA approvedPA approved
!! Hydro Seamer ADS, N YorkshireHydro Seamer ADS, N Yorkshire 0.60.6 No PA madeNo PA made
!! Holsworthy Biogas CompanyHolsworthy Biogas Company
!! Holdsworthy, DevonHoldsworthy, Devon 1.431.43 CommissionedCommissioned
!! NFFO5 AD not eligible to enterNFFO5 AD not eligible to enter
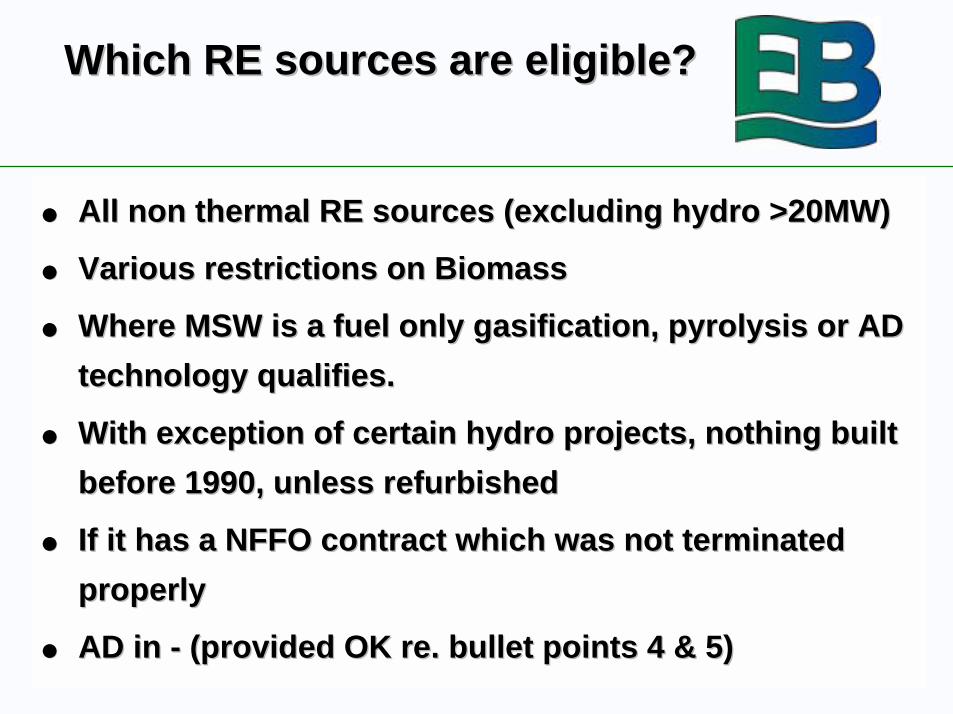
Which RE sources are eligible?Which RE sources are eligible?
!! All non thermal RE sources (excluding hydro >20MW)All non thermal RE sources (excluding hydro >20MW)
!! Various restrictions on BiomassVarious restrictions on Biomass
!! Where MSW is a fuel only gasification, pyrolysis or ADWhere MSW is a fuel only gasification, pyrolysis or AD
technology qualifies.technology qualifies.
!! With exception of certain hydro projects, nothing builtWith exception of certain hydro projects, nothing built
before 1990, unless refurbishedbefore 1990, unless refurbished
!! If it has a NFFO contract which was not terminatedIf it has a NFFO contract which was not terminated
properlyproperly
!! AD in - (provided OK re. bullet points 4 & 5)AD in - (provided OK re. bullet points 4 & 5)

Biogas incentives in GermanyBiogas incentives in Germany
!! German Renewable Energy Act (1.4.2000) German Renewable Energy Act (1.4.2000)
!! Electricity 20 year min price Electricity 20 year min price
!! 30% capital refund after construction (grant) 30% capital refund after construction (grant)
!! Long term soft loan Long term soft loan

Biogas incentives in GermanyBiogas incentives in Germany
!! 150 developers and installers of new systems 150 developers and installers of new systems
!! 1000 new plants installed 1000 new plants installed
!! > 2000 new jobs > 2000 new jobs
!! now stopped… now stopped…
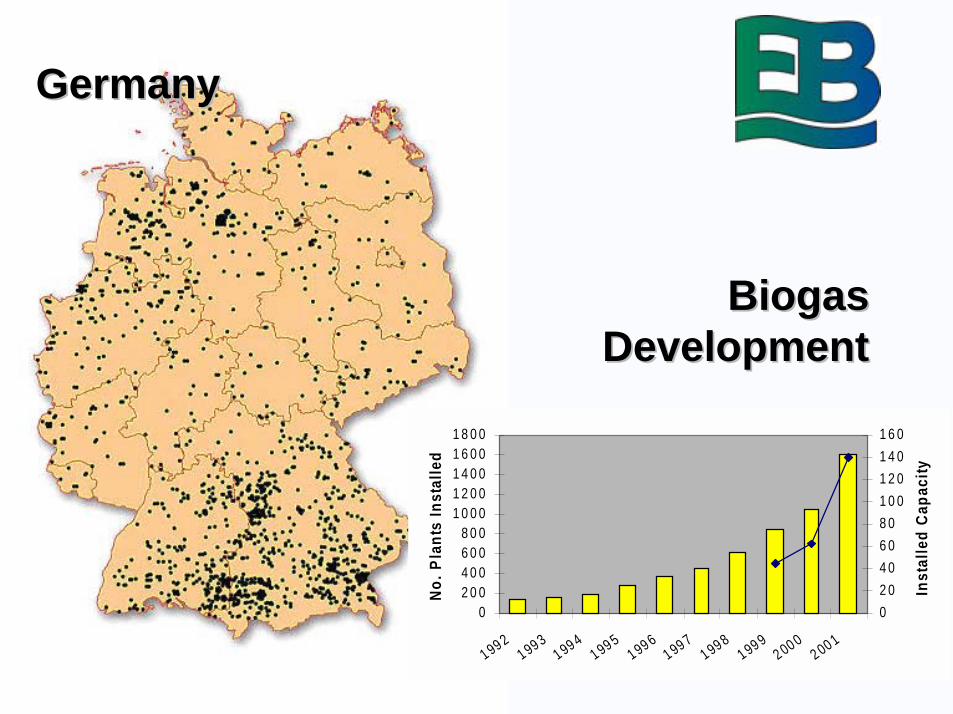
GermanyGermany
BiogasBiogasDevelopmentDevelopment
02 0 04 0 06 0 08 0 0
1 0 0 01 2 0 01 4 0 01 6 0 01 8 0 0
19921993
19941995
19961997
19981999
20002001
No
. P
lan
ts I
nst
alle
d
0
2 0
4 0
6 0
8 0
1 0 0
1 2 0
1 4 0
1 6 0
Inst
alle
d C
apac
ity
Biogas incentives in GermanyBiogas incentives in Germany
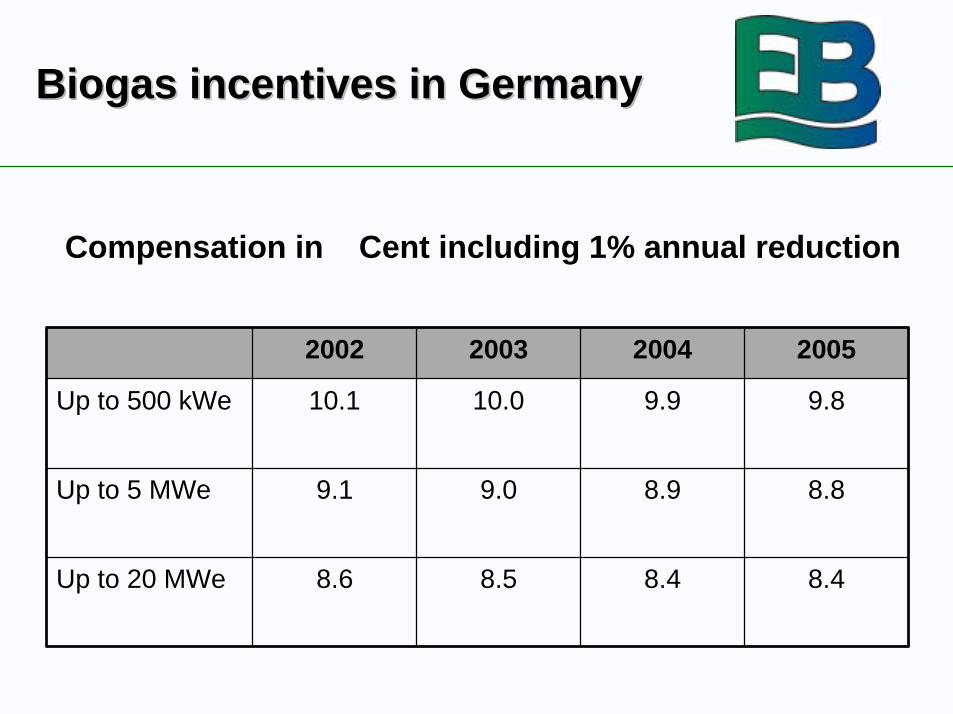
8.48.48.58.6Up to 20 MWe
8.88.99.09.1Up to 5 MWe
9.89.910.010.1Up to 500 kWe
2005200420032002
Compensation in Cent including 1% annual reduction
ConclusionsConclusions
!! Technology available and developingTechnology available and developing
!! Poor Poor implementionimplemention – lack of understanding – lack of understanding
!! Needs careful Needs careful incentivisationincentivisation
!! Barriers – public perception, scale, costBarriers – public perception, scale, cost
!! Developments – new forms of ownership, projectDevelopments – new forms of ownership, projectdevelopment and operationdevelopment and operation

The EndThe End