Embed Size (px)
Citation preview

Environmental Conditions and Disk Reliability in Free-cooled Datacenters
Ioannis Manousakis, Sriram Sankar, Gregg McKnight,
Thu D. Nguyen, and Ricardo Bianchini

Problem Statement
� Datacenters are costly and consume lots of energy
� Evolving cooling technologies in datacenters¡ Chiller-based (traditional) ¡ Water-side economized ¡ Air-side economized (aka free cooling)
� Unexplored tradeoff: environmentals, reliability, cost

Background
a) Chiller-based Cooling b) Free Cooling
� Cooling technologies
Ø Chillers and water-side: tightly controlled environmentals

Background
a) Chiller-based Cooling b) Free Cooling
� Cooling technologies
Ø Chillers and water-side: tightly controlled environmentals

Background
a) Chiller-based Cooling b) Free Cooling
� Cooling technologies
Ø Chillers and water-side: tightly controlled environmentals

Background
a) Chiller-based Cooling b) Free Cooling
� Cooling technologies
Ø Chillers and water-side: tightly controlled environmentals

Background
a) Chiller-based Cooling b) Free Cooling
� Cooling technologies
Ø Chillers and water-side: tightly controlled environmentals

Background
a) Chiller-based Cooling b) Free Cooling
� Cooling technologies
Ø Free cooling: may expose servers to harsh environmentals

Technology Characteristics
� Cooling technologies:¡ Chiller-based ¡ Water-side economized ¡ Free cooling
CAPEX
OPEX
RH
Temperature

Prior Work
� Hard disk failure studies in datacenters¡ Pinheiro[FAST’07], El-Sayed[SIGMETRICS’12], Sankar[ToS’13]
ØFocused on temperature and temperature variation¡ Chiller-based (traditional) datacenters
ØWhat’s new with our work¡ Three types of cooling ¡ Wider (more aggressive) environmental envelopes ¡ Primary focus on (relative) humidity

Contributions and Roadmap
1. Impact of environmentals on disk failure rates2. Root causes3. Cooling vs reliability vs cost tradeoffs4. Modeling of failure rates5. Design considerations

Methodology
� Collect large traces from hard disks ¡ Nine datacenters (2-4 years), 1M HDDs¡ All types of Microsoft datacenters
Tag Technology Population
CD1 Chiller 117K
CD2 Water-side 146K
CD3 Free-Cooled 24K
HD1 Chiller 16K
HD2 Water-side 100K
HH1 Free-Cooled 168K
HH2 Free-Cooled 213K
HH3 Free-Cooled 124K
HH4 Free-Cooled 161K
Total 1.07M
CD1
cold dry
HH1
hot humid

Methodology
� Collect extensive hard disk operation tracesØ Logged and archived by Microsoft Autopilot1. I/O communication faults (dead controller / TX-RX error)2. Behavioral SMART faults (read-write, sectors, seek, etc.)3. Age-related SMART faults (max hours, on-off cycles, etc.)
AutopilotServer Rack

Methodology
� Collect extensive hard disk operation tracesØ Logged and archived by Microsoft Autopilot1. I/O communication faults (dead controller / TX-RX error)2. Behavioral SMART faults (read-write, sectors, seek, etc.)3. Age-related SMART faults (max hours, on-off cycles, etc.)
Server RackFault Type
RMA
Autopilot
Results
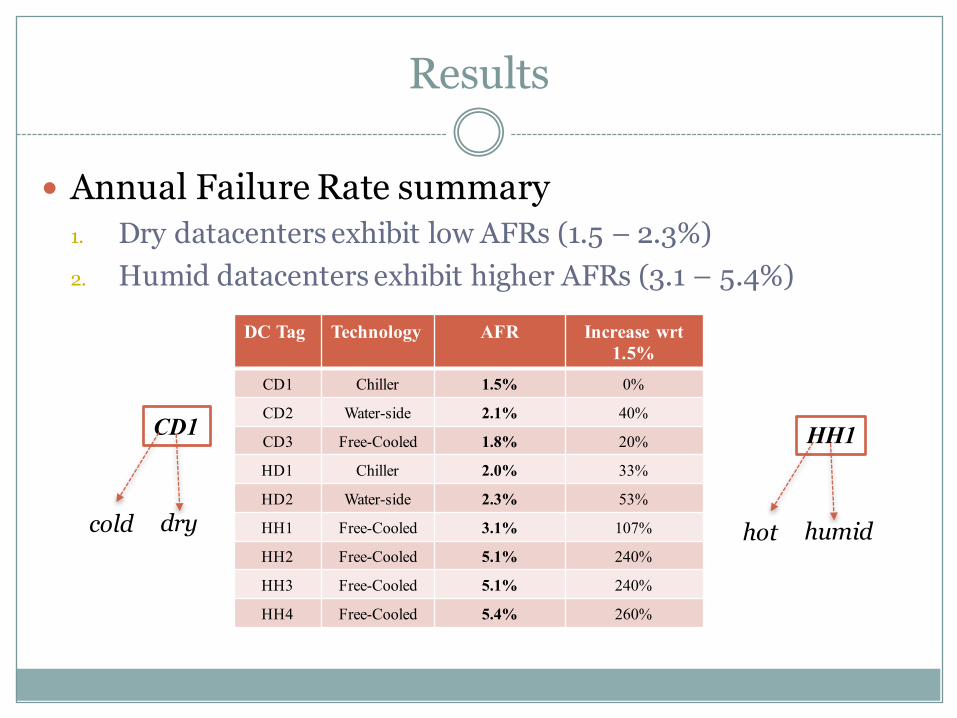
� Annual Failure Rate summary1. Dry datacenters exhibit low AFRs (1.5 – 2.3%)2. Humid datacenters exhibit higher AFRs (3.1 – 5.4%)
DC Tag Technology AFR Increase wrt1.5%
CD1 Chiller 1.5% 0%
CD2 Water-side 2.1% 40%
CD3 Free-Cooled 1.8% 20%
HD1 Chiller 2.0% 33%
HD2 Water-side 2.3% 53%
HH1 Free-Cooled 3.1% 107%
HH2 Free-Cooled 5.1% 240%
HH3 Free-Cooled 5.1% 240%
HH4 Free-Cooled 5.4% 260%
CD1
cold dry
HH1
hot humid

Annual Failure Rate (AFR) Results
1. Dry datacenters show low AFRs (1.5 – 2.3%)2. Humid datacenters show higher AFRs (3.1 – 5.4%)
DC Tag Technology AFR Increase wrt1.5%
CD1 Chiller 1.5% 0%
CD2 Water-side 2.1% 40%
CD3 Free-Cooled 1.8% 20%
HD1 Chiller 2.0% 33%
HD2 Water-side 2.3% 53%
HH1 Free-Cooled 3.1% 107%
HH2 Free-Cooled 5.1% 240%
HH3 Free-Cooled 5.1% 240%
HH4 Free-Cooled 5.4% 260%
HH1
hot humid
CD1
cold dry

Contributions and Roadmap
1. Impact of environmentals on disk failure rates2. Root causes3. Cooling vs reliability vs cost tradeoffs4. Modeling of failure rates5. Design considerations

Root Causes: Error Breakdown
� Dry DCs à Bad sector count (mechanical): ~50-60%� Humid DCs à Controller (connectivity): ~60%
0 20 40 60 80 100
RawRead Error RateSpin Up Time
Reallocated Sectors Count
Seek Error RateSpin Retry CountPower Cycle CountCurrent Pending Sector
SMART RCV DRIVE DATA
IOCTL ATA PASS THROUGH
Other
HD1
CD3
HH1
Percentage(%)

Root Causes: Temporal Clustering
� Significant temporal clustering on HH1� No temporal clustering on HD1

Root Causes: Temporal Clustering
� Significant temporal clustering on HH1� No temporal clustering on HD1
ØData suggests a lifetime failure process
Summer Winter Summer Winter

Root Causes: Correlating to Environmentals
� Failure rate regressions for HH11. Discover trends – variables that change together2. Split into 4 groups P1 – P4 (total population = 170K)
Popul. % Temp. RH CoVTemp.
CoVRH
P1 30.1 5.1*10-5 1.2*10-4 -7.9*10-3 -6.5*10-3
P2 25.6 -1.9*10-5 1.0*10-4 -9.0*10-3 -3.7*10-3
P3 23.3 1.4*10-3 2.1*10-4 -4.9*10-2 -4.4*10-2
P4 19.6 1.7*10-3 4.4*10-4 -1.3*10-1 -8.0*10-2
Popul. % Temp. RH CoVTemp.
CoVRH
P1 30.1 -6.4*10-3 5.1*10-2 -1.7*10 0 -9.0*10-0
P2 25.6 -1.6*10-2 5.3*10-2 -1.0*10-1 -1.6*10-1
P3 23.3 6.3*10-3 9.9*10-2 -8.4*10 0 3.5*10 0
P4 19.6 3.3*10-2 11.5*10-2 -3.9*10 0 -1.3*10 0
y = a*x + b y = a*e (b*x)
coefficient a coefficient b

Root Causes: Correlating to Environmentals
� Failure rate regressions for HH11. Discover trends – variables that change together2. Split into 4 groups P1 – P4 (total population = 170K)
Ø RH% seems to have the strongest impact
Popul. % Temp. RH CoVTemp.
CoVRH
P1 30.1 5.1*10-5 1.2*10-4 -7.9*10-3 -6.5*10-3
P2 25.6 -1.9*10-5 1.0*10-4 -9.0*10-3 -3.7*10-3
P3 23.3 1.4*10-3 2.1*10-4 -4.9*10-2 -4.4*10-2
P4 19.6 1.7*10-3 4.4*10-4 -1.3*10-1 -8.0*10-2
Popul. % Temp. RH CoVTemp.
CoVRH
P1 30.1 -6.4*10-3 5.1*10-2 -1.7*10 0 -9.0*10-0
P2 25.6 -1.6*10-2 5.3*10-2 -1.0*10-1 -1.6*10-1
P3 23.3 6.3*10-3 9.9*10-2 -8.4*10 0 3.5*10 0
P4 19.6 3.3*10-2 11.5*10-2 -3.9*10 0 -1.3*10 0
y = a*x + b y = a*e (b*x)
coefficient a coefficient b

Root Causes: Correlating to Environmentals
� Failure rate correlations for HH11. Discover trends – variables that change together2. Correlation matrix
a) Pearson’s correlation b) Spearman’s correlation

Root Causes: Correlating to Environmentals
� Failure rate correlations for HH11. Discover trends – variables that change together2. Correlation matrix
a) Pearson’s correlation b) Spearman’s correlation

Root Causes: Correlating to Environmentals
� Failure rate correlations for HH11. Discover trends – variables that change together2. Correlation matrix
a) Pearson’s correlation b) Spearman’s correlation

Contributions and Roadmap
1. Impact of environmentals on disk failure rates2. Root causes3. Cooling vs reliability vs cost tradeoffs4. Modeling of failure rates5. Design considerations

Cooling-Related Cost Tradeoffs
� Cooling technologies vs costs¡ Free cooling results in higher HDD costs¡ Operator will pay the extra HDD costs (or warranties)
Normalized
Cost
Chiller
W-side
Chiller
W-side
Chiller
W-side
0
0.2
0.4
0.6
0.8
1
0
0.2
0.4
0.6
0.8
1
0
0.2
0.4
0.6
0.8
1
10 Years 15 Years 20 Years
Disk CostOpex CoolCapex Cool
FreeCool
FreeCool
FreeCool

Cooling-Related Cost Tradeoffs
� Cooling technologies vs costs¡ Free cooling results in higher HDD costs¡ Operator will pay the extra HDD costs (or warranties)
AFR = 1.5%
Normalized
Cost
Chiller
W-side
Chiller
W-side
Chiller
W-side
0
0.2
0.4
0.6
0.8
1
0
0.2
0.4
0.6
0.8
1
0
0.2
0.4
0.6
0.8
1
10 Years 15 Years 20 Years
Disk CostOpex CoolCapex Cool
FreeCool
FreeCool
FreeCool
AFR = 1.75%
AFR = 5.4%

Summary of Observations
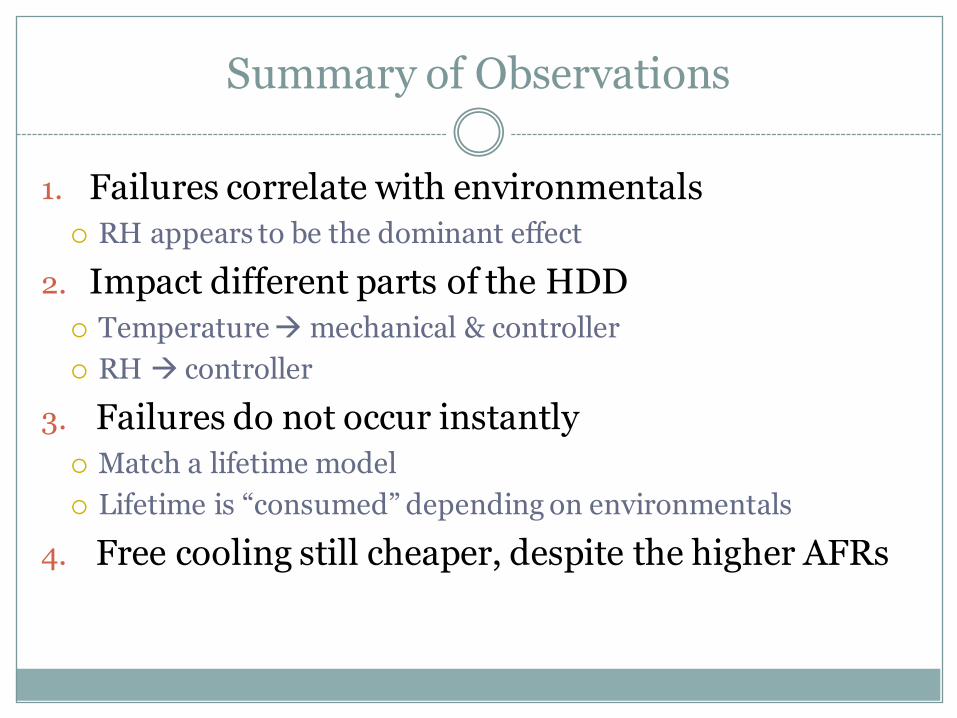
1. Failures correlate with environmentals¡ RH appears to be the dominant effect
2. Impact different parts of the HDD¡ Temperature à mechanical & controller¡ RH à controller
Summary of Observations
1. Failures correlate with environmentals¡ RH appears to be the dominant effect
2. Impact different parts of the HDD¡ Temperature à mechanical & controller¡ RH à controller
3. Failures do not occur instantly ¡ Match a lifetime model¡ Lifetime is “consumed” depending on environmentals
4. Free cooling still cheaper, despite the higher AFRs
Contributions and Roadmap
1. Impact of environmentals on disk failure rates2. Root causes3. Cooling vs reliability vs cost tradeoffs4. Modeling of failure rates5. Design considerations

Model Construction
� Estimate AFRs¡ Various server and datacenter designs/conditions/locations

Model Construction
� Estimate AFRs¡ Various server and datacenter designs/conditions/locations
1. Modeling HDD mechanical degradation
2. Modeling corrosion¡ Extension of Arrhenius equation¡ Accounts for combined temperature and RH effects
CR(T,RH) = const ·e(− Eak·T ) ·e(b·RH)+ (
c·RHk·T )
AFT = eEak ·(
1Tb− 1Te)

Model Construction
� Lifetime Acceleration Factor (AF)¡ Compared to a baseline (AFR=1.5% @25C and 50% RH)¡ AF1 : Temperature - AF2: RH and Temperature
� Validation¡ Collect hourly environmentals in other datacenters¡ Use the model constructed in P1 to predict failure rates¡ Validated with P2, P3, P4, and CD3, HD1 (within 5%)
Contributions and Roadmap
1. Impact of environmentals on disk failure rates2. Root causes3. Cooling vs reliability vs cost tradeoffs4. Modeling of failure rates5. Design considerations

Design Considerations
� Disk placement affects HDD failure rates

Design Considerations
� Disk placement affects HDD failure rates
Airf
low
Dire
ctio
n

Design Considerations
� Disk placement affects HDD failure rates
Airf
low
Dire
ctio
n
Disk at the front• Low Temp• High RH%

Design Considerations
� Disk placement affects HDD failure rates
Airf
low
Dire
ctio
n
Disk at the back• High Temp• Low RH%

Design Considerations
� Disk placement affects HDD failure rates
Airf
low
Dire
ctio
n
Disk at the side• Var. Temp• Var. RH%

Conclusions
� Explored HDD reliability vs environmentals¡ 9 datacenters with 3 cooling technologies, 1M disks¡ AFRs impacted by enviromentals, especially high RH¡ Tradeoff favors free cooling: costs down, despite higher AFRs
� Developed an accurate model from real failure data ¡ Combines corrosion and temperature
� Learned lessons¡ Server layout has a significant impact on HDD AFRs¡ More lessons in the paper

Thank you
Questions?