Embed Size (px)
Citation preview

ENVIRONMENTAL COST ACCOUNTINGFOR CHEMICAL & OIL COMPANIES :
A BENCHMARKING STUDY
A Project of Institute for Corporate Environmental Management at the University of Houstonin Partnership with the Business Council for Sustainable Development - Gulf of Mexico
Authors:David Shields, University of Houston, College of Business
Administration(CBA) and American Graduate School of International Management (Thunderbird)
Beth Beloff, Director, CBA Institute for Corporate Environmental Management(ICEM), University Of Houston
Miriam Heller, University of Houston, Cullen College of Engineering Dept. of Industrial Engineering

1
Table of Contents
Topic Page
List of Figures and Tables 2
Purpose of Report 3
Acknowledgments 4
Executive Summary 5
Summary of Key Findings 10
Project Background 12
Benchmarking Process 14
Environmental Accounting System Development 17Framework
Attitude Toward Environmental Stewardship 18
Environmental Cost Accounting System Development 22
Environmental Costs 29
Use of Environmental Cost Accounting in Managerial 33Decision Making
Appendix A: Partner Company Profiles and 38Case study Summaries
Appendix B: Questionnaire 44
Appendix C: Definitions of Factors 54

2
List of Figures and Tables
Name Page
Table A: Ranking of Factors and Issues 16
Table B: Cost Sheet for Product A* 28
Table C: Comparative Environmental Costs 31
Figure 1: Environmental Cost Accounting Cooperative BenchmarkingSM Process 14
Figure 2: Conceptual Level Framework for Environmental Cost Accounting 17

3
Purpose of This Report
This report summarizes an Environmental Cost Accounting Benchmarking Study of fivemajor U.S. and Mexican companies currently involved in developing environmental accountingsystems. The purpose of the benchmarking study, which was conducted from June 1995 throughJune 1996, was to compare environmental accounting approaches in oil and chemical companieswhose activities have significant environmental impact.
This project was jointly facilitated by the Institute for Corporate EnvironmentalManagement of the University of Houston (“ICEM”), and by Pilko & Associates (“Pilko”).
We would particularly like to thank the five participating companies for their exhaustivecontributions to the study. Due to confidentiality agreements, two of the five companies arereferred to using fictitious names, denoted by an asterisk (*) below:
• Celanese Mexicana• Ciba-Geigy• Grupo Primex• International Refineries*• Specialty Refiners*
The purpose of the study was not to identify a single best system for environmental costaccounting, since requirements of such systems vary with industry, location, corporate culture,and many other aspects of a company. Rather, the purpose was to allow the Partners to discussthe form and functions of the environmental cost accounting systems they are developing orusing, as well as to discuss uses for the cost information yielded by such systems. This reportsummarizes the information shared in the Benchmarking.
For more information about basic Environmental Accounting concepts or EPA’sEnvironmental Accounting Project, contact the Pollution Prevention Information Clearinghouseat 202 260-1023 to have an information packet sent to you, or visit the EnvironmentalAccounting Project website at http:\\www.epa.gov.opptintr/acctg/
4
Acknowledgments
We gratefully acknowledge the agencies and organizations who provided support for thisresearch: Business Council for Sustainable Development-Gulf of Mexico (BCSD-GM) for whichfunding was provided through the U. S. Environmental Protection Agency’s (EPA)Environmental Accounting Project in an ORD social science research grant, National ScienceFoundation (Grant # III-9319795), Texas Hazardous Waste Research Center (Inter-AgencyContract # LUB-IAC-7UHH), Gulf Coast Hazardous Substance Research Center - LamarUniversity (Contract # LUB-IAC-8UHH), Management Institute for Environment & Business(MEB) and the University of Houston. Additionally, the participating companies covered out-of-pocket expenses for the work effort.
We wish to thank Holly Elwood of the EPA Environmental Accounting Project, Jim Coleand the ORD staff at EPA for their help in making this project possible and for spending mucheditorial time.
This document has been refined considerably with the kind assistance of the followingreviewers:(1) Earl Beaver, Ph.D., Director of Waste Management, Monsanto Company, St. Louis,Missouri.(2) Stephan Barg, Director, International Institute for Sustainable Development, Canada.(3) Daryl Ditz, Ph.D., Associate, Technology and Environment Program, World ResourcesInstitute, Washington, DC.(4) Carl Henn, President, Senior Vice President, Concord Energy, Inc., New Brunswick, NewJersey.(5) Naomi Soderstrom, Ph.D., Associate Professor of Accounting, University of Colorado,Denver.(6) Chris Stinson, Ph.D., Assistant Professor of Accounting, University of Texas, Austin.
Particular thanks go to the participants from industry, who provided the grist for thisstudy, and for the assistance of Trish Gillespie, Carmel Adelberg, Rodolfo Lopez, Kavan Mehtaand Vaishali Patil at the Institute for Corporate Environmental Management, who labored manylong hours on this project.
5
Executive Summary
Over the past twenty years, responsible environmental management has become animportant focus of companies throughout the world. During this period, many environmentalregulations have been enacted, requiring management to consider the environmental implicationsof virtually every decision facing their companies. Governmental mandates for environmentallyresponsible behavior have been enacted in virtually all countries.
Recently, there has been a shift in environmental regulation from the “command andcontrol” approach to environmental regulation to market driven forms, in which pollutionprevention alternatives are replacing mandated end-of-pipe technologies. This movement isdriven by the realization that it can be more efficient (and cost effective) to avoid pollution thanit is to clean it up.
Determining the appropriate pollution prevention approach often leads to additionaldecisions that must be made by management. These decisions include selecting among proposedcapital expenditures, and making better pricing and product mix decisions by uncovering the realcosts (including environmental costs) of various products and processes. As markets foremissions' allowances develop, companies will want to determine whether it is more cost-beneficial to buy or sell these allowances, given the costs of avoiding the covered emissions.Finally, estimates of subsequent cleanup liability can change the relative attractiveness ofacquiring or disposing of a facility.
These decisions require information about costs and benefits that have often notpreviously been collected. Environmental cost accounting information is useful in improving anumber of business decisions. This document describes the process and results of abenchmarking effort conducted to define current practices in environmental cost accounting andfuture needs.
Project Background
In 1994, as part of on-going environmental accounting research, a benchmarking projectwas initiated at the Institute for Corporate Environmental Management (ICEM), University ofHouston, to examine current practices in environmental accounting in industry. The teamassembled included Miriam Heller from Industrial Engineering, David Shields fromAccountancy and Taxation in the College of Business, and Beth Beloff from ICEM. The teamchose the methodology described as Cooperative Benchmarking™ to develop this information.This methodology was created by Pilko & Associates to bring participating companies (Partners)together in small groups to discuss environmental issues/ problem areas and generate new ideasfor improving environmental management practices.
At the same time, member companies of the Business Council for SustainableDevelopment - Gulf of Mexico (BCSD-GM) were developing projects to demonstrate thebusiness opportunities arising from incorporating sustainable development concepts into businessdecisions. The development of a tool to assist in identifying economic opportunities in reductionof environmental impacts was of great appeal to the BCSD-GM. As a result, member companiesfrom both the U.S. and Mexico were encouraged to participate in the benchmarking effort, andBCSD-GM became a valuable partner in the project. Two non-BCSD members also joined toform a group of five companies from the chemical and refining industries that participated in the

6
study. The companies were Celanese Mexicana, Ciba-Geigy, Grupo Primex, “InternationalRefineries,” and “Specialty Refiners.”
The environmental cost accounting Cooperative Benchmarking™ process can becharacterized by the following steps:• Determination of Factors and Issues of most interest to the participating companies.• Conversion of Factors and Issues into an in-depth questionnaire.• Formation of cross-functional teams within companies to complete the questionnaires and
prepare case studies highlighting specific applications of environmental accounting tocorporate decisions.
• Implementation of two in-depth multi-day benchmarking sessions in which companiespresented information developed for the questionnaire and case studies to the group.
• Facilitation of group discussions around issues presented and lessons learned.• Distribution to participating of confidential reports summarizing results and review.• Generation of the sanitized version of report to sponsoring organizations.
What are Environmental Costs?
Due to the importance of accurate cost information in making the decisions sketched outabove, the term “environmental cost” has been introduced into the vocabulary of environmentalmanagers. Environmental cost has been defined in various ways. During the benchmarkingsessions, the term was often used to refer to costs incurred in order to comply with regulatorystandards, costs which have been incurred in order to reduce or eliminate releases of hazardoussubstances, all other costs associated with corporate practices aimed at reducing environmentalimpacts, and costs associated with not addressing these issues. (More uses of the term can befound in the Environmental Protection Agency’s Introduction to Environmental Accounting As ABusiness Management Tool: Key Concepts and Terms1.) Six observations emerge from thedefinition provided here: 1. Environmental costs are really a subset of the costs of operating a business. Formerly,when substances were released into the air, water or land, the resulting pollution would beconsidered a social cost, an externality. Regulation has resulted in internalization of some ofthese environmental externalities, through, for example, requirement of additional investment inequipment or training, or for fines and fees resulting from noncompliance. 2. As environmental externalities become internalized, new costs emerge. These newcosts must be captured by the cost accounting system, so that product costs remain accurateenough to facilitate sound decision making. For example, how should the cost of improvedwaste treatment (wastewater plants, incinerators, etc.) be reflected in the costs of the productsresponsible for waste generation?
3. The magnitudes of environmental costs are greatly underestimated, and their impact onproduct or process costs is often obscured through inaccurate overhead accounting.Environmental costs are often hidden in overhead and underestimated. For instance, in another
1 Environmental Protection Agency 742-R-95-001, June 1995, 39 pages.

7
effort, the Amoco Yorktown Refinery case study documented in “Green Ledgers: Case Studiesin Corporate Environmental Accounting,” a large sample of employees estimated environmentalcosts to be 3% of non-crude operating expenses. After further investigation, those costs werefound to be at least 22% of non-crude operating costs2.
4. Environmental cost information, like all cost information, is useful only when there aredecisions that are facilitated by knowing that information. Among the decisions that can befacilitated by environmental cost information is product costing. Product costing accuracy is notimproved by defining costs already accurately assigned to products by the cost accountingsystem, regardless of whether they are called environmental. That is, the label “environmental”does not improve cost accuracy in this case but it may enable cost reduction of the product.
5. Many superior environmental projects are often not identified as environmentalbecause they convey operating benefits as well (i.e., pollution prevention projects which increaseyield). Sometimes, the best environmental projects are not identified as environmental at all.Conversely, end-of-pipe treatments are classified as environmental and are often given highpriority by management, but may not represent the best solution to the problem. Thus, proactiveenvironmental management often leads to higher “nonenvironmental” costs and lowerenvironmental costs.
6. Despite the existence of fledgling environmental cost accounting systems, participatingcompanies relied on techniques such as Life Cycle Assessment and materials balancing, whichdo not require financial data. They claim that, in many cases, environmental cost information isless useful than non-financial, real-time measures of performance. Participating companies haddifficulty providing environmental cost data relating to various types of environmental activities.
Attitude Toward Environmental Stewardship
As is true with the development of any management initiative, the development ofenvironmental cost accounting systems is dependent on the corporate culture, or attitudes, inplace. Given favorable attitudes among top management, an internal champion, adequatefunding, and follow-through that includes integration of the tool into everyday decision-making,the development of such a system is likely to succeed. Without such support, the system will nothave an impact.
The degree of success experienced by the participant companies in establishing and usingenvironmental accounting systems reflects this. Some participating companies appear to valueenvironmental considerations as one of the primary keys to company success. Other companiessupported voluntary environmental initiatives less enthusiastically. However, their agreement toparticipate in this study indicates a strong interest in responsible environmental management.
In the companies with cultures supporting high integration of environmental functionsinto the business processes, it was considered less important to differentiate betweenenvironmental and nonenvironmental costs, and emphasis was placed on allocating all costs to
2 Ditz, D., Ranganathan, J., and Banks, D.(ed.). (1995). Green Ledgers: Case Studies in Corporate EnvironmentalAccounting, World Resources Institute, Washington, DC.
8
product and processes. In those companies less well integrated, there were more reasons foundto identify environmental costs separately from other costs.
Environmental Cost Accounting Systems
A supportive corporate culture forms the foundation for developing a successfulenvironmental cost accounting system. Participating companies point to varying degrees ofsuccess:
International Refineries is addressing environmental cost accounting by identifyingenvironmental costs through a coding system. Similarly, Ciba-Geigy describes the developmentof an environmental cost accounting system based on detailed overhead accounting; one whichalso incorporates standard cost variance analysis. This system will be useful in allocatingenvironmental costs to the products and processes that cause them, and isolating nonstandardcost performance where it occurs.
Both International Refineries and Grupo Primex are approaching environmental costs byretrofitting to their existing accounting systems. International Refineries and Ciba-Geigygenerate environmental cost data as part of the General Ledger systems. Grupo Primex andSpecialty Refiners utilize free standing systems that access, but are not directly integrated with,other systems.
The categories defined for accumulating environmental costs may directly affect howenvironmental cost information is and can be used within an organization. Each company’s“cuts” at the problem was a little different. For example: • International Refineries’ system tracks and defines all HSE related expenditure by
category, media and line of business, yet has difficulty tracking environmental costs bylocation or sub-unit.
• International Refineries’ focus on expense elements is consistent with their primary useof the system as an aid to capital budgeting for environmental projects
• International Refineries, Grupo Primex and Specialty Refiners have a strong focus on theenvironmental cost of a product. Accumulated costs in high level categories generallylimited the degree to which such costs could be used for “what if” analyses.
• Ciba-Geigy accounts for environmental costs by product or as part of capital projects.These distributed environmental costs are difficult to accumulate by other categories.
No company was developing activity-based environmental accounting systems. Thus,there was no direct attempt to identify the relationship between managerial decisions and thecosts of those decisions. At best, the focus was on improving how costs associated withenvironmental processes are allocated to product. In many cases, this entailed installing bettermeasurement capability to improve cost allocation. For example, Ciba-Geigy has implemented atransfer pricing mechanism to provide appropriate internal economic signals.
No environmental cost system tracked intangible or less tangible costs. Specialty Refinersreported that historical liability was considered in their system but no details were given. Ciba-Geigy and International Refineries track remediation and liability costs using another system.

9
Some companies found value in defining synthetic performance measures over aggregateinformation: ecological management ratios (Grupo Primex) and cost per pound of waste(International Refineries). Ciba-Geigy believes that environmental costs cannot adequatelyindicate performance and that other methods, such as materials balancing and Life-CycleAssessment is necessary complementary tools for environmental cost management.
Use of Environmental Cost Accounting in Managerial Decision Making.
A number of difficulties may hamper efforts to incorporate environmental costaccounting information into business decision making. For example, end-of-pipe projects aremore easily identified as environmental than are pollution prevention projects. By prioritizingenvironmental projects which are required for compliance (which is done by all of theparticipating companies), there may be a bias toward acceptance of end-of-pipe projects at theexpense of superior, pollution prevention projects. Indeed, the structure of environmental costaccounting information will have a profound effect on the decisions. Conversely, the corporateculture will directly affect decisions regarding the kind of environmental cost accountinginformation to be gathered.
All companies differentiated between environmental capital expenditures andenvironmental operating and maintenance costs. They reported systematic methods forevaluating capital expenditures for budgetary approval. Environmental operating andmaintenance costs are tracked in most cases. However, these costs are not singled out for specialmanagement. They are used in the same way as nonenvironmental costs, to identify problemareas in cost performance (identification of significant deviations from budget), or todemonstrate the cost impact of process improvements.
A major issue identified by participants relates to circumstances in which environmentalcost accounting information is more useful to managers than real-time nonfinancial information,such as waste stream metering and yield rates. In general, the participants felt that nonfinancialmeasures were superior to financial information for day-to-day management, but that financialinformation more effectively justified the need for intervention to top management.
10
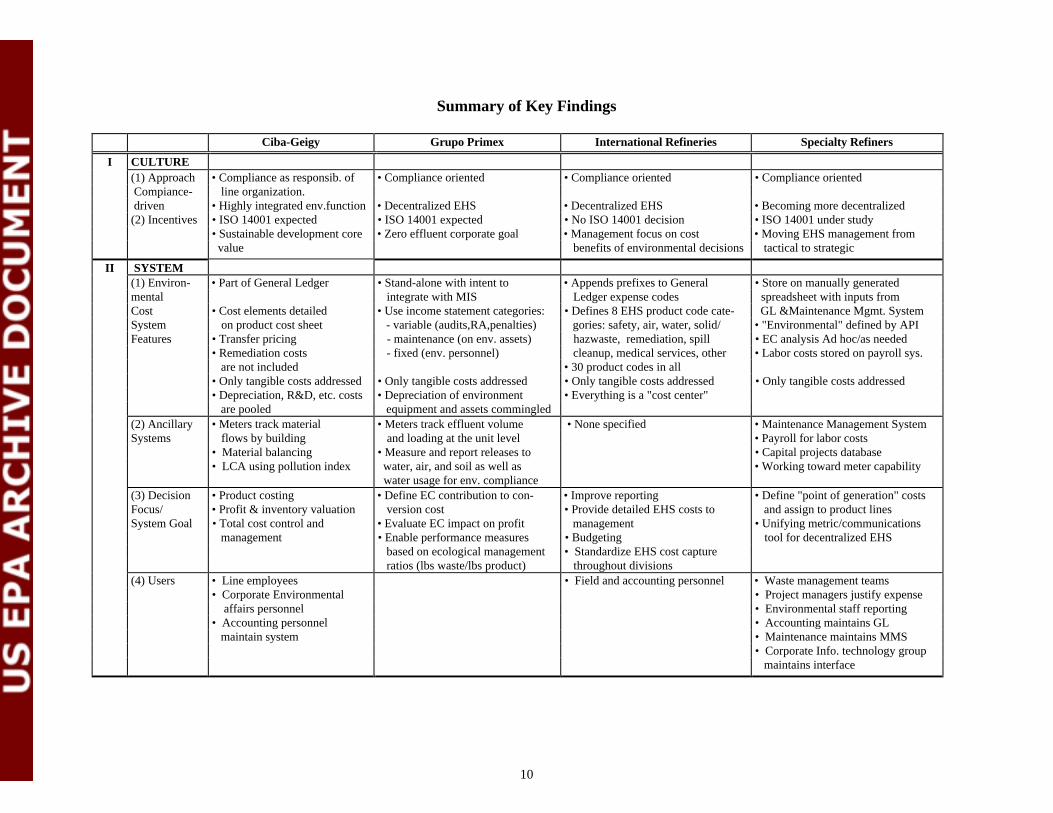
Summary of Key Findings
Ciba-Geigy Grupo Primex International Refineries Specialty Refiners
I CULTURE(1) Approach • Compliance as responsib. of • Compliance oriented • Compliance oriented • Compliance oriented Compiance- line organization. driven • Highly integrated env.function • Decentralized EHS • Decentralized EHS • Becoming more decentralized(2) Incentives • ISO 14001 expected • ISO 14001 expected • No ISO 14001 decision • ISO 14001 under study
• Sustainable development core • Zero effluent corporate goal • Management focus on cost • Moving EHS management from value benefits of environmental decisions tactical to strategic
II SYSTEM(1) Environ- • Part of General Ledger • Stand-alone with intent to • Appends prefixes to General • Store on manually generatedmental integrate with MIS Ledger expense codes spreadsheet with inputs fromCost • Cost elements detailed • Use income statement categories: • Defines 8 EHS product code cate- GL &Maintenance Mgmt. SystemSystem on product cost sheet - variable (audits,RA,penalties) gories: safety, air, water, solid/ • "Environmental" defined by APIFeatures • Transfer pricing - maintenance (on env. assets) hazwaste, remediation, spill • EC analysis Ad hoc/as needed
• Remediation costs - fixed (env. personnel) cleanup, medical services, other • Labor costs stored on payroll sys. are not included • 30 product codes in all• Only tangible costs addressed • Only tangible costs addressed • Only tangible costs addressed • Only tangible costs addressed• Depreciation, R&D, etc. costs • Depreciation of environment • Everything is a "cost center" are pooled equipment and assets commingled
(2) Ancillary • Meters track material • Meters track effluent volume • None specified • Maintenance Management SystemSystems flows by building and loading at the unit level • Payroll for labor costs
• Material balancing • Measure and report releases to • Capital projects database• LCA using pollution index water, air, and soil as well as • Working toward meter capability
water usage for env. compliance(3) Decision • Product costing • Define EC contribution to con- • Improve reporting • Define "point of generation" costsFocus/ • Profit & inventory valuation version cost • Provide detailed EHS costs to and assign to product linesSystem Goal • Total cost control and • Evaluate EC impact on profit management • Unifying metric/communications
management • Enable performance measures • Budgeting tool for decentralized EHS based on ecological management • Standardize EHS cost capture ratios (lbs waste/lbs product) throughout divisions
(4) Users • Line employees • Field and accounting personnel • Waste management teams• Corporate Environmental • Project managers justify expense affairs personnel • Environmental staff reporting• Accounting personnel • Accounting maintains GL maintain system • Maintenance maintains MMS
• Corporate Info. technology group maintains interface

11
Summary of Key Findings
Ciba-Geigy Grupo Primex International Refineries Specialty Refiners
III DECISIONS(a) Operating • Env. costs are tracked • Env. costs are tracked but not • Env. costs are tracked to • Product mix decisions incorp.
separately different from other costs. improve budgeting, find cost environmental cost info, where
• Env. aspects of ongoing saving opp.(volume disc.) push price flexibility, pricing incorp.
operation allocated to cost resp. to business unit and environmental costs.
product better understand costs of • Intangible, qualitative issues
alternate remediation. considered in envi. decisions.
(b) Capital • Capital projects must meet • Capital projects must meet • Capital projects must meet • Capital projects must meet
expenditure normal hurdle rates/unless normal hurdle rates/unless normal hurdle rates/unless normal hurdle rates/unless
mandated; if required for mandated; if required for mandated; if required for mandated; if required for
compliance approved compliance approved compliance approved compliance approved
IV OVERALL SYSTEM
(1) Strengths • Product costing, profit, and • Well positioned to integrate • Simplicity and basis in current • Based on reliable General Ledger
inventories are more accurate with real-time data system makes use likely
• Clearly defines responsibility • Use MIS to relate environmental • Low incremental cost
and accountability costs to financial information • Extensibility
• Information is provided at • Only as accurate as current cost
appropriate, effective levels codes
in the organization • High availability of data
(2) Weak- • Environmental cost elements • Personnel resistance indicates • Maintenance security • Politically difficult to set up
-nesses may not be labeled as such lack of clearly defined respon- • No distinction between recurring new cost codes
• System lacks flexibility to sibility and non-recurring costs • High level systems directed at
accumulate costs for some • Cannot trace cost to specific external reporting
meaningful environmental unit • Limited user training
decisions, e.g., technologies • No transfer pricing • Manpower intensive
• Inflexibility hampers EC and • Only captures labor costs associ- • Lack of low-level decision costing
and LCA integration ated with "environmental unit" (spill, permitting)
12
Project Background
In the 1990’s, the traditional command-and-control approach has given way to a moremarket-driven regulatory strategy. Today, businesses are encouraged to select technologies andmethods to best meet environmental performance standards, taking cost-benefit relationships intoaccount. Yet, the market-driven approach can only be successful if companies understand theircost structures, including environmental costs, and the economic benefits that arise fromimproved environmental performance. For assistance, environmental managers are seekingdecision support tools to characterize the cost and benefit relationship of environmentalactivities. They need tools to bridge the communication gaps between environmental, financialand operations managers around these issues. Reliable environmental cost information andaccounting models for allocating environmental costs to specific activities, processes, andproducts are essential for the market-driven approach, as well as for the broader integration ofenvironment into the business, to succeed.
Over the last three years, the Institute for Corporate Environmental Management (ICEM)at the University of Houston, in response to requests from business, has been coordinating thedevelopment of an environmental accounting framework. This research has been directed by aninterdisciplinary environmental accounting team, through grants from the University of Houston,National Science Foundation, Gulf Coast Hazardous Substance Research Center, USEnvironmental Protection Agency, and Management Institute for Environment and Business.
A major step toward building a foundation for a corporate system to account forenvironmental costs are to understand current practices of leading companies in similarindustries. The ICEM team chose the methodology described as Cooperative BenchmarkingSM
to develop this information. This methodology was created by Pilko & Associates to bringparticipating companies (Partners) together in small groups to discuss environmental issues /problem areas and generate new ideas for improving environmental management. CooperativeBenchmarkingSM is an attempt to produce results far exceeding those realized from traditionalbenchmarking methods. The benchmarking sessions are rigorous, with each session lasting twoto three days.
In 1994, ICEM and Pilko & Associates initiated the Environmental AccountingBenchmarking Project to develop an understanding of environmental cost accounting through abenchmarking study of corporate practices. The project had the following objectives:
• To collect information on what companies in the chemical and refining industries aredoing in accounting for environmental costs and how environmental accounting canprovide decision makers with the information they need.
• To develop case studies from each participating company on how they are grapplingwith the issues of environmental management and cost accounting for environmentalactivities.
• To establish baseline environmental cost information as identified by all participatingcompanies.
• To develop a framework for understanding the nature and uses of environmentalaccounting.

13
At the same time, member companies of the Business Council for SustainableDevelopment - Gulf of Mexico (BCSD-GM) were developing projects to demonstrate thebusiness opportunities inherent in incorporating sustainable development approaches in businessdecisions. BCSD-GM recognizes the value of developing a tool to assist in identifying economicopportunities in reduction of environmental impacts. The BCSD-GM encouraged its U.S. andMexican companies to participate in the environmental cost accounting benchmarking project. Inaddition, several companies outside of the BCSD membership were approached.
The Environmental Accounting Benchmarking Project was formed with the assistance ofgrants from various sources previously mentioned and a commitment from the companies tocover direct project expenses. The companies agreed to the participation of two corporateindividuals representing three skill sets: environmental, operations and finance. David Shieldsfrom the University of Houston (ICEM) and Eric Dietert from Pilko agreed to co-facilitate thebenchmarking sessions. Research assistants from the MBA, Industrial Engineering, andChemical Engineering programs at the University of Houston were brought into the project.Confidentiality agreements were signed by the benchmarking team.
Company profiles and examples of each company’s usage of environmental accountingcan be found in Appendix A.

14
The Benchmarking Process
The benchmarking process has been organized into four parts: Defining ProjectObjectives from Factors and Issues, Data Collection through Questionnaires, BenchmarkingSessions, and Synthesis. The following diagram captures the flow of activities characterizing theentire effort3:
Environmental Cost AccountingCooperative Benchmarking SM Process
Participating
Companies Agree
to Benchmarking
PreliminaryFactors andIssues areDrafted
Questionnaire
Developed
Companies
Complete
Questionnaires
and Prepare
Case Studies
Benchmarking
Sessions
Scheduled
CompletedQuestionnaires
and Case StudiesDistributed
BenchmarkingSessions:
May 16,17June 26-28
FindingsSynthesized and
Draft ReportPrepared
Participating
Companies
CommentFinal Report
Figure 1: Environmental Cost Accounting Cooperative BenchmarkingSM Process
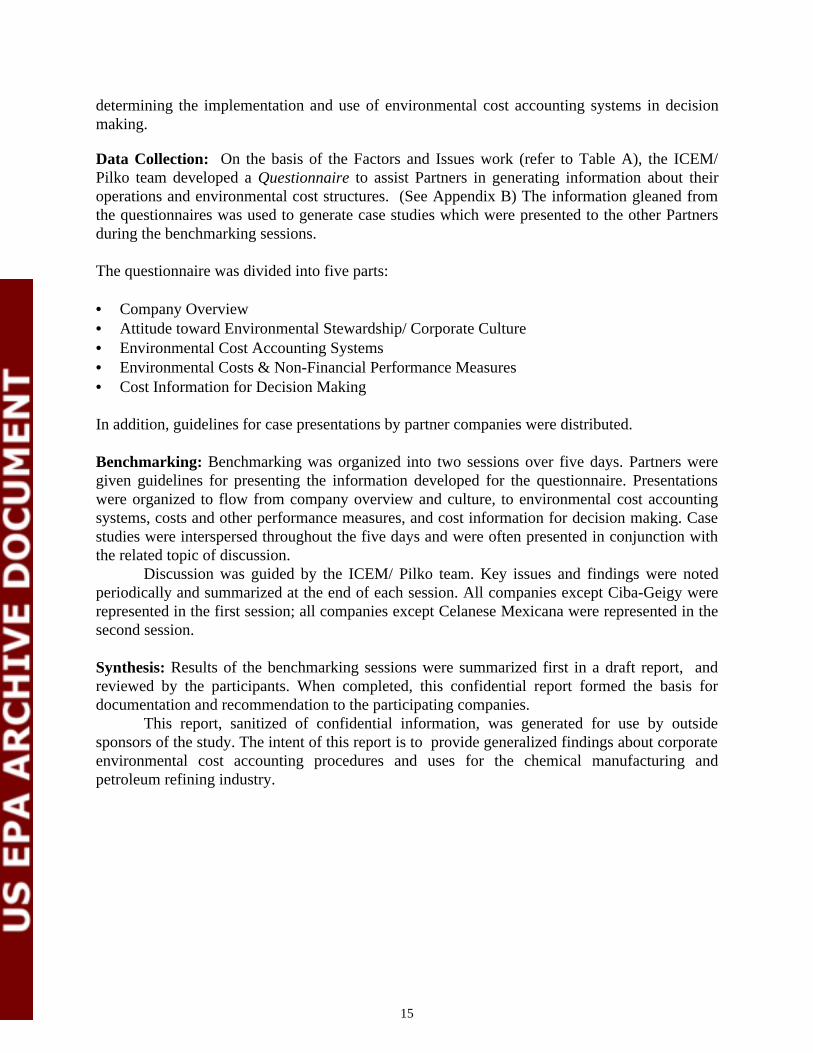
Defining Project Objectives through Factors and Issues: In an effort to organize the projectaround environmental accounting factors and issues of greatest interest to the Partners, a list ofeighteen factors was prepared. Definitions were discussed and Partners ranked the factors bygreatest to least interest. This formed the basis for the organization of the Data Collection phaseof the project. (Table A, Ranking of Factors and Issues)
Partners were most interested in 1) understanding how to monitor for environmentalcosts; 2) developing systems for cost accounting; 3) automating environmental accountinginformation systems; 4) and learning about methods to allocate environmental costs to productand process. They chose to emphasize the decision support aspects of the accountingdevelopments: managerial control, budgeting, etc. Of least interest to participants were theimpacts of North American Free Trade Agreement (NAFTA) on costs, and life cycle costing.
The underlying structure for the project (as depicted in Figure 2) became clearer duringthe discussions regarding factors and issues. It became apparent that corporate attitudes towardresponsible environmental performance (corporate culture) were the primary factor in
3 Cooperative BenchmarkingSM is a service mark of Pilko & Associates, Inc.
15
determining the implementation and use of environmental cost accounting systems in decisionmaking.
Data Collection: On the basis of the Factors and Issues work (refer to Table A), the ICEM/Pilko team developed a Questionnaire to assist Partners in generating information about theiroperations and environmental cost structures. (See Appendix B) The information gleaned fromthe questionnaires was used to generate case studies which were presented to the other Partnersduring the benchmarking sessions.
The questionnaire was divided into five parts:
• Company Overview• Attitude toward Environmental Stewardship/ Corporate Culture• Environmental Cost Accounting Systems• Environmental Costs & Non-Financial Performance Measures• Cost Information for Decision Making
In addition, guidelines for case presentations by partner companies were distributed.
Benchmarking: Benchmarking was organized into two sessions over five days. Partners weregiven guidelines for presenting the information developed for the questionnaire. Presentationswere organized to flow from company overview and culture, to environmental cost accountingsystems, costs and other performance measures, and cost information for decision making. Casestudies were interspersed throughout the five days and were often presented in conjunction withthe related topic of discussion.
Discussion was guided by the ICEM/ Pilko team. Key issues and findings were notedperiodically and summarized at the end of each session. All companies except Ciba-Geigy wererepresented in the first session; all companies except Celanese Mexicana were represented in thesecond session.
Synthesis: Results of the benchmarking sessions were summarized first in a draft report, andreviewed by the participants. When completed, this confidential report formed the basis fordocumentation and recommendation to the participating companies.
This report, sanitized of confidential information, was generated for use by outsidesponsors of the study. The intent of this report is to provide generalized findings about corporateenvironmental cost accounting procedures and uses for the chemical manufacturing andpetroleum refining industry.
16
Table A - Ranking of Factors and Issues
Factor* Rank
Environmental cost monitoring 1
Full cost accounting 2
Environmental accounting info. systems 2
Capital Versus Operating 3
Management Control 3
Environmental cost allocations 3
ECA info. for decision support 3
Budgeting process 3
Future environmental liabilities 4
Compliance versus voluntary costs 5
Reporting Systems - Accounting systems 5
Remedial/clean-up costs 5
Other metrics 6
Life cycle cost accounting 6
EC info. for external-focused issues 7
Environmental cost drivers 7
Public financial disclosure statements 7
NAFTA 7
* Note: Working definitions are given in Appendix C

17
Environmental Accounting System Development Framework
The following framework illustrates the relationship between different managementprocesses involved in environmental cost accounting. This framework was the basis for thequestionnaire developed in conjunction with the Environmental Cost Accounting BenchmarkingProject. Each of the elements in the framework was the subject of one or more discussionsessions during the Benchmarking Sessions.
CorporateAttitude TowardEnvironmentalStewardship
Environmental Information
Systems
DecisionMaking
DATA
Figure 2 : Conceptual Level Framework for Environmental Cost Accounting
DATA
The framework reflects the interrelationship between corporate culture (attitude towardenvironmental stewardship) and the availability of resources for development of anenvironmental accounting system. Only companies with a clear desire to integrateenvironmental decision making into the normal business context is likely to make such aninvestment.
The environmental information system will generate data that would otherwise beunavailable to managers. This data may be cost-based or may consist of nonfinancial measures.Nonfinancial measures can be used to either generate financial measures with the addition ofother data, or they may be used directly, as real-time data.
In either case, the data provide evidence relating to the decision to be made. Ultimately,the creation of better information systems generates better data that support better decisionmaking. This, in turn, may have a feedback effect on the organizational learning and culture ofthe company. This culture change brings about conditions that could cause future changes in theorganization’s information systems as well as the kinds of decisions that management will make.

18
Attitude Toward Environmental Stewardship
During this project, it became clear that, for the five participating companies, anorganization’s attitude toward environmental stewardship is directly related to the companyculture and, in fact, is a subset of the company culture. An example for assessing how theseelements function together was offered by one Partner company. Ciba-Geigy has published itsenvironmental policy: “Vision 2000" which describes a balance between the economic, socialand environmental responsibilities that will ensure the prosperity of the business beyond the year2000.
The Vision 2000 policy reflects the company culture at Ciba-Geigy, defining the natureof the organization and describing the core values that determine the actions of the company:
• Economic Success: This is ultimately the measure by which companies and theirshareholders evaluate their success.
• Social Responsibility: Ciba-Geigy accepts responsibility for the effects of its actions onemployees, the community, and other stakeholders.
• Environmental Responsibility: Ciba-Geigy strives to maintain a policy of sustainabledevelopment, including resource conservation and pollution prevention. The goal is toconduct business in a way that will not impede the ability of present and future generations tomeet their needs.
This attitude toward environmental stewardship helps to define the organization throughits culture because the culture represents the set of values, norms and procedures that serve as thefoundation for any environmental project. The culture is affected by the dominant individuals inthe organization, as well as by the industry and, perhaps, the nationality of the company.Nationality can be important due to differences in laws and regulations, socio-economicconditions, and cultural traditions. The five Partners made presentations on the topic of attitude toward environmentalstewardship. Although the topics discussed during this session varied with each Partner, most ofthe discussion centered around a few main areas. These areas include: the environmentalorganization and associated roles and responsibilities; environmental management systems,policies and procedures; environmental standards, compliance efforts and voluntary programs,and organizational changes.
Structure of the environmental organizations. All five Partners have some form ofenvironmental organization. The roles and responsibilities of these environmental units varyamong the Partners. Some companies organize their environmental group in a decentralizedmanner. In these cases, significant resources are placed at operating facilities while the corporategroup provides an oversight and limited support role.
Other Partners allocate a greater share of resources to a centralized organization. Thecentralized environmental group provides proportionately more top-down support to thefacilities. The amount and allocation of environmental resources provide an initial indicator ofthe company’s attitude toward environmental stewardship. However, differences in

19
organizational demands for environmental services may also explain the different organizationalstructures and resource allocations.
U.S./Mexico Environmental Climate. Each Partner has developed environmentalmanagement systems, policies and procedures which reflect their national cultures, as well astheir corporate cultures. All Partners, whether Mexican or U.S.-based, are concerned withcompliance with applicable environmental rules and regulations.
The regulatory requirements in the U.S. and Mexico are generally similar, but there arealso a number of differences. Many of the regulations created in the U.S. are subsequently issuedin Mexico after a time lag of several years. Consequently, it may be easier for Mexicancompanies than for U.S. companies to accurately predict what future regulations will be.
The Mexican companies in this study claim that they face a more regulated environmentthan U.S. companies in the use of water. Water usage is taxed at a higher rate than in the U.S.,and is taxed twice: once when it is extracted from groundwater wells, and a second time either asthe cost of treating the water to standards or the costs of reinjecting water to water qualitystandards. This double taxation results in very conservative water usage policies by MexicanPartners.
The extent to which the Partners participate in voluntary environmental programs varieswith the nationality of the company. The U.S. companies tend to have more voluntary programparticipation than do the Mexican companies. However, there are fewer voluntary programs inMexico than in the U.S. The direction of causation is not clear: do voluntary programs generateinterest among companies, or do companies provide the impetus for voluntary programs?
All the Partners have undergone or are in the process of undergoing significantenvironmental organizational changes. This phenomenon is not limited to the current wave of“re-engineering” which is occurring in many U.S. industries. Additional competitive pressures,brought on by dynamics such as the globalization of industry and political policy changes such asNAFTA, have caused the Mexican Partners to undergo significant organizational changes aswell. (Recall that Partner companies ranked NAFTA-driven environmental changes as relativelyuninteresting during the planning session.)
The following sketches out relevant aspects of the corporate culture of the participatingcompanies:
Ciba-Geigy. Within Ciba-Geigy, compliance is the responsibility of the lineorganization. If the line organization requests assistance in determining compliance levels, or forrelated support, several groups are available to provide it. These include Environmental Affairs,Regulatory Affairs, Legal Department and Regulatory Networks. If local standards are belowCiba-Geigy’s internal standards, they will comply with the higher standards.
Ciba-Geigy participates in a number of voluntary programs including ICC Charter forSustainable Development, Responsible Care, ISO 14000 (site by site), EPA 33/50,Environmental Leadership and Green Lights. In general, all employees are responsible for bothregulatory compliance and company internal standards. Environmental performance goals arepart of the organization’s objectives. Consequently, there is a corresponding impact oncompensation. Adherence to these environmental regulations and standards is everyone’sresponsibility day in and day out.

20
Grupo Primex. Within Grupo Primex, compliance issues are a top priority. Compliancewith effluent discharge limitations is currently under evaluation. The company plans to start up awastewater treatment system to address chemical oxygen demand, suspended solids and oil andgrease exceedences.
In addition to its membership in the BCSD-Gulf of Mexico, Grupo Primex participates inthe Responsibilidad Integral: El Compromiso de la Industria Quimica (Integral Responsibility:The Commitment of the Chemical Industry). This voluntary program is analogous to theResponsible Care program in the United States. This program is aggressive as companies haveagreed to full implementation in five years.
Grupo Primex reorganized and downsized during 1993. The company closed a plant andis now conducting all operations at a single complex. Upon completion of the reorganization,Grupo Primex began a program of paying employees who submit ideas that improveenvironmental performance, but only after the idea is implemented.
International Refineries. Within International Refineries, the operating unit isresponsible for conformance with the environmental policy. International Refineries employs adecentralized staff, placing resources at operating locations. A lean and flat organizationprovides preventive support to the operating organization for ongoing efforts.
International Refineries’ environmental policy is signed by the CEO and was last updatedin 1990. The management systems emphasize preventive programs, and senior managementsupports efforts by the corporate environmental group to improve performance. As demonstratedin the case studies included in this report, International Refineries management sees value inbetter understanding its environmental costs.
International Refineries participates in a number of industry and government voluntaryprograms. These include Responsible Care, American Petroleum Institute’s(API) STEP, EPA33/50, Green Lights, Natural Gas STAR and Energy STAR. Incentives have been created forimprovements in environmental performance. Individual performance review has anenvironmental element, and senior management performance review also includes an informalenvironmental element.
International Refineries has significantly changed its organization and asset structurefrom 1990 to 1995. Assets in the Exploration and Production and retail marketing areas havebeen rationalized. The upstream operations have been consolidated and new business units werecreated for the downstream and chemical operations. These changes have led to an approximate30% decrease in headcount. During this period, the Health, Safety and Environmental (HSE)group has increased headcount and created a stable structure.
Specialty Refiners. Specialty Refiners conducts a compliance auditing program toevaluate the effectiveness of compliance efforts at the company’s facilities. Specialty Refinersalso requires annual assurance letters from facility management which certify compliance withregulations. Specialty Refiners also participates in a number of voluntary programs including:EPA 33/50, API STEP, Green Lights, Waste Wise and ISO 9000.
Specialty Refiners has been a leader in developing a used oil stewardship program insupport of its car service business. Major efforts under the auspices of the API included theformation of a used oil coalition which consisted of 12 to 15 oil companies. Another effort wasin the area of developing model laws and regulation for the used oil, mainly to prevent it frombecoming a hazardous waste.

21
Specialty Refiners reorganized during 1995, effectively moving corporate resources outto operating facilities. The corporate group is currently responsible for regulatory matters andenvironmental policy. There are also two shared services groups. These are remediation andoccupational health, both located within the marketing division. All other functions are withinthe operating divisions or at the facility. There are approximately 100 full time equivalentsinvolved in the Environmental Safety and Health (ESH) group.
22
Environmental Cost Accounting System Development
In the sessions, each of the partner companies discussed their current system forgenerating environmental cost information. A variety of methods were used. Some systemswere wholly integrated, or layered, onto the General Ledger. Other systems were in the fledglingstage, existing as ad hoc systems that access information from other established systems to fulfilldecision making needs as they arise. Each system is described more fully in the followingsection.
Ciba-Geigy. Ciba-Geigy has identified two uses for environmental cost accounting. Thefirst use is to assign the proper current cost to the correct product, for profit determination andinventory valuation. The second use is to provide management with support for controlling andmanaging costs. Ciba-Geigy recognizes the impact of misallocation of overhead costs, whichoften include environmental costs, to product. The system implemented by Ciba-Geigy addressesmost issues regarding environmental costs by instituting an improved cost accounting systemthat accurately associates each cost with each product.
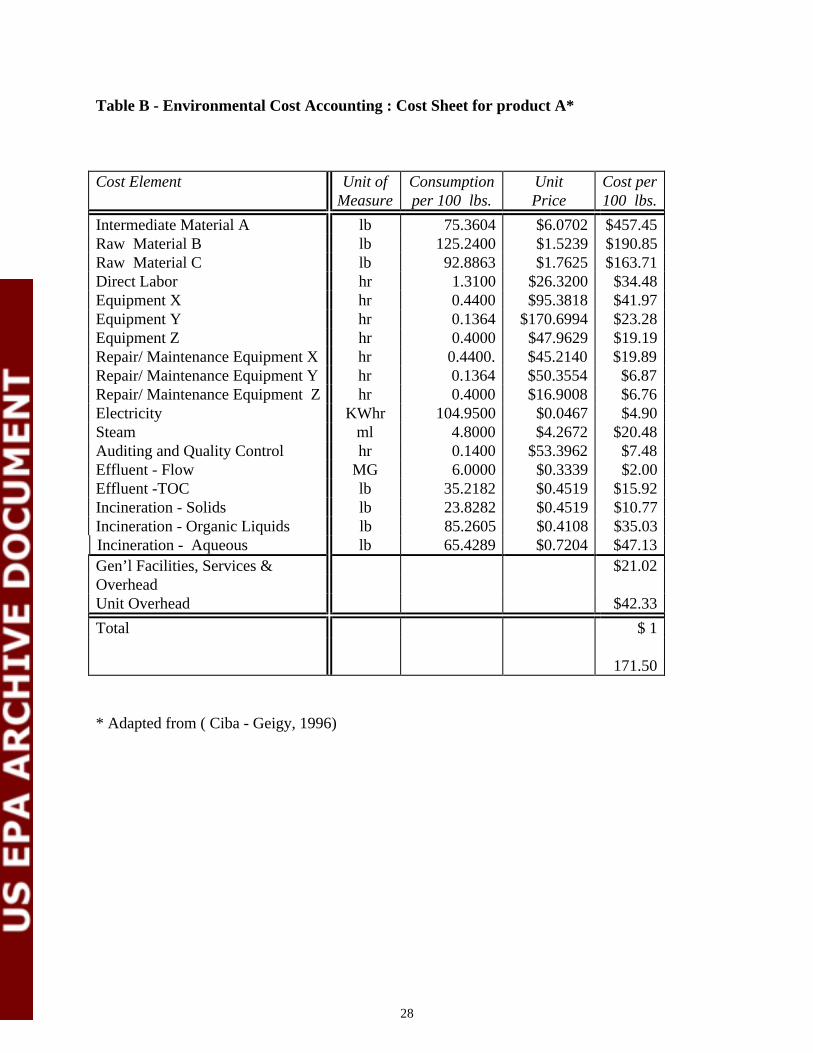
Ciba-Geigy generates environmental cost information as part of the General LedgerSystem. Each product has associated with it a detailed product cost sheet which defines all costelements associated with the product. Given for each cost element is the unit of measure,consumption per 100 pounds of product, unit price and cost per 100 pounds of product (see TableB at the end of this section for a fictitious cost sheet.) The cost elements include raw material,direct labor, equipment, repair and maintenance, electricity, steam, analysis and quality control,wastewater, incinerated wastes broken down into solid, organic and aqueous types, generalfacilities, services, and overhead (general FS&O), and unit overhead.
While the cost sheets enable more accurate product costing, controlling and managingenvironmental costs are dealt with using transfer pricing mechanisms. Ciba-Geigy has weighedseveral methods for determining the appropriate rate for the transfer price. One method, using theratio of the total cost to total capacity is easy to implement, provides a predetermined rate for thebudget cycle, and it adequately reflects a lower cost for lower usage. However, since it is notnormalized to reflect actual usage rather than total capacity there may be unallocated costs.
Another method, which defines the rate as the ratio of total cost to actual usage, showsthe real cost of services but results in a rate that varies during the budget cycle. This method maynot provide incentive to minimize wastes, since the environmental cost will depend on theinteractive effects of all users of the service. For example, if all users reduce their use of theservice by one half, none will realize a reduced rate for usage, as the corresponding unit rate willdouble.
Moreover, Ciba-Geigy recognizes limitations of purely financial information. Ciba-Geigy has developed another management tool for computerized reporting known as SEEP(Safety, Energy, and environmental Protection). The system requires all major production sites toinput to SEEP data on safety, resource use and environmental releases, excluding those from theraw materials production and consumer use stages of the product life-cycle. Cost data are alsomanually entered by site. Aggregate and analytic forms of these data form the foundation ofCiba’s Corporate Environmental Report. Also, these data fit directly into a limited Life-CycleAssessment methodology currently under development to improve the cost-effectiveness of

23
environmental decision. (A more detailed description of the use of LCA is given in the Ciba-Geigy Case Study.)
System users and system maintenance. The system is used by line employees to manageongoing environmental costs (as with other costs). Cost information is available throughout theorganization and each operating unit knows product costs. Corporate Environmental Affairs isresponsible for remediation costs, but these are not handled by the cost accounting system. Theyare dealt with in a fashion similar to how capital investment projects are handled. Themaintenance of the systems rests with corporate, division, and plant accounting functions.
System strengths and weaknesses. The system clearly defines responsibilities andaccountabilities. The objective is to try to account for environmental costs at the location andlevel where individuals are responsible for them and can make decisions to manage them.
A primary weakness of the system is that environmental costs are part of many costcenters. This leads to environmental costs being general and summary in nature. While chargeback mechanisms should facilitate improvement, it is difficult to explicitly define environmentalcosts and accumulate them into meaningful categories. For instance, aggregating environmentalcost information over multiple cost centers, as is required to be consistent with annual SEEPreporting needs, is very difficult.
Grupo Primex. In 1996, Grupo Primex began environmental cost monitoring. Goals forthe environmental accounting system were established. First, the environmental cost accountingsystem was to be a sub-system from their existing management information system. Second, thesystem needed to assist Grupo Primex in determining the impact of an environmental cost on netprofit and conversion (direct labor and overhead) cost. Finally, the system would have to enableperformance measurement, at all levels in the company based on ecological management ratios.The ecological management ratio is an index which measures pounds of waste produced perpounds of product, i.e., it is a waste-focused yield measurement. The index is not yet widely usedin the plants.
Grupo Primex focuses on environmental costs in certain income statement categories:variable costs, maintenance, and fixed expenses. Variable costs may fall into a general regulatorycategory, which includes environmental audits, risk assessment, penalties, remediation orresearch and development. Other variable costs are tracked by media. Variable costs associatedwith water may relate to duty payments for environmental permit exceedences not associatedwith audits, compliance fees for particular discharge conditions, utilities, electricity, wateranalysis, and labor costs. Water has double costs, since there is a fee to extract it from the groundas well as to dispose of it. Variable costs for air include monitoring and duty payments (fees andtaxes). Currently, Mexico has nothing comparable to the Clean Air Act Amendments of 1990.Variable costs for hazardous materials may be associated with analysis, duty payments, treatmentand disposal, transportation and labor cost. Finally, costs for soil analyses and duty payments arevariable.
Measurement instrumentation enables Grupo Primex to track environmental costs at theunit level. For instance, the costs of the wastewater treatment plant are allocated to each productaccording to loading and volume.
Mexican companies report usage and emissions to the government to determine dutypayments. Payment is made when emissions are reported. Water is reported quarterly; airemissions are reported once per year. Soil is reported periodically. Funds are escrowed, based onpredicted duty payments. To facilitate reporting, Grupo Primex’s General Ledger tracks metric

24
tons of production with costs. The financial and environmental management systems arereviewed on a monthly basis.
Maintenance costs include all expenses incurred as a result of preventive and correctivemaintenance for ecological assets, e.g., the wastewater treatment plant. Fixed expenses areintegrated by salaries and wages paid to ecology department personnel.
System strengths and weaknesses. Grupo Primex has begun separating environmentalcosts from operating costs. The system is free standing and does not directly access data fromany other system. However, they have made strides in procuring measurement equipment thatenables real-time data collection. Environmental costs can be related to financial informationusing their management information system.
One principle problem with the environmental accounting system is implementation.People resist what they perceive to be forced compliance or behavioral change. The company istrying to provide incentives through monetary recognition of individual initiatives onceimplemented.
Another issue to be resolved is the company’s operating definition of environmentalcosts. This definition process is not complete, so not all potentially interesting information isbeing collected. For example, the current system does not attempt to track less tangible costs.
Depreciation costs of environmental equipment and production assets are commingled,i.e., environmentally-related depreciation is not separated from depreciation of nonenvironmentalassets. This distinction is more important in Mexico than in the U.S., because, in Mexico, if acapital investment is for environmental assets, it can be fully depreciated in the first year,resulting in significant tax savings.
International Refineries. Four overarching goals led International Refineries to thedecision to extend their accounting system to incorporate environmental costs. First, InternationalRefineries would like to improve reporting capabilities for governmental, public and industryconcerns. Second, the system would provide additional detail to management about Health,Safety and Environment (HSE) expenditures. Third, such a system would provide a standardizedapproach to capturing HSE data through divisions. Finally, International Refineries opted to“enhance” the system rather than risk disruption and change through the construction of anentirely new system.
Specific requirements for the system were internally generated. The system would besimple but would have the capability to 1) track and define all expenditures related to health,safety or environmental projects by category, media, location and line of business; 2) trackpenalties and fines imposed by regulatory agencies; and 3) spot errors. System developmententailed three people working for seven months: two accountants and one environmentalspecialist.
The Enhanced Health, Safety and Environmental(HSE) Accounting System builds on theexisting accounting system by defining HSE product codes. These HSE product codes are teamed(via prefix) with existing accounting, location, and expense codes. There are eight categories ofHSE product codes: safety, air, water, solid and hazardous waste, remediation, spill cleanup,medical services and other (e.g., maintenance). Other categories correspond to those defined bythe U.S. Census Bureau and the American Petroleum Institute (API) in their annual surveys.
HSE product codes for safety include compliance fines, monitoring, asbestos, safetyequipment and safety supplies. HSE product codes for air include compliance fines, emissions

25
testing, and stack sampling. Solid waste product codes include compliance fines, hazardouswaste, non-hazardous waste, and waste testing and analysis. Remediation codes include soilremediation, compliance fines, testing and analysis and site assessment. A last category (other)includes miscellaneous environmental expenses, e.g., bird cones for the stacks. About 30 expensecodes are explicitly associated with HSE product codes. Examples of environmentally connectedexpense codes include environmental professional fees, public awareness programs, externalanalytical laboratory fees, and waste transportation.
Field personnel approve an invoice and select the correct product and expense codes.Accounting “load” forms are filled in using specific accounting codes assigned by location,product and expense codes. The accounting department pays invoices and enters coding into theGeneral Ledger system. Therefore, any expense can be identified and selected according to any ofthese three codes. Utility costs can be listed in this format and one can even specify the utilityaccording to whether it is electric, water, gas, etc.
Although environmental costs have been tracked to some degree for the last several years,only data after 1993 are accurate and comparable.
Strengths and weaknesses of the system. The system has many strengths. Its simplicityand the nature of its extension to the existing accounting system. Data is continuously andinstantaneously available, so expenditures can be instantly tracked by category. By includingenvironmental costs into the cost base of project accounting, individuals who are in the bestposition to manage environmental costs can give them full consideration. In turn, theseindividuals can be held responsible for their decisions. Extraordinary activities can be capturedbecause the system is expandable through the simple addition of new account categories.
The ease with which new accounts can be added can also be risky, since it facilitatesinappropriate changes as well as appropriate ones. New account classifications may be added,resulting in overlapping account codes. This inconsistency means that time series comparison ofenvironmental costs will not be accurate. The system will reject codes of impossible formats, butno other checks are performed as the data are entered. Thus, classification accuracy will dependon the account assignment, as determined by an accounting clerk.
Another weakness of the system is its lack of distinction of recurring and non-recurringcosts. Distinguishing between these costs could produce cost time series comparisons of higherfidelity, since non-recurring costs could be screened out.
Future improvements in the system include developing a procedure to routinely reviewproduct codes to delete redundant codes and ensure that new product codes are not included inthe wrong categories.
The account classifications do not facilitate tracing costs arising from incidents, such asspills, back to a specific unit, since not all units have separate cost centers (e.g., the wastewatertreatment plant). These systems are viewed as general overhead costs, without any chargebackmechanism. The system, therefore, does not currently support transfer pricing to all units.Additional metering capabilities, e.g., tracking volumes sent to flares, would provide measures ofactivity that could be used as a basis for transfer pricing.
International Refineries is aware that excessive reliance on profit maximization strategiesusing internal charge backs will inevitably cause internal arguments, and may not be good in thelong run, since cost cutting may short-change safety. On the other hand, International Refineriesbelieves charge back could contribute to improved operations management. A transfer pricingmechanism would help track line leaks or determine which unit ought to recycle.

26
The system has some limitations regarding labor costs. It does not capture personnel timeby project, and only includes labor if it is associated directly with an “environmental unit," e.g.,the desulfurization unit, or the wastewater treatment plant.
Specialty Refiners. Specialty Refiners’ primary goal for an environmental costaccounting system is to provide “point of generation” environmental expenses assigned toproduct lines. Spills, disposal costs, over/under treating for lube oils, permitting, wastewatertreatment, etc., would all be assigned relatively accurate costs. The cost information would bedistributed to appropriate field personnel to demonstrate the cost of specific actions as well asinaction. Given Specialty Refiners’ trend toward decentralized ESH, environmental costs couldserve as a unifying metric and communication tool.
Specialty Refiners has begun examining environmental costs, although a separateenvironmental cost system is not in place. Environmental cost data are generated and analyzedon an ad hoc basis. Environmental cost data are generated using the mainframe General Ledgerand the Maintenance Management System. Labor costs are not included since salary informationis stored on the payroll system. Capital contractor work requests are maintained and accessed ona database. All of these data are used to synthesize environmental costs which are stored on amanually generated spreadsheet. The spreadsheets are generated by the accounting department orby management on an as-needed basis. The level of detail depends on need, and is usually basedon a particular commodity, chemical or contractor.
Specialty Refiners can modify their General Ledger in a fashion similar to InternationalRefineries’. Any environmental area can be set up as a cost center at the business manager’sdiscretion. One refinery is tracking costs using the system. This capability permits detailedinformation to be made available from high level categories, e.g., materials and supplies, labor,contract services, etc. This capability is rarely utilized and depends on a facility’s desire tocapture information. Although cost center codes are easy to set up, gaining approval for themmay be politically difficult: cost codes require authorization of each division and each division’scontroller.
Capital project costs can be retrieved from invoices. There are tax benefits to capturingdetails on capital costs. These costs have been identified and broken out for several annualreports for the last 20 years. In determining which costs fall under the category “environmental”,there is not much discretion since Specialty Refiners uses the percentages recommended by API.
Work order and material detail information can be obtained from the MaintenanceManagement System. Material detail is available only if a requisition is written or a warehousehas entered information. The discretionary use of credit cards for expenses under $5000,instituted three to four years ago, confounds the ability to accurately track all costs. Theseexpenses translate into approximately $25,000 per supervisor per month, based upon EHSpersonnel estimates. Labor costs can only be obtained using the payroll system and are based ontimecards.
Specialty Refiners maintains a capital projects database which monitors projectinformation, including status, contract work orders (CWO), authorization requests andauthorization for expenditures. This system generates and tracks CWO’s, excluding vendorswhich are often charged on credit cards, for expense work. Contractor cost detail can begenerated by the desired category.
Users of the system. The system’s use depends on each facility’s demand forenvironmental cost information. There is typically a monthly review of information by a

27
management team. The information is analyzed with both an environmental as well as non-environmental perspective. The information is used by waste management teams consisting oftwo or three individuals focused on a specific problem, and by project managers to justifyenvironmental expenditures. Finally, the environmental department uses the various systemsmentioned above to generate and report required regulatory data.
System maintenance. Accounting is charged with maintaining the General Ledgersystem. Maintenance is responsible for the Maintenance Management System. Interfaces are theresponsibility of the Corporate Information Technology Group.
System strengths and weaknesses. The systems in place that are used to generateenvironmental cost data have many advantages. The General Ledger is a very reliable system andthe accounting staff are well trained in its application. Cost data from the General Ledger areavailable on a monthly basis, so analyses can be fairly current. Capital projects are easier tomonitor because they are well defined and have a paper trail associated with them, except for thesmaller credit card charges. The Maintenance Management System can be used to respond tocustom requests, e.g., VOC monitoring information was successfully generated using thissystem.
The systems used to provide environmental cost information are not very effective . Theyare primarily high level systems directed toward meeting government requirements, not businessrequirements. There is only limited user training, despite difficulties in manipulating the data, thecomplexity of the cost structure and the inflexibility in report generation. The system can allocatecosts, but the process is manpower intensive.
The system allows environmental costs to be accumulated primarily at the cost centerlevel, so detailed cost analysis is difficult. Specialty Refiners is converting a new accountingsystem (SAP AG), which should allow for more flexible cost monitoring, not only by cost center,but also by product line and product code. The allocation mechanism of the system will beimproved and environment costs will be integrated into the facility cost structure. The allocationmechanism will be facilitated by the installation of better measurement equipment. For instance,Specialty Refiners is in the process of installing total organic carbon (TOC) analyzers on effluentstreams to allocate back to “pieces” of the plant. Such information would also be useful foridentifying alarm conditions or for source reduction.
Given the shortcomings associated with the high-level nature of the system, it is notsurprising that Specialty Refiners identified “point of generation” environmental expenseassignment to product lines as a future system need. A system that could determine the cost ofspills, disposal costs, over/under treating for lube oils or permitting, etc., would enable fieldpersonnel to understand and take control of specific action or inaction costs to the company.
28
Table B - Environmental Cost Accounting : Cost Sheet for product A*
Cost Element Unit ofMeasure
Consumptionper 100 lbs.
UnitPrice
Cost per100 lbs.
Intermediate Material A lb 75.3604 $6.0702 $457.45Raw Material B lb 125.2400 $1.5239 $190.85Raw Material C lb 92.8863 $1.7625 $163.71Direct Labor hr 1.3100 $26.3200 $34.48Equipment X hr 0.4400 $95.3818 $41.97Equipment Y hr 0.1364 $170.6994 $23.28Equipment Z hr 0.4000 $47.9629 $19.19Repair/ Maintenance Equipment X hr 0.4400. $45.2140 $19.89Repair/ Maintenance Equipment Y hr 0.1364 $50.3554 $6.87Repair/ Maintenance Equipment Z hr 0.4000 $16.9008 $6.76Electricity KWhr 104.9500 $0.0467 $4.90Steam ml 4.8000 $4.2672 $20.48Auditing and Quality Control hr 0.1400 $53.3962 $7.48Effluent - Flow MG 6.0000 $0.3339 $2.00Effluent -TOC lb 35.2182 $0.4519 $15.92Incineration - Solids lb 23.8282 $0.4519 $10.77Incineration - Organic Liquids lb 85.2605 $0.4108 $35.03Incineration - Aqueous lb 65.4289 $0.7204 $47.13Gen’l Facilities, Services & $21.02OverheadUnit Overhead $42.33
Total $ 1
171.50
* Adapted from ( Ciba - Geigy, 1996)
29
Environmental Costs
As part of the initial questionnaire, the participating companies were asked to completecost matrices, whose results are summarized in Table C. This was requested for three reasons.
First, the degree of effort required to complete the task reflects on the quality of thecurrent environmental cost accounting system, if any. It is possible to evaluate the quality of thesystems as they currently stand, by reviewing the information provided by each company.
Second, the costs are organized by the type of activity that generated the costs. Bycomparing the magnitude of the costs for each activity, the important activities could beidentified. As it turned out, item 3, Environmental Aspects of Ongoing Operating, and item 4,Remediation Function, contained the most dollars for all participants. This was not surprising.Many costs associated with the on-going operations are tracked as separate expense elements intraditional cost accounting systems. As such, they are easily discernible as “environmental.”Similarly, costs associated with remediation are easily identified as “ environmental” and moreeasily quantified (if not accurately) since SEC regulations governing financial accountingrequires they be reported.
Third, by comparing the costs for each activity across companies, it is possible todetermine whether companies are having similar experiences in dealing with environmentalissues, and whether their accounting systems are having similar success in capturing cost data.
The general results indicate that the participants varied greatly in their reported costs,although two variables - company size and type of business (refining or chemicals)-- can explainmost of that variation. The level of detail in the breakdowns varied by company. Grupo Primexand Specialty Refiners provided detailed costs for subcategories in each relevant item, whileCiba-Geigy and International Refineries provided global totals. However, even Grupo Primexand Specialty Refiners acknowledged that it was very difficult to accurately complete thequestionnaire, despite having environmental cost accounting systems in place. One problem maybe that the environmental cost accounting systems tend to be aggregated at the plant level(especially Grupo Primex and Specialty Refiners), not at the corporate level.
There was general agreement that most costs will not increase drastically over the nextfew years. It was pointed out that some of the costs are discretionary, in that the timing ofimplementation is partially driven by what the company can afford in the given period.
There was surprisingly little reported investment in Centralized Environmental Activities(item 1) or Regulatory Affairs (item 2), given that all of the U.S. companies report a centralizedfunction, including active interaction with federal and state agencies.
In fact, the presentation of the aggregate results to the participants was met with asurprisingly cool reception. It became clear that the participants do not feel that environmentalcosts by themselves are very interesting or important. However, the participants were able toidentify and categorize a number of uses for environmental cost information. Although thereappears to be some degree of overlap between them, three basic types of uses were identified:
1. Decision Making: Environmental cost information can illuminate issues such asdetermining the level of value added, use of risk-based versus necessity acquisitions, capitalbudgeting including lower Hurdle Rates for environmental projects, product costing anddiscretionary versus regulatory investments.

30
2. Baseline Cost Information: By developing baseline environmental cost information,managers can improve resource allocation decisions, support lobbying efforts, and improvecost control. Comparing baseline costs to current costs may help identify cost reductionopportunities, estimate future project costs, serve as a basis for budgeting, and capture costavoidance.
3. Management Incentives: Participants agreed that management’s incentives for
environmental stewardship were sometimes complex, and that environmental costinformation might be useful for improving the management performance evaluation processby incorporating environmental costs into financial performance measures. These costscould also be used for public relations purposes, by providing evidence of the efforts made bythe company in environmental stewardship. For example,several Partners discussed community relations problems that may lead to future costs if notresolved: for example, the legal release of irritating gases; and the “environmental justice”issue, in which the community which developed around the existing plant now claimsenvironmental damage from the plant’s proximity to the community. There was consensusthat, even if company activities were above legal reproach, building better communityrelations can help avoid lawsuits, denied permits, and similar costs. Partners are oftenwilling to invest in good community relations to avoid these future costs.
Finally, the participants agreed on the difference between production economics, politics,and the emotions of the press and of private citizens. These differences make “rationalmanagement techniques” somewhat risky, in that public opinion is often far removed from whatis right or fair. In discussing the use of environmental costs for decision making, the participantsdifferentiated between capital expenditures and routine operating and maintenance costs. Allparticipants felt that environmental capital expenditures were special, because they are oftenmandated by government.
If technologies are mandated, the task is to implement them on a timely basis, even whenmandated technologies represent an excessively expensive, suboptimal solution. Particularly,mandated technologies tend to represent “end of pipe” solutions, which may be less efficient thanpollution prevention approaches, that depend on redesigning the waste generating processes. Thecompanies would often rather be given a mandated outcome than a mandated method ortechnology for reaching that outcome, but the time horizon for meeting these targets is often tooshort to arrive at the best solution.
In addition to selected environmental cost information, all of the participating companiesuse non-financial input and output measures, which provide more detailed information moredirectly than anything which could be provided by the cost system. Non-financial indicators,such as number of incidents reported and TRI (Toxics Release Inventory) statistics, are oftenmore useful for operating managers. Cost information is most useful as a way of determining theoverall economic effects of current methods and of alternatives.

31
Table C - Comparative Environmental CostsSales (Worldwide) ‘94
A) International Refineries $3.4BB) Ciba-Geigy ($15.3B) $4.6BC) Grupo Primex $184MD) Specialty Refiners $1.51BE) Celanese Mexicana didn’t provide any cost table information
1 2 3 4* 5 6EnvironmentalFunction
Total Cost ($) (Mostrecent fiscal year)
Source ofInformation inColumn 2
% of Total CostAllocated to ProductAs Part of Cost ofGoods Sold (COGS)
Source ofInformation inColumn 4
AnticipatedAnnualPercentageChange OverNext 3 Years
1) Centralized Environmental ActivitiesPermittingTrainingEnvironmental compliance auditingEnvironmental management systems auditOther
B) $1000KA) 1,292KC) 173KD) 561K
0%0%0%0%
5%8%15%-33%
2) Regulatory AffairsLobbyingPolitical Action CommitteeRegulatory agency involvementInvolvement in legislative processOther
B) 1,300KA) ---C) ---D) ---
0%N/A0%---
5%---------
3) Environmental Aspects of OngoingOperations
Annual depreciation of environment assetsStripping ColumnIncineratorWastewater Treatment SystemLabor of operating the environmental assetsMaintenance of environmental assetsOperations and maintenanceOther
B) 61,500K
A) 23,076K
C) ~630K
D) ~14,500K
100%
0%
17%
100%
5%
5%
0%
---

32
4) Remediation FunctionLaborContractors/StudiesDisposalAnnual depreciation of assetsOperation and maintenanceOther Field work/implementation
B) 60,000K
A) 25,800K
C) 128K
D) Not broken out
0%
0%
0%
---
significantly less
10%
0%
---5) Environmental Aspects of
Community/External AffairsPublic relationsCommunity affairsPhilanthropyIndustry groupsOther
B) (in #3)
A) Don’t track
C) 5K
D) Not broken out
NA
NA
0%
---
---
N/A
---
---6) Environmental Aspects of Product & Process
DevelopmentR&D - Design for environmentProduct engineeringProcess engineeringPilot plantMarketingProcurementOther
B) 2,600K
A) Don’t track
C) 30,172K
D) Not broken out
30%
0%
0%
---
10%
N/A
0%
---
7) Other (please specify) Marine Preservation Association National Polystyrene Recycling Corp.
A) 2,464K 95%0%
* Including cost of feedstock, labor and other refining/manufacturing costs.
What percentage of cost of goods sold (COGS) relates to feedstock? %Provide capital expenditures for the last three years for environmental-related plant and equipment:
$ 1994, $ 1993, $ 1992.A) 22M A) 26M A) 41MB) 15M B) 30M B)49MC) 2M C) --- C) 1MD) 2.289M D)26.263M D)5.059M

33
Use of Environmental Cost Accounting in Managerial Decision Making
Decisions using cost data. A number of specific decisions were identified that coulddirectly make use of environmental cost information. The list is not necessarily exhaustive. Inmany of these decision contexts, environmental cost information would be treated as just anothercost of doing business, such as in product pricing or product mix. In other situations, theenvironmental cost accounting information may have a unique role in the decision process . Thismight be the case in waste management decisions, pollution prevention alternatives or market-based environmental options. In all cases, identifying and quantifying environmental costs,whether currently captured by the accounting system, or as part of future liabilities or intangiblecosts and benefits will enrich the quality of the following decisions.
1. Internal/External Benchmarking: How are we doing against competitors? How areindividual plants doing, on a comparative basis?
2. Product Pricing: Better environmental cost accounting can lead to betterunderstanding of what a particular product costs to produce. For products withprice flexibility (differentiated products), this may be reflected in priceadjustments.
3. Product Mix: Better environmental cost accounting can be beneficial even withcommodity products, for which the price is market-driven. The company maychoose to adjust their product mix to maximize overall profitability.
4. Waste Management Decisions: Better understanding of environmental cost structureswill lead engineers and managers to make more cost-effective choices in treatingand disposing waste.
5. Pollution Prevention Alternatives: A better understanding of current environmentalcosts, as well as that of prospective alternatives, will result in better capitalexpenditure decisions.
6. Materials/Supplier Selection: Companies committed to environmentally responsiblemanufacturing understand that a “cradle to grave” mentality is necessary. Throughbetter sourcing of materials, companies can push environmental responsibility upthe supply chain. They may partner with suppliers to make pollution preventionoptions more cost-effective. Also, can significant environmental costs be avoidedthrough outsourcing?
7. Facility Location/Layout: Companies may find that their by-products can be used asinputs to other companies. Such companies often co-locate with these Partners.
8. Outbound Logistics: These issues pertain to finished product, by-products andwaste. Packaging of finished product has significant environmental implications,if the packaging must be destroyed to use the product. Is additional cost ofdesign and materials worth the investment, if the environmental liability might bereduced? For by-products and waste, off-site disposal raises the risk of futureliabilities for activities which are currently legal, and off-site transport moves thematerial beyond the control of the company.
9. Market-Based Environmental Options: An active market in SO2 and other pollutionallowances is developing. Understanding the cost of reducing these emissions iskey to establishing values for these allowances.

34
10. International Environmental Standards: ISO 14000 is expected to be finalized during1997. This ISO 14000 requires that environmental standards be documented andfollowed, though environmental accounting is not explicitly mandated.Certification may be required to maintain the customer base, especially in Europe.
11. Public Relations / Lobbying: Understanding the cost of this activity, and of the costsof not participating in this activity, will help to rationalize the level of investmentto be made here.
12. Training: The best level of training (from a cost-benefit point of view) is easier todetermine if the benefits are quantifiable.
Decisions using nonfinancial data. As previously mentioned, one crucial issue is thedegree to which financial indicators, such as environmental cost accounting information, areused, as compared with non-financial indicators, such as the number of incidents or TRI releaseinformation. The value of non-financial indicators is linked to the specificity and timeliness ofthose indicators. The value of financial information is that the net economic effect of theinterplay of complex physical systems can be captured on a summary basis.
Participants seemed to agree that, at the plant level, non-financial indicators are essential,and cost accounting measures are secondary. Perhaps this is because the decisions that must bemade at the operations level tend to be relatively straightforward, technical and immediate. Plantoperations must be monitored and adjusted more quickly than cost information can be provided.The value of cost information seems to be limited to decisions requiring a common denominator.
The higher the management level, the more likely that financial information will be used,as costs can be seen as a shorthand for multiple factors. It is also likely that, the higher themanagement level, the more the manager’s performance evaluation will be based on financialmeasurements. Thus, the high-level manager will be more interested in summary financialmeasurements of environmental activities than will plant operations. This is because the high-level manager is responsible for more diverse activities, and for activities with longer time spans.Of course, high-level management will be interested in aggregate nonfinancial data, as well.
Ciba-Geigy presented its use of life-cycle analysis as a method for evaluating relativeenvironmental impacts of processes and products. This is found in case studies later in thisdocument.
Company use of environmental cost information for decision making. Fourcompanies made presentations on this topic: Ciba-Geigy, International Refineries, Grupo Primex,and Specialty Refiners. Two primary types of decisions were addressed, capital acquisitions andoperating decisions.
Environmental Cost information was used primarily for capital acquisition decisions. Thecompanies indicated that the processes used for capital acquisitions of environment items tendedto be made using the same process as that for non-environmental items. However, as indicatedbelow, in individual company coverage, the environmental items tended to be given priority,especially if the environmental investments were mandated by government regulation. Desirableenvironmental projects tended to be given informal priority, in that most companies did not use alower Hurdle Rate for environmental investments. This was true of both U.S. and Mexicancompanies.
35
Identifiability of environmental portion of pollution prevention projects. Thepreference for environmental capital items is reflected in an issue also discussed in the “costs”section: that “end of pipe” sorts of acquisitions are clearly identifiable as environmentalexpenditures, but improved technology (which may also result in cleaner processes, thusaddressing environmental issues at least as well, but less directly) are often considered operatingimprovements, not environmental. Because integrative solutions, such as improved technology,are clearly the superior approach to environmental stewardship (pollution prevention beingsuperior to post-production clean up), the preference for clearly environmental capitalexpenditures over non-environmental may inhibit companies’ ability to achieve greaterenvironmental responsibility through pollution prevention.
Perhaps one solution is to identify differential economic benefits to investments that canbe legitimately classified as environmental, whether they represent pollution prevention or end ofpipe investments. The issue of determining what portion of the investment is environmental hasalready been tackled by the American Petroleum Institute(API). One company, SpecialtyRefiners, systematically allocates a portion of their investment in pollution prevention projects asbeing environmental, using API guidelines. It was pointed out that, in some jurisdictions,environmental projects are currently given special tax status, such as shorter depreciation periods(U.S.) or immediate write-off of cost (Mexico). These tax concessions may be justified by theenvironmental benefit to citizens within these jurisdictions.
The following describes how each of the participating companies uses environmental costinformation:
Ciba-Geigy. Capital Expenditure Decisions. Ciba-Geigy tracks environmental costsseparately as certain cost elements on product cost sheets. However, environmental capitalexpenditures are seen as part of normal business expenditures; they are part of viewed as a costof doing business. The biggest difference between environmental and non-environmentalexpenditures relates to government mandates, whether the project is required, and whether thegovernment regulation stipulates technologies or performance. Performance-based regulation isgenerally preferred, because companies can identify and implement the best alternative solution.
All potential capital projects are evaluated based on traditional capital budgeting criteria,and are all subject to the same approval levels, Hurdle Rates and other financial test, except inthe case of mandated environmental projects. If the project is governmentally mandated, HurdleRates are meaningless; the project must be done.
Operating Decisions. Ciba-Geigy tracks environmental remediation costs separately.While significant differences exist, the internal approval process is similar to the capitalexpenditure approval process.
Grupo Primex. Grupo Primex tracks environmental costs relating to both capitalexpenditures and ongoing operations and maintenance. However, like the other Partnercompanies, decision-making with environmental costs focuses primarily on capital expenditures.
Capital Expenditure Decisions. The process for developing cost estimates is the same forany kind of capital project, whether environmental or not. The Environmental Manager decideswhether a project is to be classified as environmental. However, environmental capitalexpenditures are tracked independently of other capital expenditures. Once needs or opportunityareas are identified, preliminary engineering studies identify critical parameters, leading to anestimate of the total capital expenditure required. If the project is required to meet regulations,

36
the project will be approved in virtually all cases, subject to final approval by the GeneralDirector. If the project is not required to meet regulations, the Payback period and Internal Rateof Return are determined. If the Payback period is less than three years and the Internal Rate ofReturn exceeds the Hurdle Rate, if sufficient cash is available, and other aspects of the projectmeet with the approval of senior management, then the project is undertaken. If the project doesnot meet the financial criteria, the project is put on hold until regulations change, unless there aresignificant intangible benefits associated with the project.
Operating Decisions. Grupo Primex captures the ongoing cost of environmentalactivities, but does not exhaustively differentiate between environmental and other operating andmaintenance activities. The company views environmental activities as a part of doing business,and manages these activities accordingly.
International Refineries. The system has helped International Refineries betterunderstand where they are spending money. Two areas with unexpectedly high costs proved tobe waste hauling and operations analysis. With International Refineries’ system, the cost perpound of waste can be estimated. They can breakdown waste hauling costs by vendor as well.Despite what might be expected, it is not uncommon for the same vendor to charge differentprices for the same services that were negotiated separately. A side project developing aroundthis system involves coordinating purchases and looking at volume discounts. A refinerymanager could also use this type of information to improve selection or negotiations withcatalyst suppliers, waste disposers, etc.
Improved understanding of environmental costs improves the budgeting process. Thefocus on expense codes is particularly useful, since budgets are constructed around expensecodes. As a result of the Enhanced HSE accounting systems, there is a better understanding ofremediation costs, as well as the costs of different types of remediation.
Accounting for environmental costs has also proved useful as a communication tool.International Refineries is now able to track environmental, health and safety (HSE) operatingexpenditures, HSE capital expenses as well as environmental accruals. Superfund expenses aretracked and are included depending on the information displayed. HSE expenditures are alsotracked according to business sector, i.e., upstream, downstream and chemical.
Capital Expenditure Decisions. International Refineries evaluates environmental capitalexpenditures in the same way as non-environmental capital expenditures. However, the priorityof the capital project is directly linked to whether the project is required to comply withgovernment regulations.
HSE capital and operating budgets are developed by business units with input from on-site HSE personnel. Included are corporate HSE costs that are allocated to business units, basedon a rough estimate of percentage of time spent by corporate HSE staff on each business unit.
International Refineries has developed a Capital Budgeting Guidelines hierarchy ofprojects, ranging from A to G. Category A consists of environmental projects, of which A1projects are required for compliance with regulations in the current year, and A2 projects will berequired in the future. B projects are health and safety projects, with B1 referring to legalmandates effective in the current year, and B2 projects referring to future legal mandates. Cprojects are expenditures required to avoid the loss of an asset, or to meet the terms of an existingcontract. D projects are discretionary projects with a current year positive net cash flow, Eprojects with high returns where delay in investment will significantly reduce future returns, and

37
F projects are those with returns that exceed the Hurdle Rate for the year. G projects are projectswith undefined economics. These G projects are virtually never funded.
Operating Decisions. International Refineries has a relatively well-developedenvironmental cost accounting system, but does not base ongoing operating and maintenancedecisions on costs specifically identified as environmental. However, International Refineriesuses this system to track all expenditures of HSE functions by category, media, location and lineof business. It functions well in spotting irregularities.
Examples of uses of the International Refineries information include:• Budgeting (by expense code)• Identifying opportunities for Volume discounts / leverage with vendors.• Making business units responsible for their own costs.
Specialty Refiners. Specialty Refiners uses environmental cost information extensivelyfor both capital expenditure and operating decisions.
Capital Expenditure Decisions. Specialty Refiners’ capital budgeting process is similarto that of the other companies, consisting of a multi-step process. The initial project is oftenconceived at the plant level, where the problem is most often identified, but it may originate atcorporate or at the tech center, depending on the specific problem. An initial set of alternatives isevaluated, and the leading contender(s) are further refined. Process design specifications aregenerated, including a detailed Safety and Environmental checklist, which must be approved bycorporate HSE before the project can proceed. A capital budget proposal is generated, consistingof both the technical and economic evaluations of the alternative. The approval process will beaffected by the size of the project, the economics, and the degree of linkage to other projects inthe current capital budget. As a part of the Authorization for Expenditure, the cost is apportionedbetween the environmental part and the non-environmental proportion, using API’s guidelinesand Specialty Refiners’ experience. These environmental proportions are rough, usually 50% to100%, but may be as small as 25%.
During the construction of the project, concurrent cost audits are regularly performed,providing a basis for evaluating both the budget and the actual performance. However, uponcompletion of the project, post-implementation audits are rarely, if ever, performed.
Operating Decisions. Specialty Refiners takes environmental costs into account whenmaking operating decisions. For example, product mix decisions are affected by potentially highenvironmental costs of new products. Additional environmental responsibility brings the needfor better environmental performance, which could translate into either more environmental staff,or larger non-environmental staff which takes responsibility for some environmental activities.Finally, environmental costs can affect product pricing for specialty products, for which there ispricing flexibility. One difficulty in using environmental costs for operating decisions is theaccuracy and timeliness of cost assignments to specific products.
In addition, Specialty Refiners is aware of how current practices have a real, future costbut of uncertain magnitude and timing. For example, environmental liabilities and futuredisposal costs are real, but difficult to estimate. Environmental regulations are likely to change,and may bring about new retroactive liability. Consumer confidence and the support of thecommunity are essential, but can be influenced either positively or negatively by public relations,quite apart from real environmental issues. These issues affect operating decisions, but aredifficult to accurately quantify.
38
Appendix APartner Company Profiles
CELANESE MEXICANA(Celanese Mexicana participated in only the first, two-day session. Thus, the volume of material
reported in this section is limited, relative to the other Partner companies)
Celanese Mexicana has eight operating locations in Mexico. The company’s total 1994worldwide sales in U.S. dollars were over $800 million. The company employs over 7000employees worldwide. Its major business segments are chemicals, fibers, and packagingmaterials.
In 1990, Celanese Mexicana established a company-wide environmental, health andsafety organization. At about the same time, a company environmental policy was establishedand signed by the Board of Directors. Celanese Mexicana employees are expected to takeresponsibility for environmental issues as a condition of employment. Environmentalperformance of the company affects yearly bonuses, both positively and negatively.
Participation in voluntary programs is limited. Emission reductions of 85% wereestablished as a goal for Celanese Mexicana in 1991, to be accomplished by 1997. So far, 70%reductions have been achieved. This program was started on the initiative of the company; thereis no governmental agency requesting voluntary emission reductions.
One aspect of the culture at Celanese Mexicana that affects the company’s ability toestablish consistent standards across the company is the difference between fibers and chemicalspersonnel. Fibers personnel are more conservative, while chemicals personnel are much lessconservative. One possible approach being considered to lessen this effect is interchangingpersonnel, so that each group can better understand the other.
Celanese Mexicana Case Study
Celanese Mexicana’s case examined a technological process change which improvedboth their environmental and financial performance.
The main products of the this particular plant are acrylates, of which the plant produces11,000 tons per year. Their old production method used acrylonitrile as its main input. Theprocess generated 40,000 tons of waste stream every year, of which the main components wereacrylamide, acrylic acid, alcohol and ammonium sulfate.
In 1990, the U.S. EPA released a list of regulated toxic pollutants. There are generallytwo to three years between the passage of an environmental regulation in the United States andthe passage of a similar regulation in Mexico. Celanese Mexicana therefore decided to change itsproduction process in anticipation of similar Mexican regulation.
The new technology uses propylene as an input instead of acrylonitrile, and eliminates theintermediate production of acrylamide. The waste stream produced consists of unsaturated acid,water, carbon dioxide and carbon monoxide, and unreacted propylene. In addition to reducingtoxic output, the change has halved the process’ production costs. While the investment in thenew propylene based system was originally conceived as an environmental project, it was theexpected fast payback that convinced management to approve the initial expenditure.

39
CIBA-GEIGY
At the time of this study, Ciba-Geigy was an international company with 13 operatingunits in the U.S., three in Canada and three in Mexico. The company’s 1994 worldwide saleswere over $1.5 billion. Ciba-Geigy had 87,000 employees worldwide, 15,000 in the UnitedStates. The company’s major business segments were health care, agriculturalproducts(including crop protection products), animal health care products and seeds, andindustrial products(including additives, textile products, polymers, pigments, chemicals). Amerger with Sandoz was announced by Ciba Geigy in March, 1997. It needs approval from U.Sand Europe authorities in Federal Trade Commission. In this new Novartis business structure,MBT and speciality chemicals will be separately traded.
Ciba-Geigy Case Study
Ciba-Geigy presented a case study that addressed their use of Life-Cycle Assessment(LCA). LCA is a tool that is used to measure the relative environmental impact of processes orproduct uses. It considers all environmental impact occurring during the production and use of aproduct, including the raw material acquisition, manufacturing, application, utilization anddisposal functions, within a predetermined boundary (“Battery Limit”) for the study.
Ciba-Geigy uses an LCA method that was developed in Europe. It measures emissions in“pollution units” which are based on acceptable ambient concentrations as issued by governmentagencies, e.g., the EPA. The lower the acceptable ambient concentration of a substance, thegreater are its number of pollution units per unit of mass.
The case study covered Ciba-Geigy’s LCA of IRGAZIN DPP RED BO, a highperformance pigment mainly used in automobile paint. The LCA considered all theenvironmental impacts, starting with the raw material aquisition, manufacturing, the chemicalsynthesis, packaging, transportation, as well as all the downstream customer uses (paintproduction and car painting) and the ultimate use and disposal of the cars. It shows that drivingthe cars has the highest environmental impact, followed by the painting process. Looking only atthe chemical synthesis step (which is under Ciba-Geigy’s direct control,) the LCA identifies themajor environmental impact resulting not from the chemicals used, as might be expected, butfrom the energy requirements during manufacturing.
Using this information as a guide to prioritize the process improvement efforts, Ciba-Geigy has already managed to improve the yields by 10%, while reducing waste by 50% and theenergy requirements by 14%. Further improvements are expected. Additional LCAs for majorproducts are being developed.

40
GRUPO PRIMEX
Grupo Primex has one location in Mexico. The company’s 1994 total worldwide saleswere $181.1 million. Its worldwide employee base consists of 540 employees. The company’smajor business segments involve production of PVC resins, PVC compounds, phthalicanhydride and plasticizers.
Grupo Primex Case Study I
This case study examined a technological problem regarding the wastewater streamgenerated from the production of plasticizers. Plant capacity is 45,000 tons of plasticizer peryear. This amount represents approximately 25% of the total physical output of the plant. In theplasticizer production sequence, the residual, which consists of water, alcohol andplasticizer,undergoes separation treatment for reclamation of the plasticizer in the material. Theseparation process is complicated by effects stemming from the high temperature of the residual.
To facilitate the recovery of plasticizer, Grupo Primex invested in a process modificationconsisting of two additional steps. The first step neutralized the electric charge of the plasticizerrecovered from the previous batch. The second step involved the recovery of excess alcohol afterthe second heating step.
The primary advantage of the modification is that the residual wastewater is cleaner andcan be re-used. The change has resulted in a cost saving of US $800,000. In addition, theunusable waste plasticizer stream was eliminated, resulting in additional production of 300 tonsper year. Finally, downtime reserved for equipment cleaning (50 hours per month) waseliminated. Although environmental cost accounting did not a play a significant role inidentifying the problem or determining a solution, the benefit of the project is reflected inimproved financial performance.
Grupo Primex Case Study II
This brief case study identified options for treatment of Pthalic anhydride in gaseousemissions from a chemical plant. Pthalic anhydride is not regulated by the Mexican government,so there is no urgent need to control its release . However, it is an irritant and there areenvironmental benefits to be reaped from its removal. The company considers installingscrubbers or an incinerator to treat the Pthalic anhydride. Incinerators are the cheaper option, andGrupo Primex tentatively plans to install them next year.

41
INTERNATIONAL REFINERIES
International Refineries has 13 operating locations in the U.S. which include tworefineries, four chemical plants, five product terminals and two oil and gas production units. Thecompany’s 1994 worldwide sales were over $1.5 billion; and worldwide it has over 2000employees. The company’s major business segments include exploration and production ofcrude oil, natural gas marketing and distribution, marketing and distribution of petroleumproducts, and manufacturing and marketing of chemicals and plastics.
International Refineries Case Study
International Refineries’ case study discussed their system for estimating environmentalliabilities. When an environmental liability is identified during the year, the responsible projectmanagers and International Refineries’ environmental advisor jointly determine the amount to beaccrued. Accruals are based on an estimation of how much of the cost of any given incident canbe attributed directly to International Refineries, and how much it will cost to remediateInternational Refineries’ share. It is uncommon for International Refineries to be whollyresponsible for a site.
Estimated costs include the cost of remediation according to current legal requirements,and sometimes the predicted cost of litigation as well. Accruals are indicated on the company’sbalance sheet as liabilities. The accruals are reviewed quarterly by a team of International Refineries managers andoutside auditors. The accrual process is fairly elaborate, but there are two caveats associatedwith it. First, the outside auditors may not agree with International Refineries’ estimated costs.Second, the environmental liability accrual process is not linked to International Refineries’capital budgeting process. Thus, estimated liabilities are not directly linked with proposedcapital expenditures for environment.
42
SPECIALTY REFINERS
Specialty Refiners has approximately 120 operating locations in the U.S. The company’s1994 worldwide sales were over $1.5 billion and it has over 2000 employees. The majorbusiness segments of the Company are domestic and international motor oil marketing and sales,refining, the industrial specialties business unit and the base oil marketing department.
Specialty Refiners Case Study I
Specialty Refiners’ first case study described a technical problem that was analyzed andsolved at one of their oil refineries. It is a relatively old plant, and its technology problems arenot shared by other Specialty Refiners facilities. The analyzed process involved the removal ofimpurities from lube oil feed stock to make food grade white mineral oils. The process results ina highly acidic oil, which is neutralized with caustic, to protect equipment from acid corrosion.However, the caustic combines with the oil residue to create an emulsion layer referred to as“muck.”
An excess of muck built up in the plant, and by 1991 the plant was spending a lot onstorage and disposal of the emulsion. In addition, the emulsion chemically trapped by-products,such as petroleum sulfonate, which would otherwise be salable. The warning about excessemulsion first came from field operators rather than from the accounting department, but it tookcost documentation from the accounting records to legitimize the concern.
Plant engineers as well as an outside consultant attempted to solve the problem to noavail. Finally, an operations employee suggested the use of sodium bisulfite to break down theemulsion. Sodium bisulfite was cheap N(.65/gal), easily available since it was a by product ofcurrent plant processes located near the system, and effective in breaking down the emulsion. Sofar, the new sodium bisulfite treatment has saved the company over $180,000.
Specialty Refiners Case Study II
The refinery examined in this case, which dates from the 1930’s and refines an average of50,000 bbl per day. This case deals with a change in their wastewater treatment costs.
The refinery’s wastewater treatment system dates from the 1960’s. It involves API andCPI separators, aerated lagoon and settling lagoon sections, stocked with commerciallypurchased microorganisms.
In 1993, the company’s cost reports showed a yearly expenditure of $600,000 toreplenish microorganisms in the lagoon system. A review board was formed to investigate thematter, composed of the Environment, Health and Safety manager, a wastewater engineer,operations management representatives, site managers, and the outside vendor. They examinedthe relevant data from 1994 and realized that alkanolamine and N-methylperoladine(NMP), alube oil extracting agent in the wastewater were combining to form ammonia in the wastewater,which was toxic to the microorganisms. Orthophosphate soaps used to clean the system pipeswere also harmful. Operators were unaware of the amine peaking and its effects downstream;they consider amine a waste product. The operators could only follow the lagged ammoniapeaks.

43
In response to this information, the review board recommended that operations managersminimize their disposal of amines and NMP in the system. To accomplish this, operationsinstituted an inventory system. One conclusion was that chemical usage would be a valuableindirect measure of environmental cost. The operations’ vigilance resulted in a reduction of 65%of the liquid biosupplements and 50% of regular biosupplements. They saved $200,000 per yearon the cost of microorganisms. In 1995 the plant passed the state biomonitoring test for the firsttime, because its lagoon system was functioning so well. However, due to reassignment ofpersonnel within the company, many of the experienced operations managers who enacted thechange have been replaced in their positions by relatively inexperienced employees. This newgroup of personnel has not been able to maintain the improvements made by their predecessors,but Specialty Refiners believes that experience and training will improve their performance inthe near future.

44
Appendix B
ENVIRONMENTAL COST ACCOUNTINGCOOPERATIVE BENCHMARKINGSM STUDY
OVERVIEW
The questionnaire to be used in the Environmental Cost AccountingCooperative Benchmarking study serves the following purposes:
Requires the Partner company filling out the questionnaire to understand the various Factors and Issues that are addressed by
the questionnaire.
Provides a common level of understanding to the other Partnercompanies who are participating prior to the actual CooperativeBenchmarkingSM meetings.
Facilitates discussion during the meetings based on how thequestionnaire is answered by the Partner company.
The questionnaire is comprised of two parts. The first part is a strategicoverview approach to environmental cost accounting within the organization.The nature of the questions is based on the list of Factors and Issues that wererank ordered by the Partner companies. In this manner, sufficient exposure isgiven to topics that are the highest priority to the Partners.
The second part of the questionnaire is the two case studies that are to bepresented during the benchmarking sessions. The case studies may beprojects that have been previously investigated by the Partner company or anarea in which the company wants to conduct further study. The two casestudies should be differentiated from one another. For example, the casestudies might be on a mature product and a new product or on an old processand a new process. The distinguishing feature might be geographical,technical, commodity vs. specialized, etc.
The case studies may highlight a success in investigating environmental costaccounting or some critical information that was necessary for an importantdecision or the case study could highlight how a bad decision was made andhow it might be improved in the future.
Cooperative BenchmarkingSM is a Service Mark of Pilko & Associates, Inc.©Pilko & Associates, Inc.

45
The case studies should be written up as part of the questionnaire with anyappropriate flow diagrams, charts, tables, etc., to fully explain the case.
The agenda for the benchmarking meeting will allow one hour for the casestudy presentation, discussion and questions. Each participant will presentone case study each day for approximately 30 - 45 minutes. There will then bea period of time for discussion and questions to fill out the rest of the hour.
INSTRUCTIONS
The requested information is provided in a Word Perfect 6.0/6.1 file (named"WORDPERF") and a MS Word for Windows 2.0(c) file (named "MSWORD") onthe enclosed 3 ½ inch floppy and also with a hard copy. Please complete thequestionnaire in one of the provided word processor files or by manuallycompleting the hard copy and return one hard copy of the questionnaire. Useof the disk will allow you to expand the answer section if more room is needed.If you are completing the hard copy, attach additional pages if there is notenough room to adequately answer the question. Please do not return the disk.If you answer the questionnaire on disk, print out a hard copy and return tous.
Cooperative BenchmarkingSM is a Service Mark of Pilko & Associates, Inc.©Pilko & Associates, Inc.

46
PART I - QUESTIONNAIRE
1. Is the company participating in this study as a parent company, asubsidiary, a division, etc.? Please describe the relationship.
2. Indicate the number of operating locations for each of thegeographical areas:
United States Europe Canada Africa Mexico Asia South America Australia
TOTAL
3. Indicate the company's 1994 worldwide sales in U.S. dollars:
$ (millions)
Indicate the company's worldwide employee base:
employees
4. Indicate the company's major business segments:
5. Attach a copy of the Environmental Organization Chart for thecompany.
6. List the three most significant difficulties the company faces inattempting to remain in compliance with environmental regulations:
1)
2)
3)
7. Does the company go beyond compliance? Going beyond compliancemeans that the company adopts standards which are more stringent
47
than those required by regulation. For example, a company mayinstitute pollution control equipment prior to a regulatory deadline totake advantage of pollution credits. Another example might be that acompany that adopts standards that exceed local standards.
Yes
No
If yes, under what conditions?
Does the company adopt “cleaner” technologies or methods thatexceed requirements:
YesNo
If yes, provide examples:
Does the company adopt “cleaner” technologies or methods beforethey are required?
Yes
No
If yes, provide examples:
Does the company participate in voluntary environmental programs?
Yes
No
If yes, provide examples:
8. In terms of environmental issues, how is the North American FreeTrade Agreement (NAFTA) expected to affect the company?
In terms of environmental issues, how is the General Agreement onTrade and Tariffs (GATT) expected to affect the company?
Will the company participate in ISO 14000?

48
Yes
No
If yes, please describe:
9. What incentives (financial or other) are provided for employees toparticipate in improving the environmental performance of thecompany?
Is environmental performance recognized in an employee’s annualreviews? Employees include senior management, facilitymanagement, supervisory and operations personnel. Is participationin pollution prevention efforts encouraged? Provide examples:
10. If the company has faced reorganization/reengineering/downsizing inthe last three years, how has this affected your environmentalperformance and cost monitoring abilities?
11. Does the company generate environmental cost information?
Yes
No
If yes, which of the following statements (a-e) best describes how yougenerate this information:
a) Generated as a part of your general ledger system.
b) Generated as a part of your management accounting system,separate from your general ledger system.
c) Generated by a free standing system, using data electronicallytransferred from your general ledger or management accountingsystem.
d) Generated by a free standing system, which does not directlyaccess data in other systems, including non-automated, ad-hocmethods.
e) Generated by some other type of system. Please describe:

49
Who are the recipients of the information?
12. What internal barriers affect the ability of the company to collectenvironmental cost information?
What systems or organizational structures are in place that facilitatecollecting environmental cost information?
Please provide examples of problems or successes encountered incollecting environmental cost information:
13. Does the company make estimates of the less tangible environmentalcosts or benefits such as liabilities from past operations, the indirectcost of regulation, the benefits of environmental proactivity, etc?
Yes
No
If yes, please elaborate:
14. If the company has attempted to identify these less tangible costs andbenefits, was this attempt done as a pilot project, company-wide or onsome other basis? Please elaborate:
15. Describe the environmental cost accounting system the companywould like to have in place five to ten years from now. Describe whatinformation would be gathered, to whom it would be distributed, andfor what the information would be used:
16. List the five most important performance measures that the companyuses to track/monitor environmental performance. Examples includeboth Output Measures such as: number of spills, number of permitexceedences, tons of hazardous waste minimized, dollar ofenvironmental fines and penalties, and Input Measures such astraining, compliance, audits, and drills for emergency preparedness:
1) Output:
Input:
2) Output:

50
Input:
3) Output:
Input:
4) Output:
Input:
5) Output:
Input:
17. Which, if any, of these performance measures have been translatedinto monetary units?
How is this information used within the company?
18. Are environmental operating expenditures tracked independently ofother operating expenditures?
Yes
No
Why?
19. Are environmental capital expenditures tracked independently ofother capital expenditures?
Yes
No
Why?
20. Who or what level decides whether a project should be classified asenvironmental? What criteria are used in the decision?
What criteria are used by the company to differentiate between capitaland operating expenses?

51
21. Please describe the process of developing cost estimates forenvironmental projects utilized by the company:
22. Are estimates of current or future environmental costs utilized in newproduct design and development decisions?
Current EnvironmentalCosts
Future Environmental Costs
Yes Yes
No No
In product mix decisions?
Current EnvironmentalCosts
Future Environmental Costs
Yes Yes
No No
In what ways are they used?
23. Describe the process used by the company to determine whether acapital environmental expenditure should be undertaken:
24. At what organizational level in the company are capital environmentalexpenditures approved?
Is this the same level at which these projects are managed? If not,where are these projects managed?
Does this level differ for non-environmental capital expenditures?
25. When financial analysis of capital environmental expenditures isperformed, are numeric estimates included for intangibles such asgoodwill, improved community or employee relations, fines orpenalties?
Yes
No

52
Describe:
26. What techniques (Return on Assets (ROA), Internal Rate of Return(IRR), Net Present Value (NPV), payback period, etc.) are used toevaluate the feasibility of the project?
Do these techniques differ from those used to evaluate non-environmental projects?
Yes
NoAre there different performance levels (i.e., Hurdle Rates) forenvironmental projects versus non-environmental projects?
Yes
No
Describe:
27. Is it easier to obtain approval for projects labeled as “environmental?”
Yes
No
Explain:
28. Describe the methods used to estimate future environmental liabilitiesthat arose due to past activities or operations:
What outside support, if any, does the company rely on to estimatethese liabilities?
What are the primary difficulties involved in estimating theseliabilities?
29. How does the company estimate liabilities for future activities e.g.,acquisition of sites with existing contamination, future spills, etc.?

53
What are the primary difficulties involved in estimating theseliabilities?
30. Under what conditions would the company revise an estimate of aliability created from past operations or activities?
Would the company revise estimates of past liability as part of aperiodic review process?
Yes
No
Describe:
Would the company revise estimates of past liability based onanticipated changes in regulations?
Yes
No
Describe
31. How does your company monitor future environmental regulations?
Who is involved in the environmental regulatory monitoring process?
What individuals or organizations outside your company are used tohelp forecast regulatory changes and their potential impacts to thecompany?
How does the company link environmental regulatory monitoring withthe environmental budgeting process?
32. What activities does the company engage in to influence regulatorychanges?

54
APPENDIX C :DEFINITION OF FACTORS
ENVIRONMENTAL COST ACCOUNTING COOPERATIVE
BENCHMARKING SM STUDY
RANKING OF FACTORS AND ISSUES
Ranking Factors and Issues
∗ Cross-Border - NAFTA/trade related -Effect of NAFTA on environmentalissues facing companies. Will NAFTAresult in changes in laws andenforcement levels?
∗ Environmental capital costs vs.
environmental operating costs -Differences between environmentalcapital and operating costs in terms ofmethod of classification, size, timing,and visibility.
- Effects of differences on process utilization or redesign- Effect on management behavior
∗ Management control - EnvironmentalCost Accounting (ECA) can providemanagement with tools for making goodinternal decisions which integrateeconomic and environmental concerns.
∗ Other metrics/proxies for
environmental cost information - Is anECA system set in the traditional modeof quantifying performance in terms ofdollars the most effective, or is someother system which measuresperformance in terms of, say chemicalpollution units, better?
∗ Full cost accounting - How to identify
and quantify all the costs (direct, indirectand intangible) associated withproducts/processes or activities withinthe boundaries of the organization?

55
∗ Environmental cost information for
external-focused issues - Using ECAinformation for dealing with issuesexternal to the company like lobbying,regulations, providing information to thecommunity, marketing, etc.
56
Ranking Factors and Issues ∗ Environmental cost information for
decision support - ECA can be used fordecision making, cost monitoring andcontrol and motivation.
∗ Environmental cost
drivers/environmental cost inventory -Identifying basic activities that causeenvironmental costs.
∗ Remedial/cleanup costs -
Environmental remediation costs (e.g.,Superfund) for current and pastoperations.
∗ Environmental cost monitoring - Is it
important to quantify in absolute terms(dollar amounts) al environmental costs?
∗ Public financial disclosure statements
- Is it important to have specificstate/national rules regarding disclosureof financial liability?
∗ Environmental compliance costs vs.
Environmental voluntary costs - Is itimportant to differentiate between thetwo categories and deal with themseparately?
∗ Future environmental liabilities -
Liabilities on the company for 1) Pastactivities/products 2) Current and futureactivities/products.
∗ Budgeting processes - Political
documents - Are environmentalprojects treated differently than other(non-environmental) projects?
∗ Reporting systems - Accounting
system - What kind of managementinformation system is needed? How
57
does it capture environmental costinformation?
∗ Life cycle cost accounting - Identifying
all cost bearing activities that areassociated with a product/processthrough its lifetime, from acquisitionthrough disposal.
(Note: Full cost accounting onlycaptures costs internal to the companywhereas, life cycle cost accountingcaptures cost external to the companyalso. Full cost accounting is thus a sub-set of life cycle cost accounting)
Ranking Factors and Issues
∗ Accounting information systemsenvironmental accounting informationsystems - Many companies arepublishing separate environmentalreports. But the reports are not alwaysconsistent in what and how much thesay. I there a need to develop a uniformsystem for environmental reporting tooutside constituents?
∗ Environmental cost allocations -
Allocating costs correctly toenvironmental activities that cause them.Ideally everything should be charged to aproduct/process rather than to overhead.
∗ Other ∗ Other ∗ Other
COMPANY COMPLETING FORM:
INDIVIDUAL COMPLETING FORM: