Embed Size (px)
Citation preview

For feedback and suggestions Investor Relations Group
E-mail: [email protected]
Environmental Data Book
Year Ended March 31, 2020
- 1 -
Positioning of the Environmental Data Book
The Environmental Data Book provides information and data on the Santen Group’s environmental efforts. Related
information is also available on our Annual Report and website.
(Reporting boundary)
Japan: all facilities including sales offices
Other countries: Principal production facilities, Tampere Plant (Finland) and Suzhou Plant (China)
(Reporting period)
Japan: April 1, 2019 – March 31, 2020
Other countries: January 1, 2019 – December 31, 2019
Certain information is updated after the above period.
Tampere Plant (Finland) covers the period from January 1, 2019 to September 30, 2019 when the business transfer to Next Pharma
was completed.
With regard to the major indicators, figures for previous fiscal years are also given.
(Important change in organization during the reporting period)
Transfer of functions of Osaka Plant to other plants completed and Osaka Plant was closed by March 31, 2015.
The business transfer of Tampere Plant (Finland) to Next Pharma was completed by September 30, 2019.
(Guidelines referenced)
This data book has been prepared with reference to the Environmental Reporting Guidelines (2018 edition, Ministry of the
Environment of Japan), Basic Guidelines on Accounting for Greenhouse Gas Emissions Throughout the Supply Chain (Ministry of
the Environment of Japan / Ministry of Economy, Trade and Industry of Japan, Ver.2.3), Environmental Accounting Guideline (2005
edition, the Ministry of the Environment of Japan), and GRI Standards.
(Notational system of numerical results)
Total and tallies of shares may not always match, due to the effect of rounding and so on.
(Currency exchange rate - U.S. dollar amounts)
In this data book, U.S.dollar amounts have been translated from yen, solely for the convenience of the reader, at the rate of ¥108.83
to U.S.$1.00, the exchange rate prevailing on March 31, 2020.
(Independent Assurance)
The performance indicators denoted by ✔ this symbol have been assured independently. Independent Assurance Report is posted
on P14.
(Date of issue)
December, 2020
- 2 -
Contents
1.Environmental management ・・・・・・・・・・・・・・・・・・・・・・・・・・・・・・・・・・・・・・・・・・・・・・・・・・ P. 3 FY2020 targets/ performances in FY2019
ISO14001certification
Environmental management audit
Evaluation of water stress
Environment-related accidents and complaints
Overview of environmental impact (FY2019)
2.Measures against Climate Change ・・・・・・・・・・・・・・・・・・・・・・・・・・・・・・・・・・・・・・・・・・・・・ P. 5 Greenhouse gas (CO2) emissions trend by scope
Greenhouse gas (CO2) emissions reporting boundary
Greenhouse gas (CO2) emissions calculation standards
Greenhouse gas (CO2) emissions conversion coefficients
Greenhouse gas (CO2) emissions trend by operational site
Energy usage trend
Renewable energy trend
3.Reducing our Environmental Impact ・・・・・・・・・・・・・・・・・・・・・・・・・・・・・・・・・・・・・・・・・・・ P. 8 Waste reduction and recycling trend
Air pollutants emissions trend
Water pollutants emissions trend
PRTR substances handled (in Japan)
PCB storage
Water usage trend
Prevention of environmental pollution
4.Biodiversity ・・・・・・・・・・・・・・・・・・・・・・・・・・・・・・・・・・・・・・・・・・・・・・・・・・・・・・・・・・・・・・・ P. 11 Forest conservation activities
Local environmental clean-up activities
【Reference】 ・・・・・・・・・・・・・・・・・・・・・・・・・・・・・・・・・・・・・・・・・・・・・・・・・・・・・・・・・・・・・・・・・ P. 12
Environmental accounting (in Japan)
Independent Assurance Report ・・・・・・・・・・・・・・・・・・・・・・・・・・・・・・・・・・・・・・・・・・・・・・・・・・・・・・・ P. 14

- 3 -
1.Environmental management
■FY2020 targets/ performances in FY2019
【Santen Group】
FY2020 targets Performance in FY2019
Measures against Climate Change CO2 emissions Lower than 34,357t-CO2 33,916t-CO2
Reducing our Environmental Impact
Final waste disposal ratio
Lower than 2.1% 3.3%
Input water resources
Less than 2.4thousand m3/billion yen
2.43 thousand m3/billion yen
【In Japan】
FY2020 targets Performance in FY2019
Measures against Climate Change CO2 emissions Lower than 24,756t-CO2 24,773t-CO2
Reducing our Environmental Impact
Final waste disposal ratio Lower than 0.01% 0.013%
■ISO14001certification Organization scope of activity acquisition date
As integrated organization Shiga Product Supply Center Noto Plant Claire Co., Ltd
Production of pharmaceuticals Cleaning of antidust and sterilized clothing
December 2014 ※
Suzhou Plant (China) Production of pharmaceuticals February 2019 ※ Shiga Plant was registered in 1999, Noto Plant was in 2003, and were migrated to integrated organization certification in 2014
■Environmental management audit
Our ISO 14001-certified plants are constantly subject to regular assessment by an ISO 14001 certification assessment
body. We also make an internal audit of our plants that have not yet obtained ISO 14001 certification by following the
ISO 14001 standard.
■Evaluation of water stress
WRI AQUEDUCT is used to evaluate and confirm the rarity (water stress) of water sources in the area where each
factory or research sites is located.
■Environment-related accidents and complaints
There was no accident that causes environmental pollution, i.e. soil contamination, and no infraction of laws or regulations
related environmental issues, at our business sites.
- 4 -
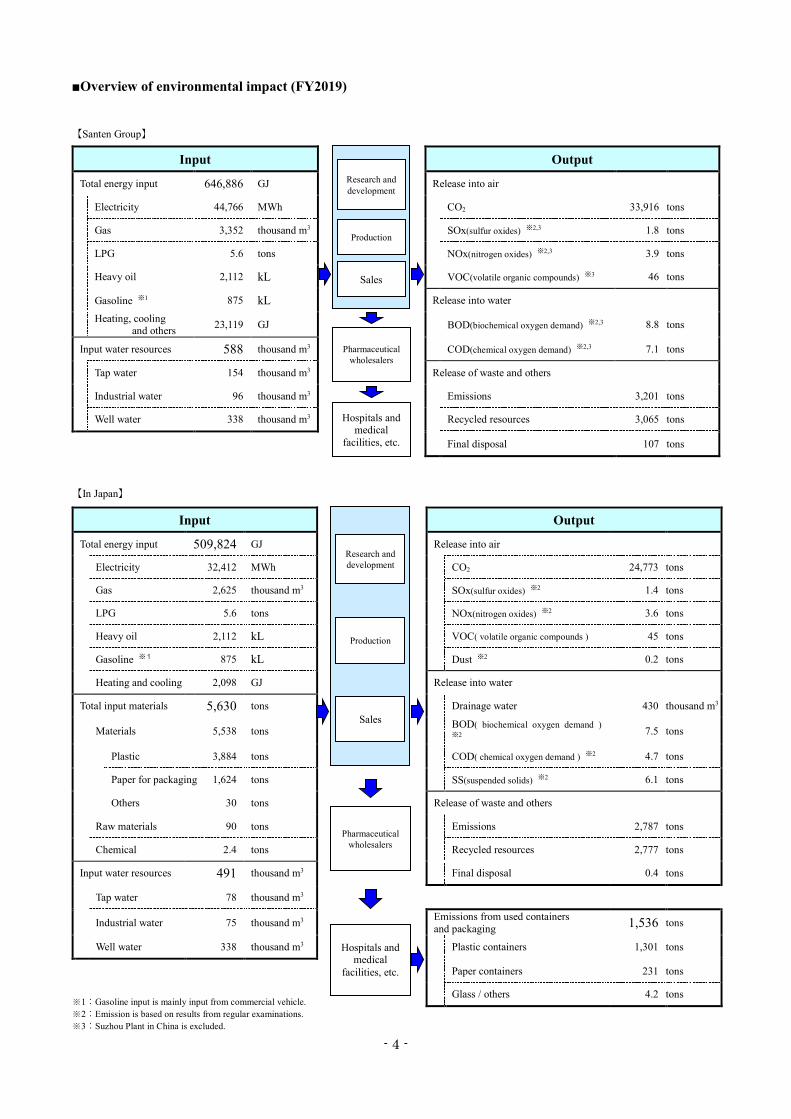
■Overview of environmental impact (FY2019)
【Santen Group】
【In Japan】
Input
Output
Total energy input 646,886 GJ Release into air
Electricity 44,766 MWh CO2 33,916 tons
Gas 3,352 thousand m3 SOx(sulfur oxides) ※2,3 1.8 tons
LPG 5.6 tons NOx(nitrogen oxides) ※2,3 3.9 tons
Heavy oil 2,112 kL VOC(volatile organic compounds) ※3 46 tons
Gasoline ※1 875 kL Release into water
Heating, cooling and others 23,119 GJ BOD(biochemical oxygen demand) ※2,3 8.8 tons
Input water resources 588 thousand m3 COD(chemical oxygen demand) ※2,3 7.1 tons
Tap water 154 thousand m3 Release of waste and others
Industrial water 96 thousand m3 Emissions 3,201 tons
Well water 338 thousand m3 Recycled resources 3,065 tons
Final disposal 107 tons
Input
Output
Total energy input 509,824 GJ Release into air
Electricity 32,412 MWh CO2 24,773 tons
Gas 2,625 thousand m3 SOx(sulfur oxides) ※2 1.4 tons
LPG 5.6 tons NOx(nitrogen oxides) ※2 3.6 tons
Heavy oil 2,112 kL VOC( volatile organic compounds ) 45 tons
Gasoline ※1 875 kL Dust ※2 0.2 tons
Heating and cooling 2,098 GJ Release into water
Total input materials 5,630 tons Drainage water 430 thousand m3
Materials 5,538 tons BOD( biochemical oxygen demand ) ※2 7.5 tons
Plastic 3,884 tons COD( chemical oxygen demand ) ※2 4.7 tons
Paper for packaging 1,624 tons SS(suspended solids) ※2 6.1 tons
Others 30 tons Release of waste and others
Raw materials 90 tons Emissions 2,787 tons
Chemical 2.4 tons Recycled resources 2,777 tons
Input water resources 491 thousand m3 Final disposal 0.4 tons
Tap water 78 thousand m3
Industrial water 75 thousand m3 Emissions from used containers and packaging 1,536 tons
Well water 338 thousand m3 Plastic containers 1,301 tons
Paper containers 231 tons
Glass / others 4.2 tons
Pharmaceutical wholesalers
Hospitals and medical
facilities, etc.
Research and development
Production
Sales
Pharmaceutical wholesalers
Hospitals and medical
facilities, etc.
Research and development
Production
Sales
※1:Gasoline input is mainly input from commercial vehicle. ※2:Emission is based on results from regular examinations. ※3:Suzhou Plant in China is excluded.

- 5 -
2.Measures against Climate Change
■Greenhouse gas (CO2) emissions trend by scope
【Scope 1 and 2】 (unit:t-CO2)
Year ended March 31 % Change
2020/2019 2019 2020 Santen Group 17,018 ✔15,924 -6.4 Scope 1 In Japan 14,390 13,779 -4.2 Outside Japan 2,628 2,145 -18.4 Santen Group 18,234 ✔17,992 -1.3 Scope 2※ In Japan 10,533 10,994 4.4 Outside Japan 7,701 6,998 -9.1
※ The amount of Scope 2 emissions in FY2018 (Year ended March 31, 2019) has been retroactively revised to improve data accuracy.
【Scope 3】 (unit:t- CO2)
Category Year ended March 31 % Change 2020/2019 Calculation methodology 2019 2020
1:Purchased goods and services 142,215 147,531 3.7 Estimated figures based on multiplying the weight of raw materials, ingredients, or purchase amount of stock goods by the emission factors of the calculation database.
2:Capital goods※ 15,480 ✔16,480 6.5 Estimated figures based on multiplying the amount of money for acquisition of the fixed assets by the emission factors of the calculation database.
3:Fuel and energy related activities not included in Scope1 and Scope2 1,099 ✔2,211 101.2
Estimated figures based on multiplying the usage of electricity by the emission factors of the calculation database.
4:Transportation and distribution (Upstream) 630 763 21.1
Estimated figures based on the transportation distance between the plants/logistics centers and the destinations (pharmaceutical wholesalers, etc.) with using the fuel consumption method or the ton method.
5:Waste generated in operation 440 489 11.1 Estimated figures based on multiplying the weight of each waste discharged by the emission factors of the calculation database.
6:Business travel 2,763 2,041 -26.1 Estimated figures based on multiplying the travel expenses of each transportation type and accommodation expenses by the emission factors of the calculation database.
7:Employee commuting 1,633 1,485 -9.1
Estimated figures based on multiplying the commutation expenses of public transportation systems and the amount of gasoline used of the commuter cars by the calculation database.
12:End-of-life treatment of sold products 223 207 -7.2 Estimated figures based on multiplying the weight of each material for the sold products and packaging by the emission factors of the calculation database.
Total 164,483 171,207 4.1
CO2 emissions per unit of revenue [t-CO2/billion yen]
933 938 0.4
● Database of emissions unit values for accounting of greenhouse gas emissions, etc., by organizations throughout the supply chain (ver.3.0, Ministry of the Environment of Japan / Ministry of Economy, Trade and Industry of Japan).
● Category 8,10,11,13-15 are not indicated, because of our business characteristics. Category 9 is not calculated and indicated, at present. ※ Category 2: capital goods emissions in FY2018 (Year ended March 31, 2019) has been retroactively revised to improve data accuracy.
- 6 -
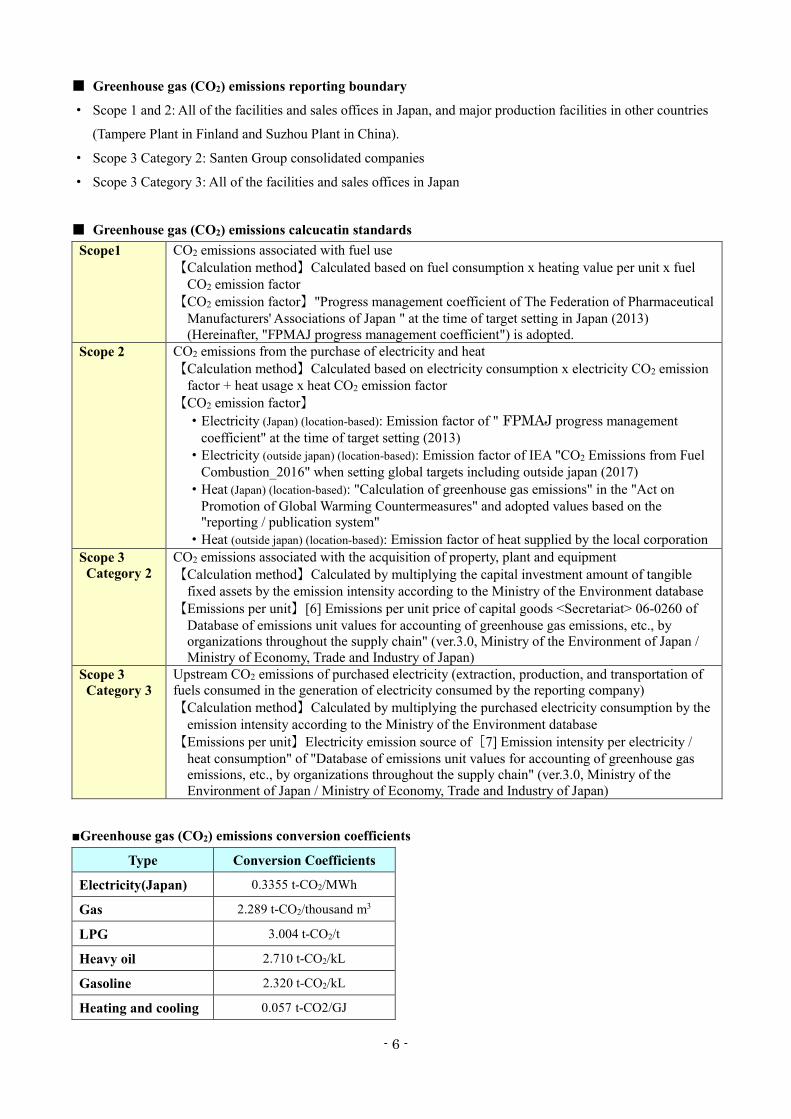
■ Greenhouse gas (CO2) emissions reporting boundary
・ Scope 1 and 2: All of the facilities and sales offices in Japan, and major production facilities in other countries
(Tampere Plant in Finland and Suzhou Plant in China).
・ Scope 3 Category 2: Santen Group consolidated companies
・ Scope 3 Category 3: All of the facilities and sales offices in Japan
■ Greenhouse gas (CO2) emissions calcucatin standards Scope1 CO2 emissions associated with fuel use
【Calculation method】Calculated based on fuel consumption x heating value per unit x fuel CO2 emission factor
【CO2 emission factor】"Progress management coefficient of The Federation of Pharmaceutical Manufacturers' Associations of Japan " at the time of target setting in Japan (2013) (Hereinafter, "FPMAJ progress management coefficient") is adopted.
Scope 2 CO2 emissions from the purchase of electricity and heat 【Calculation method】Calculated based on electricity consumption x electricity CO2 emission
factor + heat usage x heat CO2 emission factor 【CO2 emission factor】
・Electricity (Japan) (location-based): Emission factor of " FPMAJ progress management coefficient" at the time of target setting (2013)
・Electricity (outside japan) (location-based): Emission factor of IEA "CO2 Emissions from Fuel Combustion_2016" when setting global targets including outside japan (2017)
・Heat (Japan) (location-based): "Calculation of greenhouse gas emissions" in the "Act on Promotion of Global Warming Countermeasures" and adopted values based on the "reporting / publication system"
・Heat (outside japan) (location-based): Emission factor of heat supplied by the local corporation Scope 3
Category 2 CO2 emissions associated with the acquisition of property, plant and equipment 【Calculation method】Calculated by multiplying the capital investment amount of tangible
fixed assets by the emission intensity according to the Ministry of the Environment database 【Emissions per unit】[6] Emissions per unit price of capital goods <Secretariat> 06-0260 of
Database of emissions unit values for accounting of greenhouse gas emissions, etc., by organizations throughout the supply chain" (ver.3.0, Ministry of the Environment of Japan / Ministry of Economy, Trade and Industry of Japan)
Scope 3 Category 3
Upstream CO2 emissions of purchased electricity (extraction, production, and transportation of fuels consumed in the generation of electricity consumed by the reporting company) 【Calculation method】Calculated by multiplying the purchased electricity consumption by the
emission intensity according to the Ministry of the Environment database 【Emissions per unit】Electricity emission source of[7] Emission intensity per electricity /
heat consumption" of "Database of emissions unit values for accounting of greenhouse gas emissions, etc., by organizations throughout the supply chain" (ver.3.0, Ministry of the Environment of Japan / Ministry of Economy, Trade and Industry of Japan)
■Greenhouse gas (CO2) emissions conversion coefficients
Type Conversion Coefficients
Electricity(Japan) 0.3355 t-CO2/MWh
Gas 2.289 t-CO2/thousand m3
LPG 3.004 t-CO2/t
Heavy oil 2.710 t-CO2/kL
Gasoline 2.320 t-CO2/kL
Heating and cooling 0.057 t-CO2/GJ
- 7 -
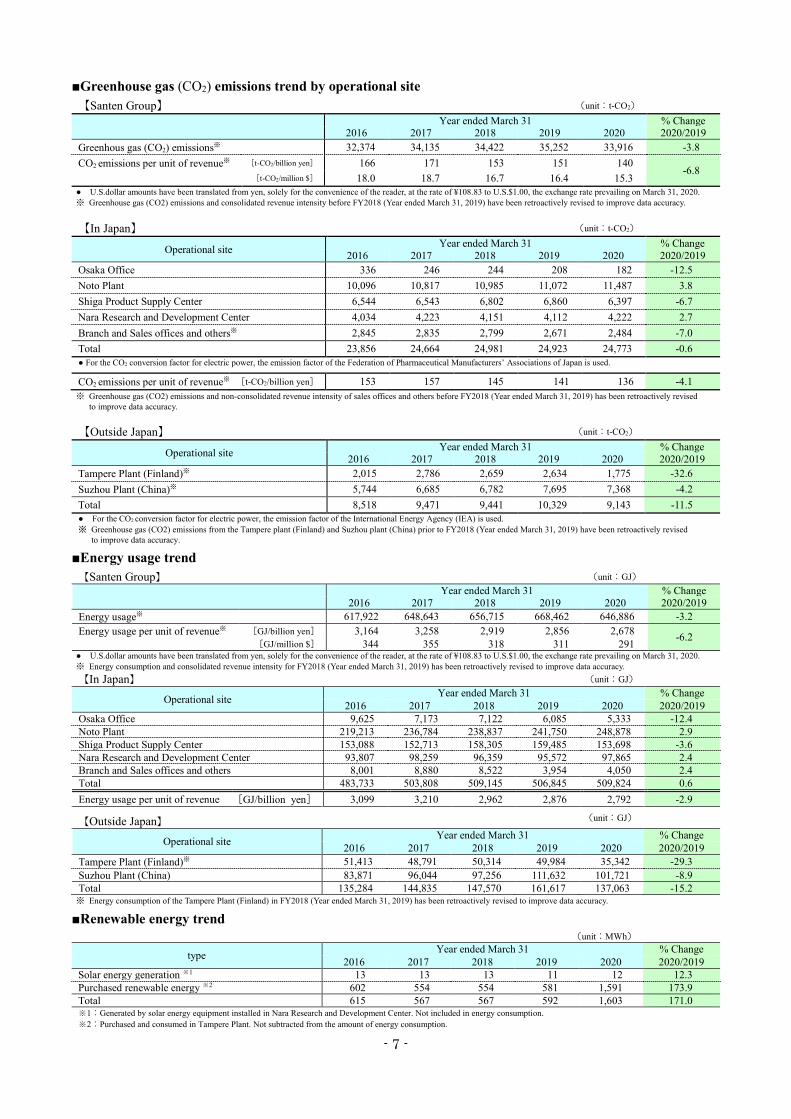
■Greenhouse gas (CO2) emissions trend by operational site 【Santen Group】 (unit:t-CO2) Year ended March 31 % Change 2016 2017 2018 2019 2020 2020/2019 Greenhous gas (CO2) emissions※ 32,374 34,135 34,422 35,252 33,916 -3.8 CO2 emissions per unit of revenue※ [t-CO2/billion yen] 166 171 153 151 140
-6.8 [t-CO2/million $] 18.0 18.7 16.7 16.4 15.3
● U.S.dollar amounts have been translated from yen, solely for the convenience of the reader, at the rate of ¥108.83 to U.S.$1.00, the exchange rate prevailing on March 31, 2020. ※ Greenhouse gas (CO2) emissions and consolidated revenue intensity before FY2018 (Year ended March 31, 2019) have been retroactively revised to improve data accuracy.
【In Japan】 (unit:t-CO2)
Operational site Year ended March 31 % Change 2016 2017 2018 2019 2020 2020/2019
Osaka Office 336 246 244 208 182 -12.5 Noto Plant 10,096 10,817 10,985 11,072 11,487 3.8 Shiga Product Supply Center 6,544 6,543 6,802 6,860 6,397 -6.7 Nara Research and Development Center 4,034 4,223 4,151 4,112 4,222 2.7 Branch and Sales offices and others※ 2,845 2,835 2,799 2,671 2,484 -7.0 Total 23,856 24,664 24,981 24,923 24,773 -0.6 ● For the CO2 conversion factor for electric power, the emission factor of the Federation of Pharmaceutical Manufacturers’ Associations of Japan is used.
CO2 emissions per unit of revenue※ [t-CO2/billion yen] 153 157 145 141 136 -4.1 ※ Greenhouse gas (CO2) emissions and non-consolidated revenue intensity of sales offices and others before FY2018 (Year ended March 31, 2019) has been retroactively revised
to improve data accuracy. 【Outside Japan】 (unit:t-CO2)
Operational site Year ended March 31 % Change 2016 2017 2018 2019 2020 2020/2019
Tampere Plant (Finland)※ 2,015 2,786 2,659 2,634 1,775 -32.6 Suzhou Plant (China)※ 5,744 6,685 6,782 7,695 7,368 -4.2 Total 8,518 9,471 9,441 10,329 9,143 -11.5 ● For the CO2 conversion factor for electric power, the emission factor of the International Energy Agency (IEA) is used. ※ Greenhouse gas (CO2) emissions from the Tampere plant (Finland) and Suzhou plant (China) prior to FY2018 (Year ended March 31, 2019) have been retroactively revised
to improve data accuracy.
■Energy usage trend 【Santen Group】 (unit:GJ) Year ended March 31 % Change 2016 2017 2018 2019 2020 2020/2019 Energy usage※ 617,922 648,643 656,715 668,462 646,886 -3.2 Energy usage per unit of revenue※ [GJ/billion yen] 3,164 3,258 2,919 2,856 2,678 -6.2 [GJ/million $] 344 355 318 311 291
● U.S.dollar amounts have been translated from yen, solely for the convenience of the reader, at the rate of ¥108.83 to U.S.$1.00, the exchange rate prevailing on March 31, 2020. ※ Energy consumption and consolidated revenue intensity for FY2018 (Year ended March 31, 2019) has been retroactively revised to improve data accuracy. 【In Japan】 (unit:GJ)
Operational site Year ended March 31 % Change 2016 2017 2018 2019 2020 2020/2019
Osaka Office 9,625 7,173 7,122 6,085 5,333 -12.4 Noto Plant 219,213 236,784 238,837 241,750 248,878 2.9 Shiga Product Supply Center 153,088 152,713 158,305 159,485 153,698 -3.6 Nara Research and Development Center 93,807 98,259 96,359 95,572 97,865 2.4 Branch and Sales offices and others 8,001 8,880 8,522 3,954 4,050 2.4 Total 483,733 503,808 509,145 506,845 509,824 0.6 Energy usage per unit of revenue [GJ/billion yen] 3,099 3,210 2,962 2,876 2,792 -2.9
【Outside Japan】 (unit:GJ)
Operational site Year ended March 31 % Change 2016 2017 2018 2019 2020 2020/2019
Tampere Plant (Finland)※ 51,413 48,791 50,314 49,984 35,342 -29.3 Suzhou Plant (China) 83,871 96,044 97,256 111,632 101,721 -8.9 Total 135,284 144,835 147,570 161,617 137,063 -15.2 ※ Energy consumption of the Tampere Plant (Finland) in FY2018 (Year ended March 31, 2019) has been retroactively revised to improve data accuracy.
■Renewable energy trend (unit:MWh)
type Year ended March 31 % Change 2016 2017 2018 2019 2020 2020/2019
Solar energy generation ※1 13 13 13 11 12 12.3 Purchased renewable energy ※2 602 554 554 581 1,591 173.9 Total 615 567 567 592 1,603 171.0 ※1:Generated by solar energy equipment installed in Nara Research and Development Center. Not included in energy consumption. ※2:Purchased and consumed in Tampere Plant. Not subtracted from the amount of energy consumption.
- 8 -
3.Reducing our Environmental Impact
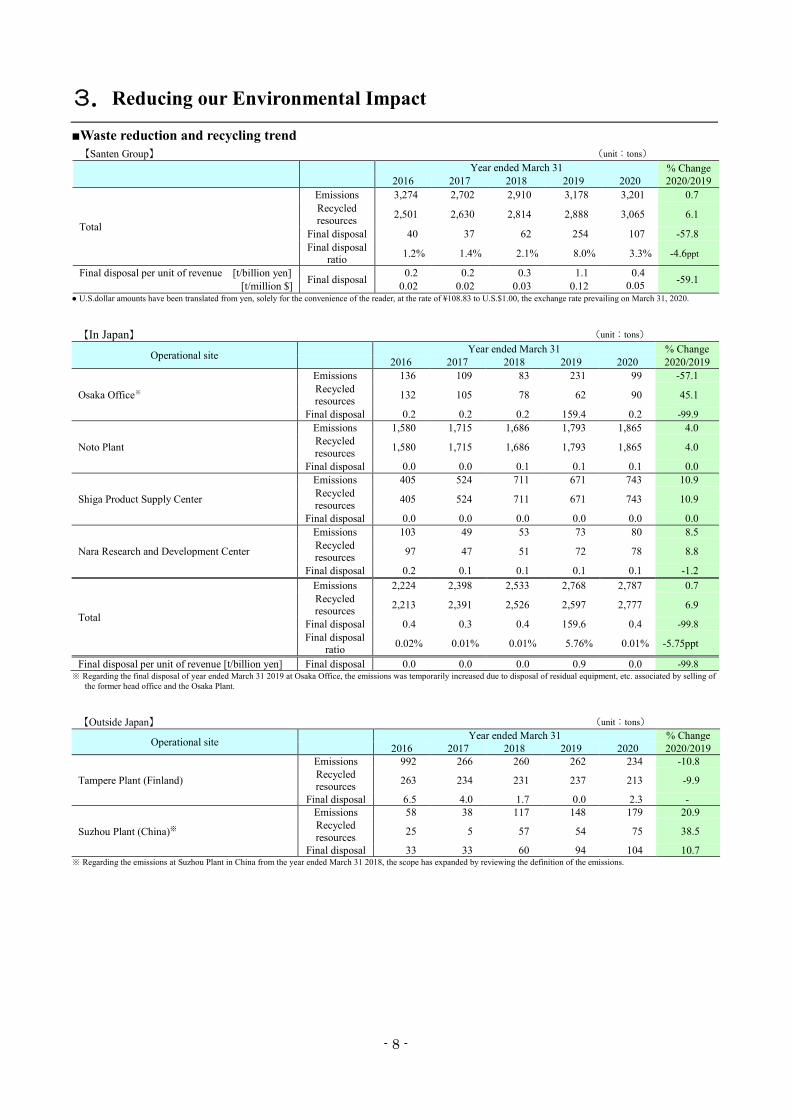
■Waste reduction and recycling trend 【Santen Group】 (unit:tons)
Year ended March 31 % Change 2016 2017 2018 2019 2020 2020/2019
Total
Emissions 3,274 2,702 2,910 3,178 3,201 0.7 Recycled resources 2,501 2,630 2,814 2,888 3,065 6.1
Final disposal 40 37 62 254 107 -57.8 Final disposal
ratio 1.2% 1.4% 2.1% 8.0% 3.3% -4.6ppt
Final disposal per unit of revenue [t/billion yen] Final disposal 0.2 0.2 0.3 1.1 0.4 -59.1 [t/million $] 0.02 0.02 0.03 0.12 0.05 ● U.S.dollar amounts have been translated from yen, solely for the convenience of the reader, at the rate of ¥108.83 to U.S.$1.00, the exchange rate prevailing on March 31, 2020.
【In Japan】 (unit:tons)
Operational site Year ended March 31 % Change 2016 2017 2018 2019 2020 2020/2019
Osaka Office※
Emissions 136 109 83 231 99 -57.1 Recycled resources 132 105 78 62 90 45.1
Final disposal 0.2 0.2 0.2 159.4 0.2 -99.9
Noto Plant
Emissions 1,580 1,715 1,686 1,793 1,865 4.0 Recycled resources 1,580 1,715 1,686 1,793 1,865 4.0
Final disposal 0.0 0.0 0.1 0.1 0.1 0.0
Shiga Product Supply Center
Emissions 405 524 711 671 743 10.9 Recycled resources 405 524 711 671 743 10.9
Final disposal 0.0 0.0 0.0 0.0 0.0 0.0
Nara Research and Development Center
Emissions 103 49 53 73 80 8.5 Recycled resources 97 47 51 72 78 8.8
Final disposal 0.2 0.1 0.1 0.1 0.1 -1.2
Total
Emissions 2,224 2,398 2,533 2,768 2,787 0.7 Recycled resources 2,213 2,391 2,526 2,597 2,777 6.9
Final disposal 0.4 0.3 0.4 159.6 0.4 -99.8 Final disposal
ratio 0.02% 0.01% 0.01% 5.76% 0.01% -5.75ppt
Final disposal per unit of revenue [t/billion yen] Final disposal 0.0 0.0 0.0 0.9 0.0 -99.8 ※ Regarding the final disposal of year ended March 31 2019 at Osaka Office, the emissions was temporarily increased due to disposal of residual equipment, etc. associated by selling of
the former head office and the Osaka Plant.
【Outside Japan】 (unit:tons)
Operational site Year ended March 31 % Change 2016 2017 2018 2019 2020 2020/2019
Tampere Plant (Finland)
Emissions 992 266 260 262 234 -10.8 Recycled resources 263 234 231 237 213 -9.9
Final disposal 6.5 4.0 1.7 0.0 2.3 -
Suzhou Plant (China)※
Emissions 58 38 117 148 179 20.9 Recycled resources 25 5 57 54 75 38.5
Final disposal 33 33 60 94 104 10.7 ※ Regarding the emissions at Suzhou Plant in China from the year ended March 31 2018, the scope has expanded by reviewing the definition of the emissions.

- 9 -
■Air pollutants emissions trend 【Santen Group】 (unit:tons)
Substance Year ended March 31 % Change 2016 2017 2018 2019 2020 2020/2019
SOx(sulfur oxides) ※1,2 10.1 8.3 6.1 2.2 1.8 -19.7 NOx(nitrogen oxides) ※1,2 7.9 7.5 8.3 4.0 3.9 -2.9 VOC(volatile organic compounds) ※2 65 36 36 41 46 10.4
【In Japan】 (unit:tons)
Substance Year ended March 31 % Change 2016 2017 2018 2019 2020 2020/2019
SOx(sulfur oxides) ※1 4.5 2.7 2.4 1.8 1.4 -20.9 NOx(nitrogen oxides) ※1 5.5 5.1 5.9 3.6 3.6 0.9 VOC(volatile organic compounds) 27 34 35 40 45 11.2 Dust 0.6 0.4 0.4 0.2 0.2 -9.1
【Outside Japan】 (unit:tons)
Substance Year ended March 31 % Change 2016 2017 2018 2019 2020 2020/2019
SOx(sulfur oxides) ※1,2 5.6 5.6 3.7 0.4 0.3 -13.5 NOx(nitrogen oxides) ※1,2 2.4 2.4 2.4 0.4 0.3 -34.1 VOC(volatile organic compounds) ※2 38.3 1.2 1.4 1.2 1.0 -16.7 ※1:Emission is estimated based on results from regular examinations. ※2:Suzhou Plant in China is excluded.
■Water pollutants emissions trend 【Santen Group】 (unit:tons)
Substance Year ended March 31 % Change 2016 2017 2018 2019 2020 2020/2019
BOD(biochemical oxygen demand) ※1,2 7.4 4.5 4.5 8.7 8.8 1.2 COD(chemical oxygen demand) ※1,2 11.1 5.4 4.8 7.5 7.1 -5.5
【In Japan】 (unit:tons)
Substance Year ended March 31 % Change 2016 2017 2018 2019 2020 2020/2019
BOD(biochemical oxygen demand) ※1 2.1 2.9 3.0 8.7 7.5 -13.7 COD(chemical oxygen demand) ※1 1.9 2.5 2.6 4.9 4.7 -4.8 SS(suspended solids) ※1 4.7 6.5 8.9 7.2 6.1 -16.0
【Outside Japan】 (unit:tons)
Substance Year ended March 31 % Change 2016 2017 2018 2019 2020 2020/2019
BOD(biochemical oxygen demand) ※1,2 5.3 1.6 1.5 0.0 1.3 - COD(chemical oxygen demand) ※1,2 9.2 2.9 2.2 2.6 2.4 -7.0 ※1:Emission is estimated based on results from regular examinations. ※2:Suzhou Plant in China is excluded.
■PRTR substances handled (in Japan) 【In Japan】 (unit:tons)
Substance Year ended March 31 % Change 2016 2017 2018 2019 2020 2020/2019
Acetonitrile 1.8 1.8 1.8 1.9 1.8 -3.6 Boron and its compounds 0.7 0.9 1.0 0.6 0.7 11.8 Xylene 0.2 0.1 0.6 0.1 0.2 352.0 Others 0.2 0.1 0.2 0.8 0.3 -57.7 Total※ 2.8 2.9 3.5 3.3 3.1 -7.6 ※ The data included chemical materials used more than 1 kg in a year. The number of substances over 1kg used per year 18 14 30 34 26 -23.5
■PCB storage We have no PCB-containing equipment in our business sites at July 2020. In March 2017, we completed, through a nationally designated service provider, appropriately disposing of the three PCB-containing fluorescent light ballasts that had been stored at our former Osaka Plant, and making them harmless.
- 10 -
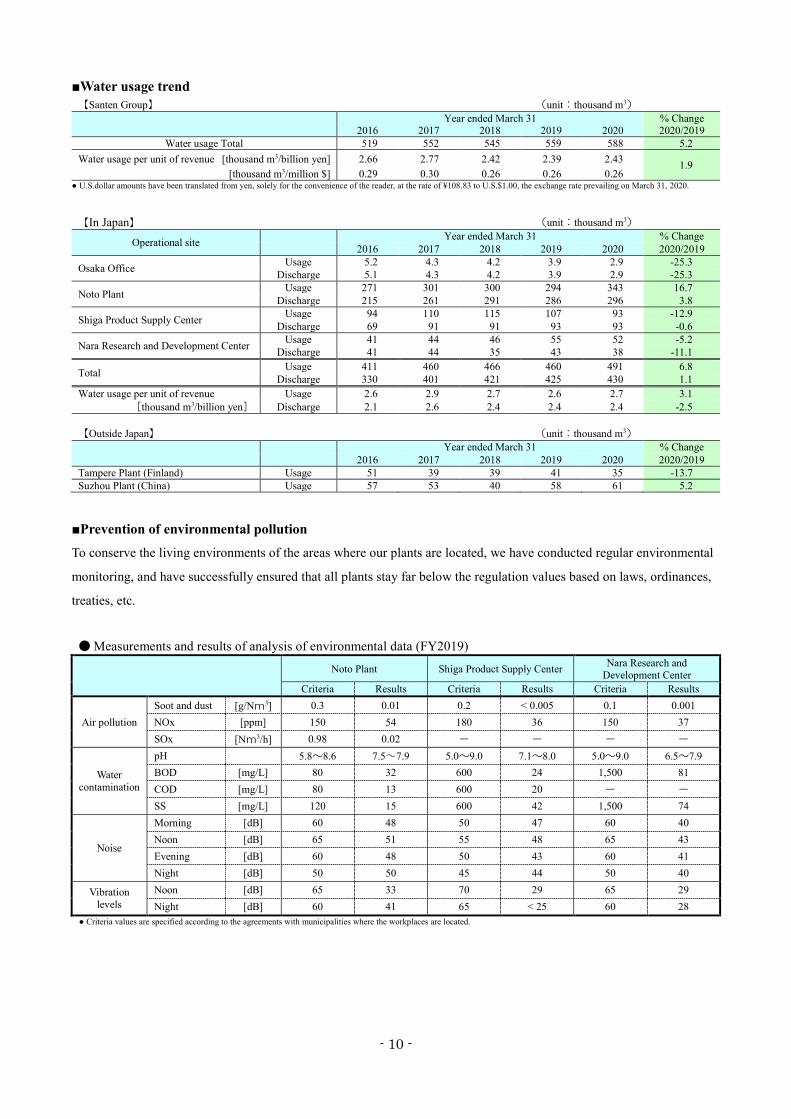
■Water usage trend 【Santen Group】 (unit:thousand m3)
Year ended March 31 % Change 2016 2017 2018 2019 2020 2020/2019
Water usage Total 519 552 545 559 588 5.2 Water usage per unit of revenue [thousand m3/billion yen] 2.66 2.77 2.42 2.39 2.43 1.9
[thousand m3/million $] 0.29 0.30 0.26 0.26 0.26 ● U.S.dollar amounts have been translated from yen, solely for the convenience of the reader, at the rate of ¥108.83 to U.S.$1.00, the exchange rate prevailing on March 31, 2020. 【In Japan】 (unit:thousand m3)
Operational site Year ended March 31 % Change 2016 2017 2018 2019 2020 2020/2019
Osaka Office Usage 5.2 4.3 4.2 3.9 2.9 -25.3 Discharge 5.1 4.3 4.2 3.9 2.9 -25.3
Noto Plant Usage 271 301 300 294 343 16.7 Discharge 215 261 291 286 296 3.8
Shiga Product Supply Center Usage 94 110 115 107 93 -12.9 Discharge 69 91 91 93 93 -0.6
Nara Research and Development Center Usage 41 44 46 55 52 -5.2 Discharge 41 44 35 43 38 -11.1
Total Usage 411 460 466 460 491 6.8 Discharge 330 401 421 425 430 1.1
Water usage per unit of revenue [thousand m3/billion yen]
Usage 2.6 2.9 2.7 2.6 2.7 3.1 Discharge 2.1 2.6 2.4 2.4 2.4 -2.5
【Outside Japan】 (unit:thousand m3)
Year ended March 31 % Change 2016 2017 2018 2019 2020 2020/2019
Tampere Plant (Finland) Usage 51 39 39 41 35 -13.7 Suzhou Plant (China) Usage 57 53 40 58 61 5.2
■Prevention of environmental pollution
To conserve the living environments of the areas where our plants are located, we have conducted regular environmental
monitoring, and have successfully ensured that all plants stay far below the regulation values based on laws, ordinances,
treaties, etc.
🔴🔴 Measurements and results of analysis of environmental data (FY2019) Noto Plant Shiga Product Supply Center Nara Research and
Development Center Criteria Results Criteria Results Criteria Results
Air pollution Soot and dust [g/Nm3] 0.3 0.01 0.2 < 0.005 0.1 0.001 NOx [ppm] 150 54 180 36 150 37 SOx [Nm3/h] 0.98 0.02 - - - -
Water contamination
pH 5.8~8.6 7.5~7.9 5.0~9.0 7.1~8.0 5.0~9.0 6.5~7.9 BOD [mg/L] 80 32 600 24 1,500 81 COD [mg/L] 80 13 600 20 - - SS [mg/L] 120 15 600 42 1,500 74
Noise
Morning [dB] 60 48 50 47 60 40 Noon [dB] 65 51 55 48 65 43 Evening [dB] 60 48 50 43 60 41 Night [dB] 50 50 45 44 50 40
Vibration levels
Noon [dB] 65 33 70 29 65 29 Night [dB] 60 41 65 < 25 60 28
● Criteria values are specified according to the agreements with municipalities where the workplaces are located.
- 11 -
4.Biodiversity
■Forest conservation activities
Because appropriate forest conservation contributes to not only facilitating the absorption of CO2 but also maintaining
the rich natural environment and headwater conservation capacity, leading to the protection of biodiversity, Santen Group
engages in forest conservation activities.
・Activities of Noto Plant
Noto Plant supports the Environmental Education Project to conserve nature at Mt. Hodatsu, organized by the board of
education of Hodatsushimizu Town, the local government of the area where it is located. Santen employees participate in
the project as helpers by leading local students in mountain climbing and cleaning.
・Activities of Shiga Product Supply Center
Santen calls for employees' participation in events held by a Shiga Prefecture-based NPO to offer practical training on the
management and use of satoyama forests and other matters.
■Local environmental clean-up activities
To contribute to the cleaning up and beautification of local environments, Santen's offices, laboratories and plants,
including the Noto Plant, the Shiga Product Supply Center and the Shimoshinjo Office, conduct clean-up activities in
collaboration with local governments and regional organizations.

- 12 -
【Reference】Environmental accounting(in Japan)
Scope: The cost and effect of Environmental preservation of Santen Pharmaceutical Co., Ltd. Period covered: April 1st, 2019 to March 31st 2020 Reference: Environmental Accounting Guideline (2005 edition, the Ministry of the Environment of Japan)
【Environmental conservation costs】 (unit:million yen)
category Year ended March 31, 2019 Year ended March 31, 2020
Investments Expenses Investments Expenses
Business area costs 23.3 223.4 35.8 159.6
Pollution prevention 0.0 57.7 0.3 47.0
Global environmental conservation 23.2 108.1 28.3 57.2
Resource circulation 0.1 57.6 7.2 55.5
Upstream/downstream costs — 12.9 — 10.0
Administration costs 0.1 67.1 1.1 91.2
R&D costs — — — —
Social activity costs — 0.6 — 1.4
Environmental damage costs — — — 0.1
Total 23.3 304.0 36.9 262.3 Only the cases that can be determined as related to the purpose of environmental conservation are included in the calculation. The cost includes the depreciation amount and was accounted for the same way as the accounting. Current investment includes both the investment amount and expense. Total number was only a rough estimation because the totals were rounded off. The employment cost of the environmental management department and operation and maintenance of the environmental management system was accounted for as
administration costs. “-” means no cost or no activities.
【Economic effects of environmental conservation measures】 (unit:million yen)
category Year ended March 31, 2019 Year ended March 31, 2020
Profits from sales of waste etc 80.3 90.5
Cost reductions 13.1 14.0
Only economic effects that can be determined with a high degree of certainty are included in the calculation.
- 13 -
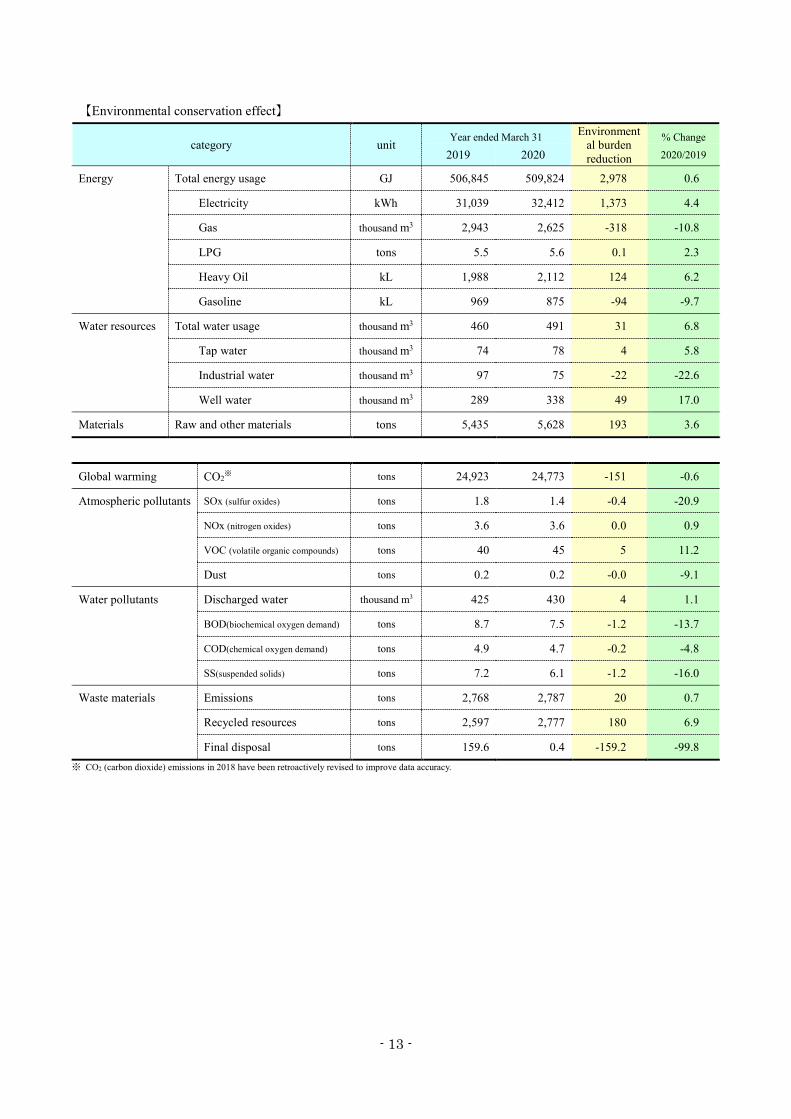
【Environmental conservation effect】
category unit Year ended March 31 Environment
al burden reduction
% Change 2019 2020 2020/2019
Energy Total energy usage GJ 506,845 509,824 2,978 0.6
Electricity kWh 31,039 32,412 1,373 4.4
Gas thousand m3 2,943 2,625 -318 -10.8
LPG tons 5.5 5.6 0.1 2.3
Heavy Oil kL 1,988 2,112 124 6.2
Gasoline kL 969 875 -94 -9.7
Water resources Total water usage thousand m3 460 491 31 6.8
Tap water thousand m3 74 78 4 5.8
Industrial water thousand m3 97 75 -22 -22.6
Well water thousand m3 289 338 49 17.0
Materials Raw and other materials tons 5,435 5,628 193 3.6
Global warming CO2※ tons 24,923 24,773 -151 -0.6
Atmospheric pollutants SOx (sulfur oxides) tons 1.8 1.4 -0.4 -20.9
NOx (nitrogen oxides) tons 3.6 3.6 0.0 0.9
VOC (volatile organic compounds) tons 40 45 5 11.2
Dust tons 0.2 0.2 -0.0 -9.1
Water pollutants Discharged water thousand m3 425 430 4 1.1
BOD(biochemical oxygen demand) tons 8.7 7.5 -1.2 -13.7
COD(chemical oxygen demand) tons 4.9 4.7 -0.2 -4.8
SS(suspended solids) tons 7.2 6.1 -1.2 -16.0
Waste materials Emissions tons 2,768 2,787 20 0.7
Recycled resources tons 2,597 2,777 180 6.9
Final disposal tons 159.6 0.4 -159.2 -99.8 ※ CO2 (carbon dioxide) emissions in 2018 have been retroactively revised to improve data accuracy.
店
Independent Assurance Report
To the President and Chief Executive Officer of Santen Pharmaceutical Co., Ltd.
We were engaged by Santen Pharmaceutical, Co., Ltd. (the "Company") to undertake a limited assurance engagement of the
environmental indicators marked with "V" (the "Indicators") for the period from April 1, 2019 to March 31, 2020, included in its
Environmental Data Book 2020 (the "Data Book") for the fiscal year ended March 31, 2020.
The Company's Responsibility
The Company is responsible for the preparation of the Indicators in accordance with its own reporting criteria (the "Company's
reporting criteria"), as described in the Data Book.
Our Responsibility
Our responsibility is to express a limited assurance conclusion on the Indicators based on the procedures we have performed. We
conducted our engagement in accordance with the'International Standard on Assurance Engagements (ISAE) 3000, Assurance
Engagements other than Audits or Reviews of Historical Financial Information' and the'ISAE 3410, Assurance Engagements on
Greenhouse Gas Statements' issued by the International Auditing and Assurance Standards Board. The limited assurance
engagement consisted of making inquiries, primarily of persons responsible for the preparation of information presented in the
Data Book, and applying analytical and other procedures, and the procedures performed vary in nature from, and are less in extent
than for, a reasonable assurance engagement. The level of assurance provided is thus not as high as that provided by a reasonable
assurance engagement. Our assurance procedures included:
● Interviewing the Company's responsible personnel to obtain an understanding of its policy for preparing the Data Book and
reviewing the Company's reporting criteria.
● Inquiring about the design of the systems and methods used to collect and process the Indicators.
● Performing analytical procedures on the Indicators.
● Examining, on a test basis, evidence supporting the generation, aggregation and reporting of the Indicators in conformity with
the Company's reporting criteria, and recalculating the Indicators.
● Making inquiries and reviewing materials including documented evidence of one of the Company's plants selected on the
basis of a risk analysis, as alternative procedures to site visits.
● Evaluating the overall presentation of the Indicators.
Conclusion
Based on the procedures performed, as described above, nothing has come to our attention that causes us to believe that the
Indicators in the Data Book are not prepared, in all material respects, in accordance with the Company's reporting criteria as
described in the Data Book.
Our Independence and Quality Control
We have complied with the Code of Ethics for Professional Accountants issued by the International Ethics Standards Board for
Accountants, which includes independence and other requirements founded on fundamental principles of integrity, objectivity,
professional competence and due care, confidentiality and professional behavior. In accordance with International Standard on
Quality Control 1, we maintain a comprehensive system of quality control including documented policies and procedures regarding
compliance with ethical requirements, professional standards and applicable legal and regulatory requirements.
”/J/(1 fj1"二乙崖こ.ぺ ニ.
/ KPMG AZSA Sustainability Co., Ltd.
Osaka, Japan
December 14, 2020
- 14 -