Embed Size (px)
Citation preview

1
Keywords: heat stress
ENVIRONMENTAL ENGINEERING TO REDUCE HEAT STRESSIN DAIRY CATTLE
Wei Fang,Department of Bio-Industrial Mechatronics Engineering
National Taiwan University,1, Section 4, Roosevolt Rd., Taipei, Taiwan ROC
ABSTRACT
To reduce heat stress in dairy cattle requires a multi-disciplinary approach. It should in-clude breeding, nutrition, structural design of the shed, environmental controls, and management.This Bulletin will focus on the introduction of engineering fundamentals related to the use of moistair and water for cooling. It describes some technologies which can be used to reduce heat stressin dairy cattle. Software which can be downloaded from the Internet is introduced. Equations,Tables and Figures are provided to help readers in the design process of their approach to reduc-ing heat stress in dairy cattle.
������������
The impact of heat stress on estrous behavior,conception rates and the lactation of dairy cattle ishuge. A great deal of research has been done toreduce such stress. The financial losses of dairyfarmers because of the lower pregnancy rates andmilk yields in dairy cattle suffering from heat stressare well known. Research suggests that an inte-grated approach is required in order to reduce heatstress.
This Bulletin will first focus on the engi-neering background related to the use of water andmoist air to cool the environment. Second, it willdiscuss various means of reducing heat stress indairy cattle, including some newly developed meth-ods.
������� ���� ��� ��� �� ��� ��
� ��� ��� ������ ��
Psychrometric properties of moist air
Psychrometric charts are tools from whichengineers derive the thermodynamic properties ofmoist air. Such properties include dry bulb, wet bulband dew point temperatures, absolute and relativehumidity, specific volume, vapor pressure and satu-rated vapor pressure. At a given atmospheric pres-sure, other properties can be derived, given twoindependent properties. Charts with only threeatmospheric pressures are available. They are: at sea
level (one atmospheric pressure), and middle alti-tude and high-altitude atmospheric pressure.
Software called ‘Psychart’, shown in Fig.1, was developed to replace these charts. Thissoftware allows users to assign different atmosphericpressures, thus making it more accurate in practicalapplications. As shown in Fig. 2, users can entereither the pressure value or the altitude, in eithermetric or English units.
The tables below provide users with easyaccess to the thermodynamic properties, under regu-lar summer conditions, of tropical and subtropicalclimates at 1 atmospheric pressure. Under otherpressure conditions, the program must be re-run.
Table 1 shows wet bulb temperature (Twb)with given ranges of dry bulb temperature (Tdb) andrelative humidity (RH). Table 2 shows the RH withgiven ranges of Tdb and Twb.
The pad and fan system, misting and fog-ging are cooling methods based on evaporativecooling. The limitation of this approach is the wetbulb depression (WBD) of the air conditions. WBDis the difference between Tdb and Twb. Table 3shows WBD at various Tdb and RH.
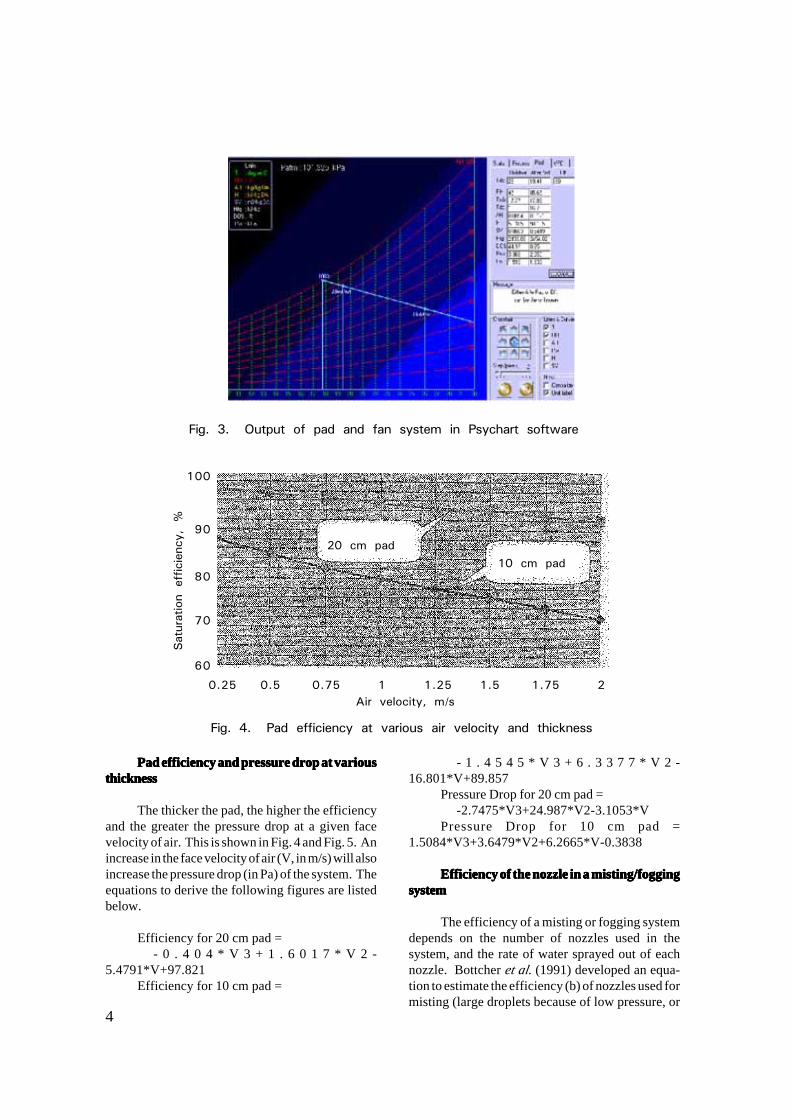
The efficiency of the pad and fan system isdefined as the (Tdb-outdoor-Tdb-after pad) overWBD. In Fig. 3, the assigned Tdb-outdoor equals26oC, while RH equals 45%. The derived Twb is17.77 oC, thus, WBD equals 8.23 oC. An 80%efficiency pad means the Tdb-after pad equals 26 -0.8 * WBD = 26-0.8 * 8.23 = 19.42oC.

2
����� �� ������ �� ����������� ����
����� �� ������� ������� ������ ���� ������ ��� ������ ����������� ��������
Pad efficiency at various facing velocities
Trumbull et al. (1986) developed equationsto predict the efficiency of three commercially avail-able cooling pads as a function of the air velocity (V,in m/s). Although no information is available in thereport about how thick the pads were, they wereprobably all around 10 cm thick. The equations areas follows:
Eff = 86.62 – 20.787 * V + 2.755 * V2
for Cooling Pad A (made from cellulosepaper with honey comb configuration)
Eff = 91.034- 17.91 * V +5231 * V2
for Cooling Pad B (made from cellulose paper sheets)
Eff = 76.055 + 2.909 * V – 17.414 * V2
for Excelsior Cooling Pad CMannix (1981) found that the water flow
rate through a pad had no effect on the evaporatorpad performance, as long as the water was evenlydistributed and the pad was fully saturated. Incontrast, Trumbull et al. (1986) did find that theefficiency of the pads varied with different waterflow rates. At low water flow rates (0.57 – 1.53 L/s),the efficiency fell when the face velocity increasedfrom 0.2 to 1 m/s. At high water flow rates (2.16 –3.33 L/s), the efficiency remained the same whenface velocity increased from 0.2 to 1 m/s.
The blow-off of water from the pad oc-curred at 1 m/s for the excelsior pad, 1.6 m/s forcooling pad A and 2 m/s for cooling pad B (Trumbullet al. 1986).

3
���� �� ���� �������� �� ������ ���� ��!�""
���� ��� #$� �%!��!!&�
�! �� �" �' �( )! )� )" )' )( "! "� ""
%! �)�*+ �%�)+ �* �(�'� �!��� ���(" �)�"' �%�!+ �'�*) �(�)( )!�!" )��* ))�)(
%% �"�"* �'��� �*�** �+�") ���!( ���*% �"�"� �'�!+ �*�*( �+�"* )���( )��(+ )"�'�
'! �%��% �'�(" �(�%) �!��) ���+) �)�') �%�)" �*�!' �(�*+ )!�%) )���( )"�!" )%�(�
'% �%�(� �*�%" �+��* ���!� ���*% �"�"+ �'��% �(�!� �(�*( )��%' ))�)% )%��' )'�+*
*! �'�"% �(��� �+�++ ���** �)�%% �%�)) �*��) �(�+) )!�*" )��%' )"�)+ )'��" )(�!+
*% �*�!+ �(�+ �!�* ���%� �"�)) �'��% �*�++ �+�() )��'* ))�%) )%�" )*��( )+��*
(! �*�*� �+�%' ���" �)��% �%�� �'�+' �(�(� )!�* )��%+ )"�"( )'�)+ )(�) "!��)
(% �(�)) �!�� ���!( �)�+' �%�(% �*�*" �+�'" )��%' ))�"( )%�"� )*�)% )+�) "���'
+! �(�+) �!�(" ���*% �"�'* �'�%+ �(�%� )!�"% )��)+ )"�)% )'�)� )(��( "!��* "���'
+% �+�%) ���"* �)�"� �%�)' �*�)� �+��* )���" ))��� )%�� )*��+ )+�� "���� ")��"
�!! �! �� �" �' �( )! )� )" )' )( "! "� ""
���� �� #$� ���� &�� �� ������ ���� ��� ���� ��!�""���
�! �� �" �' �( )! )� )" )' )( "! "� ""
�! �!! (��') '+�!� %*�'� "(�!� )+�(+ )) �*��" ����" �*�(+ �"��' ����* (�%%
�� ,-. �!! ()�"+ *!�"( %+�"( %!��) "���' )%�)% �+�%� �"�%� �!��" �'�%* �)�"�
�" ,-. ,-. �!! ("�)" *��(" '���( %��!' ""��) )*�"+ )��'+ �'�'+ ���)( �(�'*
�' ,-. ,-. ,-. �!! (%��* *)��� '��*% %)�() "'��� )+�"% ))�'( �(�'* �"�)"
�( ,-. ,-. ,-. ,-. �!! (%�+( *"�) '"��� %%�"% "*�(% "���" )%�"+ )!�"(
)! ,-. ,-. ,-. ,-. ,-. �!! ('�*( *%�") '%�%' %'�+% "+�"" "��(( )*��)
)� ,-. ,-. ,-. ,-. ,-. ,-. �!! (*�%' *'�"+ ''�(� %(�)) %!�(+ ""�)'
)" ,-. ,-. ,-. ,-. ,-. ,-. ,-. �!! ((�)� **�"+ '*�+' %+�%( %���+
)' ,-. ,-. ,-. ,-. ,-. ,-. ,-. ,-. �!! (+�!) *(�)+ '(�++ '!�'(
)( ,-. ,-. ,-. ,-. ,-. ,-. ,-. ,-. ,-. �!! (+�'* *+��( '+�(*
"! ,-. ,-. ,-. ,-. ,-. ,-. ,-. ,-. ,-. ,-. �!! +!��+ *+�(�
"� ,-. ,-. ,-. ,-. ,-. ,-. ,-. ,-. ,-. ,-. ,-. �!! +!�%*
"" ,-. ,-. ,-. ,-. ,-. ,-. ,-. ,-. ,-. ,-. ,-. ,-. �!!
���� )� /0�� �� ������ ���� ��!�""���� ��� #$� �%!��!!&�
�! �� �" �' �( )! )� )" )' )( "! "� ""
%! '��� '�'� * *�)+ *�*( (��' (�%" (�+� +��* +�'� +�+' �!�) �!�'�
%% %�%) %�(( '��) '�%* '�+� *��% *�%( *�+� (��� (�%) (�(� +��� +�)(
'! "�(% %��' %�"* %�** '�!* '�)* '�'' '�+" *��� *�"* *�*� *�+' (��+
'% "��+ "�"' "�*) "�++ %��% %�%� %�*% %�++ '��� '�"" '�'% '�(" *�!)
*! )�%% )�*( "�!� "��) "�"% "�'* "�(* %�!* %��' %�"" %�'� %�*' %�+�
*% ��+� )�� )�) )�"+ )�'* )�(% "�!� "��* "�)) "�"* "�' "�*� "�()
(! ���+ ��"" ��' ��*% ��+ )�!" )��( )�) )�"� )�%� )�'� )�* )�**
(% ��'* ��( ��+� ��!" ���% ���' ��)' ��"" ��%� ��%+ ��'% ��* ��*"
+! ��!* ���' ���% ��)) ��"� ��"+ ��%% ��'� ��'% ��'+ ��*� ��*) ��*"
+% !�"* !�%) !�%+ !�'" !�'+ !�*) !�*' !�*+ !�( !�(� !�( !�*+ !�*'
�!! ! ! ! ! ! ! ! ! ! ! ! ! !
4
Pad efficiency and pressure drop at variousPad efficiency and pressure drop at variousPad efficiency and pressure drop at variousPad efficiency and pressure drop at variousPad efficiency and pressure drop at variousthicknessthicknessthicknessthicknessthickness
The thicker the pad, the higher the efficiencyand the greater the pressure drop at a given facevelocity of air. This is shown in Fig. 4 and Fig. 5. Anincrease in the face velocity of air (V, in m/s) will alsoincrease the pressure drop (in Pa) of the system. Theequations to derive the following figures are listedbelow.
Efficiency for 20 cm pad =- 0 . 4 0 4 * V 3 + 1 . 6 0 1 7 * V 2 -
5.4791*V+97.821Efficiency for 10 cm pad =
- 1 . 4 5 4 5 * V 3 + 6 . 3 3 7 7 * V 2 -16.801*V+89.857
Pressure Drop for 20 cm pad =-2.7475*V3+24.987*V2-3.1053*V
Pressure Drop for 10 cm pad =1.5084*V3+3.6479*V2+6.2665*V-0.3838
Efficiency of the nozzle in a misting/foggingEfficiency of the nozzle in a misting/foggingEfficiency of the nozzle in a misting/foggingEfficiency of the nozzle in a misting/foggingEfficiency of the nozzle in a misting/foggingsystemsystemsystemsystemsystem
The efficiency of a misting or fogging systemdepends on the number of nozzles used in thesystem, and the rate of water sprayed out of eachnozzle. Bottcher et al. (1991) developed an equa-tion to estimate the efficiency (b) of nozzles used formisting (large droplets because of low pressure, or
����� )� 1������ �2� ��� ��� 2�� � ����� ��� �� ����� ��2����
����� "� ��� �22������ � �� ������ ��� ����� � ��� ����3����
�!� ��� ��
�!� ��� ��
�!!
+!
(!
*!
'!
!��% !�% !�*% � ���% ��% ��*% �
.��� ����� 4� �-�
5���������22������ 4�&
5
large holes in the nozzle) or fogging (small dropletsbecause of high pressure and small holes in thenozzle), with respect to water pressure (P, in kPa).The equation is listed below.
b = 0.124 + 1.35 * 10-4*PAt 35 atmospheric pressure, the efficiency
is around 60%. When P equals 64.888 atmosphericpressure (64.888 * 100 kPa), the nozzle efficiency(b) reaches 100%, assuming 1 atmospheric pressureequals 0.1 MPa. Considering some friction loss, anatmospheric pressure of 70 is recommended forhigh-pressure fogging.
Temperature humidity index (THI)
Both the rectal temperature and milk produc-tion of dairy cows are in direct proportion to the THI(Igono et al. 1985; Knapp and Grummer 1991).Dairy cattle are considered to be suffering from heatstress at a THI higher than 70-72oC (Ingraham et al.1974; Johnson 1985, Stott 1981). Conception ratesfall when the monthly average THI is higher than 62(du Preez et al. 1991). Below are two equations tocalculate the THI.
THI = T (in oF) -0.55 * (100-RH%)/100 *(T-58) (Ingraham et al. 1974)
THI = Tdb (in oC) + 0.36 * Tdp (in oC) +41.2 (Armstrong 1994)
Both equations required two environ-men-tal factors. The first equation requires dry bulbtemperature (in degrees Fahrenheit) and relativehumidity (as a percentage). The second equationrequires dry bulb and dew point temperatures, bothin degrees Centigrade. Please note that the THIshould not be expressed as a unit, whether oF or oC.The results of the above equations are not alwaysconsistent, as listed below. The THI values ofIngraham’s equation are always larger than thevalues calculated using Armstrong’s equation. Thedifference is more marked as the THI values becomelarger, as shown in Table 4.
Linvill and Pardue (1992) developed an
equation to predict milk production, based on theprevious four days’ THI information, as shown be-low.
MP (in kg/day/cow) = 21.48 – 0.051 *0.0099 * HA80S
where, 21.48 = regular milk production in kgper day per cow;
HD74: total hours of THI>74 for the last 4days;
HA80S = square of total hours of THI > 80for previous day.
A different equation, developed by Berry(1964), and listed in ASAE standards (1988), islisted below:MPD = 1.08 – 1.736 NL + 0.02474 (NL)
(THI)where, MPD: decrease in milk production per
cow per day, in kg/day/cow;NL: daily milk yield under no heat stress, in
kg/day/cow;THI: Temperature humidity index
Table 5 shows the MPD values for threelevels of NL values, assuming daily milk yields are20, 25 and 30 kg/day/cow. It is quite obvious thatat a fixed THI, the daily milk increases with anincrease in NL. This indicates that heat stress affectshigh-yielding cows the most, in terms of lower milkproduction (MPD). Furthermore, daily milk yieldsincrease when the temperature humidity index (THI)rises, at the same level of NL.
Black globe temperature (BGT)
The black globe temperature (BGT) repre-sents the combined effect of dry bulb temperature,average radiation and average wind velocity. It isnormally used to quantify the effect of shading. Theblack globe temperature does not consider the effectof humidity. When the BGT is less than 25oC, forcedventilation has no effect in reducing the body andrectal temperatures of cattle. When the temperatureof the surrounding environment (the 1.8 m above
���� "� ���������� �2� �$6� �7������
�4��� #$& ��� ��� �$6
*(�(��8 "%& �$6 8*��%! �6�����9�� �7������
�'�� �*�*
�� �)
�� �$68 *��(( �.��������9�� �7������
�!"��8 �!!& �$68�!" �6�����9�� �7������
"!�� "!
�� �$68 +%�' �.��������9�� �7������

6
ground level inside the dairy barn) of cattle reaches36oC, forced ventilation can reduce the rate ofincrease in rectal temperature by half as BGT in-creases (Berman 1985).
Wet bulb globe temperature (WBGT)
The wet bulb globe temperature (WBGT) is amore useful index than THI or BGT. It takes intoconsideration the dry bulb temperature, humidity,radiation and wind velocity. A heat stress monitor(Fig. 5) was used to calculate WBGT, using separateequations depending on whether the device was inthe shade or exposed to sunlight. The equations arelisted below.
WBGT indoors = 0.7 * Twb + 0.3 * BGTWBGT outdoors = 0.7 * Twb + 0.2 * BGT
+ 0.1 * Tdbwhere, WBGT, Twb, Tdb, BGT are in oC.
The WBGT was used in studies of “stay-time” for an individual performing various tasks invarious levels of heat (PHEL). It was also used instudies of permissible heat exposure threshold limitvalues by the Heat Stress Division at the NavalMedical Research Institute of the US Navy.
�� ���� ��� ���� ��
There is no single method of reducing heatstress in cattle and other animals. The only success-ful approach is an integrated approach.
Structure
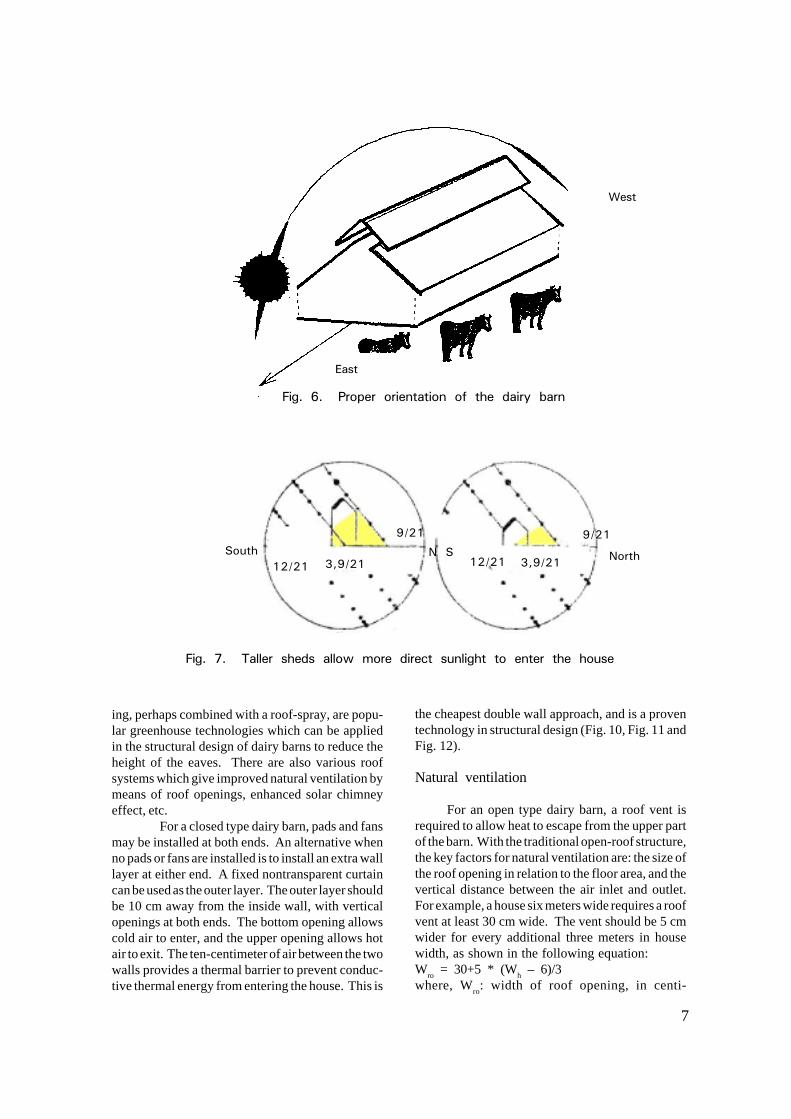
The longer side of the dairy barn should havean east-west orientation. This reduces the amount ofdirect sunlight shining on the side walls or enteringthe house, as shown in Fig. 6.
Painting the roof white may increase thelevel of sunlight reflected, thus reducing the amountof absorbed solar energy (All heat at the same wavelength must be either reflected or absorbed, soincreasing the amount of reflected heat reduces theamount of heat absorbed).
An open type dairy barn should be shieldedfrom direct sunlight as much as possible by meansof side curtains. As shown in Fig. 7 taller sheds allowmore direct sunlight to enter the house.
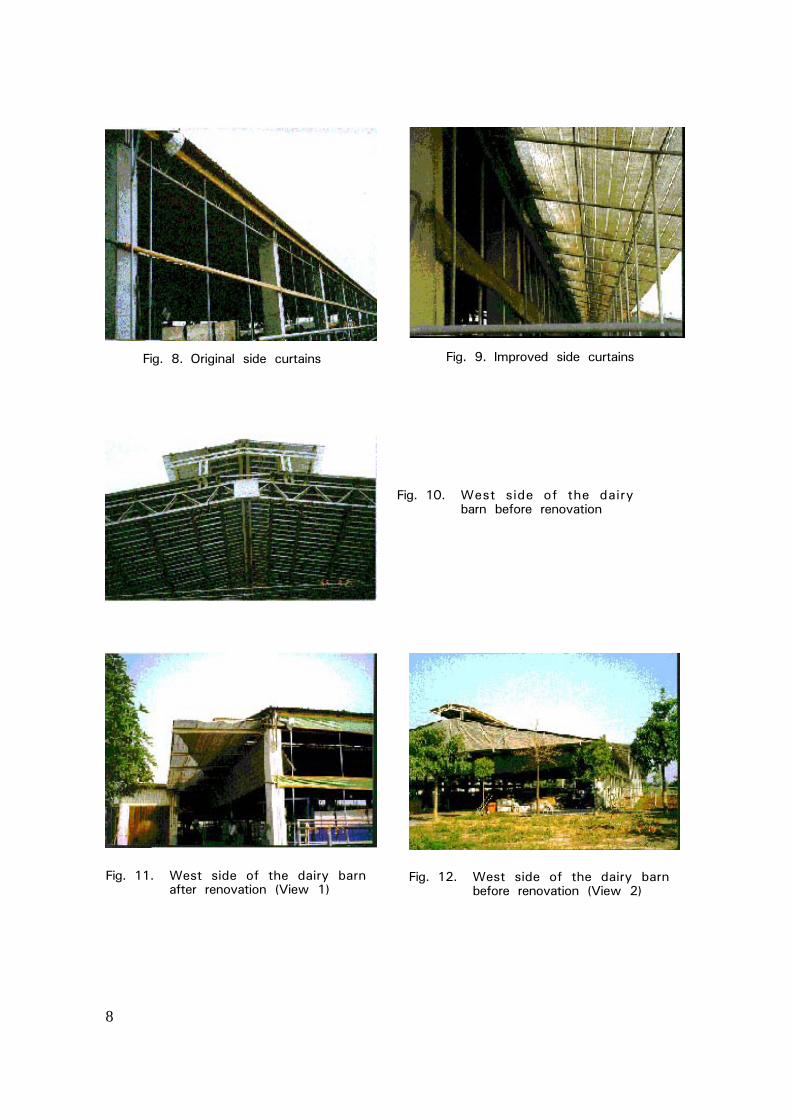
Side curtains are the cheapest way of pre-venting sunlight from entering the house. Installingthe side curtains on the support posts (Fig. 8) giveslittle protection when the curtains are rolled up.However, the eaves can be extended with shadingmaterial (Fig. 9), and the vertical shading moved tothe outside of the eaves. This gives much betterprotection from the sun. The west side of the barncan also be fitted with side and vertical curtains.
Tall structures (with eaves more than 3.5meters high) are not economically viable. There areother ways of removing the hot air trapped under theroof inside the building. Outer coverings and shad-
���� %� :������ ;��� 2��� )� � ��� �2� ,<� ������ ������ �� ��������� ����������
���8)'�� ���8)'
�� ���8)!
�� ���8�"
��
;��4� 3�-���-� #$8+!& #�8%!& #$8*!& #$8+!&
�$68(+�% �$68(%�+ �$68*+�+ �$68*)��
,<� 8� �!� 3�-���-� ;��8�!�' ;��8� (�( ;��8%�+ ;��8��'
,<� 8� �%� 3�-���-� ;��8�) ;��8�!�( ;��8*�� ;��8)�!
,<� 8� )!� 3�-���-� ;��8�%�" ;��8���* ;��8(�) ;��8)�)
����� %� $��� ������� ��������� � �������� �2�� ��� �� � ���4� ��3� ������� ���� ���� ����������� ������
7
ing, perhaps combined with a roof-spray, are popu-lar greenhouse technologies which can be appliedin the structural design of dairy barns to reduce theheight of the eaves. There are also various roofsystems which give improved natural ventilation bymeans of roof openings, enhanced solar chimneyeffect, etc.
For a closed type dairy barn, pads and fansmay be installed at both ends. An alternative whenno pads or fans are installed is to install an extra walllayer at either end. A fixed nontransparent curtaincan be used as the outer layer. The outer layer shouldbe 10 cm away from the inside wall, with verticalopenings at both ends. The bottom opening allowscold air to enter, and the upper opening allows hotair to exit. The ten-centimeter of air between the twowalls provides a thermal barrier to prevent conduc-tive thermal energy from entering the house. This is
the cheapest double wall approach, and is a proventechnology in structural design (Fig. 10, Fig. 11 andFig. 12).
Natural ventilation
For an open type dairy barn, a roof vent isrequired to allow heat to escape from the upper partof the barn. With the traditional open-roof structure,the key factors for natural ventilation are: the size ofthe roof opening in relation to the floor area, and thevertical distance between the air inlet and outlet.For example, a house six meters wide requires a roofvent at least 30 cm wide. The vent should be 5 cmwider for every additional three meters in housewidth, as shown in the following equation:W
ro = 30+5 * (W
h – 6)/3
where, Wro
: width of roof opening, in centi-
����� '� ������� ����������� �2� ���� ��� � ���
/���
=��
����� *� ���� ������ ��� ����� ������� �������� ��� ������ ���� �����
5����
)4+-��
+-��
��-��,����
+-��
)4+-����-��,� 5
8
����� (� 1������ ����� ������� ����� +� 6���� ��� ����� �������
����� �!� /���� ����� �2� ���� ��� ���� ��2���� ���� ����
����� ��� /���� ����� �2� ���� ��� � ���2���� ���� ����� �:���� ��
����� ��� /���� ����� �2� ���� ��� � �����2���� ���� ����� �:���� ��

9
meters;W
h: width of dairy house, in meters.
A simple model exists to predict thermally-induced natural ventilation where there is only oneinlet and one outlet. However, use of this modelshould be limited to making initial or field esti-mates. If the inlet and outlet are equal in size andthere is no wind, airflow can be estimated by theequation listed below (Albright 1990).
V = 2 * A * (C/0.65) * [g * h * (Ti – To)/Ti]1/2
where V is in m3/5, g is the gravitational con-stant, A is the area of one of the openings, C is thecoefficient of discharge of each opening, h is thedistance, m, between the two openings, and Ti andTo are indoor and outdoor air temperature, K, respec-tively. If the two openings are not equal, the smallerof the two is used in the above equation. V isadjusted by multiplying (1 + % increase in flow).The % increase in flow can be calculated using theregression equation shown in Fig. 13.
Various kinds of roof vent are available.These include a double roof with tiny holes (Fig. 14)and a wind-driven rotating roof vent (Fig. 15).Rotating roof vents are quite popular in Taiwan.However, some manufacturers do not understandthe principle of the solar chimney, so performanceof the system varies from one brand to another.
Cooling systems
Forced ventilation
In an open type dairy barn, fans can be in-stalled the length of the house and tilted at no morethan 30 degrees. It should be noted that the airtemperature inside a barn is higher in the upper partthan down near the ground, because hot air rises. Airdensity decreases when the temperature increases. Ifthe fans have too much tilt, the heated air in theupper layer will be brought down around the dairycattle. One way to prevent this, while still usinglarge fans tilted at an angle, is to install a high-pressure fogging system under the roof. The foggersshould be facing downwards or horizontally (Fig.16). The fog will evaporate, thus reducing thetemperature of the air in the upper part of the barnwithout increasing the humidity of the air aroundthe cattle.
A movable fan system was developed toprovide breeze to the cattle, sometimes just at mealtimes and sometimes all the time. Two fans per setwere installed, with 10 meters between each set. Onefan in the set faced the feed, and the other fan wastrained on the necks of the cattle, as shown in Fig.17. One motor was used to drive four sets of fans, thenumber suited to the dimensions of the dairy barn.In other applications, the same motor can drive upto ten sets of fans. The system has been working
����� �)� ���������� �������� ��� 2��� ��� ��������� ����� �2� �������������� ��
#���� �2� �������������� ��4� ��� ���� ���
&������������2��
8�!��'(*>�� ?� )��%"�>
)� �� ����+">
��?
*��!+(>� �� %��*%
#�� 8� !�+++*
� � ) " % '
"!
)%
)!
�%
�!
�%
�!
%
!

since 1995, and no failure has been found up to now(2002).
Pad and fan system
In a closed type dairy barn, an evaporativecooling system is required in tropical and subtropi-cal climates. The pad and fan system is one possi-bility. The usefulness of the pad system depends onthe local climate and the efficiency of the pad. Ifexpensive imported pads are used, the efficiency is80% for a ten-centimeter pad at 1.5 m/s suggestedface velocity, and about 90% for 15-centimeter padat 2.5 m/s suggested face velocity.
The potential of the pad system in Taiwanwas investigated by the author, based on localclimate (using 10 years of hourly weather data)(Fang 1994).
High humidity is not necessarily accompa-nied by temperatures. This is true in other placesbesides Taiwan. This is the reason why evaporativecooling systems are still useful, even in hot, humidareas such as Taiwan.
However, how good is the evaporativecooling system? What can we expect in terms ofreducing air temperature by means of a pad? Fig. 18attempts to show this in a diagram, which is rathermisleading. First, in Taiwan, we don’t have humid-ity as high as 30%, while our highest temperature ismore than 35oC. Thus, it is reasonable to expect atemperature drop of 5oC at 100% ‘pad efficiency'.For example, in Tainan (south Taiwan), for 92% ofthe year one should not expect the fall in tempera-ture of air passing the pad to exceed 4oC, assuming80% efficiency.
Lowering the temperature of the water usedin the pad system has little effect on the temperatureof the air passing through the pad.
Fogging multi-layer net and fan system
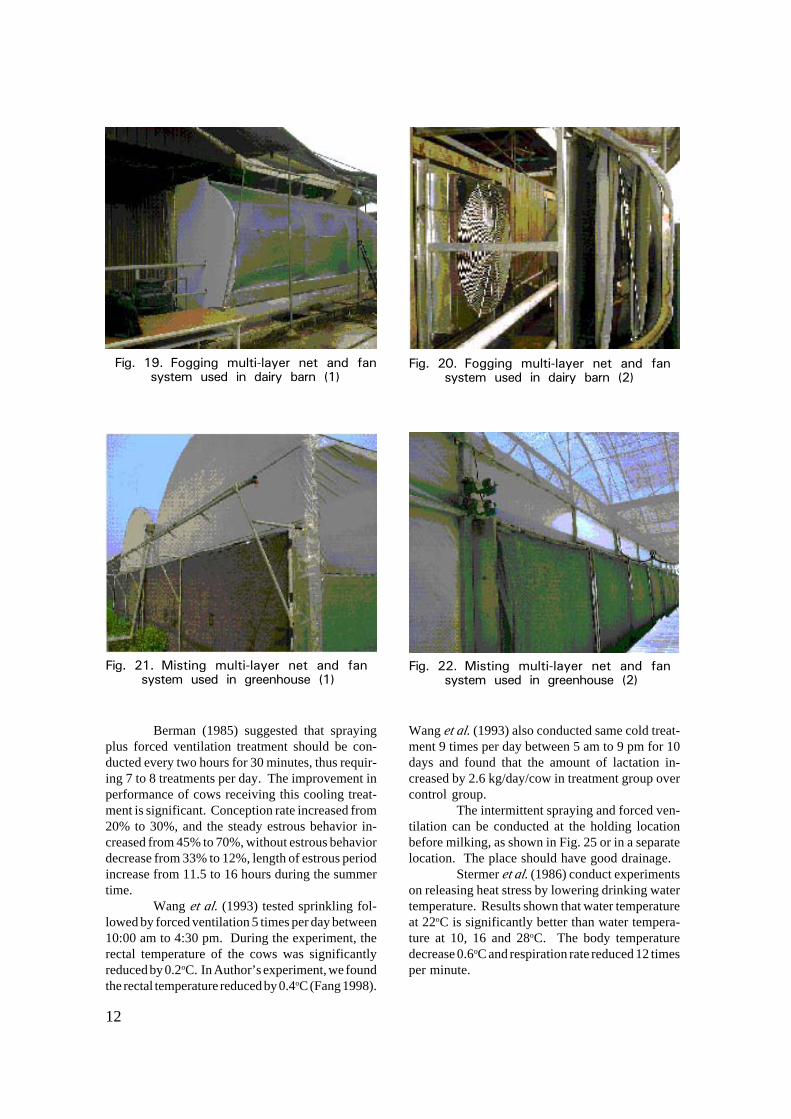
In Taiwan, we have tried different materials toreplace expensive imported pads. One promisingsystem, a fogging multi-layer net and fan systemdeveloped by the author, was patented in 2001.
The efficiency of the system reaches 92.5%,which is higher than either the ten-centimeter or 15-centimeter pad system. The fogging multi-layer netand fan system can be used with either negativepressure or positive pressure. The positive pressuretype system was installed in a dairy barn (Fig. 19 andFig. 20) of a company in South Taiwan. The nega-tive pressure type systems have been successfullyinstalled in chicken houses, greenhouses, etc. (Fig.21 and Fig. 22).
Berman et al. (1985) have suggested that25-26oC is the upper critical temperature for high-yielding dairy cows. If a closed dairy barn is equippedwith pads and fans, or a fogging multi-net and fansystem, either system should maintain the environ-ment of the cows at a temperature of less than 26oCthroughout the day.
Intermittent spraying and forced ventilation
A fogging and movable fan system may in-crease lactation, but it has little effect on rectaltemperature. Direct spraying of water onto the bodyis the cheapest way of reducing the rectal tempera-
����� �"� 1��� ��� �2� � ������ �����2� �������� � � ��� ����
����� �%� /������� ��� �������� ���2� ���
10

ture, thus reducing the heat stress of cattle. Aconsiderable amount of research has shown that thissystem is effective in improving milk yield and thereproductive performance of dairy cows (Wang et al.1993; Berman 1995).
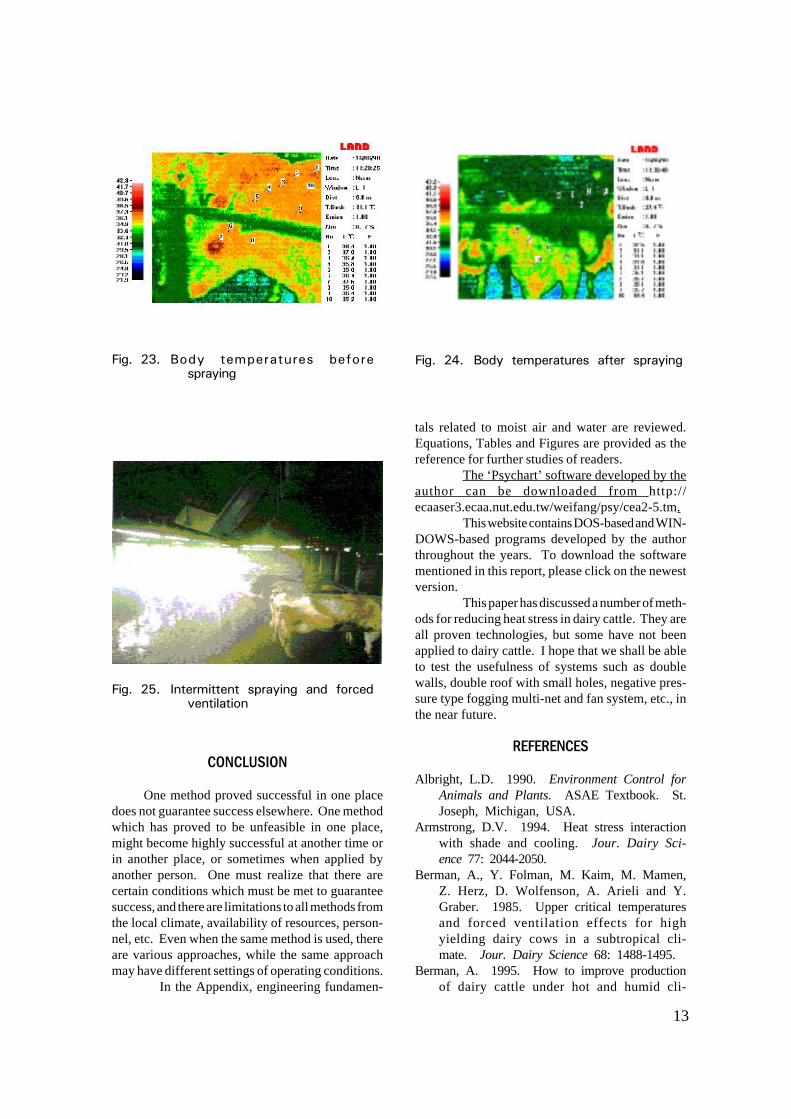
Fig. 23 and Fig. 24 show the infrared imageof the cattle before and after spraying. An intermit-tent timer control system was installed to control theon/off of the sprayer and fans. The best coolingeffect can be achieved by setting the system at 1:9intervals per cycle and 5 to 6 cycles per treatment.Berman (1985; 1995) and Wang et al. (1993) sug-gested that spraying for 0.5 minute should be fol-lowed by turning on the fan for 4.5 minutes. In total,five minutes per cycle and 30 minutes per treatmentcan have 6 cycles.
The author used one minute of sprayingand nine minutes of fan per period, the treatmentlasting for 50 minutes (five cycles) using differenttypes of nozzle and fan (Fang 1998). The exactsetting should depend on the local situation and thewater flow rate, the volumetric flow rate of the fanand the number of fans installed. The key is to wetthe cattle thoroughly and dry them again com-pletely. The major cooling effect lies in the periodduring which the wet cattle become dry.
Using Berman's approach, the cooling ef-fect lasts for 30-45 minutes, (0.5 min spray, 4.5 minforced ventilation, 6 cycles, 30 minutes). The cool-ing effect lasts for 60-90 minutes using the author’sapproach (1 min spraying, 9 min forced ventilation,5 cycles lasting a total of 50 minutes).
����� �'� ;� ��� 2�� ������� ����2������� ��� ������ ���� �2� ���� ��� ���
����� �*� ;� ���� 2�� � ���� ��� ���3��2� ��� � ����
����� �(� ;�������� �������������� �2� ��� ��� 2�� ����� ��� ����� � ���2�������� �2� ����������
11
12
Berman (1985) suggested that sprayingplus forced ventilation treatment should be con-ducted every two hours for 30 minutes, thus requir-ing 7 to 8 treatments per day. The improvement inperformance of cows receiving this cooling treat-ment is significant. Conception rate increased from20% to 30%, and the steady estrous behavior in-creased from 45% to 70%, without estrous behaviordecrease from 33% to 12%, length of estrous periodincrease from 11.5 to 16 hours during the summertime.
Wang et al. (1993) tested sprinkling fol-lowed by forced ventilation 5 times per day between10:00 am to 4:30 pm. During the experiment, therectal temperature of the cows was significantlyreduced by 0.2oC. In Author’s experiment, we foundthe rectal temperature reduced by 0.4oC (Fang 1998).
Wang et al. (1993) also conducted same cold treat-ment 9 times per day between 5 am to 9 pm for 10days and found that the amount of lactation in-creased by 2.6 kg/day/cow in treatment group overcontrol group.
The intermittent spraying and forced ven-tilation can be conducted at the holding locationbefore milking, as shown in Fig. 25 or in a separatelocation. The place should have good drainage.
Stermer et al. (1986) conduct experimentson releasing heat stress by lowering drinking watertemperature. Results shown that water temperatureat 22oC is significantly better than water tempera-ture at 10, 16 and 28oC. The body temperaturedecrease 0.6oC and respiration rate reduced 12 timesper minute.
����� �+� �������� ����� ��� ���� ��� 2�� ����� ����� ��� ��� � ���� ���
����� �!� �������� ����� ��� ���� ��� 2�� ����� ����� ��� ��� � ���� ���
����� ��� ;������� ����� ��� ���� ��� 2�� ����� ����� ��� ����������� ���
����� ��� ;������� ����� ��� ���� ��� 2�� ����� ����� ��� ����������� ���
13
����������
One method proved successful in one placedoes not guarantee success elsewhere. One methodwhich has proved to be unfeasible in one place,might become highly successful at another time orin another place, or sometimes when applied byanother person. One must realize that there arecertain conditions which must be met to guaranteesuccess, and there are limitations to all methods fromthe local climate, availability of resources, person-nel, etc. Even when the same method is used, thereare various approaches, while the same approachmay have different settings of operating conditions.
In the Appendix, engineering fundamen-
tals related to moist air and water are reviewed.Equations, Tables and Figures are provided as thereference for further studies of readers.
The ‘Psychart’ software developed by theauthor can be downloaded from http://ecaaser3.ecaa.nut.edu.tw/weifang/psy/cea2-5.tm.
This website contains DOS-based and WIN-DOWS-based programs developed by the authorthroughout the years. To download the softwarementioned in this report, please click on the newestversion.
This paper has discussed a number of meth-ods for reducing heat stress in dairy cattle. They areall proven technologies, but some have not beenapplied to dairy cattle. I hope that we shall be ableto test the usefulness of systems such as doublewalls, double roof with small holes, negative pres-sure type fogging multi-net and fan system, etc., inthe near future.
������
Albright, L.D. 1990. Environment Control forAnimals and Plants. ASAE Textbook. St.Joseph, Michigan, USA.
Armstrong, D.V. 1994. Heat stress interactionwith shade and cooling. Jour. Dairy Sci-ence 77: 2044-2050.
Berman, A., Y. Folman, M. Kaim, M. Mamen,Z. Herz, D. Wolfenson, A. Arieli and Y.Graber. 1985. Upper critical temperaturesand forced ventilation effects for highyielding dairy cows in a subtropical cli-mate. Jour. Dairy Science 68: 1488-1495.
Berman, A. 1995. How to improve productionof dairy cattle under hot and humid cli-
����� �)� 0�� � ������������ ��2������ ���
����� �"� 0�� � ������������ 2���� ��� ���
����� �%� 6������������ ��� ���� ��� 2����� ��������

14
mate. Taiwan Livestock Research Institute(TLRI), Taiwan, R.O.C. (In Chinese, trans-lated by Dr. Lee, Shan-Nan).
Bottcher, R.W., G.R. Baughman, R.S. Gates,M.B. Timmons. 1991. Characterizing effi-ciency of misting systems for poultry.Transactions of the American Society ofAgricultural Engineering, pp. 586-590.
Du Preez, J.H., S.J. Terblanche, W.H. Giesecke,C. Maree and M.C. Welding. 1991. Effectof heat stress on conception in a dairyherd model under south African condi-tions. Theriogenology 35:1039-1049.
Fang, Wei. 1994. Design and operations ofpad and fan system. Journal of Agricul-tural Machinery 3,4: 57-70. (In Chinesewith English abstract).
Fang, Wei. 1994. Greenhouse Cooling inSubtropical Regions. Acta Horticulturae399: 37-48.
Fang, Wei. 1995. Quantitative measures ofthe effectiveness of evaporative coolingsystems in greenhouse. Journal of Agri-cultural Machinery 4.2: 15-25. (In Chinesewith English abstract).
Fang, Wei, 1998. Releasing thermal stress ofDairy cows. Council of Agriculture,Unpub. Project Report. (In Chinese).
Fang, Wei and Chien-Chou Lai. 2001. Fog-ging multi-layer net and fan system.Patent No. 171021. R.O.C. (In Chinese).
Igono, M.O., B.J. Steevens, M.D. Shanklin andH.D. Johnson. 1985. Spray cooling ef-fects on milk production, milk and rectaltemperatures of cows during a moderatetemperature summer season. Jour. DairyScience 68: 979-985.
Ingraham, R.H., D.D. Gillette and W.D.Wagner. 1974. Relation of temperatureand humidity to conception rate of Hol-stein cows in subtropical climate. Jour.Dairy Science 57: 476-481.
Johnson, H.D.. 1985. Physiological responsesand productivity of cattle. In: StressPhysiology in Livestock, Vol II, YousefM.K. (Ed.) CRC Press, USA, pp.3-23.
Knapp, D.M. and R.R. Grummer. 1991. Re-sponse of lactating dairy cows to fatsupplementation during heat stress. Jour.Dairy Science 74: 2573-2579.
Linvill, D.E. and F.E. Pardue. 1992. Heatstress and milk production in the southCarolina coastal plains. Jour. Dairy Sci-ence 75: 2598-2604.
Mannix, J.G. 1981. Evaluation of convectiveheat transfer coefficient of an evaporativecooling pad. Unpub. Thesis, Auburn Uni-versity, USA.
Munters Corp., USA. 1996. Catalogue ofPads.
Stermer, R.A., C.F. Brasington, C.E. Coppock,J.K. Lanham and K.Z. Milan. 1986. Effectof drinking water temperature on heatstress of dairy cows. Jour. Dairy Science69: 546-551.
Stott, G.H. 1981. What is animal stress andhow is it measured. Jour. Animal Science52:150-153.
Trumbull, R.D., J.L. Koon and C.A. Flood, Jr.1986. Potential for use of evaporativecooling systems. ASAE paper 86-4048.St. Joseph, MI. User manual of hs-3600from Metrosonics, INC., USA.
Wang, J.Y., S.Y. Lu, Y.C. Hu and T.W. Yang.1993. Effects of evaporative cooling onlactation and reproduction of Holsteincows in Summer. Jour. Chinese DairyScience 22, 2: 163-173. (In Chinese withEnglish abstract).

15


![RESEARCH ON THE HEAT BALANCE SHEET DRYING FLUIDIZED … · Umiditatea min. Rh [% ] U miditatea max. Rh [%] Umiditaeta mni .Rh [% ] 19 19 14 19 14 14 13 14 14 12 14 Umiditateamax](https://img.pdfslide.net/doc/110x75/5dd1117ed6be591ccb6410d5/research-on-the-heat-balance-sheet-drying-fluidized-umiditatea-min-rh-u-miditatea.jpg)