Embed Size (px)
Citation preview
Environmental Factors Affecting Environmental Factors Affecting Salmon ProductionSalmon Production
Washington Department of Fish & Wildlife Science Division
Dave SeilerDave Seiler

Map

Coho spawner

Coho FryCoho Fry

Coho SmoltCoho Smolt

SunsetSunset Falls Falls
SF Skykomish RiverSF Skykomish River

Deschutes River screw trap Deschutes River screw trap at Tumwater Fallsat Tumwater Falls

Big Beef Creek during floodBig Beef Creek during flood

Bingham CreekBingham Creek

Skagit River traps from airSkagit River traps from air

Skagit River screw & scoop traps, near Mt VernonSkagit River screw & scoop traps, near Mt Vernon

Clearwater River scoop trap

W – Fence TrapW – Fence Trap

Adult Returns to Sunset Falls FishwaySF Skykomish River
0
10,000
20,000
30,000
40,000
50,000
60,000
1958 1963 1968 1973 1978 1983 1988 1993 1998 2003
Return Year
Adu
lts
CohoChinookSteelhead

Deschutes River Adult Coho Returns
0
4,000
8,000
12,000
1980 1983 1986 1989 1992 1995 1998 2001 2004
Return Year
Ad
ult
s

Big Beef Creek Smolt Production Coho, Cutthroat & Steelhead
0
10,000
20,000
30,000
40,000
50,000
1978 1981 1984 1987 1990 1993 1996 1999 2002
Smolt Year
Sm
olt
Pro
du
ctio
n
Coho
Cutthroat
Steelhead

Bingham Creek Smolt Production Coho, Cutthroat & Steelhead
0
20,000
40,000
60,000
80,000
1982 1985 1988 1991 1994 1997 2000 2003
Smolt Year
Sm
olt P
rodu
ctio
n
Coho
Cutthroat
Steelhead

Big Beef & Bingham CreeksCoho Smolt Productions
0
20,000
40,000
60,000
80,000
1978 1981 1984 1987 1990 1993 1996 1999 2002
Smolt Year
Sm
olt
Pro
du
ctio
n
Bingham
Big Beef

Marine SurvivalPuget Sound Wild Coho
0%
5%
10%
15%
20%
25%
30%
35%
1978 1980 1982 1984 1986 1988 1990 1992 1994 1996 1998 2000 2002 2004
Return Year
Mar
ine
Su
rviv
al
Big Beef Deschutes SF Skykomish Baker River

Marine SurvivalBingham Creek Wild Coho
0%
2%
4%
6%
8%
10%
12%
1983 1985 1987 1989 1991 1993 1995 1997 1999 2001 2003
Return Year
Ma
rin
e S
urv
iva
l

Skagit River Wild Coho Smolt Production
R2 = 85%
R2 = 61%
0.0
0.5
1.0
1.5
2.0
2.5
1987 1989 1991 1993 1995 1997 1999 2001 2003
Brood Year
Pro
du
ctio
n (
mill
ion
s)
Even YearsOdd Years
BY 2002Low Summer Flows
& Fall Floods

Chehalis River Minimum Spawning Flows
& Subsequent Coho Smolt Production, BYs 1980-2000
1997 1994
R2 = 73%
0.0
1.0
2.0
3.0
4.0
0 500 1,000 1,500 2,000 2,500
Minimum Spawning Flow (cfs)
Sm
olts
(m
illio
ns)
Actual
Low Escapement
Predicted

Bingham Creek Wild Coho, BYs 1980-2001 Smolt Production & Low Flows
1997 1993
2000
2001
1999
1996
1998
1995
R2 = 95%
0
20,000
40,000
60,000
80,000
25% 50% 75% 100% 125% 150%
Puget Sound 60-day Average Low Flow (proportion)
Sm
olt
Pro
du
ctio
n
Before Screen Removal After Screen Removal in 1992

Bingham Creek Coho Smolt Production Related to Peak November Flows Following Screen Removal at Lake Nahwatzel
R2 = 97%
-50%
0%
50%
100%
150%
200%
0 5,000 10,000 15,000 20,000 25,000 30,000
Satsop Peak Daily Flow (Nov)
% A
dd
itio
na
l S
mo
lts

Cedar River Wild Sockeye FrySurvival as a Function of Peak Incubation Flow
R2 = 75%
0%
5%
10%
15%
0 1,000 2,000 3,000 4,000 5,000 6,000 7,000 8,000
Peak Incubation Flow
Eg
g-t
o-M
igra
nt
Su
rviv
al

Egg-to-Migrant Survival and Peak Flowin the Skagit River
Wild Zero-Age Chinook: Brood Years 1989-2001
19931998
1997
1996 19942001
1999
1995
1989
1990
2000R2 = 90%
0%
6%
12%
18%
24%
0 25,000 50,000 75,000 100,000 125,000 150,000 175,000
Peak Incubation Flow (cfs)
Eg
g-t
o-M
igra
nt
Su
rviv
al
Actual
2000 Outlier
Predicted

Clearwater River Wild Coho Smolt Production &Peak Flow During Egg Incubation, Brood years 1979-2001
Low Escapement
1997
1983
1994
R2 = 40%
0
30,000
60,000
90,000
120,000
0 20,000 40,000 60,000 80,000
Peak Incubation Flow (cfs), Queets River
Sm
olt
Pro
du
ctio
n
Not Included
Predicted

In-River Survival of Hatchery Sockeye Fry
Released at Landsburg HatcheryCedar River 1995
0%
20%
40%
60%
80%
100%
0 500 1,000 1,500 2,000 2,500 3,000 3,500
Flow (cfs)
Su
rviv
al
Actual
Predicted

Bear Creek Sockeye Fry Survival Related to Flows During Migration
Brood Years 1996 - 2003
2000 2002
2003 1999
1997 1998
2001
1996 Ice Storm
R2 = 62.8%
0%
5%
10%
15%
20%
50 100 150 200Average Flow (Feb 1 - March 31)
Eg
g-t
o-F
ry S
urv
ival

Cedar River Chinook Migration
0
3,000
6,000
9,000
12,000
15,000
18,000M
igra
nts
0
1,000
2,000
3,000F
low
(cfs
)193,994 Fry
41,261 Smolts
Flow
2003
0
2,000
4,000
6,000
1-Jan 1-Feb 1-Mar 1-Apr 1-May 1-Jun 1-Jul
Mig
ran
ts
0
1,000
2,000
3,000
Flo
w (cfs)
10,994 Fry
21,255 Smolts
Flow
2001

Cedar River Wild Sockeye Fry Migration Timing
as a Function of Temperature
2000 BroodEarthquake &
Low Flows
R2 = 59%
60
70
80
90
100
5 5.5 6 6.5 7 7.5 8
Average February Temperature (C)
Med
ian
Mig
rati
on
Dat
e

Proportion of PIT Tagged Chinook Detected at the Ballard Locks
Lake Washington Temperatures at Fremont BridgeAverage of years 2001 – 2003
0%
20%
40%
60%
80%
100%
18 19 20 21 22 23 24 25 26 27 28 29
Statistical Week Tagged
Det
ectio
n R
ate
50
53
56
59
62
65
Tem
perature (F)
Cedar River Bear CreekTemp.
Release Site:
0
10
20
30
40
50
60
70
80
90
100
1970 1975 1980 1985 1990 1995 2000 2005 2010
Day
s E
xcee
ding
20
C
DAYS
PREDICTED DAYS
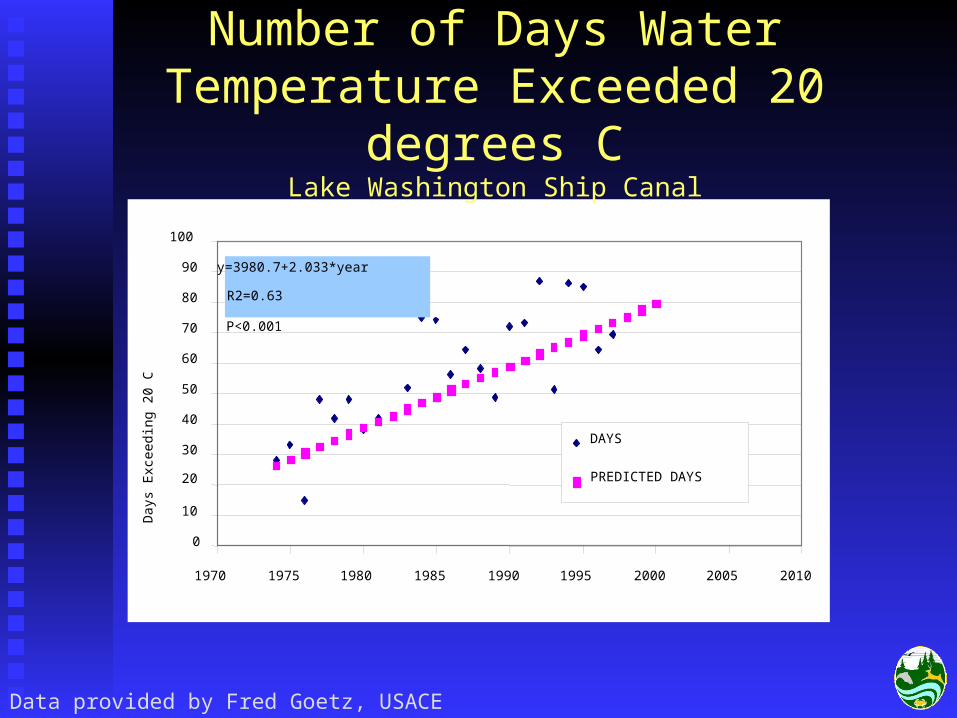
y=3980.7+2.033*year
R2=0.63
P<0.001
Number of Days Water Temperature Exceeded 20
degrees CLake Washington Ship Canal
Data provided by Fred Goetz, USACE
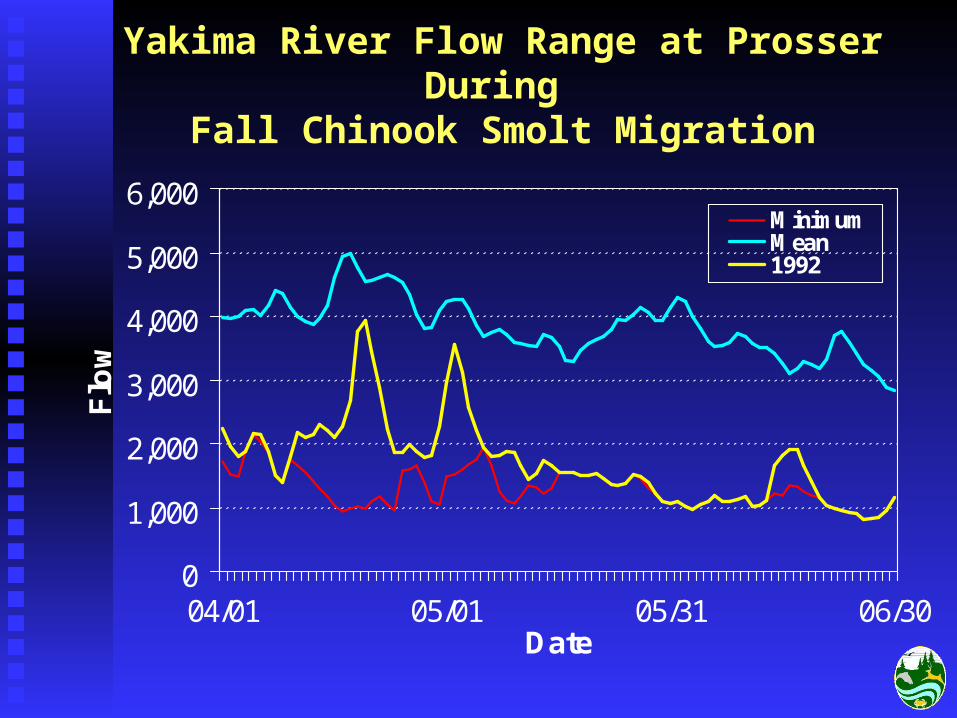
Yakima River Flow Range at Prosser During
Fall Chinook Smolt Migration
0
1,000
2,000
3,000
4,000
5,000
6,000
04/01 05/01 05/31 06/30Date
Flo
w
MinimumMean1992

Fall Chinook Smolt Migration PastProsser & West Richland
and Stream Temperature, Yakima River 1992
0
8
16
24
32
04/07 04/21 05/05 05/19 06/02 06/16
Date
Es
tim
ate
d M
igra
tio
n(t
ho
us
an
ds
)
50
60
70
80
90
Maxim
um D
ailyT
emperature (F
)
ProsserRichlandTemperature
74,000 smolts transported June 4-15


![SEILER John SL414 - E. C. Saylor · John "Hans" SEILER and Elizabeth BLOUGH 1. John "Hans"1 SEILER [SL414+], born i, 26 Aug 1768 in Pennsylvania; died i 4 Mar 1855, son of John SEILER](https://img.pdfslide.net/doc/110x75/5b5cba237f8b9a3a718cdb1f/seiler-john-sl414-e-c-john-hans-seiler-and-elizabeth-blough-1-john-hans1.jpg)