Embed Size (px)
Citation preview
ENVIRONMENTAL FACTORS INFLUENCING FUNGAL GROWTH ON GYPSUM
BOARDS AND THEIR BIODEGRADATION: A UNIVERSITY CAMPUS CASE STUDY
by
Negin Kazemian
B.Sc., The University of British Columbia Okanagan, 2014
A THESIS SUBMITTED IN PARTIAL FULFILLMENT OF
THE REQUIREMENTS FOR THE DEGREE OF
MASTER OF SCIENCE
in
THE COLLEGE OF GRADUATE STUDIES
(Biology)
THE UNIVERSITY OF BRITISH COLUMBIA
(Okanagan)
February 2017
© Negin Kazemian, 2017
The undersigned certify that they have read, and recommend to the College of Graduate
Studies for acceptance, a thesis entitled:
Environmental Factors Influencing Fungal Growth on Gypsum Boards and their
Biodegradation: A University Campus Case Study
Submitted by Negin Kazemian in partial fulfilment of the requirements of
The degree of Master of Science in Biology.
Dr. John Klironomos, IKBSAS: Unit 2, Biology
Supervisor, Professor (please print name and faculty/school above line)
Dr. Abbas Milani, Engineering
Supervisory Committee Member, Professor (please print name and faculty/school above line)
Dr. Louise Nelson, IKBSAS: Unit 2, Biology
Supervisory Committee Member, Professor (please print name and faculty/school above line)
Dr. David Scott, IKBSAS: Unit 7, Earth and Environmental Sciences, Physical Geography
University Examiner, Professor (please print name and faculty/school above line)
Feb, 10, 2017
(Date Submitted to Grad Studies)
iii | P a g e
Abstract
Contamination and growth of fungi within buildings, has gained increasing public attention
within the last decade. Indoor fungal growth can have many adverse effects on building
materials and has been linked to many health effects. In an effort to better understand the
different environmental conditions that lead to fungal growth on indoor materials of drywall,
and observe the biodegradative capabilities of these organisms, a case study was conducted at
the University of British Columbia-Okanagan campus.
The results of this study showed that age, and type of rooms can affect the diversity and
composition of fungal taxa, with rooms in older buildings and laboratories supporting a higher
diversity of fungi. The type of flooring and presence of carpet was not an influencing factor on
fungal growth and diversity observed on drywall samples. A higher degree of fungal growth also
affected the physical and mechanical properties of these building materials, with more fungi
increasing the dry weight loss and decreasing the tensile strength of drywall. Although there
are several epidemiological studies on the association between indoor fungi and the
development of health problems, much still needs to be learned about what factors in indoor
environments lead to the growth of these microorganisms. With a better understanding of
which factors and environmental conditions trigger fungal growth in built environments, we can
eventually better design indoor living spaces occupied by humans and develop methods for
dealing with such problems.
iv | P a g e
Preface
This thesis presents an experimental-statistical analysis of the effects of fungal growth on
gypsum boards. This research was conducted at the University of British Columbia, Okanagan
campus, under co-supervision of Dr. John Klironomos and Dr. Abbas S. Milani. A preliminary
version of this work and a later completed form of parts of this thesis were published in the 1st
and 2nd Annual Biology Graduate Symposium, Biology Department, UBC Okanagan, 2015 &
2016. A version of chapters 2-5 has been submitted in a journal for publication. This work was
drafted in whole by N. Kazemian with editorial comments by Drs. J. Klironomos, A. S. Milani,
and L. Nelson.
v | P a g e
Table of Contents
Abstract-----------------------------------------------------------------------------------------------------------------iii
Preface------------------------------------------------------------------------------------------------------------------iv
Table of Contents-----------------------------------------------------------------------------------------------------v
List of Tables ---------------------------------------------------------------------------------------------------------viii
List of Figures----------------------------------------------------------------------------------------------------------ix
Acknowledgements--------------------------------------------------------------------------------------------------xi
Dedication-------------------------------------------------------------------------------------------------------------xii
Chapter 1. Background and Thesis Organization-------------------------------------------------------------1
1.1 Introduction----------------------------------------------------------------------------------------------1
1.2 Motivation of this research--------------------------------------------------------------------------2
1.3 Objectives------------------------------------------------------------------------------------------------2
1.4 Thesis outline--------------------------------------------------------------------------------------------4
Chapter 2. Literature Review--------------------------------------------------------------------------------------5
2.1 Mycobiota of indoor environment------------------------------------------------------------------5
2.1.1 Fungi--------------------------------------------------------------------------------------------------5
2.2 Indoor fungal growth-----------------------------------------------------------------------------------6
2.2.1 Humidity and temperature effects------------------------------------------------------------6
2.2.2 Age of buildings------------------------------------------------------------------------------------8
2.2.3 Number of occupants-----------------------------------------------------------------------------8
2.3 Fungal growth on construction and finishing materials---------------------------------------9
2.3.1 Wood-------------------------------------------------------------------------------------------------9
2.3.2 Wallpaper--------------------------------------------------------------------------------------------9
2.3.3 Plastics and glass---------------------------------------------------------------------------------10
2.3.4 Paint-------------------------------------------------------------------------------------------------10
2.3.5 Carpet-----------------------------------------------------------------------------------------------10
2.3.6 Dust--------------------------------------------------------------------------------------------------10
2.3.7 Gypsum boards-----------------------------------------------------------------------------------11
vi | P a g e
2.3.8 Biodeterioration and biodegradation-------------------------------------------------------14
2.4 Fungal products: Mycotoxins-----------------------------------------------------------------------15
2.4.1 Sterigmatocystin---------------------------------------------------------------------------------18
2.4.2 Trichothecenes-----------------------------------------------------------------------------------18
2.5 The indoor microbiome and health problems--------------------------------------------------19
2.6 Sampling methods------------------------------------------------------------------------------------20
2.7 Summary------------------------------------------------------------------------------------------------21
Chapter 3. Materials and Methods --------------------------------------------------------------------------- 22
3.1 Sampling ----------------------------------------------------------------------------------------------- 22
3.2 Growth coverage ------------------------------------------------------------------------------------ 25
3.3 Fungal growth identification ---------------------------------------------------------------------- 25
3.4 PCR of fungal species problematic for health ------------------------------------------------- 25
3.4.1 DNA extraction ---------------------------------------------------------------------------------- 25
3.4.2 PCR amplification ------------------------------------------------------------------------------ 26
3.5 Physical and mechanical testing ----------------------------------------------------------------- 27
3.6 Statistical analyses ---------------------------------------------------------------------------------- 27
Chapter 4. Results and Discussion ---------------------------------------------------------------------------- 29
4.1 Fungal coverage on drywall-------------------------------------------------------------------------29
4.2 Fungal diversity on drywall--------------------------------------------------------------------------31
4.3 Environmental factors--------------------------------------------------------------------------------35
4.4 Weight loss----------------------------------------------------------------------------------------------36
4.5 Mechanical testing------------------------------------------------------------------------------------37
4.6 SEM imaging--------------------------------------------------------------------------------------------38
4.7 Generalized linear model results------------------------------------------------------------------40
4.8 Discussion-----------------------------------------------------------------------------------------------41
Chapter 5. Conclusions and Future Work---------------------------------------------------------------------46
5.1 Conclusions---------------------------------------------------------------------------------------------46
5.2 Future work recommendation---------------------------------------------------------------------46
vii | P a g e
References ---------------------------------------------------------------------------------------------------------- 48
Appendices ---------------------------------------------------------------------------------------------------------- 57
Appendix A Supplementary figures of the correlation between uncontrolled--------------57
Appendix B Supplementary table for number and specification of rooms sampled-------62
Appendix C Supplementary table and figure for sample of normality assumption--------63
Appendix D Supplementary table and figures for the nested design analysis--------------64
Appendix E Supplementary table and figure for the rank correlation between coverage
and diversity---------------------------------------------------------------------------------68
Appendix F Supplementary figures for the uncontrolled factors affecting coverage and
diversity---------------------------------------------------------------------------------------69
Appendix G Supplementary table and figures assessing confounding effects among
controlled factors and random environmental variables----------------------------73
Appendix H Supplementary table and figure for the correlation between weight loss and
tensile strength-----------------------------------------------------------------------------78
Appendix I Supplementary figures for the interaction of the three controlled factors
tested for coverage and diversity------------------------------------------------------79
viii | P a g e
List of Tables
Table 2.1 The different categories of drywall available and their description and utility............13
Table 2.2 Fungal mycotoxin production, their growth, and health effects................................. 17
Table 3.1 Details of the four buildings sampled at UBCO campus...............................................22
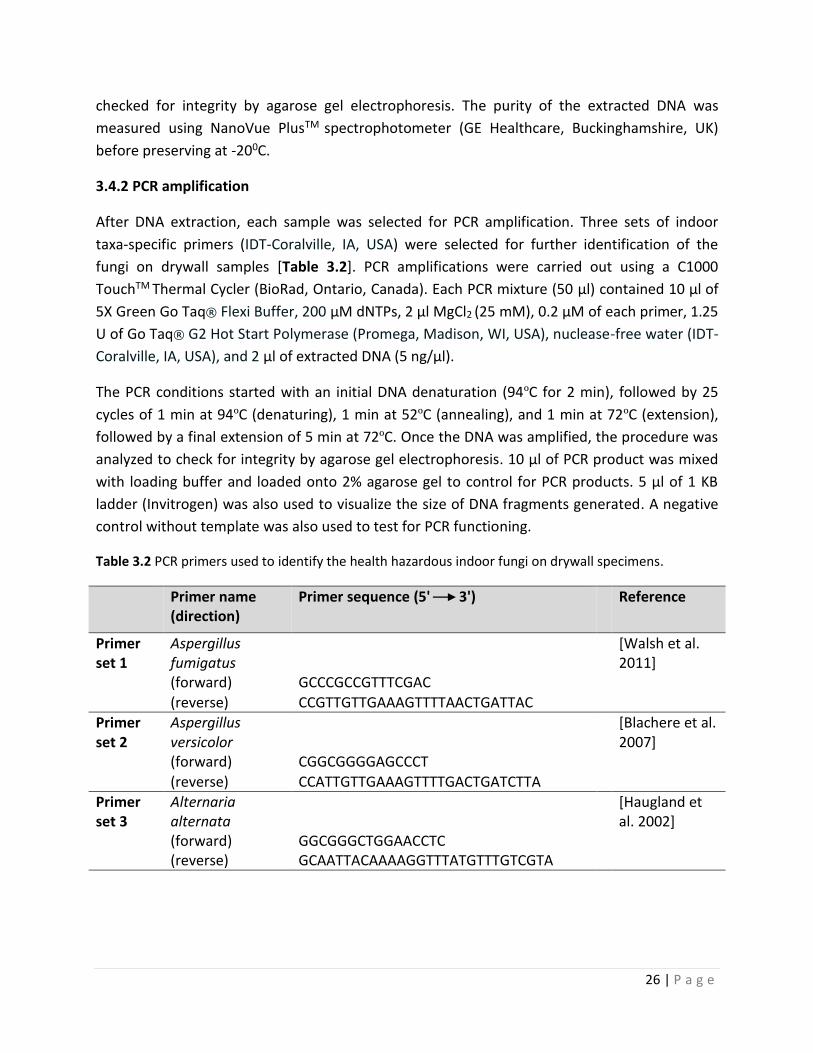
Table 3.2 PCR primers used to identify the health hazardous indoor fungi on drywall
specimens......................................................................................................................26
Table 3.3 Summary of statistical methods used for the different responses/analyses................28
Table 4.1 Fungal community composition observed on the drywall samples of 51 sampled
rooms ...........................................................................................................................31
Table 4.2 Average humidity and temperature measured for the four selected buildings at UBCO
campus for the month of July 2014..............................................................................35
Table 4.3 Summary of measurement of uncontrolled factors averaged for the three
different types of rooms...............................................................................................36
Table 4.4 The uncontrolled factors measured for all 51 rooms across the UBCO campus..........36
Table 4.5 The p-values for three indoor factors of age, type of room, and flooring compared
between the Kruskal-Wallis analysis.............................................................................40
Table 4.6 Observed p-values for coverage and diversity using the nested..................................41
Table B.1 Summary of number of rooms and their location as sampled.....................................62
Table C.1 Example of tested normality assumption.....................................................................63
Table D.1 Example of generalized linear model output using the nested design........................64
Table E.1 The correlation table between fungal diversity and fungal coverage..........................68
Table G.1 P-values corresponding to symmetric rank correlation matrix among the controlled
factors..........................................................................................................................73
Table G.2 P-values corresponding to symmetric rank correlation matrix among the uncontrolled
factors..........................................................................................................................74
Table H.1 The correlation analysis between weight loss and stress of drywall samples.............78
ix | P a g e
List of Figures
Figure 2.1 Moisture production and entrance in buildings............................................................7
Figure 2.2 Fungal growth on indoor drywall material..................................................................12
Figure 2.3 (A) Instron machine used for tensile testing, and (B) the stress versus strain graph of
a specimen after a tensile test....................................................................................14
Figure 2.4 (A) Close-up configuration of a test sample under tensile loading using Wedge Action
Grips for flexible thin specimens, and (B) induced fracture in the middle of..............15
Figure 3.1 51 selected rooms for identified environmental factors at UBCO: i) age of building, ii)
type/function of room, and iii) type of flooring..........................................................23
Figure 3.2 (A) Petri dishes set up on shelf brackets for dust collection, and (B) 500 ml graduated
volumetric bottles with rubber lined caps..................................................................24
Figure 4.1 The relationship between indoor factors of (a) age, (b) type of room, and (c) type of
flooring influencing fungal coverage range (1-5) on drywall samples.........................30
Figure 4.2 The fungal taxa present in rooms of buildings sampled at UBCO for the controlled
factors of (a) age, (b) type of rooms, and (c) type of flooring.....................................32
Figure 4.3 The relationship between indoor factors of (a) age, (b) type of room, and (c) type of
flooring influencing fungal diversity of drywall...........................................................34
Figure 4.4 Weight loss of drywall samples with varying ranges (levels) of fungal growth coverage
(1-5) over a one week time period..............................................................................37
Figure 4.5 Tensile strength of drywall samples with varying ranges of fungal growth, post tensile
testing .........................................................................................................................38
Figure 4.6 SEM micrographs of drywall samples showing (A-C) the control pieces which are UV
sterilized and not exposed to dust and high humidity.................................................39
Figure A.1 The uncontrolled factor of temperature measured for the controlled factors...........57
Figure A.2 The uncontrolled factor of humidity measured for the controlled factors.................58
Figure A.3 The uncontrolled factor of dustiness measured for the controlled factors................59
Figure A.4 The uncontrolled factor of occupancy level measured for the controlled factors......60
Figure A.5 The uncontrolled factor of window presence measured for the controlled factors...61
x | P a g e
Figure B.1 Photographs of the atria in (a) Arts and (b) Science buildings at UBCO......................62
Figure C.1 (A) The normality Q-Q plots and (B) detrended normal Q-Q plots..............................63
Figure D.1 Comparing details of all the four buildings on campus with different types of rooms
and flooring.................................................................................................................65
Figure E.1 Visualization of high correlation between fungal coverage and fungal diversity........68
Figure F.1 The uncontrolled factors of temperature, humidity, occupancy level, dustiness, and
window presence affecting fungal coverage................................................................69
Figure F.2 The uncontrolled factors of temperature, humidity, occupancy level, dustiness, and
window presence affecting fungal diversity.................................................................71
Figure G.1 The correlation between the controlled factors.........................................................73
Figure G.2 The uncontrolled factors of temperature, humidity, occupancy level, dustiness, and
window presence and their correlation.......................................................................74
Figure H.1 High correlation between weight loss and maximum stress of drywall samples.......78
Figure I.1 The Interaction between the three controlled factors tested for fungal coverage......79
Figure I.2 The Interaction between the three controlled factors tested for fungal diversity.......80
xi | P a g e
Acknowledgements
This dissertation could not have been completed without the support and contributions of the
many individuals in my life. Firstly, I would like express my deepest gratitude to my principal
supervisor Prof. John Klironomos for his continuous guidance during my studies. John's
patience and passion for teaching me new things, allowed me to grow as a person and as a
researcher. Your trust in me with this project allowed me to gain more confidence and learn
valuable skills that I will always carry with me for many years. I am grateful to you for all the
time you spent passing on your knowledge to me.
I would also like to highlight the immense support of my Co-supervisor, Prof. Abbas S. Milani.
Thank you for all your help. You allowed me to step out of my comfort zone and try new things.
This interdisciplinary study and window of opportunity that you opened for me into the
materials engineering world could not have been done without your support. I would also like
to thank another member of my advisory committee, Dr. Louise Nelson. I am grateful for all the
valuable and insightful comments in our meetings and discussions.
I would also like to thank a very special individual in my life. I had the privilege of working with
Dr. Sepideh Pakpour during my Bachelor studies at UBC. Witnessing her passion and
commitment for her research allowed me to push myself and pursue a Master's degree in
Biology. Her guidance throughout the years has meant so much to me and I am so lucky to have
met her. My friends and fellow graduate students in our lab, as well as the Composites
Research Network-Okanagan lab have also been a major support group. Your friendship and
advice will never be forgotten. Thank you for always inspiring me with all the amazing work that
you all do.
Lastly, I would like to thank my amazing family for all their love and encouragement. Thank you
to my lovely sister, Rojin Kazemian, for always being there for me. For my great parents who
have sacrificed much in their life for a better future for my sister and I. They always pushed me
to follow my passion and my dreams. Thank you for your unwavering support throughout my
life. I love you unconditionally.
Negin Kazemian
University of British Columbia
February 2017

xii | P a g e
Dedication
This thesis is dedicated to my loving parents:
Fahimeh Tajzadeh & Hossein Kazemian
1 | P a g e
Chapter 1. Background and Thesis Organization
1.1 Introduction
In recent years, there has been a growing global concern regarding the potential impacts of the
environment on health and human development. Over time humans have evolved to live in
confined spaces known as built environments. Presently, people spend 80-95% of their daily
lives indoors [Cabral 2010; Decarro et al. 2003], starting from childhood in daycares and
schools, to work environments and homes. Even leisure time is most often spent in indoor
environments. As a result of this, the exposure to airborne substances has become an
important factor to measure and investigate in indoor environments.
The U.S. Environmental Protection Agency reports that indoor air can be two to five times more
polluted than outdoor air [Portnoy et al. 2004]. Indoor environments are often composed of a
very complex ecosystem that contains viable and dead organisms as well as allergens, small
fragments of organisms, and metabolites such as volatile organic compounds and mycotoxins
[Block 1953; Cabral 2010; Lee et al. 2010]. Saprotrophic fungi are among the many
microorganisms found in indoor environments, and are key agents of structural decay [Scott et
al. 2004]. These fungi can utilize carbon and nutrients, and acquire nutrients via breakdown of
starch, cellulose, and lignin [Hoang et al. 2010]. Fungal spores in the air are impossible to
eliminate in indoor environments; however, controlling humidity and temperature is the best
strategy for reducing growth of these microorganisms [Mihinova & Pieckova 2012; Vacher et al.
2010]. Moisture can enter indoor environments through many different sources such as
leakages, floods, increased condensation, and even activities of occupants in spaces [Adan &
Samson 2011; Mihinova & Pieckova 2012]. Other factors such as age of buildings [Sivasubramini
et al. 2004], number of occupants [Sharpe et al. 2014], and flooring, such as carpets [Wani et al.
2014], can also affect the concentration of fungal spores found and released in indoor
environments.
Fungi in built environments can grow on the surface of many indoor materials such as drywall,
ceiling tiles, carpets, insulation material, etc. [Genuis 2007]. Drywall (or gypsum board), is a
ubiquitous building material used in all construction. This indoor material is made of gypsum
plaster and two thick sheets of paper [Wakili et al. 2014]. While drywall has many advantages, it
is also highly susceptible to microbial growth due to the cellulosic paper backing [Pasanen et al.
1997]. The degrading enzymes and metabolites produced by microorganisms induce hydrolysis
of cellulose macromolecules, leading to discoloration and an increase in damage of internal
areas of the material [Webb et al. 2000; Pekhtasheva et al. 2012]. Thus, fungal growth can
degrade this material and affect the structural integrity of a building [Portnoy et al. 2004].
2 | P a g e
Concern over contamination and growth of fungi within buildings has gained increasing public
attention, due to the increasing prevalence of mould-related health problems [Nielsen 2003;
Mihinova & Pieckova 2012; Wani et al. 2014]. Fungal growth in homes, institutions, and work
places has been reported in many publications, including the World Health Organization
guidelines: dampness and moulds, which concluded that there is sufficient evidence that
occupants in mouldy buildings are at increasing risk of respiratory problems, respiratory
infections, allergic diseases, and asthma [Andersen et al. 2002; Cabral 2010; Douwes et al.
2003]. Thus, human exposure assessment and environmental evaluations are increasingly
becoming recognized as essential components of building design and health care of patients
[Genuis 2007]. Therefore, it is important to better understand the diversity and composition of
indoor fungal species that are present due to different environmental factors, and to explore
their contribution to degradation of indoor material and to occupants' health problems.
1.2 Motivation of this research
There have been several attempts to investigate the fungal community of indoor environments
and on building materials such as gypsum drywall [Andersen et al. 2011; Nielsen 2002; Nielsen
et al. 2004]; however, most of these studies focus on the mycotoxins produced [Nielsen et al.
2004; Nielsen et al. 1998], the finishes applied (paint and wallpaper) [Krause et al. 2006; Vacher
et al. 2010], or the abundance of cultural or pathogenic strains and their health effects
[Andersen et al. 2002], rather than a survey of fungal diversity in indoor spaces; hence, the
environmental factors that determine diversity and composition of the fungal community in
built environments are still poorly understood and require further investigation. Although many
models exist to assess indoor environments, no one model or tool is predictive of the whole
environment [Keall et al. 2012; Vesper et al. 2007]. Therefore, further environmental features
that affect fungal growth need to be examined. With today's building materials and design,
indoor environments are more prone to fungal growth. Fungal spores available in the air, along
with the humidity from the environment may lead to growth on many indoor materials. Fungal
growth on a building material can affect the structural integrity of that material, as the fungus
can use it as a nutrient source and has the ability to degrade it over time [Portnoy et al. 2004].
Exposure to mould and dampness is also known to have many health effects and is thus a
significant aspect for further study [Andersen et al. 2002]. Accordingly, the overall scope of the
proposed research was to better understand the different environmental conditions that lead
to fungal growth and to link fungal community composition of indoor dust to biodegradation
and biodeterioration of drywall as a representative example of building materials.
1.3 Objectives
The association between fungal growth in indoor environments and the development of health
problems, as well as fungal effects on indoor materials has been established by some
3 | P a g e
epidemiological studies [Genuis 2007; Miller & McMullin 2014; Nielsen et al. 1998; Cox-Ganser
2015]. Research is still needed, however, to learn which environmental factors in indoor
environments lead to fungal growth on common building materials and cause their
biodegradation, along with potential health risks for occupants. With a better understanding of
such factors, builders can further optimize the design of indoor living spaces occupied by
humans and develop methods for dealing with such problems. To address parts of the above
gap, the main aim of this thesis has been to identify factors leading to indoor fungal growth on
gypsum drywall, and to determine their effects on physical and mechanical properties of this
indoor material by conducting a case study on select buildings at the UBC-Okanagan. The
specific objectives (research questions) are as follows.
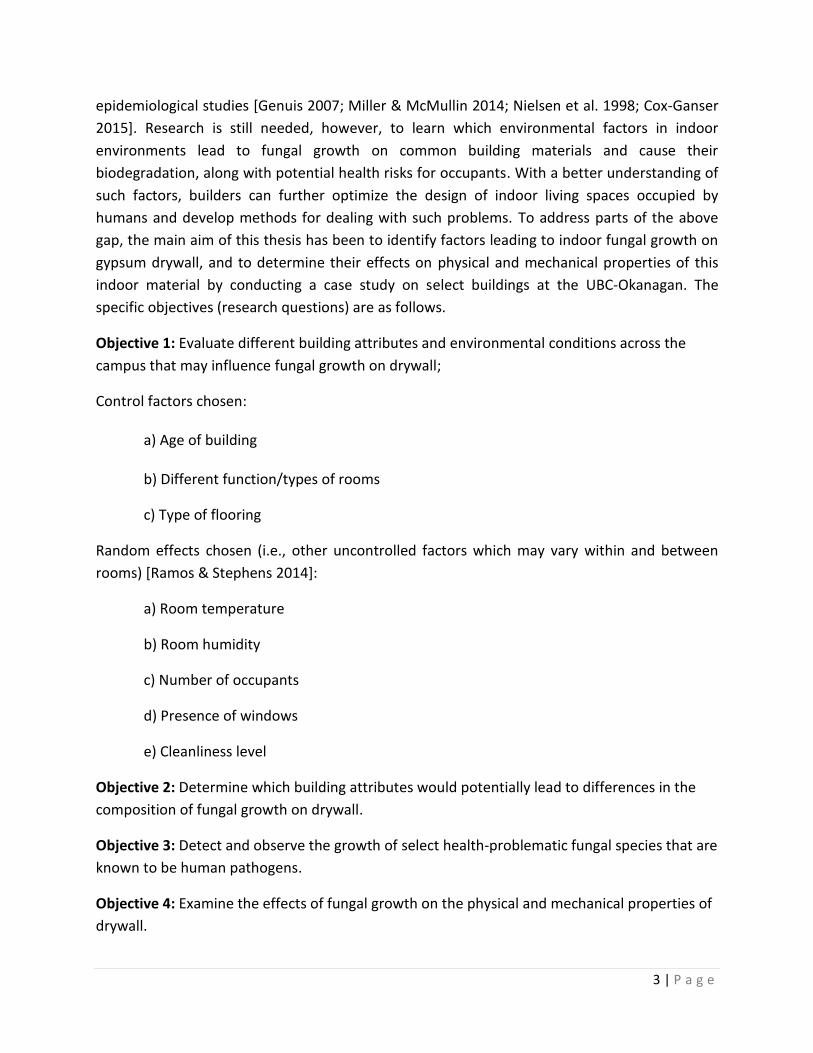
Objective 1: Evaluate different building attributes and environmental conditions across the
campus that may influence fungal growth on drywall;
Control factors chosen: a) Age of building b) Different function/types of rooms
c) Type of flooring
Random effects chosen (i.e., other uncontrolled factors which may vary within and between
rooms) [Ramos & Stephens 2014]:
a) Room temperature
b) Room humidity
c) Number of occupants
d) Presence of windows
e) Cleanliness level
Objective 2: Determine which building attributes would potentially lead to differences in the
composition of fungal growth on drywall.
Objective 3: Detect and observe the growth of select health-problematic fungal species that are
known to be human pathogens.
Objective 4: Examine the effects of fungal growth on the physical and mechanical properties of
drywall.
4 | P a g e
1.4 Thesis outline
Chapter 1 describes the objectives and motivation of the study. Chapter 2 includes a literature
review of the factors affecting fungal growth in built environments, where a number of earlier
studies are discussed and compared. Chapter 3 provides the methodology used in this study to
fulfil the objectives defined in section 1.3. Chapter 4 presents and discusses the results
obtained for the tests, both biological tests and mechanical/materials tests. A discussion of the
results and data analysis is also included in this chapter. Finally, chapter 5 includes the main
conclusions of the study and outlines potential future work.
5 | P a g e
Chapter 2. Literature Review
Built environments are complex ecosystems that support a high diversity of microbial life
including human pathogens and commensals [Kembel et al. 2012]. People spend the majority of
their daily lives indoors [Cabral 2010; Decarro et al. 2003] and are constantly inhaling the
available air in these environments. This chapter includes a literature review of past research
on factors affecting fungal growth on many indoor materials, such as gypsum boards.
2.1 Mycobiota of indoor environment
The air we breathe and the environment we live in are profound determinants of our health
and well-being. In general, the indoor microbiome consists of both autotrophic (e.g., algae), and
heterotrophic (e.g., bacteria, fungi, and protozoans) organisms [Pitkaranta 2012]. High moisture
exposure [Mendell et al. 2011], can lead to microbial growth on many indoor materials, leading
to low indoor air quality, and subsequently to serious health problems [Cabral 2010]. The main
sources of indoor microbes are: i) outside air, ii) indoor surfaces, iii) bodies of humans, and iv)
other organisms living indoors [Pakarinen et al. 2008]. Overall there is still a poor understanding
of what sources are most significant in shaping the built environment microbiome. In this
project, as a case study, the focus will be on the fungal component of indoor environments in
various university buildings.
2.1.1 Fungi
Fungi are commonly found in the built environment and have been estimated as one fourth of
the earth's total biomass [Scott 2001; Wani et al. 2014]. Fungi are a member of a large group of
eukaryotic, heterotrophic organisms that with the presence of water, grow, elongate, and form
tube-like structures called hyphae [Genuis 2007], and reproduce by means of spores (tiny highly
characteristic and specialized reproductive structures) [Kendrick 1985]. Although fungi are
important in ecosystems [Andersen et al. 2011], they may also be problematic in indoor
environments. Fungi that live in buildings are saprotophs and are key agents in structural decay.
These fungi acquire nutrients via breakdown of starch, cellulose, and lignin by the production of
extracellular enzymes [Hoang et al. 2010]. Some indoor fungi may also act as human parasites
(e.g., Aspergillus fumigatus) [Flannigan et al. 2001; Scott 2001].
Fungi found indoors are classified into two groups, yeast and filamentous fungi. Studies
demonstrated that yeast are abundant in houses with pre-dominant species such as
Rhodotorula minuta and R. albidus, which can cause allergic reactions [Verhoeff et al. 1994]. To
date, 100-150 species of fungi have been detected in indoor environments, which is only a
fraction of the 100,000 discovered [Adan & Samson 2011]. Five hundred of these 100,000
species have also been found to be human pathogens [Anderen et al. 2002].
6 | P a g e
Indoor microbiota can be categorized into three groups based on the formation of spores: i)
airborne conidia produced as dry single spores or in chains from Aspergillus, Penicillium,
Alternaria, Cladosporium; ii) spores produced in wet slimy heads that don't become easily
airborne since they stick together in wet heads, belonging to Stachybotrys, Acremonium,
Fusarium, and Trichoderma; iii)) spores formed in fruiting bodies such as Phoma and Eurotium
[Adan & Samson 2011].
2.2 Indoor fungal growth
The concern for mould growth in buildings is a continuing problem, which is exacerbated due to
poor planning, accelerated building processes, and complex building constructions [Adan &
Samson 2011; Cabral 2010]. The fraction of buildings with mould contamination in the United
States and Canada is about 36% [Sivasubramini et al. 2004]. A home environmental survey by
O'Connor et al. (2004), measured the concentration of airborne fungi inside and outside homes
and found that indoor fungal concentration was an indicator of the relative mouldiness of a
home. The concentration of outdoor bioaerosols can change seasonally and increase in the
months of winter (Mihinova & Pieckova 2012). Aerosols reach indoor environments through
natural and or mechanical ventilation via windows and doors, and can also be transported by
people and animals [Muilenberg 1995]. The concentration of fungal spores in bioaerosols
depends on three biological factors. The first is the magnitude of sporulation, which is highest
at an optimum temperature of 25–30 °C. The second is the spore release from conidiophores,
which is influenced by humidity and air currents. Lastly spore dimensions and weight, which
affect how spores can adhere to a surface and enable the germination of fungi. The most
abundant fungi in the atmosphere (Cladosporium, Penicillium, and Aspergillus) produce high
numbers of small and light spores, and therefore they dominate most environments. Alternaria
and Stachybotrys produce fewer, bigger, and heavier spores, which tend to settle faster. In
bioaerosols, these spores live shorter than small and lighter spores [Cabral 2010]. Little is still
known about the dynamics of biological aerosols in indoor environments, including fungal
spores and, thus, needs further investigation.
2.2.1 Humidity and temperature effects
It is impossible to eliminate all fungal spores in indoor environments; however, moisture
control is the best strategy for reducing growth [Mihinova & Pieckova 2012; Cabral 2010].].
Water can enter buildings as both a liquid and gas (water vapour) [Figure 2.1]. Once the water
comes in contact with the building materials, it can be drawn in via pores or capillaries by a
process called absorption, so it is very important to assess moisture in indoor environments
[Straube 2006]. The main sources of moisture in indoor environments are via: a) capillary action
of building subsoil and groundwater intrusion, b) building design and or operational issues such
as leaking, c) raining on buildings, d) condensation, and e) activities of occupants such as in the

7 | P a g e
bathroom, kitchen, laundry, and spills [Adan & Samson 2011; Mihinova & Pieckova 2012]. Of all
the factors that have been studied which affect fungal growth, water has been proven to be a
major determinant, along with temperature and time [Vacher et al. 2010]. As a result, flooded
areas tend to experience significant fungal exposure. The Centre for Disease Control noted that
mould growth will develop on materials that remain wet for 48-72 hours [Genuis 2007].
Fungi that grow on particular material are known as ‘associated’ fungi and categorized into
three groups based on their water activity aw (aw x 100=% relative humidity at equilibrium)
[Andersen et al. 2002]. These categories consist of: i) primary colonizers that are storage
moulds which grow at aw of less than 0.8 (low moisture level in material), such as Aspergillus
versicolor (at 120 C), and less frequently A. fumigatus, A. niger, Penicillium palitans,
Paecilomyces variotii, and Wallemia seb; ii) secondary colonizers that require a minimum aw of
0.8-0.9 (intermediate moisture level) including Alternaria, Cladosporium, Phoma, Ulocladium, A.
fumigatus and A. versicolor (at 250 C); and iii) tertiary colonizers known as water damage
moulds that require aw of at least 0.9 or higher (high moisture level), such as Chaetomium
globosum, Stachybotrys chartarum, and Trichoderma [Ababutain 2013; DEHS 2010; Flannigan et
al. 2001; Grant et al. 1989].
Figure 2.1 Moisture production and entrance in buildings [Mihinova & Pieckova 2012].
It is worth noting that the distribution of moisture is not always uniform and therefore different
parts of a medium can lead to varying amounts and different types of fungal growth. For
example, the hydrophilic mould Stachybotrys chartarum was detected on an extremely wet
8 | P a g e
surface of a wall, while A. versicolor was detected on the drier parts of the growing region
[Grant et al. 1989]. All species in indoor environments have their own individual growth
requirements and identifying the fungi to the species level could be a good indication of the
building condition as a whole [Adan & Samson 2011]. In sub-sections of section 2.3, fungal
growth on the most common building materials will be discussed.
2.2.2 Age of buildings
Different environments will support different fungal communities. The age of the building is an
important factor affecting the fungal spore concentration in indoor air [Sivasubramini et al.
2004]. Older properties usually have elevated levels of dampness and fungal contamination
[Sharpe et al. 2014]. This may be due to a number of factors: i) they are less insulated from the
outside and therefore are less efficient at preventing water entrance, ii) they hold higher
moisture levels in the building fabric due to older construction materials and techniques, etc.
[Sharpe et al. 2014].
2.2.3 Number of occupants
High occupant places also have a higher fungal spore or fragment concentration. The number of
people occupying an environment can increase the risk of condensation and proliferation of
fungi [Sharpe et al. 2014]. Fungal spore release is affected by the air velocity above the surface
and texture of the surface [Andersen et al. 2011]. Kildeso et al. (2003) studied the release of
particles from several typical indoor fungi growing on building material (gypsum boards) for 4–
6 weeks and saw differences between different fungal species and whether they released
spores or fragments. The type of released particles was influenced by the velocity of the air
current. However, toxic fungi (Stachybotrys sp. and Chaetomium sp.) do not readily become
airborne [Andersen et al. 2002]. Also, an essential element of "niche based theories of species
diversity" suggests that spatial heterogeneity in environmental conditions is a critical cause of
species diversity. Therefore, a more heterogeneous area can provide more suitable conditions
for a larger number of species [Chase & Leibold 2003; Hutchinson 1957].
With high occupancy environments and the risk of high humidity, air ventilation is critical in
indoor environments. Windows may help to eliminate moisture build up on the surfaces of
indoor material to decrease microbial growth [Jamriska et al. 2000]. Windows however can also
provide an area of great microbial growth. With the opening of windows and changes of
weather and precipitation, microbes can use window sills as substrates to grow. Thus frequent
cleaning around windows in indoor environments is important to decrease microbial growth on
this substrate.
Highly populated indoor environments can also lead to a higher production of indoor dust,
which contain organic substrates that can act as a major source of nutrient that enable
9 | P a g e
microbes to grow [Brown et al. 1996]. Another factor that can affect dust and microbial growth
in indoor environments is the use of household vacuums. Passive accumulation of particles is
formed from the surrounding environments, and therefore indoor microbial assemblages can
be shaped and even enriched by household vacuum cleaners or HVAC systems without a high
efficiency particulate air (HEPA) filtration. Fungi and dust can build up in these dark spaces and
act as an incubator and disperse fungal spores indoors [Cheong & Neumeister-Kemp 2005;
Sharpe et al. 2014]. As a result, cleanliness of built environments is another factor that can
correlate with fungal growth in indoor environments.
2.3 Fungal growth on construction and finishing materials
Fungi can grow on many different types of materials and substrates. Temperature, humidity,
and type of surface are the three important factors that could determine fungal growth in
indoor environments.
2.3.1 Wood
Damage to an indoor structure made of wood due to microorganisms can be an economically
costly occurrence. In 1977 the UK estimated the cost of repairing fungal damaged timber used
in construction amounted to £3 million per week [Schmidt 2007]. Wood is highly susceptible to
fungal colonization by fungi such as Cladosporium, Penicillium, and Aspergillus [Bjurman 1994].
In addition, basidiomycetes such as white rot and brown rot fungi can also grow on these
materials and lead to their decay, with Serpula lacrymans being the most common indoor
basidiomycete [Schmidt 2007]. Drying wood leads to a higher nitrogen concentration and lower
molecular carbohydrates on the surface, leading to a higher susceptibility to mould growth
[Thelander et al. 1993, Viitanen 1997]. Some engineered wood products such as Oriented
Strand Boards (OSB), plywood, and Medium Density Fiberboard (MDF) are more susceptible to
growth of Aspergillus, Trichoderma, and Penicillium than solid wood and wood composites
[Mankowski & Morrell 2000], while woods such as Douglas-fir heartwood provide more
durability and are less susceptible to these microrganisms [Yan & Morrell 2015].
2.3.2 Wallpaper
Both paper and glue are good media for fungal growth and thus wallpaper is very susceptible to
mould growth [Bissett 1987; Grant et al. 1989]. Synthetic polymers such as synthetic rubber
and plastic can also be degraded by Aspergillus niger, Aspergillus flavus, Aureobasidium
pullulans, Chaetomium sp., Penicillium funiculosum, Penicillium luteum, and Trichoderma sp.
[Flannigan et al. 2001].
10 | P a g e
2.3.3 Plastics and glass
Fungi can also grow on polyethylene and polyvinyl chloride (PVC) as they can degrade
plasticizers including organic acid esters [Webb et al. 2000]. Glass reinforced plastics (GRP),
known as fiberglass, and fiberglass ceiling tiles are other susceptible materials that can support
fungal growth, especially A. versicolor, and Penicillium sp. [Horak et al. 1985, Steyn & Vleggaar
1976].
2.3.4 Paint
Fungi can also grow on water-based or solvent-based paints; however, it isn't clear whether
moulds found on the surface are using the paint components or taking nutrients from the dust
on the surface [Allsopp et al. 2004]. In general, paints can increase or decrease the
susceptibility of a given base material, depending on the type of fungi growing on the substrate.
For example, paints can prevent the growth of Aureobasidium pullulans, while Penicillium and
Aspergillus species can grow rapidly on paints [Nielsen 2003].
2.3.5 Carpet
The presence of carpets indoor can also influence fungal growth [Sharpe et al. 2014; Wnni et al.
2014]. High humidity that makes carpets wet, is responsible for producing a suitable growth
condition for fungi such as Alternaria sp. [DEHS 2010; Wani et al. 2014]. There are many ways
to prevent fungal contamination of carpets such as the use of surface disinfectants, removal of
wet organic material regularly, and proper ventilation [Wani et al. 2014].
2.3.6 Dust
Dust is a mixture of organic and inorganic airborne air particles, originating from the indoor and
outdoor environments [Scott et al. 2004]. The main constituents of house dust are plant pollen,
human and animal hair, live and dead dust mites, textile fibers, paper fibers, human skin cells
and other organic debris [Brown et al. 1996]. Exposure to house dust is mainly via inhalation,
but to a lesser extent also by mouth, hand activities, and ingestion of dust [WHO 2009]. These
organic substrates act as a major source of nutrients that enable organisms such as animals
(arthropods, rodents), bacteria and fungi to grow on the surface of building materials such as
steel, glass, brick, concrete, gypsum drywall, and stones [Brown et al. 1996; Harvey & May
1990; Scott 2001]. The main components of the dust microbiome are viable and non-viable
fungal spores, fragments of spores, hyphae, lichen soredia, fruiting bodies, bacterial cells,
endospores, and fragmented cells [Pitkaranta 2012]. Therefore, dust analysis may be used as a
means to observe the presence of fungal species that have accumulated over time in a room
[Portnoy et al. 2004]. This method has been particularly used in earlier monitoring studies
[Abdalla 1988; De-Wei & Kendrick 1955; Wani et al. 2014].
11 | P a g e
2.3.7 Gypsum boards
Drywall (also known as plasterboard, wallboard, gypsum board, or LAGYP) is a panel made
of gypsum plaster pressed between two thick sheets of paper. Drywall is a ubiquitous building
material used in all construction and was invented in early 1900s, but did not become
predominantly used until after War World II [Wakili et al. 2014]. It is used to make interior walls
and ceilings of buildings and is sold under the trademarks Sheetrock, Gyproc, and Gyprock.
North America is one of the largest gypsum board users in the world. These drywall pieces
serve not only as a thermal store but as a heat exchanger as well [Wakili et al. 2014].
A manufactured wallboard panel consists of a layer of gypsum plaster sandwiched between two
layers of paper [Mehta et al. 2008]. Gypsum is a mineral found in sedimentary rock formations
in a crystalline form known as calcium sulfate dihydrate CaSO4•2H2O. The raw gypsum, CaSO4·2
H2O, is heated (350oF) to drive off the water then slightly re-hydrated to produce the hemi-
hydrate of calcium sulfate (CaSO4·½ H2O) [Mehta et al. 2008; Chandara et al. 2009; Wakili et al.
2014]. These gypsum crystals also provide good compressive strength properties to the final
composite/sandwiched material system [Chen et al. 2010]. The plaster is then mixed with fiber
(typically paper and/or fibreglass), plasticizer, foaming agent, and ground gypsum crystal as an
accelerator, EDTA, and other additives that may decrease mildew and increase fire resistance
(fibreglass and vermiculite) [Wakili et al. 2014]. The board is then formed by sandwiching a core
of the wet mixture between two sheets of heavy paper or fibreglass mats. The sheets of paper,
which are made up of cellulose and starch [Pasanen et al. 1997], provide tensile strength to the
board and hold the gypsum together to give them a smoother edge for easier application.
When the core sets, it is then dried in a large drying chamber, and the sandwich becomes rigid
and strong enough for use as a building material. The mechanical strength origin of these
building materials is still unclear (Chen et al. 2010).
Advantages of using drywall include ease of installation, fire resistance, sound isolation,
durability, versatility, and their installation at low costs. However, their major disadvantage is
their cellulosic paper backing which is susceptible to microbial growth [Figure 2.2]. Drywall can
be exposed to microorganisms during manufacturing, storage, transport, and the environment
where it is installed. Neighbouring materials installed with a high moisture capacity could
diffuse to drywall and lead to higher humidity [Dedesko & Siegel 2015]. Insulating material for
energy efficiency can also create potential for dampness and condensation [Dedesko & Siegel
2015]. After fungal growth is evident in buildings, the material must be ripped out and
replaced. The annual loss of drywall due to microbiological damage in the building industry
remains a problem.
12 | P a g e
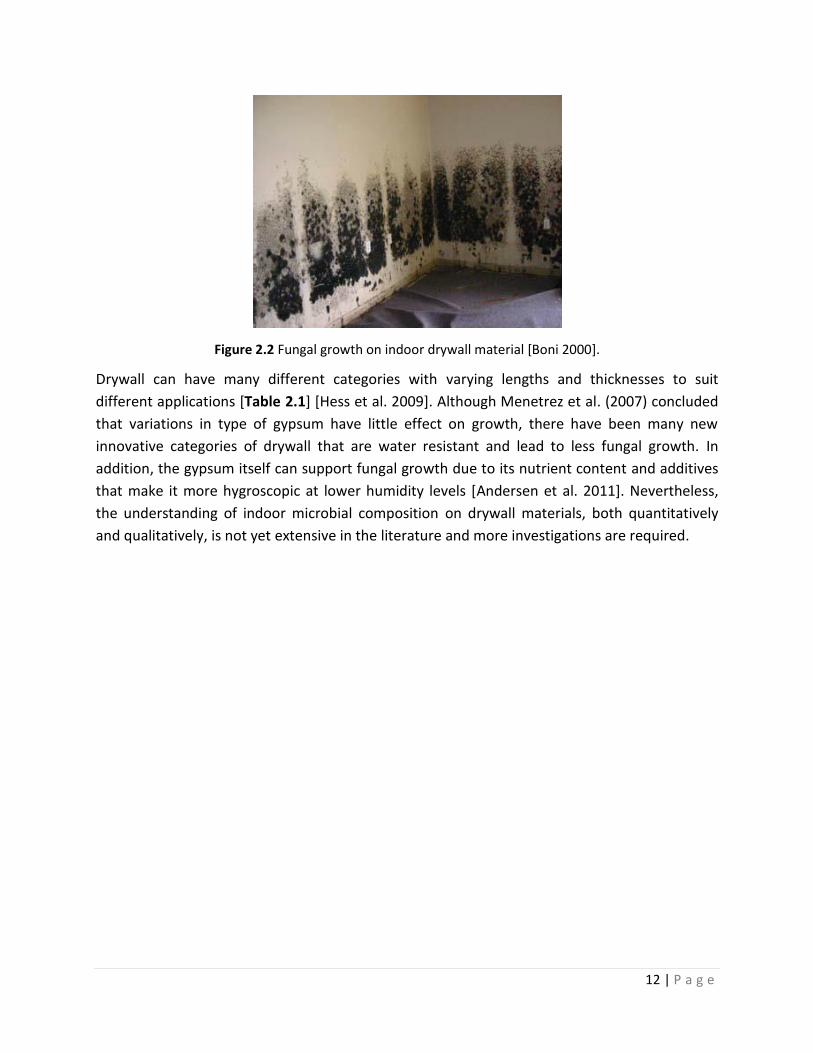
Figure 2.2 Fungal growth on indoor drywall material [Boni 2000].
Drywall can have many different categories with varying lengths and thicknesses to suit
different applications [Table 2.1] [Hess et al. 2009]. Although Menetrez et al. (2007) concluded
that variations in type of gypsum have little effect on growth, there have been many new
innovative categories of drywall that are water resistant and lead to less fungal growth. In
addition, the gypsum itself can support fungal growth due to its nutrient content and additives
that make it more hygroscopic at lower humidity levels [Andersen et al. 2011]. Nevertheless,
the understanding of indoor microbial composition on drywall materials, both quantitatively
and qualitatively, is not yet extensive in the literature and more investigations are required.

13 | P a g e
Table 2.1 The different categories of drywall available and their description and utility [Home Depot,
Home Hardware, RONA 2015]
Category of drywall Description
Fire-resistant (Type X) Different thickness and multiple layers of
wallboard provide increased fire rating.
Often perlite, vermiculite and boric acid are added
to improve fire resistance.
Gypsum “Firecode C”. This board is similar in composition to Type X,
except for more glass fibers and a form of
vermiculite, used to reduce shrinkage.
Greenboard Drywall that contains an oil-based additive/wax in
the green colored paper covering that provides
moisture resistance. It is more expensive. Its paper
covering resists water (but is not water-proof); can
be used in washrooms and other high humidity
areas.
Blueboard Is a plaster base board with blue coating to be
specifically finished with veneer plaster. It has high
water and mould resistance. Plastering requires a
skilled professional and is more expensive than
Greenboard.
Cement board This is more water-resistant than Greenboard, for
use in high humid areas.
Soundproof drywall Is a laminated drywall made with gypsum and
other materials such as damping polymers to
significantly increase the sound transmission
class rating.
HUMITEK: Mould resistant drywall
(new)/DensArmor paperless drywall
Paperless drywall. Gypsum is covered with
fiberglass.
Lead-lined drywall Drywall used around radiological equipment.
EcoRock/Enviroboard Drywall that uses a combination of 20 recycled
materials and no starch cellulose; it is advertised as
being environmentally friendly.
Controlled density (CD) Also called ceiling board, which is available only in
1/2" thickness and is significantly stiffer than
regular boards.
Phase change drywall (new) Stores and releases heat to save power. 26-45%
paraffin.
14 | P a g e
2.3.8 Biodeterioration and biodegradation
Fungi that live in buildings are saprotrophs and are key agents in structural decay [Scott et al.
2004]. Fungal growth can degrade material and affect the structural integrity of a building
[Portnoy et al. 2004]. The degrading enzymes and metabolites produced by the microorganisms
induce hydrolysis of cellulose macromolecules, leading to discoloration, mass loss, and an
increase in damage of internal areas of the material [Webb et al. 2000; Pekhtasheva et al.
2012]. Most of the natural and man-made compounds, in particular construction and finishing
materials that contain natural organic polymers including starch, cellulose, hemicellulose,
pectin, and lignin are most susceptible to fungal growth [Block 1953; Flannigan et al. 2001].
Inorganic compounds can also serve as a medium for fungal growth with the support of the
dust available in the atmosphere [Korpi et al. 1997; Pasanen et al. 1997]. The physical and
mechanical properties of these indoor materials can be affected over time by fungal growth.
Next to the microbially driven biodegradation mechanism, ‘biodeterioration’ of the material
can also take place, by definition due to abiotic factors such as temperature and UV radiation,
and lead to weight loss over time [Pekhtasheva et al. 2012, Ramirez et al. 2011].
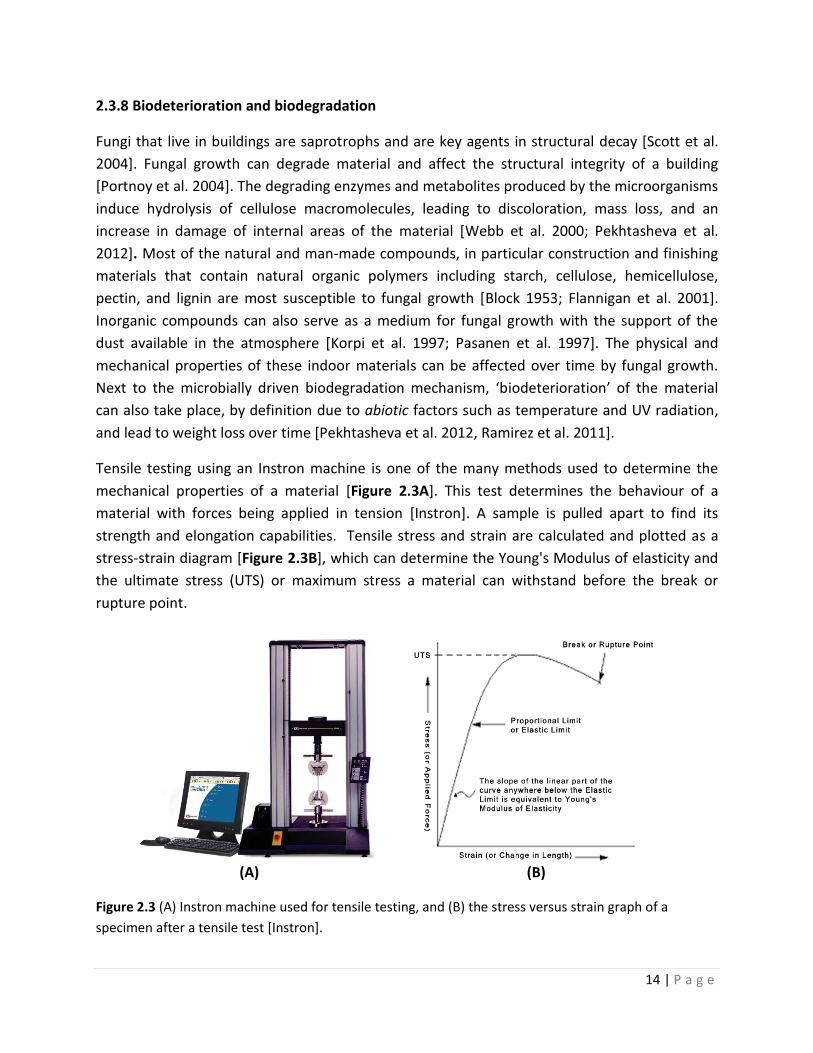
Tensile testing using an Instron machine is one of the many methods used to determine the
mechanical properties of a material [Figure 2.3A]. This test determines the behaviour of a
material with forces being applied in tension [Instron]. A sample is pulled apart to find its
strength and elongation capabilities. Tensile stress and strain are calculated and plotted as a
stress-strain diagram [Figure 2.3B], which can determine the Young's Modulus of elasticity and
the ultimate stress (UTS) or maximum stress a material can withstand before the break or
rupture point.
(A) (B)
Figure 2.3 (A) Instron machine used for tensile testing, and (B) the stress versus strain graph of a
specimen after a tensile test [Instron].
15 | P a g e
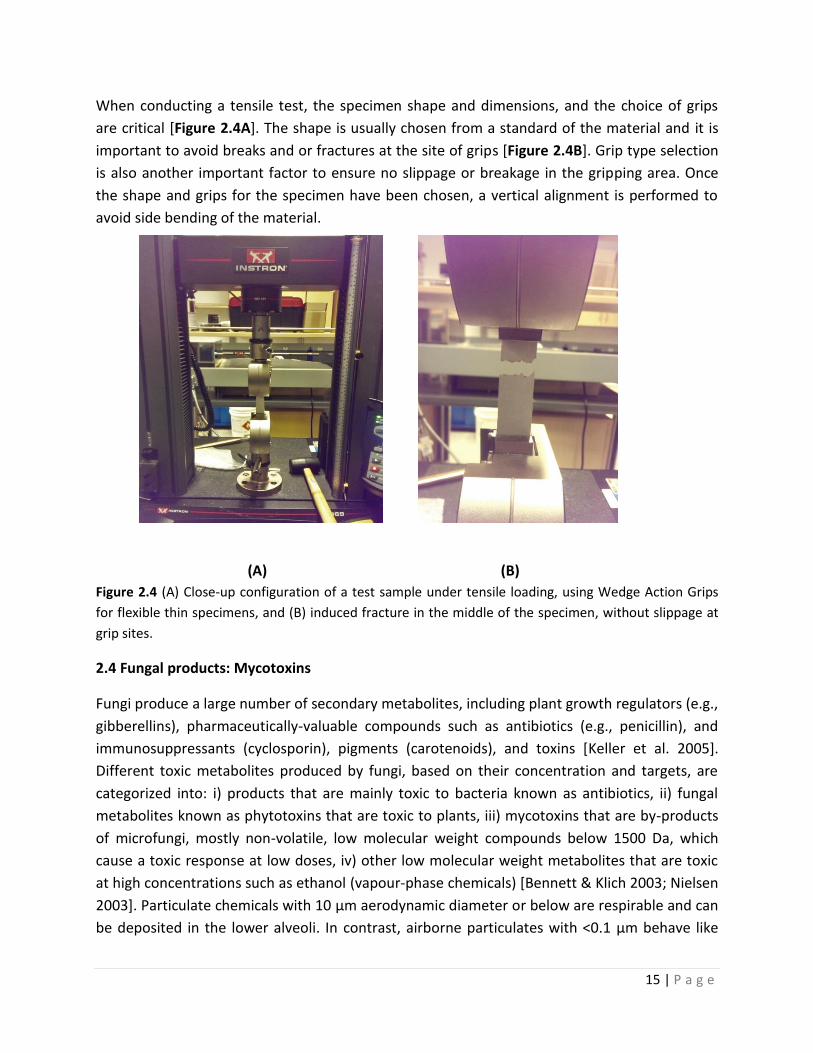
When conducting a tensile test, the specimen shape and dimensions, and the choice of grips
are critical [Figure 2.4A]. The shape is usually chosen from a standard of the material and it is
important to avoid breaks and or fractures at the site of grips [Figure 2.4B]. Grip type selection
is also another important factor to ensure no slippage or breakage in the gripping area. Once
the shape and grips for the specimen have been chosen, a vertical alignment is performed to
avoid side bending of the material.
(A) (B)
Figure 2.4 (A) Close-up configuration of a test sample under tensile loading, using Wedge Action Grips
for flexible thin specimens, and (B) induced fracture in the middle of the specimen, without slippage at
grip sites.
2.4 Fungal products: Mycotoxins
Fungi produce a large number of secondary metabolites, including plant growth regulators (e.g.,
gibberellins), pharmaceutically-valuable compounds such as antibiotics (e.g., penicillin), and
immunosuppressants (cyclosporin), pigments (carotenoids), and toxins [Keller et al. 2005].
Different toxic metabolites produced by fungi, based on their concentration and targets, are
categorized into: i) products that are mainly toxic to bacteria known as antibiotics, ii) fungal
metabolites known as phytotoxins that are toxic to plants, iii) mycotoxins that are by-products
of microfungi, mostly non-volatile, low molecular weight compounds below 1500 Da, which
cause a toxic response at low doses, iv) other low molecular weight metabolites that are toxic
at high concentrations such as ethanol (vapour-phase chemicals) [Bennett & Klich 2003; Nielsen
2003]. Particulate chemicals with 10 µm aerodynamic diameter or below are respirable and can
be deposited in the lower alveoli. In contrast, airborne particulates with <0.1 µm behave like
16 | P a g e
vapour based chemicals, and can move in and out of the airways with respiratory movements
[McGregor 1987].
It has been 54 years since mycotoxins were discovered [Bennett & Klich 2003]. Mycotoxins have
caused epidemics such as: i) ergotism from mouldy bread and alkaloids of Claviceps purpurea
that led to the death of hundreds of thousands of people, ii) alimentary toxic aleukia (ATA) that
killed 100,000 Russians during 1942-1948, iii) stachybotrytoxicosis that killed many horses in
the USSR in the 1930s, and iv) aflatoxicosis which killed more than 100,000 turkey spoults in the
United Kingdom in 1960 due to mould-contaminated peanut meals [Bennett & Klich 2003; Pitt
2000]. Many different fungal species are capable of producing mycotoxins that are toxic to
humans. Based on section 2.2 and the findings in this section, five of the most problematic and
common mycotoxin-producing fungi found in indoor environments have been summarized
below [Table 2.2].
17 | P a g e
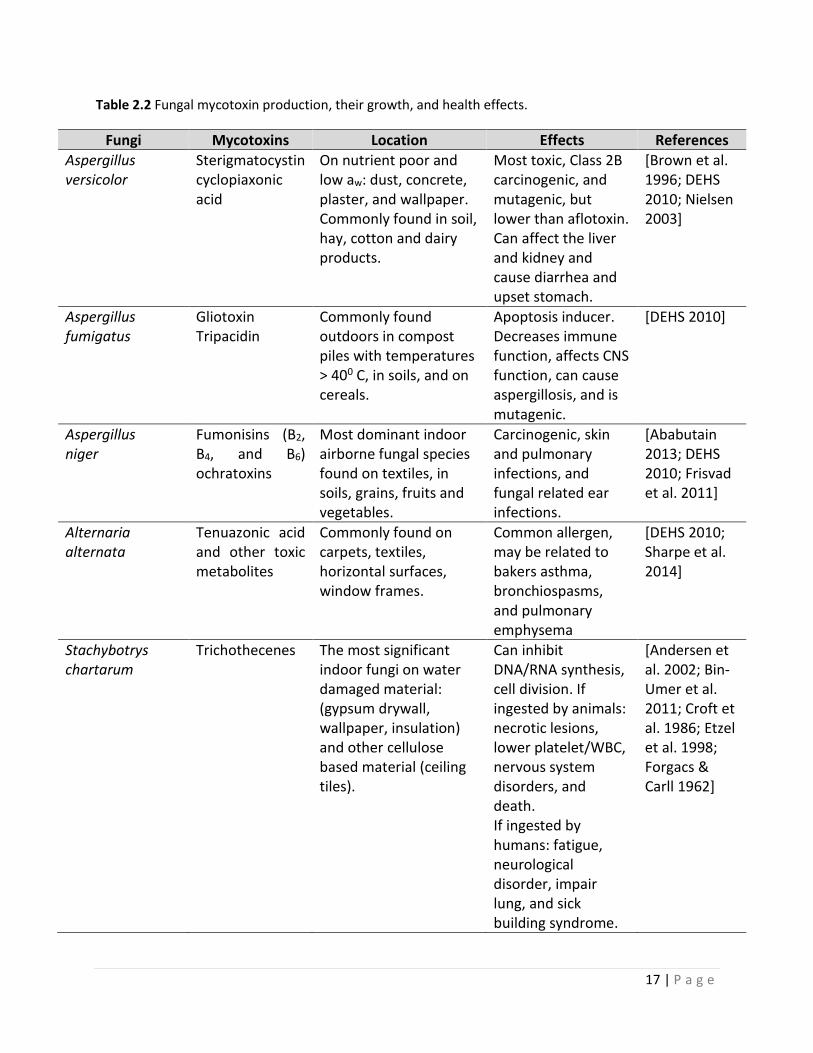
Table 2.2 Fungal mycotoxin production, their growth, and health effects.
Fungi Mycotoxins Location Effects References
Aspergillus versicolor
Sterigmatocystin cyclopiaxonic acid
On nutrient poor and low aw: dust, concrete, plaster, and wallpaper. Commonly found in soil, hay, cotton and dairy products.
Most toxic, Class 2B carcinogenic, and mutagenic, but lower than aflotoxin. Can affect the liver and kidney and cause diarrhea and upset stomach.
[Brown et al. 1996; DEHS 2010; Nielsen 2003]
Aspergillus fumigatus
Gliotoxin Tripacidin
Commonly found outdoors in compost piles with temperatures > 400 C, in soils, and on cereals.
Apoptosis inducer. Decreases immune function, affects CNS function, can cause aspergillosis, and is mutagenic.
[DEHS 2010]
Aspergillus niger
Fumonisins (B2, B4, and B6) ochratoxins
Most dominant indoor airborne fungal species found on textiles, in soils, grains, fruits and vegetables.
Carcinogenic, skin and pulmonary infections, and fungal related ear infections.
[Ababutain 2013; DEHS 2010; Frisvad et al. 2011]
Alternaria alternata
Tenuazonic acid and other toxic metabolites
Commonly found on carpets, textiles, horizontal surfaces, window frames.
Common allergen, may be related to bakers asthma, bronchiospasms, and pulmonary emphysema
[DEHS 2010; Sharpe et al. 2014]
Stachybotrys chartarum
Trichothecenes
The most significant indoor fungi on water damaged material: (gypsum drywall, wallpaper, insulation) and other cellulose based material (ceiling tiles).
Can inhibit DNA/RNA synthesis, cell division. If ingested by animals: necrotic lesions, lower platelet/WBC, nervous system disorders, and death. If ingested by humans: fatigue, neurological disorder, impair lung, and sick building syndrome.
[Andersen et al. 2002; Bin-Umer et al. 2011; Croft et al. 1986; Etzel et al. 1998; Forgacs & Carll 1962]
18 | P a g e
Some species of fungi are capable of producing a variety of mycotoxins. Production may also
vary depending on the interaction with other fungal species and other microbes, water activity,
temperature, gas composition and the presence of chemical preservatives [Bennett & Klich
2003; Varga et al. 2005]. It is theorized that mycotoxin production occurs in idiophase when
fungal growth is halted, usually because of the nutrient exhaustion [Demain 1986]; however,
there is also evidence of mycotoxin production during active growth of fungi [Magan & Aldred
2007]. Other studies show that mycotoxin production was stimulated by the initiation of stress,
particularly drought stress, when conditions were marginal for growth [Magan & Aldred 2007].
For instance, Aspergillus carbonarious grows optimally at 30-350 C and 0.95 aw, but instead of
growth A. carbonarious produces ochratoxin A (OTA), which is a mycotoxin associated with
nephrotoxicity, hepatotoxicity, immunotoxicity effects on animals or the human body [Esteban
et al. 2004; Hohler 1998]. In the following sub-sections two fungal mycotoxins including
Sterigmatocystin and Trichothecenes will be reviewed, due to their significance in indoor
environments.
2.4.1 Sterigmatocystin
Sterigmatocystin is an intermediate product in the aflatoxin biosynthetic pathway or the end-
product in different ascomycetes. It is produced by 20 different species of fungi such as A.
versicolor and A. nidulans [Brown et al. 1996]. A. versicolor is one of the most frequently
occurring species identified in damp indoor environments, as a result of its ability to grow on
very nutrient poor materials and low aw such as dust, concrete, and plaster [Nielsen 2003]. Also
more was found in non-sporulating mycelium in contrast to conidia [Nielsen et al. 1998].
Sterigmatocystin is among the most toxic, mutagenic, and carcinogenic natural products, but
considerably lower than aflatoxins [Brown et al. 1996]. This toxin has major effects on the liver
and kidney, and is classified as a class 2B carcinogen [Brown et al. 1996].
2.4.2 Trichothecenes
Trichothecene mycotoxins are produced by different genera including Fusarium, Spicellum,
Stachybotrys, Cephalosporium, Trichoderma, and Trichothecium. Fungi with trichothecene
production abilities are responsible for the spoilage of cereal crops and various fruits; however,
among these genera, Stachybotrys has been demonstrated as a significant indoor environment
contaminant which is associated with damp building-related illnesses [Nielsen 2003; Yike et al.
2007]. In general, trichothecene-producing species can grow on water damaged building
materials (e.g., gypsum boards, wallpaper, and insulation) and any cellulose-based building
materials [Andersen et al. 2002].
These active compounds are capable of inhibiting eukaryotic protein synthesis, inhibiting DNA,
RNA synthesis, cell division, membrane structure, and mitochondrial protein synthesis [Bin-
19 | P a g e
Umer et al. 2011]. Ingestion of this mycotoxin has been associated with necrotic lesions,
lowered platelet and WBC count, nervous system disorders and death [Forgacs & Carll 1962]. It
may also cause chronic fatigue, neurological disorders, impaired lung functions and sick building
syndrome [Croft et al. 1986; Etzel et al. 1998]. Residents of houses contaminated with
trichothecenes may suffer from illnesses such as the cold, flu, sore throat, diarrhea, headaches,
fatigue, dermatitis, and alopecia [Croft et al. 1986].
2.5 The indoor microbiome and health problems
The potential health problems may be categorized into three groups: i) general symptoms
including fatigue, memory and concentration problems, nausea, and a poor immune system, ii)
mucosal symptoms such as blocked nose, itching eyes, burning skin sensation, and recurrent
upper airways infections, and finally iii) lung symptoms such as wheezing, cough, bronchitis and
asthma [Bin-Umer et al. 2011].
Smaller-sized fragments have longer lifetimes in the air compared to larger spores, and can
penetrate into the alveolar region when inhaled. Moreover, due to their small size, fragments
may be able to evade phagocytosis by macrophages and can be transported through systemic
circulation [Cabral 2010]. The health impact of these fragments may therefore be greater than
that of spores [Cabral 2010].
Fungi and their products are associated with poor indoor air quality and sick building syndrome
[Karunasena et al. 2000]. Sick building syndrome (SBS) is a term commonly used to describe the
consequence of poor indoor air quality [Karunasena et al. 2000]. This term, coined in 1982, was
used to describe the many symptoms that are commonly observed [Karunasena et al. 2000].
Numerous studies have demonstrated that people living and working in damp or mouldy
buildings have an increased risk of airway infections, respiratory diseases such as mycoses,
hypersensitivity pneumonitis (HP), organic dust toxic syndrome (ODTS), as well as cancer
[Cabral 2010; Douwes et al. 2003; Mihinova & Pieckova 2012]. It has been estimated that 21%
of US asthma cases are attributed to dampness and mould exposure [Mihinova & Pieckova
2012]. In Sweden, Wickman et al. 1992 found that Penicillium, Alternaria, and Cladosporium
moulds were more common in homes of children with allergies. Asthma is a serious chronic
inflammatory problem that can be generated by a variety of allergens, such as pollen, animal
dander, dust mites, air pollutants, and moulds [Brunekreef et al. 1989]. The risk of opportunistic
infections is also on the rise [Brunekreef et al. 1989].
Health problems associated with mycotoxins depend on their type, duration and dose of
exposure, age, health and nutritional status of the affected individual [Adan & Samson 2011].
Acute toxicity of mycotoxins can lead to degeneration of liver or kidney or interfere with
protein synthesis. Chronic toxicity may result in cancer or tumor induction [Adan & Samson
20 | P a g e
2011]. Some may even interfere with DNA replication and produce mutagenic or teratogenic
responses [Adan & Samson 2011; Varga et al. 2005]. Although the key role of microbial growth
and emissions in building-related illnesses have been hypothesized, the evidence for its proof is
still weak [Pitkaranta 2012].
2.6 Sampling methods
Fungi in indoor environments can be sampled from the air, surfaces (eg. tape lifting), dust, and
materials. Sample detection techniques that require a short time, have reduced labour, and
great analytical frequency are still needed. When air sampling, special features need to be
considered. Differences in aerodynamic diameters of particles can affect collection. Short
sampling times are also a common problem while air sampling. One method of air sampling is
by collecting bioaerosols in microcentrifuge tubes [Lindsley et al. 2006], which can later be
analyzed by PCR and immunoassays.
It has been found that dust microbial measurements can reflect microbial load present over a
period of time longer than can be obtained using air samples [Portnoy et al 2004]. Thus by
collecting dust samples, evaluation of long term exposure is possible. It has been noted,
however, that single sample dust collections are not sufficient to provide satisfactory
concentrations of fungi present in indoor environments. There are spatial and temporal
variations in microbial concentrations and thus more than one sample would provide a better
representative of fungal communities present in the air. Outdoor samples should also be taken
for comparison, since it is an important source for indoor air [Mazur & Kim 2006].
Using these different methods of sampling requires further analysis to determine the microbial
communities present in indoor environments. One of these methods is the use of traditional
culture-based techniques. Many of these techniques, however, have limitations that result in
imprecise and inaccurate findings of indoor compositions both quantitatively and qualitatively
[Lee et al. 2010]. The key problem relates to selectivity and low resolution of such methods. For
example, traditional plate cultivation may only detect certain viable organisms and produce
results in laboratory conditions, but not those that are unculturable, dormant, or dead
[Pitkaranta 2012]. Some species also grow more rapidly than others and could over run others
on the culture plate, suggesting that many species may be missed if relying on culturing alone.
Thus a comprehensive study to characterize the main constituents of the built environment
microbiome using advanced DNA-based methods may offer solutions to these problems
[Mendell et al. 2011]. DNA-based methods are inexpensive, rapid and an accurate and standard
method that can be used for fungal DNA amplification.
21 | P a g e
2.7 Summary
Drywall is a common material used in construction of houses. Microbial growth, such as by
fungi, is a frequent problem and disadvantage of this type of material. In the past, research on
factors affecting indoor fungal growth on the gypsum drywall material has been limited. For this
reason, an understanding of the diversity of microbial communities such as fungi on this highly
common building material was deemed essential. Moreover, there still exists a gap in the
literature on understanding the effect of grown microbial communities on the physical and
mechanical properties of building materials. Thus an inter-disciplinary study is required and can
provide additional information on this topic. Such comprehension can eventually lead to better
design of new buildings, optimum selection of related materials, and reduction in human health
risks in built environments.
22 | P a g e
Chapter 3. Materials and Methods
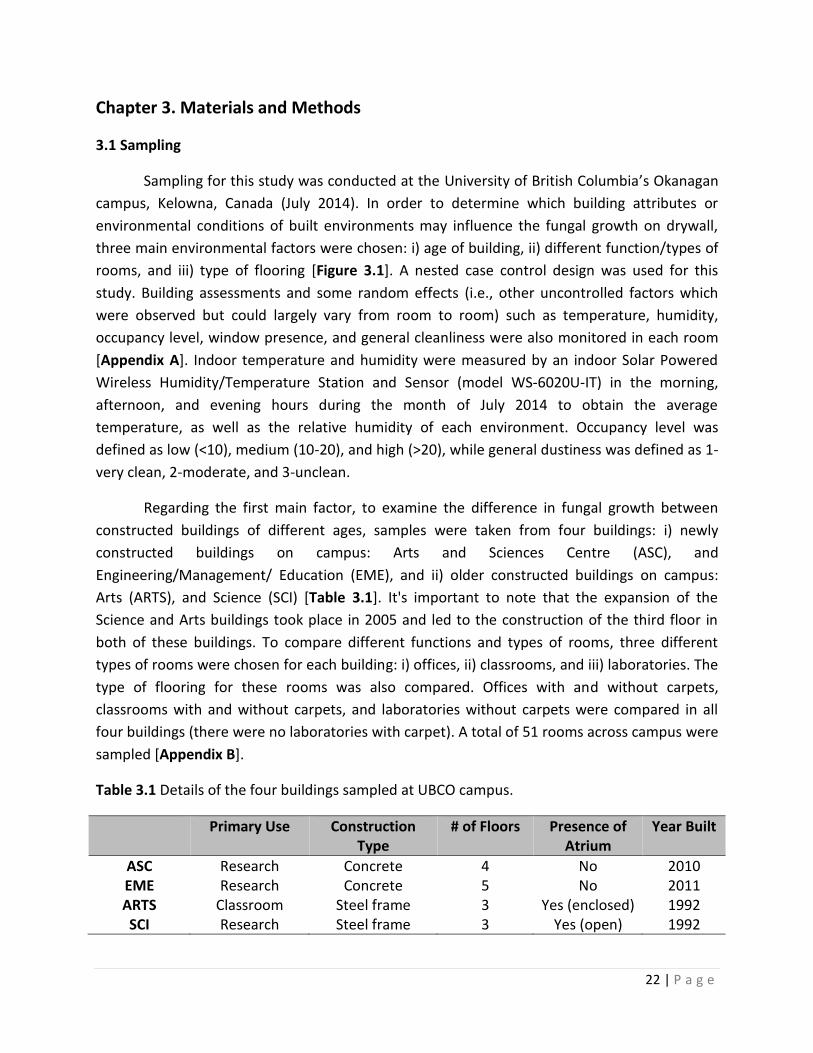
3.1 Sampling
Sampling for this study was conducted at the University of British Columbia’s Okanagan
campus, Kelowna, Canada (July 2014). In order to determine which building attributes or
environmental conditions of built environments may influence the fungal growth on drywall,
three main environmental factors were chosen: i) age of building, ii) different function/types of
rooms, and iii) type of flooring [Figure 3.1]. A nested case control design was used for this
study. Building assessments and some random effects (i.e., other uncontrolled factors which
were observed but could largely vary from room to room) such as temperature, humidity,
occupancy level, window presence, and general cleanliness were also monitored in each room
[Appendix A]. Indoor temperature and humidity were measured by an indoor Solar Powered
Wireless Humidity/Temperature Station and Sensor (model WS-6020U-IT) in the morning,
afternoon, and evening hours during the month of July 2014 to obtain the average
temperature, as well as the relative humidity of each environment. Occupancy level was
defined as low (<10), medium (10-20), and high (>20), while general dustiness was defined as 1-
very clean, 2-moderate, and 3-unclean.
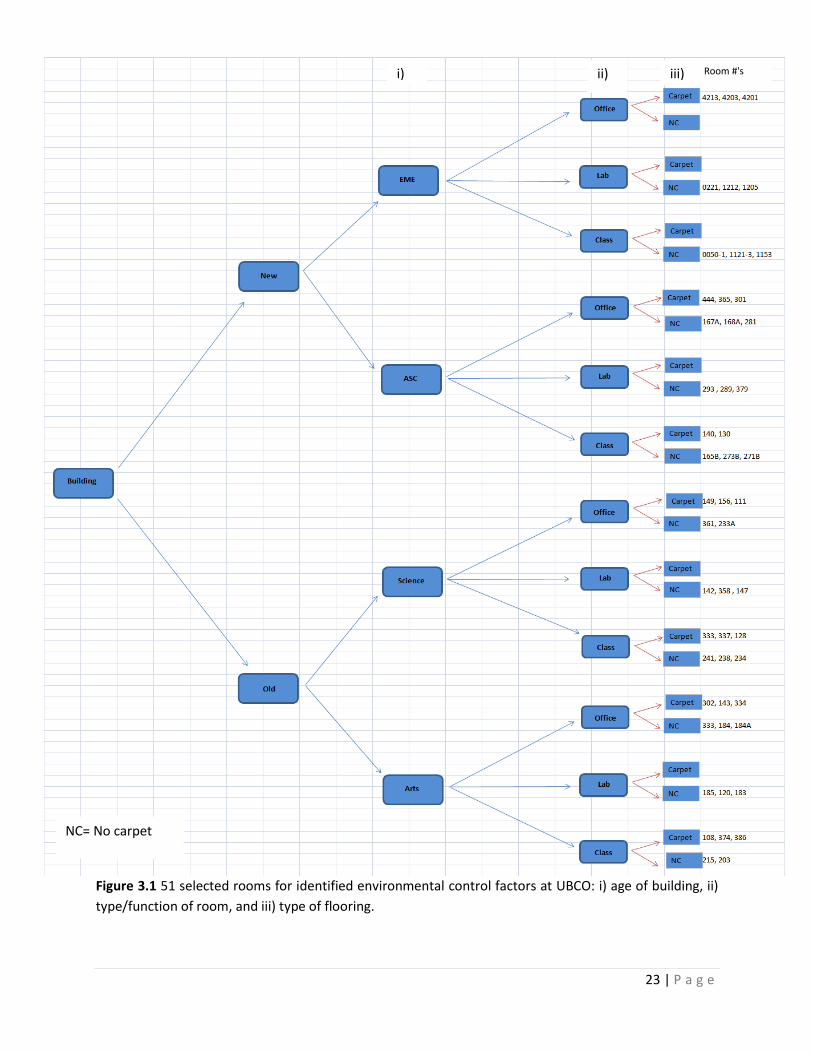
Regarding the first main factor, to examine the difference in fungal growth between
constructed buildings of different ages, samples were taken from four buildings: i) newly
constructed buildings on campus: Arts and Sciences Centre (ASC), and
Engineering/Management/ Education (EME), and ii) older constructed buildings on campus:
Arts (ARTS), and Science (SCI) [Table 3.1]. It's important to note that the expansion of the
Science and Arts buildings took place in 2005 and led to the construction of the third floor in
both of these buildings. To compare different functions and types of rooms, three different
types of rooms were chosen for each building: i) offices, ii) classrooms, and iii) laboratories. The
type of flooring for these rooms was also compared. Offices with and without carpets,
classrooms with and without carpets, and laboratories without carpets were compared in all
four buildings (there were no laboratories with carpet). A total of 51 rooms across campus were
sampled [Appendix B].
Table 3.1 Details of the four buildings sampled at UBCO campus.
Primary Use Construction Type
# of Floors Presence of Atrium
Year Built
ASC Research Concrete 4 No 2010 EME Research Concrete 5 No 2011 ARTS Classroom Steel frame 3 Yes (enclosed) 1992 SCI Research Steel frame 3 Yes (open) 1992
23 | P a g e
Figure 3.1 51 selected rooms for identified environmental control factors at UBCO: i) age of building, ii)
type/function of room, and iii) type of flooring.
i) ii) iii)
NC= No carpet
Room #'s
24 | P a g e
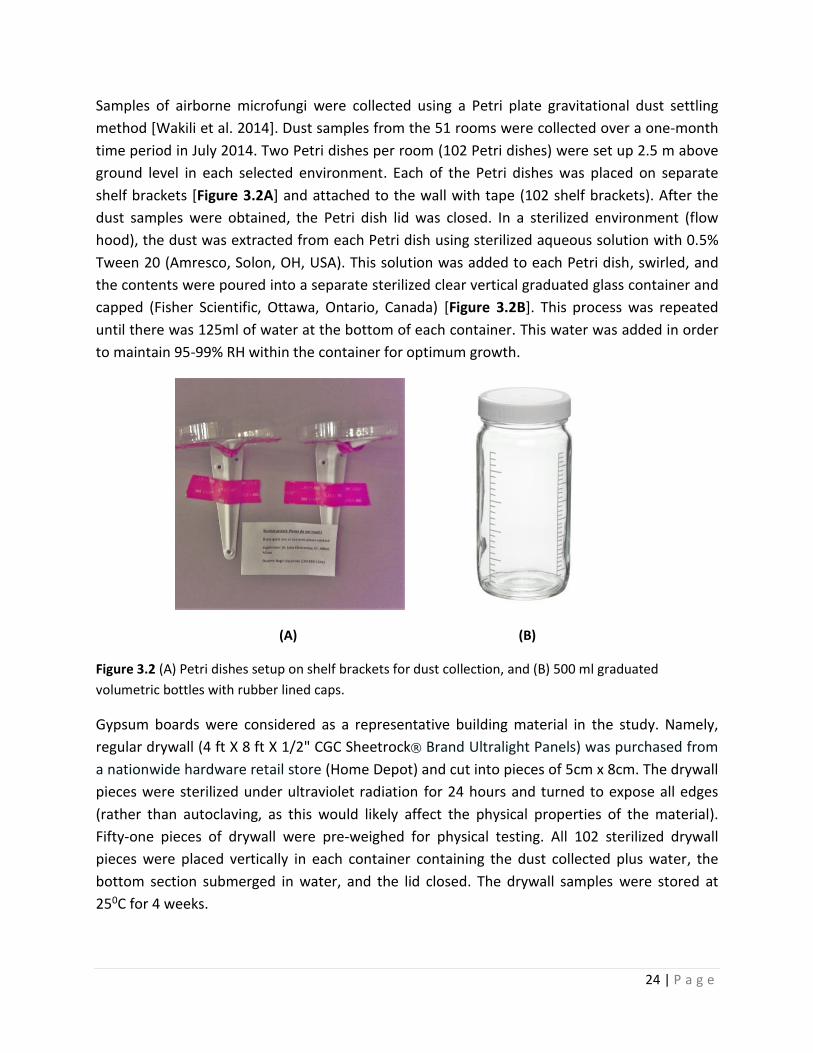
Samples of airborne microfungi were collected using a Petri plate gravitational dust settling
method [Wakili et al. 2014]. Dust samples from the 51 rooms were collected over a one-month
time period in July 2014. Two Petri dishes per room (102 Petri dishes) were set up 2.5 m above
ground level in each selected environment. Each of the Petri dishes was placed on separate
shelf brackets [Figure 3.2A] and attached to the wall with tape (102 shelf brackets). After the
dust samples were obtained, the Petri dish lid was closed. In a sterilized environment (flow
hood), the dust was extracted from each Petri dish using sterilized aqueous solution with 0.5%
Tween 20 (Amresco, Solon, OH, USA). This solution was added to each Petri dish, swirled, and
the contents were poured into a separate sterilized clear vertical graduated glass container and
capped (Fisher Scientific, Ottawa, Ontario, Canada) [Figure 3.2B]. This process was repeated
until there was 125ml of water at the bottom of each container. This water was added in order
to maintain 95-99% RH within the container for optimum growth.
(A) (B)
Figure 3.2 (A) Petri dishes setup on shelf brackets for dust collection, and (B) 500 ml graduated
volumetric bottles with rubber lined caps.
Gypsum boards were considered as a representative building material in the study. Namely,
regular drywall (4 ft X 8 ft X 1/2" CGC Sheetrock® Brand Ultralight Panels) was purchased from
a nationwide hardware retail store (Home Depot) and cut into pieces of 5cm x 8cm. The drywall
pieces were sterilized under ultraviolet radiation for 24 hours and turned to expose all edges
(rather than autoclaving, as this would likely affect the physical properties of the material).
Fifty-one pieces of drywall were pre-weighed for physical testing. All 102 sterilized drywall
pieces were placed vertically in each container containing the dust collected plus water, the
bottom section submerged in water, and the lid closed. The drywall samples were stored at
250C for 4 weeks.
25 | P a g e
3.2 Growth coverage
After a 4-week growth phase, one sample from each room was tested for % growth coverage
on the drywall sample using Image-J software [Sun et al. 2015]. A scale of 1-5 was used to
categorize the % growth, as defined below:
1 = minimal growth, (growth covering 0-20% of sample area)
2 = growth covering 20-40% of sample area
3 = growth covering 40-60% of sample area
4 = growth covering 60-80% of sample area
5 = growth covering majority (80-100%) of sample area
3.3 Fungal growth identification
After determining the % coverage of the drywall samples, they were assessed for fungal taxa
that are able to grow on gypsum boards in order to determine fungal diversity. The fungal
diversity index was the number of genera of fungi found on each of the 51 drywall samples.
Fungi growing on the drywall were transferred onto Potato Dextrose Agar (Difco, Detroit,
Michigan, USA) and incubated at room temperature for one week. Pure cultures from all
morphologically different colonies were grown and sub-cultured for identification to the
species level when possible, using macroscopic and microscopic characteristics. Wet mount
slides were made of the fungi using glycerol, and later examined for identification using a
compound microscope.
3.4 PCR of fungal species problematic for health
After fungal identification by culturing methods, further testing was required. In particular, in
order to better detect the presence and growth of fungal species that are known to be human
pathogens, a DNA-based approach (here PCR amplification) was used to further determine the
identity of the fungi present on the drywall samples. The drywall samples were examined for
the presence of three pathogenic fungi that commonly grow on indoor wet materials, including
Alternaria alternata, Aspergillus versicolor, and Aspergillus fumigatus [Brown et al. 1996;
Nielsen 2003, Mihinova & Pieckova 2012].
3.4.1 DNA extraction
DNA was extracted from the drywall samples using the FastDNA® SPIN Kit for Soil (MP,
Biomedicals, LLC, Solon, OH, USA) according to the manufacturer's instructions. Total DNA was
extracted from 500 mg of fungi growing on 51 drywall samples. Extracted DNA samples were
26 | P a g e
checked for integrity by agarose gel electrophoresis. The purity of the extracted DNA was
measured using NanoVue PlusTM spectrophotometer (GE Healthcare, Buckinghamshire, UK)
before preserving at -200C.
3.4.2 PCR amplification
After DNA extraction, each sample was selected for PCR amplification. Three sets of indoor
taxa-specific primers (IDT-Coralville, IA, USA) were selected for further identification of the
fungi on drywall samples [Table 3.2]. PCR amplifications were carried out using a C1000
TouchTM Thermal Cycler (BioRad, Ontario, Canada). Each PCR mixture (50 µl) contained 10 µl of
5X Green Go Taq® Flexi Buffer, 200 µM dNTPs, 2 µl MgCl2 (25 mM), 0.2 µM of each primer, 1.25
U of Go Taq® G2 Hot Start Polymerase (Promega, Madison, WI, USA), nuclease-free water (IDT-
Coralville, IA, USA), and 2 µl of extracted DNA (5 ng/µl).
The PCR conditions started with an initial DNA denaturation (94ºC for 2 min), followed by 25
cycles of 1 min at 94ºC (denaturing), 1 min at 52ºC (annealing), and 1 min at 72ºC (extension),
followed by a final extension of 5 min at 72ºC. Once the DNA was amplified, the procedure was
analyzed to check for integrity by agarose gel electrophoresis. 10 µl of PCR product was mixed
with loading buffer and loaded onto 2% agarose gel to control for PCR products. 5 µl of 1 KB
ladder (Invitrogen) was also used to visualize the size of DNA fragments generated. A negative
control without template was also used to test for PCR functioning.
Table 3.2 PCR primers used to identify the health hazardous indoor fungi on drywall specimens.
Primer name (direction)
Primer sequence (5' 3') Reference
Primer set 1
Aspergillus fumigatus (forward)
GCCCGCCGTTTCGAC
[Walsh et al. 2011]
(reverse) CCGTTGTTGAAAGTTTTAACTGATTAC
Primer set 2
Aspergillus versicolor (forward)
CGGCGGGGAGCCCT
[Blachere et al. 2007]
(reverse) CCATTGTTGAAAGTTTTGACTGATCTTA
Primer set 3
Alternaria alternata (forward)
GGCGGGCTGGAACCTC
[Haugland et al. 2002]
(reverse) GCAATTACAAAAGGTTTATGTTTGTCGTA
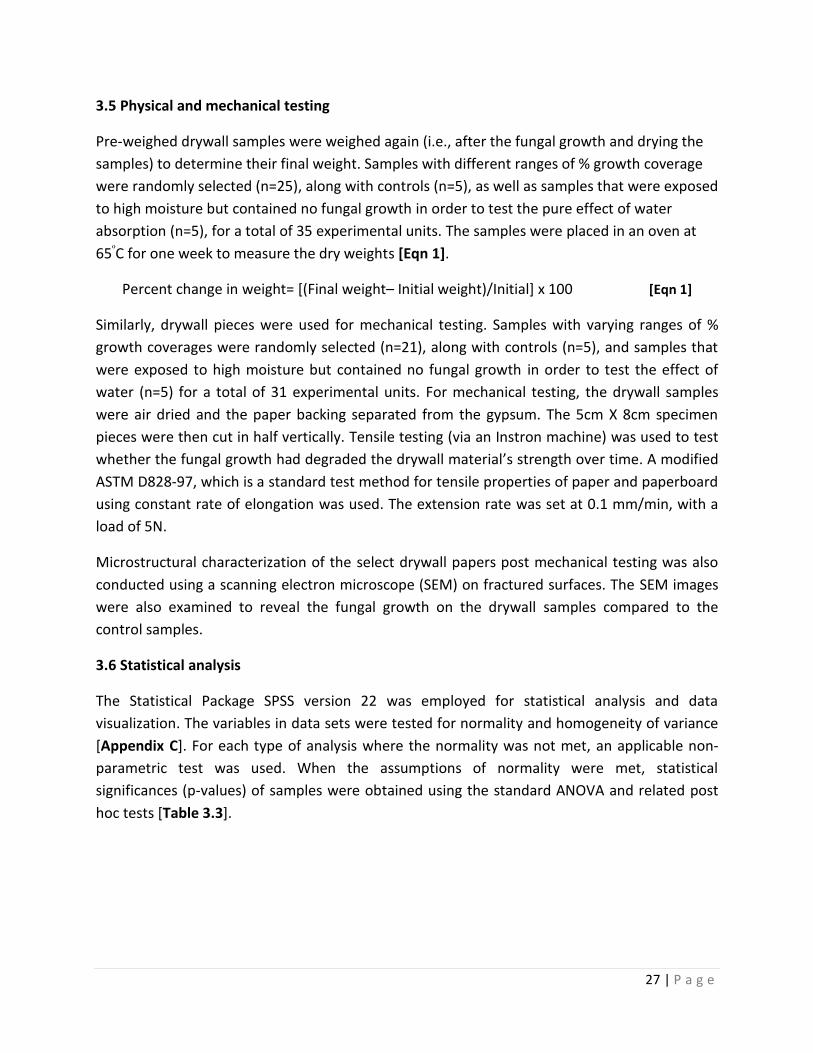
27 | P a g e
3.5 Physical and mechanical testing
Pre-weighed drywall samples were weighed again (i.e., after the fungal growth and drying the
samples) to determine their final weight. Samples with different ranges of % growth coverage
were randomly selected (n=25), along with controls (n=5), as well as samples that were exposed
to high moisture but contained no fungal growth in order to test the pure effect of water
absorption (n=5), for a total of 35 experimental units. The samples were placed in an oven at
65ºC for one week to measure the dry weights [Eqn 1].
Percent change in weight= [(Final weight– Initial weight)/Initial] x 100 [Eqn 1]
Similarly, drywall pieces were used for mechanical testing. Samples with varying ranges of %
growth coverages were randomly selected (n=21), along with controls (n=5), and samples that
were exposed to high moisture but contained no fungal growth in order to test the effect of
water (n=5) for a total of 31 experimental units. For mechanical testing, the drywall samples
were air dried and the paper backing separated from the gypsum. The 5cm X 8cm specimen
pieces were then cut in half vertically. Tensile testing (via an Instron machine) was used to test
whether the fungal growth had degraded the drywall material’s strength over time. A modified
ASTM D828-97, which is a standard test method for tensile properties of paper and paperboard
using constant rate of elongation was used. The extension rate was set at 0.1 mm/min, with a
load of 5N.
Microstructural characterization of the select drywall papers post mechanical testing was also
conducted using a scanning electron microscope (SEM) on fractured surfaces. The SEM images
were also examined to reveal the fungal growth on the drywall samples compared to the
control samples.
3.6 Statistical analysis
The Statistical Package SPSS version 22 was employed for statistical analysis and data
visualization. The variables in data sets were tested for normality and homogeneity of variance
[Appendix C]. For each type of analysis where the normality was not met, an applicable non-
parametric test was used. When the assumptions of normality were met, statistical
significances (p-values) of samples were obtained using the standard ANOVA and related post
hoc tests [Table 3.3].
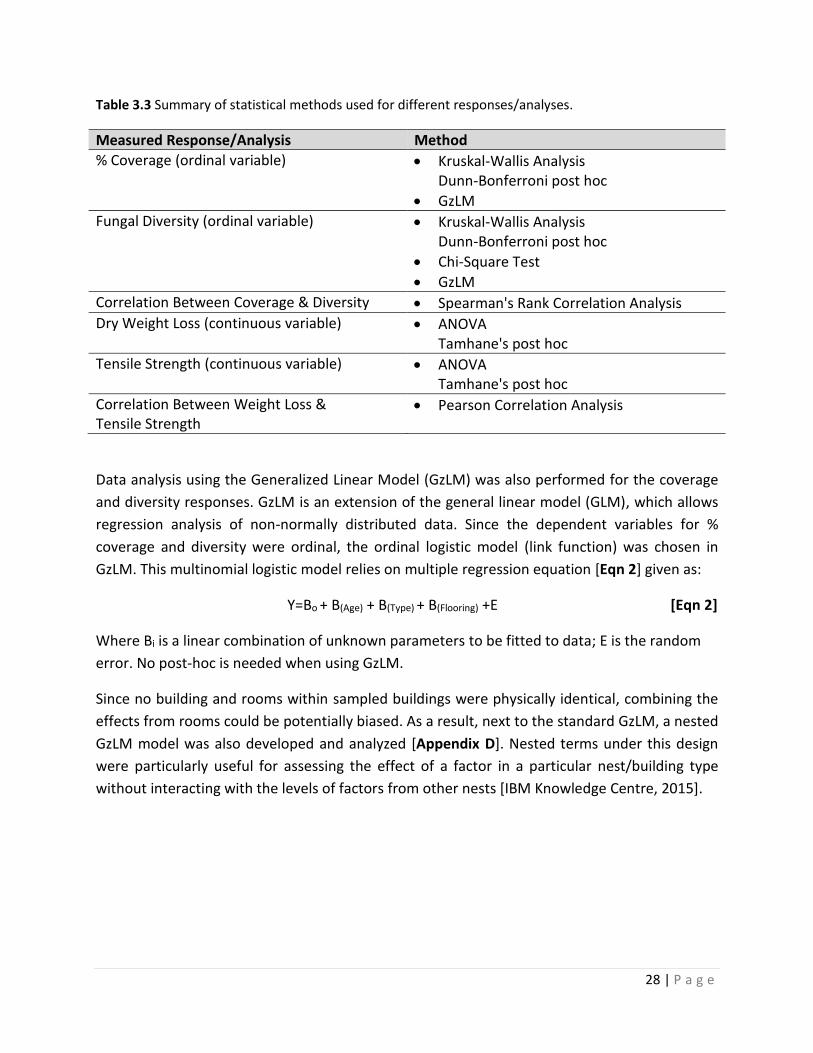
28 | P a g e
Table 3.3 Summary of statistical methods used for different responses/analyses.
Measured Response/Analysis Method
% Coverage (ordinal variable) Kruskal-Wallis Analysis Dunn-Bonferroni post hoc
GzLM
Fungal Diversity (ordinal variable) Kruskal-Wallis Analysis Dunn-Bonferroni post hoc
Chi-Square Test
GzLM
Correlation Between Coverage & Diversity Spearman's Rank Correlation Analysis
Dry Weight Loss (continuous variable) ANOVA Tamhane's post hoc
Tensile Strength (continuous variable) ANOVA Tamhane's post hoc
Correlation Between Weight Loss & Tensile Strength
Pearson Correlation Analysis
Data analysis using the Generalized Linear Model (GzLM) was also performed for the coverage
and diversity responses. GzLM is an extension of the general linear model (GLM), which allows
regression analysis of non-normally distributed data. Since the dependent variables for %
coverage and diversity were ordinal, the ordinal logistic model (link function) was chosen in
GzLM. This multinomial logistic model relies on multiple regression equation [Eqn 2] given as:
Y=Bo + B(Age) + B(Type) + B(Flooring) +E [Eqn 2]
Where Bi is a linear combination of unknown parameters to be fitted to data; E is the random
error. No post-hoc is needed when using GzLM.
Since no building and rooms within sampled buildings were physically identical, combining the
effects from rooms could be potentially biased. As a result, next to the standard GzLM, a nested
GzLM model was also developed and analyzed [Appendix D]. Nested terms under this design
were particularly useful for assessing the effect of a factor in a particular nest/building type
without interacting with the levels of factors from other nests [IBM Knowledge Centre, 2015].
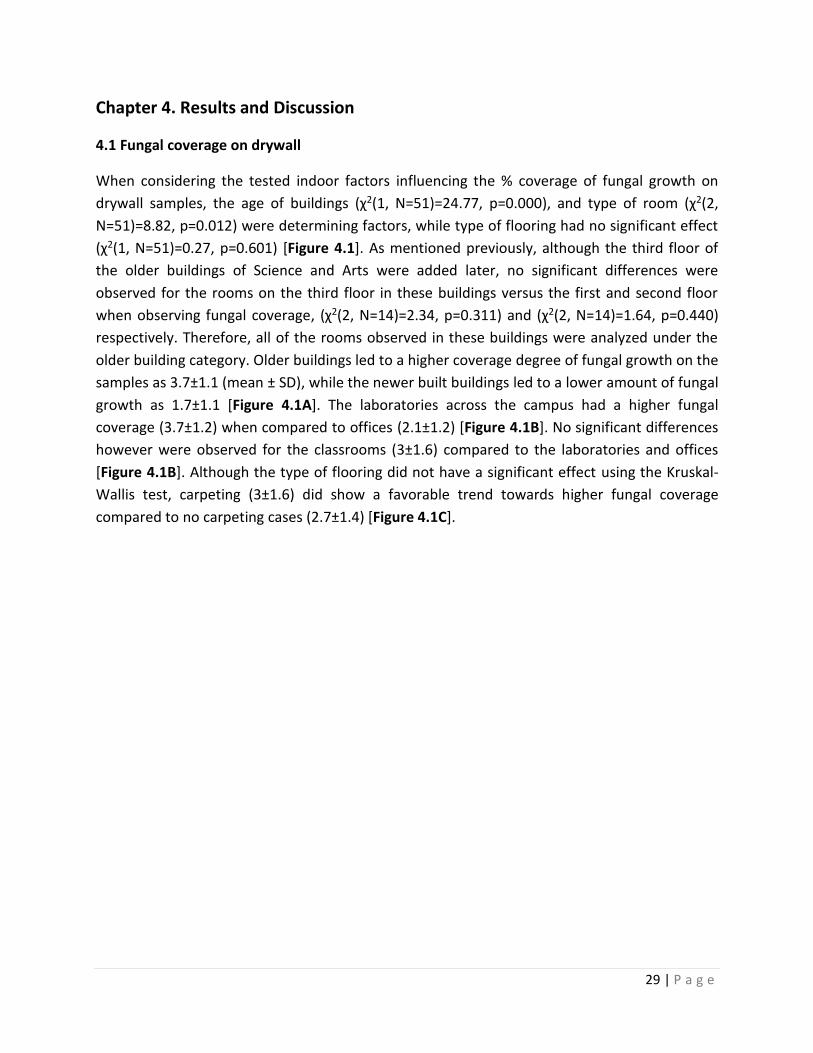
29 | P a g e
Chapter 4. Results and Discussion
4.1 Fungal coverage on drywall
When considering the tested indoor factors influencing the % coverage of fungal growth on
drywall samples, the age of buildings (χ2(1, N=51)=24.77, p=0.000), and type of room (χ2(2,
N=51)=8.82, p=0.012) were determining factors, while type of flooring had no significant effect
(χ2(1, N=51)=0.27, p=0.601) [Figure 4.1]. As mentioned previously, although the third floor of
the older buildings of Science and Arts were added later, no significant differences were
observed for the rooms on the third floor in these buildings versus the first and second floor
when observing fungal coverage, (χ2(2, N=14)=2.34, p=0.311) and (χ2(2, N=14)=1.64, p=0.440)
respectively. Therefore, all of the rooms observed in these buildings were analyzed under the
older building category. Older buildings led to a higher coverage degree of fungal growth on the
samples as 3.7±1.1 (mean ± SD), while the newer built buildings led to a lower amount of fungal
growth as 1.7±1.1 [Figure 4.1A]. The laboratories across the campus had a higher fungal
coverage (3.7±1.2) when compared to offices (2.1±1.2) [Figure 4.1B]. No significant differences
however were observed for the classrooms (3±1.6) compared to the laboratories and offices
[Figure 4.1B]. Although the type of flooring did not have a significant effect using the Kruskal-
Wallis test, carpeting (3±1.6) did show a favorable trend towards higher fungal coverage
compared to no carpeting cases (2.7±1.4) [Figure 4.1C].
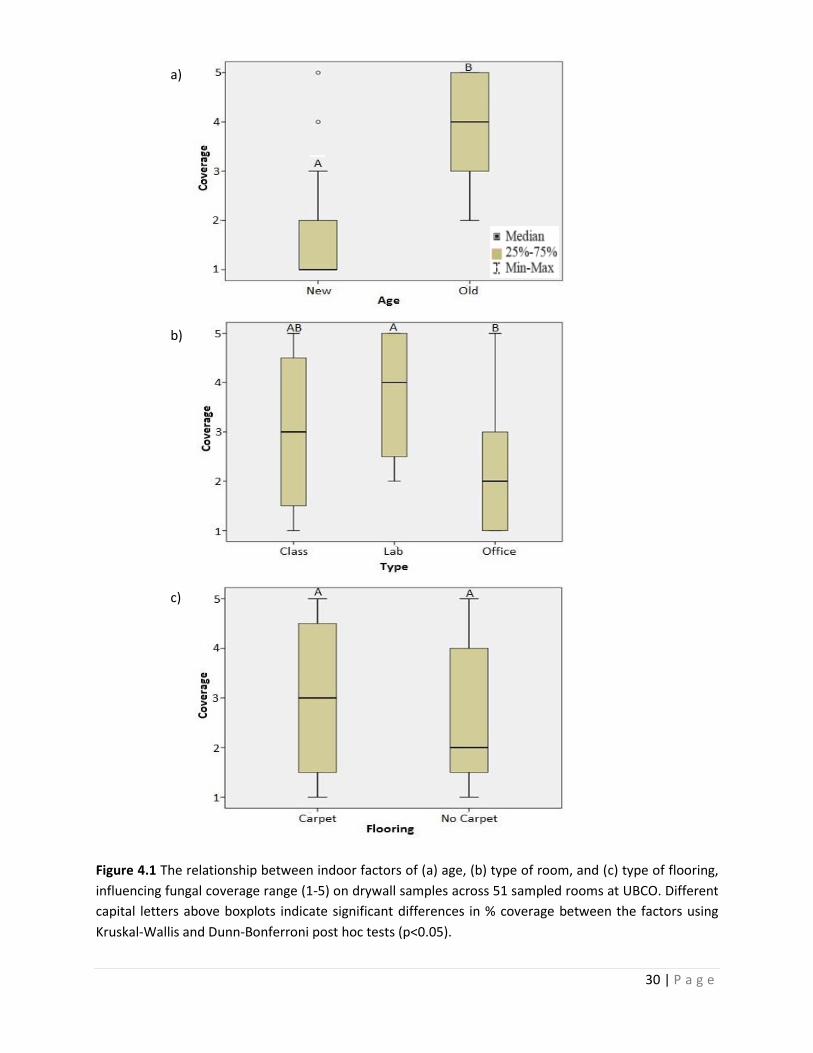
30 | P a g e
Figure 4.1 The relationship between indoor factors of (a) age, (b) type of room, and (c) type of flooring,
influencing fungal coverage range (1-5) on drywall samples across 51 sampled rooms at UBCO. Different
capital letters above boxplots indicate significant differences in % coverage between the factors using
Kruskal-Wallis and Dunn-Bonferroni post hoc tests (p<0.05).
a)
b)
c)
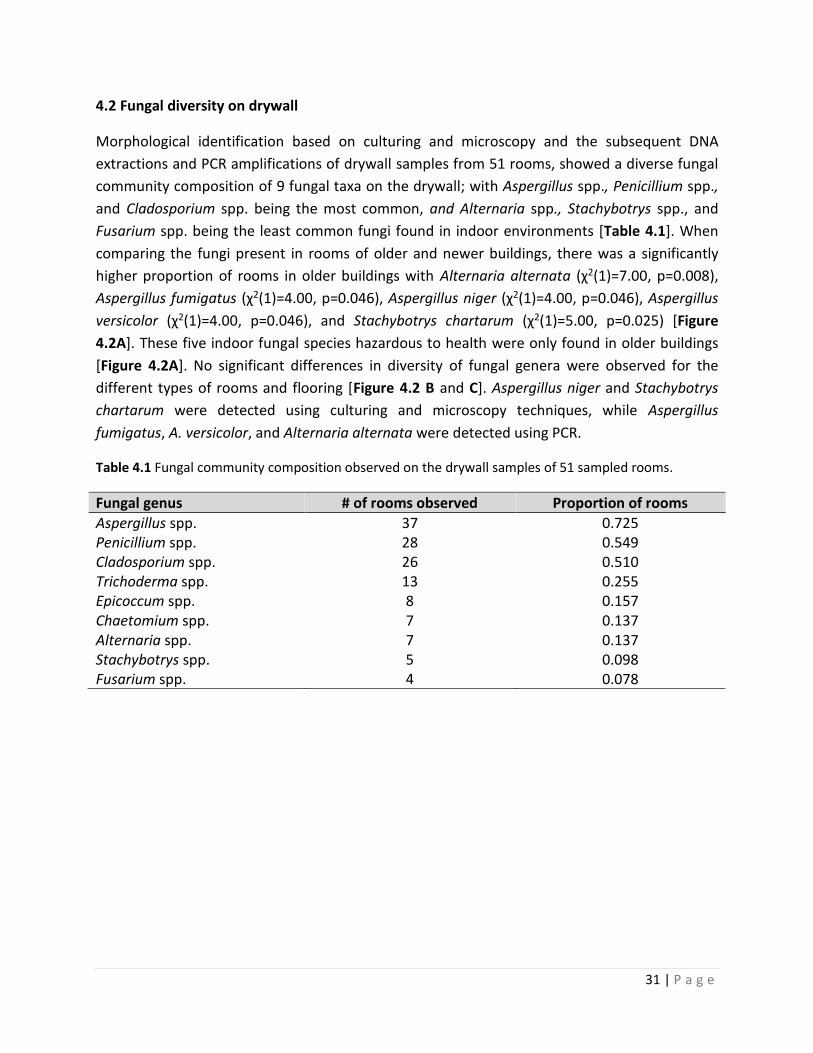
31 | P a g e
4.2 Fungal diversity on drywall
Morphological identification based on culturing and microscopy and the subsequent DNA
extractions and PCR amplifications of drywall samples from 51 rooms, showed a diverse fungal
community composition of 9 fungal taxa on the drywall; with Aspergillus spp., Penicillium spp.,
and Cladosporium spp. being the most common, and Alternaria spp., Stachybotrys spp., and
Fusarium spp. being the least common fungi found in indoor environments [Table 4.1]. When
comparing the fungi present in rooms of older and newer buildings, there was a significantly
higher proportion of rooms in older buildings with Alternaria alternata (χ2(1)=7.00, p=0.008),
Aspergillus fumigatus (χ2(1)=4.00, p=0.046), Aspergillus niger (χ2(1)=4.00, p=0.046), Aspergillus
versicolor (χ2(1)=4.00, p=0.046), and Stachybotrys chartarum (χ2(1)=5.00, p=0.025) [Figure
4.2A]. These five indoor fungal species hazardous to health were only found in older buildings
[Figure 4.2A]. No significant differences in diversity of fungal genera were observed for the
different types of rooms and flooring [Figure 4.2 B and C]. Aspergillus niger and Stachybotrys
chartarum were detected using culturing and microscopy techniques, while Aspergillus
fumigatus, A. versicolor, and Alternaria alternata were detected using PCR.
Table 4.1 Fungal community composition observed on the drywall samples of 51 sampled rooms.
Fungal genus # of rooms observed Proportion of rooms
Aspergillus spp. 37 0.725 Penicillium spp. 28 0.549 Cladosporium spp. 26 0.510 Trichoderma spp. 13 0.255 Epicoccum spp. 8 0.157 Chaetomium spp. 7 0.137 Alternaria spp. 7 0.137 Stachybotrys spp. 5 0.098 Fusarium spp. 4 0.078
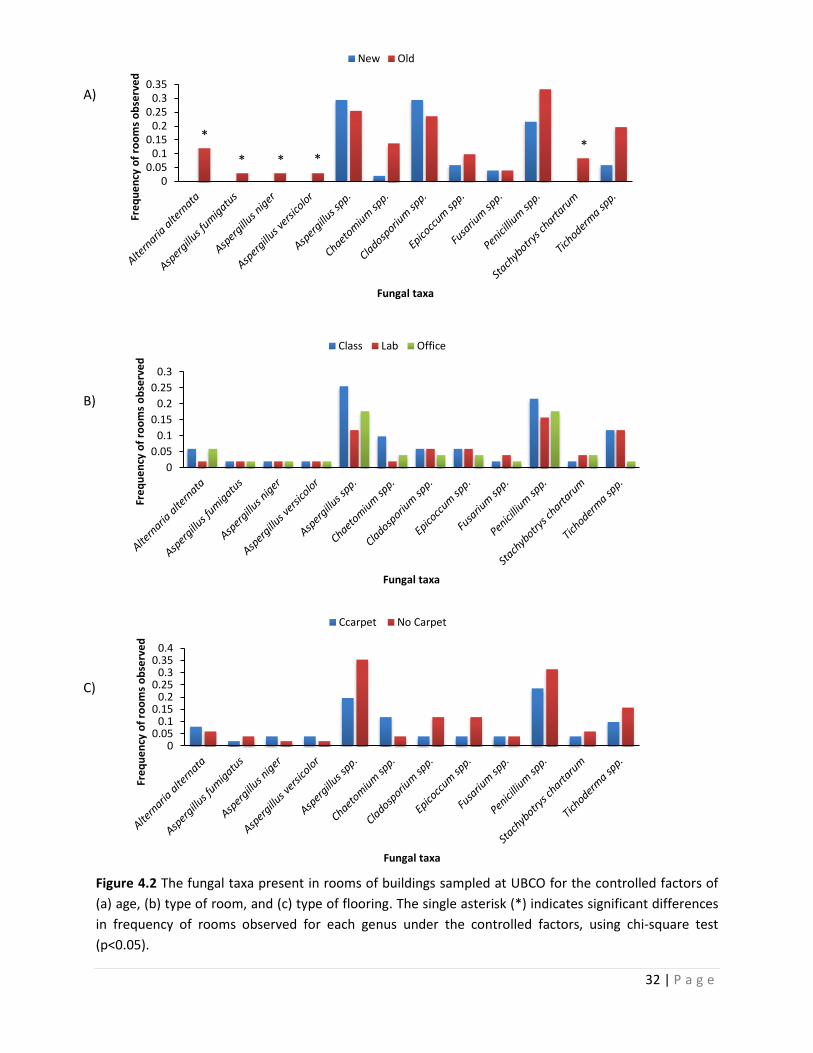
32 | P a g e
00.05
0.10.15
0.20.25
0.30.35
Fre
qu
en
cy o
f ro
om
s o
bse
rve
d
Fungal taxa
New Old
0
0.05
0.1
0.15
0.2
0.25
0.3
Fre
qu
en
cy o
f ro
om
s o
bse
rve
d
Fungal taxa
Class Lab Office
00.05
0.10.15
0.20.25
0.30.35
0.4
Fre
qu
en
cy o
f ro
om
s o
bse
rve
d
Fungal taxa
Ccarpet No Carpet
Figure 4.2 The fungal taxa present in rooms of buildings sampled at UBCO for the controlled factors of
(a) age, (b) type of room, and (c) type of flooring. The single asterisk (*) indicates significant differences
in frequency of rooms observed for each genus under the controlled factors, using chi-square test
(p<0.05).
A)
*
* * * *
B)
C)
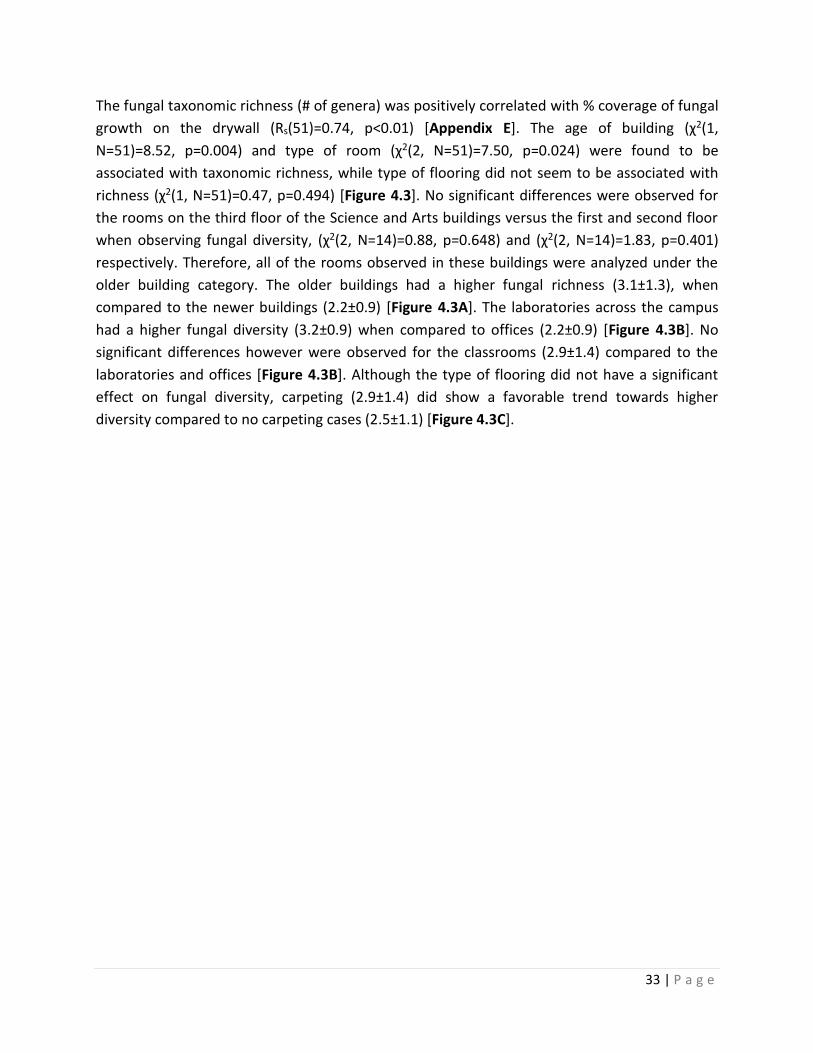
33 | P a g e
The fungal taxonomic richness (# of genera) was positively correlated with % coverage of fungal
growth on the drywall (Rs(51)=0.74, p<0.01) [Appendix E]. The age of building (χ2(1,
N=51)=8.52, p=0.004) and type of room (χ2(2, N=51)=7.50, p=0.024) were found to be
associated with taxonomic richness, while type of flooring did not seem to be associated with
richness (χ2(1, N=51)=0.47, p=0.494) [Figure 4.3]. No significant differences were observed for
the rooms on the third floor of the Science and Arts buildings versus the first and second floor
when observing fungal diversity, (χ2(2, N=14)=0.88, p=0.648) and (χ2(2, N=14)=1.83, p=0.401)
respectively. Therefore, all of the rooms observed in these buildings were analyzed under the
older building category. The older buildings had a higher fungal richness (3.1±1.3), when
compared to the newer buildings (2.2±0.9) [Figure 4.3A]. The laboratories across the campus
had a higher fungal diversity (3.2±0.9) when compared to offices (2.2±0.9) [Figure 4.3B]. No
significant differences however were observed for the classrooms (2.9±1.4) compared to the
laboratories and offices [Figure 4.3B]. Although the type of flooring did not have a significant
effect on fungal diversity, carpeting (2.9±1.4) did show a favorable trend towards higher
diversity compared to no carpeting cases (2.5±1.1) [Figure 4.3C].
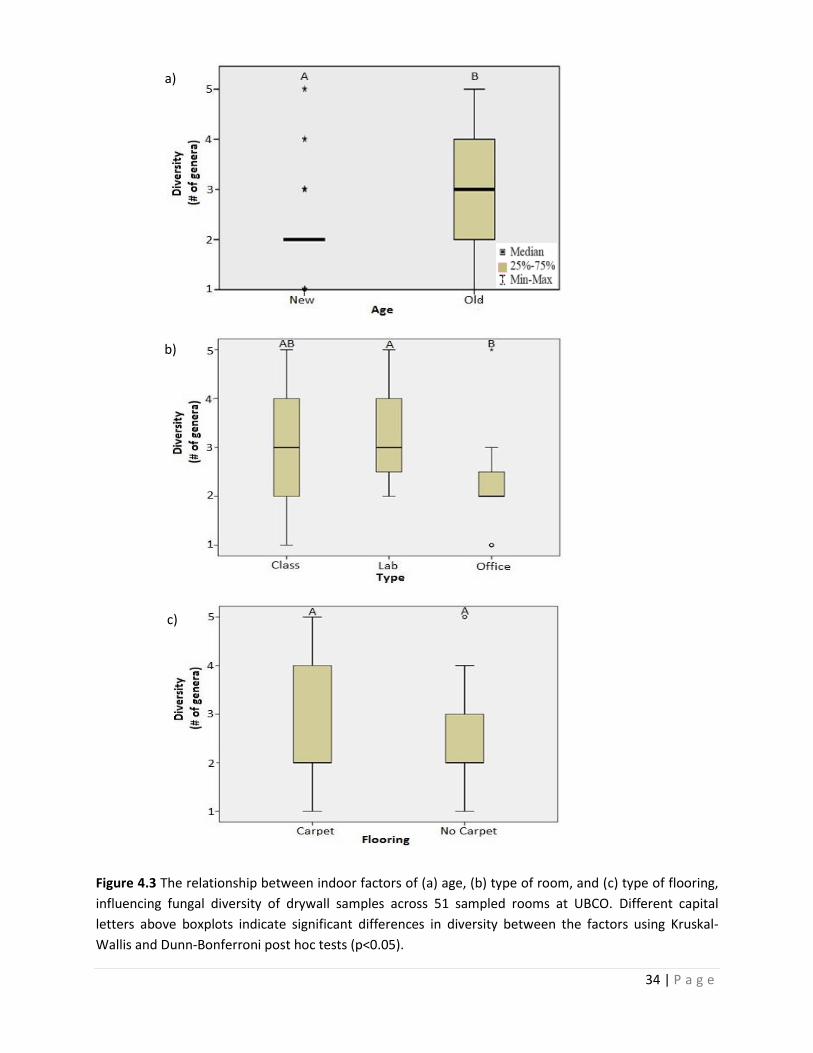
34 | P a g e
Figure 4.3 The relationship between indoor factors of (a) age, (b) type of room, and (c) type of flooring,
influencing fungal diversity of drywall samples across 51 sampled rooms at UBCO. Different capital
letters above boxplots indicate significant differences in diversity between the factors using Kruskal-
Wallis and Dunn-Bonferroni post hoc tests (p<0.05).
c)
b)
a)
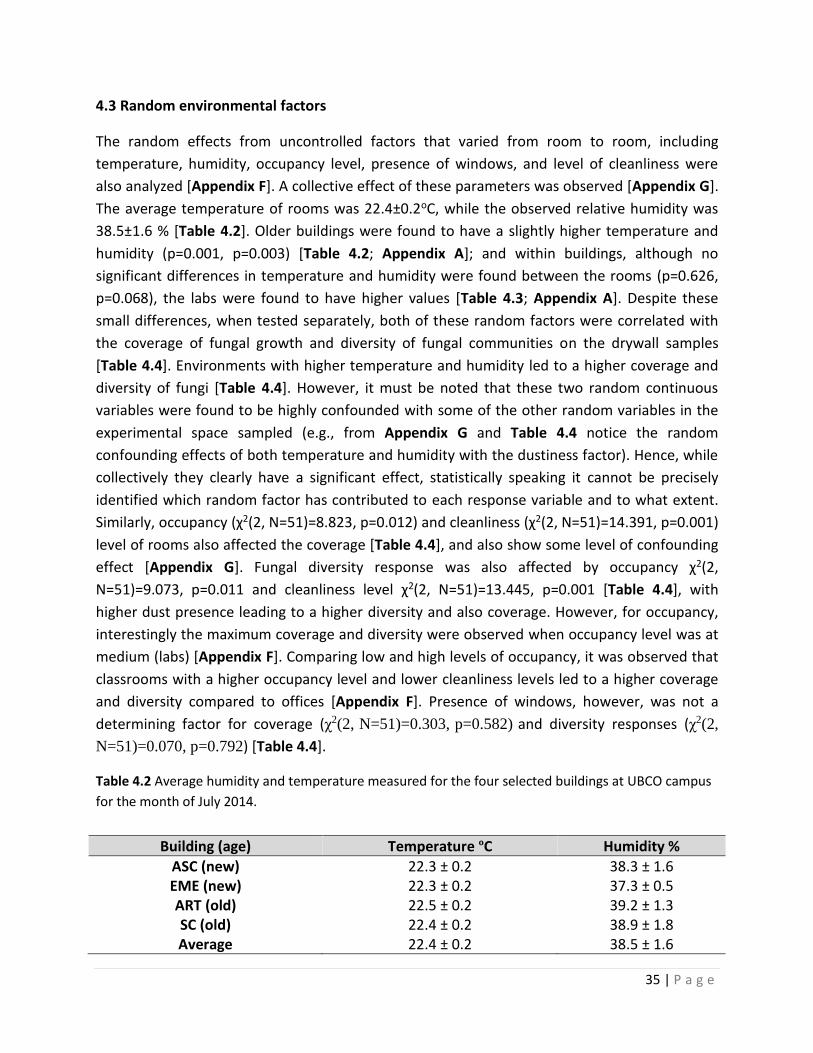
35 | P a g e
4.3 Random environmental factors
The random effects from uncontrolled factors that varied from room to room, including
temperature, humidity, occupancy level, presence of windows, and level of cleanliness were
also analyzed [Appendix F]. A collective effect of these parameters was observed [Appendix G].
The average temperature of rooms was 22.4±0.2oC, while the observed relative humidity was
38.5±1.6 % [Table 4.2]. Older buildings were found to have a slightly higher temperature and
humidity (p=0.001, p=0.003) [Table 4.2; Appendix A]; and within buildings, although no
significant differences in temperature and humidity were found between the rooms (p=0.626,
p=0.068), the labs were found to have higher values [Table 4.3; Appendix A]. Despite these
small differences, when tested separately, both of these random factors were correlated with
the coverage of fungal growth and diversity of fungal communities on the drywall samples
[Table 4.4]. Environments with higher temperature and humidity led to a higher coverage and
diversity of fungi [Table 4.4]. However, it must be noted that these two random continuous
variables were found to be highly confounded with some of the other random variables in the
experimental space sampled (e.g., from Appendix G and Table 4.4 notice the random
confounding effects of both temperature and humidity with the dustiness factor). Hence, while
collectively they clearly have a significant effect, statistically speaking it cannot be precisely
identified which random factor has contributed to each response variable and to what extent.
Similarly, occupancy (χ2(2, N=51)=8.823, p=0.012) and cleanliness (χ2(2, N=51)=14.391, p=0.001)
level of rooms also affected the coverage [Table 4.4], and also show some level of confounding
effect [Appendix G]. Fungal diversity response was also affected by occupancy χ2(2,
N=51)=9.073, p=0.011 and cleanliness level χ2(2, N=51)=13.445, p=0.001 [Table 4.4], with
higher dust presence leading to a higher diversity and also coverage. However, for occupancy,
interestingly the maximum coverage and diversity were observed when occupancy level was at
medium (labs) [Appendix F]. Comparing low and high levels of occupancy, it was observed that
classrooms with a higher occupancy level and lower cleanliness levels led to a higher coverage
and diversity compared to offices [Appendix F]. Presence of windows, however, was not a
determining factor for coverage (χ2(2, N=51)=0.303, p=0.582) and diversity responses (χ2(2,
N=51)=0.070, p=0.792) [Table 4.4].
Table 4.2 Average humidity and temperature measured for the four selected buildings at UBCO campus
for the month of July 2014.
Building (age) Temperature ºC Humidity %
ASC (new) 22.3 ± 0.2 38.3 ± 1.6 EME (new) 22.3 ± 0.2 37.3 ± 0.5 ART (old) 22.5 ± 0.2 39.2 ± 1.3 SC (old) 22.4 ± 0.2 38.9 ± 1.8 Average 22.4 ± 0.2 38.5 ± 1.6
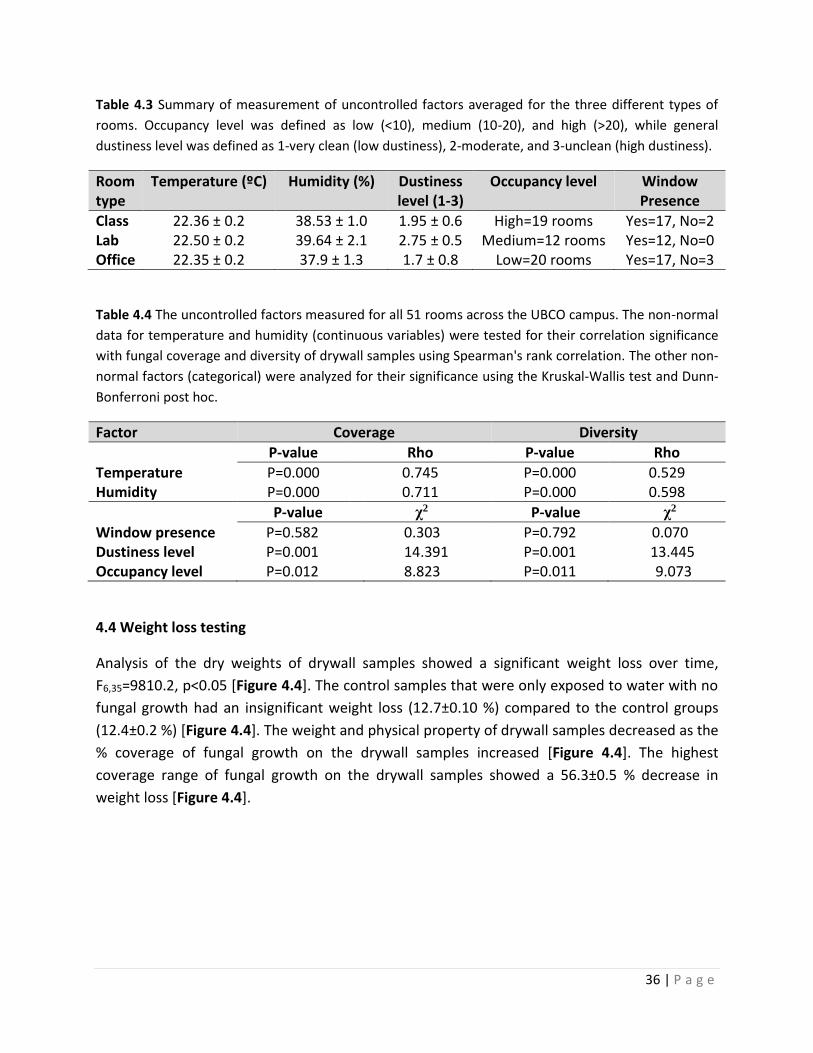
36 | P a g e
Table 4.3 Summary of measurement of uncontrolled factors averaged for the three different types of
rooms. Occupancy level was defined as low (<10), medium (10-20), and high (>20), while general
dustiness level was defined as 1-very clean (low dustiness), 2-moderate, and 3-unclean (high dustiness).
Room type
Temperature (ºC) Humidity (%) Dustiness level (1-3)
Occupancy level Window Presence
Class 22.36 ± 0.2 38.53 ± 1.0 1.95 ± 0.6 High=19 rooms Yes=17, No=2 Lab 22.50 ± 0.2 39.64 ± 2.1 2.75 ± 0.5 Medium=12 rooms Yes=12, No=0 Office 22.35 ± 0.2 37.9 ± 1.3 1.7 ± 0.8 Low=20 rooms Yes=17, No=3
Table 4.4 The uncontrolled factors measured for all 51 rooms across the UBCO campus. The non-normal
data for temperature and humidity (continuous variables) were tested for their correlation significance
with fungal coverage and diversity of drywall samples using Spearman's rank correlation. The other non-
normal factors (categorical) were analyzed for their significance using the Kruskal-Wallis test and Dunn-
Bonferroni post hoc.
Factor Coverage Diversity
P-value Rho P-value Rho
Temperature P=0.000 0.745 P=0.000 0.529 Humidity P=0.000 0.711 P=0.000 0.598
P-value χ2 P-value χ2
Window presence P=0.582 0.303 P=0.792 0.070 Dustiness level P=0.001 14.391 P=0.001 13.445 Occupancy level P=0.012 8.823 P=0.011 9.073
4.4 Weight loss testing
Analysis of the dry weights of drywall samples showed a significant weight loss over time,
F6,35=9810.2, p<0.05 [Figure 4.4]. The control samples that were only exposed to water with no
fungal growth had an insignificant weight loss (12.7±0.10 %) compared to the control groups
(12.4±0.2 %) [Figure 4.4]. The weight and physical property of drywall samples decreased as the
% coverage of fungal growth on the drywall samples increased [Figure 4.4]. The highest
coverage range of fungal growth on the drywall samples showed a 56.3±0.5 % decrease in
weight loss [Figure 4.4].
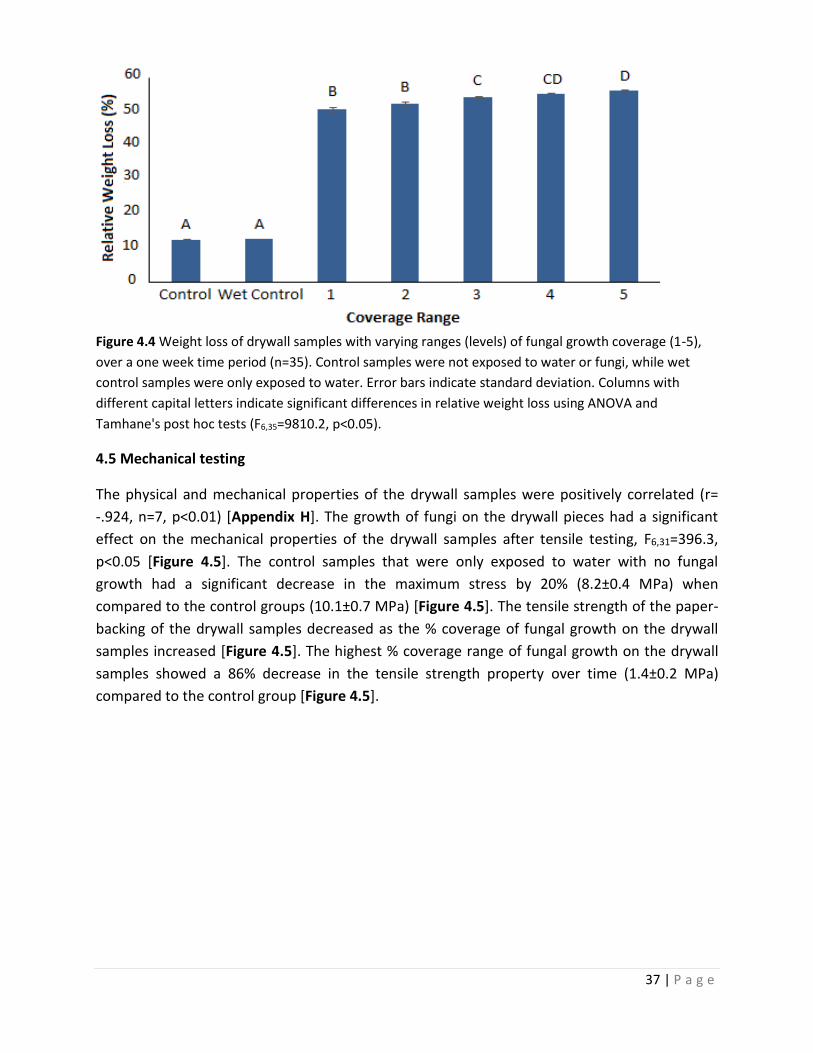
37 | P a g e
Figure 4.4 Weight loss of drywall samples with varying ranges (levels) of fungal growth coverage (1-5),
over a one week time period (n=35). Control samples were not exposed to water or fungi, while wet
control samples were only exposed to water. Error bars indicate standard deviation. Columns with
different capital letters indicate significant differences in relative weight loss using ANOVA and
Tamhane's post hoc tests (F6,35=9810.2, p<0.05).
4.5 Mechanical testing
The physical and mechanical properties of the drywall samples were positively correlated (r=
-.924, n=7, p<0.01) [Appendix H]. The growth of fungi on the drywall pieces had a significant
effect on the mechanical properties of the drywall samples after tensile testing, F6,31=396.3,
p<0.05 [Figure 4.5]. The control samples that were only exposed to water with no fungal
growth had a significant decrease in the maximum stress by 20% (8.2±0.4 MPa) when
compared to the control groups (10.1±0.7 MPa) [Figure 4.5]. The tensile strength of the paper-
backing of the drywall samples decreased as the % coverage of fungal growth on the drywall
samples increased [Figure 4.5]. The highest % coverage range of fungal growth on the drywall
samples showed a 86% decrease in the tensile strength property over time (1.4±0.2 MPa)
compared to the control group [Figure 4.5].
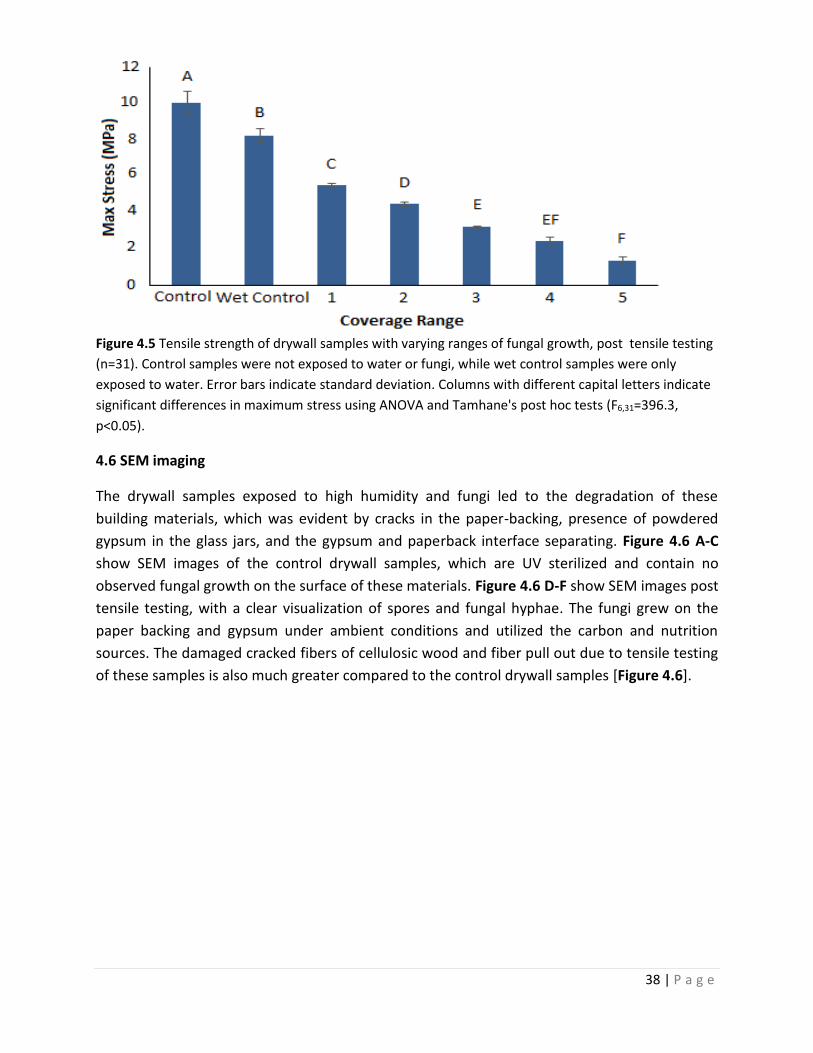
38 | P a g e
Figure 4.5 Tensile strength of drywall samples with varying ranges of fungal growth, post tensile testing
(n=31). Control samples were not exposed to water or fungi, while wet control samples were only
exposed to water. Error bars indicate standard deviation. Columns with different capital letters indicate
significant differences in maximum stress using ANOVA and Tamhane's post hoc tests (F6,31=396.3,
p<0.05).
4.6 SEM imaging
The drywall samples exposed to high humidity and fungi led to the degradation of these
building materials, which was evident by cracks in the paper-backing, presence of powdered
gypsum in the glass jars, and the gypsum and paperback interface separating. Figure 4.6 A-C
show SEM images of the control drywall samples, which are UV sterilized and contain no
observed fungal growth on the surface of these materials. Figure 4.6 D-F show SEM images post
tensile testing, with a clear visualization of spores and fungal hyphae. The fungi grew on the
paper backing and gypsum under ambient conditions and utilized the carbon and nutrition
sources. The damaged cracked fibers of cellulosic wood and fiber pull out due to tensile testing
of these samples is also much greater compared to the control drywall samples [Figure 4.6].

39 | P a g e
D)
E)
F)
Figure 4.6 SEM micrographs of drywall samples showing (A-C) the control pieces which are UV sterilized
and not exposed to dust and high humidity conditions, and (D-F) the drywall pieces post tensile testing
and after 4 weeks of exposure to dust and high humidity conditions.
A) Damaged/cracked wood fibers
post tensile testing
Fungal spores
B) Fungal hyphae
C)
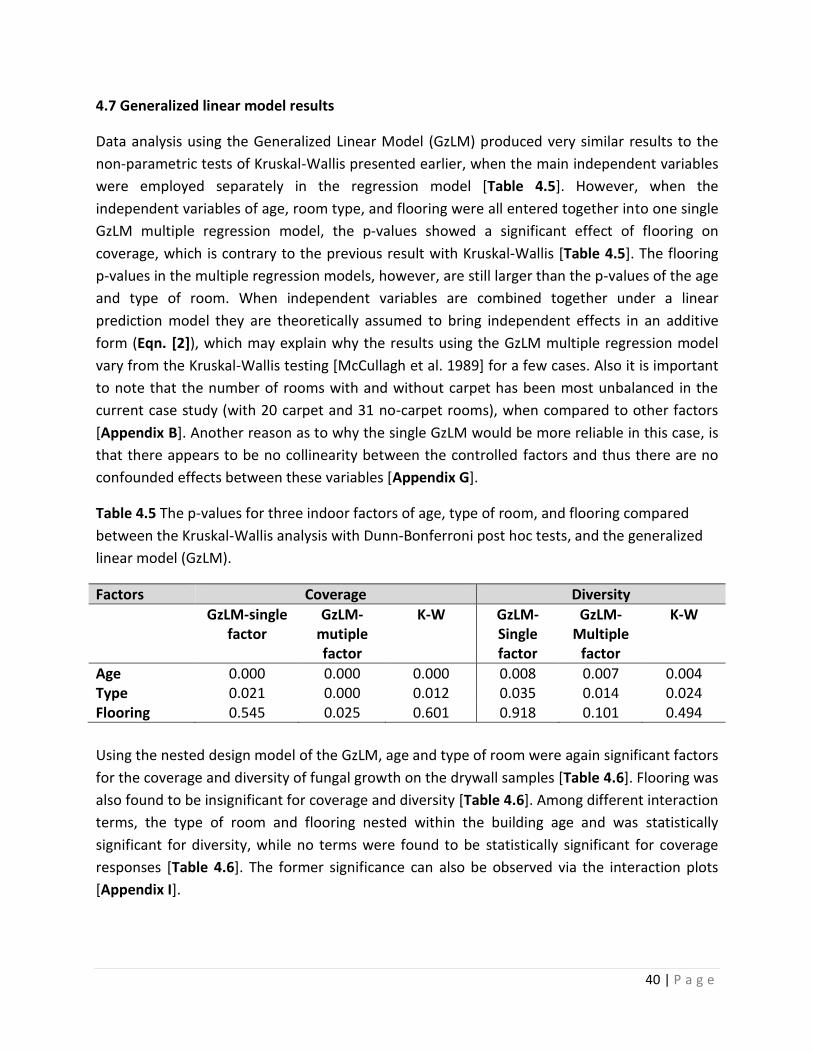
40 | P a g e
4.7 Generalized linear model results
Data analysis using the Generalized Linear Model (GzLM) produced very similar results to the
non-parametric tests of Kruskal-Wallis presented earlier, when the main independent variables
were employed separately in the regression model [Table 4.5]. However, when the
independent variables of age, room type, and flooring were all entered together into one single
GzLM multiple regression model, the p-values showed a significant effect of flooring on
coverage, which is contrary to the previous result with Kruskal-Wallis [Table 4.5]. The flooring
p-values in the multiple regression models, however, are still larger than the p-values of the age
and type of room. When independent variables are combined together under a linear
prediction model they are theoretically assumed to bring independent effects in an additive
form (Eqn. [2]), which may explain why the results using the GzLM multiple regression model
vary from the Kruskal-Wallis testing [McCullagh et al. 1989] for a few cases. Also it is important
to note that the number of rooms with and without carpet has been most unbalanced in the
current case study (with 20 carpet and 31 no-carpet rooms), when compared to other factors
[Appendix B]. Another reason as to why the single GzLM would be more reliable in this case, is
that there appears to be no collinearity between the controlled factors and thus there are no
confounded effects between these variables [Appendix G].
Table 4.5 The p-values for three indoor factors of age, type of room, and flooring compared
between the Kruskal-Wallis analysis with Dunn-Bonferroni post hoc tests, and the generalized
linear model (GzLM).
Factors Coverage Diversity
GzLM-single factor
GzLM-mutiple factor
K-W GzLM- Single factor
GzLM- Multiple
factor
K-W
Age 0.000 0.000 0.000 0.008 0.007 0.004 Type 0.021 0.000 0.012 0.035 0.014 0.024 Flooring 0.545 0.025 0.601 0.918 0.101 0.494
Using the nested design model of the GzLM, age and type of room were again significant factors
for the coverage and diversity of fungal growth on the drywall samples [Table 4.6]. Flooring was
also found to be insignificant for coverage and diversity [Table 4.6]. Among different interaction
terms, the type of room and flooring nested within the building age and was statistically
significant for diversity, while no terms were found to be statistically significant for coverage
responses [Table 4.6]. The former significance can also be observed via the interaction plots
[Appendix I].
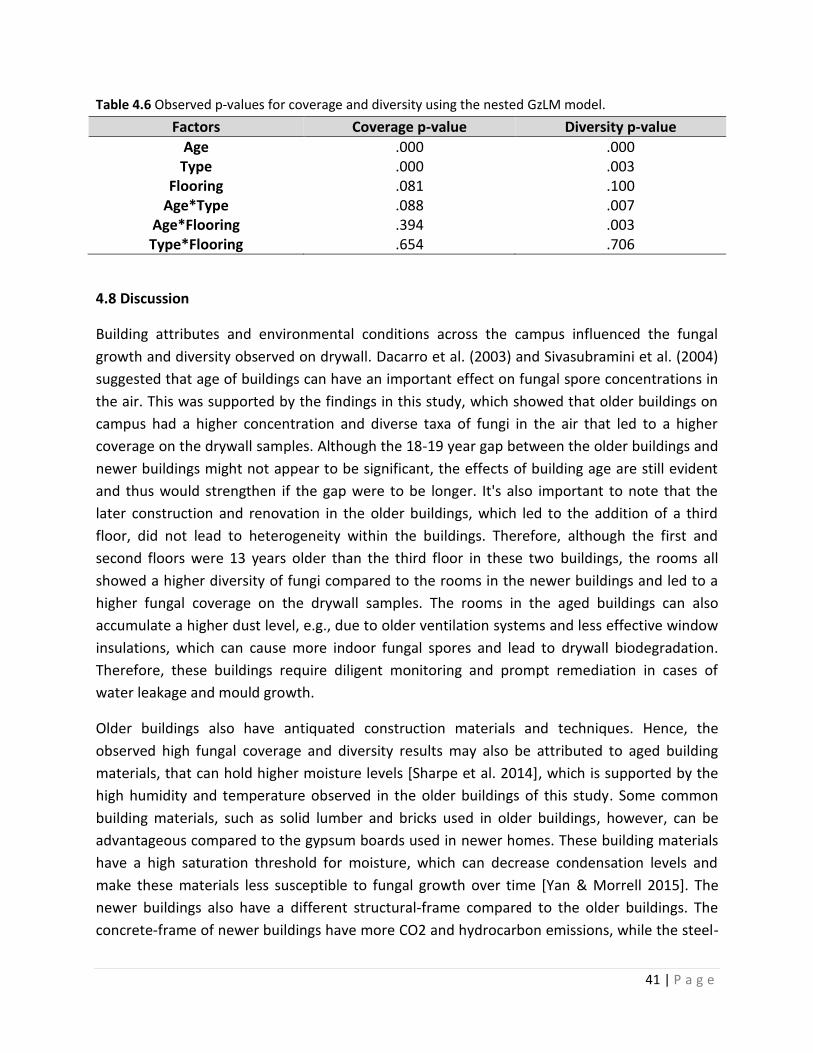
41 | P a g e
Table 4.6 Observed p-values for coverage and diversity using the nested GzLM model.
Factors Coverage p-value Diversity p-value
Age .000 .000 Type .000 .003
Flooring .081 .100 Age*Type .088 .007
Age*Flooring .394 .003 Type*Flooring .654 .706
4.8 Discussion
Building attributes and environmental conditions across the campus influenced the fungal
growth and diversity observed on drywall. Dacarro et al. (2003) and Sivasubramini et al. (2004)
suggested that age of buildings can have an important effect on fungal spore concentrations in
the air. This was supported by the findings in this study, which showed that older buildings on
campus had a higher concentration and diverse taxa of fungi in the air that led to a higher
coverage on the drywall samples. Although the 18-19 year gap between the older buildings and
newer buildings might not appear to be significant, the effects of building age are still evident
and thus would strengthen if the gap were to be longer. It's also important to note that the
later construction and renovation in the older buildings, which led to the addition of a third
floor, did not lead to heterogeneity within the buildings. Therefore, although the first and
second floors were 13 years older than the third floor in these two buildings, the rooms all
showed a higher diversity of fungi compared to the rooms in the newer buildings and led to a
higher fungal coverage on the drywall samples. The rooms in the aged buildings can also
accumulate a higher dust level, e.g., due to older ventilation systems and less effective window
insulations, which can cause more indoor fungal spores and lead to drywall biodegradation.
Therefore, these buildings require diligent monitoring and prompt remediation in cases of
water leakage and mould growth.
Older buildings also have antiquated construction materials and techniques. Hence, the
observed high fungal coverage and diversity results may also be attributed to aged building
materials, that can hold higher moisture levels [Sharpe et al. 2014], which is supported by the
high humidity and temperature observed in the older buildings of this study. Some common
building materials, such as solid lumber and bricks used in older buildings, however, can be
advantageous compared to the gypsum boards used in newer homes. These building materials
have a high saturation threshold for moisture, which can decrease condensation levels and
make these materials less susceptible to fungal growth over time [Yan & Morrell 2015]. The
newer buildings also have a different structural-frame compared to the older buildings. The
concrete-frame of newer buildings have more CO2 and hydrocarbon emissions, while the steel-
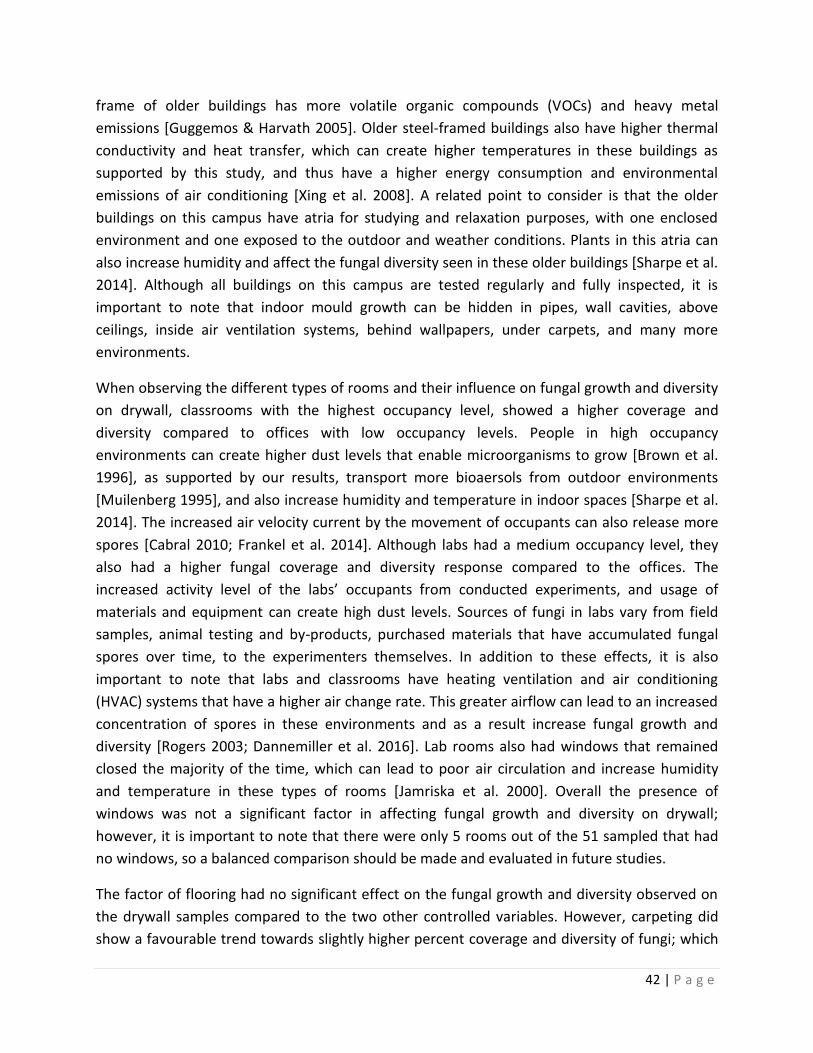
42 | P a g e
frame of older buildings has more volatile organic compounds (VOCs) and heavy metal
emissions [Guggemos & Harvath 2005]. Older steel-framed buildings also have higher thermal
conductivity and heat transfer, which can create higher temperatures in these buildings as
supported by this study, and thus have a higher energy consumption and environmental
emissions of air conditioning [Xing et al. 2008]. A related point to consider is that the older
buildings on this campus have atria for studying and relaxation purposes, with one enclosed
environment and one exposed to the outdoor and weather conditions. Plants in this atria can
also increase humidity and affect the fungal diversity seen in these older buildings [Sharpe et al.
2014]. Although all buildings on this campus are tested regularly and fully inspected, it is
important to note that indoor mould growth can be hidden in pipes, wall cavities, above
ceilings, inside air ventilation systems, behind wallpapers, under carpets, and many more
environments.
When observing the different types of rooms and their influence on fungal growth and diversity
on drywall, classrooms with the highest occupancy level, showed a higher coverage and
diversity compared to offices with low occupancy levels. People in high occupancy
environments can create higher dust levels that enable microorganisms to grow [Brown et al.
1996], as supported by our results, transport more bioaersols from outdoor environments
[Muilenberg 1995], and also increase humidity and temperature in indoor spaces [Sharpe et al.
2014]. The increased air velocity current by the movement of occupants can also release more
spores [Cabral 2010; Frankel et al. 2014]. Although labs had a medium occupancy level, they
also had a higher fungal coverage and diversity response compared to the offices. The
increased activity level of the labs’ occupants from conducted experiments, and usage of
materials and equipment can create high dust levels. Sources of fungi in labs vary from field
samples, animal testing and by-products, purchased materials that have accumulated fungal
spores over time, to the experimenters themselves. In addition to these effects, it is also
important to note that labs and classrooms have heating ventilation and air conditioning
(HVAC) systems that have a higher air change rate. This greater airflow can lead to an increased
concentration of spores in these environments and as a result increase fungal growth and
diversity [Rogers 2003; Dannemiller et al. 2016]. Lab rooms also had windows that remained
closed the majority of the time, which can lead to poor air circulation and increase humidity
and temperature in these types of rooms [Jamriska et al. 2000]. Overall the presence of
windows was not a significant factor in affecting fungal growth and diversity on drywall;
however, it is important to note that there were only 5 rooms out of the 51 sampled that had
no windows, so a balanced comparison should be made and evaluated in future studies.
The factor of flooring had no significant effect on the fungal growth and diversity observed on
the drywall samples compared to the two other controlled variables. However, carpeting did
show a favourable trend towards slightly higher percent coverage and diversity of fungi; which
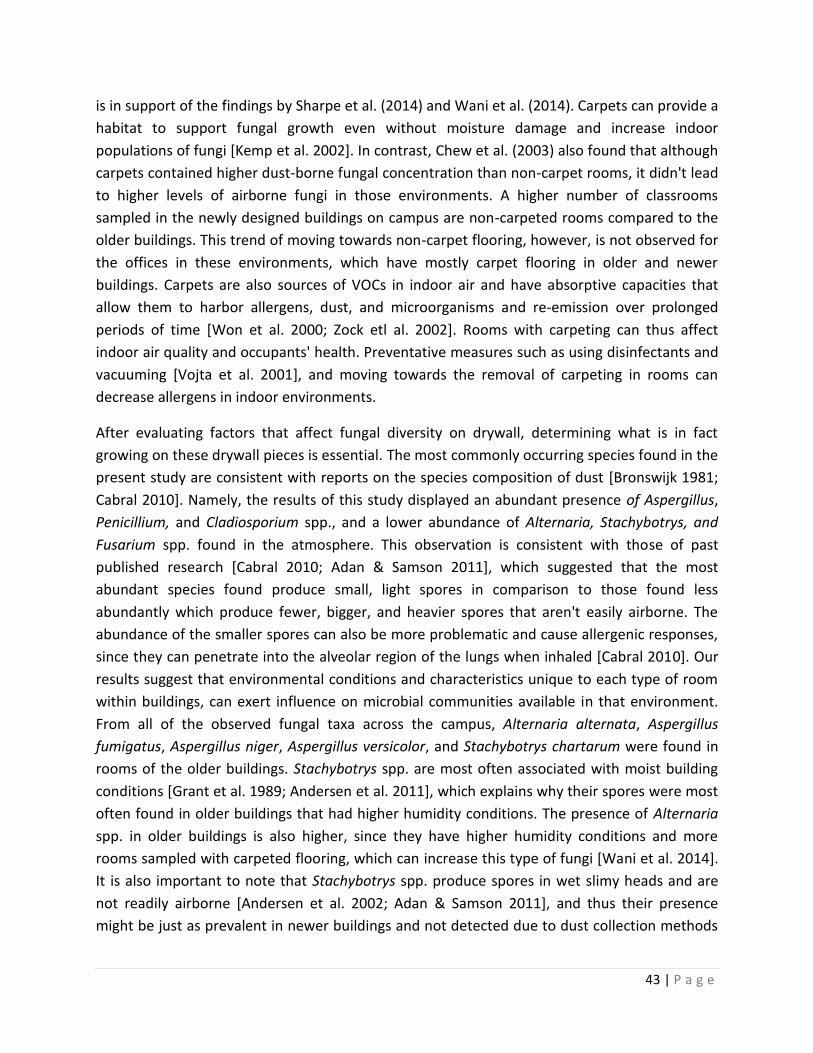
43 | P a g e
is in support of the findings by Sharpe et al. (2014) and Wani et al. (2014). Carpets can provide a
habitat to support fungal growth even without moisture damage and increase indoor
populations of fungi [Kemp et al. 2002]. In contrast, Chew et al. (2003) also found that although
carpets contained higher dust-borne fungal concentration than non-carpet rooms, it didn't lead
to higher levels of airborne fungi in those environments. A higher number of classrooms
sampled in the newly designed buildings on campus are non-carpeted rooms compared to the
older buildings. This trend of moving towards non-carpet flooring, however, is not observed for
the offices in these environments, which have mostly carpet flooring in older and newer
buildings. Carpets are also sources of VOCs in indoor air and have absorptive capacities that
allow them to harbor allergens, dust, and microorganisms and re-emission over prolonged
periods of time [Won et al. 2000; Zock etl al. 2002]. Rooms with carpeting can thus affect
indoor air quality and occupants' health. Preventative measures such as using disinfectants and
vacuuming [Vojta et al. 2001], and moving towards the removal of carpeting in rooms can
decrease allergens in indoor environments.
After evaluating factors that affect fungal diversity on drywall, determining what is in fact
growing on these drywall pieces is essential. The most commonly occurring species found in the
present study are consistent with reports on the species composition of dust [Bronswijk 1981;
Cabral 2010]. Namely, the results of this study displayed an abundant presence of Aspergillus,
Penicillium, and Cladiosporium spp., and a lower abundance of Alternaria, Stachybotrys, and
Fusarium spp. found in the atmosphere. This observation is consistent with those of past
published research [Cabral 2010; Adan & Samson 2011], which suggested that the most
abundant species found produce small, light spores in comparison to those found less
abundantly which produce fewer, bigger, and heavier spores that aren't easily airborne. The
abundance of the smaller spores can also be more problematic and cause allergenic responses,
since they can penetrate into the alveolar region of the lungs when inhaled [Cabral 2010]. Our
results suggest that environmental conditions and characteristics unique to each type of room
within buildings, can exert influence on microbial communities available in that environment.
From all of the observed fungal taxa across the campus, Alternaria alternata, Aspergillus
fumigatus, Aspergillus niger, Aspergillus versicolor, and Stachybotrys chartarum were found in
rooms of the older buildings. Stachybotrys spp. are most often associated with moist building
conditions [Grant et al. 1989; Andersen et al. 2011], which explains why their spores were most
often found in older buildings that had higher humidity conditions. The presence of Alternaria
spp. in older buildings is also higher, since they have higher humidity conditions and more
rooms sampled with carpeted flooring, which can increase this type of fungi [Wani et al. 2014].
It is also important to note that Stachybotrys spp. produce spores in wet slimy heads and are
not readily airborne [Andersen et al. 2002; Adan & Samson 2011], and thus their presence
might be just as prevalent in newer buildings and not detected due to dust collection methods
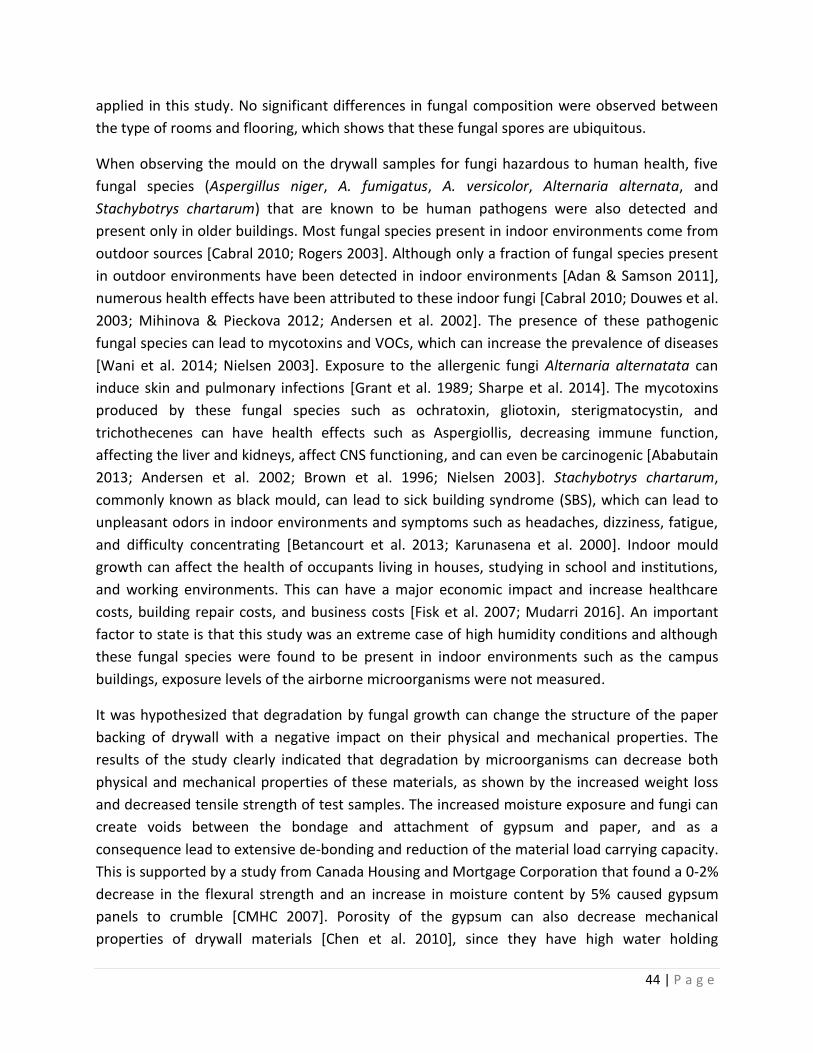
44 | P a g e
applied in this study. No significant differences in fungal composition were observed between
the type of rooms and flooring, which shows that these fungal spores are ubiquitous.
When observing the mould on the drywall samples for fungi hazardous to human health, five
fungal species (Aspergillus niger, A. fumigatus, A. versicolor, Alternaria alternata, and
Stachybotrys chartarum) that are known to be human pathogens were also detected and
present only in older buildings. Most fungal species present in indoor environments come from
outdoor sources [Cabral 2010; Rogers 2003]. Although only a fraction of fungal species present
in outdoor environments have been detected in indoor environments [Adan & Samson 2011],
numerous health effects have been attributed to these indoor fungi [Cabral 2010; Douwes et al.
2003; Mihinova & Pieckova 2012; Andersen et al. 2002]. The presence of these pathogenic
fungal species can lead to mycotoxins and VOCs, which can increase the prevalence of diseases
[Wani et al. 2014; Nielsen 2003]. Exposure to the allergenic fungi Alternaria alternatata can
induce skin and pulmonary infections [Grant et al. 1989; Sharpe et al. 2014]. The mycotoxins
produced by these fungal species such as ochratoxin, gliotoxin, sterigmatocystin, and
trichothecenes can have health effects such as Aspergiollis, decreasing immune function,
affecting the liver and kidneys, affect CNS functioning, and can even be carcinogenic [Ababutain
2013; Andersen et al. 2002; Brown et al. 1996; Nielsen 2003]. Stachybotrys chartarum,
commonly known as black mould, can lead to sick building syndrome (SBS), which can lead to
unpleasant odors in indoor environments and symptoms such as headaches, dizziness, fatigue,
and difficulty concentrating [Betancourt et al. 2013; Karunasena et al. 2000]. Indoor mould
growth can affect the health of occupants living in houses, studying in school and institutions,
and working environments. This can have a major economic impact and increase healthcare
costs, building repair costs, and business costs [Fisk et al. 2007; Mudarri 2016]. An important
factor to state is that this study was an extreme case of high humidity conditions and although
these fungal species were found to be present in indoor environments such as the campus
buildings, exposure levels of the airborne microorganisms were not measured.
It was hypothesized that degradation by fungal growth can change the structure of the paper
backing of drywall with a negative impact on their physical and mechanical properties. The
results of the study clearly indicated that degradation by microorganisms can decrease both
physical and mechanical properties of these materials, as shown by the increased weight loss
and decreased tensile strength of test samples. The increased moisture exposure and fungi can
create voids between the bondage and attachment of gypsum and paper, and as a
consequence lead to extensive de-bonding and reduction of the material load carrying capacity.
This is supported by a study from Canada Housing and Mortgage Corporation that found a 0-2%
decrease in the flexural strength and an increase in moisture content by 5% caused gypsum
panels to crumble [CMHC 2007]. Porosity of the gypsum can also decrease mechanical
properties of drywall materials [Chen et al. 2010], since they have high water holding
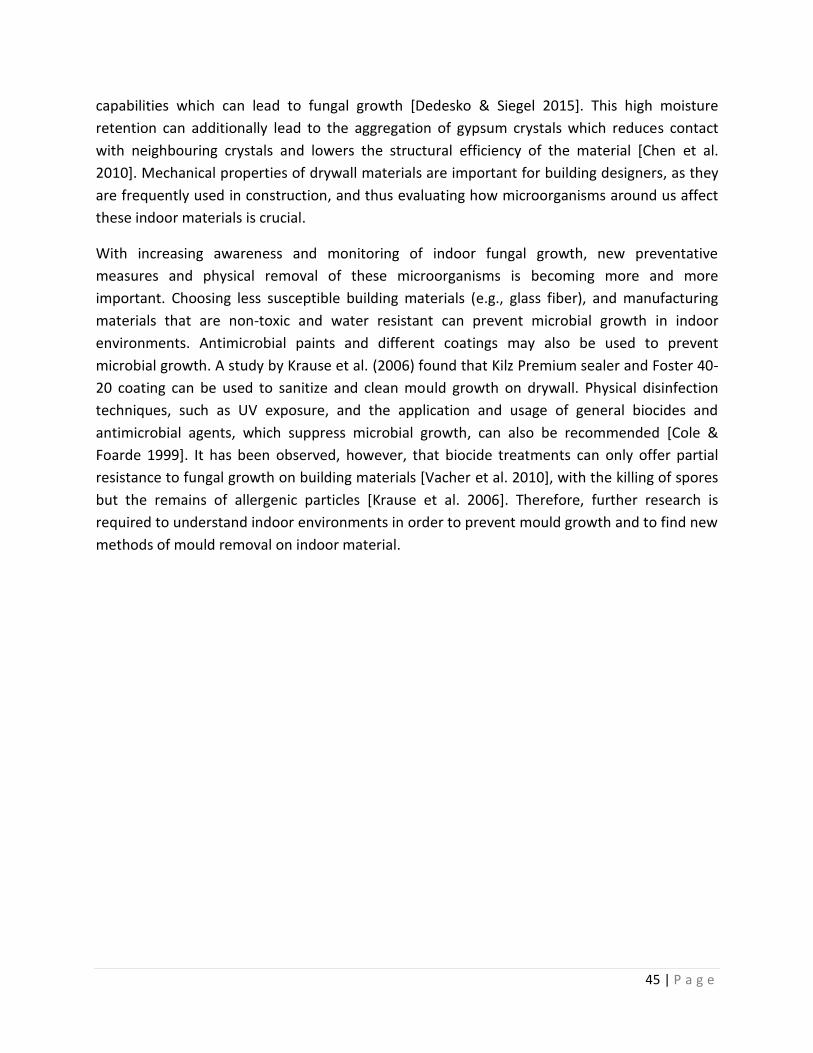
45 | P a g e
capabilities which can lead to fungal growth [Dedesko & Siegel 2015]. This high moisture
retention can additionally lead to the aggregation of gypsum crystals which reduces contact
with neighbouring crystals and lowers the structural efficiency of the material [Chen et al.
2010]. Mechanical properties of drywall materials are important for building designers, as they
are frequently used in construction, and thus evaluating how microorganisms around us affect
these indoor materials is crucial.
With increasing awareness and monitoring of indoor fungal growth, new preventative
measures and physical removal of these microorganisms is becoming more and more
important. Choosing less susceptible building materials (e.g., glass fiber), and manufacturing
materials that are non-toxic and water resistant can prevent microbial growth in indoor
environments. Antimicrobial paints and different coatings may also be used to prevent
microbial growth. A study by Krause et al. (2006) found that Kilz Premium sealer and Foster 40-
20 coating can be used to sanitize and clean mould growth on drywall. Physical disinfection
techniques, such as UV exposure, and the application and usage of general biocides and
antimicrobial agents, which suppress microbial growth, can also be recommended [Cole &
Foarde 1999]. It has been observed, however, that biocide treatments can only offer partial
resistance to fungal growth on building materials [Vacher et al. 2010], with the killing of spores
but the remains of allergenic particles [Krause et al. 2006]. Therefore, further research is
required to understand indoor environments in order to prevent mould growth and to find new
methods of mould removal on indoor material.
46 | P a g e
Chapter 5. Conclusions and Future Work
5.1 Conclusions
Although there have been a substantial number of studies on indoor factors affecting fungal
growth on building materials, the underlying mechanism of such associations are not well
understood and still need further experimental confirmation. The results of this case study
suggested that older buildings can support a higher diversity of fungi and lead to more fungal
growth on drywall material. Therefore, a more diligent monitoring of older buildings may be
critical (e.g., as a proactive measure to potential flooding, etc.), since fungal species hazardous
to health were also discovered in some old buildings. Different types of rooms can support the
growth of a variety of different fungal species, with laboratories, classrooms, and offices in
order having more fungal growth and diversity of species observed on drywall. Proper
ventilation in these rooms (especially labs) and frequent cleaning strategies to decrease dust
can help with prevention of fungal growth. The type of flooring (presence of carpet) was not a
significant indoor factor influencing the amount of fungal growth and diversity, when compared
to the age and room type. The role of fungi in drywall degradation was strongly supported by
the material tests in the study, which showed that these microorganisms can affect the
mechanical constants and structural integrity of the drywall material over time. Increasingly,
we are gaining understanding of the complexity of fungi in indoor environments and their
effects on human health and building material integrity. This increased insight can eventually
enable optimization and usage of new building materials, help with design and functionality of
new buildings, and decrease health concerns.
5.2 Future work recommendation
Gypsum boards are a major component of houses. Microbial growth, such as fungi, on these
materials can be a devastating and problematic issue. Mould growth can lead to costly
remediation and cleaning products, and even the removal of entire drywall. Therefore,
understanding factors influencing their growth is critical for drywall producers, construction
workers, building designers, and home owners.
The present research results assisted in enhancing our understanding of some factors
influencing fungal growth on these building materials. The significant identified factors in this
study, however, were only a fraction of the available possibilities and indoor variations that can
affect growth and diversity of indoor biota. Therefore, further research is needed to understand
associations/interactions of built environment biota with different engineered materials in a
broader sense. In particular, further research is needed for a) manufacturing new materials that
are less susceptible to fungal growth, b) fast characterization and detection methods
specifically for fungal species that are problematic for human health, c) finding non-toxic and
47 | P a g e
cost effective cleaning products to remove fungi on building materials (i.e., for maintenance
purposes), and d) investigating associations between these organisms as well as volatile organic
compound emissions from indoor building materials (i.e. due to their biodegradation process),
and health of occupants.
48 | P a g e
References
Abdalla, M. H. (1988). Prevalence of airborne Aspergillus flavus in Khartoum (Sudan) airspora with
reference to dusty weather and inoculum survival in simulated summer conditions.
Mycopathology, 104, 137-141.
Ababutain, I. M. (2013). Effect of some ecological factors on the growth of Aspergillus
niger and Cladosporium sphaerospermum. American Journal of Applied Science, 10, 159-163.
Adan, O. C. G., & Samson, R. A. (2011). Fundamentals of mold growth in indoor environments and
strategies for healthy living. The Netherlands: Wageningen Academic Publisher.
Allsopp, D., Seal, K., & Gaylarde, C. (2004). Introduction to Biodeterioration, 2nd ed. Cambridge, UK:
Cambridge University Press.
Andersen, B., Frisvad, J. C., Sondergaard, I., Rasmussen, I. S., & Larsen, L. S. (2011). Associations between
fungal species and water-damaged building materials. Applied and Environmental Microbiology,
77(12), 4180-4188.
Andersen, B., Nielsen, K. F., & Jarvis, B. B. (2002). Characterization of Stachybotrys from water-damaged
buildings based on morphology, growth, and metabolite production, Mycologia, 94, 392-403.
Bennett, J. W., & Klich, M. (2003). Mycotoxins. Clinical Microbiology Reviews, 16, 497.
Betancourt, D. A., Krebs, K., Moore, S. A., & Martin, S. M. (2013). Microbial volatile organic compound
emissions from Stachybotrys chartarum growing on gypsum wallboard and ceiling tile. BMC
Microbiology, 13(1), 283.
Bin-Umer, M. A., McLaughlin, J. E., Basu, D., McCormick, S., & Tumer, N. E. (2011). Trichothecene
mycotoxins inhibit mitochondrial translation-implication for the mechanism of toxicity. Toxins,
3, 1484-1501.
Bissett, J. (1987). Fungi associated with urea-formaldehyde foam insulation in Canada. Mycopathologia,
99, 47-56.
Bjurman, J. (1994). Ergosterol as an indicator of mold growth on wood in relation to culture,age,
humidity stress and nutrient level. International Biodeterioration & Biodegradation, 33, 355-368.
Blachere, F. M., Lindsley, W. G., Slaven, J. E., Green, B. J., Anderson, S. E., Chen, B. T., Beezhold, D. H.
(2007). Bioaerosol sampling for detection of aerosolized influenza virus. Influenza and Other
Respiratory Viruses, 1(3), 113-120.
Block, S. S. (1953). Humidity requirements for mold growth. Applied Microbiology, 1, 287-293.
Boni, J. (2000). What is toxic mould? Guardian Home Inspection. Retrieved from http://guardian-
homeinspection.com/index-10.html [Feb 19, 2014].
49 | P a g e
Brown, D. W., Yu, J. H., Kelkar, H. S., Fernandes, M., Nesbitt, T. C., et al. (1996). Twenty-five coregualted
transcripts define a sterigmatocystin gene cluster in Aspergillus nidulans. Proceedings of the
National Academy of Sciences of the United States of America, 93, 1418-1422.
Bronswijk, JEMH. (1981). House dust biology; for allergists, acarologists and mycologists. Zoelmond:
Published by the author.
Brunekreef, B., Dockery, D. W., Speizer, F. E., Ware, J. H., Spengler, J. D., et al. (1989). Home dampness
and respiratory morbidity in children. American Review of Respiratory Disease, 140, 1363-1367.
Cabral, JP. S. (2010). Can we use indoor fungi as bioindicators of indoor air quality? Historical
perspectives and open questions. Science of the Total Environment, 408, 4285-4295.
Chandara, C., Azizli, K. A. M., Ahmad, Z. A., & Sakai, E. (2009). Use of waste gypsum to replace natural
gypsum as set retarders in portland cement. Waste Management, 29(5), 1675-1679.
Chase, J. M., & Leibold, M. A. (2003). Ecological niches: Linking classical and contemporary approaches:
Univ of Chicago Press, Chicago.
Cheong, C. D., & Neumeister-Kemp, H. G. J. (2005). Reducing airborne indoor fungi and fine particulates
in carpeted Australian homes using intensive, high efficiency HEPA vacuuming. Journal of
Environmental Health, 4.
Chen, A., Sucech, S., & Faber, K.T. (2010). A hierarchical study of the mechanical properties of gypsum.
Journal of Master of Science, 45, 4444-4453.
Chew, G.L., Rogers, C., Burge, H. A., Muilenberg, M. L., & Gold, D. R. (2003). Dustborne and airborne
fungal propagules represent a different spectrum of fungi with differing relations to home
characteristics. Allergy, 58, 13-20.
CMHC. (2007). Relationship between moisture content and mechanical properties of gypsum
sheathing. CMHC. Retrieved from
http://www.becor.org/content/downloads/CAN%20WETTED%20GYPSUM%20SHEATHING%20B
E%20REHABILITATED%20-%20ALEX%20MCGOWAN.pdf [June 27, 2016]
Cole, E. C & Foarde, K. K. (1999). Biocide and antimicrobial agents. Bioaerosol Assessment and Control.
American Conference of Governmental Industrial Hygienists, Cincinnati.
Cox-Ganser, J. M. (2015). Indoor dampness and mould health effects-ongoing questions on microbial
exposures and allergic versus non-allergic mechanisms. Clinical & Experimental Allergy, 45(10),
1478-142.
Croft, W. A., Jarvis, B. B., Yatawara, C. S. (1986). Airborne outbreak of trichothecene toxicosis.
Atmospheric Environment, 20, 549-552.
50 | P a g e
Dacarro, C., Picco, A. M., Grisoli, P., Rodolfi, M. (2003). Determination of aerial microbiological
contamination in scholastic sports environments. Journal of Applied Microbiology, 95, 904-912.
Dannemiller, K. C., Gent, J. F., Leaderer, B. P., Peccia, J. (2016). Influence of housing characteristics on
bacterial and fungal communities in homes of asthmatic children. Indoor Air, 26, 179-192.
Dedesko, S., & Siegel, S. A. (2015). Moisture parameters of fungal communities associated with gypsum
drywall in buildings. Microbiome, 3, 71.
Demain, A. L. (1986). Regulation of secondary metabolism in fungi. Pure and Applied Chemistry, 58, 219-
226.
Department of Environmental Health and Safety. 2010. Fungal glossary. University of Minnesota.
Retrieved from: http://www.dehs.umn.edu/iaq_fib_fg_gloss.htm [Feb 1, 2015].
De-Wei & Kendrick, B. (1955). Indoor aeromycota in relation to residential characteristics and allergic
symptoms. Mycopathologia, 131, 149-157.
Douwes, J., Thorne, P., Pearce, N., & Heederik, D. (2003). Bioaerosol health effects and exposure
assessment: progress and prospects. Annals of Occupational Hygiene, 47, 187-200.
Esteban, A., Abarca, M. L., Bragulat, M. R., & Cabanes, F. J. (2004). Effects of temperature and incubation
time on production of ochratoxin A by black aspergilli. Research in Microbiology, 155, 861-866.
Etzel, R. A., Montana, E., Sorenson, W. G., Kullman, G. J., Allan, T. M., et al. (1998). Acute pulmonary
hemorrhage in infants associated with exposure to Stachybotrys atra and other fungi. Archives
of Pediatrics & Adolescent Medicine, 152, 757-762.
Fisher Scientific. Fisher brand products. Retrieved from: http://www.fishersci.com [Feb 1, 2015].
Fisk, W. S., Lei-Gomez, Q., & Mendell, M. J. (2007). Meta-analyses of the associations of respiratory
health effects with dampness and mold in homes. Indoor Air, 17(4), 284-296.
Flannigan, B., Miller, J. D., & Samson, R. A. (2001). Micoroorganisms in home and indoor work
environments: Diversity, health impacts, investigation and control. London; New York, NYl:
Taylor & Francis.
Forgacs, J., & Carll, W. T. (1962). Mycotoxicoses. Advances in Veterinary Science, 7, 273-382.
Frankel, M., Hansen, E. W., & Madsen, A. M. (2014). Effect of relative humidity on aerosolization and
total inflammatory potential of fungal particles from dust-inoculated gypsum boards. Indoor Air,
24, 16-28.
Frisvad, J. C., Larsen, T. O., Meijer, M., Varga, J., Samson, R. A., & Nielsen, K. F. (2011). Fumonisin
and ochratoxin production in industrial Aspergillus niger strains. PLoS ONE, 6(8).
51 | P a g e
Genuis, S. J. (2007). Clinical medicine and the budding science of indoor mold exposure. European
Journal of Internal Medicine, 18, 516-523.
Grant, C., Hunter, C. A., Flannigan, B., & Bravery, A. F. (1989). The moisture requirements of molds
isolated from domestic dwellings. International Biodeterioration, 25, 259-284.
Guggemos, A. A., & Harvath, A. (2005). Comparison of environmental effects of steel- and concrete-
framed buildings. Journal of Infrastructure Systems, 11(2), 93-101.
Harvey, P., & May, R. (1990). Matrimony, Mattresses and mites. New Scientist, 125, 48-49.
Haugland, R., Vesper, S., & US Environmental Protection Agency. (2002). Method of identifying and
quantifying specific fungi and bacteria.
Hess, J. A., Kincl, L. D., & Davis, K. (2009). The impact of drywall handling tools on the low back. Applied
Ergonomics, 41(2), 305-312.
Hoang, C. P., Kinney, K. A., Corsi, R. L., & Szaniszlo, P. J. (2010). Resistance of green building materials to
fungal growth. International Biodeterioration and Biodegradation, 64, 104-113.
Hohler, D. (1988). Ochratoxin A in food and feed: occurrence, legislation and mode of action. Aeitschrift
Fur Ernahrungswissenschaft, 37, 2-12.
Home Depot. Drywall. Retrieved from: www.homedepot.ca [Feb 1, 2015].
Home Hardware. Drywall. Retrieved from: http://www.homehardware.ca/en/index.htm [Feb 1, 2015].
Horak, R. M., Steyn, P. S., Vleggaar, R., &Rabie, C. J. (1985). Metabollites of Aspergillus ustus. Part 3.
Structure elucidation of austalides. Journal of the Chemical Society, 1, 363-367.
Hutchinson, G. E. (1957). Population studies-animal ecology and demography-concluding remarks. Cold
Spring Harbor Symposia on Quantitative Biology, 22, 415-427.
IBM Knowledge Centre. (2015). Generalized Linear Models. Retrieved from
http://www.ibm.com/support/knowledgecenter [Accessed June 28, 2016].
Instron. Illinois Tool Works Inc. Retrieved from: www.instron.com [Jan, 25, 2015].
Jamriska, M., Morawska, L., & Clarke, B. A. (2000). Effect of ventilation and filtration on submicrometer
particles in an Indoor Environment. Indoor Air, 10, 19-26.
Karunasena, E., Markham, N., Brasel, T., Cooley, J. D., & Straus, D. C. (2000). Evaluation of fungal growth
on cellulose-containing and inorganic ceiling tile. Mycopathologia, 150, 91-95.
Keller, N. P., Turner, G., & Bennett, J. W. (2005). Fungal secondary metabolism-from biochemistry to
genomics. Nature Reviews Microbiology, 3, 937-947.
52 | P a g e
Kembel, S. W., Jones, E., Kline, J., Northcutt, D., Stenson, J., et al. (2012). Architectural design influences
the diversity and structure of the built environment microbiome. The ISME Journal, 6, 1469-
1479.
Kendrick, B. (1985). The fifth Kingdom. Waterloo, Ont: Mycologue Publications.
Keall, M. D., Crane, J., Baker, M. G., Wickens, K., Chapman, P. H., & Cunningham, M. (2012). A measure
for quantifying the impact of housing quality on respiratory health: a cross-sectional study.
Environmental Health, 11(33).
Kemp, P. C., Neumeister-Kemp, H. G., Koch, C., Lysek, G., & Murray, F. (2002). Determining the growth
and vitality of microorganisms in carpets and mattresses in non-problem dwellings by measuring
CO2 released during respiration. Indoor Built Environment, 11, 214-220.
Kildeso, J., Wurtz, H., Nielsen, K. F., Kruse, P., Wilkins, K., Thrane, U., Gravesen, S., Nielsen, P. A., &
Schneider, T. (2003). Determination of fungal spore release from wet building materials. Indoor
Air, 13(2), 148-155.
Korpi, A., Pasanen, A. L., Pasanen, P., & Kalliokoski. P. (1997). Microbial growth and metabolism in house
dust. International Biodeterioration & Biodegradation; 40, 19-27.
Krause, M., Geer, W., Swenson, L., Fallah, P., & Robbins, C. (2006). Controlled study of mold growth and
cleaning procedure on treated and untreated wet gypsum wallboard in an indoor environment.
Journal of Occupational and Environmental Hygiene, 3(8), 435-441.
Land, C. J., Must, A., & Hogberg, N. (2003). Identification of fungi, especially Stachybotrys chartarum
from gypsum boards, by means of PCR and sequencing of ribosomal DNA. Indoor Built
Environment, 12, 227-229.
Lee, S. H., Lee, H. J., Kim, S. J., Lee, H. M., Kang, H., et al. (2010). Identification of airborne bacterial and
fungal community structures in an urban area by T-RFLP analysis and quantitative real-time PCR.
Science of the Total Environment, 408, 1349-1357.
Lindsley, W. G., Schmechel, D., & Chen, B. T. (2006). A two-stage cyclone using microcentrifuge tubes for
personal bioaerosol sampling. Journal of Environmental Monitoring, 8, 1136-1142.
Magan, N., Aldred, D. (2007). Why do fungi produce mycotoxins? Food mycology: a multifaceted
approach to fungi and food: CRC Press.
Mankowski, M., & Morrell, J. J. (2000). Patterns of fungal attack in wood-plastic composites following
exposure in a soil block test. Wood and Fiber Science, 32, 340-345.
Mazur, L. J., & Kim, J. (2006). Spectrum of non-infectious health effects from molds. Pediatrics, 118(6).
McCullagh, P., & Nelder, J. A. (1989). Generalized Linear Models (2nd ed.). Washington, DC: Chapman &
Hall/CRC.
53 | P a g e
McGregor, D. B. (1987). Genotoxic chemicals in the human environment: their identification and
interaction; editors: SCOPE.
Mehta, M., Scarborough, W., & Armpriest, D. (2008). Gypsum Board. Building Construction:
Principles, Materials, & Systems. Pearson Education, Inc. Upper Saddle River, NJ., pp 320-323.
Mendell, M. J., Mirer, A. G., Cheung, K., Tong, M., & Douwes, J. (2011). Respiratory and allergic health
effects of dampness, mold, and dampness-related agents: A review of the epidemiologic
evidence. Environmental Health Perspectives, 119, 748-756.
Menetrez, M. Y., Foarde, K. K., Webber, T. D., Dean, T. R., & Betancourt, D. A. (2007). Testing
antimicrobial paint efficacy on gypsum wallboard contaminated with Stachybotrys chartarum.
Journal of Occupational and Environmental Hygiene, 5(2), 63-66.
Mihinova, D., & Pieckova, E. (2012). Moldy buildings, health of their occupants and fungal prevention.
Bratisl Lek Listy, 13(5), 314-318.
Miller, J. D., McMullin, D. R. (2014). Fungal secondary metabolites as harmful indoor air contaminants:
10 years on. Applied Microbiology & Biotechnology, 98, 9953-9966.
Mudarri, D. H. (2016). Valuing the economic costs of allergic rhinitis, acute bronchitis, and asthma from
exposure to indoor dampness and mold in the US. Journal of Environmental & Public Health,
2016, 1-12.
Muilenberg, M. L. (1995). The Outdoor Aerosol. In: Burge, H.A. (Ed). Bioaerosols. CRC Press, Inc., Boca
Raton, Florida, pp. 163-204.
Nielsen, K. F. (2002). Mould growth on building materials. The Mycology Group, Technical University of
Denmark.
Nielsen, K. F. (2003). Mycotoxin production by indoor molds. Fungal Genetics and Biology, 39, 103-117.
Nielsen, K. F., Holm, G., Uttrup, L. P., and & Nielsen, P. A. (2004). Mould growth on building materials
under low water activities. Influence of humidity and temperature on fungal growth and
secondary metabolism. International Biodeterioration and Biodegradation, 54(4),325-336.
Nielsen, K. F., Thrane, U., Larsen, T. O., Nielsen, P. A., & Gravesen, S. (1998). Production of mycotoxins
on artificially inoculated building materials. International Biodeterioration & Biodegradation, 42,
9-16.
O'Connor, G. T., Walter, M., Mitchell, H., Kattan, M., Morgan, W. J., Gruchalla, R. S., Pangracic, J. A.,
Smartt, E., Stout, J. W., Evans, R., Crain, E. F., & Burge, H. A. (2004). Airborne fungi in the homes
of children with asthma in low-income urban communities: The inner-city asthma study. The
Journal of Allergy and Clinical immunology, 114(3), 599-606.
54 | P a g e
Pakarinen, J., Hyvarinen, A., Salkinoja-Salonen, M., Laitinen, S., Nevalainen, A., et al. (2008).
Predominance of Gram-positive bacteria in house dust in the low-allergy risk Russian Karelia.
Environmental Microbiology, 10, 3317-3325.
Pasanen, P., Korpi, A., Kalliokoski, P., & Pasanen, A. L (1997). Growth and volatile metabolite production
of Aspergillus versicolor in house dust. Environment International, 23, 425-432.
Pekhtasheva E., Neverov A., Kubica S., & Zaikov G. (2012). Biodegradation and biodeterioration of some
natural polymers. Chemistry and Chemical Technology, 6(3).
Pitkaranta, M. (2012). Molecular profiling of indoor microbial communities in moisture damaged and
non-damaged buildings Helsinki. University of Helsinki; 463 p.
Pitt, J. I. (2000). Toxigenic fungi and mycotoxins. British Medical Bulletin, 56: 184-192.
Portnoy, J. M., Barnes, C. S., & Kennedy, K. (2004). Sampling for indoor fungi. Journal of Allergy and
Clinical Immunology, 113, 189-198.
Ramirez, O. A., Santos, A. G., & Gonzalez, F. J. N. (2011). Physical and mechanical characterization of
gypsum boards containing phase change materials for latent heat storage A. Materiales de
construccion, 61,465-484.
Ramos, T., & Stephens, B. (2014). Tools to improve built environment data collection for indoor
microbial ecology investigations. Building and Environment, 81, 243-257.
Rogers, C. A. (2003). Indoor fungal exposure. Immunology and Allergy Clinics of North America, 23, 501-
518.
RONA Home and Garden. Drywall and Trims. Retrived from: http://www.rona.ca/en [Feb, 1, 2015].
Schmidt, O. (2007). Indoor wood-decay basidiomycetes: damage, causal fungi, physiology, identification
and characterization, prevention and control. Mycological Progress, 6(4), 261-279.
Scott, J. A., Untereiner, B., Wong, N., Straus, A., & Malloch, D. (2004). Genotypic variation in Penicillium
chysogenum from indoor environments. Mycologia, 96,1095-1105.
Scott, J.A. (2001). Studies on indoor fungi (doctoral dissertation). University of Toronto, Canada.
Sharpe, R., Thornton, C. R., Osborne, N. J. (2014). Modifiable factors governing indoor fungal diversity
and risk of asthma. Clinical and Experimental Allergy, 44, 631-641.
Sivasubramani, S. K., Niemeier, R. T., Reponen, T., Grinshpun, S. A. (2004). Assessment of the
aerosolization potential for fungal spores in moldy homes. Indoor Air, 14, 405-412.
Steyn, P. S., & Vleggaar, R. (1976). The structure of dihydrodeoxy-8-epi-austdiol and the absolute
configuration of the azaphilones. Journal of the Chemical Society, 1, 204-206.
55 | P a g e
Straube, J. (2006). Moisture and materials. Building Science Digest, 138, 1-7.
Sun, Z., Wang, Y., Ji, S., Wang, K., & Zhao, Y. (2015). Computer-aided analysis with image J for
quantitatively assessing psoriatic lesion area. Skin Research and Technology, 21(4), 437-443.
Thelander, O., Bjurnman, J., & Boutelje, J. (1993). Increase in the content of low molecular carbon
hydrates at lumber surfaces during drying and correlation with nitrogen content, yellowing, and
mould growth. Wood Science Technology, 27, 381-389.
Vacher, S., Hermamdez, C., Bartschi, C., & Poussereau, N. (2010). Impact of paint and wall-paper on
mould growth on plasterboards and aluminum. Building and Environment, 45, 916-921.
Varga, J., Peteri, Z., Tabori, K., Teren, J., & Vagvolgyi, C. (2005). Degradation of ochratoxin A and other
mycotoxins by Rhizopus isolates. International Journal of Food Microbiology, 99, 321-328.
Verhoeff, A. P., Vanwijnen, J. H., Vanreenenhoekstra, E. S., Samson, R. A., Vanstrien, R. T., et al. (1994).
Fungal propagules in-house dust .2. Relation with residential characteristics and respiratory
symptoms. Allergy, 4, 540-547.
Vesper, S., McKinstry, C., Ashley, P., Haugland, R., Yeatts, K., Bradham, K., & Svendsen, E. (2007).
Quantitative PCR analysis of molds in the dust from homes of asthmatic children in North
Carolina. Journal of Environmental Monitoring, 9(8), 826-830.
Viitanen, H. A. (1997). Modelling the time factor in the development of mould fungi-Effects of critical
humidity and temperature conditions in pine and spruce sapwood. Holzforschung, 51, 6-14.
Vojta, P. J., Randels, S. P., Stout, J., Muilenberg, M., Bruge, H. A., Lynn, H., Mitchell, H., O'connor, G. T., &
Zeldin, D. C. (2001). Effects of physical interventions on house dust mite allergen levels in carpet,
bed, and upholstery dust in low-income, urban homes. Environmental Health Perspectives,
109(8), 815-819.
Wakili, G. K., Koebel, M., Glaettli, T., & Hofer, M. (2014). Thermal conductivity of gypsum boards beyond
dehydration temperature. Fire and Material, 39, 85-94.
Walsh, T. J., Wissel, M. C., Grantham, K. J., Petraitiene, R., Petraitis, V., Kasai, M., Francesconi, A., Cotton,
M. P., Hughes, J. E., Greene, L., Bacher, J. D., Manna, P., Salomoni, M., Kleiboeker, S. B., &
Reddy, S. K. (2011). Molecular detection and species-specific identification of medically
important aspergillus species by real-time PCR in experimental invasive pulmonary
aspergiollosis. Journal of Clinical Microbiology, 49(12), 4150-4157.
Wani, K. A., Mamta, K., Khan, T. A., & Lone, R. (2014). Fungal contamination of carpet industry in
Gwalior Madhya Pradesh (India). Indoor and Built Environment, 23(5), 724-729.
Webb, J. S., Nixon, M., Eastwood, I. M., Greenhalgh, M., Robson, G. D., et al. (2000). Fungal colonization
and biodeterioration of plasticized polyvinyl chloride. Applied and Environmental Microbiology,
66, 3194-3200.
56 | P a g e
Wickman, M., Gravesen, S., Nordvall, S. L., Pershagen, G., Sundell, J. (1992) Indoor viable dust-bound
microfungi in relation to residential characteristics, living habitats, and symptoms in atopic and
control children. Journal of Allergy and Clinical Immunology, 89(3), 752–759.
Won, D., Corsi, R. L., & Rynes, M. (2000). New indoor carpet as an adsorptive reservoir for volatile
organic compounds. Environmental Science & Technology, 34(19), 4193-4198.
World Health Organization. (2009). WHO guidelines for indoor air quality: dampness and mold.
Copenhagen: WHO Regional Office for Europe.
Xing, S., Xu, Z., & Jun, G. (2008). Inventory analysis of LCA on steel- and concrete-construction office
buildings. Energy & Buildings, 40(7), 1188-1193.
Yan, L., & Morrell, J. J. (2015). Mold and decay resistance of thermally modified Douglas-fir heartwood.
Forest Products Journal, 65(5-6), 272-277.
Yike, I., Rand, T., & Dearborn, D. G. (2007). The role of fungal proteinase in pathophyiology of
Stachybotryn chartarum. Mycopathologia, 164, 171-181.
Zock, J., Jarvis, D., Luczynska, C., Sunyer, J., Burney, P., & European Community Respiratory Health
Survey. (2002). Housing characteristics reported mold exposure, and asthma in European
community respiratory health survey. The Journal of Allergy & Clinical Immunology, 110(2), 285-
292.
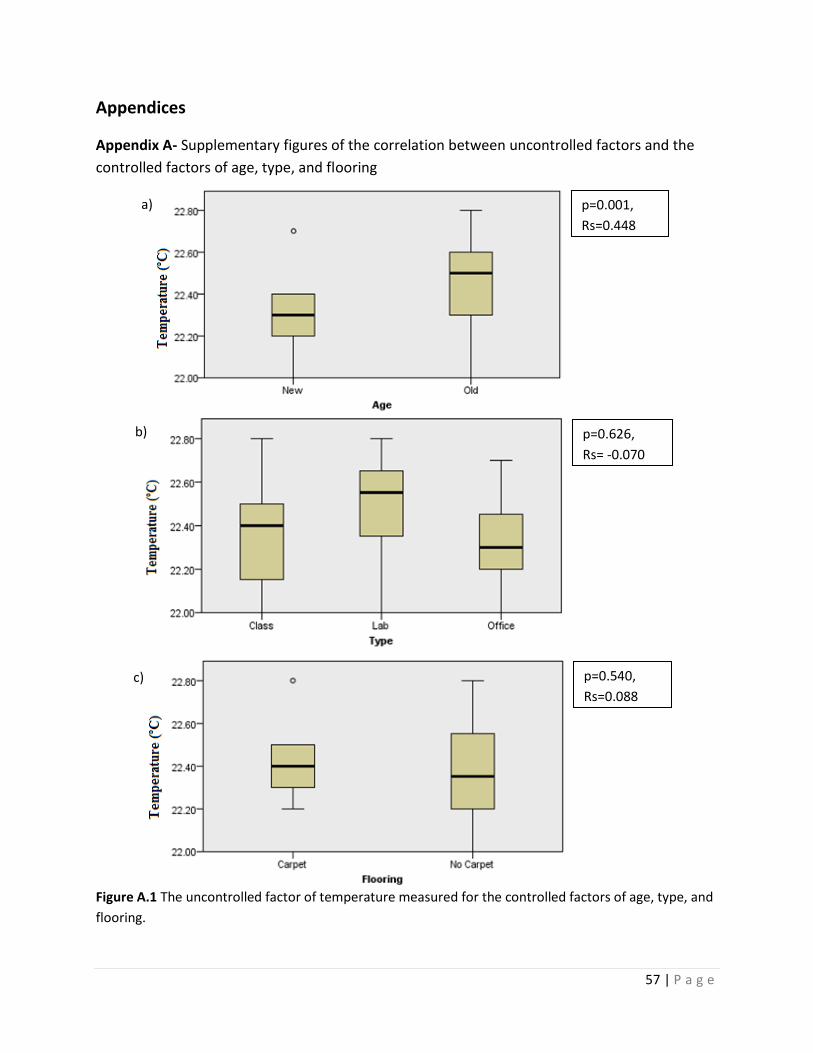
57 | P a g e
Appendices
Appendix A- Supplementary figures of the correlation between uncontrolled factors and the
controlled factors of age, type, and flooring
Figure A.1 The uncontrolled factor of temperature measured for the controlled factors of age, type, and
flooring.
p=0.001,
Rs=0.448
p=0.626,
Rs= -0.070
p=0.540,
Rs=0.088
a)
b)
c)
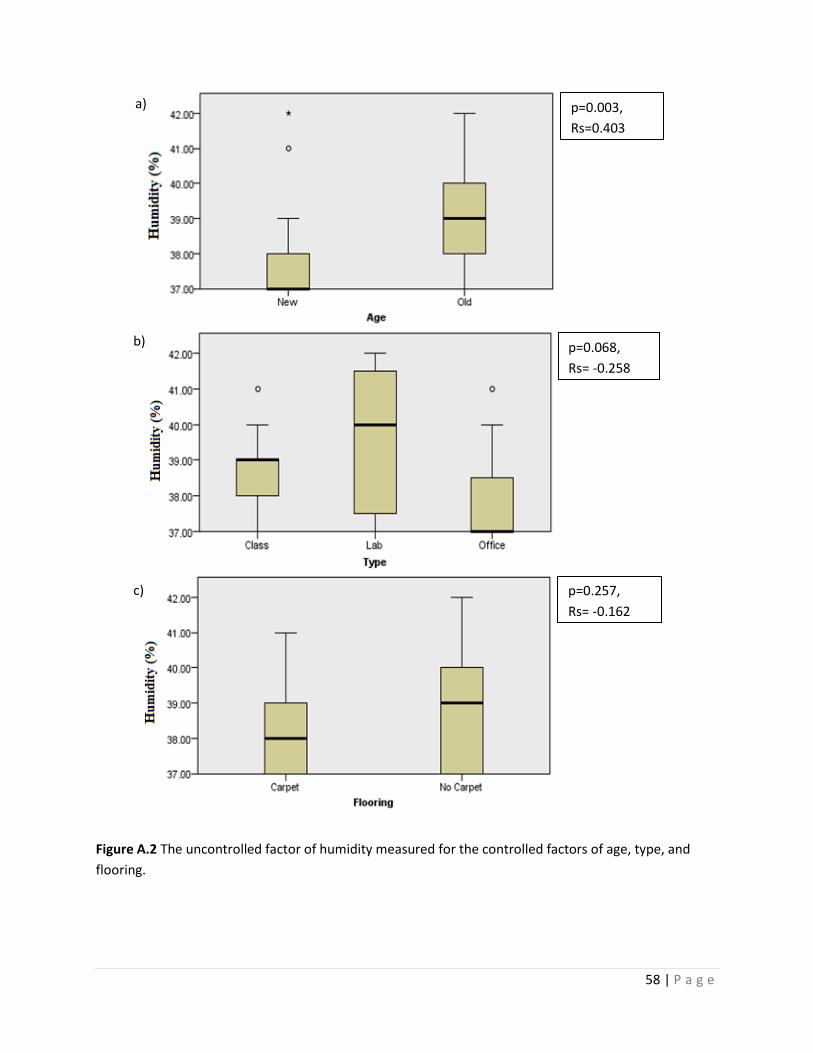
58 | P a g e
Figure A.2 The uncontrolled factor of humidity measured for the controlled factors of age, type, and
flooring.
p=0.003,
Rs=0.403
p=0.068,
Rs= -0.258
p=0.257,
Rs= -0.162
a)
b)
c)
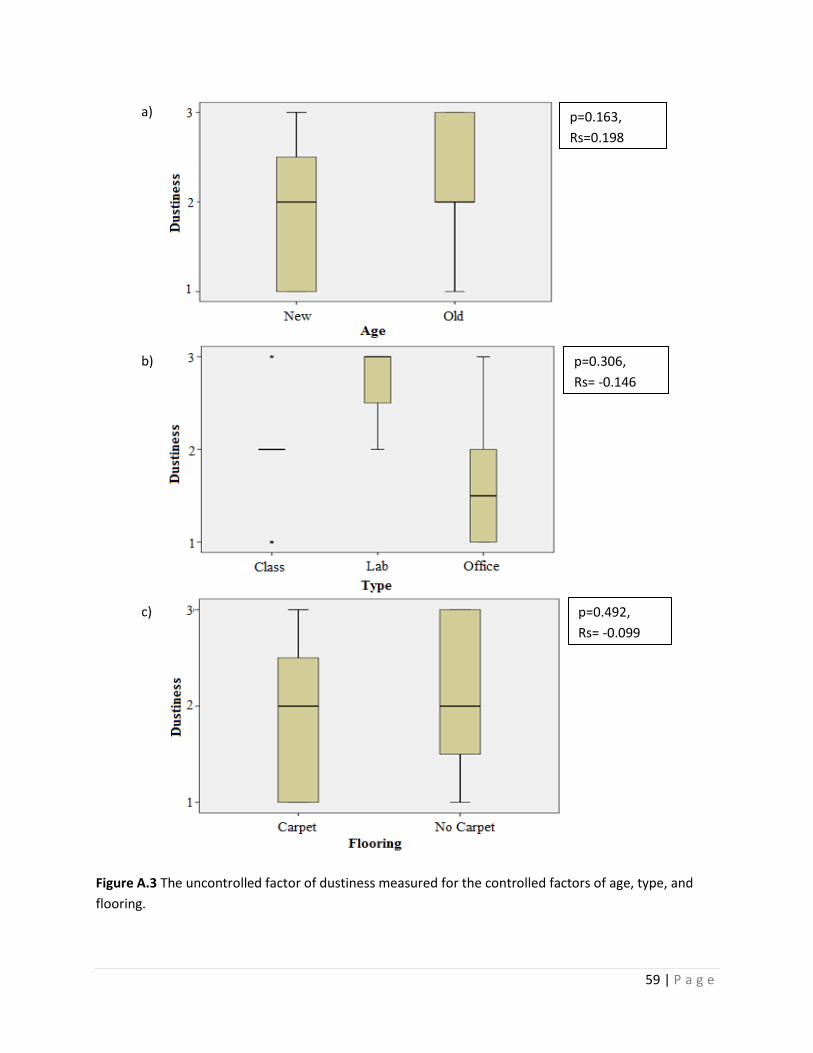
59 | P a g e
Figure A.3 The uncontrolled factor of dustiness measured for the controlled factors of age, type, and
flooring.
p=0.163,
Rs=0.198
p=0.306,
Rs= -0.146
p=0.492,
Rs= -0.099
a)
b)
c)
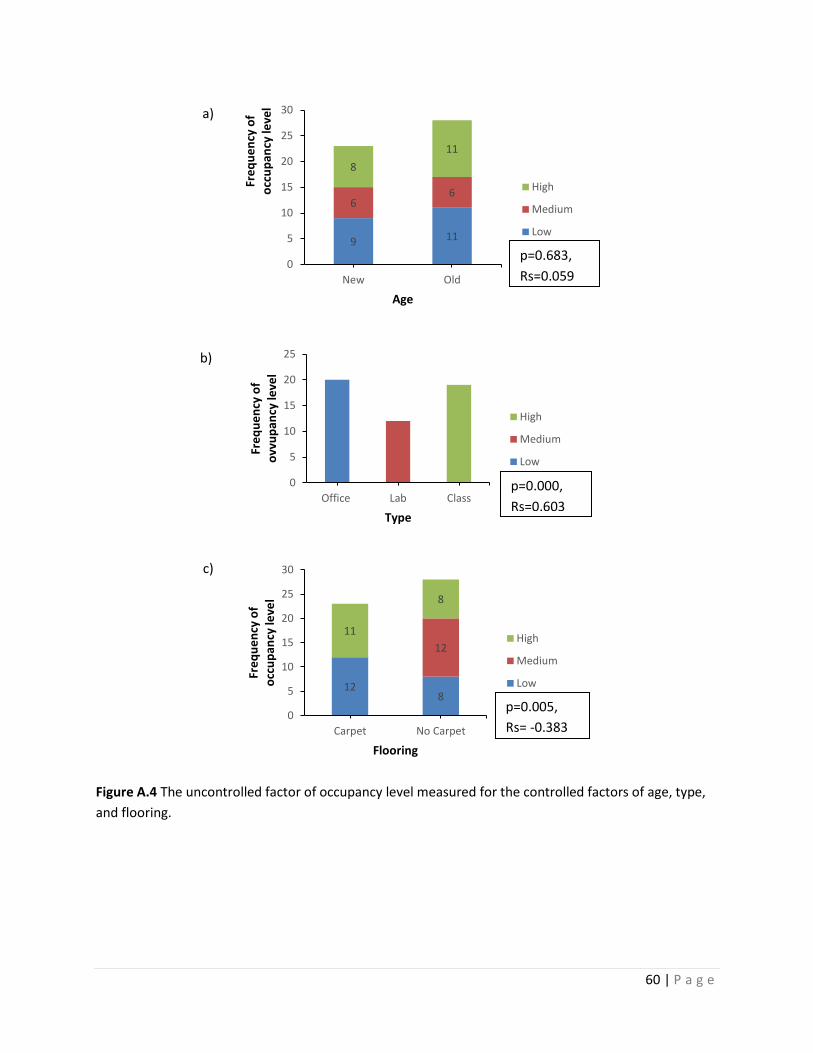
60 | P a g e
Figure A.4 The uncontrolled factor of occupancy level measured for the controlled factors of age, type,
and flooring.
9 11
66
8
11
0
5
10
15
20
25
30
New Old
Fre
qu
en
cy o
f o
ccu
pan
cy le
vel
Age
High
Medium
Low
0
5
10
15
20
25
Office Lab Class
Fre
qu
en
cy o
f o
vvu
pan
cy le
vel
Type
High
Medium
Low
128
12
11
8
0
5
10
15
20
25
30
Carpet No Carpet
Fre
qu
en
cy o
f o
ccu
pan
cy le
vel
Flooring
High
Medium
Low
p=0.683,
Rs=0.059
p=0.000,
Rs=0.603
p=0.005,
Rs= -0.383
a)
b)
c)
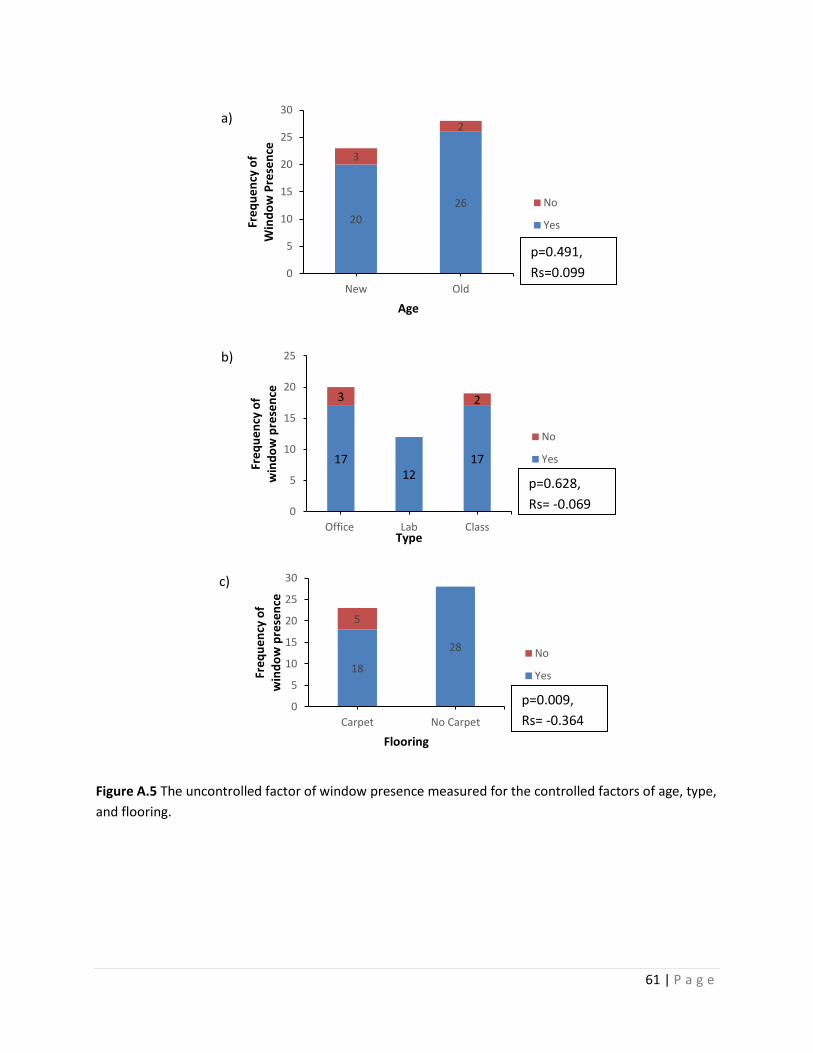
61 | P a g e
Figure A.5 The uncontrolled factor of window presence measured for the controlled factors of age, type,
and flooring.
20
26
3
2
0
5
10
15
20
25
30
New Old
Fre
qu
en
cy o
f W
ind
ow
Pre
sen
ce
Age
No
Yes
1712
17
3 2
0
5
10
15
20
25
Office Lab Class
Fre
qu
en
cy o
f w
ind
ow
pre
sen
ce
Type
No
Yes
18
28
5
0
5
10
15
20
25
30
Carpet No Carpet
Fre
qu
en
cy o
f w
ind
ow
pre
sen
ce
Flooring
No
Yes
p=0.491,
Rs=0.099
p=0.628,
Rs= -0.069
p=0.009,
Rs= -0.364
a)
b)
c)
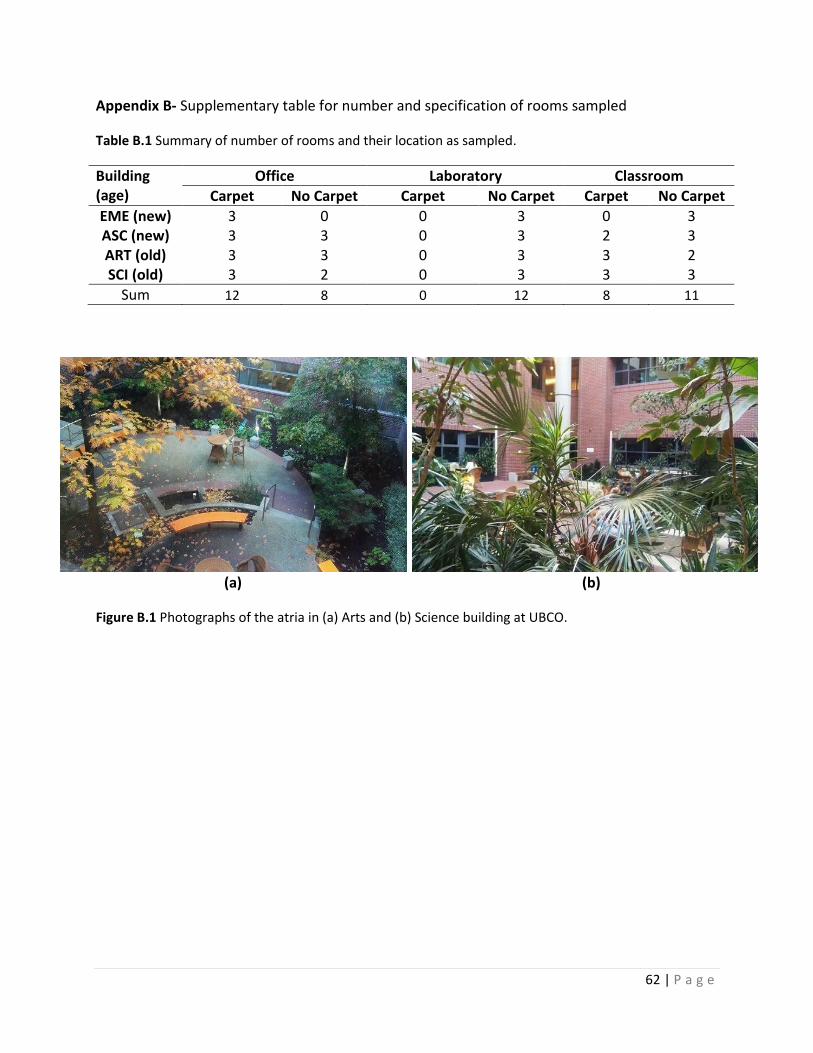
62 | P a g e
Appendix B- Supplementary table for number and specification of rooms sampled
Table B.1 Summary of number of rooms and their location as sampled.
Building (age)
Office Laboratory Classroom
Carpet No Carpet Carpet No Carpet Carpet No Carpet
EME (new) 3 0 0 3 0 3 ASC (new) 3 3 0 3 2 3 ART (old) 3 3 0 3 3 2 SCI (old) 3 2 0 3 3 3
Sum 12 8 0 12 8 11
(a) (b)
Figure B.1 Photographs of the atria in (a) Arts and (b) Science building at UBCO.
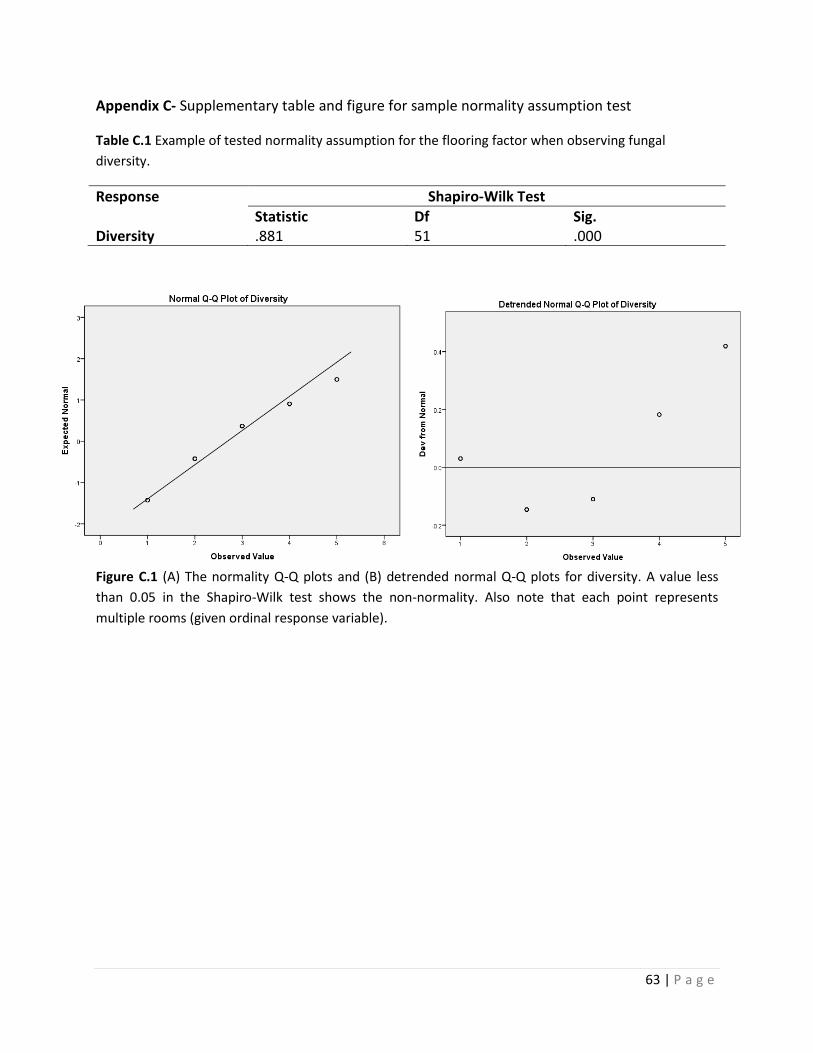
63 | P a g e
Appendix C- Supplementary table and figure for sample normality assumption test
Table C.1 Example of tested normality assumption for the flooring factor when observing fungal
diversity.
Response Shapiro-Wilk Test
Statistic Df Sig. Diversity .881 51 .000
Figure C.1 (A) The normality Q-Q plots and (B) detrended normal Q-Q plots for diversity. A value less
than 0.05 in the Shapiro-Wilk test shows the non-normality. Also note that each point represents
multiple rooms (given ordinal response variable).
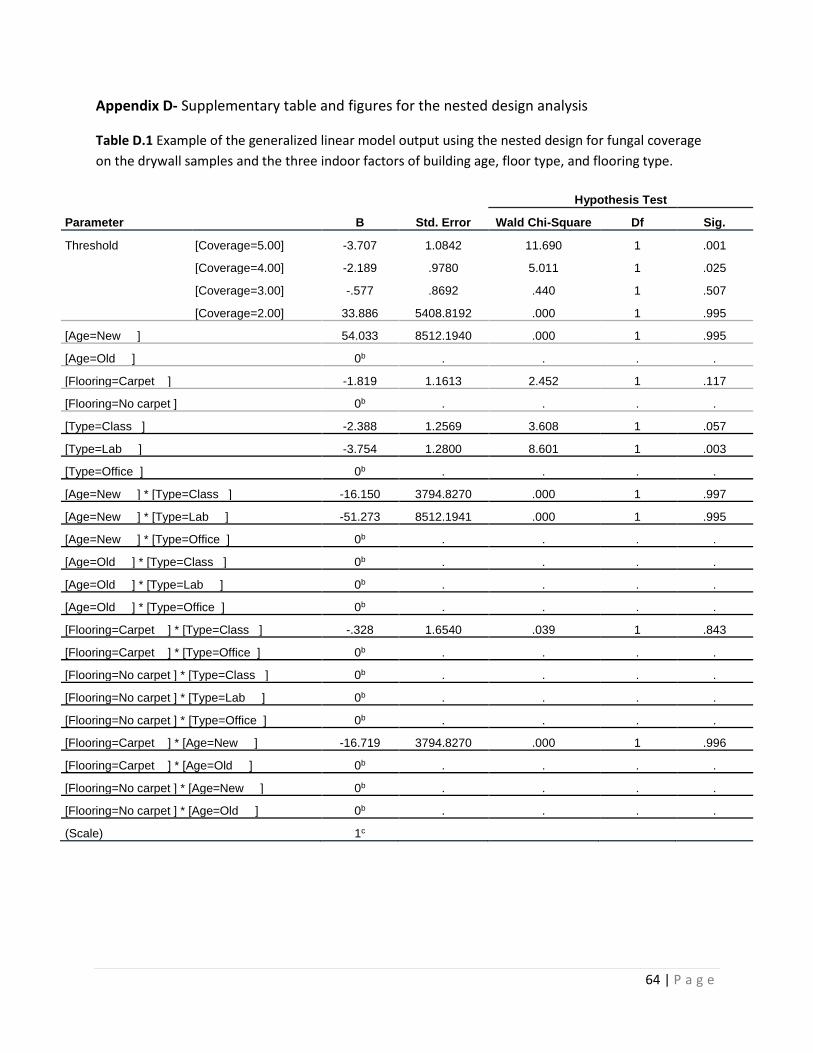
64 | P a g e
Appendix D- Supplementary table and figures for the nested design analysis
Table D.1 Example of the generalized linear model output using the nested design for fungal coverage
on the drywall samples and the three indoor factors of building age, floor type, and flooring type.
Parameter B Std. Error
Hypothesis Test
Wald Chi-Square Df Sig.
Threshold [Coverage=5.00] -3.707 1.0842 11.690 1 .001
[Coverage=4.00] -2.189 .9780 5.011 1 .025
[Coverage=3.00] -.577 .8692 .440 1 .507
[Coverage=2.00] 33.886 5408.8192 .000 1 .995
[Age=New ] 54.033 8512.1940 .000 1 .995
[Age=Old ] 0b . . . .
[Flooring=Carpet ] -1.819 1.1613 2.452 1 .117
[Flooring=No carpet ] 0b . . . .
[Type=Class ] -2.388 1.2569 3.608 1 .057
[Type=Lab ] -3.754 1.2800 8.601 1 .003
[Type=Office ] 0b . . . .
[Age=New ] * [Type=Class ] -16.150 3794.8270 .000 1 .997
[Age=New ] * [Type=Lab ] -51.273 8512.1941 .000 1 .995
[Age=New ] * [Type=Office ] 0b . . . .
[Age=Old ] * [Type=Class ] 0b . . . .
[Age=Old ] * [Type=Lab ] 0b . . . .
[Age=Old ] * [Type=Office ] 0b . . . .
[Flooring=Carpet ] * [Type=Class ] -.328 1.6540 .039 1 .843
[Flooring=Carpet ] * [Type=Office ] 0b . . . .
[Flooring=No carpet ] * [Type=Class ] 0b . . . .
[Flooring=No carpet ] * [Type=Lab ] 0b . . . .
[Flooring=No carpet ] * [Type=Office ] 0b . . . .
[Flooring=Carpet ] * [Age=New ] -16.719 3794.8270 .000 1 .996
[Flooring=Carpet ] * [Age=Old ] 0b . . . .
[Flooring=No carpet ] * [Age=New ] 0b . . . .
[Flooring=No carpet ] * [Age=Old ] 0b . . . .
(Scale) 1c
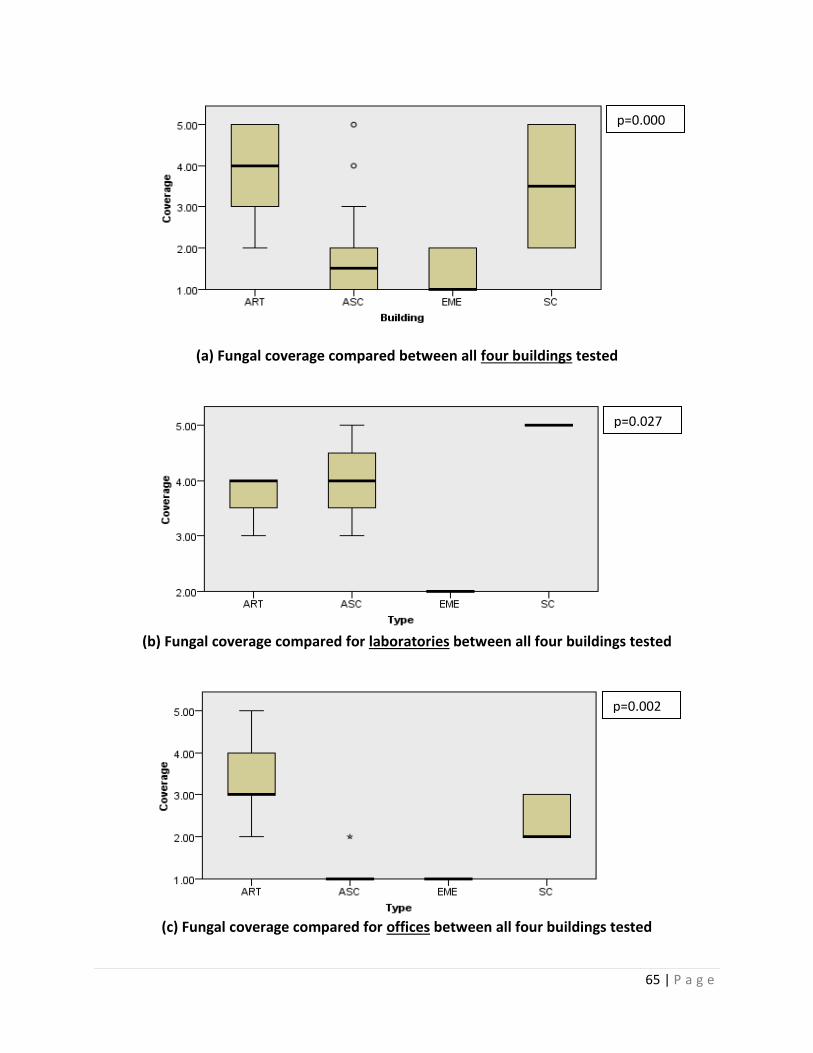
65 | P a g e
(a) Fungal coverage compared between all four buildings tested
(b) Fungal coverage compared for laboratories between all four buildings tested
(c) Fungal coverage compared for offices between all four buildings tested
p=0.000
p=0.027
p=0.002
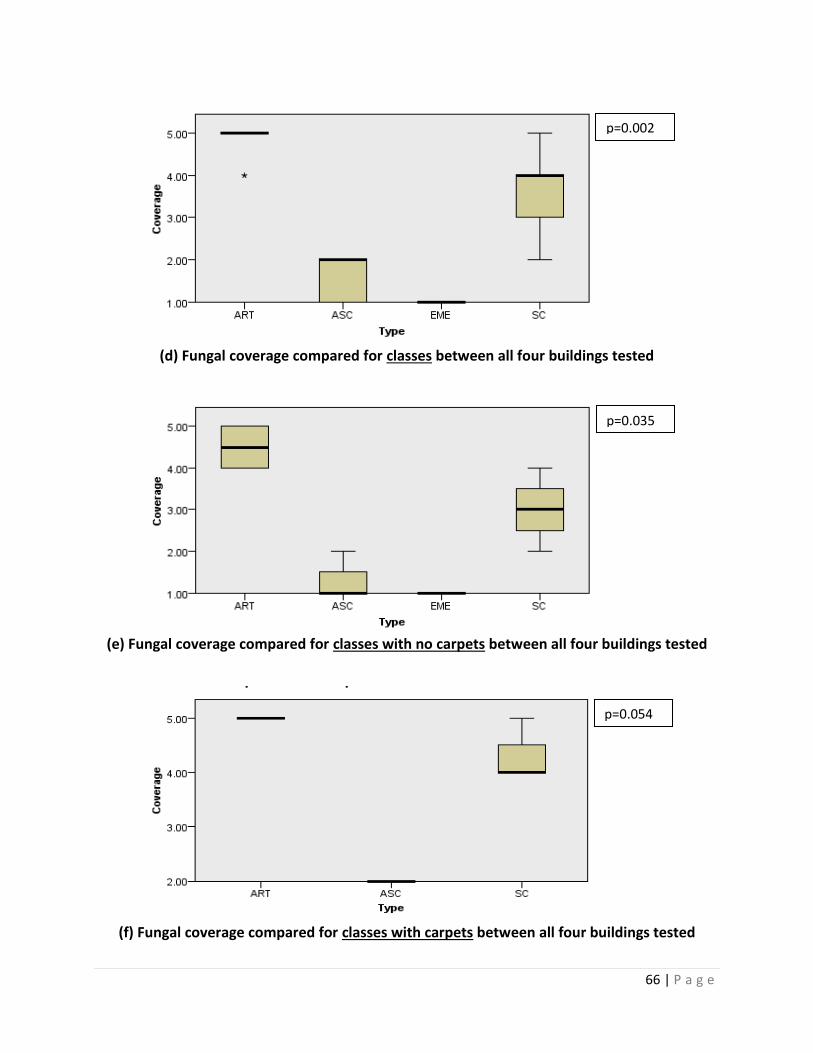
66 | P a g e
(d) Fungal coverage compared for classes between all four buildings tested
(e) Fungal coverage compared for classes with no carpets between all four buildings tested
(f) Fungal coverage compared for classes with carpets between all four buildings tested
p=0.002
p=0.035
p=0.054
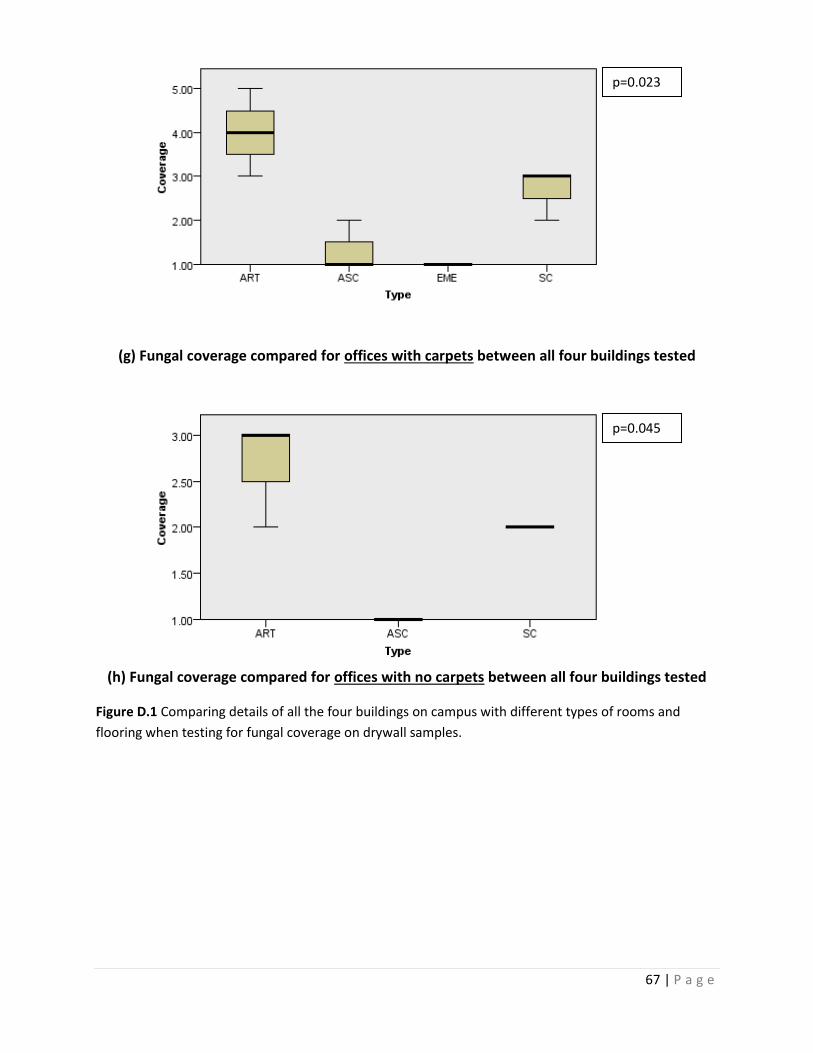
67 | P a g e
(g) Fungal coverage compared for offices with carpets between all four buildings tested
(h) Fungal coverage compared for offices with no carpets between all four buildings tested
Figure D.1 Comparing details of all the four buildings on campus with different types of rooms and
flooring when testing for fungal coverage on drywall samples.
p=0.023
p=0.045
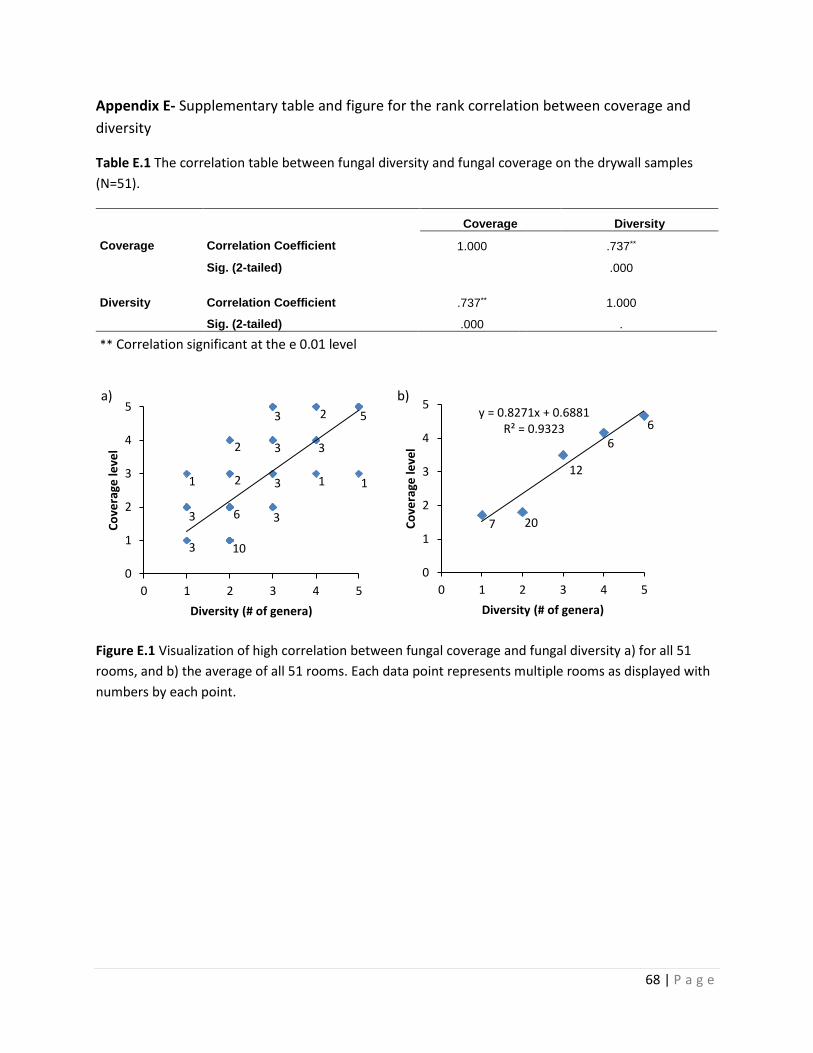
68 | P a g e
Appendix E- Supplementary table and figure for the rank correlation between coverage and
diversity
Table E.1 The correlation table between fungal diversity and fungal coverage on the drywall samples
(N=51).
Figure E.1 Visualization of high correlation between fungal coverage and fungal diversity a) for all 51
rooms, and b) the average of all 51 rooms. Each data point represents multiple rooms as displayed with
numbers by each point.
Coverage Diversity
Coverage Correlation Coefficient 1.000 .737**
Sig. (2-tailed) .000
Diversity Correlation Coefficient .737** 1.000
Sig. (2-tailed) .000 .
** Correlation significant at the e 0.01 level
0
1
2
3
4
5
0 1 2 3 4 5
Co
vera
ge le
vel
Diversity (# of genera)
y = 0.8271x + 0.6881R² = 0.9323
0
1
2
3
4
5
0 1 2 3 4 5
Co
vera
ge le
vel
Diversity (# of genera)
20
6
6
7
12 1
5 2
3
1
3
3
3
3
10
6
2
2
3
3
1
a) b)
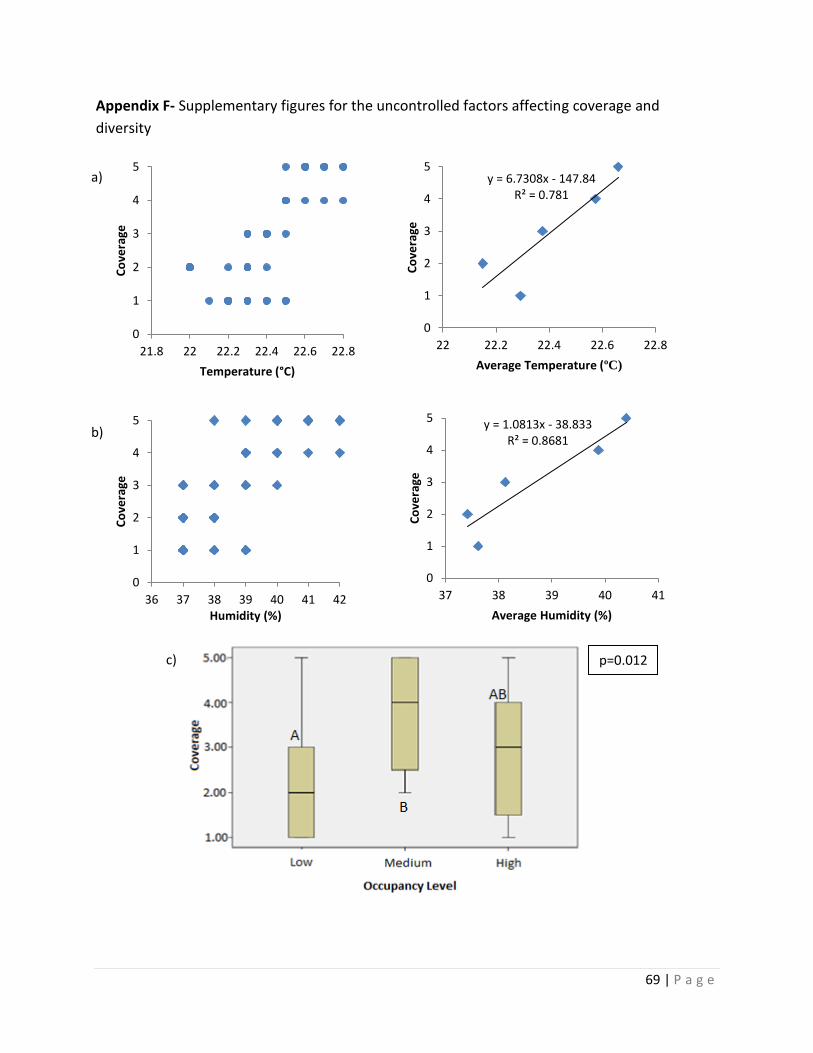
69 | P a g e
Appendix F- Supplementary figures for the uncontrolled factors affecting coverage and
diversity
0
1
2
3
4
5
21.8 22 22.2 22.4 22.6 22.8
Co
vera
ge
Temperature (°C)
y = 6.7308x - 147.84R² = 0.781
0
1
2
3
4
5
22 22.2 22.4 22.6 22.8
Co
vera
ge
Average Temperature (ºC)
0
1
2
3
4
5
36 37 38 39 40 41 42
Co
vera
ge
Humidity (%)
y = 1.0813x - 38.833R² = 0.8681
0
1
2
3
4
5
37 38 39 40 41
Co
vera
ge
Average Humidity (%)
p=0.012
a)
b)
c)
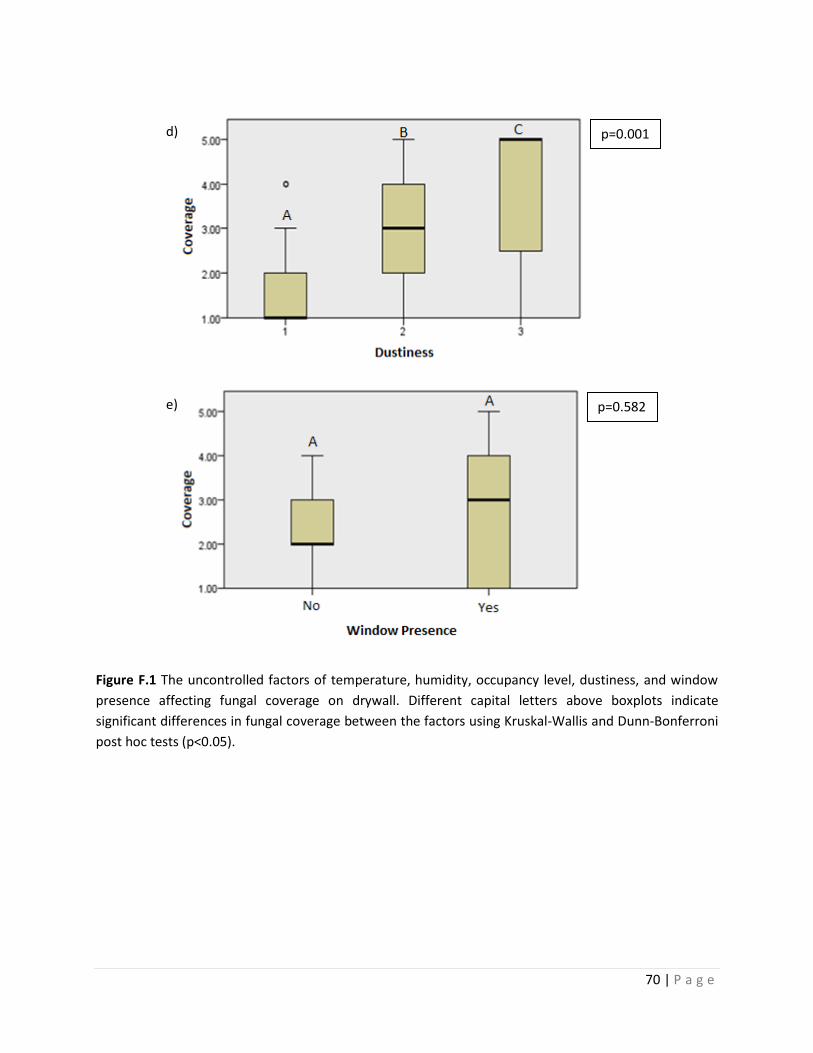
70 | P a g e
Figure F.1 The uncontrolled factors of temperature, humidity, occupancy level, dustiness, and window
presence affecting fungal coverage on drywall. Different capital letters above boxplots indicate
significant differences in fungal coverage between the factors using Kruskal-Wallis and Dunn-Bonferroni
post hoc tests (p<0.05).
p=0.001
p=0.582
d)
e)
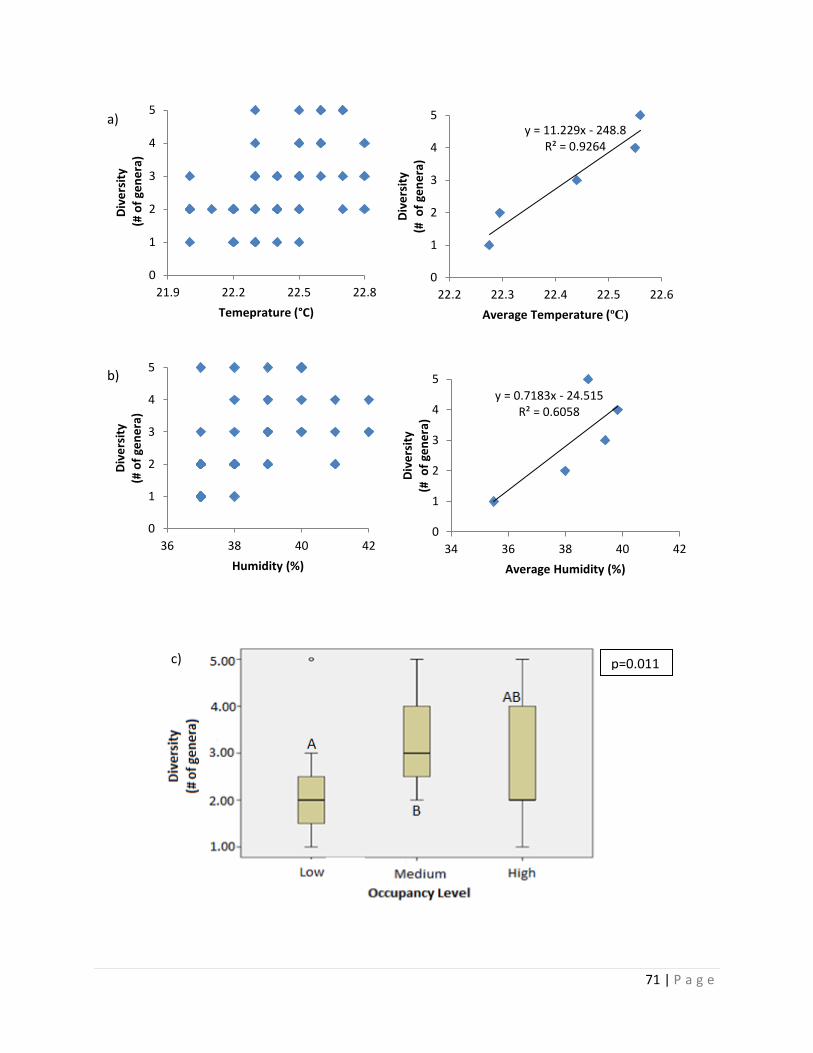
71 | P a g e
0
1
2
3
4
5
21.9 22.2 22.5 22.8
Div
ers
ity
(# o
f ge
ne
ra)
Temeprature (°C)
y = 11.229x - 248.8R² = 0.9264
0
1
2
3
4
5
22.2 22.3 22.4 22.5 22.6
Div
ers
ity
(# o
f ge
ne
ra)
Average Temperature (ºC)
0
1
2
3
4
5
36 38 40 42
Div
ers
ity
(# o
f ge
ne
ra)
Humidity (%)
y = 0.7183x - 24.515R² = 0.6058
0
1
2
3
4
5
34 36 38 40 42
Div
ers
ity
(# o
f ge
ne
ra)
Average Humidity (%)
p=0.011
a)
b)
c)
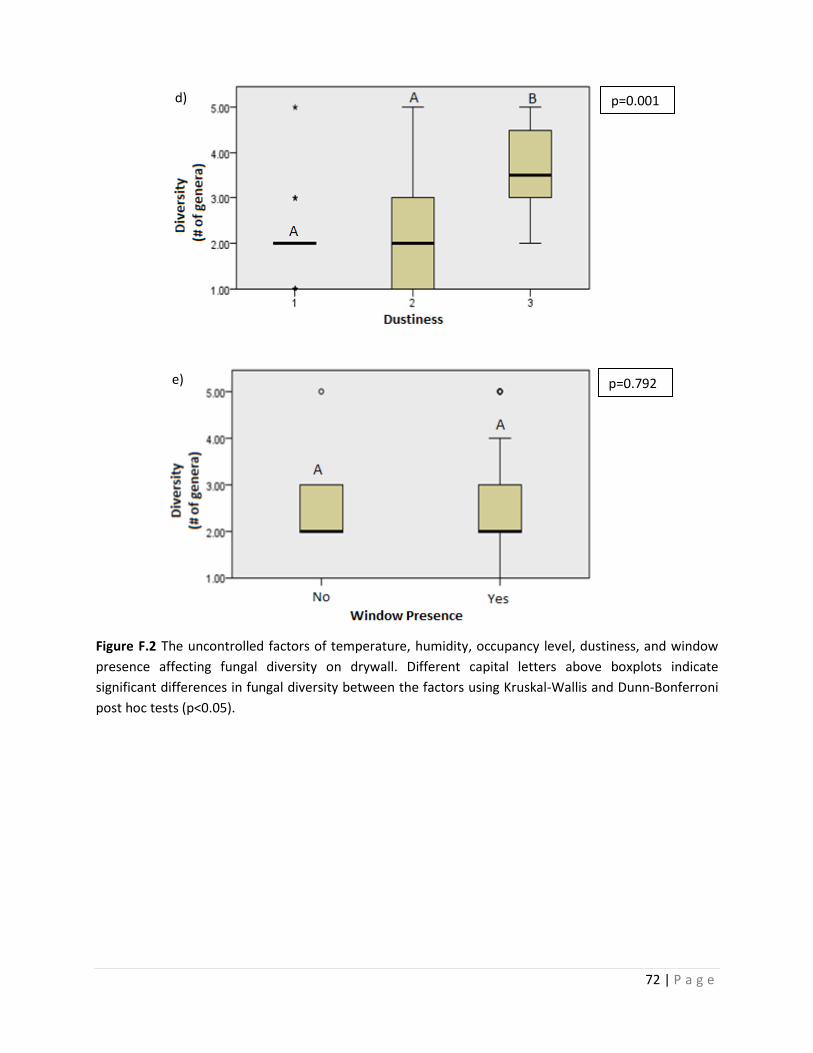
72 | P a g e
Figure F.2 The uncontrolled factors of temperature, humidity, occupancy level, dustiness, and window
presence affecting fungal diversity on drywall. Different capital letters above boxplots indicate
significant differences in fungal diversity between the factors using Kruskal-Wallis and Dunn-Bonferroni
post hoc tests (p<0.05).
p=0.001
p=0.792
d)
e)
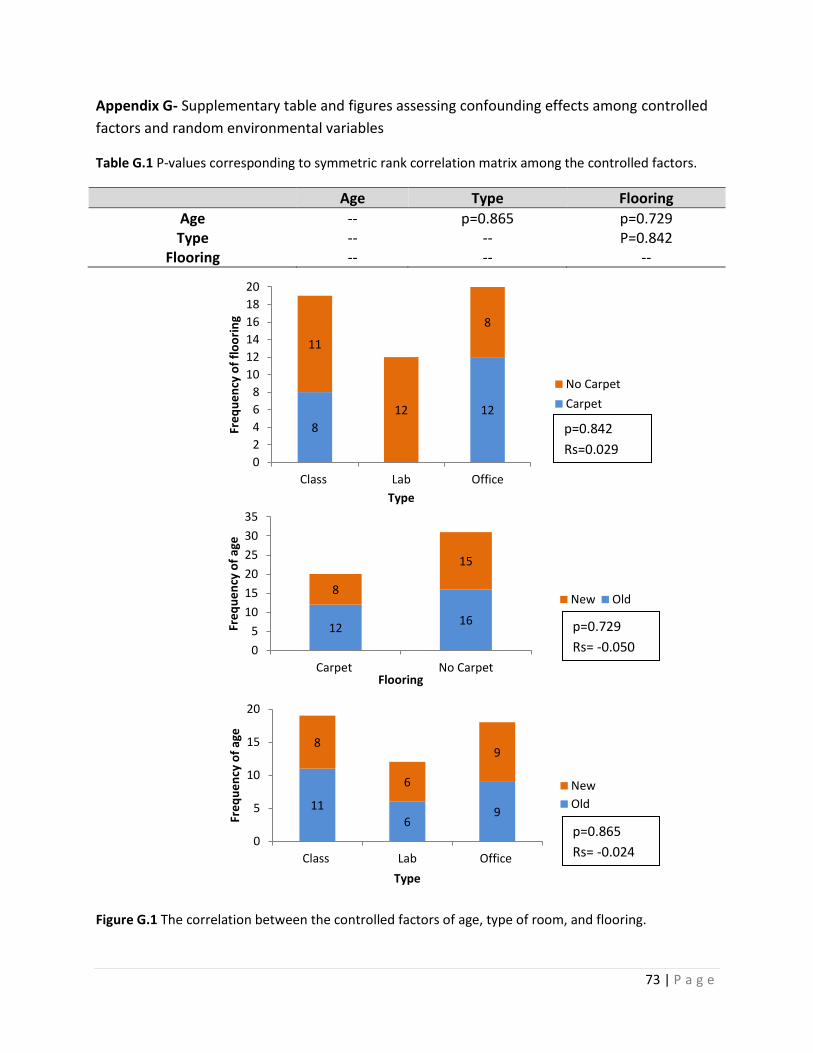
73 | P a g e
1216
8
15
0
5
10
15
20
25
30
35
Carpet No Carpet
Fre
qu
en
cy o
f ag
e
Flooring
New Old
116
9
8
6
9
0
5
10
15
20
Class Lab Office
Fre
qu
en
cy o
f ag
e
Type
New
Old
Appendix G- Supplementary table and figures assessing confounding effects among controlled
factors and random environmental variables
Table G.1 P-values corresponding to symmetric rank correlation matrix among the controlled factors.
Age Type Flooring
Age -- p=0.865 p=0.729 Type -- -- P=0.842
Flooring -- -- --
Figure G.1 The correlation between the controlled factors of age, type of room, and flooring.
8
12
11
12
8
0
2
4
6
8
10
12
14
16
18
20
Class Lab Office
Fre
qu
en
cy o
f fl
oo
rin
g
Type
No Carpet
Carpet
p=0.842
Rs=0.029
p=0.729
Rs= -0.050
p=0.865
Rs= -0.024
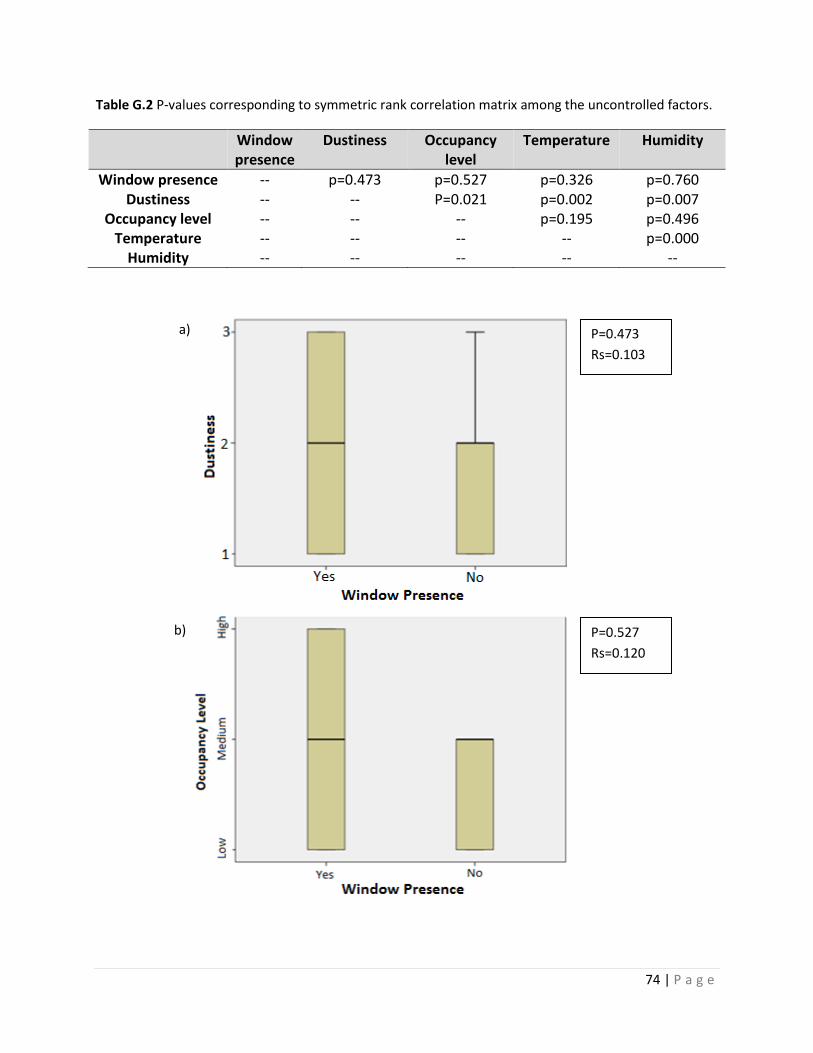
74 | P a g e
Table G.2 P-values corresponding to symmetric rank correlation matrix among the uncontrolled factors.
Window presence
Dustiness Occupancy level
Temperature Humidity
Window presence -- p=0.473 p=0.527 p=0.326 p=0.760 Dustiness -- -- P=0.021 p=0.002 p=0.007
Occupancy level -- -- -- p=0.195 p=0.496 Temperature -- -- -- -- p=0.000
Humidity -- -- -- -- --
P=0.473
Rs=0.103
P=0.527
Rs=0.120
a)
b)
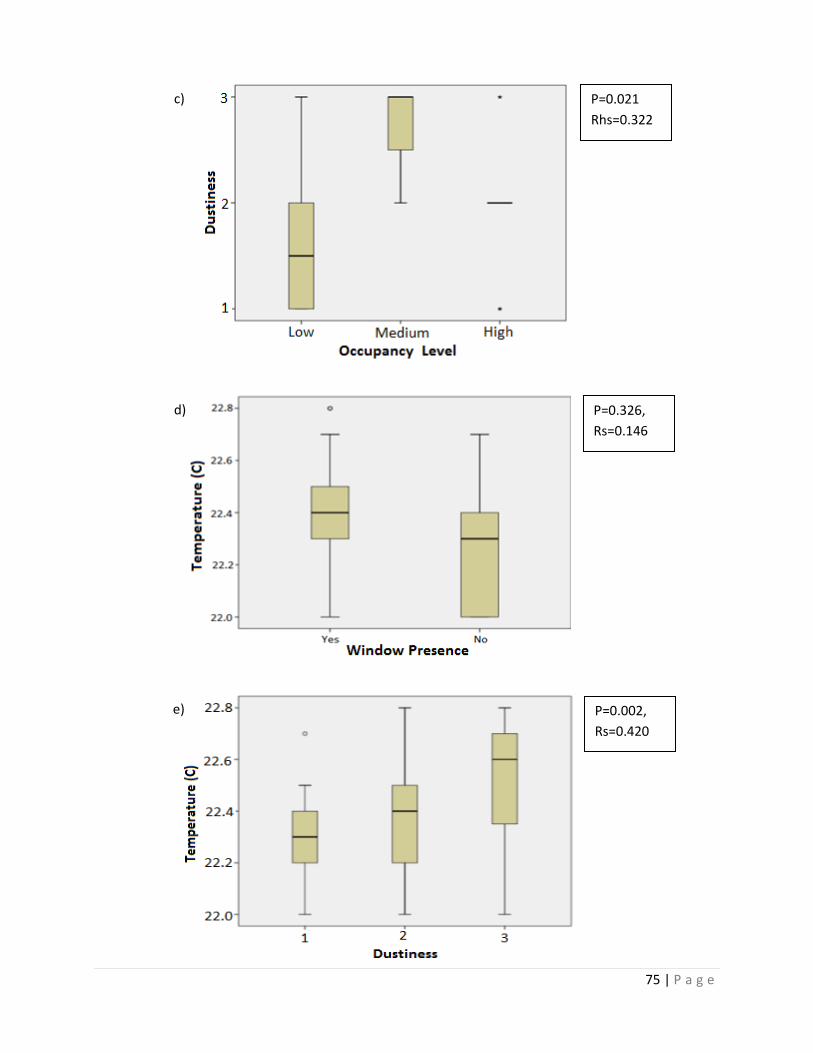
75 | P a g e
P=0.021
Rhs=0.322
P=0.326,
Rs=0.146
P=0.002,
Rs=0.420
c)
d)
e)
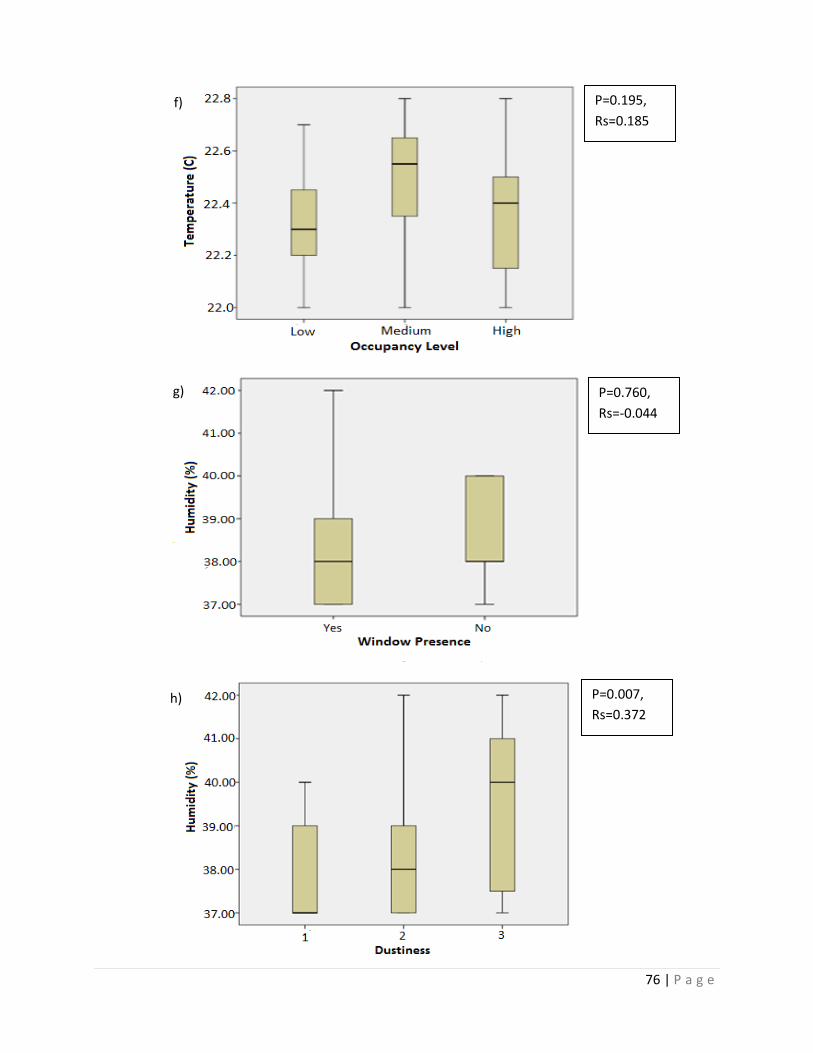
76 | P a g e
P=0.195,
Rs=0.185
P=0.760,
Rs=-0.044
P=0.007,
Rs=0.372
f)
g)
h)
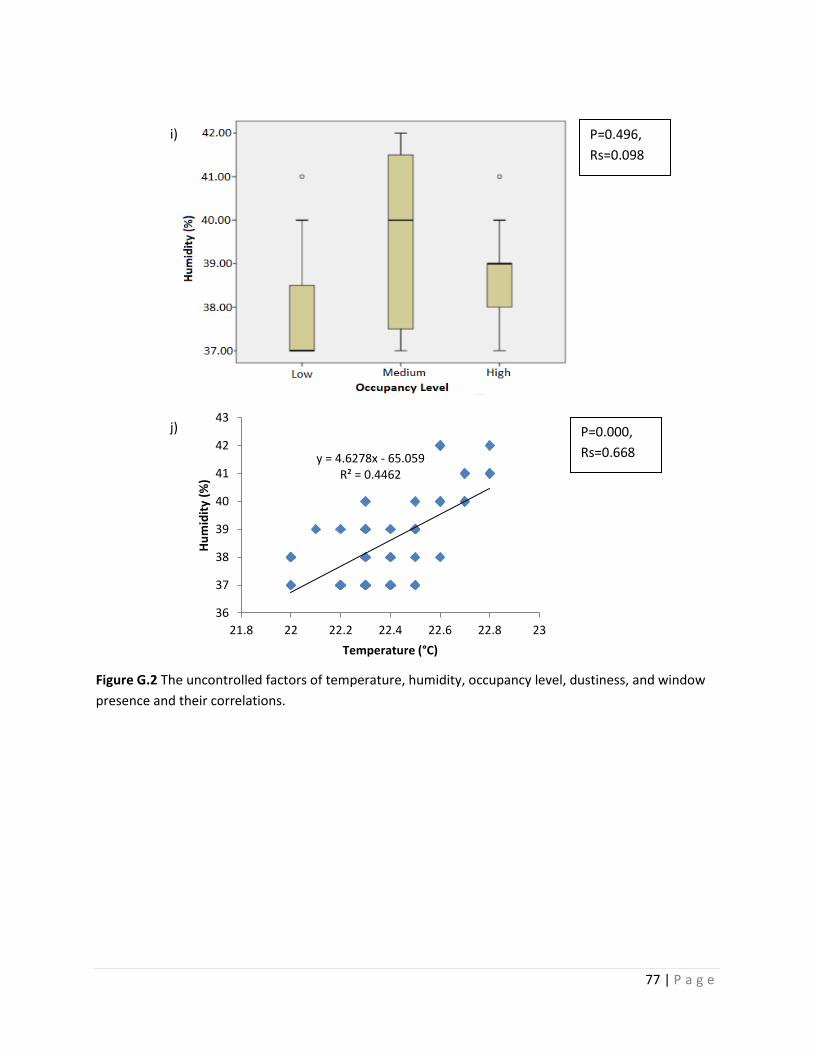
77 | P a g e
Figure G.2 The uncontrolled factors of temperature, humidity, occupancy level, dustiness, and window
presence and their correlations.
P=0.496,
Rs=0.098
y = 4.6278x - 65.059R² = 0.4462
36
37
38
39
40
41
42
43
21.8 22 22.2 22.4 22.6 22.8 23
Hu
mid
ity
(%)
Temperature (°C)
P=0.000,
Rs=0.668
i)
j)
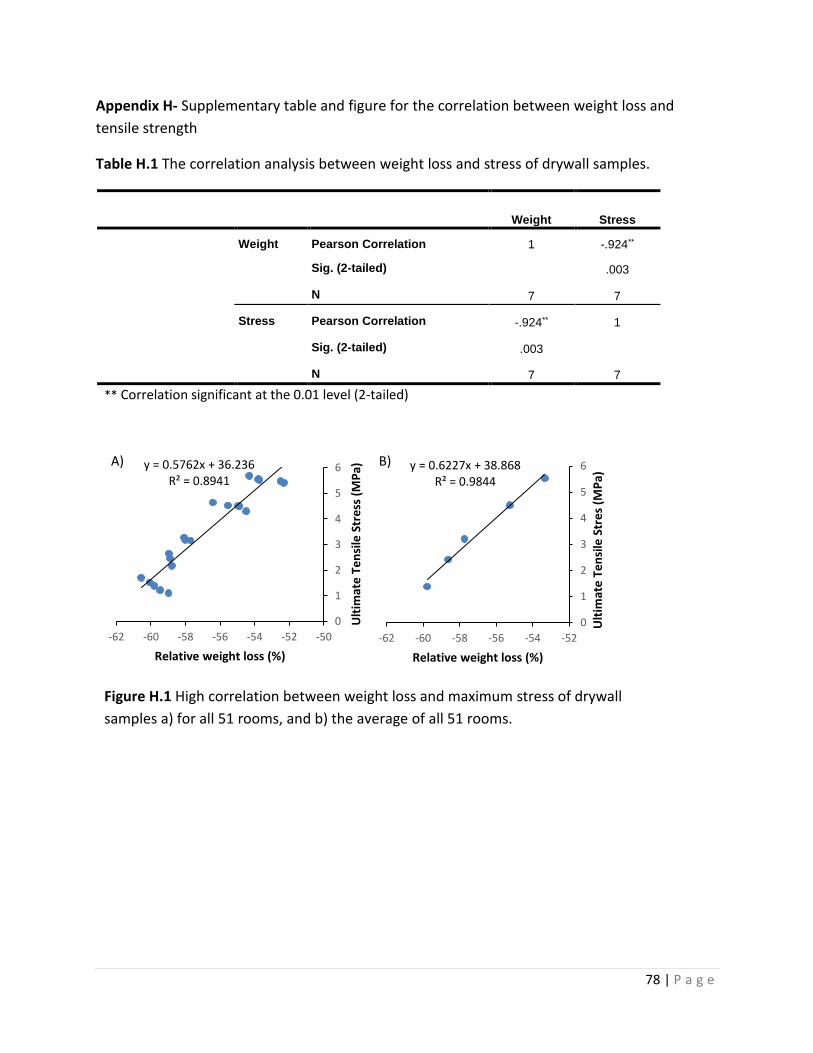
78 | P a g e
Appendix H- Supplementary table and figure for the correlation between weight loss and
tensile strength
Table H.1 The correlation analysis between weight loss and stress of drywall samples.
Weight Stress
Weight Pearson Correlation 1 -.924**
Sig. (2-tailed) .003
N 7 7
Stress Pearson Correlation -.924** 1
Sig. (2-tailed) .003
N 7 7
** Correlation significant at the 0.01 level (2-tailed)
Figure H.1 High correlation between weight loss and maximum stress of drywall
samples a) for all 51 rooms, and b) the average of all 51 rooms.
y = 0.5762x + 36.236R² = 0.8941
0
1
2
3
4
5
6
-62 -60 -58 -56 -54 -52 -50
Ult
imat
e T
en
sile
Str
ess
(M
Pa)
Relative weight loss (%)
y = 0.6227x + 38.868R² = 0.9844
0
1
2
3
4
5
6
-62 -60 -58 -56 -54 -52
Ult
imat
e T
en
sile
Str
es
(MP
a)
Relative weight loss (%)
A) B)
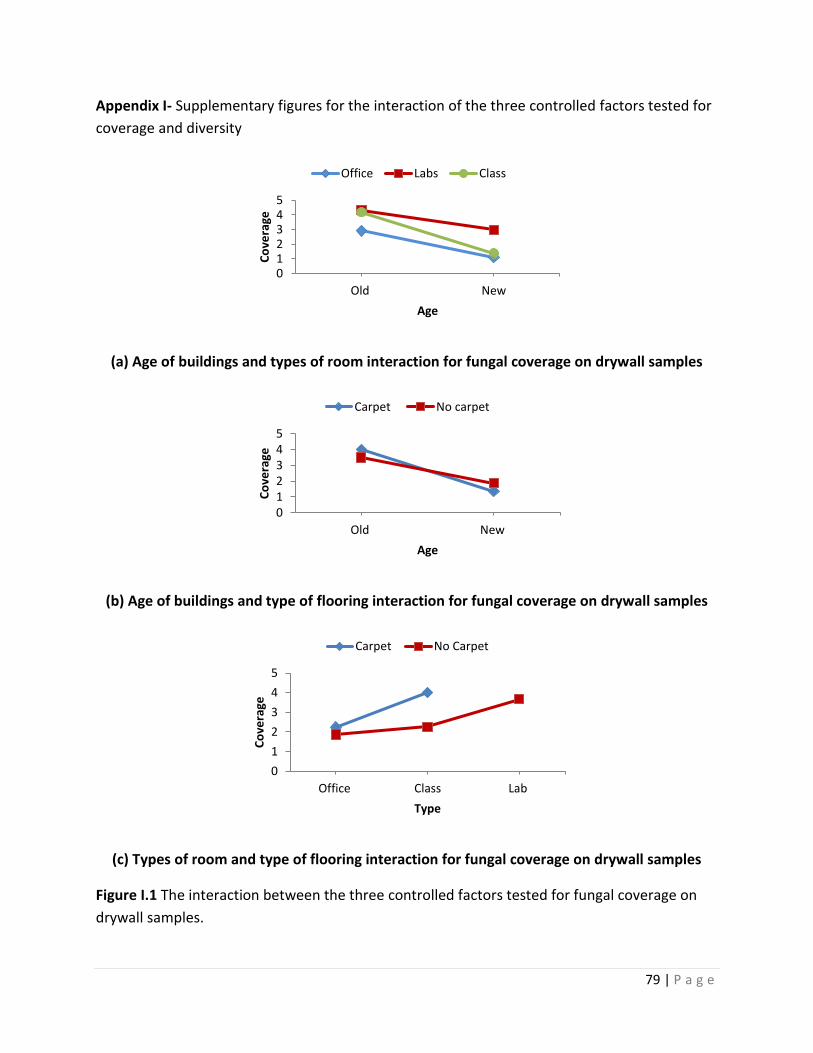
79 | P a g e
Appendix I- Supplementary figures for the interaction of the three controlled factors tested for
coverage and diversity
(a) Age of buildings and types of room interaction for fungal coverage on drywall samples
(b) Age of buildings and type of flooring interaction for fungal coverage on drywall samples
(c) Types of room and type of flooring interaction for fungal coverage on drywall samples
Figure I.1 The interaction between the three controlled factors tested for fungal coverage on
drywall samples.
012345
Old New
Co
vera
ge
Age
Office Labs Class
012345
Old New
Co
vera
ge
Age
Carpet No carpet
0
1
2
3
4
5
Office Class Lab
Co
vera
ge
Type
Carpet No Carpet
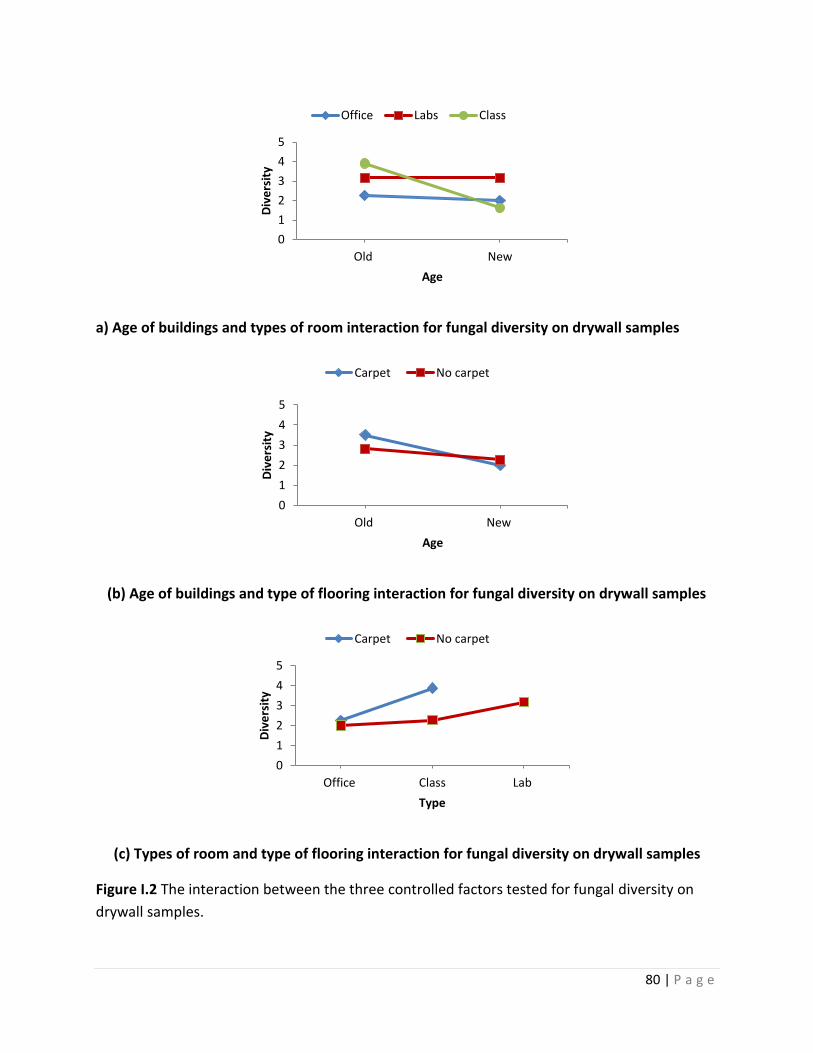
80 | P a g e
a) Age of buildings and types of room interaction for fungal diversity on drywall samples
(b) Age of buildings and type of flooring interaction for fungal diversity on drywall samples
(c) Types of room and type of flooring interaction for fungal diversity on drywall samples
Figure I.2 The interaction between the three controlled factors tested for fungal diversity on
drywall samples.
0
1
2
3
4
5
Old NewD
ive
rsit
yAge
Office Labs Class
0
1
2
3
4
5
Old New
Div
ers
ity
Age
Carpet No carpet
0
1
2
3
4
5
Office Class Lab
Div
ers
ity
Type
Carpet No carpet


![Factors influencing[1]](https://img.pdfslide.net/doc/110x75/54be1c8d4a795948378b4597/factors-influencing1.jpg)