Embed Size (px)
Citation preview
Turkish J Eng Env Sci
(2013) 37: 272 – 285
c⃝ TUBITAK
doi:10.3906/muh-1310-8
Turkish Journal of Engineering & Environmental Sciences
http :// journa l s . tub i tak .gov . t r/eng ineer ing/
Research Article
Environmental impact of dyeing and printing industry of Sanganer, Rajasthan
(India)
Ikbal HUSAIN1, Jakir HUSAIN2, Mohammed ARIF3,∗
1Public Health Engineering Department Laboratory, Bhilwara, Rajasthan, India2National River Water Quality Laboratory, Central Water Commission, New Delhi, India3Department of Chemistry, Banasthali University, Niwai, District Tonk, Rajasthan, India
Received: 20.10.2013 • Accepted: 08.01.2014 • Published Online: 03.02.2014 • Printed: 28.02.2014
Abstract:Wastewater and groundwater samples of Sanganer were studied to find out the pollution load of wastewater
generated from dyeing and printing units and its impact on the quality of domestic wastewater of the Amanishah Nallah
and groundwater. The wastewater of these units was found to have high concentrations of sodium, chloride, and sulfate.
It has remarkable concentrations of copper, chromium, and iron with low chemical oxygen demand and nearly 7-fold
biochemical oxygen demand. The wastewater of these units, discharged on land without any treatment, comes into
the Amanishah Nallah through small watercourses. The quality of the domestic wastewater of Nallah deteriorates with
the mixing of wastewater from these units. Maximum concentrations of physicochemical parameters were found at the
Sanganer Road bridge sampling point. Eleven groundwater samples, collected from various locations of Sanganer, were
found polluted due to percolation of wastewater into the ground. Copper and chromium were recorded from some
groundwater sources while iron was recorded from almost all sources. Sodium and chloride are the major cation and
anion in the groundwater, which is identical to the wastewater of dyeing and printing units. Source G5 , near the small
watercourse carrying the wastewater of these units, had maximum impact and maximum values of physicochemical
parameters.
Key words: Dyeing and printing industry, wastewater, groundwater pollution, heavy metals, drinking water quality,
irrigation quality
1. Introduction
Since the beginning of human civilization, cloth has been among the 3 basic needs of mankind (i.e. food, clothing,
and shelter). Natural products like cotton, silk, wool, and jute are reported to be used for manufacturing of
cloth. Due to high consumer demand, presently synthetic fibers like nylon, rayon, polyester, and acrylic are
being used to fulfill requirements for natural fibers. Color has always been a special necessity and so, in every
civilization from remote ages to the present day, the art of dyeing has played an important role in adding
beauty to the world. At present, approximately 15% of total world production of colorants is lost daily during
their synthesis and use for coloring fabrics, which corresponds to almost 128 t/day around the world [1]. The
production of printed textiles in India dates back to the fourth century BC [2]. Today the textile industry is
the single largest organized sector in the country, earning one-third of total national export profits [3–7].
Sanganer, near Jaipur (Rajasthan, India), is famous for its traditional dyeing and printing of cloth used
∗Correspondence: [email protected]
272
HUSAIN et al./Turkish J Eng Env Sci
for a variety of purposes. The world-famous art of cloth printing began developing in Sanganer during the 18th
century and attained its peak in the 19th century due to the Cheepas, a particular caste who mastered this art
from infancy. The natural dyes that were used in the early period have now been replaced by synthetic dyes.
Dyeing and printing industrial wastes disposed both in liquid and solid forms in land and water bodies
percolate into the groundwater and get transported in the direction of the groundwater flow. The rate of
percolation and transportation of pollutants in the groundwater flow increases in arid and semiarid conditions
due to high permeability of soil. As a result, different pollutants reach the groundwater system and pose a
threat to groundwater quality, which ultimately affects the socioeconomic life of the people who depend on
the groundwater for various purposes [8–14]. As per an unpublished survey conducted by the Rajasthan State
Pollution Control Board, in Jaipur 75% of total wastewater from dyeing and printing units is directly drained
into the Amanishah Nallah, while the remaining 25% accumulates in the surrounding areas of the printing and
dyeing units and along roadsides, forming pools and puddles. The accumulation of wastewater in the pools
adversely affects the groundwater of the area on account of the high porosity of the sandy soil of Sanganer.
This study was carried out to characterize the wastewater and to learn its impact on groundwater.
1.1. Dyeing and printing process in Sanganer
In Sanganer, 3-step dyeing and printing is carried out, which involves bleaching, dyeing, and printing processes.
Bleaching removes natural coloring materials from the gray cloth and makes it suitable for dyeing and printing.
In the process, cloth is first dipped in turkey oil (caustic soda slurry) to remove starch and is then passed
through a solution of bleaching powder followed by a washing. This process makes the cloth alkaline; the cloth
is then heated with dilute acid and sodium sulfate. After heating, the cloth is washed with detergent and
whitening agent and dried in the open air. Before dyeing, the cloth is wound on a roller and passed through
a tray of color dye solutions. The process is repeated several times and chemicals are added to fix the color.
After dyeing, the cloth is again washed.
In Sanganer, 2 basic types of printing process are in use: block printing and screen printing. Block
printing is traditional printing in which wood blocks are dipped in color and impressions are made on the
cloth. In screen printing, designs are prepared on a screen using a solution of polyvinyl alcohol and potassium
dichromate. The cloth that is to be printed is fixed, and the screen is placed on it carefully and lifted again
and again until the printing is completed. After printing, the process of color fixing starts. At present, the 3
commonly used dye-fixing processes in Sanganer are as follows:
1. Diazotization process: The indigo and rapid dyes used for dyeing and printing are fixed by keeping
the cloths in a dilute solution of either sulfuric acid or hydrochloric acid and sodium nitrite for 20 min,
commonly by continuous passing. The acid most commonly used in Sanganer is sulfuric acid, on account
of its low cost. The cloth is then washed 3 times with fresh water in separate tanks to remove chemicals
and avoid bleeding of dyes.
2. Silicate process: The reactive dyes used in dyeing are fixed by soaking the cloth in a solution of sodium
silicate for about 12 h. The cloth is then washed 3 times, similar to the diazotization process.
3. Patri Process: The Patri process is basically used for black aniline dyeing and printing. It is commonly
used in combination with the diazotization process. The cloth is washed in water containing sodium
bicarbonate and then in plain water.
273
HUSAIN et al./Turkish J Eng Env Sci
2. Materials and methods
Wastewater and groundwater samples were collected in precleaned 5-L and 1-L polypropylene containers for
chemical and heavy metal analysis, respectively. The heavy metal sample was acidified with ultrapure HNO3 .
The necessary precautions were adopted during sampling [15]. All physicochemical parameters were analyzed in
the laboratory by standard methods. The heavy metals were estimated by atomic absorption spectrophotometer
using standard methods [16].
3. Results and discussion
3.1. Characteristics of wastewater in Sanganer
For the characterization of wastewater of dyeing and printing units, 11 wastewater samples from different sites
were collected and analyzed for physicochemical parameters. The physicochemical results of the wastewater are
shown in Table 1.
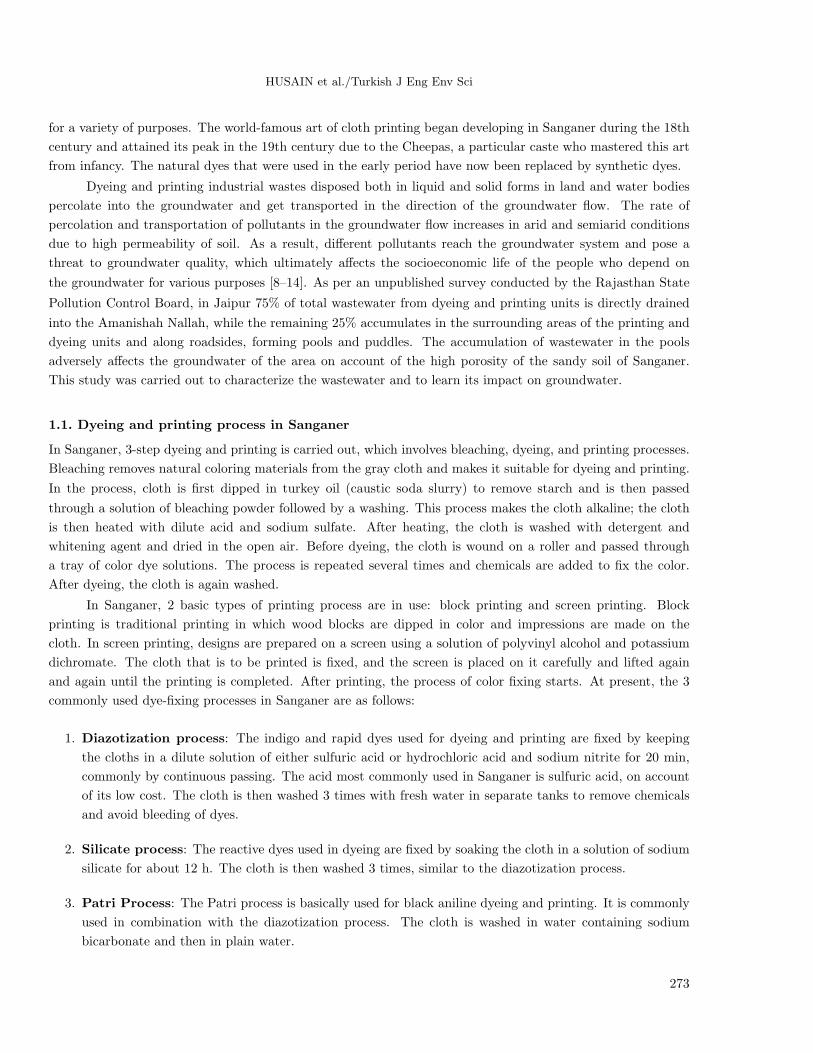
Table 1. Physicochemical results of wastewater.
Parameter Site 1 Site 2 Site 3 Site 4 Site 5 Site 6 Site 7 Site 8 Site 9 Site 10 Site 11
pH 7.2 7.1 7.1 6.9 7.0 6.8 7.2 7.0 7.3 7.1 7.1Electricalconductivity 2590 2670 2860 2530 3660 2220 2490 2760 2850 3250 3560(µmho/cm)TDS 1554 1665 1742 1489 2217 1386 1525 1663 1742 2008 2147Total hardness 350 360 390 340 500 300 330 350 370 500 510Bicarbonate 212 256 240 210 341 272 409 312 358 541 320Chloride 500 550 570 460 700 430 480 550 590 680 720Sulfate 190 200 220 180 290 150 130 170 160 200 260Nitrate 62 45 56 58 90 24 53 64 58 86 102Fluoride 0.7 0.5 0.6 0.8 1.2 1.3 0.6 0.5 0.9 1.0 0.6Calcium 60 56 64 76 80 64 60 48 72 80 104Magnesium 48 53 55 36 72 34 43 55 46 72 60Sodium 440 480 500 420 600 330 310 420 410 280 480Potassium 11 15 9 13 32 18 22 13 22 15 46Copper 0.45 0.28 0.15 0.32 0.24 1.08 0.32 0.68 0.31 0.34 0.24Chromium 0.13 0.09 0.06 0.08 0.16 0.08 0.04 0.06 0.07 0.03 0.02Iron 0.96 1.66 1.34 0.89 2.75 1.07 0.76 1.15 0.68 1.23 1.34BOD 25.3 26.9 35.1 26.3 32.5 31.2 28.6 22.4 21.7 32.7 26.9COD 150.8 190.3 181.6 203.1 345.1 156.2 147.8 120.6 253.8 212.0 147.5All parameter excepts pH and EC are in mg/L.
The pH of the wastewater was found close to natural levels, ranging from 6.8 to 7.3. The pH of wastewater
from 3 units was below 7.0, while 2 units had 7.0 pH values and the remaining had pH levels above 7.0. Although
sulfuric and hydrochloric acid are used in the color-fixing diazotization process, the use of other salt and caustic
slurry in other steps gives it a neutral nature.
The electrical conductance (EC) of the wastewater was between 2220 and 3660 µmho/cm. The high
conductance indicates high contents of ions in the wastewater, which was confirmed by the high total dissolved
solids (TDS). TDS of the wastewater was found in the range of 1386 to 2217 mg/L.
The hardness of the wastewater was between 300 mg/L and 510 mg/L. Most of the hardness was due
to the hardness of the initial fresh water used in the process. Maximums of 700 mg/L chloride and 290 mg/L
274

HUSAIN et al./Turkish J Eng Env Sci
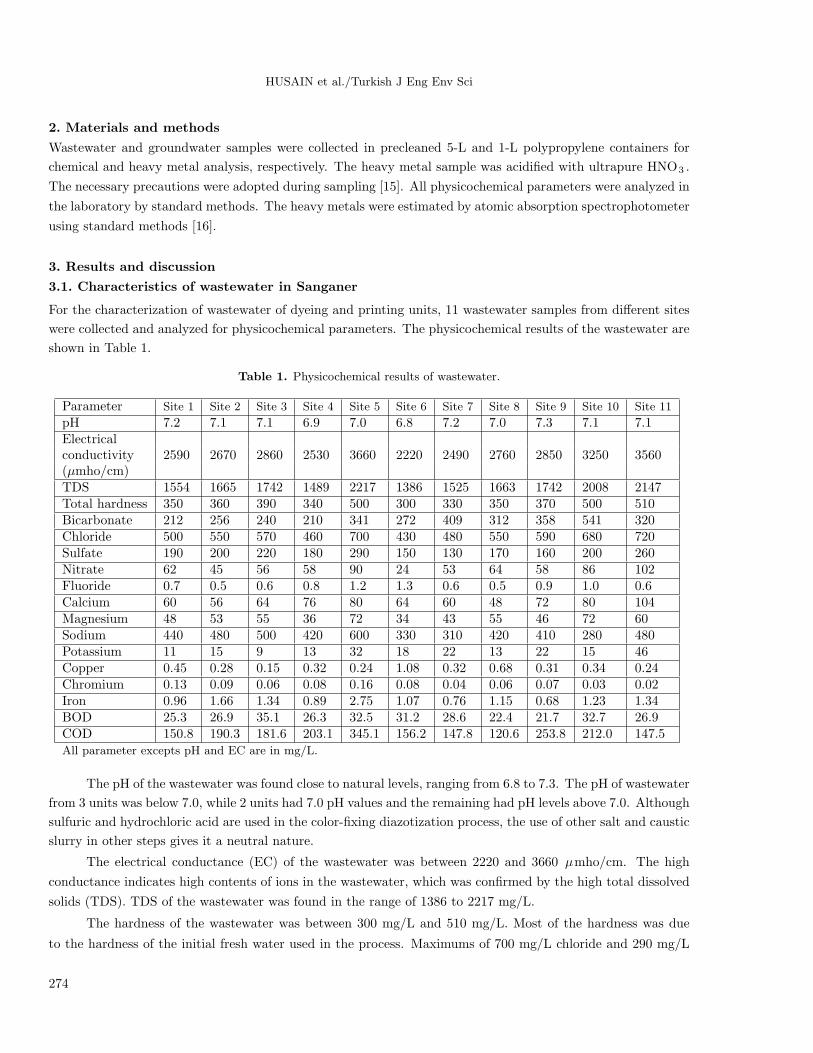
sulfate was recorded in the area. From Figure 1 and 2, it is clear that these are the major anions. The higher
concentrations of these ions are due to the salts used in the process. The concentration of nitrate (minimum 24
mg/L and maximum 102 mg/L) was comparatively low.
Cation curve
Anion curve Heavy metal
curve
HCO3
SO3
NO3
Figure 1. Composition of textile industrial effluent. Figure 2. Ionic composition of textile effluent (individual
ions).
Sodium was recorded to be the major cation as it is extensively used in the process (Figure 1). It was
found between 280 and 600 mg/L. Sodium dominates in dyeing and printing industrial effluent. Calcium and
magnesium ions are precipitated as carbonates and bicarbonates and sodium chloride, being highly soluble,
becomes the major component in the effluent [17]. From Figure 2 it is clear that in the heavy metal iron
and copper concentrations are higher. The concentration of iron ranged from 0.68 to 2.75 mg/L while the
concentration of copper ranged from 0.15 to 1.08 mg/L. The chemical oxygen demand (COD) of the wastewater
was higher than the biochemical oxygen demand (BOD). The average COD and BOD were 192 and 28 mg/L,
respectively. Having a higher COD than BOD indicates that the wastewater is richer in chemical pollutants
than biological pollutants. This wastewater can cause serious environmental problems due to its color, large
amount of suspended solids, and high COD [18].
From the above discussion, it is clear that the physicochemical characteristics of the wastewater from
various units fluctuate very much. The characteristics were found to depend primarily on the kind of process used
and the kind of discharge released from washing tanks. The wastewaters from various processes have different
concentrations of pollutants; the concentration of pollutants is maximum in the first wash and decreases in the
subsequent washes, as a result of which there is a decrease in concentration of pollutants in wastewater.
3.2. Impact of wastewater on Amanishah Nallah
For the study of the impact of wastewater of dyeing and printing units on the Amanishah Nallah body of water,
samples were collected from 3 points:
1. Upstream of the polluted zone: Sample from the Ajmer Road Bridge on the Amanishah Nallah was
collected.
275
HUSAIN et al./Turkish J Eng Env Sci
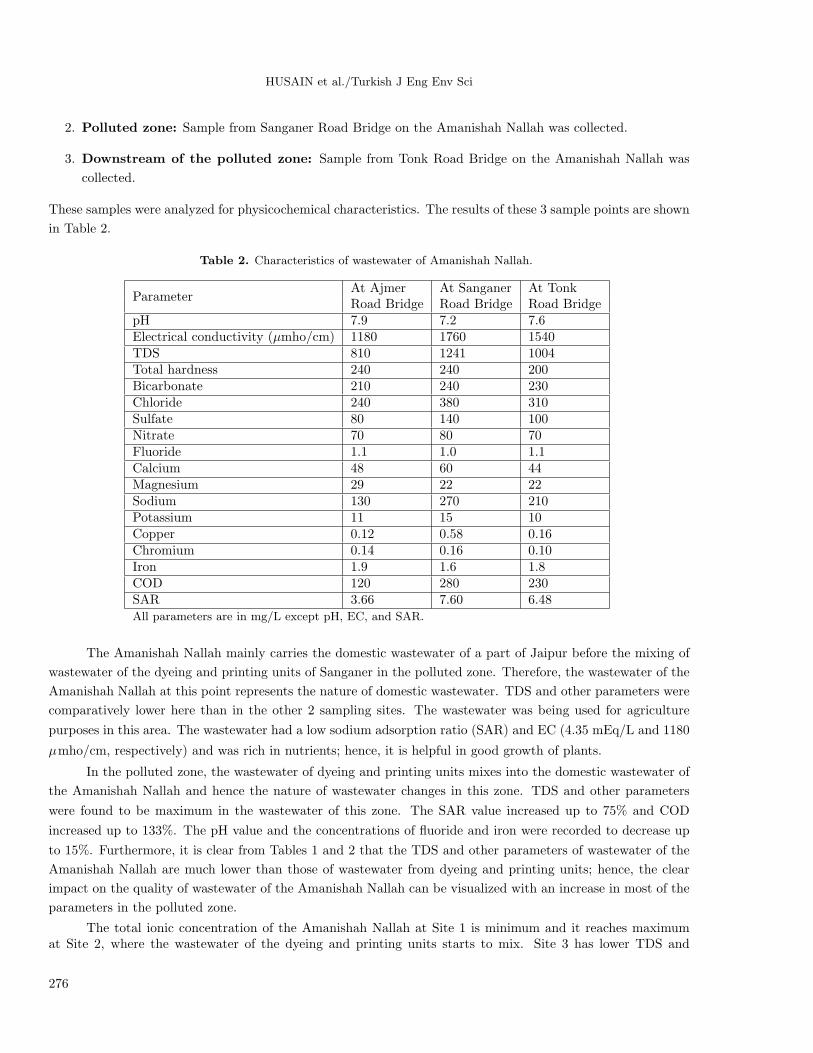
2. Polluted zone: Sample from Sanganer Road Bridge on the Amanishah Nallah was collected.
3. Downstream of the polluted zone: Sample from Tonk Road Bridge on the Amanishah Nallah was
collected.
These samples were analyzed for physicochemical characteristics. The results of these 3 sample points are shown
in Table 2.
Table 2. Characteristics of wastewater of Amanishah Nallah.
ParameterAt Ajmer At Sanganer At TonkRoad Bridge Road Bridge Road Bridge
pH 7.9 7.2 7.6Electrical conductivity (µmho/cm) 1180 1760 1540TDS 810 1241 1004Total hardness 240 240 200Bicarbonate 210 240 230Chloride 240 380 310Sulfate 80 140 100Nitrate 70 80 70Fluoride 1.1 1.0 1.1Calcium 48 60 44Magnesium 29 22 22Sodium 130 270 210Potassium 11 15 10Copper 0.12 0.58 0.16Chromium 0.14 0.16 0.10Iron 1.9 1.6 1.8COD 120 280 230SAR 3.66 7.60 6.48All parameters are in mg/L except pH, EC, and SAR.
The Amanishah Nallah mainly carries the domestic wastewater of a part of Jaipur before the mixing of
wastewater of the dyeing and printing units of Sanganer in the polluted zone. Therefore, the wastewater of the
Amanishah Nallah at this point represents the nature of domestic wastewater. TDS and other parameters were
comparatively lower here than in the other 2 sampling sites. The wastewater was being used for agriculture
purposes in this area. The wastewater had a low sodium adsorption ratio (SAR) and EC (4.35 mEq/L and 1180
µmho/cm, respectively) and was rich in nutrients; hence, it is helpful in good growth of plants.
In the polluted zone, the wastewater of dyeing and printing units mixes into the domestic wastewater of
the Amanishah Nallah and hence the nature of wastewater changes in this zone. TDS and other parameters
were found to be maximum in the wastewater of this zone. The SAR value increased up to 75% and COD
increased up to 133%. The pH value and the concentrations of fluoride and iron were recorded to decrease up
to 15%. Furthermore, it is clear from Tables 1 and 2 that the TDS and other parameters of wastewater of the
Amanishah Nallah are much lower than those of wastewater from dyeing and printing units; hence, the clear
impact on the quality of wastewater of the Amanishah Nallah can be visualized with an increase in most of the
parameters in the polluted zone.
The total ionic concentration of the Amanishah Nallah at Site 1 is minimum and it reaches maximumat Site 2, where the wastewater of the dyeing and printing units starts to mix. Site 3 has lower TDS and
276
HUSAIN et al./Turkish J Eng Env Sci
other parameters than Site 2, but higher than Site 1. This is due to dilution by the mixing of the domestic
wastewater of Sanganer and seepage occurring thereon. The concentration of sulfate, chloride, calcium, and
sodium increases in the wastewater at Site 2. Here the concentration of heavy metal also increases and reaches
the maximum value. After this, the concentration of almost all parameters starts to decrease. A very large
decrease in heavy metal concentration is seen at Site 2. The concentration of heavy metals decreased due
to their accumulation in soil and absorption by crop plants cultivated in the area. Khan et al. reported an
increase in the heavy metal contents in the soil and crop plants at Sanganer [4]. Srivastava and Prakash also
found increases in levels of heavy metal contents in a wheat crop after its irrigation by textile effluent [19].
3.3. Impact of wastewater on the groundwater
For the study of the impact of wastewater of dyeing and printing units on groundwater, 11 sources situated at
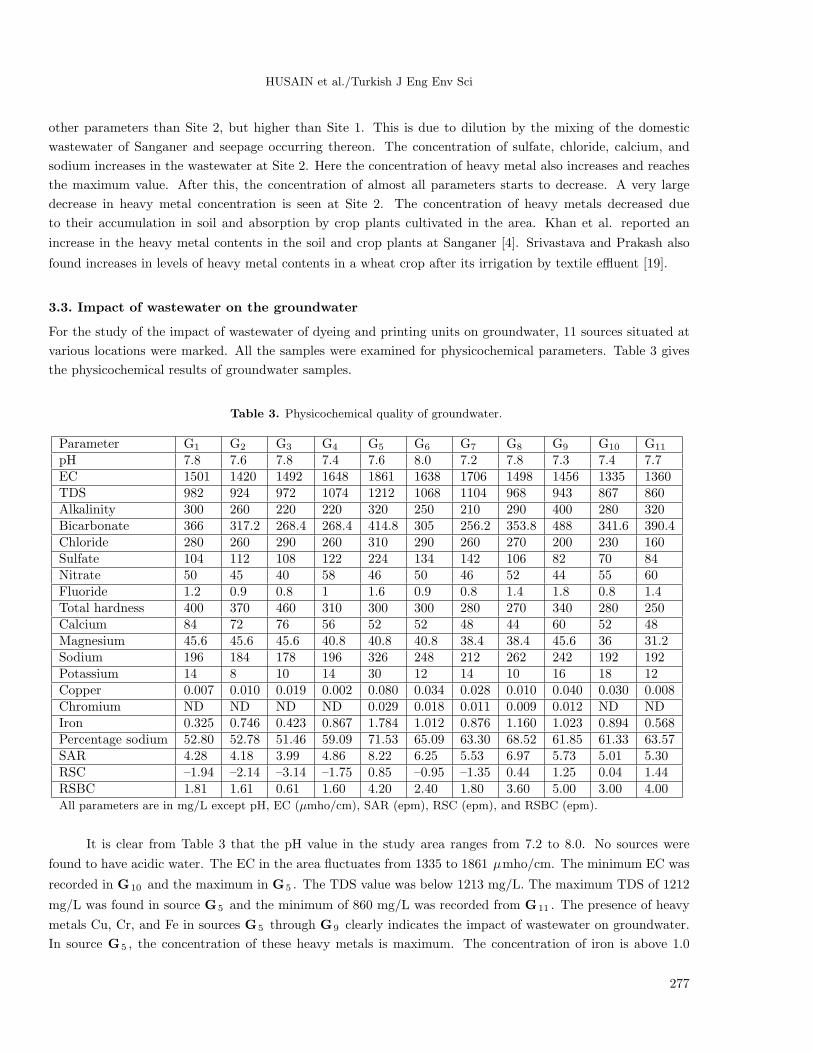
various locations were marked. All the samples were examined for physicochemical parameters. Table 3 gives
the physicochemical results of groundwater samples.
Table 3. Physicochemical quality of groundwater.
Parameter G1 G2 G3 G4 G5 G6 G7 G8 G9 G10 G11
pH 7.8 7.6 7.8 7.4 7.6 8.0 7.2 7.8 7.3 7.4 7.7EC 1501 1420 1492 1648 1861 1638 1706 1498 1456 1335 1360TDS 982 924 972 1074 1212 1068 1104 968 943 867 860Alkalinity 300 260 220 220 320 250 210 290 400 280 320Bicarbonate 366 317.2 268.4 268.4 414.8 305 256.2 353.8 488 341.6 390.4Chloride 280 260 290 260 310 290 260 270 200 230 160Sulfate 104 112 108 122 224 134 142 106 82 70 84Nitrate 50 45 40 58 46 50 46 52 44 55 60Fluoride 1.2 0.9 0.8 1 1.6 0.9 0.8 1.4 1.8 0.8 1.4Total hardness 400 370 460 310 300 300 280 270 340 280 250Calcium 84 72 76 56 52 52 48 44 60 52 48Magnesium 45.6 45.6 45.6 40.8 40.8 40.8 38.4 38.4 45.6 36 31.2Sodium 196 184 178 196 326 248 212 262 242 192 192Potassium 14 8 10 14 30 12 14 10 16 18 12Copper 0.007 0.010 0.019 0.002 0.080 0.034 0.028 0.010 0.040 0.030 0.008Chromium ND ND ND ND 0.029 0.018 0.011 0.009 0.012 ND NDIron 0.325 0.746 0.423 0.867 1.784 1.012 0.876 1.160 1.023 0.894 0.568Percentage sodium 52.80 52.78 51.46 59.09 71.53 65.09 63.30 68.52 61.85 61.33 63.57SAR 4.28 4.18 3.99 4.86 8.22 6.25 5.53 6.97 5.73 5.01 5.30RSC –1.94 –2.14 –3.14 –1.75 0.85 –0.95 –1.35 0.44 1.25 0.04 1.44RSBC 1.81 1.61 0.61 1.60 4.20 2.40 1.80 3.60 5.00 3.00 4.00All parameters are in mg/L except pH, EC (µmho/cm), SAR (epm), RSC (epm), and RSBC (epm).
It is clear from Table 3 that the pH value in the study area ranges from 7.2 to 8.0. No sources were
found to have acidic water. The EC in the area fluctuates from 1335 to 1861 µmho/cm. The minimum EC was
recorded in G10 and the maximum in G5 . The TDS value was below 1213 mg/L. The maximum TDS of 1212
mg/L was found in source G5 and the minimum of 860 mg/L was recorded from G11 . The presence of heavy
metals Cu, Cr, and Fe in sources G5 through G9 clearly indicates the impact of wastewater on groundwater.
In source G5 , the concentration of these heavy metals is maximum. The concentration of iron is above 1.0
277

HUSAIN et al./Turkish J Eng Env Sci
mg/L at 4 sources (G5 , G6 , G8 , and G9). In these 5 sources (G5 to G9) the sodium concentration was also
above 200 mg/L, while the sulfate concentration in only G5 was recorded above 200 mg/L.
From the total ionic concentration graph (Figure 3), it is clear that the total ionic concentration is nearly
constant in the first 4 sources (G1 to G4). These sources are situated along the Amanishah Nallah before the
Sanganer Road Bridge. In G5 it is maximum and in G6 it decreases. Source G5 is situated near a small
watercourse that carries the wastewater of the dyeing and printing units and hence has maximum impact. The
total ionic concentration from G6 to G9 again remains nearly constant, and after G9 it again decreases and
becomes nearly constant onward. Sources G6 to G9 are situated between the Sanganer Road Bridge and the
Tonk Road Bridge. In this area, the wastewater of dyeing and printing units and the domestic wastewater mixes
and the concentrations of most physicochemical parameters decrease; hence, these source have less impact from
the dyeing and printing unit wastewater than does G5 , which is in direct contact with pure dyeing and printing
unit wastewater. The percentage of sodium in all sources is above 50%. In 7 sources, G5 to G11 , it is above
60%, which indicates the impact of the wastewater, which is rich in sodium concentration, on the groundwater.
15
10
25
20
G1 G2 G3 G4
Groundwater source
G11G5 G6 G10G9G7 G8
Co
nce
ntr
atio
n i
n e
pm
5
0
HCO3
SO3
NO3
Figure 3. Ionic composition of groundwater of study area.
3.4. Suitability of groundwater for drinking purposes
Various standards are being used to find the suitability of groundwater for drinking purposes. Limits for safe
drinking water are different as the limits depend on environmental conditions because water consumption per
day is directly related to them. Hence, Indian Standard IS: 10500 is used for comparing the results. The Bureau
of Indian Standards purposed 2 limits for drinking purposes, maximum desirable limit and maximum permissible
limit, in their standards [20]. The maximum desirable limit is best for the consumer, but in the absence of such
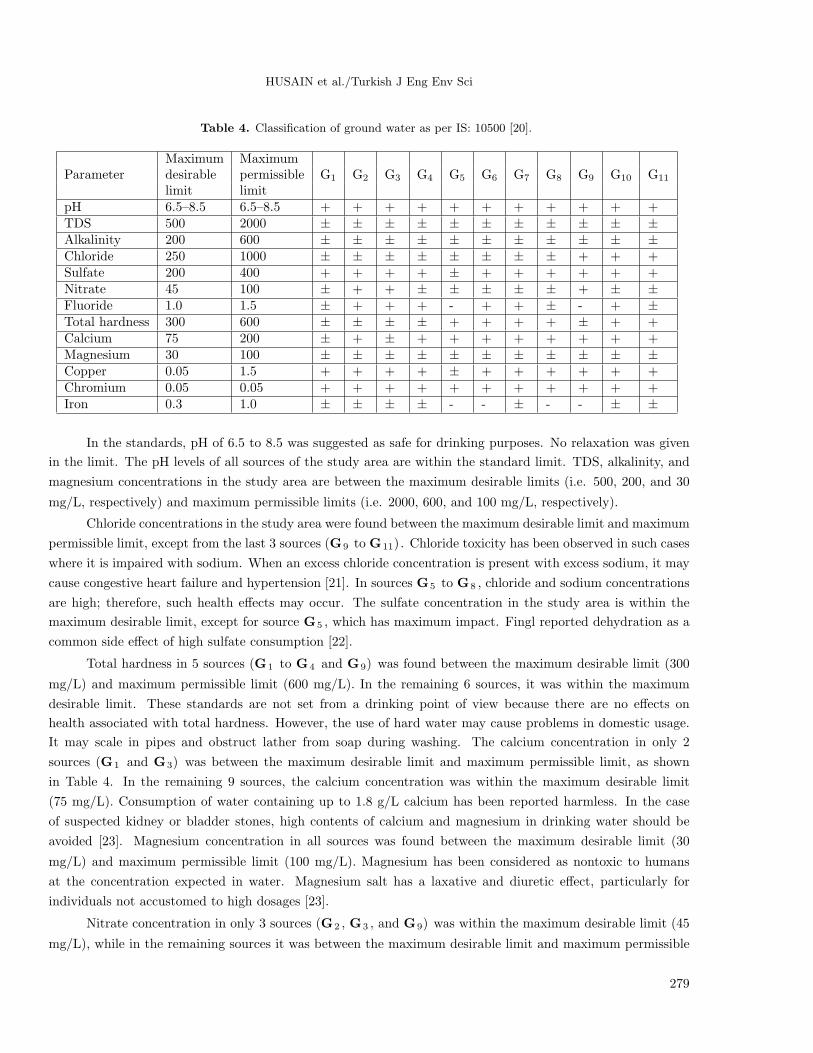
a source of water, the maximum permissible limit may be used. Table 4 presents the classification based on
IS: 10500 (1991). In the classification +, ± , and – symbols are used to classify the groundwater. The + sign
shows that results are within the maximum desirable limit and the ± sign shows that results are between the
maximum desirable and maximum permissible limits. The – sign is used to represent results that are outside
of the maximum permissible limit. Details of the parameter qualities of the zone are discussed below.
278
HUSAIN et al./Turkish J Eng Env Sci
Table 4. Classification of ground water as per IS: 10500 [20].
Maximum MaximumParameter desirable permissible G1 G2 G3 G4 G5 G6 G7 G8 G9 G10 G11
limit limitpH 6.5–8.5 6.5–8.5 + + + + + + + + + + +TDS 500 2000 ± ± ± ± ± ± ± ± ± ± ±Alkalinity 200 600 ± ± ± ± ± ± ± ± ± ± ±Chloride 250 1000 ± ± ± ± ± ± ± ± + + +Sulfate 200 400 + + + + ± + + + + + +Nitrate 45 100 ± + + ± ± ± ± ± + ± ±Fluoride 1.0 1.5 ± + + + - + + ± - + ±Total hardness 300 600 ± ± ± ± + + + + ± + +Calcium 75 200 ± + ± + + + + + + + +Magnesium 30 100 ± ± ± ± ± ± ± ± ± ± ±Copper 0.05 1.5 + + + + ± + + + + + +Chromium 0.05 0.05 + + + + + + + + + + +Iron 0.3 1.0 ± ± ± ± - - ± - - ± ±
In the standards, pH of 6.5 to 8.5 was suggested as safe for drinking purposes. No relaxation was given
in the limit. The pH levels of all sources of the study area are within the standard limit. TDS, alkalinity, and
magnesium concentrations in the study area are between the maximum desirable limits (i.e. 500, 200, and 30
mg/L, respectively) and maximum permissible limits (i.e. 2000, 600, and 100 mg/L, respectively).
Chloride concentrations in the study area were found between the maximum desirable limit and maximum
permissible limit, except from the last 3 sources (G9 to G11). Chloride toxicity has been observed in such cases
where it is impaired with sodium. When an excess chloride concentration is present with excess sodium, it may
cause congestive heart failure and hypertension [21]. In sources G5 to G8 , chloride and sodium concentrations
are high; therefore, such health effects may occur. The sulfate concentration in the study area is within the
maximum desirable limit, except for source G5 , which has maximum impact. Fingl reported dehydration as a
common side effect of high sulfate consumption [22].
Total hardness in 5 sources (G1 to G4 and G9) was found between the maximum desirable limit (300
mg/L) and maximum permissible limit (600 mg/L). In the remaining 6 sources, it was within the maximum
desirable limit. These standards are not set from a drinking point of view because there are no effects on
health associated with total hardness. However, the use of hard water may cause problems in domestic usage.
It may scale in pipes and obstruct lather from soap during washing. The calcium concentration in only 2
sources (G1 and G3) was between the maximum desirable limit and maximum permissible limit, as shown
in Table 4. In the remaining 9 sources, the calcium concentration was within the maximum desirable limit
(75 mg/L). Consumption of water containing up to 1.8 g/L calcium has been reported harmless. In the case
of suspected kidney or bladder stones, high contents of calcium and magnesium in drinking water should be
avoided [23]. Magnesium concentration in all sources was found between the maximum desirable limit (30
mg/L) and maximum permissible limit (100 mg/L). Magnesium has been considered as nontoxic to humans
at the concentration expected in water. Magnesium salt has a laxative and diuretic effect, particularly for
individuals not accustomed to high dosages [23].
Nitrate concentration in only 3 sources (G2 , G3 , and G9) was within the maximum desirable limit (45
mg/L), while in the remaining sources it was between the maximum desirable limit and maximum permissible
279

HUSAIN et al./Turkish J Eng Env Sci
limit (100 mg/L). Nitrate itself does not show toxic effects, but in human body, when it is reduced to nitrite,
it creates various serious unhealthy effects. Nitrate has been found to react with nitro-stable compounds
to form N-nitroso compounds. Most of these compounds have been found to be carcinogenic [24]. The US
National Research Council found an association between high nitrate intake and gastric and or esophageal
cancer. The major biological effect of nitrite in humans is its involvement in the oxidation of normal hemoglobin
to methemoglobin, which is unable to transport oxygen. When the concentration of methemoglobin reaches
10% of that of hemoglobin, the condition called methemoglobinemia or blue baby syndrome causes cyanosis
and, at higher concentrations, asphyxia [25,26].
Fluoride concentration in 6 sources (G2 to G4 , G6 , G7 , and G10) was within the maximum desirable
limit (1.0 mg/L), while in 3 sources (G1 , G8 , and G11) it is between the maximum desirable limit and
maximum permissible limit (1.5 mg/L). In 2 sources (G5 and G9) it is above the maximum permissible limit.
Intake of high fluoride water causes various types of fluorosis problems, from dental to skeleton [27,28]. The
type of fluorosis depends on fluoride concentration as well as on environmental conditions and consumers’ diets.
The long-term use of groundwater from sources G5 and G9 may cause dental fluorosis.
Iron concentration of 0.3 mg/L is proposed as the maximum desirable limit and 1.0 mg/L is proposed as
the maximum permissible limit by Indian standards for drinking water. In the study area, no source has an iron
concentration within the maximum desirable limit, while in 4 sources (G5 , G6 , G8 , and G9) its concentration
is above the maximum permissible limit. The remaining 7 sources have iron concentrations between these 2
limits, as shown in Table 4. Although 10 to 50 mg/day of iron is essential for humans, such concentrations in
water may cause problems in the domestic use of water. Iron above 0.3 mg/L may create a noticeable change
in taste, color, and turbidity. The use of water with high iron concentrate in laundry and sanitation may stain
cloths and utensils [23]. Meanwhile, a 0.05 mg/L concentration of copper is proposed as a maximum desirable
limit, while 1.5 mg/L is proposed as the maximum permissible limit in the absence of a more suitable source. In
the study area, only source G5 had copper concentrations between the maximum desirable limit and maximum
permissible limit. Prolonged use of such groundwater may cause Wilson disease [29]. Chromium was found in
5 sources, but its concentration was below the maximum desirable limit (0.05 mg/L)
3.5. Suitability of groundwater for irrigation purpose
To find the suitability of groundwater for irrigation purposes, various factors have been used. Most classifications
are based on EC, sodium, calcium, magnesium and bicarbonates. On the basis of these parameters, the
groundwater of the study area was classified as follows.
3.5.1. Sodium adsorption ratio
The sodium concentration is one of the major parameters of groundwater. Its concentration in irrigation water
affects the quality for irrigation purposes. A higher sodium concentration than that of calcium and magnesium
in water may clog the soil, reducing the soil permeability. Therefore, the effect caused by sodium is called the
sodium hazard. Considering the effects of sodium on soil, the US Salinity Laboratory introduced SAR based on
the concentrations of sodium, calcium, and magnesium [30]. The SAR is calculated by using following formula:
SAR =Na+√
(Ca2+ +Mg2+)/2
280
HUSAIN et al./Turkish J Eng Env Sci
On the basis of SAR values, irrigation water is classified into 4 sodium hazard classes: low (<10), medium
(10–18), high (18–26), and very high (>26). SAR values in the studied area are below 10 and therefore the
groundwater of the study area has a very low sodium hazard. The maximum SAR of the area was 8.22 from
source G5 .
3.5.2. Electrical conductance
The EC of water is due to the conductivity of dissolved ions. The presence of an excess of dissolved salts
in water has an effect on the soil quality as well as crop yield. As the EC is due to dissolved matter, the
effect created by EC is called the salinity hazard. A salinity problem occurs if the total quantity of salts in
the irrigation water is high enough to cause salt accumulation in the crop root zone to the extent that yields
are affected adversely. If an excessive quantity of soluble salts accumulates in the root zone, the plant will
experience extra difficulty in extracting enough water from the salty soil solution. This reduced water uptake
by the plant can result in slow or stunted growth and may also present with symptoms similar in appearance to
those of drought, such as early wilting. Therefore, the US Salinity Laboratory proposed a classification based
on EC values. They classified water into 4 classes, low (<750 µmho/cm), medium (750–2250 µmho/cm), high
(2250–5000 µmho/cm), and very high (>5000 µmho/cm) [30]. No source in the studied area had an EC below
750 µmho/cm. The groundwater of the area had EC values between 1335 µmho/cm and 1806 µmho/cm;
hence, all sources belong to the medium salinity hazard group. Such water can be used if a moderate amount
of leaching occurs.
3.5.3. Residual sodium carbonate
Eaton introduced the concept of residual sodium carbonate (RSC) [31]. He calculated the relation of excess
carbonate and bicarbonate concentration to calcium and magnesium concentration using following formula:
RSC=(CO2−3 +HCO−
3 )− (Ca2+ +Mg2+)
The excess carbonate and bicarbonate concentration tends to precipitate as CaCO3 , producing a white
layer of CaCO3 on the soil surface. Such a layer reduces the permeability of the soil, resulting in reduction in
the crop yield. According to this classification, irrigation water may be classified into 3 classes: safe (<1.25),
marginal (1.25–2.50), and unsafe (>2.50). In the study area, all 11 sources had RSCs below 1.25 and hence are
safe for irrigation purposes.
3.5.4. Residual sodium bicarbonate
Groundwater contains a very low or nil carbonate concentration and only precipitates with calcium only. Hence,
a new hypothesis based on only bicarbonate and sodium concentration was introduced, called residual sodium
bicarbonate (RSBC) [32]. It is calculated as excessive carbonate concentration to calcium concentration by
using following formula:
RSBC=HCO−3 − Ca+2
The RSBC values classify water into 3 classes: safe (<5.0), marginal (5.0–10), and unsafe (>10). In the
study area, no sources have RSBC values above 5.0, and hence all sources are safe for irrigation purpose.
281
HUSAIN et al./Turkish J Eng Env Sci
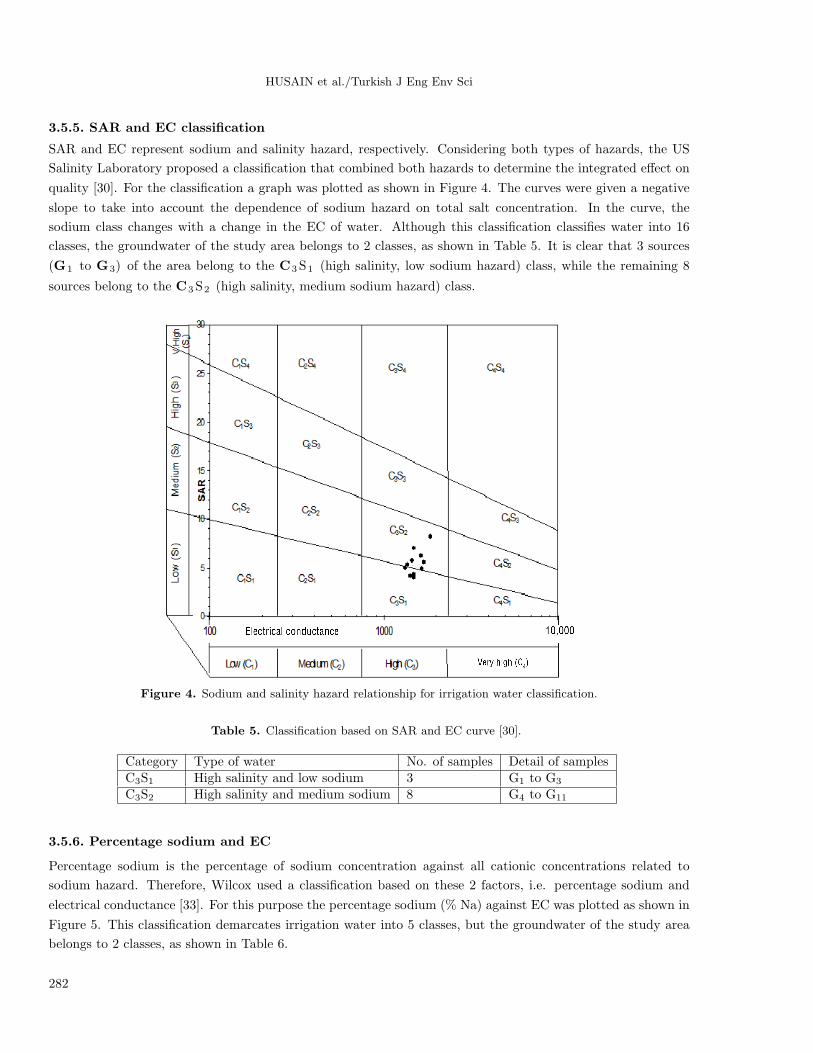
3.5.5. SAR and EC classification
SAR and EC represent sodium and salinity hazard, respectively. Considering both types of hazards, the US
Salinity Laboratory proposed a classification that combined both hazards to determine the integrated effect on
quality [30]. For the classification a graph was plotted as shown in Figure 4. The curves were given a negative
slope to take into account the dependence of sodium hazard on total salt concentration. In the curve, the
sodium class changes with a change in the EC of water. Although this classification classifies water into 16
classes, the groundwater of the study area belongs to 2 classes, as shown in Table 5. It is clear that 3 sources
(G1 to G3) of the area belong to the C3S1 (high salinity, low sodium hazard) class, while the remaining 8
sources belong to the C3S2 (high salinity, medium sodium hazard) class.
Figure 4. Sodium and salinity hazard relationship for irrigation water classification.
Table 5. Classification based on SAR and EC curve [30].
Category Type of water No. of samples Detail of samplesC3S1 High salinity and low sodium 3 G1 to G3
C3S2 High salinity and medium sodium 8 G4 to G11
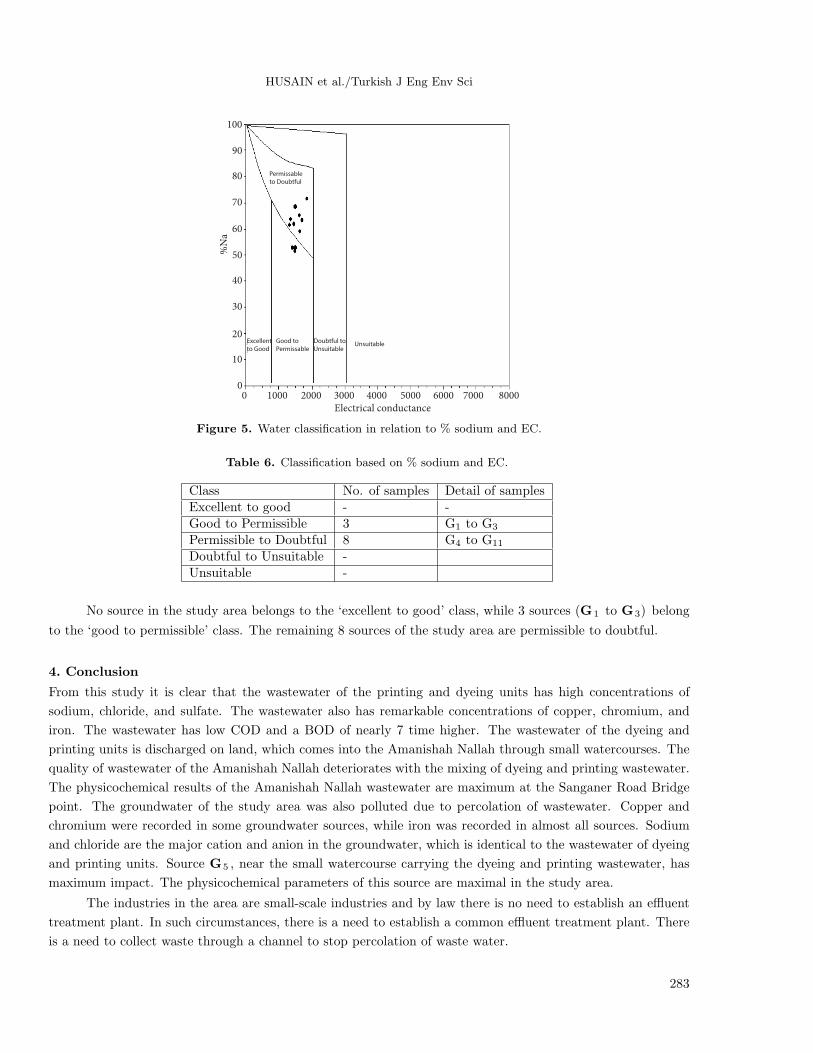
3.5.6. Percentage sodium and EC
Percentage sodium is the percentage of sodium concentration against all cationic concentrations related to
sodium hazard. Therefore, Wilcox used a classification based on these 2 factors, i.e. percentage sodium and
electrical conductance [33]. For this purpose the percentage sodium (% Na) against EC was plotted as shown in
Figure 5. This classification demarcates irrigation water into 5 classes, but the groundwater of the study area
belongs to 2 classes, as shown in Table 6.
282
HUSAIN et al./Turkish J Eng Env Sci
100
90
80
70
60
50
40
30
20
10
1000
Electrical conductance
%N
a
2000 3000 70004000 5000 6000 8000
0
0
Permissable
to Doubtful
Excellent
to Good
Good to
Permissable
Doubtful to
UnsuitableUnsuitable
Figure 5. Water classification in relation to % sodium and EC.
Table 6. Classification based on % sodium and EC.
Class No. of samples Detail of samplesExcellent to good - -Good to Permissible 3 G1 to G3
Permissible to Doubtful 8 G4 to G11
Doubtful to Unsuitable -Unsuitable -
No source in the study area belongs to the ‘excellent to good’ class, while 3 sources (G1 to G3) belong
to the ‘good to permissible’ class. The remaining 8 sources of the study area are permissible to doubtful.
4. Conclusion
From this study it is clear that the wastewater of the printing and dyeing units has high concentrations of
sodium, chloride, and sulfate. The wastewater also has remarkable concentrations of copper, chromium, and
iron. The wastewater has low COD and a BOD of nearly 7 time higher. The wastewater of the dyeing and
printing units is discharged on land, which comes into the Amanishah Nallah through small watercourses. The
quality of wastewater of the Amanishah Nallah deteriorates with the mixing of dyeing and printing wastewater.
The physicochemical results of the Amanishah Nallah wastewater are maximum at the Sanganer Road Bridge
point. The groundwater of the study area was also polluted due to percolation of wastewater. Copper and
chromium were recorded in some groundwater sources, while iron was recorded in almost all sources. Sodium
and chloride are the major cation and anion in the groundwater, which is identical to the wastewater of dyeing
and printing units. Source G5 , near the small watercourse carrying the dyeing and printing wastewater, has
maximum impact. The physicochemical parameters of this source are maximal in the study area.
The industries in the area are small-scale industries and by law there is no need to establish an effluent
treatment plant. In such circumstances, there is a need to establish a common effluent treatment plant. There
is a need to collect waste through a channel to stop percolation of waste water.
283

HUSAIN et al./Turkish J Eng Env Sci
References
[1] Thampi J, Paul R. Azo dye effluent treatment: An environmental challenge (Part I). Colourage 1997; 44: 47–49.
[2] Goetz PW, editor. The New Encyclopedia Britannica. 15th ed. London, UK: Encyclopædia Britannica, Inc.; 1987.
[3] Husain I, Vadiya VK, Husain J, Vadiya R, Sharma CS. Groundwater pollution by textile industry. Oriental Journal
of Chemistry 2003; 19: 667–676.
[4] Khan TI, Kaur N, Agarwal M. Heavy metal analysis of crop plants from agriculture fields of Sanganer town. J
Environ Pollution 1997; 4: 35–38.
[5] Husain J, Husain I, Arif M. Characterization of textile waste water. Journal of Industrial Pollution Control 2004;
20: 137–144.
[6] Husain I, Hussain J. Groundwater pollution by discharge of dyeing and printing industrial wastewater in Bandi
river, Rajasthan, India. International Journal of Environment & Bioenergy 2012; 2: 100–119.
[7] Sharma KC, Husain I, Husain J, Ojha KG. Groundwater quality of an industrial town Bhilwara, Rajasthan. J
Environ Pollution 2001; 8: 109–114.
[8] Husain I, Hussain, J. Study on the impact of textile wastewater on the groundwater quality of villages close To
River Kothari, Rajasthan, India. Pollution Research 2004; 23: 477–481.
[9] Husain I, Vaidya VK, Hussain J, Vaidya R, Sharma CS. Groundwater pollution by textile industry. Oriental Journal
of Chemistry 2003; 19: 667–676.
[10] Husain J, Sharma KC, Husain I, Ojha KG, Vaidya VK. Physico-chemical characteristics of water from bore wells
of an industrial town Bhilwara, Rajasthan: a correlation study. Asian J Chem 2001; 13: 509–512.
[11] Hussain J, Husain I, Ojha KG. Study of ground water quality for irrigation in near industrial area of Bhilwara,
Rajasthan, India. Asian J Chem 2001; 13: 1114–1122.
[12] Hussain, J, Husain I. Study on the impact of textile wastewater on the groundwater quality of villages close To
River Banas, Rajasthan, India, India. Journal of Environmental Protection 2003; 23: 1038–1044.
[13] Husain I. Physico chemical study of industrially polluted groundwater. PhD, M.D.S. University, Ajmer, India, 2004.
[14] Jacob CT, Azariah H, Roy AGV. Impact of textile industries on river Noyyal and riverine ground water quality of
Tirupur, India. Pollution Research 1999; 18: 359–368.
[15] Brown E, Skougstad MW, Fishman MJ. Method for Collection and Analysis of Water Samples for Dissolved Minerals
and Gases. Washington, DC, USA: US Department of Interior; 1974.
[16] APHA. Standard Method for Examination of Water and Wastewater. Washington, DC, USA: American Public
Health Association; 2012.
[17] Prabakaran J, Thangavel P. Colour Removal from Textile Industrial Effluents by Bioremediation and Reuse of
Treated Effluents for Agriculture. Sponsored byWater Resource Organisation (PWD), Environmental Cell Divisions.
Coimbatore, India: Department of Environmental Sciences, Tamil Nadu Agricultural University; 2002.
[18] Kim S, Park C, Kim TH, Lee JW, Kim SW. COD reduction and decolorization of textile effluent using a combined
process. J Biosci Bioeng 2003; 95: 102–105.
[19] Srivastav PN, Prakash A. Bioaccumulation of heavy metals by algae and wheat plants fed by textile effluents. J
Water Pollut Control Fed 1991; 7: 25–30.
[20] Bureau of Indian Standards. Drinking Water Standard IS: 10500. New Delhi, India: BIS; 1991.
[21] Brooker MP, Johnson PC. Behaviour of phosphate, nitrate, chloride and hardness in 12 Welsh rivers. Water Res
1984; 18: 1155–1162.
[22] Fingl E. Laxatives and cathartics. In: Gilman AG, Goodman LS, Gilman A, editors. The Pharmacological Basis of
Therapeutics. 6th ed. New York, NY, USA: MacMillan; 1980. pp. 1002–1012.
[23] De Zuane J. Handbook of Drinking Water Quality. 2nd ed. New York, NY, USA: John Wiley; 1996.
284
HUSAIN et al./Turkish J Eng Env Sci
[24] Speijers GJA. National Institute of Public Health and Environmental Protection Report No. 758473012. Bilthoven,
the Netherlands: National Institute of Public Health and Environmental Protection; 1989.
[25] US National Academy of Science. The Health Effects of Nitrate, Nitrite and N-Nitroso Compounds. Part I of a
Two-Part Study by the Committee on Nitrite and Alternative Curing Agents in Food. Washington, DC, USA:
National Academic Press; 1981.
[26] Craun GF, Grathouse DG, Gunderson DH. Methemoglobin levels in young children consuming high nitrate well
water in the United States. Int J Epidemiol 1981; 10: 309–325.
[27] World Health Origination. Fluorine and Fluoride, Environmental Health Criteria. Geneva, Switzerland: WHO;
1989.
[28] Hussain J, Hussain I, Sharma KC. Fluoride in drinking water and its ill effect on human health: a review. Journal
of Tissue Research 2004; 4: 263–273.
[29] Salonen JT. Interactions of serum copper selenium and low density lipoprotein cholesterol in atherogenesis. BMJ
1991; 302: 756–760.
[30] US Salinity Laboratory Staff. Diagnosis and Improvement of Saline and Alkali Soils. Washington, DC, USA: US
Department of Agriculture Handbook; 1954.
[31] Eaton EM. Significance of carbonate in irrigation water. Soil Sci 1950; 69: 123–133.
[32] Gupta SK, Gupta IC. Management of Saline Soils and Water. New Delhi, India: IBH; 1987.
[33] Wilcox LV. The Quality of Water for Irrigation Use. Washington, DC, USA: US Department of Agriculture; 1948.
285