Embed Size (px)
Citation preview
Environmental Life Cycle Assessment
PSE 476/WPS 576/WPS 595-005
Lecture 5: LCI
1
Fall 2012
Richard A. Venditti Forest Biomaterials
North Carolina State University Raleigh, NC 27695-8005
Go.ncsu.edu/venditti
Lecture 5: Life Cycle Inventory
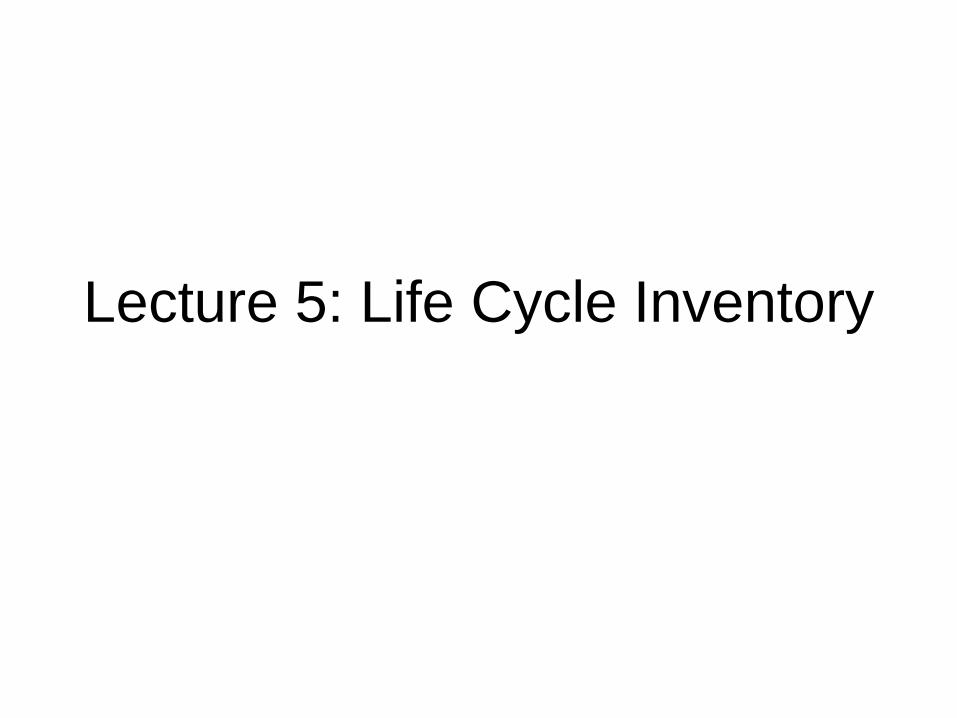
Major Parts of a Life Cycle
Assessment
Interpretation
Impact Assessment
Inventory Analysis
Goal and Scope Definition
3
Life Cycle Inventory Analysis(LCI): • Life cycle inventory analysis: Phase of the life cycle
assessment involving the compilation and the quantification of
inputs and outputs for a product throughout its life cycle [ISO
14044:2006(E)]
• “an inventory analysis means to construct a flow model of a
technical system.”
• “the model is an incomplete mass and energy balance over the
system”
• “environmentally indifferent flows such as diffuse heat and
emissions of water vapour as a combustion product are not
modelled” HHGLCA, 2004.
4
Life Cycle Inventory Analysis(LCI):
• Three major activities:
– Construction of the flowsheet
– Data collection and documentation
– Calculation of the environmental loads
in terms of the functional unit (i.e., the
reference flow) • Resource use
• Pollutant emissions
5 HHGLCA, 2004.
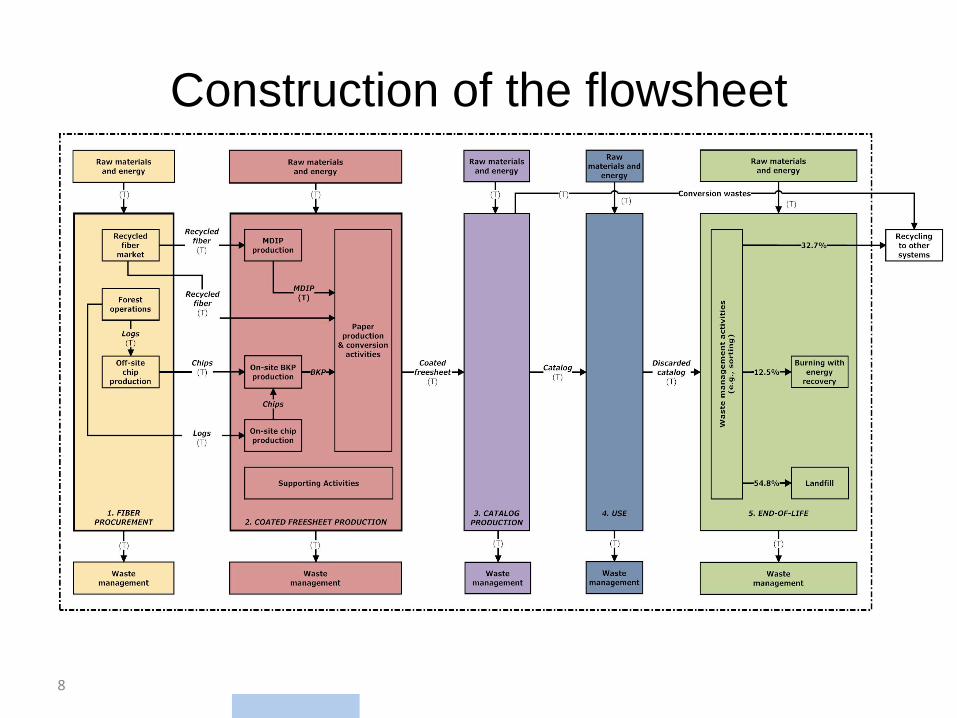
Construction of the flowsheet
• Should have all of the processes as in
accordance with the Goal and Scope section
• Should clearly show significant interchanges
between processes
• IF the entire system is extremely complicated then
two flowsheets are suggested:
– A simplified flowsheet showing the major life cycle “lumped”
parts of the system, suitable for communicating the major
concepts of the system
– A detailed flowsheet that provides finer documentation of the
system
6 HHGLCA, 2004.
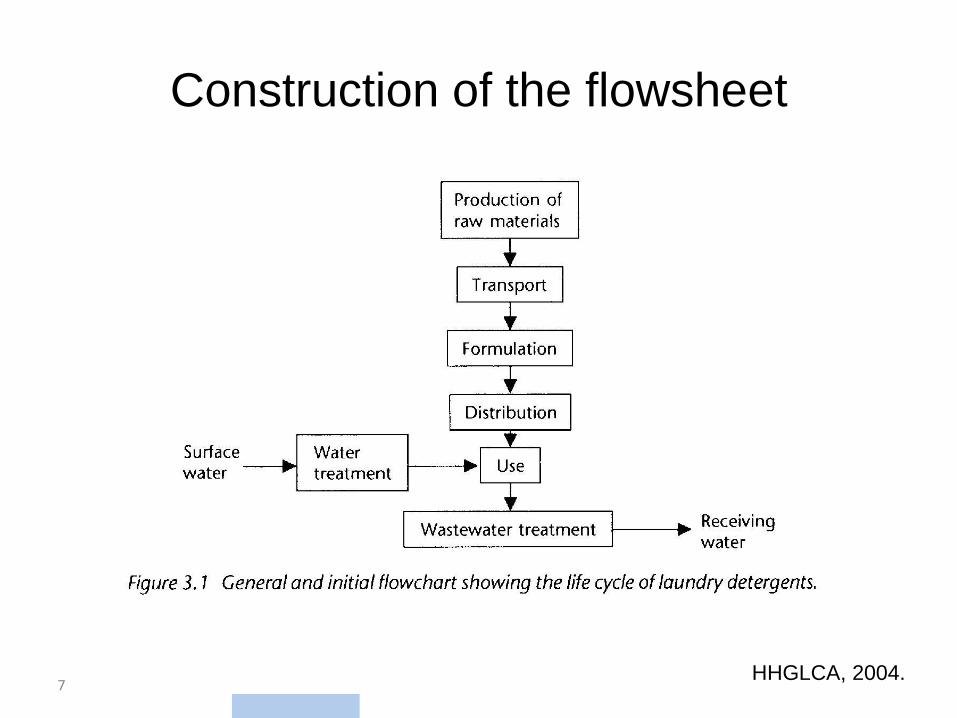
Construction of the flowsheet
7 HHGLCA, 2004.
Construction of the flowsheet
8
Data Collection
• One of the most time consuming activities in a LCA
• Garbage in, garbage out
• Main data:
– Input flows of raw materials and energy
– Other “inputs” such as land use
– Product output flows
– Emissions to air, water and land and other environmental
impacts (eg., noise)
– Data to describe processes
• Example: production efficiencies, equipment, useful lifetimes of products,
travel distances…
• Should also have data to guide allocation
9 HHGLCA, 2004.
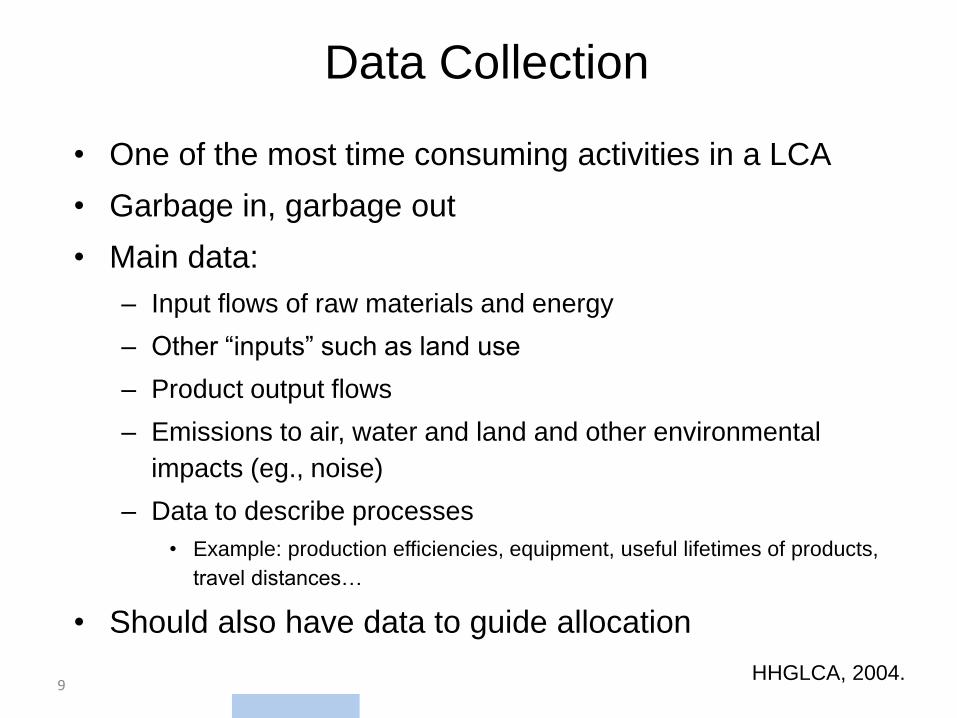
Data Collection
• For each process in the flowsheet:
10 HHGLCA, 2004.
Process
Product of interest
Emissions to air
Co-products
Emissions to water Solid Waste
Process Chemicals
Raw materials
Energy
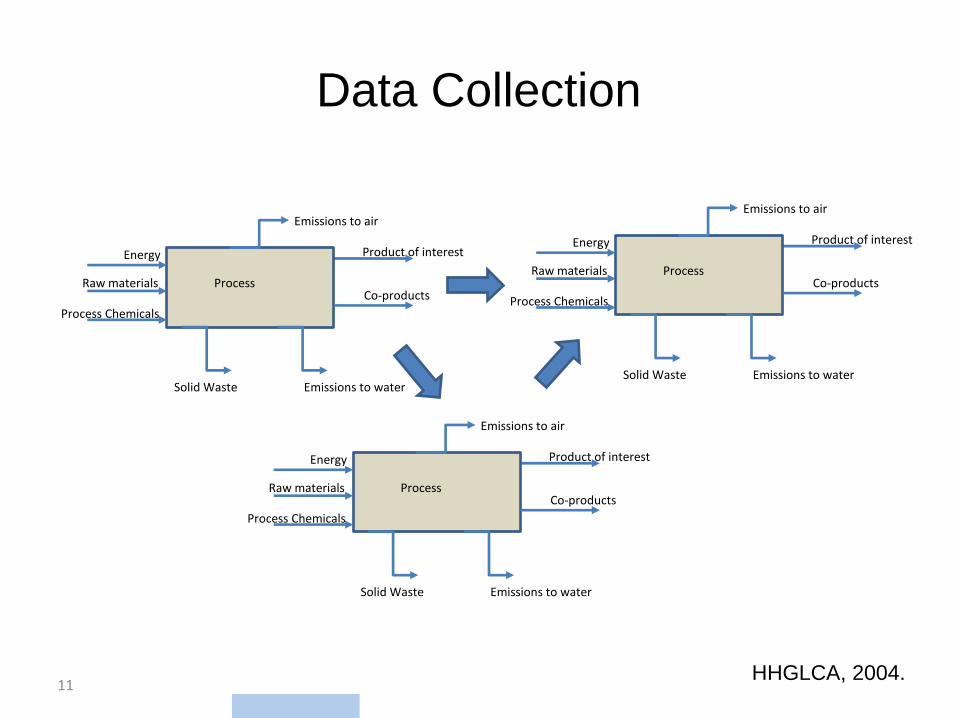
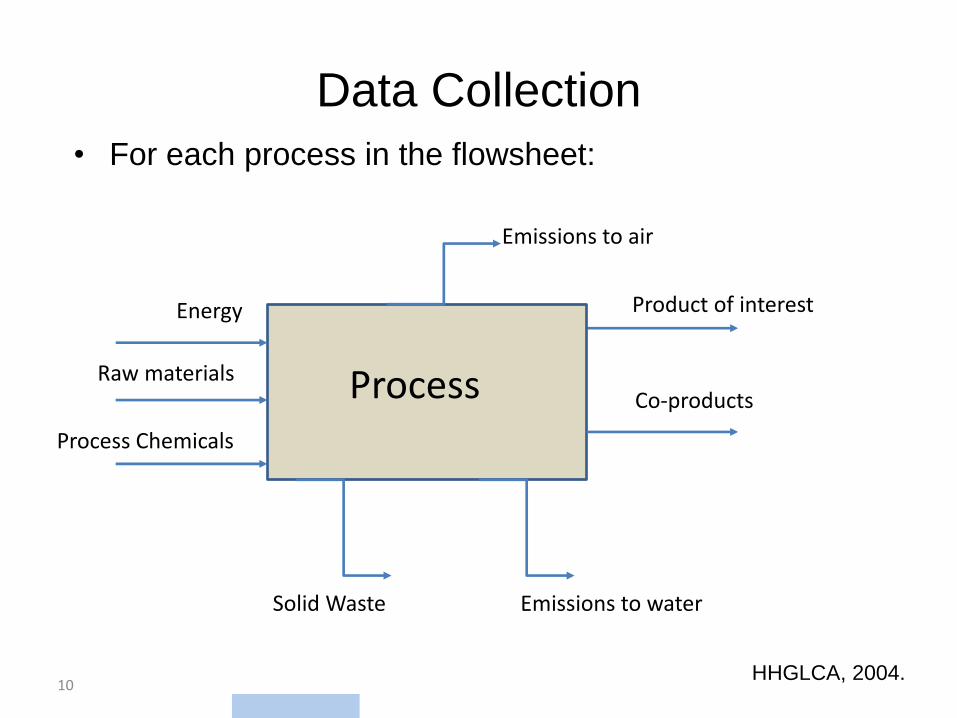
Data Collection
11 HHGLCA, 2004.
Process
Product of interest
Emissions to air
Co-products
Emissions to water Solid Waste
Process Chemicals
Raw materials
Energy
Process
Product of interest
Emissions to air
Co-products
Emissions to water Solid Waste
Process Chemicals
Raw materials
Energy
Process
Product of interest
Emissions to air
Co-products
Emissions to water Solid Waste
Process Chemicals
Raw materials
Energy
Data Sources
• Direct measurements
• Literature
• Internet
• Life cycle inventory databases
• Interviews
12 HHGLCA, 2004.
Data Sources • Foreground system: processes that actions can be directly
taken wrt the results of the LCA, direct measurements can
often be taken (primary data)
• Background system: processes that actions can not be
directly taken wrt the results of the LCA, often, external
secondary data used
• Primary Data: direct measurement/description of variables
• Secondary Data: data sources from published or
unpublished data articles, reports or studies
• Assumptions: used when primary or secondary data is not
available.
13 HHGLCA, 2004.
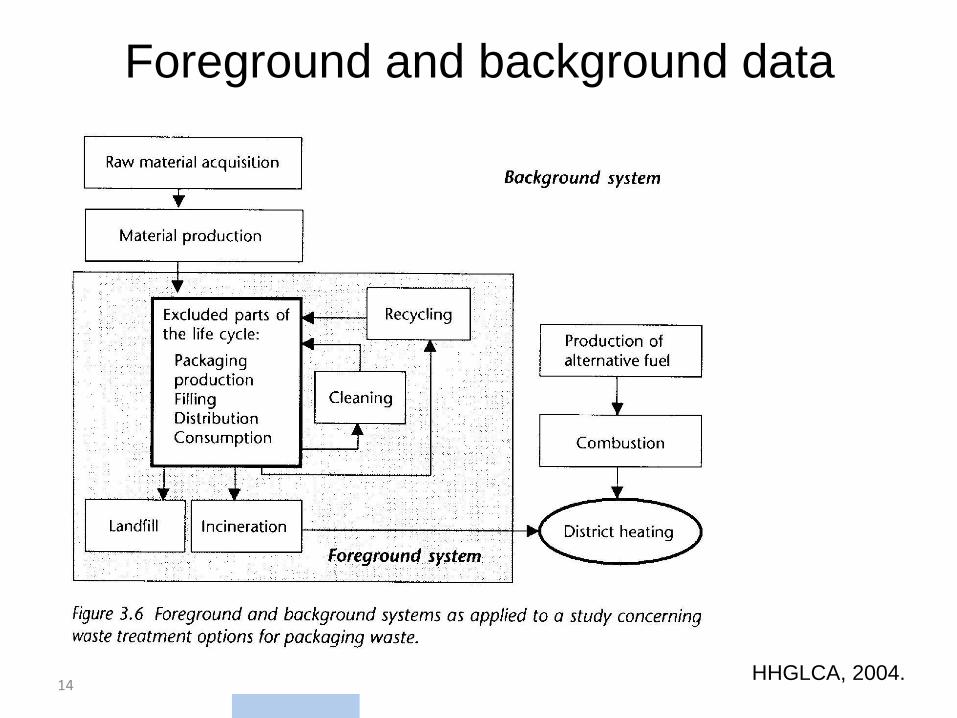
Foreground and background data
14 HHGLCA, 2004.
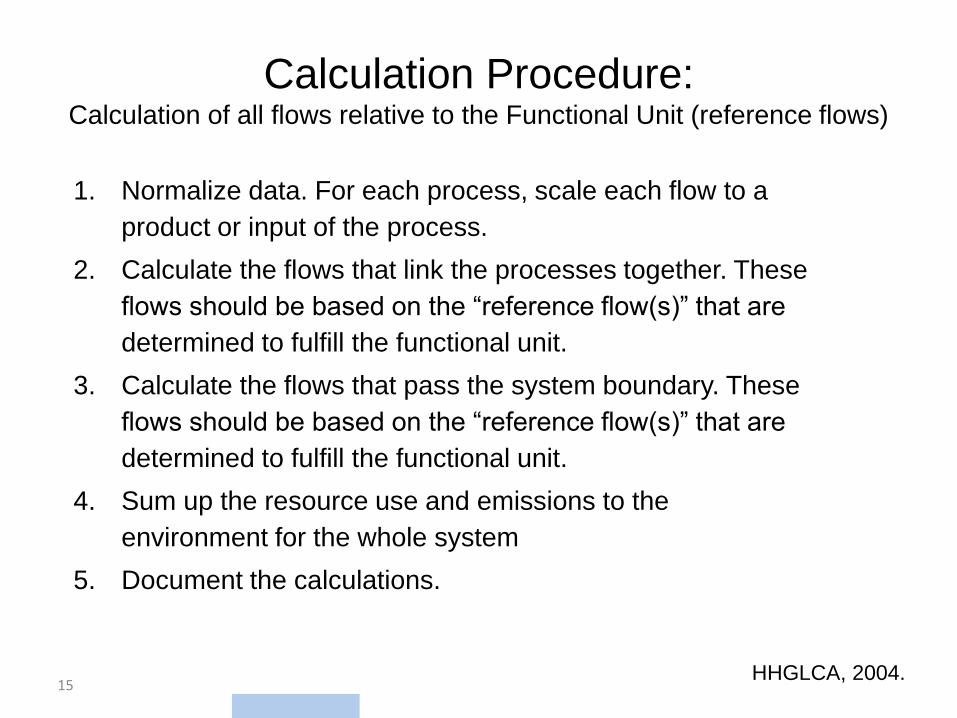
Calculation Procedure: Calculation of all flows relative to the Functional Unit (reference flows)
1. Normalize data. For each process, scale each flow to a
product or input of the process.
2. Calculate the flows that link the processes together. These
flows should be based on the “reference flow(s)” that are
determined to fulfill the functional unit.
3. Calculate the flows that pass the system boundary. These
flows should be based on the “reference flow(s)” that are
determined to fulfill the functional unit.
4. Sum up the resource use and emissions to the
environment for the whole system
5. Document the calculations.
15 HHGLCA, 2004.
Basic Unit conversions:
16
• Convert 25 days into seconds:
• Convert 4 feet into meters (25.4 mm equals an inch)
Scientific Notation:
17
• 7x10+4 = 7 x 10 x10 x10 x10 = 70,000
• 8.1x10-3 = 8.1 / (10x10x10) = 0.0081
• 8.1x10-3 = 8.1E-3 (alternate form to express this)
Calculation Procedure Example:
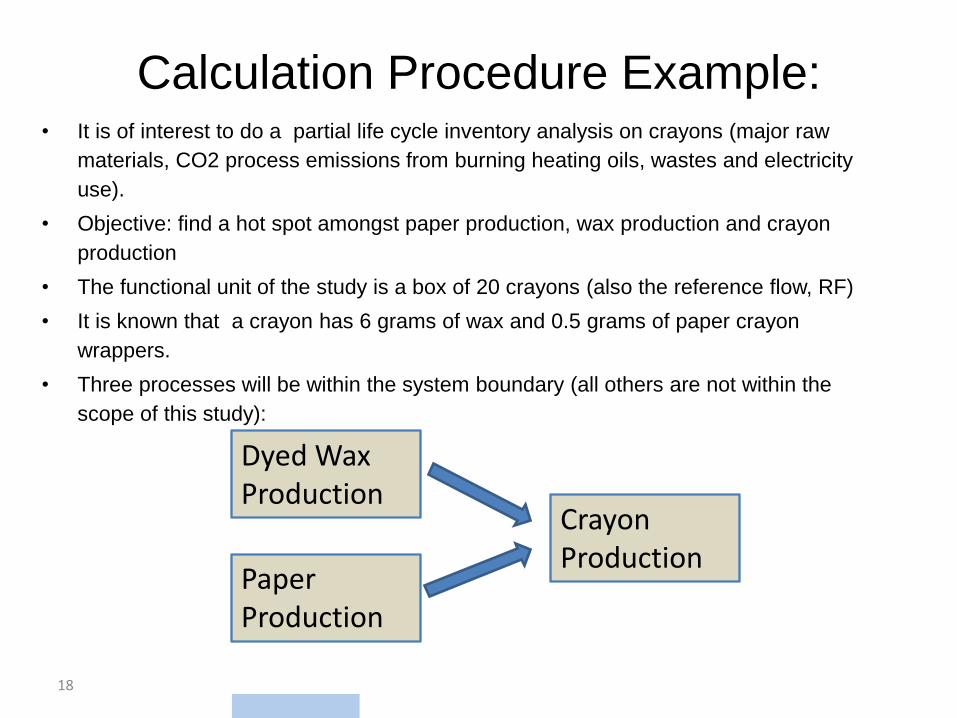
• It is of interest to do a partial life cycle inventory analysis on crayons (major raw
materials, CO2 process emissions from burning heating oils, wastes and electricity
use).
• Objective: find a hot spot amongst paper production, wax production and crayon
production
• The functional unit of the study is a box of 20 crayons (also the reference flow, RF)
• It is known that a crayon has 6 grams of wax and 0.5 grams of paper crayon
wrappers.
• Three processes will be within the system boundary (all others are not within the
scope of this study):
18
Crayon Production
Dyed Wax Production
Paper Production
Calculation Procedure Example: Data Collection
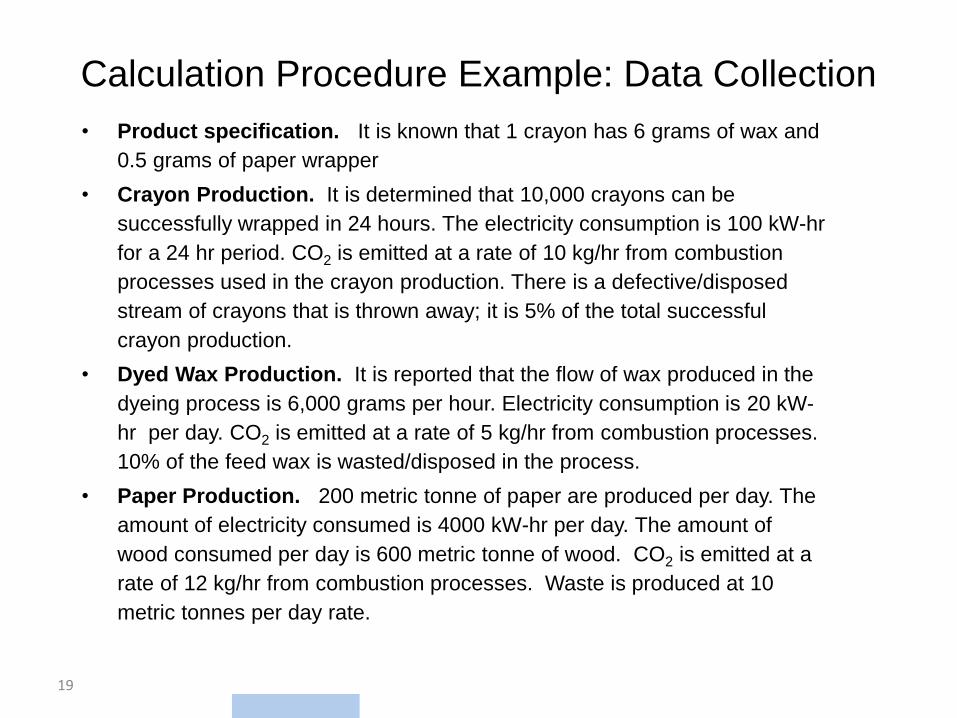
• Product specification. It is known that 1 crayon has 6 grams of wax and
0.5 grams of paper wrapper
• Crayon Production. It is determined that 10,000 crayons can be
successfully wrapped in 24 hours. The electricity consumption is 100 kW-hr
for a 24 hr period. CO2 is emitted at a rate of 10 kg/hr from combustion
processes used in the crayon production. There is a defective/disposed
stream of crayons that is thrown away; it is 5% of the total successful
crayon production.
• Dyed Wax Production. It is reported that the flow of wax produced in the
dyeing process is 6,000 grams per hour. Electricity consumption is 20 kW-
hr per day. CO2 is emitted at a rate of 5 kg/hr from combustion processes.
10% of the feed wax is wasted/disposed in the process.
• Paper Production. 200 metric tonne of paper are produced per day. The
amount of electricity consumed is 4000 kW-hr per day. The amount of
wood consumed per day is 600 metric tonne of wood. CO2 is emitted at a
rate of 12 kg/hr from combustion processes. Waste is produced at 10
metric tonnes per day rate.
19
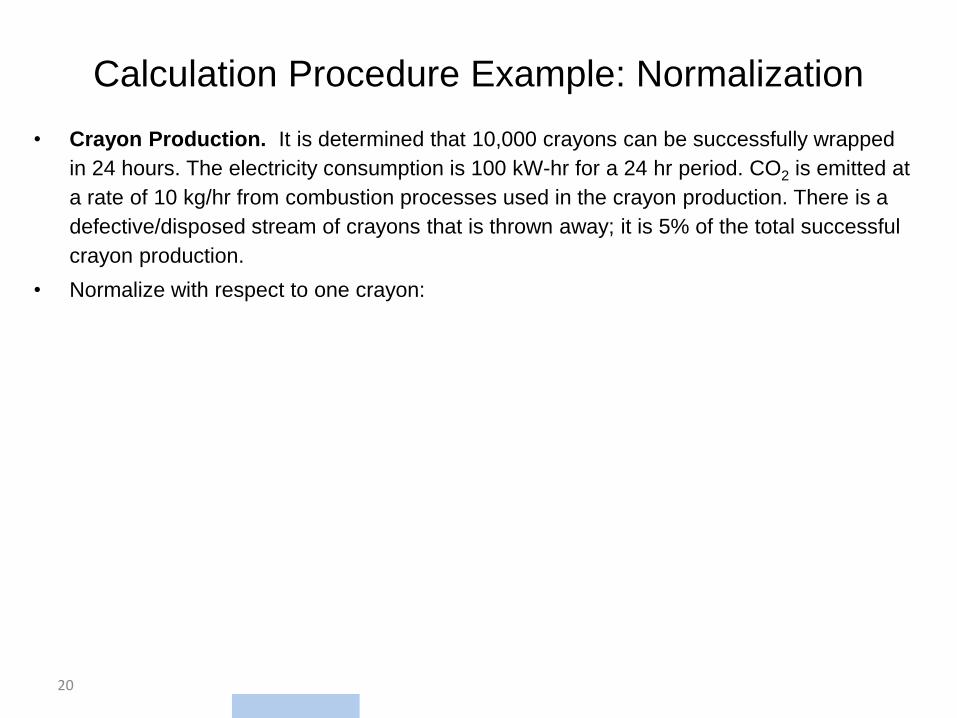
Calculation Procedure Example: Normalization
• Crayon Production. It is determined that 10,000 crayons can be successfully wrapped
in 24 hours. The electricity consumption is 100 kW-hr for a 24 hr period. CO2 is emitted at
a rate of 10 kg/hr from combustion processes used in the crayon production. There is a
defective/disposed stream of crayons that is thrown away; it is 5% of the total successful
crayon production.
• Normalize with respect to one crayon:
20
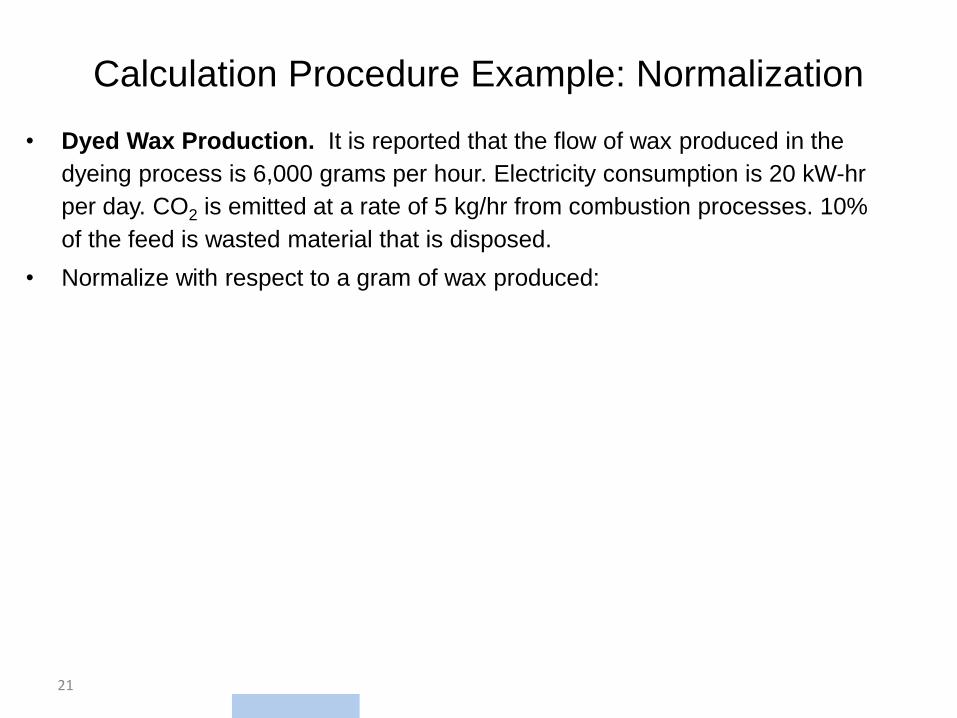
Calculation Procedure Example: Normalization
• Dyed Wax Production. It is reported that the flow of wax produced in the
dyeing process is 6,000 grams per hour. Electricity consumption is 20 kW-hr
per day. CO2 is emitted at a rate of 5 kg/hr from combustion processes. 10%
of the feed is wasted material that is disposed.
• Normalize with respect to a gram of wax produced:
21
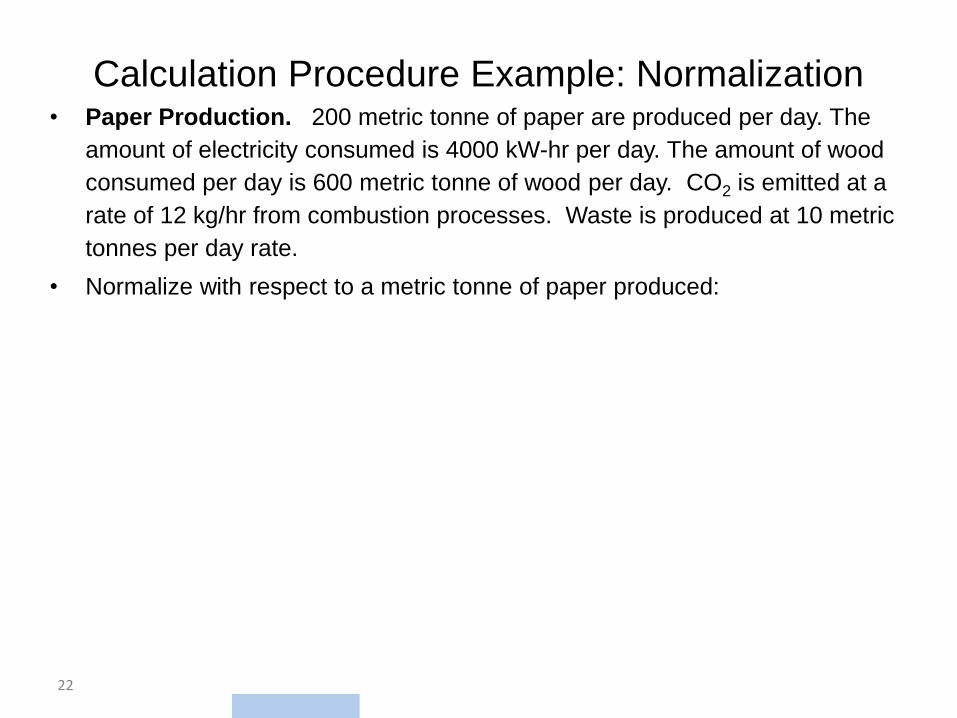
Calculation Procedure Example: Normalization • Paper Production. 200 metric tonne of paper are produced per day. The
amount of electricity consumed is 4000 kW-hr per day. The amount of wood
consumed per day is 600 metric tonne of wood per day. CO2 is emitted at a
rate of 12 kg/hr from combustion processes. Waste is produced at 10 metric
tonnes per day rate.
• Normalize with respect to a metric tonne of paper produced:
22
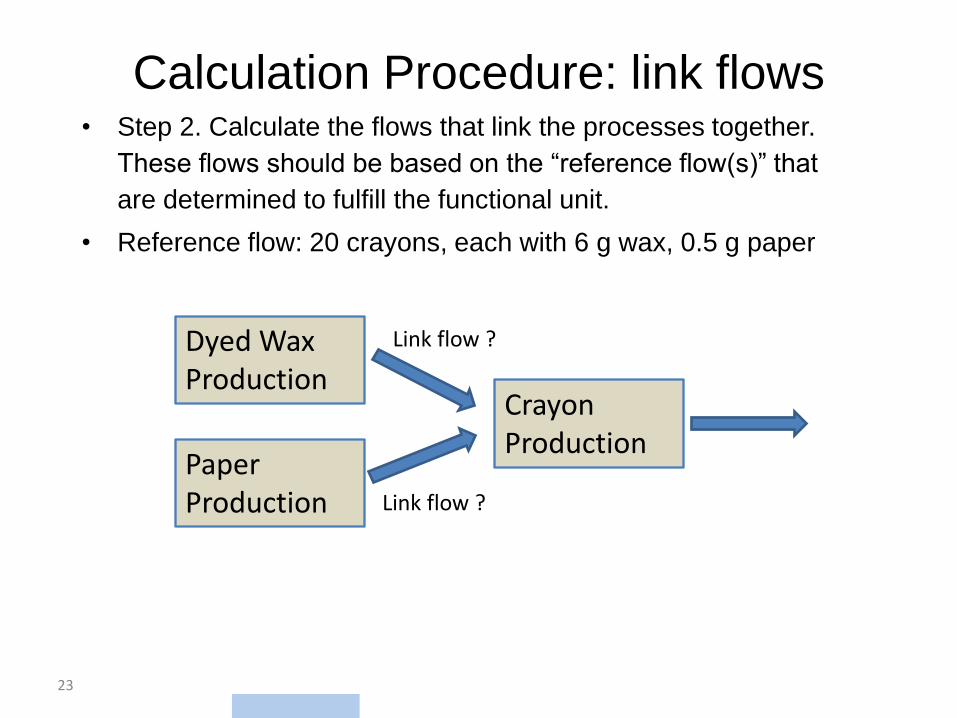
Calculation Procedure: link flows • Step 2. Calculate the flows that link the processes together.
These flows should be based on the “reference flow(s)” that
are determined to fulfill the functional unit.
• Reference flow: 20 crayons, each with 6 g wax, 0.5 g paper
23
Crayon Production
Dyed Wax Production
Paper Production
Link flow ?
Link flow ?
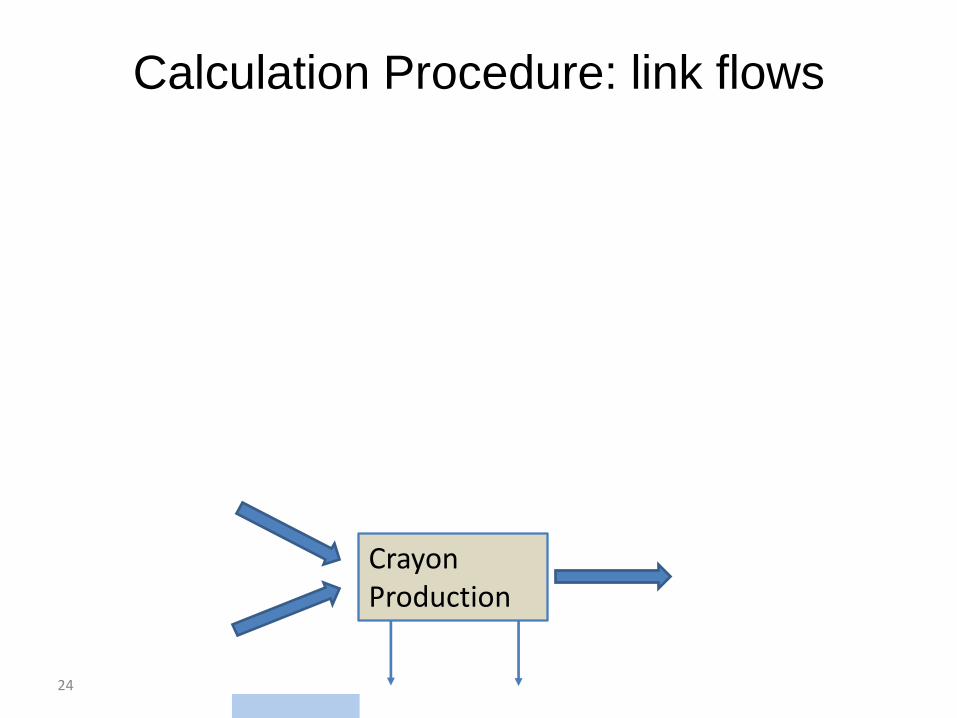
Calculation Procedure: link flows
24
Crayon Production

Calculation Procedure: STEP 3: Calculate the flows that pass the system boundary.
These flows should be based on the “reference flow(s)” that are
determined to fulfill the functional unit.
Crayon Production:
25 HHGLCA, 2004.
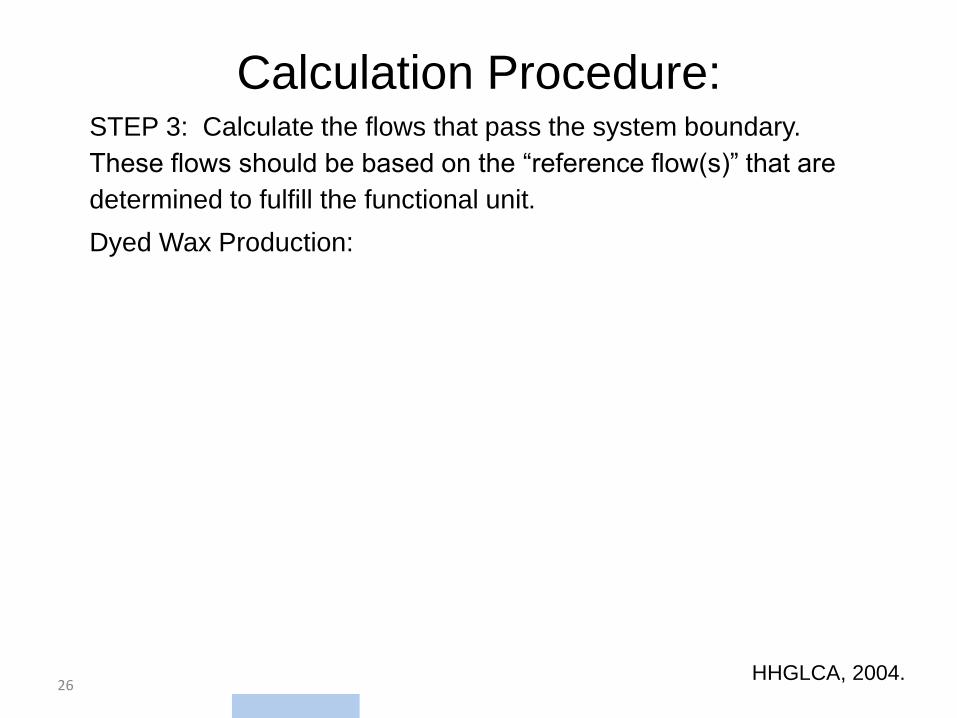
Calculation Procedure: STEP 3: Calculate the flows that pass the system boundary.
These flows should be based on the “reference flow(s)” that are
determined to fulfill the functional unit.
Dyed Wax Production:
26 HHGLCA, 2004.
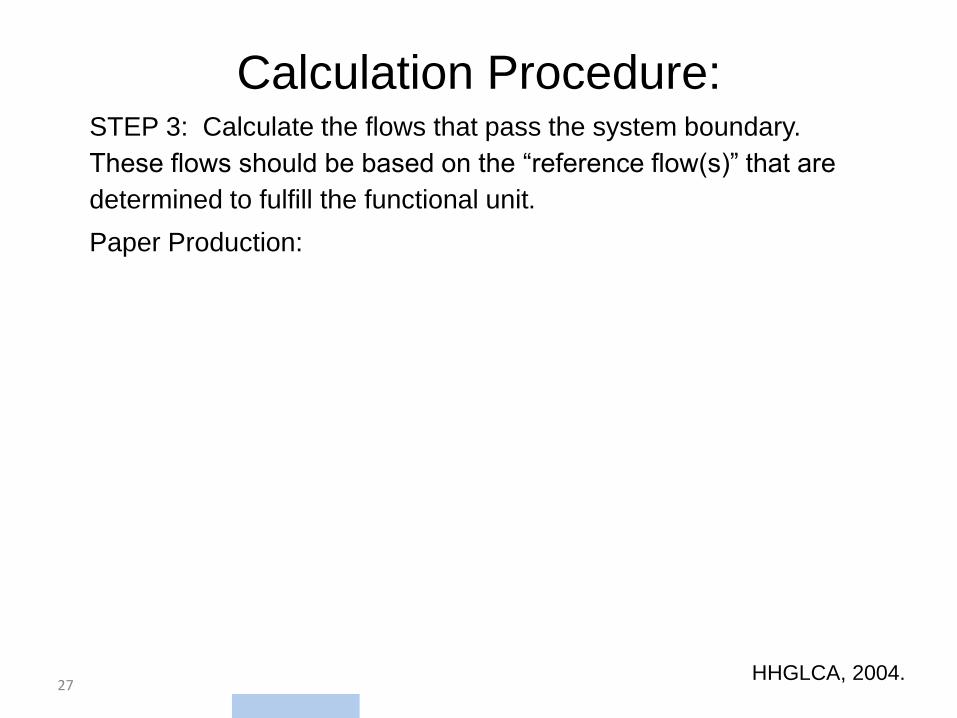
Calculation Procedure: STEP 3: Calculate the flows that pass the system boundary.
These flows should be based on the “reference flow(s)” that are
determined to fulfill the functional unit.
Paper Production:
27 HHGLCA, 2004.
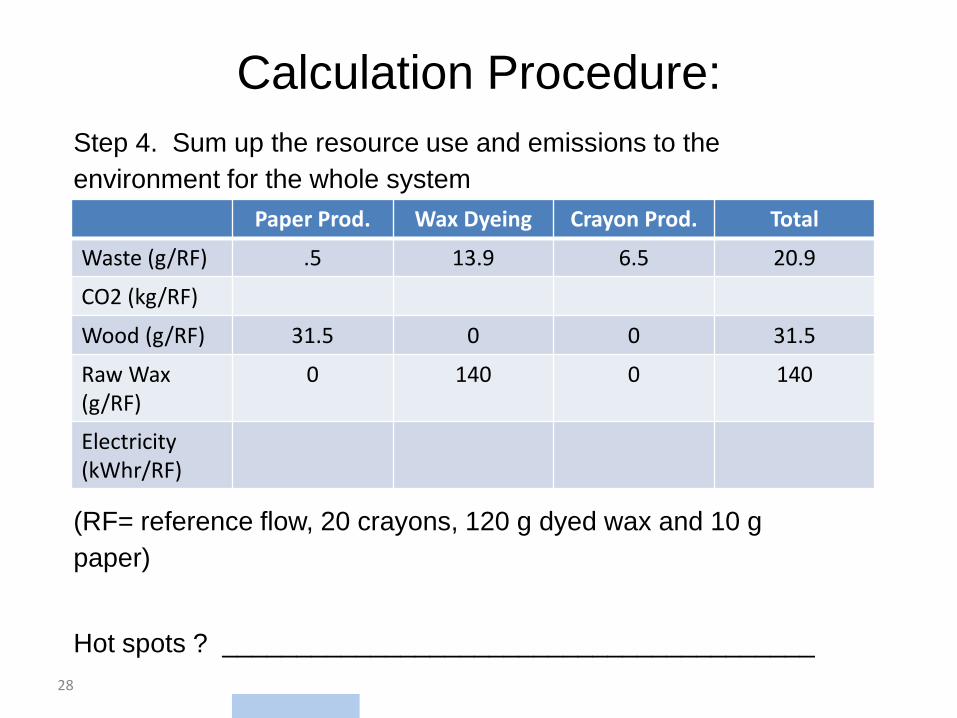
Calculation Procedure:
Step 4. Sum up the resource use and emissions to the
environment for the whole system
(RF= reference flow, 20 crayons, 120 g dyed wax and 10 g
paper)
Hot spots ? ________________________________________
28
Paper Prod. Wax Dyeing Crayon Prod. Total
Waste (g/RF) .5 13.9 6.5 20.9
CO2 (kg/RF)
Wood (g/RF) 31.5 0 0 31.5
Raw Wax (g/RF)
0 140 0 140
Electricity (kWhr/RF)
Calculation Procedure:
Step 5. Document the calculations (for others). Show example
calculations and data used. Explain boundary, allocation, and
calculation methods.
29 HHGLCA, 2004.
Summary
– Life cycle inventory (LCI) analysis
– 3 Major Activities in LCI
– Foreground data
– Background data
– Primary data
– Secondary data
– 5 steps of a LCI
– Functional unit
– Reference flows
– Normalized Process Data
– Linking flows
– Hot spots
30