Embed Size (px)
Citation preview
Environmental Management Policyunder International Carbon Leakage∗
Kazuharu Kiyono† Jota Ishikawa‡
October 2011
Abstract
This paper studies environmental management policy when twofossil-fuel-consuming countries non-cooperatively regulate greenhouse-gas emissions through emission taxes or quotas. The presence of carbonleakage caused by fuel-price changes affects the tax-quota equivalence.We explore each country’s incentive to choose an environment regula-tion instrument within a framework of a two-stage policy choice gameand find subgame-perfect Nash equilibria. This sheds a new light onthe question of why adopted policy instruments to deal with globalwarming could be different among countries. We also consider underwhat conditions creating an international market for emission permitsbenefits the fuel-consuming countries.
Keywords: global warming, carbon leakage, emission tax, emission quota,tax-quota equivalence, emission tradingJEL Classification Number: F18
∗We wish to thank participants of seminars at the Norwegian School of Economics andBusiness Administration and at Stockholm University for their helpful comments on earlierversions of this paper. The usual disclaimer applies. We are grateful to Ralph Paprzyckifor editing this paper. Ishikawa acknowledges financial support from the Ministry ofEducation, Culture, Sports, Science and Technology of Japan (MEXT) under the GlobalCenter of Excellence Project and the Grant-in-Aid for Scientific Research (A). Ishikawadedicates this paper to the late Professor Kazuharu Kiyono who passed away before thispaper is completed.
†Waseda University‡Hitotsubashi University and RIETI; Faculty of Economics, Hitotsubashi University,
Kunitachi, Tokyo 186-8601, Japan; E-mail: [email protected]
1

1 Introduction
Governments around the world are gradually adopting measures to tackle theissue of global warming. A major element of these measures in many coun-tries is the introduction of emission taxes and quotas (including the creationof markets to trade emission permits). Previous studies on environmentalregulation suggest that, within a closed economy, emission taxes and quo-tas are essentially equivalent instruments. In an open-economy framework,however, this is usually not the case.1 In particular, carbon leakage acrosscountries could arise and affect the equivalence.
There are three main channels through which international carbon leak-age can arise. The first channel is changes in a country’s industrial struc-ture as discussed in Copeland and Taylor (2005) and Ishikawa et al. (2011).When a country adopts emission regulations, the comparative advantage ofthe emission-intensive industry could shift abroad. The second channel isthe relocation of plants in response to emission regulations, particularly inemission-intensive industries (see Markusen et al., 1993; Markusen et al.,1995; Ulph and Valentini, 2001; and Ishikawa and Okubo, 2008, for exam-ple). The third channel, finally, is changes in the price of fossil fuels (See, forexample, Bohm, 1993; Felder and Rutherford, 1993; Burniaux and Martins,2000; Kiyono and Ishikawa, 2003; Hoel, 2005; and Böringer et al., 2010). Adecrease in fossil fuel demand caused by emission regulations in one countrylowers the global price of fossil fuels, boosting fossil fuel demand and hencegreenhouse-gas (GHG) emissions in other countries.
An important point is that the emission regulations adopted by one coun-try do not affect GHG emissions of other countries if these countries employemission quotas which are binding. That is, carbon leakage does not occuronce other countries directly control their GHG emissions. Thus, the tough-ness of each country’s anti-global warming policies is affected by the policychoices of other countries, in turn affecting global environmental quality. Inother words, emission taxes and quotas are unilaterally equivalent for eachcountry given the policy decisions of other countries (unilateral equivalence).
1 In this study, the term “tax-quota equivalence” is understood to mean that subjectto the objective of national welfare maximization, the government can achieve the sameresource allocation through either an emission tax or an emission quota. However, theterm has several different meanings in the previous literature. For example, when thereplacement of an emission tax with a quota that is set to equal emission levels underthe tax-ridden equilibrium gives rise to the same resource allocation across the economy.Within a partial equilibrium framework in the absence of uncertainty and incompleteinformation, such equivalence holds in a perfectly competitive market (see Xepapadeas,1997) as well as in an imperfectly competitive market without strategic abatement in-vestment by firms before the government policy decision (see Ulph, 1996). However, theequivalence breaks down in a general equilibrium model, as shown in Ishikawa and Kiyono(2006) and Ishikawa and Okubo (2008). This is mainly because an emission quota puts acap on a country’s total greenhouse gas emissions whereas the emissions are endogenouslydetermined under emission tax policy.
1
However, they are not unilaterally equivalent once each country understandsthat the policy instrument choices of other countries may be affected by itsown choice under strategic interdependence among countries subject to thecarbon-leakage effect (strategic non-equivalence).2 3
In this paper, we first demonstrate unilateral equivalence and strategicnon-equivalence more rigorously. When the equivalence does not hold, aninteresting research question is why some countries adopt emission taxeswhile some others adopt emission quotas.4 We then address this question.We explore each country’s incentive to choose an environment regulationinstrument within a framework of a two-stage policy choice game and findsubgame-perfect Nash equilibria. Our analysis is also instructive to examinethe welfare effects when creating an international market to trade emissionpermits. Therefore, we explore the conditions under which the creation ofinternational markets to trade emission permits makes all the participantsbetter off.
In our analysis, we focus on international carbon leakage caused bychanges in the fuel price, because Felder and Rutherford (1993) and Böringeret al. (2010) argue that the changes in fuel price dominate in the source ofinternational carbon leakage. We build a model with one fuel-producing (orfuel-exporting) country and two fuel-consuming (or fuel-importing) coun-tries. In the fuel-consuming countries, the non-tradable sector emits GHGand causes global warming.5 We consider a two-stage policy game in whichboth fuel-consuming countries independently choose their emission regula-tion instrument, either emission taxes or emission quotas, and then, in thesecond stage, after observing which emission regulation instrument the othercountry has chosen, determine the specific level of the policy instrument cho-sen in the first stage.
Depending on the instrument choices, different policy game equilibriaemerge. When both countries choose emission taxes (emission quotas), thesecond-stage subgame is the tax-tax policy game (the quota-quota policygame). When one country chooses emission taxes and the other emissionquotas, the resulting second-stage game is the tax-quota policy game. We
2The issue of unilateral equivalence and strategic non-equivalence has been discussedrigorously in Kiyono (1985).
3Even in the absence of carbon leakage, the tax-quota equivalence may break down ina general equilibrium framework when pollution intensities differ across industries. SeeIshikawa and Kiyono (2000,2006).
4Emission trading is implemented by EU and New Zealand. Australia and Canada aregoing to introduce emission trading. Finland was the first country to introduce emissiontaxes in 1990. Now a number of European countries employ emission taxes. South Africaintroduced a carbon tax in 2010. Countries such as China are planning to adopt emissiontaxes.
5Power generation and heat supply is the major source of GHG emissions. Accordingto the International Energy Agency (IEA), the shares of world CO2 emissions from fuelcombustion for electricity and heat, transport, and industry are, respectively, 41%, 23%,and 20% in 2007. Thus, the GHG-emission share of the non-tradable is fairly high.
2

examine which combination of instruments emerges as a subgame perfectNash equilibrium for our full game. This analysis sheds a new light onthe question of why adopted policy instruments could be different amongcountries.
In Kiyono and Ishikawa (2003), we discussed the issue of unilateral equiv-alence and strategic non-equivalence with carbon leakage through fuel pricechanges. However, the analysis there was conducted in a much simplerframework using partial equilibrium analysis. In addition to providing ageneral equilibrium analysis, the present study analyzes the game of policyinstrument choices. It is also shown that the creation of an internationalmarket for the trade in emission permits may not benefit fuel-consumingcountries.
There are many papers that compare various environmental policies in-cluding emission taxes and quotas (see, for example, Ulph, 1996; Xepa-padeas, 1997; Ishikawa and Kiyono, 2006; Lahiri and Ono, 2007; and Ishikawaand Okubo, 2008). Some of them argue what policy instruments should beused. To our knowledge, however, no study has rigorously examined the en-dogenous environmental-policy choices as a result of a policy game betweencountries. We explore the subgame perfect equilibrium when the countriescommit to either taxes or quotas before determining specific instrument lev-els.
Copeland and Taylor (2005) develop a general equilibrium model of in-ternational trade and examine the welfare effects of emission trading. Theyconsider a Heckscher-Ohlin model with three countries (i.e., two North coun-tries: West and East, and South) and assume that West and East are con-strained by the emission treaty, but South is not. It is shown that emissiontrading between West and East may make them worse off and may not causecarbon leakage in South although South is free from emission control.6
Our analysis differs from theirs not only in the structure of the modelemployed but also in that they explore the welfare effect led by a marginalinvolvement in permit trade (i.e. a limited, small volume of permit trade),whereas we discuss the total gains and losses from the country’s full involve-ment in permit trade. In Copeland and Taylor (2005), the change in theterms of trade (TOT) for commodities plays an important role in governingthe welfare effects. In our analysis, however, when the carbon-leakage effectis strong enough, the direction of the change in the TOT for fuel, which isour counterpart to their TOT for commodities, may not predict whether a
6As is well known, in the Heckscher-Ohlin model, the factor prices are equalized infree trade equilibrium when countries are incompletely specialized. This property holdsin Copeland and Taylor (2005) so that the prices of emission permits are equalized in freetrade equilibrium with incomplete specialization. Obviously, in such an equilibrium, thereis no incentive for trade in emission permits. To consider permit trade between countries,they assume that West is completely specialized in the clean good, while East producesboth clean and dirty goods. As a result, permits are exported from East to West.
3
country gains or loses by engaging in permit trade.Another study that discusses the welfare effects of international trade in
emission permits on each country is that by Ishikawa et al. (2011). Theyuse a two-country (North-South) model having both the Heckscher-Ohlinand Ricardian features. Asymmetric technologies result in a difference inthe permit prices between North and South under free trade equilibrium.It is shown that carbon leakage may arise and that emission trading maynot benefit both countries. Although the results are somewhat similar toours, their deriving force is different from ours because trade in fossil fuelis not considered. Moreover, in their model, carbon leakage is caused whenonly one country introduces an emission quota, but in our model, in contrast,even if both countries employ environmental measures, carbon leakage couldarise between them. This is because one or both countries may implementemission taxes.
The rest of the paper is organized as follows. In Section 2, we construct amodel of two fuel-consuming countries emitting GHG and one fuel-producingcountry, and show that the relative difference in the emission coefficient,that is the GHG emission per unit of fossil fuel, between the fuel-consumingcountries determines the size of the carbon-leakage effect. We discuss theproperties of the equilibria when the two fuel-consuming countries chooseemission taxes in Section 3 and those when the two fuel-consuming countrieschoose emission quotas in Section 4. In Section 5, we discuss the unilateralequivalence between emission taxes and quotas, and then the strategic non-equivalence between emission taxes and quotas. In Section 6, we explore eachcountry’s incentive to choose an environment regulation instrument withina framework of a two-stage policy choice game and find subgame-perfectNash equilibria. The results and tools for the analysis are further applied inSection 7 to consider the welfare effects of creating an international marketfor the trade in emission permits. Section 8 concludes.
2 Model
Consider a world consisting of three countries, with countries 1 and 2 bothconsuming the fossil fuel supplied by the third country, s. The economyof each country is characterized by perfect competition. Each of the fuel-consuming countries produces two goods: a homogeneous tradable commod-ity (other than the fossil fuel) produced only by labor, and a non-tradableproduced by labor, fossil fuel, and environment resources. Production ofeach good is subject to constant returns to scale, and the non-tradable sec-tor requires the use of a certain combination of fossil fuel and the environ-ment. The use of fossil fuel results in GHG emissions, which degrade globalenvironmental quality.
In this paper, the volume of the GHG emissions is represented by the
4
environment as an input factor. Thus, the tradable good is what we maycall a “clean” good and the non-tradable good a “dirty” one. We refer toeither of the fuel-consuming countries by superscripts i, j, k ∈ {1, 2} wherei and j(6= i) represent the different countries and k represents either one.The third country, s, a single country supplying the fossil fuel, produces thefossil fuel and the homogeneous tradable commodity.
Thus, each of the fuel-consuming countries produces and exports thetradable commodity to the fuel-supplying country and imports fossil fuelto produce the non-tradable good. The government of neither of the threecountries directly intervenes in the trade in the commodity or the fossilfuel. Hereafter, we use the non-fuel tradable good as the numeraire. Theconstant-returns-to-scale production technology used to produce it meansthat we can choose the units of output and input so that one unit of thetradable needs one unit of labor. This means that the wage rate should beequal to unity across the world.
As our benchmark, we construct a model in which both fuel-consumingcountries regulate their GHG emissions by means of emission taxes.
2.1 Fuel-Consuming Country
Supply-side We start with the supply side. In a fossil-fuel-consumingcountry, production of the dirty non-tradable good emits GHG and wors-ens the quality of the global environment hurting the welfare of householdsacross the world. According to Meade (1952), the emitted GHG is an “un-paid factor of production”, pricing of which is made by the government inthe country having the dirty industry. The specific emission tax rate onGHG serves as the factor price of the environmental resource for firms inthe dirty non-tradable sector.7
Next, let r denote the world price of the fossil fuel, ti, the emission taxrate set by the government in fuel-consuming country i ∈ {1, 2}, and ci(r, ti)the unit cost function for the dirty non-tradable sector in country i ∈ {1, 2}.8The assumption of perfect competition subject to constant returns to scalemeans that the equilibrium holds only when the price of the non-tradabledenoted by pi is equal to the unit cost, i.e.,
pi = ci(r, ti).
Hereafter, we assume that the unit cost function ci(r, ti) satisfies all thestandard assumptions except perfect complentarity between the fuel and theGHG emissions in the sense that there exists a certain value ei(> 0) suchthat
cit(r, ti) = eicir(r, ti) (1)
7See also Copeland and Taylor (1994).8The wage rage, being always unity, is suppressed in the unit cost function.
5
for ∀(r, ti), where cit(r, ti) def= ∂ci(r, ti)/∂ti and cir(r, ti)def= ∂ci(r, ti)/∂r. We
call this ei the emission coefficient of country i ∈ {1, 2}.One should also note that, by virtue of Shephard’s lemma, cir(r, ti) gives
the input of fossil fuel required per unit of the non-tradable good and cit(r, ri)is the counterpart for the GHG emissions in the dirty non-tradable sector.Note that this assumption of complementarity (1) leads to
citt = eicirt < 0,
where use was made of the strict concavity of the unit cost function withrespect to the fuel price.
Next, let xi represent the output of the non-tradable. Then, we mayexpress the fossil fuel demand denoted by fi and the GHG emissions denotedby zi as follows:
fi = cir(r, ti)xi,
zi = cit(r, ti)xi = eifi.
Demand-side Let us now consider the demand side. The utility of arepresentative consumer is given by
ui(xci ) + yci − θiD(zW ),
where xci denotes the consumption of the non-tradable, yci the consumption
of the tradable, zWdef=Pk zk world total GHG emissions, D(zW ) the world
damage from global warming in terms of the numeraire good, and θi(> 0)what extent country i perceives this damage to be a damage to its ownenvironment. We assume D0(zW ) > 0 and D
00(zW ) > 0.
The consumer maximizes the above utility given world total GHG emis-sions subject to the budget constraint
mi = pixci + y
ci ,
where mi denotes the national income and pi the domestic price of the non-tradable good in country i ∈ {1, 2}. Since there arise no excess profits ineither sector, the national income is the sum of labor income and emissiontax revenue, i.e.,
mi = Li + tizi,
where Li denotes the labor endowment of country i and use was made ofthe wage rate being equal to unity.
Further, assume that the utility function ui(xci) satisfies all the standardassumptions as well as
limx↓0uix(x) = +∞, and lim
x↑+∞uix(x) = 0,
6

which assures production of the non-tradable good to be always strictlypositive in each country.
Then, one may define the indirect utility function as follows:
vi(pi) + Li + tizi − θiD
ÃXk
zk
!,
where vi(pi)def= maxx
©ui(x)− pixi
ª. In the analysis that follows, we also
make use of the relation xi(pi)def= argx
©ui(x)− pixi
ª. Finally, it should be
noted that vi0(pi) = −xi(pi) holds by Shephard’s lemma.
National welfare To sum up, suppressing the labor endowment termin the above equation, we employ the following expression for the welfare ofcountry i.
wi(r, ti)def= vi(pi) + tizi − θiD
ÃXk
zk
!(2)
subject to
vi0(pi) = −xi(pi), (3)
pi = ci(r, ti), (4)
fi = fi(r, ti)
def= cir(r, ti)x
i¡ci(r, ti)
¢, (5)
zi = zi(r, ti)
def= cit(r, ti)x
i¡ci(r, ti)
¢= eif
i(r, ti). (6)
Differentiation of (2) yields:
∂wi/∂ti = (ti − θiD0)zit,
∂wi/∂r = (ti − θiD0)zir − (fi + θiD
0zjr),∂wi/∂tj = −θiD0zjt .
(7)
One should also note the following relations for the succeeding discussion:
f irdef= ∂f i/∂r = cirrxi + (c
ir)2xip < 0, f it
def= ∂f i/∂ti = eif
ir,
zirdef= ∂zi/∂r = eif
ir < 0, zit
def= ∂zi/∂ti = eif
it = eiz
ir < 0,
(8)by virtue of the technological complementarity between fossil fuel and GHG.As the third and fourth equations of (8) show, each country’s GHG emissionsdecrease as the fuel price or the emission tax rate increases, which is thesource of carbon leakage considered in our analysis.
7
2.2 Fuel-Supplying Country
As in the fuel-consuming countries, the wage rate in the fuel-supplying coun-try is equal to unity. For the purpose of focusing on the effects of fossil fueltrade and carbon leakage, we assume that production of fossil fuel is subjectto decreasing returns to scale though the other commodities are subject toconstant returns to scale. By letting Φ(r) represent the maximum profitfunction of the fossil-fuel sector, Hotelling’s lemma implies that Φ0(r) givesthe supply function of the fossil fuel, which we represent by s(r).
2.3 World Trade Equilibrium
To express the equilibrium, it suffices to write down the world fossil-fuelmarket clearing condition, i.e.,
s(r)−Xj
f j(r, ti) = 0. (9)
Given the emission tax policies of the fuel-consuming countries t def=
(t1, t2), the world fuel price is determined via (9), the relation of which weexpress by r(t). When either fuel-consuming country raises the emission taxrate, this dampens its fuel demand, thus leading to a decline in the equilib-rium fuel price. To show this effect on the price, we define the following:
∆rdef= s0(r)−
Xk
fkr (> 0), (10)
ζ`def=
½ −f ir/∆r for ` ∈ {1, 2}s0(r)/∆r for ` = s
. (11)
Here, ζi represent the relative price sensitivity of fuel-demand by countryi ∈ {1, 2} and ζs the relative price sensitivity of fuel-supply by the fuel-supplying country. By definition, the following holds:
ζ` ∈ (0, 1),X`
ζ` = 1 for ` ∈ {1, 2, s}
In terms of these relative price sensitivities, one can express the effect ofan increase in fuel-country i’s emission tax rate on the fuel price as follows:
ri(t)def= ∂r/∂ti = −eiζi < 0, (12)
where use was made of (8). The following lemma is straightforward from(12).
Lemma 1 (i) The world fuel price always declines as one of the fuel-consumingcountries raises its emission tax rate. (ii) The decrease in the world fuelprice caused by an increase in a fuel-consuming country’s emission tax ratebecomes greater as its emission coefficient and relative price sensitivity offuel demand increase.
8
Note that, with fuel-consuming countries facing an upward-sloping fuel-supply function s0(r) > 0, the above lemma critically depends on the marketpower of each fuel-consuming country. If country i is small with no marketpower in the world fuel market, then it cannot affect the world fuel price.
2.4 Emission Taxes and GHG Emissions
Before investigating each country’s strategic incentive for environment regu-lation, let us look into the effects of emission tax increases on GHG emissions.
For this purpose, we first redefine the demand for fuel and GHG emis-sions as a function of the emission tax rates of the two countries, i.e., theemission-tax profile t = (t1, t2).
f i(t)def= f i (r(t), ti) , z
i(t)def= zi (r(t), ti) . (13)
These input demand functions satisfy
f ii = f it + firri = −∆rei(1− ζi)ζi < 0
f ij = f irrj = ∆rejζiζj > 0
zii = eifii = −∆re2i ζi(1− ζi) < 0
zij = eifij = ∆reiejζjζi = z
ji > 0
(14)
where f ikdef= ∂f i(t)/∂tk and zik
def= ∂zi(t)/∂tk for i, k = 1, 2 and use was
made of (8). The above equations show that an increase in the emission taxrate by a fuel-consuming country decreases its own fuel demand as well asits own GHG emissions, while it increases those of the other fuel-consumingcountry (only when there is a decrease in the world fuel price).
An increase in the emission-tax by one country lowers the fuel price,leading to an increase in the fuel-demand of the other country and hencean increase in its GHG emissions. This is the basic mechanism of carbonleakage via trade in fuel considered in this study. This carbon-leakage effectinvolves the possibility of an increase in world total GHG emissions evenwith an increase in the emission tax rate of one of the countries.
To show this possibility of an increase in world total GHG emissions, let
zW (t)def=Xk
zk(t), fW (t)def=Xk
fk(t),
respectively represent world total GHG emissions and fuel demand as afunction of the tax profile. Using (12) and (14), the effect of an increase inti(i = 1, 2) on world total GHG emissions and fuel demand can be repre-sented as:
fWidef= ∂fW (t)/∂ti = s0(r)ri = −s0(r)eiζi < 0, (15)
zWidef= ∂zW (t)/∂ti = ∆reiζi{ejζj − ei(1− ζi)},
9
the latter of which can also be rewritten as:
zWi = ∆reiej(1− ζi)ζi
½ζj
1− ζi− eiej
¾. (16)
Thus, an increase in the emission tax by either of the two countriesunambiguously reduces the world fuel-demand (see (15)), but, as (16) shows,it may increase world total GHG emissions.
Proposition 1 Suppose that country i ∈ {1, 2} raises its emission tax rate.Then, world total GHG emissions decrease if and only if ei/ej > ζj/(1−ζi).
Hereafter, without loss of generality, we assume that the emission coef-ficient is not larger in country 1 than in country 2, i.e., e1 ≤ e2.9 Then,there are two possible cases when discussing the change in world total GHGemissions through an increase in either country’s emission tax rate. Theyare illustrated in Figure 1.
When the emission coefficients of the two fuel-consuming countries donot differ to a great extent and hence the relative emission coefficient e1/e2is in Region N (i.e., ζ2/ (1− ζ1) < e1/e2 ≤ 1), an increase in either country’semission tax rate decreases world total GHG emissions.10 If the emissioncoefficients differ a lot and hence e1/e2 is in Region A (i.e., 0 < e1/e2 <ζ2/ (1− ζ1)), however, an increase in the emission tax rate by country 1increases world total GHG emissions. This is because, provided the emissioncoefficient of country 1 is sufficiently smaller than that of country 2, sucha tax increase lowers the fuel demand and thus GHG emission by country1 with the smaller emission coefficient but the resulting decrease in thefuel price boosts the fuel demand by country 2 with the larger emissioncoefficient, leading to a large increase in GHG emissions.
As already mentioned, the possibility of an increase in world GHG emis-sions as a result of an increase in the emission tax in a country depends onthe country’s market power in the world fuel market. In fact, when the fuelprice is constant, the increase in a country’s emission tax rate only affects itsown GHG emissions, so that in this case world total GHG emissions alwaysdecrease.
We should mention that the following result holds when both fuel-consumingcountry simultaneously raise their emission tax rates.11
Lemma 2 There always holds zW1 + zW2 < 0.
9e1 < e2 could stem from differences in artificial and/or natural carbon sinks.10 If countries 1 and 2 are symmetric and hence e1 = e2 and ζ1 = ζ2 hold, then we have
ζ2/ (1− ζ1) < e1/e2 = 1 because ζ1 = ζ2 < 1/2.11The proof is provided in Appendix A.
10
Therefore, even when an increase in the emission tax by country 1 withthe smaller emission coefficient increases world total GHG emissions, theremust be a decrease in world total GHG emissions if both countries jointlyraise their emission tax rates by the same infinitesimal amount.
3 The Individually Optimal Emission Tax
Our next task is to explore the properties of the equilibria when the twofuel-consuming countries non-cooperatively choose optimal emission taxesand/or quotas. In this section, we look at the case in which each fuel-consuming country sets its emission tax rate knowing the tax rate set bythe other country, which we call the tax-tax policy equilibrium. Since theoptimal tax rate should maximize each country’s national welfare given theother’s tax rate, we refer to it as the individually optimal emission tax ratein the following discussion.
3.1 Determinants of the Optimal Emission Tax
In this subsection, we point out that there are three determinants of theindividually optimal emission tax rate. For this, we obtain the individuallyoptimal emission tax rate. Inserting the equilibrium fuel-price function into(2), we can express each country’s welfare as the following function of thetax profile:
wiT (t)def= wi (ti, r(t)) . (17)
We assume that the above welfare function is strictly concave in the coun-try’s own emission tax rate.
Since the optimal tax rate is chosen non-cooperatively, it should satisfythe following first-order condition for welfare maximization:
0 = ∂wiT
∂ti= ∂wi
∂ti+ ∂wi
∂r ri
= (ti − θiD0)zit +
n(ti − θiD
0)zir − (fi + θiD0zjr)
ori
= (ti − θiD0)zii − firi − θiD
0zjr ri,
(18)
where use was made of (7). Letting tTi represent the solution of the abovefirst-order condition for welfare maximization, i.e., country i’s emission taxrate at the non-cooperative tax-tax policy game equilibrium, we have
tTi = θiD0 + fi
µrizii
¶+ θiD
0Ãzjizii
!, (19)
11

or alternatively,
tTi = fi
µrizii
¶+ θiD
0µzWizii
¶(20)
=fi
∆rei(1− ζi)+
µ1− ejζj
ei(1− ζi)
¶θiD
0, (21)
where use was made of (12) and (14).In (19), each term represents different determinant of emission tax. The
first term represents the well-known basic motive for internalizing negativeexternalities caused by emissions. This term is obviously positive. Thesecond term is related to the TOT for fuel. As a result of an emissiontax, the fuel-consuming country can improve the TOT for fuel and hencewelfare. This effect works to raise the emission tax rate. Finally, the lastterm arises because of carbon leakage. Since an increase in the emissiontax rate lowers the fuel price, the other fuel-consuming country’s demandfor the fossil fuel is boosted, which worsens the global environment qualitythrough an increase in GHG emissions. This carbon-leakage effect worksto reduce the emission tax rate. If this carbon-leakage effect is sufficientlylarge, then the optimal policy would in fact be to impose a negative, ratherthan a positive, emission tax rate. This case occurs only when an increasein the emission tax rate increases world total GHG emissions (i.e., zWi > 0),as is shown in (20). Since zW2 < 0 always holds with e1 ≤ e2, the optimalemission tax could be negative only in country 1.
Therefore, we obtain the following proposition.
Proposition 2 1. Given the emission tax rate of the other country, theTOT effect makes the optimal emission tax rate for a fuel-consumingcountry higher but the carbon-leakage effect makes it lower.
2. Given the emission tax rate of the other country, each fuel-consumingcountry sets a strictly positive rate of emission tax if an increase inits own emission tax rate decreases world total GHG emissions. Anegative emission tax rate is optimal only in country 1. This is thecase only if an increase in country 1’s emission tax rate increases worldtotal GHG emissions.
Note that the carbon-leakage effect vanishes when a fuel-consuming coun-try is a price-taker in the world fuel market, so that its optimal emission taxrate is given by
tTi = θiD0ÃX
k
zk
!. (22)
The emission tax rate should be set equal to the perceived marginal environ-ment damage. This result is the same with the standard result obtained in a
12
closed-economy model where neither the TOT effect nor the carbon-leakageeffect exists.
We should mention that the effect of an increase in the emission co-efficient on the optimal emission tax rate is ambiguous. It increases themarginal environment damage, D0. It is straightforward from (22) that anincrease in D0 induces the country to raise the optimal emission tax ratewithout carbon leakage. However, this is not necessary the case with car-bon leakage (see (20)). That is, an increase in the emission coefficient raisesthe country’s optimal emission tax rate without carbon leakage, but maynot raise country 1’s optimal emission tax rate with carbon leakage.
3.2 Shapes of the Reaction Curves
When we solve (18) for the own emission tax rate, the solution gives countryi’s reaction function, which we denote by RiT (tj). In this subsection, wediscuss its shape.
As has been made clear in the previous literature, when each fuel-consuming country is a price-taker in the world fuel market, the optimalemission tax rate formula (22) implies that the optimal emission tax of onecountry decreases as that of the other country increases. This is because anemission tax increase by the other country decreases the own GHG emis-sions as well as the world total, which decreases the marginal environmentdamage. This leads the first country to lower its emission tax rate. For thisreason, each country’s reaction curve is downward-sloping in the tax-taxpolicy game in the absence of the carbon-leakage effect.
However, as is implied by (19), once the carbon-leakage effect occurs, theshape of the reaction function may change and it is possible that it becomesupward-sloping.
Lemma 3 In the presence of carbon leakage through fuel trade, each coun-try’s emission tax rate is not necessarily a strategic substitute to the other’stax rate in the tax-tax policy game.
3.3 A Tax Increase by the Other Country
We next consider whether a fuel-consuming country gains or loses if theother fuel-consuming country raises its emission tax rate. Specifically, weevaluate this effect when the country initially employs the optimal-responseemission tax rate.
It is proved in Appendix B that even in the presence of carbon leakage,one finds that a tax increase by either fuel-consuming country benefits theother country. That is, ∂wiT/∂tj > 0 holds.
Proposition 3 Given the individually optimal emission tax rate, the wel-fare of either of the fuel-consuming countries improves as the other country
13

increases the emission tax rate.
Thus, as in the standard literature, emission taxation by a fuel-consumingcountry gives rise to pecuniary external economies to the other fuel-consumingcountry. Using this result, it is straightforward to depict each country’s iso-welfare contour at the non-cooperative equilibrium, as shown in Figure 2.In the figure, point T1 is the non-cooperative equilibrium. Country i’s iso-welfare contour is given by wTi . Thus, the two fuel-consuming countries arebetter off by raising their tax rates above those at the non-cooperative equi-librium. Note that this result holds regardless of whether the emission taxrates are strategic substitutes or complements.
4 The Individually Optimal Emission Quota
In this section, we examine the case in which both fuel-consuming countriesemploy emission quotas. By emission quota, we mean a country-wide capof total GHG emissions. We assume that the government issues a certainnumber of GHG emission permits and establishes a perfectly competitivemarket for the domestic trade in such permits.
4.1 The Optimal Emission Quota
Consider a policy game in which both fuel-consuming countries employ emis-sion quotas. We call this the quota-quota policy game. Let qi denote country
i’s quota and q def= (q1, q2) the quota profile. In view of (2)-(6), each fuel-
consuming country’s welfare is now described by
ewiQ(ti, r) def= vi(pi) + tiqi − θiD
ÃXk
qk
!(23)
subject to
vi0(pi) = −xi(pi) (3)
pi = ci(r, ti) (4)
fi = fi(r, ti) (5)
qi = zi(r, ti) = eif
i(r, ti) (24)
s(r) =Xk
qiei
(25)
where ti now represents the price of the tradable emission permit in countryi. The last equation (25) determines the equilibrium fuel price as a functionof the quota profile, which we express by brQ(q). Simple calculation yields
∂brQ(q)∂qi
=1
eis0(r)> 0,
14
which implies:
Lemma 4 The world fuel price always declines as one of the fuel-consumingcountries decreases the level of its emission quota.
We insert this into (24), and solve for ti. We then obtain the price of thetradable permit as a function of the quota profile, which we express by bti(q).From brQ(q) and bti(q), the country’s welfare is represented as a function ofthe quota profile: bwiQ(q) def= ewiQ(ti(q), rQ(q)).In the quota-quota policy game, each country sets the quota so as to max-imize its welfare given by (23), so that the following first-order conditionholds:
0 = ∂ bwiQ∂qi
=¡−xicit + qi¢ ∂bti(q)
∂qi+ (−xicir)∂brQ(q)∂qi
+ (ti − θiD0)
= − fieis0(r) + (ti − θiD
0) ,(26)
where use was made of (24) and fi = cirxi.Solving the above equation for the permit price, we obtain
tQi = θiD0 +
fieis0(r)
, (27)
which, compared with (19), shows that there are no carbon-leakage effects.This means that each fuel-consuming country has an incentive to strengthenits environmental regulation by setting a higher price for emission permits.
The following proposition is established.
Proposition 4 If both fuel-consuming countries employ emission quotas,then there are no carbon-leakage effects, and hence each country has anincentive to strengthen its environmental regulation compared with the caseof emission taxes.
4.2 Reaction Curves in the Quota-Quota Policy Game
In this subsection, we explore reaction curves in the quota-quota policygame. In general, the shape of the associated reaction curve is ambiguous. Inthe absence of fuel trade, (27) is rewritten as tQi = θiD
0. Since the domesticpermit price is independent of the other country’s quota, it is straightforwardto see that each country’s emission quota is a strategic substitute to theother’s. In the presence of fuel trade, however, this is not necessarily thecase.
Let us now examine the relationship between the original reaction func-tions in terms of emission quota levels and the corresponding reaction curve
15

in terms of the price of the tradable emission permit. The transformed re-action curves below allow us to make comparisons among the equilibria indifferent games.
Let Γi(qj)def= argmaxqi bwiQ(q). Since qk = zk(t) holds for k ∈ {1, 2}, the
reaction function in terms of the permit price, ti = RiQ(tj), should satisfy
zi(t) = Γi¡zj(t)
¢.
Thus, the transformed reaction function, RiQ(tj), should satisfy:
dRiQ(tj)
dtj=
dΓi(qj)dqj
zjj − zijzii − dΓi(qj)
dqjzji
.
Sinceziizji= −ej(1− ζi)
eiζj(28)
holds by virtue of (14), we can rewrite the slope of the transformed reactionfunction as follows:
dRiQ(tj)
dtj= − z
jj
zji
dΓi(qj)dqj
+ej(1−ζj)eiζi
dΓi(qj)dqj
+ejζj
ei(1−ζi).
Since ejζj/ei(1− ζi) < ej(1− ζj)/eiζi always holds, it is straightforward toobtain the following lemma from the above equation:
Lemma 5
dRiQ(tj)
dtj< 0 ⇐⇒
⎧⎨⎩ (i)dΓi(qj)dqj
< 0
(ii)ejζj
ei(1−ζi) <¯dΓi(qj)dqj
¯<
ej(1−ζj)eiζi
As the above lemma shows, under the quota-quota policy game, the re-action curve in terms of the price of the tradable emission permit becomesupward-sloping even when the corresponding reaction curve in terms of emis-sion quota levels is downward-sloping. When the original reaction curve inthe quota-quota policy game over the quota-quota space is upward-sloping,the corresponding transformed reaction curve should always be upward-sloping.
4.3 A Quota Decrease by the Other Country
What if the other country reduces its emission quota level in the quota-quotapolicy game? The following shows that if a country optimizes its emissionquota in response to the quota set by the other country, such a decrease in
16
the other country’s quote unambiguously improves the welfare of the firstcountry:
d bwiQ ¡Γi(qj), qj¢dqj
=∂ bwiQ ¡Γi(qj), qj¢
∂qj(by virtue of the envelope theorem)
= −θiD0 − fibrQj < 0. (29)
Thus, in the quota-quota policy game, each country’s choice of the emis-sion quota level generates external diseconomies for the other country. Thismeans that the incentive for each country to reduce GHG emissions throughquotas is not enough from the viewpoint of the joint welfare of both fuel-consuming countries.
Thus, we have established:
Proposition 5 If both fuel-consuming countries further reduce their GHGemissions through quotas, then both can be better off than at the non-cooperativequota-quota policy game equilibrium.
5 The Equivalence between Taxes and Quotas
Depending on the instrument choices, different policy game equilibria emerge.When both countries choose emission taxes (emission quotas), the second-stage subgame is the tax-tax policy game (the quota-quota policy game).When one country chooses emission taxes and the other emission quotas,the resulting second-stage game is the tax-quota policy game. We comparethe equilibria with the aid of reaction curves depicted over the t1-t2 space.Both unilateral equivalence and strategic non-equivalence below are usefulwhen investigating reaction curves.
5.1 Unilateral Equivalence
From the viewpoint of an individual country, taxes and quotas, given thepolicy instrument of the other country, can be shown to be equivalent inthe sense that they achieve the same world resource allocation. We call thisresult unilateral equivalence between emission taxes and quotas.
First, suppose that country j employs emission taxes. Then in view of(13), given country i’s emission quota qi, the equilibrium permit price tishould satisfy
qi = zi(ti, tj).
Thus, given country j’s emission tax rate, there is a one-to-one relationshipbetween the emission quota qi and the emission tax rate or permit price ti.This establishes that emission taxes and quotas are equivalent for country igiven country j’s emission tax rate.
17

Next consider the case in which country j sets the emission quota qj .Then, given qj , when country i chooses the emission quota qi, the resultingpermit prices, ti and tj , should satisfy
qi = zi(ti, tj), qj = z
j(tj , ti).
Since∆z
def= z11 z
22 − z12 z21 > 0 (30)
holds,12 the implicit function theorem can be applied to ensure a one-to-onerelationship between the permit-price profile t and the emission-quota profile
qdef= (q1, q2). This implies that emission taxes and quotas are equivalent for
country i given country j’s emission quota.13
The above discussion leads to the following unilateral equivalence result.
Proposition 6 Given the environmental policy instrument of the other fuel-consuming country, emission taxes and quotas are equivalent for each indi-vidual country.
This proposition implies the following lemma.
Lemma 6 Given the other country’s environmental policy instrument, acountry’s reaction curves are the same regardless of its choice between taxesand quotas once they are transformed and depicted over the t1-t2 space.
In Figure 3, RiT is country i’s reaction curve given that country j em-ploys emission tax. ti is the tax rate (the permit price) in country i whencountry i employs emission tax (quota). Similarly, RiQ is country i’s reactioncurve given that country j employs emission quota.14
5.2 Strategic Non-equivalence
Even when emission taxes and quotas are equivalent given the other coun-try’s environmental policy instrument, they are no longer equivalent oncethe other country changes its policy instrument. In fact, once the othercountry switches from emission taxes to quotas, each country has an incen-tive to strengthen its own environmental regulation. Let us demonstratethis result, which we call the strategic non-equivalence result.
12This result is obtained as follows:
∆z = (z1t + z
1r r1)(z
2t + z
2r r2)− z1rz2r r1r2 = z1t z2t + z1t z2r r2 + z1rz2t r1
= e1e2(f1t f
2t + f
1t f
2r r2 + f
1r f
2t r1) = e
21e22f
1r f
2r ζs > 0.
13A more rigorous proof is provided in Appendix C.14As shown in Lemma 7, RiQ is located to the right of RiT .
18
We assume that the two countries initially employ emission taxes. InFigure 2, the equilibrium is given by point T1 where the reaction curves(which are not shown in the figure to avoid it getting too complex) intersectwith each other. Now suppose that country 2 switches from emission taxes toquotas. Given the associated tax profile, draw a curve showing the tax pairskeeping country 2’s GHG emissions constant. This iso-GHG-emissions curveis given by zT2 . In view of (14), such a curve should be upward-sloping. Then,since country 1’s iso-welfare contours are U-shaped as shown in Figure 2 andits welfare improves in the higher country 2’s emission tax rate, country 1becomes better off by choosing point Q1 along the iso-GHG-emissions curvezT2 .
The result is that country 1’s emission tax rate becomes higher as well ascountry 2’s. The reason is as follows. Since country 2’s GHG emissions areheld constant, its fuel demand is also kept constant under the emission quota.This implies that country 1’s tax increase results in no carbon leakages,leading to an increase in the emission tax rate.
How do the GHG emissions by country 1 change after such a changein the emission tax policy? The figure also shows the iso-GHG-emissionscurves for country 1, zT1 and z
Q1 . They are also upward-sloping and their
slopes are greater than country 2’s by virtue of the following relation:
dt2dt1
¯z1=const
− dt2dt1
¯z2=const
=z21z22− z
11
z12=
1
z22 z12
¡z12 z
21 − z11 z22
¢> 0,
where use was made of (30).Since z11 < 0, GHG emissions on the iso-GHG-emissions curve zQ1 are
smaller than those on the curve zT1 . This is consistent with the result forthe case above when country 1 employs more stringent environmental regu-lations.
Thus, we obtain:
Proposition 7 If a country switches from an emission tax to an individ-ually equivalent emission quota, then the other country has an incentive toraise its emission tax rate or to reduce its emission quota level.
As the above proposition implies, one country’s reaction curve (which isnot shown in Figure 2 but in Figure 3) shifts rightward on the t1-t2 planewhen the other country switches from an emission tax to a quota.15 Thatis,
Lemma 7 Country i’s reaction curve given that country j employs emissionquota is located to the right of country i’s reaction curve given that countryj employs emission tax.15The resulting new reaction curve does not necessarily have the same shape as the
original curve.
19
6 Strategic Interdependence and Subgame NashEquilibria
In this section, we find subgame perfect Nash equilibria in the followingtwo-stage policy game. In the first stage, both fuel-consuming countriesindependently choose their emission regulation instrument, either emissiontaxes or emission quotas, and then, in the second stage, after observing whichemission regulation instrument the other country has chosen, determine thespecific level of the policy instrument chosen in the first stage.
6.1 Specific Level of Policy Instruments in the Different Pol-icy Games
The result of the strategic non-equivalence of emission taxes and quotasimplies that the quality of the global environment will differ depending oneach country’s choice of policy instrument. These differences are shown inFigure 3. Figure 3 (a) shows the case in which the reaction curves of bothfuel-consuming countries are downward-sloping, while Figure 3 (b) showsthe case in which they are upward-sloping.
In the figures, each intersection of the reaction curves of the two coun-tries represent a non-cooperative environmental policy equilibrium for eachpossible combination of instrument choices. Thus, for example, point ETQshows the equilibrium when country 1 chooses emission taxes and country2 emission quotas.
6.2 Welfare Comparison
As already discussed in Section 4.1, in the quota-quota policy game, bothcountries tend to strengthen their environmental regulation compared withthe tax-tax policy game. Moreover, in view of Proposition 3, one may betempted to conclude that both countries would be better off at the quota-quota policy game equilibrium EQQ than at the tax-tax policy game equi-librium ETT . In general, however, this is not correct. The reason is thatEQQ does not always lie within the set of the tax profiles dominating ETTfor both countries.
For a more specific welfare comparison among the possible equilibria, letus compare EQQ with the equilibrium in which country i chooses emissiontaxes but country j chooses emission quotas. Movement from the latter tothe former requires changes in the tax profile along country i’s transformedreaction curve RiQ(tj) (see Figures 3 (a) and (b)). This is because whencountry i switches to emission quotas, country j has an incentive to alterits emission quota so as to raise the price of domestic emission permits, or,effectively, the emission tax rate.
20

The associated effect on country i’s welfare is given by:
d bwiQ ¡zi ¡RiQ(tj), tj¢ , zj ¡RiQ(tj), tj¢¢dtj
=∂ bwiQ ¡Γi ¡zj ¡RiQ(tj), tj¢¢ , zj ¡RiQ(tj), tj¢¢
∂qi
dzi¡RiQ(tj), tj
¢dtj
+∂ bwiQ ¡Γi ¡zj ¡RiQ(tj), tj¢¢ , zj ¡RiQ(tj), tj¢¢
∂qj
dzj¡RiQ(tj), tj
¢dtj
= −³fibrQj + θiD
0´ dzj ¡RiQ(tj), tj¢
dtj(31)
= −³fibrQj + θiD
0´zji
½dRiQ(tj)
dtj− ej(1− ζj)
eiζi
¾, (32)
where use was made of the envelope theorem, (14), (28) and (29). Thus,country i is better off by switching to emission quotas given country j’schoice of emission quotas if and only if country j’s GHG emissions decreasewith an increase in its emission tax rate along country i’s transformedreaction curve (see (31)), or alternatively if and only if dRiQ(tj)/dtj <ej(1− ζj)/eiζi (see (32)). Similarly, we obtain
d bwjQ ¡zi ¡RiQ(tj), tj¢ , zj ¡RiQ(tj), tj¢¢dtj
= −³fjbrQi + θjD
0´ dzi ¡RiQ(tj), tj¢
dtj
= −³fjbrQi + θjD
0´zii
½dRiQ(tj)
dtj− ejζjei(1− ζi)
¾.
Let ETiQj denote the equilibrium in which country i chooses emissiontaxes and country j emission quotas, and EQQ Âi ETiQj means that countryi’s welfare is strictly higher at EQQ than at ETiQj . Then the above discussioncan be summed up in the following proposition.
Proposition 8 1. EQQ Âi ETiQj if and only if country j’s GHG emis-sions decrease with an increase in its emission tax rate along countryi’s transformed reaction curve (i.e., dRiQ(tj)/dtj < ej(1− ζj)/eiζi).
2. EQQ Âj ETiQj if and only if country i’s GHG emissions decrease withan increase in country j’s emission tax rate along country i’s trans-formed reaction curve (i.e., dRiQ(tj)/dtj > ejζj/ei(1− ζi)).
These results, based on Proposition 3 (i.e., EQiTj Âi ETT ), are summa-rized in Figure 4. Noting ei(1 − ζi)/ejζj > eiζi/ej(1 − ζj), we have fourregions in the figure. We can easily confirm in the figure that the quota-quota policy game equilibrium EQQ may not be the best for both countries.
21

6.3 Policy Instrument Choices
We are now ready to determine which combination of the environment reg-ulation instruments emerges as a subgame perfect Nash equilibrium for ourfull game. Noting Figure 4, we can draw Figure 5 that illustrates possibleequilibria when both countries simultaneously choose a policy instrument.In Region QQ, a quota policy is the dominant strategy for both countries,so that EQQ arises.16 In Region QT (TQ), the choice of a quota policy dom-inates that of a tax policy for country 1 (country 2) but country 2 (country1) prefers emission taxes when country 1 (country 2) chooses quotas, so thatEQT (ETQ) arises. Lastly, in Region U, each country is better off by choos-ing a policy instrument different from the other’s choice, so that there are atleast three equilibria; two are pure-strategy equilibria, ETQ and EQT , andthe last is a mixed-strategy equilibrium.17
Thus, we obtain:
Proposition 9 Both countries choose emission quotas if both dR1Q(t2)/dt2 <e2(1 − ζ2)/e1ζ1 and dR
2Q(t1)/dt1 < e1(1 − ζ1)/e2ζ2 hold (i.e., in RegionQQ in Figure 5). Countries 1 and 2, respectively, choose an emissiontax and an emission quota if both dR1Q(t2)/dt2 > e2(1 − ζ2)/e1ζ1 anddR2Q(t1)/dt1 < e1(1 − ζ1)/e2ζ2 hold (i.e., in Region TQ), and vice versaif both dR1Q(t2)/dt2 < e2(1− ζ2)/e1ζ1 and dR
2Q(t1)/dt1 > e1(1− ζ1)/e2ζ2hold (i.e., in Region QT).
This proposition suggests a reason why employed policy instrumentsare different across countries. If both (transformed) reaction curves aredownward-sloping, then both countries necessarily choose an emission quota.If both (transformed) reaction curves are upward-sloping, on the other hand,other combinations are also possible. The presence of carbon leakage andits size critically affect the optimal environmental policy of each country.
7 The Welfare Implications of Creating an Inter-national Market for Emission Permits
In this section, on the basis of the analysis above, we investigate the welfareeffects of creating an international market for emission permits. To excludeany possible problems in choosing the world total volume of tradable per-mits, we assume that its volume is set equal to the GHG emissions chosen ata non-cooperative environmental regulation equilibrium before the market
16When e1ζ1/e2(1−ζ2) < dR2Q/dt1 < e1(1−ζ1)/e2ζ2 and dR
1Q/dt2 < e2(1−ζ2)/e1ζ1,EQT Â1 EQQ holds. Since country 2 chooses quotas in that region, however, EQT is notrealized. Similarly, ETQ is not realized when e2ζ2/e1(1−ζ1) < dR
1Q/dt2 < e2(1−ζ2)/e1ζ1and dR2Q/dt1 < e1(1− ζ1)/e1ζ1.17A mixed-strategy equilibrium is easily obtained. See Appendix D.
22

creation. More specifically, we assume that the amount of tradable emis-sion permits each country is endowed with is the same as the country wouldchoose before the creation of an international permit market.
Let qei denote the size of country i’s GHG emissions and tei its associated
emission tax rate or permit price at the equilibrium without internationaltrade in emission permits. Since each country is endowed with qei units
of emission permit, world total GHG emissions are kept constant at qcdef=P
k qek. Free permit trade leads to equalization of the permit price between
the two countries.Noting Proposition 1, we examine two possible cases. The first is Case
N of zW1 < 0 and zW2 < 0 (i.e., when e1/e2 lies in Region N in Figure 1).The iso-GHG-emissions curve for this case is shown in Figure 6 (a). Alongthe curve, when t1 falls, t2 must rise. Otherwise, world total GHG emissionswould increase. Thus, the iso-GHG-emissions curve is downward-sloping.18
The second is Case A of zW1 > 0 and zW2 < 0 (i.e., when e1/e2 lies in RegionA in Figure 1). The iso-GHG-emissions curve is upward-sloping, as shownin Figure 6 (b). Note that in the second case, the iso-GHG-emissions curvehas a slope of less than unity by virtue of Lemma 2.
The critical difference between the two cases is as follows. In the firstcase, the equilibrium permit price under international trade in emission per-mits, denoted by tM , lies between the initial permit prices of both countries.In the second case, however, tM is either greater or less than the initialdomestic prices. If the starting tax-profile is located above (below) theequal-permit-price line (i.e., the 45◦ line) as shown in Figure 6 (b), tM isgreater (less) than the initial domestic prices.
We now examine the welfare effects of allowing international trade inemission permits. For this purpose, we consider the relationship betweenthe domestic permit prices in the two countries when world total GHGemissions equal qc. This can be obtained by solving the following equation:
qc −Xk
zi(t1, t2) = 0. (33)
Country 2’s permit price is then determined as a function of country 1’spermit price, which we express by t2m(t1). This satisfies:
t02m(t1) = −zW1zW2, (34)
where one should note that the assumption of e1 ≤ e2 assures zW2 < 0 butzW1 < 0may not hold (recall Figure 1). By construction, the function t2m(t1)satisfies:
t2m(te1) = t
e2, t2m(tM ) = tM .
18See (34) below.
23

The associated equilibrium fuel price, denoted by r = rm(t1), satisfies:
s(r)− f1(r, t1)− f2 (r, t2m(t1)) = 0.
It is straightforward to verify that
r0m(t1) =e1e2ζ1ζ2∆rbzW2 (e2 − e1) ≤ 0, (35)
where use was made of e1 ≤ e2. Thus, the following Lemma is obtained.
Lemma 8 An increase in t1 as a result of country 1’s exports of emissionpermits decreases the equilibrium fuel price if e1 < e2 holds.
The intuition is as follows. If country 1 exports emission permits tocountry 2, then emissions decrease in country 1 but increase in country2. Since world total GHG emissions are kept constant, the world demandfor fuel decreases with e1 < e2 and hence the fuel price falls. The lemmaimplies that if country 1, in which the emission coefficient is smaller, exportsemission permits to country 2, then the TOT for fuel improve for both fuel-consuming countries.
The welfare of country i is given by:
wiM(t1)def= vi(pi) + tiq
ei − θiD
ÃXk
qk
!, (36)
where
pi = ci (rm(ti), ti) with ti =
½t1 for i = 1
t2m(t1) for i = 2.
Thus, noting that world total GHG emissions are constant, we have thefollowing expressions for the change in each country’s welfare resulting froman increase in country 1’s permit price:
dw1M
dt1= (qe1 − z1)− f1r0m(t1), (37)
dw2M
dt1= (qe2 − z2)t02m(t1)− f2r0m(t1). (38)
The first term corresponds to the standard gains from trade in emissionpermits. There are gains from trade for the permit-exporting (the permit-importing) country if the permit price rises (falls) as a result of permittrade. The second term stems from the change in the TOT for fuel. Ifcountry 1 exports emission permits to country 2, then the world demand forfuel decreases with e1 < e2 and hence the TOT for fuel improve for bothfuel-consuming countries (see Lemma 8).
24
Since we havedz1 (t1, t2m(t1))
dt1= −∆z
zW2< 0,
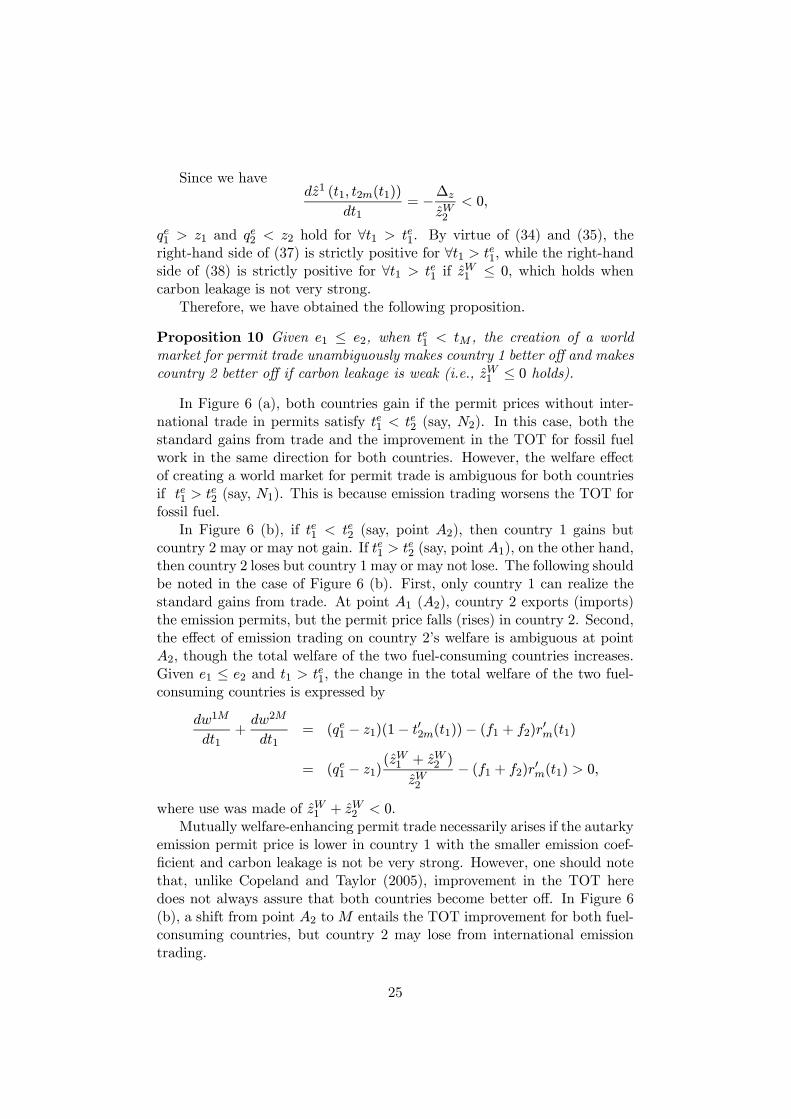
qe1 > z1 and qe2 < z2 hold for ∀t1 > te1. By virtue of (34) and (35), theright-hand side of (37) is strictly positive for ∀t1 > te1, while the right-handside of (38) is strictly positive for ∀t1 > te1 if z
W1 ≤ 0, which holds when
carbon leakage is not very strong.Therefore, we have obtained the following proposition.
Proposition 10 Given e1 ≤ e2, when te1 < tM , the creation of a worldmarket for permit trade unambiguously makes country 1 better off and makescountry 2 better off if carbon leakage is weak (i.e., zW1 ≤ 0 holds).
In Figure 6 (a), both countries gain if the permit prices without inter-national trade in permits satisfy te1 < te2 (say, N2). In this case, both thestandard gains from trade and the improvement in the TOT for fossil fuelwork in the same direction for both countries. However, the welfare effectof creating a world market for permit trade is ambiguous for both countriesif te1 > t
e2 (say, N1). This is because emission trading worsens the TOT for
fossil fuel.In Figure 6 (b), if te1 < te2 (say, point A2), then country 1 gains but
country 2 may or may not gain. If te1 > te2 (say, point A1), on the other hand,
then country 2 loses but country 1 may or may not lose. The following shouldbe noted in the case of Figure 6 (b). First, only country 1 can realize thestandard gains from trade. At point A1 (A2), country 2 exports (imports)the emission permits, but the permit price falls (rises) in country 2. Second,the effect of emission trading on country 2’s welfare is ambiguous at pointA2, though the total welfare of the two fuel-consuming countries increases.Given e1 ≤ e2 and t1 > te1, the change in the total welfare of the two fuel-consuming countries is expressed by
dw1M
dt1+dw2M
dt1= (qe1 − z1)(1− t02m(t1))− (f1 + f2)r0m(t1)
= (qe1 − z1)(zW1 + zW2 )
zW2− (f1 + f2)r0m(t1) > 0,
where use was made of zW1 + zW2 < 0.Mutually welfare-enhancing permit trade necessarily arises if the autarky
emission permit price is lower in country 1 with the smaller emission coef-ficient and carbon leakage is not be very strong. However, one should notethat, unlike Copeland and Taylor (2005), improvement in the TOT heredoes not always assure that both countries become better off. In Figure 6(b), a shift from point A2 toM entails the TOT improvement for both fuel-consuming countries, but country 2 may lose from international emissiontrading.
25
8 Conclusion
In this paper, we explored environmental policy choices in the presence ofinternational carbon leakage caused by fuel price changes, explicitly takinginto account international trade in fossil fuel. We considered a world con-sisting of two fuel-consuming countries emitting GHG and a fuel-producingcountry. The fuel-consuming countries non-cooperatively regulate GHGemissions through emission taxes or quotas. The two policy instrumentsare equivalent for each country if the other country’s choice of policy instru-ment is given. However, the presence of the carbon-leakage effect affects eachcountry’s policy stance on global warming once the other country switchesits policy instrument. That is, non-equivalence between emission taxes andquotas could arise. Such strategic non-equivalence affects the subgame per-fect equilibrium when the countries commit to either emission taxes or quo-tas before determining their specific level. Regarding policy choices, threepure-strategy equilibria exit in our analysis: (i) both countries employ anemission quota and (ii) one country employs an emission quota, while theother country employs an emission tax. This result sheds a new light onthe question of why adopted policy instruments could be different amongcountries.
The results of, and tools for, the analysis were then applied to discuss thewelfare effects of creating an international market for the trade in emissionpermits. We found that the creation of such a market improves the welfareof each participant when (i) there is an increase in the emission permitprice for the country with the smaller emission coefficient (i.e., the moreefficient environmental technology) and (ii) the difference in the level ofenvironmental technology is not large between the two participants.
As was shown, the presence of carbon leakage and its size critically affectthe optimal environmental policy of each country. As an illustration of theimplications of the results obtained here, we may regard country 1 as North(advanced countries with better environmental technologies) and country 2as South. Doing so, the following two policy implications can be derived.
First, when only North tightens environmental regulations, there is adanger that world total GHG emissions may increase, rather than decrease,thus aggravating global warming. In this sense, what would be required isto call on South to cooperate with North in dealing with global warming.Second, when initially North is tougher against global warming, the creationof an international market to trade emission permits may not benefit bothNorth and South. This is likely to be the case when carbon leakage is strong.A necessary condition for both North and South to gain from internationalemission trading is that their emission coefficients are not different too much.Thus, technology transfers from North to South may play an important rolewhen creating an international market to trade emission permits.
The purpose of this paper was to present a simple, stylized model in
26

order to focus on the international carbon leakage caused by changes in thefuel price. To do so, we assumed that the production of the non-tradablegood alone is responsible for GHG emissions and that the fuel-producingcountry does not emit GHG. Although we conjecture that our insights arestill valid in more generalized models, it would be worthwhile to examinethe implications of our approach in those models.
Appendix
A. Proof of zW1 + zW2 < 0
This appendix proves Lemma 2. Equation (14) shows
zWi = ∆reiζi©ejζj − ei(1− ζi)
ª,
which yields
1
∆r
¡zW1 + zW2
¢= 2e1e2ζ1ζ2 − e21ζ1(1− ζ1)− e22ζ2(1− ζ2).
Consider the right-hand side as a quadratic equation in e1. Then, the asso-ciated determinant is equal to
ζ21ζ22e22 − ζ1ζ2(1− ζ1)(1− ζ2)e
22 = e
22ζ1ζ2(ζ1 + ζ2 − 1) < 0,
which implies that the given equation never becomes non-negative givene1e2 6= 0. This establishes
zW1 + zW2 < 0.
B. Proof of ∂wiT/∂tj > 0
In this appendix, we prove Proposition 3. By construction of the welfarefunction, one can derive
∂wiT
∂tj=
∂wi
∂tj+
∂wi
∂rrj =
∂wi
∂tj− rjri
∂wi
∂ti
= −θiD0zjt −f jtf it(ti − θiD
0)zit = −f jt©θiD
0ej + (ti − θiD0)eiª
= −f jt(θiD
0ej + ei
(fi
µrizii
¶+ θiD
0Ãzjizii
!)),
or alternatively,
− zii
f jt
∂wiT
∂tj= eifiri + ejθiD
0zii + eiθiD0zji
= eifi(−eiζi) + ejθiD0 × e2i (1− ζi)fir + eiθiD
0 ¡−eiejζif jr ¢= −e2i fiζi + e2i ejθiD0(1− ζi)f
ir − e2i ejθjD0ζif jr .
27

Thus,
− 1e2i
ziif jt
∂wiT
∂tj= −fiζi +∆rejθiD0
¡ζiζj − ζi(1− ζi)
¢(B-1)
= −fiζi −∆rejθiD0ζiζs < 0, (B-2)
which establishes∂wiT
∂tj> 0.
C. Proof of Unilateral Equivalence
To prove the unilateral equivalence between emission taxes and quotas, wemust show that there is a one-to-one relationship for each fuel-consumingcountry between the emission tax rate and the emission quota given theother. Let us prove this first for the case in which the other country choosesemission taxes.
Given country j’s emission tax rate tj , let qi denote the emission quotaor GHG emissions by country i. The equilibrium condition requires:
qi = eifi(r, ti), s(r) =
qiei+ zj(r, ti).
Solving the second equation for the fuel price and denoting the solution byrT (qi, tj), the latter satisfies:
∂rT (qi, tj)
∂qi=
1
ei(s0(r)− ejf jr )> 0.
Insert this relation into the first equation and solve the latter for the equi-librium emission tax rate or emission permit price ti. Let tiT (qi, tj) expressthe solution. It satisfies:
∂tiT (qi, tj)
∂qi=
eifit
1− eif irrTq< 0,
by virtue of (8). This establishes the result.Next, consider the case in which the other country chooses emission quo-
tas. Let qj denote country j’s emission quota. Then again the equilibriumrequires:
qk = ekfk(r, tk), s(r) =
Xk
qkek
The equilibrium fuel price depends on the quota profile q. We express thisrelation by rQ(q). It satisfies:
∂brQ(q)∂qi
=1
eis0(r)> 0.
28

Insert this into the first equation. Then the emission tax rate is determinedby the quota profile, the relation of which we express by bti(q). It satisfies
∂bti(q)∂qi
=1− eif ir ∂brQ(q)∂qi
eif it< 0,
which establishes the result.
D. Mixed-strategy Equilibrium
A mixed-strategy equilibrium in Section 6 is easily obtained. Let ρTj denotethe probability that country j chooses emission taxes. Then country i isindifferent between taxes and quotas if and only if
ρTj wiQiTj + (1− ρTj )w
iQQ = ρTj w
iTT + (1− ρTj )w
iTiQj ,
where wiTiQj for example represents country i’s equilibrium welfare whencountry i chooses emission taxes and country j emission quotas. The aboveequation shows that the equilibrium probability ρTj satisfies
ρTj =wiTiQj − wiQQ
(wiQiTj − wiTT ) + (wiTiQj − wiQQ).
References
[1] Bohm, P. (1993) “Incomplete International Cooperation to Reduce CO2Emissions: Alternative Policies,” Journal of Environmental Economicsand Management 24, 258—271.
[2] Böringer, C., A. Lange and T. F. Rutherford (2010) “Optimal EmissionPricing in the Presence of International Spillovers: Decomposing Leak-age and Terms-of-Trade Motives,” NBER Working Paper Series 15899,National Bureau of Economic Research.
[3] Burniaux, J. and J. O. Martins (2000) “Carbon Emission Leakages: AGeneral Equilibrium View,” OECD Economics Department WorkingPapers, No. 242, OECD Publishing.
[4] Copeland, B. R. and M. S. Taylor (1994) “North-South Trade and En-vironment,” Quarterly Journal of Economics 109: 755-787.
[5] Copeland, B. R. and M. S. Taylor (2005) “Free Trade and Global Warm-ing: A Trade Theory View of the Kyoto Protocol,” Journal of Environ-mental Economics and Management 49, 205—234.
29

[6] Felder, S. and T. F. Rutherford, (1993). “Unilateral CO Reductionsand Carbon Leakage: The Consequences of International Trade in Oiland Basic Materials,” Journal of Environmental Economics and Man-agement, 25, 162-176.
[7] Hoel, M. (2005) “The Triple Inefficiency of Uncoordinated Environmen-tal Policies,” Scandinavian Journal of Economics 107, 157—173.
[8] Ishikawa, J. and K. Kiyono (2000) “International Trade and GlobalWarming,” CIRJE Discussion Paper Series CIRJE-F-78, Faculty ofEconomics, University of Tokyo.
[9] Ishikawa, J. and K. Kiyono (2006) “Greenhouse-gas Emission Controlsin an Open Economy”, International Economic Review 47, 431-450.
[10] Ishikawa, J., K. Kiyono, and M. Yomogida (2011) “Is Emis-sion Trading Beneficial?,” CCES Discussion Paper Series No. 41,Center for Research on Contemporary Economic Systems, Gradu-ate School of Economics, Hitotsubashi University <http://hermes-ir.lib.hit-u.ac.jp/rs/handle/10086/18961>, forthcoming in JapaneseEconomic Review.
[11] Ishikawa, J. and T. Okubo (2008) “Greenhouse-gas Emission Con-trols and International Carbon Leakage Through Trade Liberaliza-tion,” CCES Discussion Paper Series No.3, Hitotsubashi University<http://hdl.handle.net/10086/16318 >.
[12] Kiyono, K. (1985) “Trade-policy Games — An Inquiry Into Tariff-quotaEquivalence (Boueki-seisaku geimu — Kanzei to suryo wariate no douchimeidai ni kansuru ichi kousatsu—),” Studies on Trade and IndustrialPolicies (Tsusho-Seisaku Kenkyu), 10, 1-16 (in Japanese).
[13] Kiyono, K. and J. Ishikawa (2004) “Strategic Emission Tax-quota Non-equivalence Under International Carbon Leakage,” in H. Ursprung andS. Katayama (eds.) International Economic Policies in a GlobalizedWorld, Springer Verlag, 133—150.
[14] Lahiri, S. and Y. Ono (2007) “Relative Emission Standard versus Taxunder Oligopoly: The Role of Free Entry,” Journal of Economics 91,107-128.
[15] Markusen, J. R., E. R. Morey and N. D. Olewiler (1993) “Environ-mental Policy When Market Structure and Plant Locations are En-dogenous,” Journal of Environmental Economics and Management 24,69—86.
30
[16] Markusen, J. R., J, E. Morey and N. Olewiler (1995) “Competitionin Regional Environmental Policies When Plant Locations are Endoge-nous,” Journal of Public Economics 56, 55—77.
[17] Mead, J. E. (1952) “External Economies and Diseconomies in a Com-petitive Situation, ” Economic Journal 62, 54-67.
[18] Ulph, A. (1996) “Environmental Policy Instruments and ImperfectlyCompetitive International Trade,” Environmental and Resource Eco-nomics 7, 333-355.
[19] Ulph, A. and L. Valentini (2001) “Is Environmental Dumping GreaterWhen Plants Are Footloose?” Scandinavian Journal of Economics 103,673—688.
[20] Xepapadeas, A. (1997) Advanced Principles in Environmental Policy,Edward Elgar Publishing Inc.
31
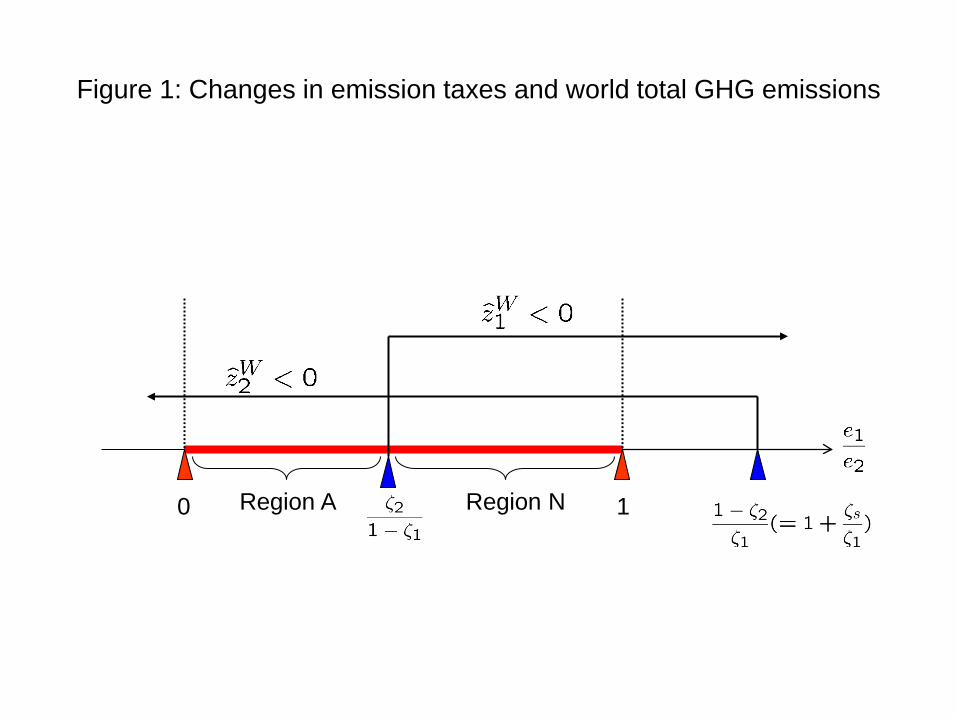
Figure 1: Changes in emission taxes and world total GHG emissions
0 1 Region A Region N
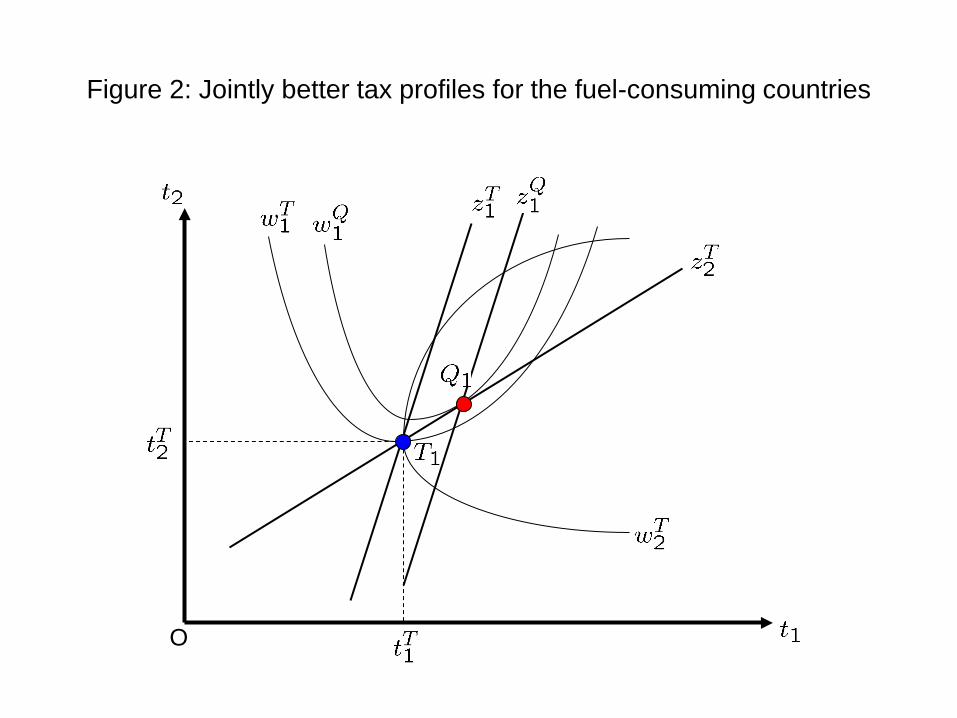
Figure 2: Jointly better tax profiles for the fuel-consuming countries
O

Figure 3 (a): Reaction curves: The case of strategic substitutes
O

Figure 3 (b): Reaction curves: The case of strategic complements
O

Figure 4: Welfare ranking of possible equilibria for country i
O

Figure 5: Possible equilibria
O
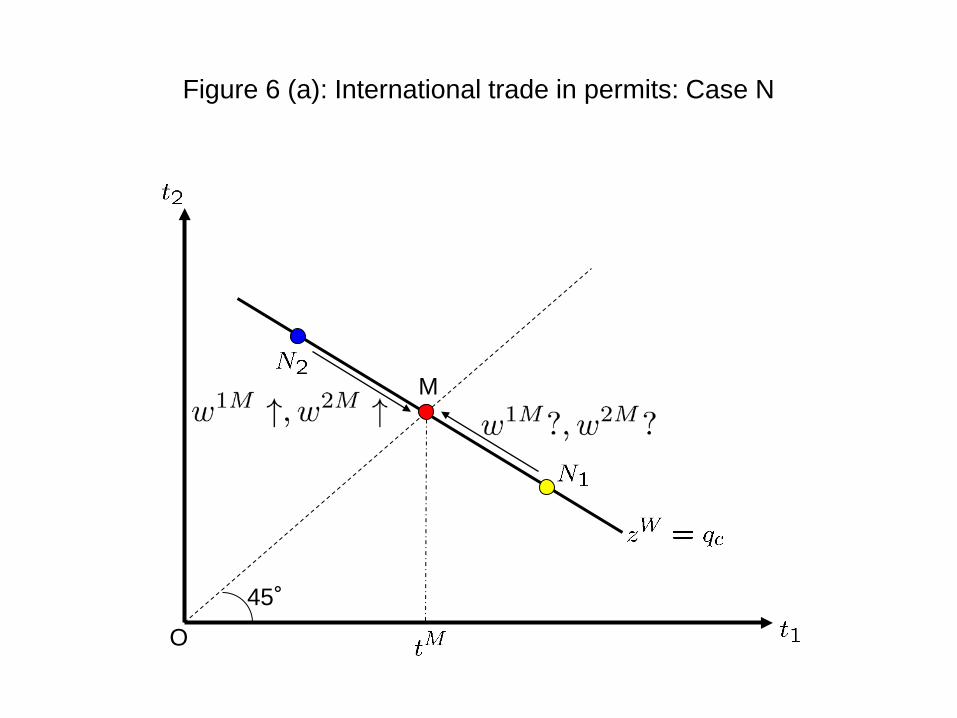
Figure 6 (a): International trade in permits: Case N
O
45°
M
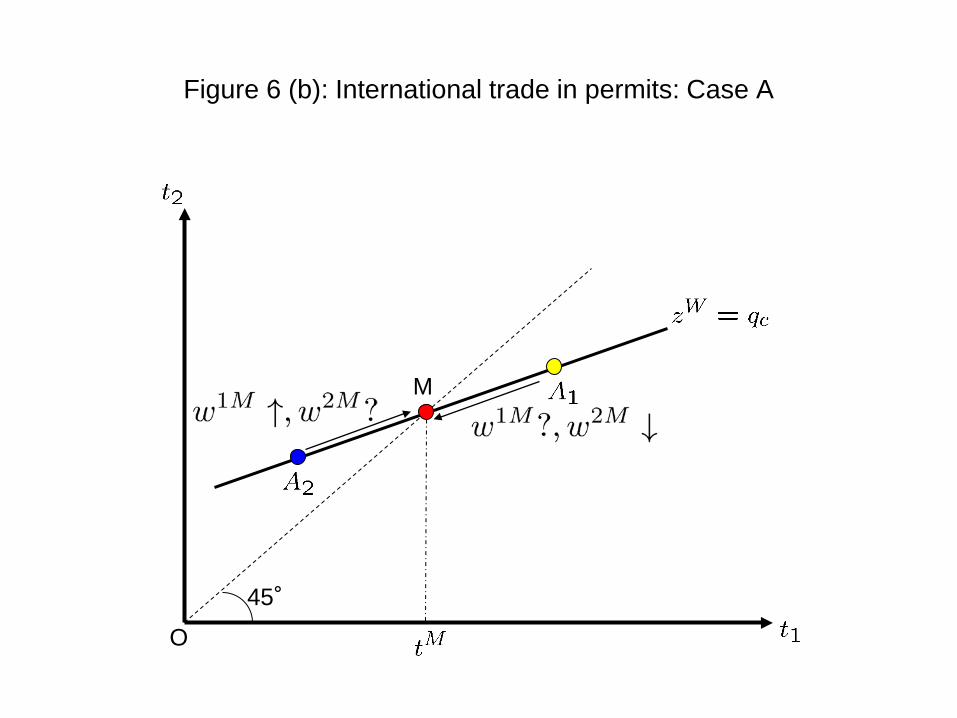
Figure 6 (b): International trade in permits: Case A
O
45°
M