Embed Size (px)
Citation preview

Environmental Monitoring Report
Pilgrim, Seabrook, and Vermont Yankee
Nuclear Power Station
Emergency Planning Zones
2014
Prepared by:
Environmental Toxicology ProgramBureau of Environmental Health
Massachusetts Department of Public Health250 Washington Street
Boston, Massachusetts 02108
August 2016

Table of Contents
Executive Summary..............................................................................................................................1
1. Introduction.................................................................................................................................2
a. Environmental Radiation.............................................................................................................3b. Laboratory Methods....................................................................................................................4
2. Environmental Monitoring and Sampling......................................................................................5
A. Pilgrim Nuclear Power Station.........................................................................................................5
B. Seabrook Nuclear Power Station.....................................................................................................8
C. Vermont Yankee Nuclear Power Station........................................................................................10
3. 2014 Environmental Monitoring Results.....................................................................................12
A. Pilgrim Nuclear Power Station.......................................................................................................12
B. Seabrook Nuclear Power Station...................................................................................................13
C. Vermont Yankee Nuclear Power Station........................................................................................14
D. References..................................................................................................................................15
E. Tables.........................................................................................................................................16
Table 1. Pilgrim Nuclear Power Station 2014 Environmental Monitoring Data – Liquid Matrices.17Table 2. Pilgrim Nuclear Power Station 2014 Environmental Monitoring Data – Solid Matrices 19Table 3. Pilgrim Nuclear Power Station 2014 Environmental Monitoring Data - Air Samples.......20Table 4. Seabrook Nuclear Power Station 2014 Environmental Monitoring Data-Liquid Matrices24Table 5. Seabrook Nuclear Power Station 2014 Environmental Monitoring Data – Solid Samples25Table 6. Seabrook Nuclear Power Station 2014 Environmental Monitoring Data – Air Samples...26Table 7. Vermont Yankee Power Station – Liquid Matrices...........................................................30Table 8. Vermont Yankee Power Station - Solid Matrices.............................................................31Table 9. Vermont Yankee Power Plant – Air Samples....................................................................32

EXECUTIVE SUMMARY
The Massachusetts Department of Public Health (MDPH) Bureau of Environmental Health (BEH) Environmental Toxicology Program (TOX) and Radiation Control Program (RCP) collaborate to conduct routine environmental monitoring within the three Emergency Planning Zones (EPZs) of nuclear power stations in the Commonwealth. This monitoring is part of the department’s regulatory responsibility and provides a system of watchfulness over environmental radiation in Massachusetts communities surrounding nuclear power plants. These EPZs include communities located within a 10-mile radius of Pilgrim Nuclear Power Station (PNPS) in Plymouth, MA, Seabrook Nuclear Power Station (Seabrook) in Seabrook, NH, and the Vermont Yankee Nuclear Power Station (VY), in Vernon, VT which ceased operations on December 29, 2014 and is undergoing decommissioning. This report summarizes the 2014 monitoring activities and results for each nuclear plant EPZ.
Radiation monitoring results in 2014 for areas surrounding the three nuclear power stations affecting Massachusetts have been either non-detect, naturally occurring, at levels expected to be present in the environment from background fallout from historic bomb testing and past nuclear accidents, or attributable to a known source. At a background location to Seabrook nuclear power station radioactive iodine was detected in two Irish moss samples. MDPH determined the source is most likely radioactive medical waste from either a water treatment plant or a hospital near the sample site. Three fish samples within and outside the VY EPZ detected Cesium-137 which MDPH has determined is attributable to historic radiation fallout in the environment.
Overall, no radiation indicators or radionuclides were detected at a level of health concern.
1

1. INTRODUCTION
THE MDPH radiation environmental monitoring program samples a variety of media within and just outside the EPZs surrounding nuclear power plants and monitors the airborne gamma radiation in the EPZs of PNPS and gamma and beta radiation in the Massachusetts communities within the EPZ of Seabrook. MDPH’s intent is to monitor radiation levels and protect public health in the Commonwealth from radiation. Samples are analyzed for radiation by the Massachusetts Environmental Radiation Laboratory (MERL). Environmental media samples analyzed in 2014 include: food crops, vegetation, milk, surface water, sediment, shellfish, fish, and air.
MDPH has a network of stationary monitors surrounding PNPS which measure gamma radiation in real-time and transmit the data to a central computer which is monitored remotely by BEH and RCP staff. The C-l0 Research & Education Foundation, Inc., a non-profit under contract to MDPH, conducts direct radiation monitoring in communities within the Seabrook EPZ.
The MDPH environmental monitoring programs at PNPS and Seabrook have been in place since the 1980s. The environmental monitoring program for Massachusetts communities within the VY EPZ began in 2011. A focused investigation of tritium in groundwater at PNPS is ongoing and not part of this report. Updates on this monitoring effort are posted on the MDPH website: Tritium investigation update reports.
The Nuclear Regulatory Commission requires specific environmental monitoring and annual reporting by operating nuclear power plants. The reports summarizing Seabrook and PNPS’s environmental monitoring can be found on the NRC website: PNPS 2014 Environmental Radiological Monitoring Report and Seabrook's 2014 Environmental Radiological Monitoring Report. Vermont Yankee’s reports are no longer on the NRC website.
MDPH’s monitoring activities for each nuclear plant are described in the Environmental Monitoring sections of this report. The report is organized by presenting sample location and analysis information for each of the three EPZs, discussing the analyses of the samples, and summarizing the monitoring results for each EPZ.
2

A. ENVIRONMENTAL RADIATION
Radiation present in the environment comes from three general sources: naturally occurring radiation, radioactive fallout from past weapons testing or nuclear accidents, and radiation from active operations. This report covers radiation from nuclear power plant operations. Other radiation sources include medical treatment and research facilities, and all contribute to the dose of environmental radiation received by exposed people.
Naturally occurring radionuclides such as Potassium-40 and Beryllium-7 are present in most environmental media. Potassium-40 is a naturally occurring radioactive form of potassium, an essential nutrient. Beryllium-7 is produced when cosmic energy collides with nitrogen and oxygen in the atmosphere. These contribute approximately 30 mrem/year to the average dose from naturally occurring radiation (NRC, 2016). Other natural background radiation sources include radon, cosmic radiation, and carbon-14 which all contribute to an annual dose of approximately 310 mrems/year.
Figure 1. Background Radiation Dose for Average U.S. Resident (NRC, 2016)
Background radiation includes fallout radiation from historic weapons testing, primarily in the 1950s and 1960s, and from nuclear power plant accidents such as Chernobyl and Fukushima. This fallout includes radioisotopes such as Cesium-137 (Cs-137) and Strontium-90 (Sr-90) which persist in the environment due to their longer half-lives. These radionuclides are also released in small quantities from nuclear power plant operations.
Operating nuclear power plants routinely emit direct gamma radiation from nuclear reactor systems, discharge gases and particulates from the station’s air stack, and discharge water containing alpha, beta and gamma radiation. Power plant emissions can be classified as: noble gases, tritium, and iodines and particulates. Noble gases are chemically inert, have short half-lives and disperse quickly in the environment, are not readily incorporated into biological tissue, and do not bioconcentrate. Tritium is created when water passes through the reactor core; the hydrogen atoms in the water molecules and other trace elements like boron absorb neutrons from the fission of the reactor fuel. Iodines and particulates, notably Cesium-137, Iodine-131, Cobalt-60, Magnesium-54, Iron-59, and Zinc-65, have environmental and public health significance: they have longer half-lives, are readily incorporated into biological tissue, and will bioconcentrate.
Exposure to radiation from nuclear power plants may occur from permitted air or liquid discharges or from unmonitored releases or leaks. MDPH evaluates possible routes of exposure for radionuclides, particularly those that accumulate in the food chain, and samples environmental media to measure potential radiation along these routes.
3
Dose Millirems/year
Annual Dose – All Sources 620 per year
Annual Dose – Due to Natural Background Radiation 310 per year

B. LABORATORY METHODS
All samples collected by and provided to MDPH are analyzed by the Massachusetts Environmental Radiation Laboratory (MERL). MERL maintains its standard of excellence in analytical capability through participation with several federal agencies in inter-laboratory quality assurance measures.
Samples analyzed by MERL are reviewed on-site for a suite of more than 30 radiation isotopes. Gamma spectroscopy is used to identify and detect environmentally significant and natural radioisotopes; gas proportion counters measure gross beta and alpha radiation; and liquid scintillation counters measure tritium. Results for environmental media samples are compared to typical background levels. In the event that gamma emitters are present above typical background, the MERL protocol calls for additional testing at an outside laboratory for alpha emitters, such as transuranic (high atomic number) elements, and beta emitters, such as strontium-90. Analysis methods by media are summarized:
AIR Air filters are collected weekly and analyzed for gross alpha and gross beta radioactivity using a gas proportion counter. Air cartridges are analyzed for iodine-131 using gamma spectroscopy. Iodine is usually the first radioactive particulate detected in the event of an accidental release of power plant radiation. Gross alpha and beta analysis is a screening-level tool that does not identify individual radionuclides; therefore, air filters are also analyzed quarterly for gamma radionuclides using gamma spectroscopy. Results are compared to results from a background monitor located in Boston.
Direct gamma radiation in air is measured with thermoluminescent dosimeters (TLDs) and analyzed using gamma spectroscopy.
WATER Surface water samples are tested for total alpha and beta radioactivity with a gas proportional counter, and for gamma-emitting materials with a gamma spectrometer. Water samples are also tested for tritium with a liquid scintillation counter. Tritium is lighter and more mobile in water than other radionuclides and is a sentinel indicator of radionuclides in water bodies.
MILKCow’s milk is tested for gamma radionuclides and iodine-131 using gamma spectroscopy. Milk is a good indicator media for radioactive particulates, particularly iodine-131, which can be detected in milk soon after cow’s graze on contaminated pastures or feed.
SOIL, BIOTA, CROPS, SEAFOOD AND SHELLFISH Produce, sediment, biota, seafood and shellfish were chosen to represent various stages of the food chain in water and on land using media where radionuclides may be identified. Shellfish filter-feed soil and sand, where heavy and soil-bound radionuclides may accumulate; lobsters eat clams, mussels and small fish; and radionuclides biomagnify from smaller to larger surface-dwelling fish. Analyses of biota and crop samples aim to identify radionuclides and particulates which may settle on plants, and be absorbed through roots of crops. Samples are tested for gamma-emitting radionuclides using a gamma spectrometer.
4

2. ENVIRONMENTAL MONITORING AND SAMPLING
This section describes the three nuclear power station 10-mile EPZs in Massachusetts and summarizes the environmental samples collected and analyzed in 2014.
A. PILGRIM NUCLEAR POWER STATION
The Pilgrim Nuclear Power Station (PNPS) is located in Plymouth, MA. Five Massachusetts communities are included in the 10-mile EPZ of PNPS: Carver, Duxbury, Kingston, Marshfield, and Plymouth shown in Figure 2.
Figure 2. PNPS EPZs and sampling locations
Radiation monitoring conducted within and outside the PNPS EPZ includes: direct radiation, air, surface water, fish, lobsters, and milk. MDPH’s radiation monitoring conducted within and outside the PNPS EPZ is a combination of independent direct radiation monitoring, air, milk and cranberry sampling and analysis of split samples provided by Entergy of water, fish, lobsters, shellfish, sediment, Irish moss, and crops.
5
Air/Direct RadiationMDPH’s direct radiation monitoring at PNPS is comprised of three systems operating on a real-time, weekly and quarterly basis. The redundant systems are designed to independently monitor the land areas within the 10-mile EPZ and to verify the utility’s radiation monitoring.
MDPH’s network of 15 stationary radiation monitoring stations detect gamma radiation in real-time and transmit data to a computer which is remotely accessed by staff from both the RCP and ETP. Emergency pager alerts are sent to MDPH and MEMA officials if radiation is detected above three times the typical background level. In 2012 and 2013, MDPH relocated three of the monitors to locations that more effectively represent the area’s coastal and more densely populated areas.
MDPH co-locates an air particulate filter and charcoal air cartridge with Entergy’s air sampler at PNPS and collects them weekly. Filters are analyzed for gross beta and gross alpha radioactivity and cartridges are analyzed for iodine-131. A filter composite sample is also analyzed quarterly for gamma radionuclides. The same analyses are done for an air particulate filter and charcoal cartridge at a background location in Boston.
MDPH has a network of 39 TLDs placed throughout the PNPS EPZ and surrounding communities which measure total gamma radiation in milliroentgen (mR). The majority of the TLDs are located in the inner perimeter of the EPZ, and three are at the site border. These TLDs are collected and analyzed quarterly, and the results are compared to those of a background location in Boston.
Figure 3. The MDPH Radiation -monitoring network at PNPS
6

Surface WaterEntergy collects seawater on a monthly basis from the PNPS discharge canal and the Powder Point Bridge in Duxbury and provides split samples to MDPH for analysis of gamma radionuclides. A quarterly composite of surface water samples from both locations is also analyzed for tritium by MERL.
Fish, Lobster and ShellfishEntergy provides split samples of fish, lobster, and shellfish samples from Plymouth Harbor, Marshfield Bay and the PNPS discharge canal to MDPH for analysis. Entergy provides control and background samples of fish, shellfish and lobster from Cape Cod Bay, and MERL analyzes split samples.
Mussels are collected semiannually from Green Harbor in Marshfield by Entergy and clams from Duxbury Bay and Plymouth Harbor; these three locations are reported to be background locations by Entergy for federal reporting requirements, but considered to be “indicator” locations by MDPH because they fall within the 10-mile EPZ. The split samples are analyzed by MERL for gamma radionuclides.
SedimentEntergy collects sediment from the PNPS discharge canal and Green Harbor in Marshfield semiannually and Duxbury Bay annually, and split samples are analyzed by MERL.
Irish mossIrish moss readily absorbs iodine and is a good reference indicator of iodine-131 in the environment. Entergy collects samples of Irish moss from the PNPS discharge canal and a background location at Brant Rock in Marshfield semiannually and split samples are analyzed by MERL.
CropsMDPH collects and analyses background cranberry samples from a bog in East Taunton annually.
Crops (e.g., corn, apples, gourds, gourd leaves, pumpkins, squash, and hay forage) are collected during the growing season annually by Entergy from a Plymouth County farm located within the PNPS EPZ, and a representative portion of samples are analyzed by MERL. Entergy also collects samples of vegetables and wild vegetation from several commercial gardens in Plymouth and two background locations in Bridgewater and Duxbury; a portion of these are provided to MERL for analysis. Entergy collects hay forage samples from a background location in Whitman and split samples are analyzed by MERL. Finally, Entergy collects cranberries from a bog located in Plymouth and MERL analyzes split samples.
MilkMDPH collects samples of cow’s milk monthly from a farm in Duxbury. The milk is analyzed for gamma radionuclides and Iodine-131. Although this farm is located just outside the EPZ (i.e., 11 miles from PNPS), it is currently the closest dairy farm to PNPS where milk samples are available.
7

B. SEABROOK NUCLEAR POWER STATION
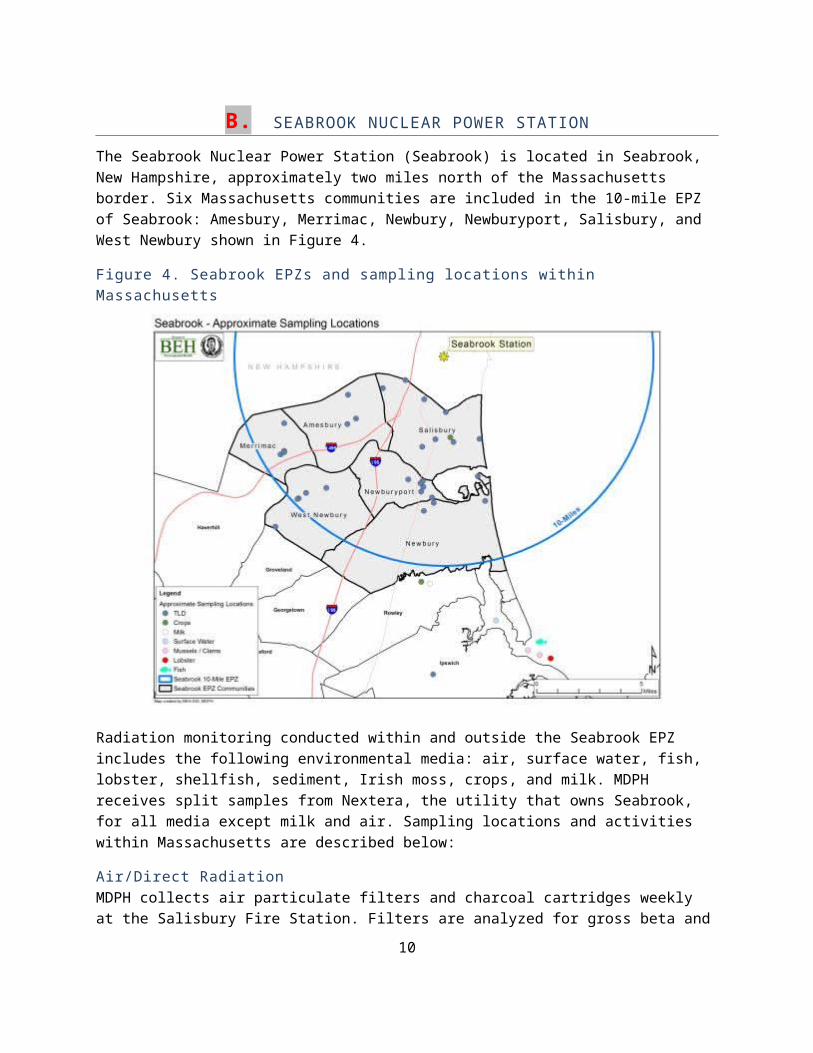
The Seabrook Nuclear Power Station (Seabrook) is located in Seabrook, New Hampshire, approximately two miles north of the Massachusetts border. Six Massachusetts communities are included in the 10-mile EPZ of Seabrook: Amesbury, Merrimac, Newbury, Newburyport, Salisbury, and West Newbury shown in Figure 4.
Figure 4. Seabrook EPZs and sampling locations within Massachusetts
Radiation monitoring conducted within and outside the Seabrook EPZ includes the following environmental media: air, surface water, fish, lobster, shellfish, sediment, Irish moss, crops, and milk. MDPH receives split samples from Nextera, the utility that owns Seabrook, for all media except milk and air. Sampling locations and activities within Massachusetts are described below:
Air/Direct RadiationMDPH collects air particulate filters and charcoal cartridges weekly at the Salisbury Fire Station. Filters are analyzed for gross beta and alpha radioactivity, and cartridges for iodine-131. Additionally, a filter composite is analyzed quarterly for gamma emitting radionuclides. The same analyses are done for air particulate filters and charcoal cartridges at the background location in Boston.
MDPH measures total ambient gamma radiation using a network of 34 TLDs placed at locations throughout the Seabrook EPZ in Massachusetts. These are collected and analyzed quarterly and results are compared to those of a background location in Boston.
8

MDPH has contracted the C-l0 Research & Education Foundation, Inc. to conduct radiation monitoring in Massachusetts communities located in the Seabrook EPZ. The C-10 system consists of a network of 16 real-time radiation sensors and weather probes located in Massachusetts within a 10-mile radius of Seabrook station. Beta, gamma, and weather data are collected and uploaded every 15 minutes to a secure web-based central repository. The data are compiled and graphed monthly, with reports submitted to MDPH. All 16 monitoring sites are located at private homes, schools, and businesses. MDPH and MEMA officials receive text alerts from C-10 if levels go above three times the typical background readings.
Surface WaterSeawater samples are typically collected monthly by Nextera from a background location in Ipswich Bay, and split samples are analyzed by MERL for gamma radionuclides. A quarterly composite of these monthly surface water samples is analyzed for tritium.
Fish, Lobster, and ShellfishSamples of fish, lobster, and shellfish, including Modiolus (Atlantic mussels) and Mytilus (Blue mussels), are collected semiannually by Nextera from Ipswich Bay, considered a background location, and split samples are analyzed by MERL for gamma radionuclides.
SedimentSediment samples from Ipswich Bay and the tidal flats on Plum Island, both background locations, are collected semiannually by Nextera and split samples are analyzed by MERL for gamma radionuclides.
Irish mossAs noted earlier, Irish moss (Chondrus) readily absorbs iodine and is a sentinel indicator of environmental iodine-131. Nextera collects samples of Irish moss semiannually from a background location in Ipswich Bay, and split samples are analyzed by MERL for gamma radionuclides.
CropsCrops (e.g., strawberries and tomatoes) are collected by Nextera from a farm located within the Seabrook EPZ in Salisbury and split samples are analyzed by MERL. In addition, strawberries, tomatoes, and squash are collected from a background location by Nextera in Ipswich and split samples are analyzed by MERL for gamma radionuclides.
MilkMDPH collects samples of cow’s milk monthly from a farm located in Rowley and analyzes them for gamma-emitting radionuclides and for iodine-131.
9

C. VERMONT YANKEE NUCLEAR POWER STATION
The Vermont Yankee Nuclear Power Station (VY) is located in Vernon, VT, approximately four miles north of the Massachusetts border. The reactor was permanently shut down on December 29, 2014, and the fuel was removed on January 12, 2015. Seven Massachusetts communities are located in the 10-mile EPZ of VY: Bernardston, Colrain, Gill, Greenfield, Leyden, Northfield, and Warwick.
Figure 5. VY EPZs and Sampling Locations within Massachusetts
MDPH initiated an environmental monitoring program in Massachusetts communities located within and outside the Vermont Yankee Nuclear Power Station EPZ in 2011. Radiation monitoring includes air, surface water, fish, sediment, grass, crops, and milk.
Air/Direct RadiationMDPH collects air particulate filters and charcoal cartridges weekly at the Northfield Transfer Station. The filters are analyzed for gross beta and gross alpha radioactivity and the cartridges for iodine-131. Additionally, a filter composite is analyzed quarterly for gamma radionuclides. The same analyses are done for air particulate filters and charcoal cartridges at the background location in Boston.
MDPH measures total gamma radiation using a network of 7 TLDs placed at locations throughout and just outside the VY EPZ. These TLDs are collected and analyzed quarterly and results are compared to those of a background location in Boston.
10
Surface WaterMDPH collects surface water samples on a quarterly basis from two locations in the Connecticut River within the communities of Northfield and Gill, and from a background location at the Miller’s River in Athol. Surface water samples are analyzed for gamma radionuclides and for tritium.
FishMDPH collects fish semiannually from the Connecticut River in Northfield and Gill and from a background location at the Millers River in Athol, and analyzes them for gamma radionuclides.
SedimentMDPH collects sediment samples semiannually from two locations in the Connecticut River in Northfield and Gill, and from a background location at the Millers River in Athol. Samples are analyzed for gamma radionuclides.
Wild GrassMDPH collects wild grass samples semiannually from two locations near the Connecticut River in Northfield and Gill and from a background location near the Millers River in Athol. Samples are analyzed for gamma radionuclides.
CropsMDPH collects and analyzes crops (e.g. pumpkins, elderberries, apples and pasture grass) from several farms within the VY EPZ in Bernardston and Northfield during the growing season. Apples are collected from a background location in Colrain. All samples are analyzed for gamma radionuclides.
MilkMDPH collects samples of cow’s milk monthly from a farm in Bernardston and analyzes them for gamma radionuclides and iodine-131. Silage, used to feed the cows, is analyzed annually for gamma radionuclides.
11

3. 2014 ENVIRONMENTAL MONITORING RESULTS
Radiation monitoring results in 2014 for Massachusetts have been either non-detect, naturally occurring (i.e., Potassium-40, Beryllium-7), or at levels expected to be present in the environment from historic background fallout and nuclear accidents including Chernobyl and Fukashima Dai-chi (i.e., Cesium-137). No detectible radionuclides were at levels of health concern or were indicative of an unintentional release of radiation at PNPS, Seabrook, or VY. Two detections of radioactive iodine were identified in Irish moss at a background location to Seabrook, and Cesium-137, attributable to historic fallout, was detected in three fish samples within and outside VY’s EPZ.
Results of environmental monitoring conducted by MDPH in the Massachusetts communities in the vicinity of each of the three nuclear power stations are discussed below and presented in Tables 1-9. The tables are organized by nuclear power station and by sample media. Results presented in this report:
Air particulate filter for gross alpha and beta radiation, charcoal filter for radioactive iodine and thermoluminescent devices (TLDs) for gamma radiation doses.
Surface and ground water for gamma radionuclides, and quarterly composites for tritium. Milk for natural and man-made radioactive materials including radioactive iodine.
Fish, shellfish, crops, vegetation and sediment for gamma radionuclides.
A. PILGRIM NUCLEAR POWER STATION
Naturally occurring Potassium-40 and Beryllium-7 were detected in nearly all samples of environmental media for which they were analyzed from both within and outside of the PNPS EPZ (results are provided in Tables 1, 2 and 3).
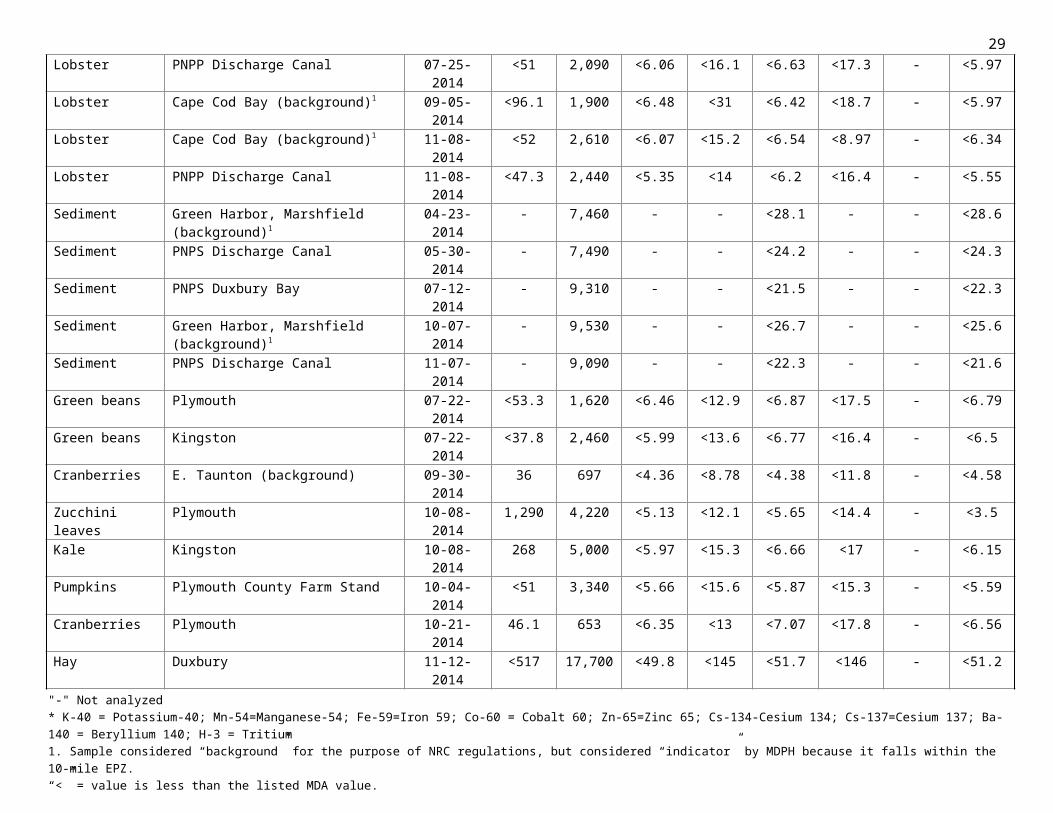
Cesium-137 was detected in a bluefish sample collected from the PNPS discharge canal on October 14, 2014, at a concentration of 5 picocuries per kilogram (pCi/kg). This amount is slightly over detection level of 4 pCi/kg, and is considered attributable to historical fallout from bomb testing in the 1950s and 1960s (Burger et al., 2007; Amund et al., 1996). Consistently, one bluefish sample in 2013 and another in 2011 had a detection of Cs-137. Cs-137 was identified in three wild vegetation samples (two from Plymouth and a background sample from Sandwich). A review of background Cs-137 levels measured prior to plant operations (Boston Edison, 1971) showed these results are consistent with levels described, and are considered attributable to historical fallout past nuclear weapons testing and power plant accidents.
Air filter and cartridge analyses indicated low levels of gross alpha and gross beta radiation, as well as naturally occurring Beryllium-7 and Potassium-40 in most samples. These results are consistent with those obtained from the background location in Boston.
Real-time monitoring did not show radiation levels above typical background levels (i.e., approximately 0.008 - 0.010 mrem/hour) with the exception of brief increases (e.g., 0.002 mrem/hour) that are expected due to rainfall washout from naturally occurring radionuclides such as radon daughters and from cosmic radiation fluctuations. The average gamma reading for the year was 0.00925 mrem/hour, and no alerts at three times background were recorded. For comparison, the average U.S. resident is
12

exposed to approximately 310 mrem per year (or 0.035 mrem/hour) from natural background radiation (NRC, 2016).
TLD results for total gamma exposure ranged from 10.9 and 50.1 mR/quarter, with an average of 16.3 mR/quarter. This value is compared to an average value of 13.6 mR/quarter measured at a background location in Boston, and results in an average gamma exposure of 2.6 mR/quarter above background. TLD readings vary, due to proximity to objects with naturally occurring radiation such as bricks and granite.
B. SEABROOK NUCLEAR POWER STATION
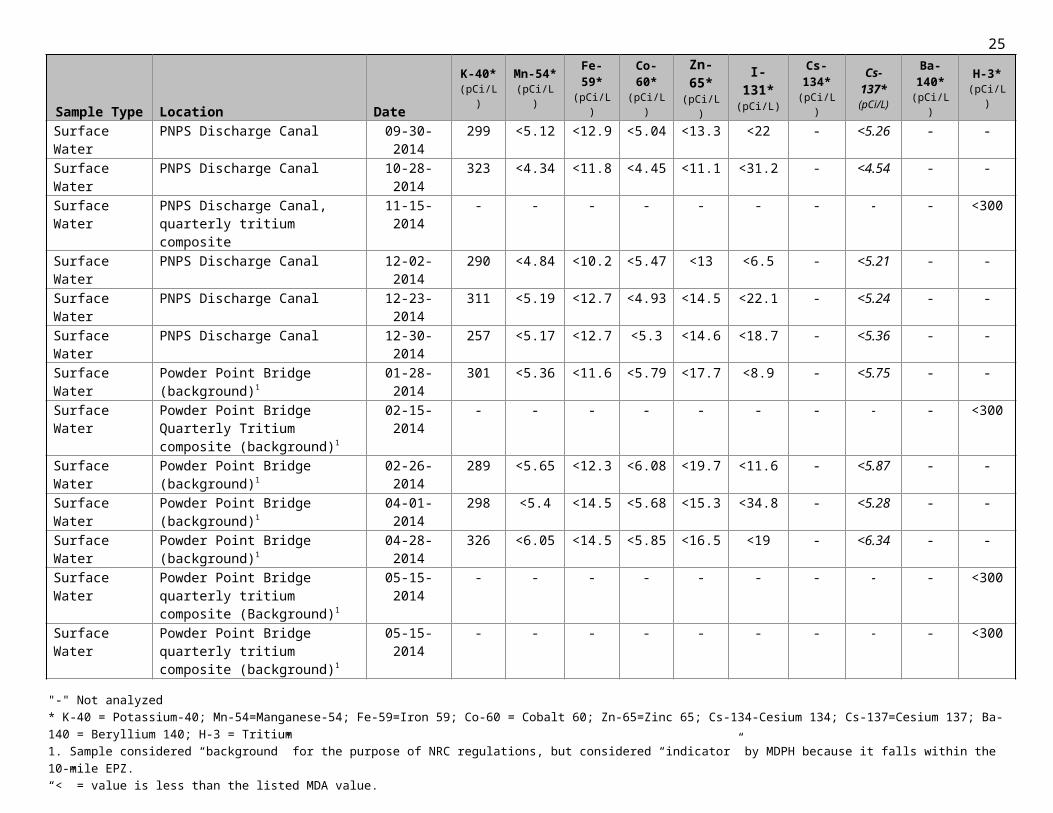
Naturally occurring Potassium-40 and Beryllium-7 were detected in nearly all samples of environmental media from both within and outside of the Seabrook EPZ (results are provided in Tables 4, 5 and 6).
Although not detected at levels of concern with respect to human health (ATSDR, 2004), both Irish moss (Chondrus) samples in Ipswich bay, a background location approximately 20 miles from the Seabrook EPZ, detected iodine-131 (144 pCi/kg on May 21, 2014 and 28.8 pCi/kg on December 15, 2014). Notably, radioactive iodine was found in Irish moss in the same location in 2012. Iodine-131 is monitored carefully as nuclear power plants and nuclear weapons produce it, but it is most commonly used for treatment of thyroid disorders (Rose et al., 2012), and is allowed to be released into sewers. Monthly surface water samples in Ipswich Bay on May 21, 2014 and weekly air samples at the Salisbury Fire Station found did not detect radioactive iodine. Sewage discharges and a medical center providing cancer treatment are near this background location, and these are most likely the source of the radioiodine. MDPH believes the radioiodine source is unlikely attributable to Seabrook and the levels detected do not present a health risk.
Air filter and cartridge results, provided in Table 6, found low levels of gross alpha and gross beta radiation, as well as naturally occurring Beryllium-7 and Potasium-40, for most samples. No gamma radionuclides of concern were detected in quarterly composite samples. The results are consistent with results obtained from the background location in Boston.
In 2014, real-time monitoring for the Seabrook EPZ did not show gamma radiation levels above typical background levels (i.e., approximately 0.010 mrem/hour) with the exception of brief increases (e.g., 0.002 mrem/hour) that are expected due to rainfall washout from naturally occurring radionuclides such as airborne radon daughters, and cosmic radiation events. Beta readings ranged from 40 to 50 counts per minute with the exception of brief increases similar to the gamma results.
TLD results for total gamma exposure ranged from 15.7-17.1 mR /quarter with an average exposure of 16.5 mR/quarter, compared to an average of 13.3 mR/quarter at the background location in Boston. The result is an increase over background exposure level of 3.2 mR/quarter. TLD readings can vary with location, due to proximity to objects with naturally occurring radiation such as bricks and granite.
13

C. VERMONT YANKEE NUCLEAR POWER STATION
Naturally occurring Potassium-40 and Beryllium-7 were detected in nearly all samples of environmental media from both within and outside of the VY EPZ (results are provided in Tables 7, 8, and 9).
Cesium-137 was detected in 3 of 5 fish samples; two from background locations (49.4 – 50.1 pCi/kg) and one (88.9 pCi/kg) from the Connecticut River. Cs-137 had been detected in a fish sample in 2013. These results are consistent with those measured in fish from other locations reported in the scientific literature and are considered attributable to historical fallout from weapons testing and past nuclear power plant accidents (VTDOH, 2012; Burger et al., 2007; ATSDR, 2004; Amund et al., 1996). Other power plant produced radionuclides were not detected in the fish, nor was Cs-137 detected in surface water at these locations, supporting the conclusion that residual deposition is the source. These concentrations of Cs-137 in fish present a very low health risk.
Cs-137 most likely attributable to historic weapon testing was detected in sediment from the Connecticut River in the VY EPZ at levels of 35.2pCi/kg and between 124 and 136 pCi/kg at the background location at the Millers River in Athol, 10 miles outside the VY EPZ. Prior year results for 2011-13 also found detectable levels of Cs-137 in the soil. Background soil and sediment in the U.S. typically has between 10 and 1000 pCi/kg of Cs-137 from atmospheric bomb testing conducted mainly in the 1950s and 1960s (US EPA, 1976).
No detectable radioactive iodine was identified in 2014 surface water samples. Iodine-131 had been previously detected in the background surface water sample at the Millers River in Athol in 2012.
Air filter and cartridge analyses (provided in Table 9) found low levels of gross alpha and gross beta radiation. The results are consistent with those obtained from the background location in Boston.
TLD results for total gamma exposure ranged from 11.8 to 16.2 mR/quarter with an average of 14.1 mR/quarter, which is almost the same as the 13.7 mR/quarter at the background location in Boston. TLD readings can vary with location, due to proximity to objects with naturally occurring radiation such as bricks and granite.
14

D. REFERENCES
Amund et al., 1996. Contaminants in Fish and Sediments in the North Atlantic Ocean. TemaNord.
ATSDR, 2004. U.S. Agency for Toxic Substances and Disease Registry. Toxicological Profile for Cesium.
ATSDR, 2004. U.S. Agency for Toxic Substances and Disease Registry. Toxicological Profile for Iodine. http://www.atsdr.cdc.gov/ToxProfiles/tp158.pdf
Beresford et al., 2013. “A new approach to predicting environmental transfer of radionuclides to wildlife: A demonstration for freshwater fish and caesium”. Science of the Total Environment, 463-4. pp. 284-292.
Boston Edison Co., 1971. Preoperational Environmental Radiation Survey Program, Summary Report through August 31, 1970.
Burger et al., 2007. “Radionuclides in Marine Fishes and Birds from Amchitka and Kiska Islands in the Aleutians: Establishing a baseline.” Health Physics. March 2007, Vol. 92, No.3.
International Commission on Radiation Protection (ICRP), 2008. Nuclear Decay Data for Dosimetric Calculations. ICRP Publication 107. Ann. ICRP 38 (3).
Jelin et al., 2015. “Quantifying annual internal effective 137 Cesium dose utilizing direct body-burden measurement and ecological dose modeling”. Journal of exposure science and environmental epidemiology.
Rose et al., 2012. “Medically-derived I-131 in municipal sewage effluent”. Water Research 46 (2012) 5663-5671.
US EPA (United States Environmental Protection Agency), 1979. 40 CFR part 190 U.S.Government Printing Office, Washington, DC.
US EPA Radiological Qualities of the Environment, 1976. EPA-520. 1-76-010. Washington, DC: U.S. Government Printing Office.
US NRC (United States Nuclear Regulatory Commission), 1996. 10 CFR Part 50, AppendixI. U.S. Government Printing Office, Washington, DC.
US NRC (United States Nuclear Regulatory Commission), 1991. 10 CFR Part 20, AppendixB. Government Printing Office, Washington DC.
US NRC (United States Nuclear Regulatory Commission), 1977. Calculation of Annual Doses to Man from routine Releases of Reactor Effluents for the Purpose of Evaluating Compliance with 10 CFR Part 50, Appendix I. Regulatory Guide 1.109. Washington, DC: U.S. Government Printing Office.
US NRC (United States Nuclear Regulatory Commission, 2016. http://www.nrc.gov/about-nrc/radiation/around-us/doses-daily-lives.html.
VTDOH (Vermont Department of Health), 2012. Tritium Investigation Archive 2012. Fish Data Comparison: Lake Carmi – Connecticut River. Accessed at: http://healthvermont.gov/enviro/rad/yankee/tritium_archive_2012.aspx.
15

E. TABLES
16

17Table 1. Pilgrim Nuclear Power Station 2014 Environmental Monitoring Data – Liquid Matrices
Sample Type Location DateK-40* (pCi/L)
Mn-54* (pCi/L)
Fe-59* (pCi/L)
Co-60* (pCi/L)
Zn-65* (pCi/L)
I-131* (pCi/L)
Cs-134* (pCi/L)
Cs-137* (pCi/L)
Ba-140* (pCi/L)
H-3* (pCi/L)
Surface Water PNPS Discharge Canal 01-28-2014 444 <7.93 <16.6 <7.71 <21.7 <13.3 - <8.06 - -Surface Water PNPS Discharge Canal, quarterly
tritium composite02-15-2014 - - - - - - - - - <300
Surface Water PNPS Discharge Canal 02-26-2014 510 <8.16 <17.6 <8.03 <24.4 <16.3 - <8.35 - -Surface Water PNPS Discharge Canal 04-01-2014 324 <6.05 <16.7 <5.93 <16.7 <39.9 - <6.27 - -Surface Water PNPS Discharge Canal 04-28-2014 324 <5.19 <12.2 <5.61 <14.8 <12.3 - <5.71 - -Surface Water PNPS Discharge Canal, quarterly
tritium composite105-15-2014 - - - - - - - - - <300
Surface Water PNPS Discharge Canal, quarterly tritium composite1
05-15-2014 - - - - - - - - - <300
Surface Water PNPS Discharge Canal 06-03-2014 327 <3.8 <9.55 <3.82 <10.1 <13.2 - <3.84 - -Surface Water PNPS Discharge Canal 07-01-2014 298 <4.16 <8.6 <4.23 <10.2 <4.97 - <4.42 - -Surface Water PNPS Discharge Canal 07-29-2014 287 <4.29 <8.72 <4.4 <11.1 <5.45 - <4.22 - -Surface Water PNPS Discharge Canal, quarterly
tritium composite08-15-2014 - - - - - - - - - <300
Surface Water PNPS Discharge Canal 09-02-2014 306 <3.93 <9.13 <4.44 <10.9 <6.89 - <4.33 - -Surface Water PNPS Discharge Canal 09-30-2014 299 <5.12 <12.9 <5.04 <13.3 <22 - <5.26 - -Surface Water PNPS Discharge Canal 10-28-2014 323 <4.34 <11.8 <4.45 <11.1 <31.2 - <4.54 - -Surface Water PNPS Discharge Canal, quarterly
tritium composite11-15-2014 - - - - - - - - - <300
Surface Water PNPS Discharge Canal 12-02-2014 290 <4.84 <10.2 <5.47 <13 <6.5 - <5.21 - -Surface Water PNPS Discharge Canal 12-23-2014 311 <5.19 <12.7 <4.93 <14.5 <22.1 - <5.24 - -Surface Water PNPS Discharge Canal 12-30-2014 257 <5.17 <12.7 <5.3 <14.6 <18.7 - <5.36 - -Surface Water Powder Point Bridge (background)1 01-28-2014 301 <5.36 <11.6 <5.79 <17.7 <8.9 - <5.75 - -Surface Water Powder Point Bridge Quarterly
Tritium composite (background)102-15-2014 - - - - - - - - - <300
Surface Water Powder Point Bridge (background)1 02-26-2014 289 <5.65 <12.3 <6.08 <19.7 <11.6 - <5.87 - -Surface Water Powder Point Bridge (background)1 04-01-2014 298 <5.4 <14.5 <5.68 <15.3 <34.8 - <5.28 - -Surface Water Powder Point Bridge (background)1 04-28-2014 326 <6.05 <14.5 <5.85 <16.5 <19 - <6.34 - -Surface Water Powder Point Bridge quarterly
tritium composite (Background)105-15-2014 - - - - - - - - - <300
Surface Water Powder Point Bridge quarterly tritium composite (background)1
05-15-2014 - - - - - - - - - <300
Surface Water Powder Point Bridge (background)1 06-03-2014 318 <4.26 <10.4 <4.43 <11.7 <15.1 - <4.44 - -
"-" Not analyzed* K-40 = Potassium-40; Mn-54=Manganese-54; Fe-59=Iron 59; Co-60 = Cobalt 60; Zn-65=Zinc 65; Cs-134-Cesium 134; Cs-137=Cesium 137; Ba-140 = Beryllium 140; H-3 = Tritium1. Sample considered “background” for the purpose of NRC regulations, but considered “indicator” by MDPH because it falls within the 10-mile EPZ.“<” = value is less than the listed MDA value.

18
Sample Type Location DateK-40* (pCi/L)
Mn-54* (pCi/L)
Fe-59* (pCi/L)
Co-60* (pCi/L)
Zn-65* (pCi/L)
I-131* (pCi/L)
Cs-134* (pCi/L)
Cs-137* (pCi/L)
Ba-140* (pCi/L)
H-3* (pCi/L)
Surface Water Powder Point Bridge (background)1 07-01-2014 204 <5.11 <10.7 <5.1 <13 <5.88 - <5.24 - -Surface Water Powder Point Bridge (background)1 07-29-2014 304 <4.93 <10.6 <4.89 <13.3 <6.29 - <5.3 - -Surface Water Powder Point Bridge quarterly
tritium composite (background)108-15-2014 - - - - - - - - - <300
Surface Water Powder Point Bridge (background)1 09-02-2014 304 <5.15 <10.8 <5.4 <13.5 <8.1 - <5.06 - -Surface Water Powder Point Bridge (background)1 09-30-2014 305 <3.8 <9.32 <3.91 <9.34 <15.3 - <3.94 - -Surface Water Powder Point Bridge (background)1 10-28-2014 239 <5.35 <14.7 <5.13 <14.3 <39.7 - <5.36 - -Surface Water Powder Point Bridge quarterly
tritium composite (background)111-15-2014 - - - - - - - - - <300
Surface Water Powder Point Bridge (background)1 12-02-2014 233 <3.8 <7.65 <4.02 <11 <4.8 - <3.83 - -Surface Water Powder Point Bridge (background)1 12-23-2014 313 <3.98 <9.93 <3.94 <11.6 <16.2 - <4 - -Surface Water Powder Point Bridge (background)1 12-30-2014 297 <3.83 <9.21 <3.87 <11 <13.5 - <3.97 - -Milk Duxbury 01-07-2014 1360 - - - - <6.43 <7.35 <6.86 <22.6 -Milk Duxbury 02-04-2014 1490 - - - - <7.87 <9.15 <8.5 <28.7 -Milk Duxbury 03-04-2014 1290 - - - - <5.8 <6.78 <6.46 <20.8 -Milk Duxbury 04-01-2014 1430 - - - - <7.95 <8.82 <8.36 <28.6 -Milk Duxbury 05-27-2014 1370 - - - - <4.41 <4.44 <4.79 <15.1 -Milk Duxbury 07-22-2014 1350 - - - - <4.24 <4.59 <4.71 <15.4 -Milk Duxbury 08-05-2014 1370 - - - - <4.15 <4.22 <4.72 <14.8 -Milk Duxbury 09-03-2014 1320 - - - - <4.21 <4.05 <4.59 <14.9 -Milk Duxbury 10-08-2014 1340 - - - - <5.19 <5.79 <5.45 <18.7 -Milk Duxbury 11-12-2014 1430 - - - - <5.06 <5.66 <5.66 <18.3 -Milk Duxbury 12-24-2014 1350 - - - - <4.22 <4.18 <4.85 <14.6 -Milk Boston (background) 03-13-2014 1520 - - - - <6.5 <7.6 <7.29 <23.0 -Milk Boston (background) 06-24-2014 1400 - - - - <5.58 <4.6 <4.64 <17.8 -
"-" Not analyzed* K-40 = Potassium-40; Mn-54=Manganese-54; Fe-59=Iron 59; Co-60 = Cobalt 60; Zn-65=Zinc 65; Cs-134-Cesium 134; Cs-137=Cesium 137; Ba-140 = Beryllium 140; H-3 = Tritium1. Sample considered “background” for the purpose of NRC regulations, but considered “indicator” by MDPH because it falls within the 10-mile EPZ.“<” = value is less than the listed MDA value.

19Table 2. Pilgrim Nuclear Power Station 2014 Environmental Monitoring Data – Solid matrices
Sample Type Location DateBe-7*
(pCi/kg)K-40*
(pCi/kg)Mn-54* (pCi/kg)
Fe-59* (pCi/kg)
Co-60* (pCi/kg)
Zn-65* (pCi/kg)
I-131* (pCi/kg)
Cs-137*
(pCi/kg)Chondrus PNPS-Discharge Canal 05-30-2014 528 13,700 <11.8 <27.8 <13.1 <35.4 <16.3 <11.8Chondrus Brant Rock-Marshfield (background)1 06-11-2014 117 4,940 <9.6 <22.9 <10 <28.7 <14.7 <9.75Chondrus Brant Rock-Marshfield (background)1 10-07-2014 53 12,100 <8.34 <20.5 <9.57 <24.4 <9.84 <8.59Chondrus PNPS-Discharge Canal 10-07-2014 194 12,000 <11.1 <27.1 <12.7 <32.9 <11.8 <11.5Clams Duxbury Bay, Duxbury 04-23-2014 <707 1,400 <33.5 <210 <29 <89.2 - <30.5Mussels Green Harbor, Marshfield 04-23-2014 <112 1,730 <7.35 <48.4 <6.74 <22.5 - <6.41Clams Plymouth Harbor, Plymouth 04-16-2014 <154 1,900 <6.84 <51.1 <6.71 <21.2 - <6.12Clams Plymouth Harbor, Plymouth 10-06-2014 <118 1,380 <7.7 <34.5 <7.5 <22.4 - <7.07Mussels Green Harbor, Marshfield 10-07-2014 <93.7 1,350 <6.73 <28.5 <6.61 <19.1 - <6.31Winter flounder Cape Cod Bay (background)1 05-03-2014 <135 3,570 <6.98 <51.6 <6.55 <21.4 - <6.15Winter flounder PNPS Discharge Canal 05-02-2014 <136 4,290 <6.8 <54.7 <6.76 <21.2 - <5.08Tautog Narragansett Bay (background)1 09-28-2014 <579 3,790 <34.2 <163 <29.7 <92.5 - <31.9Striped bass PNPS Discharge Canal 10-14-2014 <348 4,200 <24.6 <100 <24.2 <67.3 - <25.5Bluefish PNPS Discharge Canal 10-14-2014 <84.8 3,400 <6.06 <27.3 <5.76 <16.4 - 5Bluefish Buzzards Bay (background)1 11-06-2014 <67.1 3,040 <5.84 <21.6 <5.86 <17 - <4.73Lobster PNPP Discharge Canal 07-25-2014 <51 2,090 <6.06 <16.1 <6.63 <17.3 - <5.97Lobster Cape Cod Bay (background)1 09-05-2014 <96.1 1,900 <6.48 <31 <6.42 <18.7 - <5.97Lobster Cape Cod Bay (background)1 11-08-2014 <52 2,610 <6.07 <15.2 <6.54 <8.97 - <6.34Lobster PNPP Discharge Canal 11-08-2014 <47.3 2,440 <5.35 <14 <6.2 <16.4 - <5.55Sediment Green Harbor, Marshfield (background)1 04-23-2014 - 7,460 - - <28.1 - - <28.6Sediment PNPS Discharge Canal 05-30-2014 - 7,490 - - <24.2 - - <24.3Sediment PNPS Duxbury Bay 07-12-2014 - 9,310 - - <21.5 - - <22.3Sediment Green Harbor, Marshfield (background)1 10-07-2014 - 9,530 - - <26.7 - - <25.6Sediment PNPS Discharge Canal 11-07-2014 - 9,090 - - <22.3 - - <21.6Green beans Plymouth 07-22-2014 <53.3 1,620 <6.46 <12.9 <6.87 <17.5 - <6.79Green beans Kingston 07-22-2014 <37.8 2,460 <5.99 <13.6 <6.77 <16.4 - <6.5Cranberries E. Taunton (background) 09-30-2014 36 697 <4.36 <8.78 <4.38 <11.8 - <4.58Zucchini leaves Plymouth 10-08-2014 1,290 4,220 <5.13 <12.1 <5.65 <14.4 - <3.5Kale Kingston 10-08-2014 268 5,000 <5.97 <15.3 <6.66 <17 - <6.15Pumpkins Plymouth County Farm Stand 10-04-2014 <51 3,340 <5.66 <15.6 <5.87 <15.3 - <5.59Cranberries Plymouth 10-21-2014 46.1 653 <6.35 <13 <7.07 <17.8 - <6.56Hay Duxbury 11-12-2014 <517 17,700 <49.8 <145 <51.7 <146 - <51.2Wild vegetation Sandwich (background) 10-03-2014 16,400 13,600 <25.4 <87.7 <28.8 - - 67Wild vegetation Plymouth (background) 10-03-2014 5,300 8,120 <15 <80.3 <23.5 - - <20.6Wild vegetation Plymouth 10-04-2014 5,100 7,830 <30.9 <98.2 <30.1 - - 63
"-" Not analyzed* K-40 = Potassium-40; Mn-54=Manganese-54; Fe-59=Iron 59; Co-60 = Cobalt 60; Zn-65=Zinc 65; Cs-134-Cesium 134; Cs-137=Cesium 137; Ba-140 = Beryllium 140; H-3 = Tritium1. Sample considered “background” for the purpose of NRC regulations, but considered “indicator” by MDPH because it falls within the 10-mile EPZ.“<” = value is less than the listed MDA value.

20Wild vegetation Plymouth 10-04-2014 7,040 7,660 <28.4 <87.4 <27 - - 377
"-" Not analyzed* K-40 = Potassium-40; Mn-54=Manganese-54; Fe-59=Iron 59; Co-60 = Cobalt 60; Zn-65=Zinc 65; Cs-134-Cesium 134; Cs-137=Cesium 137; Ba-140 = Beryllium 140; H-3 = Tritium1. Sample considered “background” for the purpose of NRC regulations, but considered “indicator” by MDPH because it falls within the 10-mile EPZ.“<” = value is less than the listed MDA value.

21Table 3. Pilgrim Nuclear Power Station 2014 Environmental Monitoring Data - Air Samples
Sample Type Location Date
I-131* (pCi/m3)
Be-7* (pCi/m3)
K-40* (pCi/m3)
Mn-54* (pCi/m3)
Fe-59* (pCi/m3)
Co-60* (pCi/m3)
Zn-65* (pCi/m3)
Cs-134* (pCi/m3)
Cs-137* (pCi/m3)
Gross Alpha
(pCi/m3)
Gross Beta
(pCi/m3)Air Pilgrim Station 01-07-2014 <0.0408 - - - - - - - - 0.00318 0.0148Air Pilgrim Station 01-14-2014 <0.0473 - - - - - - - - 0.00402 0.0161Air Pilgrim Station 01-22-2014 <0.0383 - - - - - - - - 0.00917 0.0259Air Pilgrim Station 01-29-2014 <0.0324 - - - - - - - - 0.00315 0.0178Air Pilgrim Station 02-04-2014 <0.0574 - - - - - - - - 0.01040 0.0331Air Pilgrim Station 02-13-2014 <0.0447 - - - - - - - - 0.00755 0.0290Air Pilgrim Station
Quarterly Composite02-15-2014 - 0.0926 <0.0202 <0.0014 <0.0281 <0.00117 <0.00409 - <0.000992 - -
Air Pilgrim Station 02-19-2014 <0.0340 - - - - - - - - 0.00324 0.0191Air Pilgrim Station 02-26-2014 <0.0435 - - - - - - - - 0.00173 0.0167Air Pilgrim Station 03-04-2014 <0.0493 - - - - - - - - 0.01100 0.0420Air Pilgrim Station 03-12-2014 <0.0400 - - - - - - - - 0.00465 0.0215Air Pilgrim Station 03-19-2014 <0.0455 - - - - - - - - 0.00525 0.0182Air Pilgrim Station 03-26-2014 <0.0634 - - - - - - - - 0.00259 0.0168Air Pilgrim Station 04-01-2014 <0.0412 - - - - - - - - 0.00622 0.0225Air Pilgrim Station 04-09-2014 <0.0412 - - - - - - - - 0.00295 0.0137Air Pilgrim Station 04-15-2014 <0.0463 - - - - - - - - 0.00766 0.0264Air Pilgrim Station 04-22-2014 <0.0381 - - - - - - - - 0.00492 0.0183Air Pilgrim Station 04-29-2014 <0.0412 - - - - - - - - 0.00411 0.0188Air Pilgrim Station 05-06-2014 <0.0403 - - - - - - - - 0.00285 0.0134Air Pilgrim Station 05-14-2014 <0.0356 - - - - - - - - 0.00476 0.0226Air Pilgrim Station
Quarterly Composite05-15-2014 - 0.0774 <0.0345 <0.00177 <0.012 <0.00153 <0.00483 - <0.00151 - -
Air Pilgrim Station 05-20-2014 <0.0454 - - - - - - - - 0.00380 0.0184Air Pilgrim Station 05-27-2014 <0.0317 - - - - - - - - 0.00191 0.0148Air Pilgrim Station 06-03-2014 <0.0265 - - - - - - - - 0.00095 0.0135Air Pilgrim Station 06-10-2014 <0.0389 - - - - - - - - -0.00021 0.0149Air Pilgrim Station 06-17-2014 <0.0278 - - - - - - - - -0.00110 0.0110Air Pilgrim Station 06-25-2014 <0.0306 - - - - - - - - 0.00000 0.0164Air Pilgrim Station 07-01-2014 <0.0330 - - - - - - - - -0.00087 0.0158Air Pilgrim Station 07-08-2014 <0.0389 - - - - - - - - 0.00491 0.0183Air Pilgrim Station 07-15-2014 <0.0379 - - - - - - - - 0.00303 0.0109Air Pilgrim Station 07-22-2014 <0.0425 - - - - - - - - 0.00419 0.0167Air Pilgrim Station 07-29-2014 <0.0376 - - - - - - - - 0.00471 0.0180
-" = Not analyzed* I-131 = iodine 131; Be-7 = Beryllium 7; K-40 = Potassium-40; Mn-54=Manganese-54; Fe-59=Iron 59; Co-60 = Cobalt 60; Zn-65=Zinc 65; Cs-134 = Cesium 134; Cs-137=Cesium 137; 3-H = Tritium “<” = value is less than the listed MDA value, with the exception of Alpha and Beta where exact values sampled are provided
22
Sample Type Location Date
I-131* (pCi/m3)
Be-7* (pCi/m3)
K-40* (pCi/m3)
Mn-54* (pCi/m3)
Fe-59* (pCi/m3)
Co-60* (pCi/m3)
Zn-65* (pCi/m3)
Cs-134* (pCi/m3)
Cs-137* (pCi/m3)
Gross Alpha
(pCi/m3)
Gross Beta
(pCi/m3)Air Pilgrim Station 08-05-2014 <0.0359 - - - - - - - - 0.00463 0.0177Air Pilgrim Station 08-12-2014 <0.0396 - - - - - - - - 0.00574 0.0157Air Pilgrim Station
Quarterly Composite08-15-2014 - <0.22 0.1080 <0.00176 <0.179 <0.0011 <0.00525 - <0.000953 - -
Air Pilgrim Station 08-19-2014 <0.0328 - - - - - - - - 0.00540 0.0144Air Pilgrim Station 08-26-2014 <0.0300 - - - - - - - - 0.00141 0.0137Air Pilgrim Station 09-02-2014 <0.0201 - - - - - - - - 0.00286 0.0126Air Pilgrim Station 09-09-2014 <0.0330 - - - - - - - - 0.00245 0.0123Air Pilgrim Station 09-16-2014 <0.0252 - - - - - - - - 0.00174 0.0100Air Pilgrim Station 09-23-2014 <0.0254 - - - - - - - - 0.00283 0.0104Air Pilgrim Station 09-30-2014 <0.0258 - - - - - - - - 0.00752 0.0245Air Pilgrim Station 10-08-2014 <0.0218 - - - - - - - - 0.00382 0.0166Air Pilgrim Station 10-14-2014 <0.0244 - - - - - - - - 0.00301 0.0138Air Pilgrim Station 10-21-2014 <0.0267 - - - - - - - - 0.00501 0.0185Air Pilgrim Station 10-28-2014 <0.0202 - - - - - - - - 0.00215 0.0108Air Pilgrim Station 11-04-2014 <0.0310 - - - - - - - - 0.00921 0.0247Air Pilgrim Station 11-12-2014 <0.0221 - - - - - - - - 0.00845 0.0210Air Pilgrim Station
Quarterly Composite11-15-2014 - <0.108 <0.0252 <0.00153 <0.0457 <0.00108 <0.00432 - <0.001 - -
Air Pilgrim Station 11-19-2014 <0.0258 - - - - - - - - 0.00316 0.0159Air Pilgrim Station 11-25-2014 <0.0258 - - - - - - - - 0.00450 0.0225Air Pilgrim Station 12-02-2014 <0.0256 - - - - - - - - 0.00281 0.0165Air Pilgrim Station 12-09-2014 <0.0271 - - - - - - - - 0.00284 0.0168Air Pilgrim Station 12-16-2014 <0.0253 - - - - - - - - 0.00067 0.0100Air Pilgrim Station 12-24-2014 <0.0293 - - - - - - - - 0.00022 0.0100Air Pilgrim Station 12-31-2014 <0.0248 - - - - - - - - 0.00302 0.0181Air Background 01-07-2014 <0.0317 - - - - - - - - 0.00797 0.0201Air Background 01-14-2014 <0.0295 - - - - - - - - 0.00955 0.0237Air Background 01-21-2014 <0.0315 - - - - - - - - 0.00936 0.0261Air Background 01-29-2014 <0.0309 - - - - - - - - 0.00641 0.0179Air Background 02-04-2014 <0.0331 - - - - - - - - 0.00939 0.0317Air Background 02-11-2014 <0.0330 - - - - - - - - 0.00881 0.0255Air Background
Quarterly Composite02-15-2014 - 0.0742 <0.0293 <0.0017 <0.03 <0.00131 <0.00493 - <0.00127 - -
Air Background 02-18-2014 <0.0339 - - - - - - - - 0.00518 0.0226Air Background 02-26-2014 <0.0423 - - - - - - - - 0.00588 0.0207
-" = Not analyzed* I-131 = iodine 131; Be-7 = Beryllium 7; K-40 = Potassium-40; Mn-54=Manganese-54; Fe-59=Iron 59; Co-60 = Cobalt 60; Zn-65=Zinc 65; Cs-134 = Cesium 134; Cs-137=Cesium 137; 3-H = Tritium “<” = value is less than the listed MDA value, with the exception of Alpha and Beta where exact values sampled are provided

23
Sample Type Location Date
I-131* (pCi/m3)
Be-7* (pCi/m3)
K-40* (pCi/m3)
Mn-54* (pCi/m3)
Fe-59* (pCi/m3)
Co-60* (pCi/m3)
Zn-65* (pCi/m3)
Cs-134* (pCi/m3)
Cs-137* (pCi/m3)
Gross Alpha
(pCi/m3)
Gross Beta
(pCi/m3)Air Background 03-04-2014 <0.0596 - - - - - - - - 0.00988 0.0329Air Background 03-11-2014 <0.0312 - - - - - - - - 0.00439 0.0180Air Background 03-18-2014 <0.0329 - - - - - - - - 0.00592 0.0238Air Background 03-25-2014 <0.0361 - - - - - - - - 0.00240 0.0132Air Background 04-01-2014 0.0486 - - - - - - - - 0.00450 0.0202Air Background 04-08-2014 <0.0350 - - - - - - - - 0.00465 0.0178Air Background 04-15-2014 <0.0448 - - - - - - - - 0.00500 0.0214Air Background 04-22-2014 <0.0367 - - - - - - - - 0.00361 0.0175Air Background 04-29-2014 <0.0373 - - - - - - - - 0.00124 0.0150Air Background 05-06-2014 <0.0264 - - - - - - - - 0.00176 0.0106Air Background 05-13-2014 <0.0322 - - - - - - - - 0.00159 0.0177Air Background
Quarterly Composite05-15-2014 - 0.0956 <0.0176 <0.000986 <0.0068 <0.000923 <0.00266 - <0.0008 - -
Air Background 05-20-2014 <0.0378 - - - - - - - - 0.00132 0.0152Air Background 05-27-2014 <0.0253 - - - - - - - - 0.00018 0.0136Air Background 06-03-2014 <0.0277 - - - - - - - - 0.00088 0.0154Air Background 06-10-2014 <0.0252 - - - - - - - - 0.00044 0.0119Air Background 06-17-2014 <0.0255 - - - - - - - - 0.00009 0.0122Air Background 06-24-2014 <0.0224 - - - - - - - - 0.00105 0.0142Air Background 07-01-2014 <0.0305 - - - - - - - - 0.00272 0.0184Air Background 07-08-2014 <0.0216 - - - - - - - - 0.00864 0.0179Air Background 07-15-2014 <0.0200 - - - - - - - - 0.00584 0.0180Air Background 07-22-2014 <0.0217 - - - - - - - - 0.00535 0.0145Air Background 07-29-2014 <0.0258 - - - - - - - - 0.00753 0.0204Air Background 08-05-2014 <0.0311 - - - - - - - - 0.00535 0.0182Air Background 08-12-2014 <0.0304 - - - - - - - - 0.00592 0.0177Air Background
Quarterly Composite08-15-2014 - <0.429 <0.029 <0.00223 <0.231 <0.00136 <0.00702 - <0.00126 - -
Air Background 08-19-2014 <0.0255 - - - - - - - - 0.00413 0.0152Air Background 08-26-2014 <0.0213 - - - - - - - - 0.00272 0.0116Air Background 09-02-2014 <0.0250 - - - - - - - - 0.00468 0.0169Air Background 09-09-2014 <0.0221 - - - - - - - - 0.00692 0.0191Air Background 09-16-2014 <0.0233 - - - - - - - - 0.00079 0.0094Air Background 09-23-2014 <0.0321 - - - - - - - - 0.00340 0.0172Air Background 09-30-2014 <0.0230 - - - - - - - - 0.00565 0.0236Air Background 10-07-2014 <0.0223 - - - - - - - - 0.00607 0.0189
-" = Not analyzed* I-131 = iodine 131; Be-7 = Beryllium 7; K-40 = Potassium-40; Mn-54=Manganese-54; Fe-59=Iron 59; Co-60 = Cobalt 60; Zn-65=Zinc 65; Cs-134 = Cesium 134; Cs-137=Cesium 137; 3-H = Tritium “<” = value is less than the listed MDA value, with the exception of Alpha and Beta where exact values sampled are provided

24
Sample Type Location Date
I-131* (pCi/m3)
Be-7* (pCi/m3)
K-40* (pCi/m3)
Mn-54* (pCi/m3)
Fe-59* (pCi/m3)
Co-60* (pCi/m3)
Zn-65* (pCi/m3)
Cs-134* (pCi/m3)
Cs-137* (pCi/m3)
Gross Alpha
(pCi/m3)
Gross Beta
(pCi/m3)Air Background 10-14-2014 <0.0226 - - - - - - - - 0.00901 0.0228Air Background 10-21-2014 <0.0221 - - - - - - - - 0.00901 0.0213Air Background 10-28-2014 <0.0256 - - - - - - - - 0.00385 0.0141Air Background 11-04-2014 <0.0226 - - - - - - - - 0.00545 0.0229Air Background 11-10-2014 <0.0287 - - - - - - - - 0.00624 0.0223Air Background
Quarterly Composite11-15-2014 - <0.105 <0.0262 <0.00151 <0.0451 <0.00106 <0.00421 - <0.00102 - -
Air Background 11-18-2014 <0.0239 - - - - - - - - 0.00320 0.0163Air Background 11-25-2014 <0.0329 - - - - - - - - 0.00784 0.0268Air Background 12-02-2014 <0.0290 - - - - - - - - 0.00306 0.0175Air Background 12-09-2014 <0.0219 - - - - - - - - 0.00378 0.0214Air Background 12-16-2014 <0.0303 - - - - - - - - 0.00236 0.0145Air Background 12-23-2014 <0.0255 - - - - - - - - 0.00424 0.0159Air Background 12-30-2014 <0.0234 - - - - - - - - 0.00443 0.0185
-" = Not analyzed* I-131 = iodine 131; Be-7 = Beryllium 7; K-40 = Potassium-40; Mn-54=Manganese-54; Fe-59=Iron 59; Co-60 = Cobalt 60; Zn-65=Zinc 65; Cs-134 = Cesium 134; Cs-137=Cesium 137; 3-H = Tritium “<” = value is less than the listed MDA value, with the exception of Alpha and Beta where exact values sampled are provided

25Table 4. Seabrook Nuclear Power Station 2014 Environmental Monitoring Data – Liquid matrices
Sample Type Location Date
K-40* (pCi/L)
Mn-54*
(pCi/L)Fe-59* (pCi/L)
Co-60* (pCi/L)
Zn-65* (pCi/L)
I-131* (pCi/L)
Cs-134* (pCi/L)
Cs-137* (pCi/L)
Ba-140* (pCi/L)
3-H* (pCi/L)
Raw milk Rowley 01-08-2014 1410 - - - - <6.46 <7.42 <6.92 <22.3 -Raw milk Rowley 02-12-2014 1390 - - - - <6.36 <7.62 <7.12 <22.8 -Raw milk Rowley 03-12-2014 1350 - - - - <5.98 <6.56 <6.69 <26.1 -Raw milk Rowley 04-09-2014 1540 - - - - <7.47 <7.95 <8.00 <27.1 -Raw milk Rowley 05-07-2014 1440 - - - - <6.31 <6.85 <6.59 <22.3 -Raw milk Rowley 06-04-2014 1350 - - - - <5.13 <6.12 <5.49 <18.8 -Raw milk Rowley 07-02-2014 1320 - - - - <4.46 <4.86 <4.76 <15.4 -Raw milk Rowley 08-19-2014 1390 - - - - <5.16 <5.83 <5.57 <19.3 -Raw milk Rowley 09-10-2014 1340 - - - - <3.81 <4.15 <4.06 <13.7 -Raw milk Rowley 10-02-2014 1340 - - - - <5.27 <6.05 <5.51 <19.4 -Raw milk Rowley 11-12-2014 1500 - - - - <4.05 <4.34 <4.30 <14.6 -Raw milk Rowley 12-03-2014 1380 - - - - <4.28 <4.11 <4.72 <15.2 -Surface Water Ipswich Bay (background) 01-21-2014 250 <6.43 <12.7 <5.8 <16 <12.3 - <5.6 - -Surface Water Ipswich Bay (background)
Quarterly Composite02-15-2014 - - - - - - - - - <300
Surface Water Ipswich Bay (background) 02-20-2014 386 <5.2 <12.9 <6.19 <19.3 <8.55 - <6.79 - -Surface Water Ipswich Bay (background) 03-18-2014 312 <5.8 <11.1 <5.5 <13.2 <5.9 - <5.2 - -Surface Water Ipswich Bay (background) 04-21-2014 273 <4.4 <15.1 <5.8 <17.2 <25.1 - <6.2 - -Surface Water Ipswich Bay (background)
Quarterly Composite05-15-2014 - - - - - - - - - <300
Surface Water Ipswich Bay (background) Quarterly Composite
05-15-2014 - - - - - - - - - <300
Surface Water Ipswich Bay (background) 05-21-2014 292 <4.36 <9.7 <4.6 <12.6 <8.5 - <4.7 - -Surface Water Ipswich Bay (background) 06-23-2014 312 <4.21 <9.62 <4.06 <11.1 <13.4 - <4.41 - -Surface Water Ipswich Bay (background) 07-21-2014 264 <3.78 <8.57 <4.22 <11 <5.7 - <4.47 - -Surface Water Ipswich Bay (background)
Quarterly Composite08-15-2014 - - - - - - - - - <300
Surface Water Ipswich Bay (background) 08-19-2014 282 <4.33 <10.7 <3.79 <9.56 <25.7 - <3.7 - -Surface Water Ipswich Bay (background) 09-23-2014 355 <4.25 <9.38 <4.23 <11.5 <9.92 - <4.49 - -Surface Water Ipswich Bay (background) 10-20-2014 337 <5.31 <9.14 <4.38 <10.8 <8.8 - <4.35 - -Surface Water Ipswich Bay (background)
Quarterly Composite11-15-2014 - - - - - - - - - <300
Surface Water Ipswich Bay (background) 11-17-2014 258 <3.64 <17.5 <5.11 <13.5 <143 - <5.16 - -Surface Water Ipswich Bay (background) 12-22-2014 230 <0 <8.04 <3.67 <9.98 <6.45 - <3.82 - -
"-" Not analyzed* K-40 = Potassium-40; Mn-54=Manganese-54; Fe-59=Iron 59; Co-60 = Cobalt 60; Zn-65=Zinc 65; Cs-134-Cesium 134; Cs-137=Cesium 137; Ba-140 = Beryllium 140; H-3 = Tritium1. Sample considered “background” for the purpose of NRC regulations, but considered ‘indicator” by MDPH because it falls within the 10-mile EPZ.“<” = value is less than the listed MDA value.
26
Table 5. Seabrook Nuclear Power Station 2014 Environmental Monitoring Data – Solid Samples
Sample Type Location DateBe-7* (pCi/kg)
K-40* (pCi/kg)
Mn-54* (pCi/kg)
Fe-59* (pCi/kg)
Co-60* (pCi/kg)
Zn-65* (pCi/kg)
I-131* (pCi/kg)
Cs-137*
(pCi/kg)Chondrus Ipswich Bay (background) 05-21-2014 690 27,600 <13 <31.8 <14.9 <37.7 144 <12.9Chondrus Ipswich Bay (background) 12-15-2014 295 18,400 <15.5 <38.2 <17.7 <47.1 28.8 <15.6Modiolus Ipswich Bay (background) 05-21-2014 <59.3 1,770 <5.13 <16.6 <5.12 <14.0 - <4.94Mytilus Ipswich Bay (background) 05-23-2014 <87.5 1,430 <6.08 <26.5 <6.43 <16.8 - <5.4Mytilus Ipswich Bay (background) 11-17-2014 <99.6 1,430 <6.47 <29.6 <6.27 <20.7 - <6.21Modiolus Ipswich Bay (background) 12-15-2014 <58.7 1,140 <4.87 <16.5 <5.1 <14.7 - <5.12Skatewings Ipswich Bay (background) 05-21-2014 <1210 2,110 <79.3 <374 <66.8 <195 - <70.7Flounder Ipswich Bay (background) 08-19-2014 <163 4,190 <7.7 <58 <7.2 <23.6 - <7.28Skatewings Ipswich Bay (background) 12-02-2014 <2850 2,550 <135 <940 <122 <352 - <114Lobster Ipswich Bay (background) 05-27-2014 <76.8 1,980 <4.86 <24.7 <4.84 <14.7 - <4.34Lobster Ipswich Bay (background) 11-21-2014 <137 1,860 <5.58 <45.7 <5.03 <17.4 - <4.8Sediment(Beach) Ipswich (background) 05-21-2014 - 14,200 - - <24.8 - - <23.2Sediment(Beach) Ipswich (background) 05-21-2014 - 15,300 - - <23.9 - - <24.0Sediment(Beach) Ipswich (background) 05-21-2014 - 14,700 - - <23.7 - - <22.9Sediment (Subtidal) Ipswich (background) 05-21-2014 - 12,200 - - <34.9 - - <39.5Sediment (Subtidal) Ipswich (background) 05-21-2014 - 13,100 - - <35.3 - - <33.6Sediment (Subtidal) Ipswich (background) 05-21-2014 - 12,200 - - <31.5 - - <31.7Sediment(Beach) Ipswich (background) 11-17-2014 - 14,900 - - <31.1 - - <17.6Sediment(Beach) Ipswich (background) 11-17-2014 - 15,300 - - <32.1 - - <30.3Sediment(Beach) Ipswich (background) 11-17-2014 - 16,300 - - <25.3 - - <24.6Sediment (Subtidal) Ipswich (background) 12-15-2014 - 11,500 - - <31.0 - - <34.9Sediment (Subtidal) Ipswich (background) 12-15-2014 - 11,600 - - <36.8 - - <39.4Sediment (Subtidal) Ipswich (background) 12-15-2014 - 11,500 - - <28.2 - - <27.5Strawberries Salisbury 07-02-2014 <45 1,140 <5.5 <10.6 <6.2 <14.8 - <5.88Strawberries Ipswich (background) 07-02-2014 <38.5 1,080 <4.46 <10.4 <4.59 <11.9 - <4.87Green Beans Salisbury 07-22-2014 <51.3 1,870 <6.14 <13.2 <6.52 <16.9 - <6.38Zucchini Ipswich (background) 07-22-2014 <3.79 218 <0.457 <1.05 <0.5 <1.36 - <0.488Kale Salisbury 08-19-2014 <60.2 4,630 <7.34 <15.8 <7.58 <20.7 - <7.64Swiss Chard Ipswich (background) 08-19-2014 299 6,300 <9.2 <21.2 <10.5 <27.7 - <9.58
"-" Not analyzed* K-40 = Potassium-40; Mn-54=Manganese-54; Fe-59=Iron 59; Co-60 = Cobalt 60; Zn-65=Zinc 65; Cs-134-Cesium 134; Cs-137=Cesium 137; Ba-140 = Beryllium 140; H-3 = Tritium1. Sample considered “background” for the purpose of NRC regulations, but considered ‘indicator” by MDPH because it falls within the 10-mile EPZ.“<” = value is less than the listed MDA value.

27
"-" Not analyzed* K-40 = Potassium-40; Mn-54=Manganese-54; Fe-59=Iron 59; Co-60 = Cobalt 60; Zn-65=Zinc 65; Cs-134-Cesium 134; Cs-137=Cesium 137; Ba-140 = Beryllium 140; H-3 = Tritium1. Sample considered “background” for the purpose of NRC regulations, but considered ‘indicator” by MDPH because it falls within the 10-mile EPZ.“<” = value is less than the listed MDA value.

28Table 6. Seabrook Nuclear Power Station 2014 Environmental Monitoring Data – Air Samples
Sample Type Location Date
I-131* (pCi/m3)
Be-7* (pCi/m3)
K-40* (pCi/m3)
Mn-54*
(pCi/m3)Fe-59* (pCi/m3)
Co-60* (pCi/m3)
Zn-65* (pCi/m3)
Cs-134* (pCi/m3)
Cs-137* (pCi/m3)
Gross Alpha (pCi/m3)
Gross Beta
(pCi/m3)Air Salisbury Fire Station 01-01-2014 <0.0388 - - - - - - - 0.00955 0.0307Air Salisbury Fire Station 01-08-2014 <0.0300 - - - - - - - - 0.00798 0.0270Air Salisbury Fire Station 01-15-2014 <0.0315 - - - - - - - - 0.00567 0.0223Air Salisbury Fire Station 01-22-2014 <0.0345 - - - - - - - - 0.00728 0.0255Air Salisbury Fire Station 01-29-2014 <0.0460 - - - - - - - - 0.00435 0.0199Air Salisbury Fire Station 02-06-2014 <0.0725 - - - - - - - - 0.00473 0.0369Air Salisbury Fire Station 02-12-2014 <0.0365 - - - - - - - - 0.00740 0.0294Air Salisbury Fire Station -
Quarterly Composite02-15-2014 -
0.0805 <0.029 <0.00167 <0.0309 <0.0013 <0.00493 - <0.00128 - -
Air Salisbury Fire Station 02-19-2014 <0.0680 - - - - - - - - 0.00259 0.0199Air Salisbury Fire Station 02-26-2014 <0.0322 - - - - - - - - 0.00002 0.0098Air Salisbury Fire Station 03-12-2014 <0.0487 - - - - - - - - 0.00148 0.0142Air Salisbury Fire Station 03-05-2014 <0.0465 - - - - - - - - 0.00474 0.0332Air Salisbury Fire Station 03-19-2014 <0.0299 - - - - - - - - 0.00184 0.0222Air Salisbury Fire Station 03-26-2014 <0.0360 - - - - - - - - 0.00254 0.0189Air Salisbury Fire Station 04-02-2014 <0.0351 - - - - - - - - 0.00118 0.0186Air Salisbury Fire Station 04-09-2014 <0.0267 - - - - - - - - 0.00314 0.0154Air Salisbury Fire Station 04-16-2014 <0.0347 - - - - - - - - 0.00458 0.0181Air Salisbury Fire Station 04-23-2014 <0.0386 - - - - - - - - 0.00330 0.0183Air Salisbury Fire Station 04-30-2014 <0.0512 - - - - - - - - 0.00044 0.0095Air Salisbury Fire Station 05-07-2014 <0.0353 - - - - - - - - 0.00163 0.0090Air Salisbury Fire Station 05-14-2014 <0.0338 - - - - - - - - 0.00300 0.0148Air Salisbury Fire Station -
Quarterly Composite05-15-2014 -
0.0788 <0.025 <0.00119 <0.00777 <0.000985 <0.0031 - <0.000971 - -
Air Salisbury Fire Station 05-21-2014 <0.0373 - - - - - - - - 0.00163 0.0123Air Salisbury Fire Station 05-28-2014 <0.0218 - - - - - - - - 0.00100 0.0101Air Salisbury Fire Station 06-04-2014 <0.0260 - - - - - - - - 0.00100 0.0120Air Salisbury Fire Station 06-11-2014 <0.0267 - - - - - - - - 0.00044 0.0125Air Salisbury Fire Station 06-18-2014 <0.0307 - - - - - - - - 0.00037 0.0135Air Salisbury Fire Station 06-25-2014 <0.0281 - - - - - - - - 0.00019 0.0146Air Salisbury Fire Station 07-02-2014 <0.0279 - - - - - - - - 0.00171 0.0213Air Salisbury Fire Station 07-09-2014 <0.0218 - - - - - - - - 0.00665 0.0214Air Salisbury Fire Station 07-15-2014 <0.0317 - - - - - - - - 0.00536 0.0190Air Salisbury Fire Station 07-22-2014 <0.0355 - - - - - - - - 0.00315 0.0132Air Salisbury Fire Station 07-30-2014 <0.0267 - - - - - - - - 0.00609 0.0211
-" = Not analyzed* I-131 = iodine 131; Be-7 = Beryllium 7; K-40 = Potassium-40; Mn-54=Manganese-54; Fe-59=Iron 59; Co-60 = Cobalt 60; Zn-65=Zinc 65; Cs-134 = Cesium 134; Cs-137=Cesium 137; 3-H = Tritium “<” = value is less than the listed MDA value, with the exception of Alpha and Beta where exact values sampled are included

29
Sample Type Location Date
I-131* (pCi/m3)
Be-7* (pCi/m3)
K-40* (pCi/m3)
Mn-54*
(pCi/m3)Fe-59* (pCi/m3)
Co-60* (pCi/m3)
Zn-65* (pCi/m3)
Cs-134* (pCi/m3)
Cs-137* (pCi/m3)
Gross Alpha (pCi/m3)
Gross Beta
(pCi/m3)Air Salisbury Fire Station 08-06-2014 <0.0237 - - - - - - - - 0.00715 0.0243Air Salisbury Fire Station 08-13-2014 <0.0335 - - - - - - - - 0.00450 0.0167Air Salisbury Fire Station -
Quarterly Composite08-15-2014 -
<0.408 <0.00287 <0.00222 <0.229 <0.00138 <0.00667 - <0.00124 - -
Air Salisbury Fire Station 08-19-2014 <0.0400 - - - - - - - - 0.00228 0.0160Air Salisbury Fire Station 08-27-2014 <0.0279 - - - - - - - - 0.00361 0.0166Air Salisbury Fire Station 09-03-2014 <0.0317 - - - - - - - - 0.00576 0.0270Air Salisbury Fire Station 09-10-2014 <0.0288 - - - - - - - - 0.00516 0.0221Air Salisbury Fire Station 09-17-2014 <0.0377 - - - - - - - - 0.00257 0.0172Air Salisbury Fire Station 09-23-2014 <0.0364 - - - - - - - - 0.00337 0.0205Air Salisbury Fire Station 10-02-2014 <0.0211 - - - - - - - - 0.00629 0.0210Air Salisbury Fire Station 10-08-2014 <0.0323 - - - - - - - - 0.00410 0.0180Air Salisbury Fire Station 10-15-2014 <0.0328 - - - - - - - - 0.00563 0.0198Air Salisbury Fire Station 10-22-2014 <0.0310 - - - - - - - - 0.00381 0.0176Air Salisbury Fire Station 10-29-2014 <0.0383 - - - - - - - - 0.00105 0.0089Air Salisbury Fire Station 11-05-2014 <0.0347 - - - - - - - - 0.00492 0.0181Air Salisbury Fire Station 11-11-2014 <0.0410 - - - - - - - - 0.00656 0.0217Air Salisbury Fire Station -
Quarterly Composite11-15-2014 -
<0.138 <0.0288 <0.00199 <0.058 <0.00133 <0.0055 - <0.00125 - -
Air Salisbury Fire Station 11-19-2014 <0.0299 - - - - - - - - 0.00593 0.0176Air Salisbury Fire Station 11-26-2014 <0.0361 - - - - - - - - 0.00606 0.0260Air Salisbury Fire Station 12-03-2014 <0.0321 - - - - - - - - 0.00204 0.0161Air Salisbury Fire Station 12-11-2014 <0.0212 - - - - - - - - 0.00454 0.0159Air Salisbury Fire Station 12-16-2014 <0.0549 - - - - - - - - 0.00202 0.0182Air Salisbury Fire Station 12-24-2014 <0.0206 - - - - - - - - 0.00146 0.0147Air Salisbury Fire Station 12-31-2014 <0.0284 - - - - - - - - 0.00483 0.0201Air Background 01-07-2014 - - - - - - - - - 0.00797 0.0201Air Background 01-14-2014 - - - - - - - - - 0.00955 0.0237Air Background 01-21-2014 - - - - - - - - - 0.00936 0.0261Air Background 01-29-2014 - - - - - - - - - 0.00641 0.0179Air Background 02-04-2014 - - - - - - - - - 0.00939 0.0317Air Background 02-11-2014 - - - - - - - - - 0.00881 0.0255Air Background Quarterly
Composite02-15-2014 - 0.0742 <0.0293 <0.0017 <0.03 <0.00131 <0.00493 - <0.00127 - -
Air Background 02-18-2014 - - - - - - - - - 0.00518 0.0226Air Background 02-26-2014 - - - - - - - - - 0.00588 0.0207
-" = Not analyzed* I-131 = iodine 131; Be-7 = Beryllium 7; K-40 = Potassium-40; Mn-54=Manganese-54; Fe-59=Iron 59; Co-60 = Cobalt 60; Zn-65=Zinc 65; Cs-134 = Cesium 134; Cs-137=Cesium 137; 3-H = Tritium “<” = value is less than the listed MDA value, with the exception of Alpha and Beta where exact values sampled are included
30
Sample Type Location Date
I-131* (pCi/m3)
Be-7* (pCi/m3)
K-40* (pCi/m3)
Mn-54*
(pCi/m3)Fe-59* (pCi/m3)
Co-60* (pCi/m3)
Zn-65* (pCi/m3)
Cs-134* (pCi/m3)
Cs-137* (pCi/m3)
Gross Alpha (pCi/m3)
Gross Beta
(pCi/m3)Air Background 03-04-2014 - - - - - - - - - 0.00988 0.0329Air Background 03-11-2014 - - - - - - - - - 0.00439 0.0180Air Background 03-18-2014 - - - - - - - - - 0.00592 0.0238Air Background 03-25-2014 - - - - - - - - - 0.00240 0.0132Air Background 04-01-2014 - - - - - - - - - 0.00450 0.0202Air Background 04-08-2014 - - - - - - - - - 0.00465 0.0178Air Background 04-15-2014 - - - - - - - - - 0.00500 0.0214Air Background 04-22-2014 - - - - - - - - - 0.00361 0.0175Air Background 04-29-2014 - - - - - - - - - 0.00124 0.0150Air Background 05-06-2014 - - - - - - - - - 0.00176 0.0106Air Background 05-13-2014 - - - - - - - - - 0.00159 0.0177Air Background Quarterly
Composite05-15-2014
- 0.0956 <0.0176 <0.000986 <0.0068 <0.000983 <0.00266 - <0.0008 - -
Air Background 05-20-2014 - - - - - - - - - 0.00132 0.0152Air Background 05-27-2014 - - - - - - - - - 0.00018 0.0136Air Background 06-03-2014 - - - - - - - - - 0.00088 0.0154Air Background 06-10-2014 - - - - - - - - - 0.00044 0.0119Air Background 06-17-2014 - - - - - - - - - 0.00009 0.0122Air Background 06-24-2014 - - - - - - - - - 0.00105 0.0142Air Background 07-01-2014 - - - - - - - - - 0.00272 0.0184Air Background 07-08-2014 - - - - - - - - - 0.00864 0.0179Air Background 07-15-2014 - - - - - - - - - 0.00584 0.0180Air Background 07-22-2014 - - - - - - - - - 0.00535 0.0145Air Background 07-29-2014 - - - - - - - - - 0.00753 0.0204Air Background 08-05-2014 - - - - - - - - - 0.00535 0.0182Air Background 08-12-2014 - - - - - - - - - 0.00592 0.0177Air Background Quarterly
Composite08-15-2014 - <0.429 <0.029 <0.00223 <0.231 <0.00136 <0.00702 - <0.00126 - -
Air Background 08-19-2014 - - - - - - - - - 0.00413 0.0152Air Background 08-26-2014 - - - - - - - - - 0.00272 0.0116Air Background 09-02-2014 - - - - - - - - - 0.00468 0.0169Air Background 09-09-2014 - - - - - - - - - 0.00692 0.0191Air Background 09-16-2014 - - - - - - - - - 0.00079 0.0094Air Background 09-23-2014 - - - - - - - - - 0.00340 0.0172Air Background 09-30-2014 - - - - - - - - - 0.00565 0.0236Air Background 10-07-2014 - - - - - - - - - 0.00607 0.0189
-" = Not analyzed* I-131 = iodine 131; Be-7 = Beryllium 7; K-40 = Potassium-40; Mn-54=Manganese-54; Fe-59=Iron 59; Co-60 = Cobalt 60; Zn-65=Zinc 65; Cs-134 = Cesium 134; Cs-137=Cesium 137; 3-H = Tritium “<” = value is less than the listed MDA value, with the exception of Alpha and Beta where exact values sampled are included

31
Sample Type Location Date
I-131* (pCi/m3)
Be-7* (pCi/m3)
K-40* (pCi/m3)
Mn-54*
(pCi/m3)Fe-59* (pCi/m3)
Co-60* (pCi/m3)
Zn-65* (pCi/m3)
Cs-134* (pCi/m3)
Cs-137* (pCi/m3)
Gross Alpha (pCi/m3)
Gross Beta
(pCi/m3)Air Background 10-14-2014 - - - - - - - - - 0.00901 0.0228Air Background 10-21-2014 - - - - - - - - - 0.00901 0.0213Air Background 10-28-2014 - - - - - - - - - 0.00385 0.0141Air Background 11-04-2014 - - - - - - - - - 0.00545 0.0229Air Background 11-10-2014 - - - - - - - - - 0.00624 0.0223Air Background Quarterly
Composite11-15-2014 - <0.105 <0.0262 <0.00151 <0.0451 <0.00106 <0.00421 - <0.00102 - -
Air Background 11-18-2014 - - - - - - - - - 0.00320 0.0163Air Background 11-25-2014 - - - - - - - - - 0.00784 0.0268Air Background 12-02-2014 - - - - - - - - - 0.00306 0.0175Air Background 12-09-2014 - - - - - - - - - 0.00378 0.0214Air Background 12-16-2014 - - - - - - - - - 0.00236 0.0145Air Background 12-23-2014 - - - - - - - - - 0.00424 0.0159Air Background 12-30-2014 - - - - - - - - - 0.00443 0.0185
-" = Not analyzed* I-131 = iodine 131; Be-7 = Beryllium 7; K-40 = Potassium-40; Mn-54=Manganese-54; Fe-59=Iron 59; Co-60 = Cobalt 60; Zn-65=Zinc 65; Cs-134 = Cesium 134; Cs-137=Cesium 137; 3-H = Tritium “<” = value is less than the listed MDA value, with the exception of Alpha and Beta where exact values sampled are included

32Table 7. Vermont Yankee Power Station – Liquid Matrices
Sample Type Location DateK-40* (pCi/L)
Mn-54* (pCi/L)
Fe-59* (pCi/L)
Co-60* (pCi/L)
Zn-65* (pCi/L)
I-131* (pCi/L)
Cs-134* (pCi/L)
Cs-137* (pCi/L)
Ba-140* (pCi/L)
H-3* (pCi/L)
Milk Bernardston 01-29-2014 1350 <6.19 <6.43 <6.31 <21.2Milk Bernardston 02-27-2014 1560 <8.11 <9.09 <8.63 <29.9Milk Bernardston 03-19-2014 1320 <6.05 <7 <6.86 <21.5Milk Bernardston 04-30-2014 1360 <6.56 <6.36 <6.64 <21.9Milk Bernardston 05-28-2014 1410 <4.46 <5.04 <4.88 <15.9Milk Bernardston 06-25-2014 1290 <4.27 <4.61 <4.81 <14.9Milk Bernardston 07-23-2014 1260 <4.32 <4.33 <4.67 <14.7Milk Bernardston 08-12-2014 1270 <4.29 <4.39 <4.64 <15Milk Bernardston 09-25-2014 1380 <4.36 <4.5 <4.75 <15.2Milk Bernardston 10-23-2014 1240 <4.25 <4.49 <4.66 <15.2Milk Bernardston 11-18-2014 1400 <3.57 <4.09 <3.92 <13.3Milk Bernardston 12-12-2014 1370 <7.82 <5.27 <5.47 <23.8Surface Water Millers River, Athol (background) 03-19-2014 261 <7.46 <14.4 <7.17 <19 <8.22 <7.75Surface Water Millers River, Athol (background) 05-28-2014 <115 <5.11 <10.5 <4.95 <14 <8.01 <5.33Surface Water Millers River, Athol (background) 08-12-2014 <73.8 <3.58 <6.84 <3.57 <8.71 <4.55 <3.83Surface Water Millers River, Athol (background) 11-18-2014 <71.1 <3.61 <7.79 <3.71 <10 <6.11 <3.88Surface Water Connecticut River, Northfield 03-19-2014 1130 <5.58 <11.1 <5.65 <14.4 <6.01 <6.2Surface Water Connecticut River, Northfield 05-28-2014 <69.8 <3.74 <7.14 <3.86 <10.6 <4.08 <3.9Surface Water Connecticut River, Northfield 08-12-2014 <116 <4.98 <9.89 <5.05 <12.4 <5.62 <5.2Surface Water Connecticut River, Northfield 11-18-2014 <108 <4.13 <8.39 <4.22 <10.4 <5.38 <4.4Surface Water Connecticut River, Gill 03-19-2014 189 <7.7 <15.4 <7.7 <20.7 <8.9 <8.0Surface Water Connecticut River, Gill 05-28-2014 <106 <4.3 <8.7 <4.1 <11.8 <6.4 <4.5Surface Water Connecticut River, Gill 08-12-2014 <73 <3.4 <7.0 <3.6 <9.3 <4.1 <3.8Surface Water Connecticut River, Gill 11-18-2014 <108 <4.2 <8.8 <4.3 <11.4 <7.0 <4.5
"-" Not analyzed* K-40 = Potassium-40; Mn-54=Manganese-54; Fe-59=Iron 59; Co-60 = Cobalt 60; Zn-65=Zinc 65; Cs-134-Cesium 134; Cs-137=Cesium 137; Ba-140 = Beryllium 140; H-3 = Tritium1. Sample considered “background” for the purpose of NRC regulations, but considered ‘indicator” by MDPH because it falls within the 10-mile EPZ.“<” = value is less than the listed MDA value.

33
Table 8. Vermont Yankee Power Station Solid Matrices
Sample Type Location DateBe-7*
(pCi/Kg)K-40*
(pCi/Kg)Mn-54* (pCi/Kg)
Fe-59* (pCi/Kg)
Co-60* (pCi/Kg)
Zn-65* (pCi/Kg)
Cs-137* (pCi/Kg)
Fish (composite) Athol, Miller's River (background) 06-25-2014 <1210 3,930 <53 <371 <36 <120 49.4Fish (composite) Gill/Northfield, CT River 07-01-2014 <1200 4,570 <49.8 <374 <43.4 <140 <44.9Fish (bass) Gill/Northfield, CT River 07-01-2014 <992 3,900 <41.4 <304 <34.6 <114 88.8Fish (composite) Gill/Northfield, CT River 10-07-2014 <496 3,490 <31.8 <134 <28 <87.9 <30.7Fish (composite) Athol Miller's River (background) 10-08-2014 <770 4,350 <33.8 <208 <44.2 <125 50.1Sediment Northfield-Conn. River 5/28/2014 - 7,930 - - <27.3 - 35.2Sediment Northfield-Conn. River 9/24/2014 - 7,440 - - <24.5 - <17.4Sediment Gill-Conn. River 5/28/2014 - 8,070 - - <23.4 - <20.1Sediment Gill-Conn. River 9/24/2014 - 6,520 - - <31.6 - <34.0Sediment Athol-Millers River (background) 5/28/2014 - 11,400 - - <41.5 - 136Sediment Athol-Millers River (background) 9/24/2014 - 12,300 - - <38.1 - 124Apples Colrain (background) 09-24-2014 <40.5 1,120 <4.4 <10.7 <4.35 <12 <4.54Sugar Pumpkin Northfield 09-24-2014 <43.7 3,000 <4.48 <13.8 <5.15 <6.39 <4.21Apples Northfield 09-24-2014 49.8 1,380 <4.69 <11.3 <4.74 <12.9 <4.68Grass Northfield, Connecticut River 05-28-2014 540 13,800 <19.9 <47.8 <21.9 - <21.1Grass Gill, Connecticut River 05-28-2014 2580 17,000 <26.2 <61.3 <28.6 - <28.6Grass Northfield, Transfer Station 05-28-2014 1210 21,300 <27.2 <66.3 <29.1 - <28Grass Athol, Millers River (background) 05-28-2014 1580 22,900 <24.3 <62.9 <28.3 - 50Grass Northfield, Transfer Station 09-24-2014 2460 12,100 <15.9 <39 <18 - <16.2Grass Northfield, Connecticut River 09-24-2014 1060 12,300 <11.4 <28.8 <13.1 - 9.29Grass Gill, Connecticut River 09-24-2014 1150 11,200 <11.9 <29 <12.1 - <9.45Grass Athol, Millers River (background) 09-24-2014 2900 13,200 <13.3 <33.9 <15.3 - 22.7Silage/Corn Bernardston 11-18-2014 2020 11,200 <36 <94.1 <39 <107 <36.9
"-" Not analyzed* K-40 = Potassium-40; Mn-54=Manganese-54; Fe-59=Iron 59; Co-60 = Cobalt 60; Zn-65=Zinc 65; Cs-134-Cesium 134; Cs-137=Cesium 137; Ba-140 = Beryllium 140; H-3 = Tritium1. Sample considered “background” for the purpose of NRC regulations, but considered ‘indicator” by MDPH because it falls within the 10-mile EPZ.“<” = value is less than the listed MDA value.

34
Table 9. Vermont Yankee Power Plant – Air Samples
Sample Type Location Date
I-131* (pCi/m3)
Be-7* (pCi/m3)
K-40* (pCi/m3)
Mn-54*(pCi/m3)
Fe-59* (pCi/m3)
Co-60* (pCi/m3)
Zn-65* (pCi/m3)
Cs-134* (pCi/m3)
Cs-137* (pCi/m3)
Gross Alpha (pCi/m3)
Gross Beta (pCi/m3)
Air Northfield / VY 01-07-2014 <0.0408 - - - - - - - - 0.00754 0.0258Air Northfield / VY 01-14-2014 <0.0748 - - - - - - - - 0.00809 0.0276Air Northfield / VY 01-22-2014 <0.0355 - - - - - - - - 0.00747 0.0286Air Northfield / VY 01-29-2014 <0.0402 - - - - - - - - 0.00466 0.024Air Northfield / VY 02-04-2014 <0.0529 - - - - - - - - 0.00408 0.0315Air Northfield / VY 02-11-2014 <0.0498 - - - - - - - - 0.00673 0.0301Air Northfield/ VY
Quarterly composite02-15-2014
0.115 <0.0173 <0.00124 <0.0219 <0.001 <0.00337 - <0.000893
Air Northfield / VY 02-18-2014 <0.0450 - - - - - - - - 0.00377 0.0256Air Northfield / VY 02-27-2014 <0.0357 - - - - - - - - 0.00333 0.0241Air Northfield / VY 03-04-2014 <0.0533 - - - - - - - - 0.00606 0.0372Air Northfield / VY 03-11-2014 <0.0408 - - - - - - - - 0.00496 0.0297Air Northfield / VY 03-19-2014 <0.0394 - - - - - - - - 0.00225 0.0247Air Northfield / VY 03-25-2014 <0.0393 - - - - - - - - 0.00219 0.0228Air Northfield / VY 04-02-2014 <0.0283 - - - - - - - - 0.00162 0.0194Air Northfield / VY 04-08-2014 <0.0390 - - - - - - - - 0.00591 0.0203Air Northfield / VY 04-15-2014 <0.0279 - - - - - - - - 0.00627 0.0236Air Northfield / VY 04-22-2014 <0.0538 - - - - - - - - 0.00487 0.0207Air Northfield / VY 04-30-2014 <0.0243 - - - - - - - - 0.00288 0.0154Air Northfield / VY 05-06-2014 <0.0396 - - - - - - - - 0.00130 0.01300Air Northfield / VY 05-13-2014 <0.0449 - - - - - - - - 0.00242 0.0220Air Northfield/ VY
Quarterly composite05-15-2014
0.0981 <0.0248 <0.00109 <0.00749 <0.000998 <0.00306 - <0.00095
Air Northfield / VY 05-20-2014 <0.0411 - - - - - - - - 0.00242 0.0166Air Northfield / VY 05-28-2014 <0.0218 - - - - - - - - 0.00269 0.0165Air Northfield / VY 06-03-2014 <0.0355 - - - - - - - - 0.00099 0.0163Air Northfield / VY 06-10-2014 <0.0255 - - - - - - - - 0.00332 0.0174Air Northfield / VY 06-17-2014 <0.0312 - - - - - - - - 0.00201 0.0151Air Northfield / VY 06-25-2014 <0.0269 - - - - - - - - 0.00324 0.0179
-" = Not analyzed* I-131 = iodine 131; Be-7 = Beryllium 7; K-40 = Potassium-40; Mn-54=Manganese-54; Fe-59=Iron 59; Co-60 = Cobalt 60; Zn-65=Zinc 65; Cs-134 = Cesium 134; Cs-137=Cesium 137; 3-H = Tritium “<” = value is less than the listed MDA value, with the exception of Alpha and Beta where exact values sampled are included
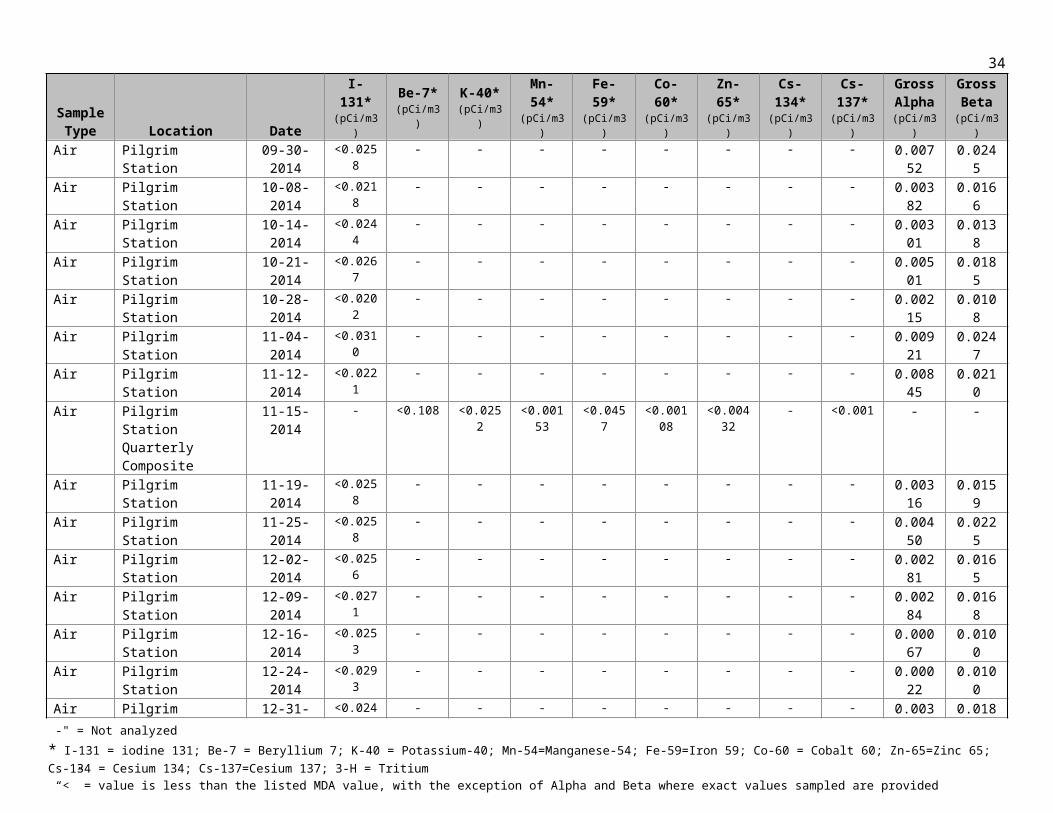
35
Sample Type Location Date
I-131* (pCi/m3)
Be-7* (pCi/m3)
K-40* (pCi/m3)
Mn-54*(pCi/m3)
Fe-59* (pCi/m3)
Co-60* (pCi/m3)
Zn-65* (pCi/m3)
Cs-134* (pCi/m3)
Cs-137* (pCi/m3)
Gross Alpha (pCi/m3)
Gross Beta (pCi/m3)
Air Northfield / VY 07-01-2014 <0.0344 - - - - - - - - 0.00261 0.0216Air Northfield / VY 07-08-2014 <0.0489 - - - - - - - - 0.00792 0.0202Air Northfield / VY 07-15-2014 <0.0236 - - - - - - - - 0.00739 0.0196Air Northfield / VY 07-23-2014 <0.0235 - - - - - - - - 0.00934 0.0201Air Northfield / VY 07-29-2014 <0.0424 - - - - - - - - 0.00791 0.0214Air Northfield / VY 08-05-2014 <0.0372 - - - - - - - - 0.0100 0.0224Air Northfield / VY 08-12-2014 <0.0327 - - - - - - - - 0.00672 0.0193Air Northfield/ VY
Quarterly composite08-15-2014 -
<0.270 0.0958 <0.00149 <0.151 <0.000977 <0.00443 - <0.000818- -
Air Northfield / VY 08-19-2014 <0.0355 - - - - - - - - 0.00412 0.0142Air Northfield / VY 08-26-2014 <0.0265 - - - - - - - - 0.00497 0.0174Air Northfield / VY 09-02-2014 <0.0285 - - - - - - - - 0.00707 0.0236Air Northfield / VY 09-09-2014 <0.0278 - - - - - - - - 0.00536 0.0225Air Northfield / VY 09-16-2014 <0.0251 - - - - - - - - 0.00261 0.0132Air Northfield / VY 09-23-2014 <0.0333 - - - - - - - - 0.00557 0.0204Air Northfield / VY 10-01-2014 <0.0239 - - - - - - - - 0.00700 0.0245Air Northfield / VY 10-08-2014 <0.0364 - - - - - - - - 0.00974 0.0208Air Northfield / VY 10-15-2014 <0.0366 - - - - - - - - 0.00812 0.0222Air Northfield / VY 10-22-2014 <0.0315 - - - - - - - - 0.00723 0.0177Air Northfield / VY 10-28-2014 <0.0359 - - - - - - - - 0.00450 0.0157Air Northfield / VY 11-05-2014 <0.0318 - - - - - - - - 0.0103 0.0230Air Northfield / VY 11-12-2014 <0.0255 - - - - - - - - 0.0102 0.0255
Air Northfield/ VY Quarterly composite
11-15-2014 -0.0706 0.106 <0.0013 <0.0387 <0.000998 <0.00366 - <0.000855
- -
Air Northfield / VY 11-19-2014 <0.0424 - - - - - - - - 0.00607 0.0175Air Northfield / VY 11-25-2014 <0.0600 - - - - - - - - 0.00864 0.0310Air Northfield / VY 12-03-2014 <0.0336 - - - - - - - - 0.00689 0.0240Air Northfield / VY 12-10-2014 <0.0370 - - - - - - - - 0.00682 0.0217Air Northfield / VY 12-17-2014 <0.0230 - - - - - - - - 0.00551 0.0204Air Northfield / VY 12-24-2014 <0.0277 - - - - - - - - 0.00421 0.0184Air Northfield / VY 12-31-2014 <0.0371 - - - - - - - - 0.0053 0.0212
-" = Not analyzed* I-131 = iodine 131; Be-7 = Beryllium 7; K-40 = Potassium-40; Mn-54=Manganese-54; Fe-59=Iron 59; Co-60 = Cobalt 60; Zn-65=Zinc 65; Cs-134 = Cesium 134; Cs-137=Cesium 137; 3-H = Tritium “<” = value is less than the listed MDA value, with the exception of Alpha and Beta where exact values sampled are included

36
Sample Type Location Date
I-131* (pCi/m3)
Be-7* (pCi/m3)
K-40* (pCi/m3)
Mn-54*(pCi/m3)
Fe-59* (pCi/m3)
Co-60* (pCi/m3)
Zn-65* (pCi/m3)
Cs-134* (pCi/m3)
Cs-137* (pCi/m3)
Gross Alpha (pCi/m3)
Gross Beta (pCi/m3)
Air Background 01-07-2014 <0.0317 - - - - - - - - 0.00797 0.0201Air Background 01-14-2014 <0.0295 - - - - - - - - 0.00955 0.0237Air Background 01-21-2014 <0.0315 - - - - - - - - 0.00936 0.0261Air Background 01-29-2014 <0.0309 - - - - - - - - 0.00641 0.0179Air Background 02-04-2014 <0.0331 - - - - - - - - 0.00939 0.0317Air Background 02-11-2014 <0.0330 - - - - - - - - 0.00881 0.0255Air Background Quarterly
Composite02-15-2014 -
0.0742 <0.0293 <0.0017 <0.03 <0.00131 <0.00493 - <0.00127- -
Air Background 02-18-2014 <0.0339 - - - - - - - - 0.00518 0.0226Air Background 02-26-2014 <0.0423 - - - - - - - - 0.00588 0.0207Air Background 03-04-2014 <0.0596 - - - - - - - - 0.00988 0.0329Air Background 03-11-2014 <0.0312 - - - - - - - - 0.00439 0.0180Air Background 03-18-2014 <0.0329 - - - - - - - - 0.00592 0.0238Air Background 03-25-2014 <0.0361 - - - - - - - - 0.00240 0.0132Air Background 04-01-2014 <0.0486 - - - - - - - - 0.00450 0.0202Air Background 04-08-2014 <0.0350 - - - - - - - - 0.00465 0.0178Air Background 04-15-2014 <0.0448 - - - - - - - - 0.00500 0.0214Air Background 04-22-2014 <0.0367 - - - - - - - - 0.00361 0.0175Air Background 04-29-2014 <0.0373 - - - - - - - - 0.00124 0.0150Air Background 05-06-2014 <0.0264 - - - - - - - - 0.00176 0.0106Air Background 05-13-2014 <0.0322 - - - - - - - - 0.00159 0.0177Air Background Quarterly
Composite05-15-2014 -
0.0956 <0.0176 <0.000986 <0.0068 <0.000923 <0.00266 - <0.0008- -
Air Background 05-20-2014 <0.0378 - - - - - - - - 0.00132 0.0152Air Background 05-27-2014 <0.0253 - - - - - - - - 0.00018 0.0136Air Background 06-03-2014 <0.0277 - - - - - - - - 0.00088 0.0154Air Background 06-10-2014 <0.0252 - - - - - - - - 0.00044 0.0119Air Background 06-17-2014 <0.0255 - - - - - - - - 0.000087 0.0122Air Background 06-24-2014 <0.0224 - - - - - - - - 0.00105 0.0142Air Background 07-01-2014 <0.0305 - - - - - - - - 0.00272 0.0184Air Background 07-08-2014 <0.0216 - - - - - - - - 0.00864 0.0179
-" = Not analyzed* I-131 = iodine 131; Be-7 = Beryllium 7; K-40 = Potassium-40; Mn-54=Manganese-54; Fe-59=Iron 59; Co-60 = Cobalt 60; Zn-65=Zinc 65; Cs-134 = Cesium 134; Cs-137=Cesium 137; 3-H = Tritium “<” = value is less than the listed MDA value, with the exception of Alpha and Beta where exact values sampled are included
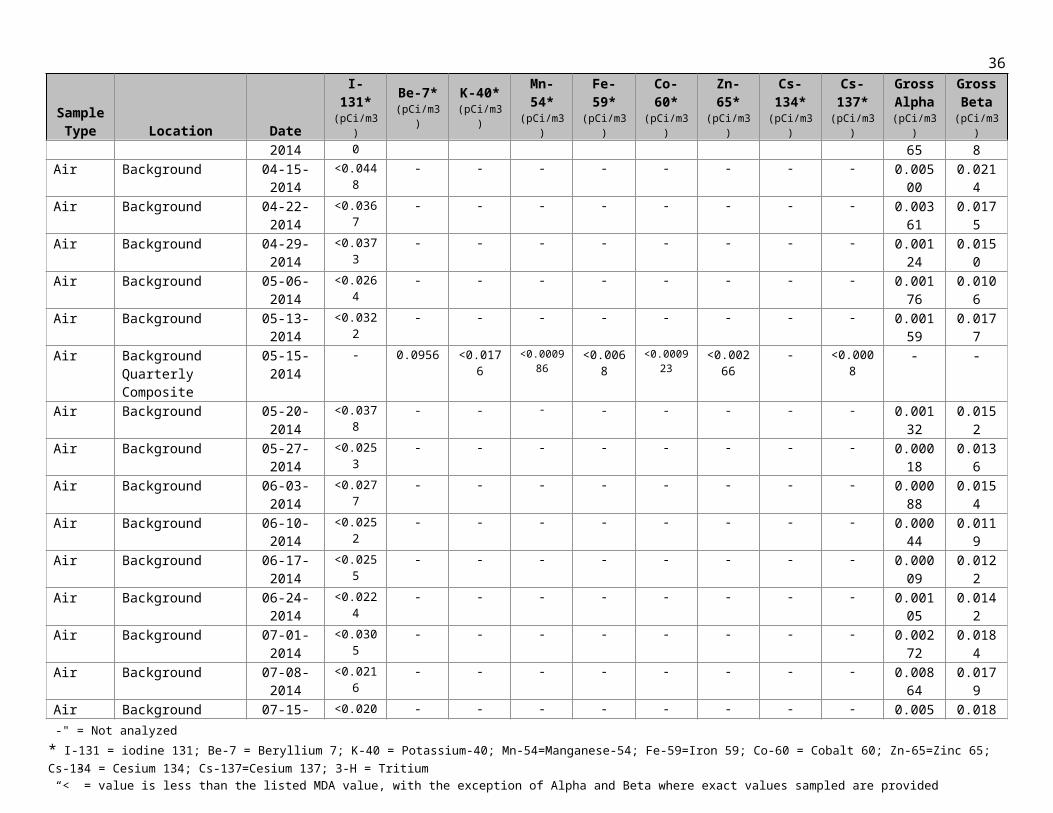
37
Sample Type Location Date
I-131* (pCi/m3)
Be-7* (pCi/m3)
K-40* (pCi/m3)
Mn-54*(pCi/m3)
Fe-59* (pCi/m3)
Co-60* (pCi/m3)
Zn-65* (pCi/m3)
Cs-134* (pCi/m3)
Cs-137* (pCi/m3)
Gross Alpha (pCi/m3)
Gross Beta (pCi/m3)
Air Background 07-15-2014 <0.0200 - - - - - - - - 0.00584 0.018Air Background 07-22-2014 <0.0217 - - - - - - - - 0.00535 0.0145Air Background 07-29-2014 <0.0258 - - - - - - - - 0.00753 0.0204Air Background 08-05-2014 <0.0311 - - - - - - - - 0.00535 0.0182Air Background 08-12-2014 <0.0304 - - - - - - - - 0.00592 0.0177Air Background Quarterly
Composite08-15-2014 -
<0.429 <0.029 <0.00223 <0.231 <0.00136 <0.00702 - <0.00126- -
Air Background 08-19-2014 <0.0255 - - - - - - - - 0.00413 0.0152Air Background 08-26-2014 <0.0213 - - - - - - - - 0.00272 0.0116Air Background 09-02-2014 <0.0250 - - - - - - - - 0.00468 0.0169Air Background 09-09-2014 <0.0221 - - - - - - - - 0.00692 0.0191Air Background 09-16-2014 <0.0233 - - - - - - - - 0.00079 0.00944Air Background 09-23-2014 <0.0321 - - - - - - - - 0.00340 0.0172Air Background 09-30-2014 <0.0230 - - - - - - - - 0.00565 0.0236Air Background 10-07-2014 <0.0223 - - - - - - - - 0.00607 0.0189Air Background 10-14-2014 <0.0226 - - - - - - - - 0.00901 0.0228Air Background 10-21-2014 <0.0221 - - - - - - - - 0.00901 0.0213Air Background 10-28-2014 <0.0256 - - - - - - - - 0.00385 0.0141Air Background 11-04-2014 <0.0226 - - - - - - - - 0.00545 0.0229Air Background 11-10-2014 <0.0287 - - - - - - - - 0.00624 0.0223Air Background Quarterly
Composite11-15-2014 -
<0.105 <0.0262 <0.00151 <0.0451 <0.00106 <0.00421 - <0.00102- -
Air Background 11-18-2014 <0.0239 - - - - - - - - 0.00320 0.0163Air Background 11-25-2014 <0.0329 - - - - - - - - 0.00784 0.0268Air Background 12-02-2014 <0.0290 - - - - - - - - 0.00306 0.0175Air Background 12-09-2014 <0.0219 - - - - - - - - 0.00378 0.0214Air Background 12-16-2014 <0.0303 - - - - - - - - 0.00236 0.0145Air Background 12-23-2014 <0.0255 - - - - - - - - 0.00424 0.0159Air Background 12-30-2014 <0.0234 - - - - - - - - 0.00443 0.0185
-" = Not analyzed* I-131 = iodine 131; Be-7 = Beryllium 7; K-40 = Potassium-40; Mn-54=Manganese-54; Fe-59=Iron 59; Co-60 = Cobalt 60; Zn-65=Zinc 65; Cs-134 = Cesium 134; Cs-137=Cesium 137; 3-H = Tritium “<” = value is less than the listed MDA value, with the exception of Alpha and Beta where exact values sampled are included


![1 mdph presentation[1]](https://img.pdfslide.net/doc/110x75/58a75bfa1a28ab217e8b5009/1-mdph-presentation1.jpg)