Embed Size (px)
Citation preview
Environmental Profit and Loss
Vodafone Netherlands
Methodology and Results
2014/15
ForewordAt Vodafone Netherlands we are determined to be a successful company, now and in the future. Our success depends on us achieving our core purpose of empowering our customers to be confidently connected. Every day we challenge ourselves to do more for our customers and to be at the forefront of our industry. But achieving success means looking beyond our performance of today.
We recognise that the measure of success is not just our share price, or how loyal our customers are or the size of our revenue. Success is finding the right balance between all our stakeholders’ interests, whether they are customers, suppliers, employees, investors, NGO’s or regulators.
I’m passionate about our industry and believe that it can help people to resolve many of the problems in our society. Telecommunication is already having a big impact on our lives and helps us in many ways. However, there are costs to the benefits it brings, which are not fully reflected in the financial measures that we use to steer our company.
If we are to be a leader in our sector, we need to assess our company not only on the traditional financial ratios, but on the value we create for society at large. To measure and manage the total value that we create, we must look beyond standard financial accounting to find the right balance between financial and societal values, for our stakeholders and for society. That’s what I call a sustainable business - one that is successful, today and tomorrow.
The Vodafone Environmental Profit & Loss account (E P&L) is our first attempt to measure our impact on society at large. With this information, we can create new insights that enhance the strategic decisions we make every day. We are able to steer our performance more responsively, which helps us to focus on the areas where we can make a difference. For instance, our Machine to Machine (M2M) business is a growing activity that allows our customers to be more efficient, so by doing more to increase this business we can reduce ours and our customers’ environmental impact.
Measuring our environmental impact is a first step in assessing the total impact we have on the world around us. The E P&L can help us to understand how we can reduce the toll we take on our environment and enable our customers to reduce theirs too. With this E P&L, we can contribute to the debate on the environmental impact of business in general and inspire other companies in and outside our industry to do the same.
Rob Shuter, CEO Vodafone Netherlands
2 Vodafone Netherlands E P&L Methodology and Results 14/15
Scoping Environmental impact Results and conclusions AppendixGeneral
3 Vodafone Netherlands E P&L Methodology and Results 14/15
Scoping Environmental impact Results and conclusions AppendixGeneral
Vodafone Thuis 21
Impact of Vodafone’s products and services 23
Dematerialisation 23
M2M Connectivity 25
Results and conclusionsThe E P&L account 2014/2015 27
What do we learn from the results? 29
AREAS for improvement 30
Acknowledgements 31
References 32
AppendixAppendix A – Material impact areas 33
Appendix B – Calculations 35
- Environmental impact calculations 35
- Valuation calculations 42
Appendix C – Assumptions 43
- General E P&L assumptions 43
- General content assumptions 43
- Environmental impact of handsets 43
- Carbon impact of smart working 44
- Carbon impact of M2M 44
Appendix D – Report Stakeholder dialogue 46
ContentsForeword 2
Table of contents 3
Excecutive summary 4
General Vodafone Netherlands 6
Our vision 6
Why we developed this E P&L 6
What is an E P&L? 7
The aim of the Vodafone E P&L 7
Scoping Step 1: Decide what to measure 8
Step 2: Map the value chain 8
Step 3: Collect data 11
Step 4: Valuation 11
Step 5: Calculating E P&L 11
Environmental impact Buildings 13
Network 15
Servicing customers by employees 17
Handsets 19
4 Vodafone Netherlands E P&L Methodology and Results 14/15
What is an E P&L?The Vodafone Environmental Profit & Loss account (E P&L) is an overview of all the positive and negative environmental values (or impacts) that Vodafone creates in the course of its business and throughout its value chain. To take two examples, Vodafone creates positive environmental value by the mobile connectivity services it provides such as Smart Garbage systems which help customers avoid energy and related air emissions. However, Vodafone has a negative environmental impact from the energy used by its data centres and in the production of mobile devices.
Why Vodafone developed an E P&LVodafone aims to use the E P&L to improve its decision making so that it can reduce its negative impact on the environment and boost its positive impact. By knowing what impacts it has, Vodafone can strategically focus on its full performance, rather than just its financial performance. This E P&L has five goals:
1. Strategic insights on the environmental value of the value chain
2. Insights for internalisation
3. Clarity
4. Forecasting
5. Benchmarking.
ScopeIn order to identify Vodafone’s impact, five steps were taken:
STEP 1: Decide what to measureThe purpose of this step was to identify what should be included in the E P&L. Vodafone aims to include as many business areas as possible.
The E P&L is based on:
1. Business scope: which parts of the Vodafone business are included?
2. Value chain scope: how far back in the supply chain or forward to the customers is included?
3. Impact scope: which types of environmental impacts are taken into account?
STEP 2: Map the value chainThe second step is to map the value chain in order to make sure that Vodafone understands it. The key areas are defined at each stage in the value chain, including transport. Most information about the value chain is derived from life cycle analysis or from the direct supplier of Vodafone.
STEP 3: Collect dataData used in this E P&L is based on primary and secondary data. Primary data was collected from Vodafone’s own operations. Based on this information, Vodafone was able to assess its own impacts. Secondary data from suppliers and additional research were used to fill in the gaps, especially to assess impacts deeper in the value chain.
STEP 4: ValuationVodafone has put a monetary value on its impacts, by converting non-financial impacts (such as CO2 emissions) into financial numbers. Putting a monetary value on activities helps Vodafone better understand the positive and negative impacts of its business.
STEP 5: Calculating E P<he collected data is translated into financial values and summarised in an E P&L.
Executive Summary
Scoping Environmental impact Results and conclusions AppendixGeneral

5 Vodafone Netherlands E P&L Methodology and Results 14/15
Executive Summary
ResultsIn the 12 months to 31 March 2015, Vodafone Netherlands had a negative environmental impact (Loss) of ≈€21.6 million, of which ≈€1.9 million is directly caused by Vodafone Netherlands own operations, which is only 9% of the total negative impact. The negative impact includes four key elements: network, products, servicing customers by employees and buildings. Carbon emission counts for 42% of the total negative environmental impact. Water for 33%, air for 24% and waste for 1% of the total E P&L.
The positive impact of Vodafone’s services is ≈€37.4 million, which derives from enabling customers to reduce their carbon footprint.
Strategic insights on the environmental value of the value chain. Vodafone is able to have a significant positive impact on the environment by its smart working and M2M solutions. These findings suggest that Vodafone should innovate further with these type of products and services. The negative impact is mainly related to hardware like handsets and M2M equipment, which Vodafone doesn’t produce. Circular business can be adopted to reduce this impact.
Insights for internalisation. CO2 emissions create the most material negative and positive environmental impact. Therefore, Vodafone should seek to optimise the balance between these impacts. The new carbon ambition of Vodafone will help to address this material issue: Vodafone Netherlands will help our customers to save 25 times the amount of carbon we are generating though our own activities.
Forecasting. Vodafone’s vision is to empower its customers. With the insights of this E P&L, it intends to forecast how it can fulfil customer expectations, based on the value it creates for them. With these insights Vodafone can sharpen its risk strategies and make better investment decisions based on shared value.
Clarity. By publishing this E P&L, Vodafone intends to improve its transparency for its share- and stakeholders. Stakeholders have indicated that they would also like to see insights on the social impact of Vodafone, alongside the environmental impacts.
Benchmarking. By expressing the company’s impacts in euros, the impacts across different life stages can be more easily compared. Vodafone expects more companies in its sector to publish their E P&L results. When available, the company can use these results for benchmarking. Further, it can benchmark their own performance in time.
Buildings €182,340
Network €1,075,025
Vodafone Thuis€513,320
Loss Profit
Servicing customers€1,524,393
M2M€3,840,469
Handsets€14,465,883
Dematerialisation€17,031,199
M2M€20,405,781
Scoping Environmental impact Results and conclusions AppendixGeneral
Vodafone Netherlands E P&L 14/15
- Karel Zeldenrust, Dutch Ministry of Infrastructure and the Environment
Establishing a profit and loss account for environmental issues influenced by Vodafone’s business, is a fine initiative. It will make it possible better to understand the interrelated environmental interests of both company and society and to realize as a company an actual weighting of social costs and benefits. Future business processes and investments can be therefore stimulated in the direction of creating true shared value, both for Vodafone and society as a whole.
“ “
1. General1.1 Vodafone NetherlandsVodafone Netherlands is the second largest mobile communication company in the Netherlands. As of 31st March 2015 Vodafone Netherlands had almost 5.2 million customers. The main offices are located in Amsterdam and Maastricht. Furthermore there are offices in Eindhoven, Capelle aan den IJssel, Bodegraven and Amstelveen. Vodafone Netherlands has 245 company-owned shops. The Vodafone Netherlands services encompass mobile and fixed (voice, sms & data) connectivity for businesses and consumers, TV and broadband for consumers. Having started out as a mobile company, Vodafone Netherland’s main network is mobile and covers more than 95% of the Dutch population for 2G, 3G and 4G.
Vodafone Netherlands is part of Vodafone Group, which is one of the largest mobile communication companies in the world with 443 million customers per 31 March 2015. Vodafone Group is full or part-owner of more than 30 mobile companies in different countries on 5 different continents. It also has 50 global partner networks. More information is available at www.vodafone.nl and www.vodafone.com.
The scope of this E P&L are the activities of Vodafone Netherlands. In the rest of this document the name Vodafone refers to Vodafone Netherlands.
1.2 Our visionCommunication technology has become an indispensable part of society and it has a great impact on our busi¬ness and personal lives. As one of the global communication leaders, Vodafone plays a central part in exploring, developing and building technology which empowers our customers to be confidently connected. Communication technology can and will create solutions for problems. As Vodafone grows in a world where connectivity is a commodity, its responsibility to deliver these solutions increases. The company’s customers expect this from us, as do its shareholders. Other stakeholders also expect this from us. Vodafone’s employees are working to deliver on these expectations, day in, day out.
Solving society’s problems or satisfying its needs is the central role a company should seek. When the company works with customers, it can solve, innovate and create. By doing this, Vodafone can create shared value. This means value for its customers, the society and the business. Vodafone believes that long term business success can only be realised when a company sets out to solve societal problems. It achieves that objective with a sustainable balance between social, economic and environmental values.
A shared value should be clear, easy to understand and appropriate for strategic decision making. We know this is not always the case, but it is a necessity to have these insights to assess the problems our services can and should help to address and to assess our performance.
By producing this E P&L, Vodafone can assess the difference that it makes beyond the buying and selling price of goods and services. This is referred to as the impact, value or externalities. Both positive and negative externalities are taken into account. Monetising these values and adding them together, creates an E P&L. These insights allow us to assess the company’s performance and give a broader view of the value that it creates.
1.3 Why we developed this E P&LVodafone expects that it will become increasingly important in the coming years to determine how much value a company creates for society. Currently, this way of valuation is relatively new. Vodafone’s ambition is to assess both the social and environmental value it creates. For instance, the social value it creates by its mobile phone subscriptions and the social value it creates for its employees.
With this E P&L, Vodafone has started to determine the value of its environmental impacts. There are two reasons why it is best to start with environmental impacts.
Firstly, because valuation methods of environmental impacts are more mature. Much research has been done on the environmental impacts of carbon emissions, for example. This reduces the need for Vodafone to develop its own valuation methods and enables better and comparable insights.
6 Vodafone Netherlands E P&L Methodology and Results 14/15
Scoping Environmental impact Results and conclusions AppendixGeneral
Secondly, because of the mature data systems Vodafone has in this area. We have measured and reported our environmental performance for years. Through our Eco-Rating scheme of scoring handsets we have good evidence of the environmental impact of handsets and our partner Ericsson has calculated many environmental aspects of building and maintaining a telecommunication infrastructure.
1.4 What is an E P&L?The E P&L of the Dutch operation is, to our knowledge, the first published E P&L in the global ICT industry. It is an overview of all the positive and negative environmental values (or impacts) that Vodafone Netherlands creates through its activities and throughout its value chain. Vodafone creates positive environmental value by the mobile connectivity services it provides like Smart Garbage systems, which helps customers to reduce energy and related air emissions. But Vodafone reduces environmental value, by the energy used in its data centres and through its supply chain, for instance from the production of mobile devices.
By adding up these two scores, it is possible to estimate an overview of the company’s environmental costs and benefits. That information can then be expressed in euros. This allows us to compare different areas where the company has an environmental impact and helps us to make more informed decisions.
The results of the E P&L are approximate rather than exact. However, they help us identify areas of opportunity and risk. Improvements to the E P&L are expected in the coming years, since more business are looking to calculate impacts and publish their results. Examples of other companies who have published their environmental and sometimes social impacts include Holcim (Ambuja), Dutch Railways (NS), Kering (Puma) and Novo Nordisk. Also, there are several associations working on the development of impact protocols, such as the World Business Counsel of Sustainable Development (WBCSD), which will further develop and harmonise methodologies and valuation methods and speed up the adoption of a common approach to calculating and valuing social and environmental impacts.
1.5 The aim of the Vodafone E P&LVodafone aims to use the E P&L for enhanced strategic decision making in order to decrease its negative value and to boost its positive value. By knowing where the value is most significant, Vodafone can strategically focus on real performance (more than just financial). Vodafone has developed the E P&L for five reasons:
1. Strategic insights on the environmental value of the full life cycle. The E P&L creates a better understanding of the company’s environmental impact and those of its suppliers. It provides insights on how to increase the efficiency of Vodafone’s operations. And further up the value chain, the
General
E P&L shows which products and services create the most shared value which can lead to strategic commercial insights.
2. Insights for internalisation. The E P&L provides insights into our most material environmental impacts. This information can help the company to predict and respond to upcoming regulations and standards. It also gives the company an ideas of areas of concern, where stakeholders may take action. Further, Vodafone wants to understand the link between its environmental impacts and the effect of market dynamics, such as scarcity & pricing, extreme weather and new markets.
3. Forecasting. The insights of our E P&L and therefore our impact, negative or positive, will help to estimate customer demands over the long term. Predictions based on these insights will enable Vodafone to develop a vision of the future. The E P&L will help to steer and underpin long term business planning, including the environmental risk management process.
4. Clarity. The publication of an E P&L will increase transparency to shareholders and stakeholders. This is one of the biggest reasons for carrying out the E P&L. As well as external transparency, it will create internal awareness of sustainable business. The research and development of an E P&L will develop knowledge and experience with non-financial accounting, which Vodafone needs to broaden shared value based calculations in the future.
5. Benchmarking. The results of the E P&L will be used to assess the performance of the company’s value chain. As more companies publish their E P&L results, Vodafone will use its E P&L for benchmarking purposes.
The methodology of the E P&L is aimed at identifying both the positive and negative environmental impacts of Vodafone and to monetise this impact. The impacts on the environment are determined by analysing Vodafone’s externalities as discussed in section 1.2. The information to calculate the externalities is mainly based on company data, LCA analyses, stakeholder dialogues, materiality assessments, Vodafone’s vision and strategy and publicly available information. It is important to understand the boundaries of the analysis, which are given in the next chapter.
7 Vodafone Netherlands E P&L Methodology and Results 14/15
Scoping Environmental impact Results and conclusions AppendixGeneral
8 Vodafone Netherlands E P&L Methodology and Results 14/15
The process of generating this E P&L was divided into five steps. First, Vodafone had to decide what areas of the business the company wanted to measure. Second, the value chains of these areas were mapped. Then data was gathered in these areas and the valuation factors were drawn up. The final step was calculating the E P&L.
STEP 1: Decide what to measureThe first step in the E P&L was the scope setting. The purpose of this step was to identify what should be included in the E P&L. Vodafone aims to include as many business areas as possible. In Appendix A, a detailed assessment is provided.
The scope of the E P&L is based on:
1. Business scope: which parts of the Vodafone business are included?
2. Value chain scope: how far back in the supply chain or forward to the custowmers is included?
3. Impact scope: which types of environmental impacts are taken into account?
Business scope
Vodafone has determined its relevant business impact areas by assessing four areas: Vodafone’s buildings in which it operates, the network it uses for its services, business related activities of its employees and the impacts of the products and services it delivers. All products Vodafone delivers are included in the materiality analysis, including handsets, tablets, Vodafone Thuis, dematerialisation, and M2M. Tablets were excluded from the impact measurement, as they are not statistically significant (tablets in this reporting year account for less than 1% of the total number of devices sold).
Value chain scope
Vodafone has included the entire life cycle for each business area, except the value chain of the office buildings in which it operates.
Impact scope
Environmental indicators were identified for each material business area. All major environmental indicators were included in the assessment (greenhouse gas emissions, air emissions, water consumption, water pollution waste production, land use, and biodiversity). In each area some environmental indicators were excluded, due to lack of available information and materiality.
STEP 2: Map the value chainThe second step is to map the value chain, in order to make sure that the company understands it. The key areas are defined at each stage in the value chain, including transport. Most information about the value chain is derived from life cycle analysis or from the direct supplier of Vodafone.
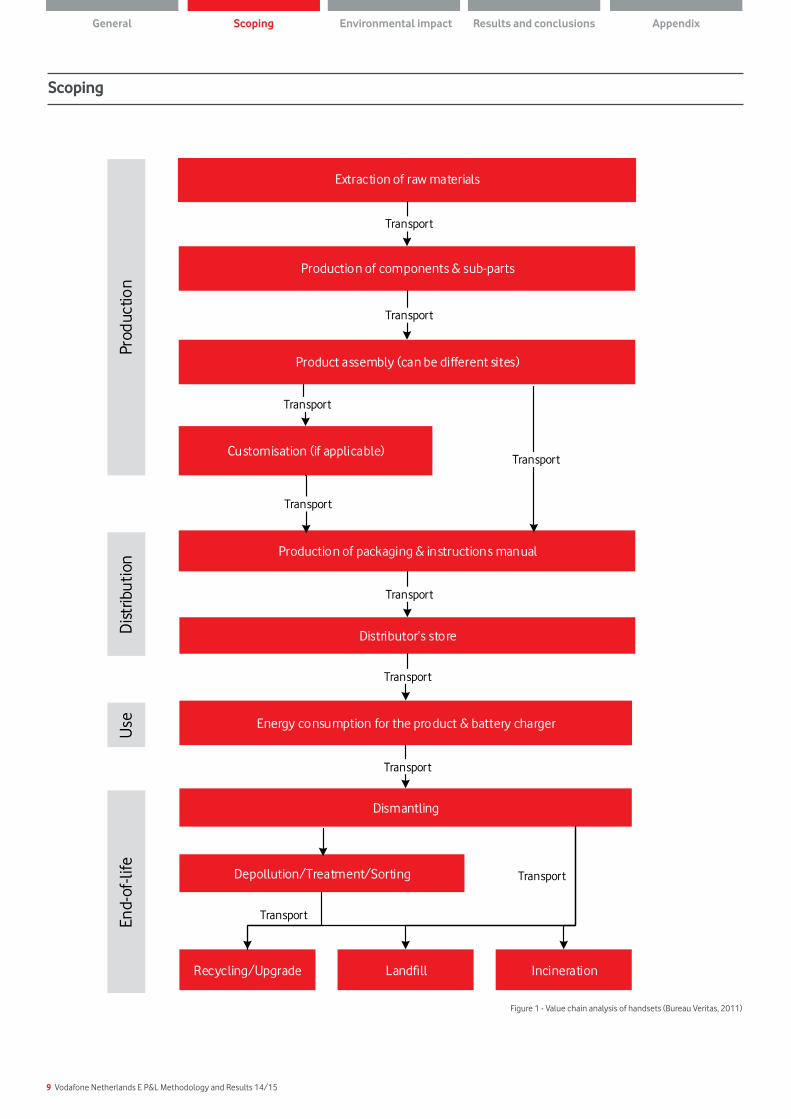
Figure 1 provides an example of a value chain map. The map gives an overview on the processes that are necessary to produce a handset. The value chain is divided in four life stages: production, distribution, use, and end of life.
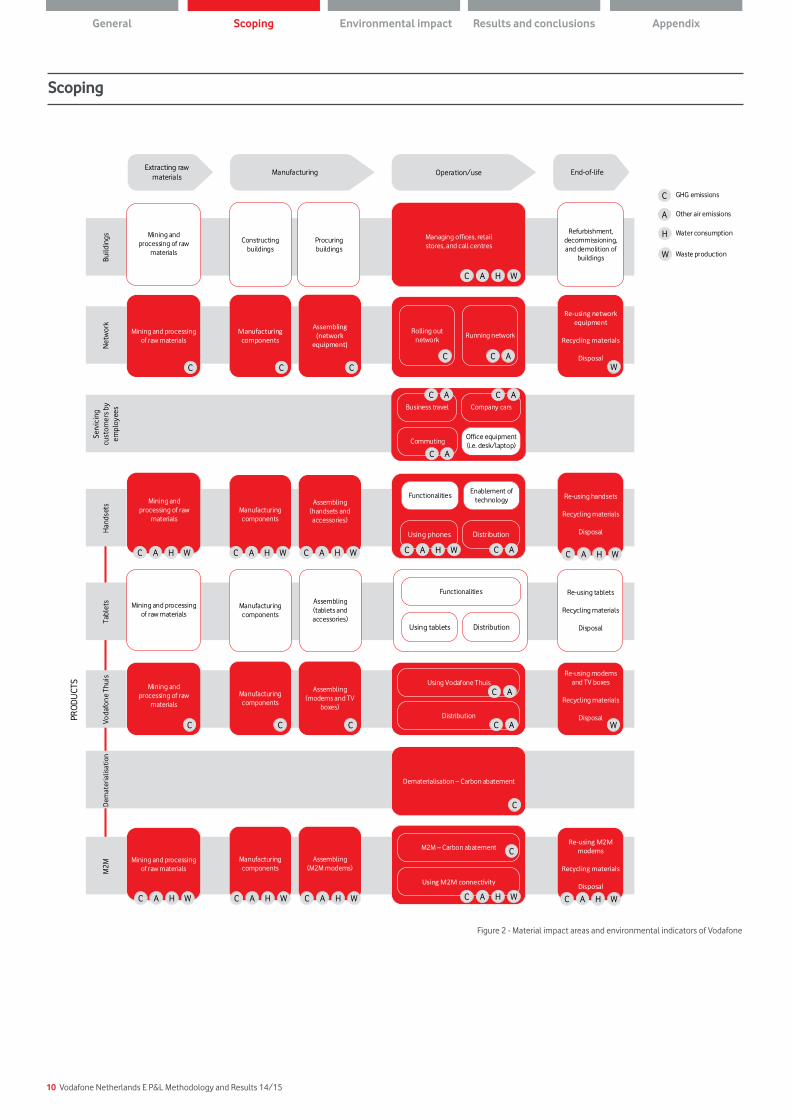
Based on the outcomes of the value chain map and the initial scoping exercise, Figure 2 was developed, which illustrates the final scope of this E P&L. Areas in scope are coloured red. For each area, environmental indicators have been included, based on availability of data. Included indicators are specified in Figure 2.
2. Scoping
Scoping Environmental impact Results and conclusions AppendixGeneral
9 Vodafone Netherlands E P&L Methodology and Results 14/15
Scoping
Extraction of raw materials
Production of components & sub-parts
Transport
Product assembly (can be different sites)
Customisation (if applicable)
Production of packaging & instructions manual
Transport
Transport
Transport
Transport
Distributor’s store
Energy consumption for the product & battery charger
Transport
Transport
Dismantling
Depollution/Treatment/Sorting
Recycling/Upgrade Landfill Incineration
Transport
noitcudorPnoitubirtsi
DU
seEn
d-of
-life
Transport
Transport
Figure 1 - Value chain analysis of handsets (Bureau Veritas, 2011)
Scoping Environmental impact Results and conclusions AppendixGeneral
10 Vodafone Netherlands E P&L Methodology and Results 14/15
Build
ings
Han
dset
sTa
blet
sVo
dafo
ne
Thui
sD
emat
eria
lisat
ion
M2M
Net
wor
k
Constructingbuildings
Procuringbuildings
Manufacturing components
Assembling (tablets and accessories)
Managing offices, retail stores, and call centres
Refurbishment, decommissioning, and demolition of
buildings
Re-using tablets
Recycling materials
Disposal
Using phones
Functionalities
Dematerialisation – Carbon abatement
Rolling out network
Running network
Extracting raw materials
Manufacturing Operation/use End-of-life
Mining and processing of raw materials
Manufacturing components
Assembling (handsets and accessories)
Manufacturing components
Assembling (modems and TV
boxes)
Manufacturing components
Assembling (network
equipment)
Re-using handsets
Recycling materials
Disposal
Re-using modems and TV boxes
Recycling materials
Disposal
Re-using network equipment
Recycling materials
Disposal
Mining and processing of raw
materials
Enablement of technology
Functionalities
Mining and processing of raw materials
Mining and processing of raw
materials
Mining and processing of raw
materials
Mining and processing of raw materials
Manufacturing components
Assembling (M2M modems)
Re-using M2M modems
Recycling materials
Disposal
C C CC C A
W
C A H W
C A H WC A H WC A H WC A H WC A H W
C C C
C
W
C A H WC A H WC A H WC A H W
Serv
icin
g cu
stom
ers
by
empl
oyee
s Business travel Company cars
Commuting
C A
C AC A
STCU
DO
RP
C
A
H
W
GHG emissions
Other air emissions
Water consumption
Waste production
Distribution
C A
Using tablets Distribution
Using Vodafone ThuisC A
DistributionC A
M2M – Carbon abatement
Using M2M connectivity
C A H W
C
Office equipment (i.e. desk/laptop)
Scoping
Figure 2 - Material impact areas and environmental indicators of Vodafone
Scoping Environmental impact Results and conclusions AppendixGeneral
11 Vodafone Netherlands E P&L Methodology and Results 14/15
STEP 3: Collect dataBased on the defined scope, data is gathered. Data used in this E P&L is based on primary and secondary data. Primary data was collected from the direct operations of Vodafone. Based on this information, Vodafone was able to assess mostly of its own impacts. Secondary data sources and techniques were used to fill in gaps, especially deeper in the value chain.
Life cycle analyses (LCAs) are generally the preferred method of estimating impacts where primary data is unavailable. Vodafone had already conducted multiple LCAs over time and with the help of suppliers, other LCAs are included in this E P&L. The LCAs take into account regional differences, such as energy mix associated with electricity use.
When applicable, Vodafone has collected both negative and positive impacts of the business area. As a telecommunication company, Vodafone has a positive impact on the environment, by enabling customers to communicate effectively without having to travel to meet up.
STEP 4: ValuationThe results of the E P&L are shown as a monetary value. Expressing impacts in monetary terms gives Vodafone an understanding of the extent of the impact and the social consequences of its operations, on a regional basis. For example, water consumption in China has a different cost to water consumption in the Netherlands, due to differences in scarcity level.
Environmental data was converted into monetary terms primarily by means of The Shadow Pricing Handbook of CE Delft (see Appendix B.2). This handbook uses detailed models to convert environmental data into euros and is commonly used in the Netherlands. Carbon emissions were valued using a study of the EPA (2013).
STEP 5: Calculating E P<he E P&L is calculated based on the valuation factors and gathered data. For instance, multiplying the amount of emitted CO
2 by a valuation factor.
Scoping
Scoping Environmental impact Results and conclusions AppendixGeneral

12 Vodafone Netherlands E P&L Methodology and Results 14/15
This chapter provides insights in the valuation of the four key elements of the E P&L (buildings, network, servicing customers by employees, and products). The E P&L includes the impact of the following products: (1) mobile handsets, (2) Vodafone Thuis, (3) dematerialisation, and (4) M2M connectivity. Detailed information on calculations can be found in Appendix B1. Each element of the E P&L is described based on the following framework:
3. Environmental impact
Impact General description of the negative and positive environmental impact created by this element
Impact area Scope: shows the value chain area for which the impact is calculated (displayed in red) and the indicators that are included in the calculation. For example:
Build
ings
Han
dset
sTa
blet
sVo
dafo
ne
Thui
sD
emat
eria
lisat
ion
M2M
Net
wor
k
Constructingbuildings
Procuringbuildings
Manufacturing components
Assembling (tablets and accessories)
Managing offices, retail stores, and call centres
Refurbishment, decommissioning, and demolition of
buildings
Re-using tablets
Recycling materials
Disposal
Using phones
Functionalities
Dematerialisation – Carbon abatement
Rolling out network
Running network
Extracting raw materials
Manufacturing Operation/use End-of-life
Mining and processing of raw materials
Manufacturing components
Assembling (handsets and accessories)
Manufacturing components
Assembling (modems and TV
boxes)
Manufacturing components
Assembling (network
equipment)
Re-using handsets
Recycling materials
Disposal
Re-using modems and TV boxes
Recycling materials
Disposal
Re-using network equipment
Recycling materials
Disposal
Mining and processing of raw
materials
Enablement of technology
Functionalities
Mining and processing of raw materials
Mining and processing of raw
materials
Mining and processing of raw
materials
Mining and processing of raw materials
Manufacturing components
Assembling (M2M modems)
Re-using M2M modems
Recycling materials
Disposal
C C CC C A
W
C A H W
C A H WC A H WC A H WC A H WC A H W
C C C
C
W
C A H WC A H WC A H WC A H W
Serv
icin
g cu
stom
ers
by
empl
oyee
s Business travel Company cars
Commuting
C A
C AC A
STCU
DO
RP
C
A
H
W
GHG emissions
Other air emissions
Water consumption
Waste production
Distribution
C A
Using tablets Distribution
Using Vodafone ThuisC A
DistributionC A
M2M – Carbon abatement
Using M2M connectivity
C A H W
C
Office equipment (i.e. desk/laptop)
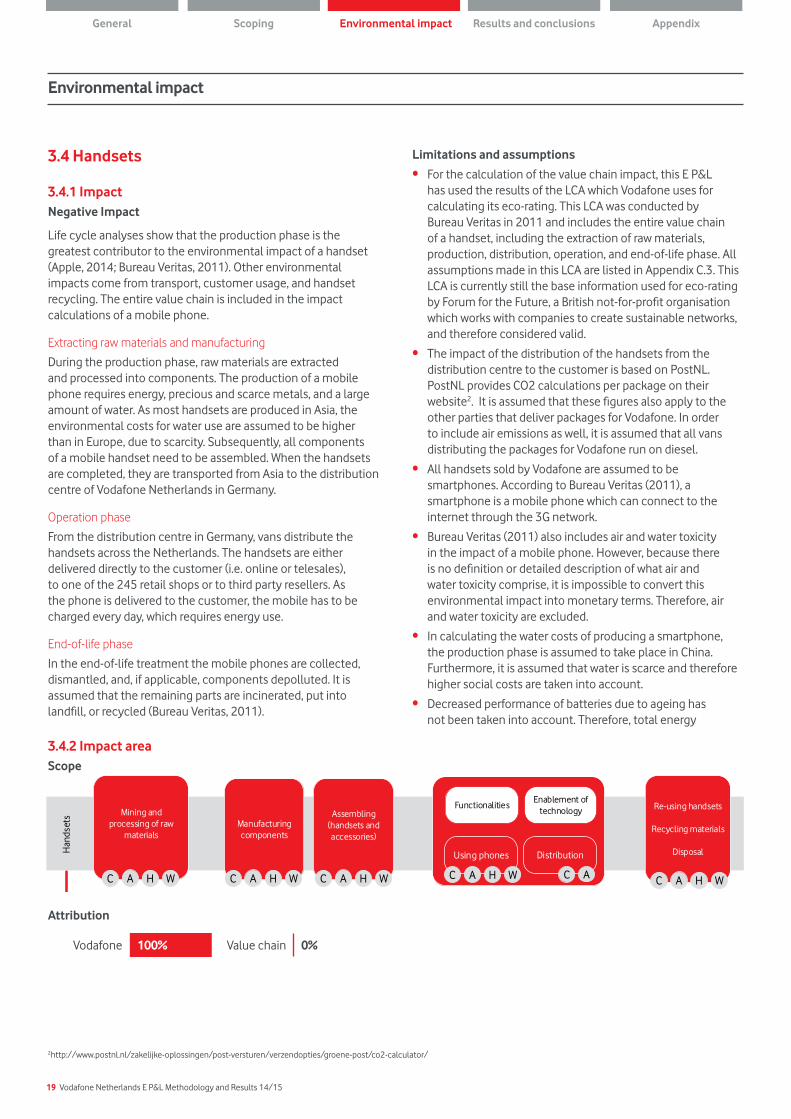
Attribution: the percentage of environmental costs and profits that can be attributed to Vodafone or to the value chain partners. For example:
Vodafone 100% Value chain 0%
Limitations and assumptions: the limitations and assumptions made in calculating the impact.
Calculations Provides an overview of how the negative and positive impacts were calculated.
Scoping Environmental impact Results and conclusions AppendixGeneral
13 Vodafone Netherlands E P&L Methodology and Results 14/15
3.1 Buildings
3.1.1 ImpactNegative impact
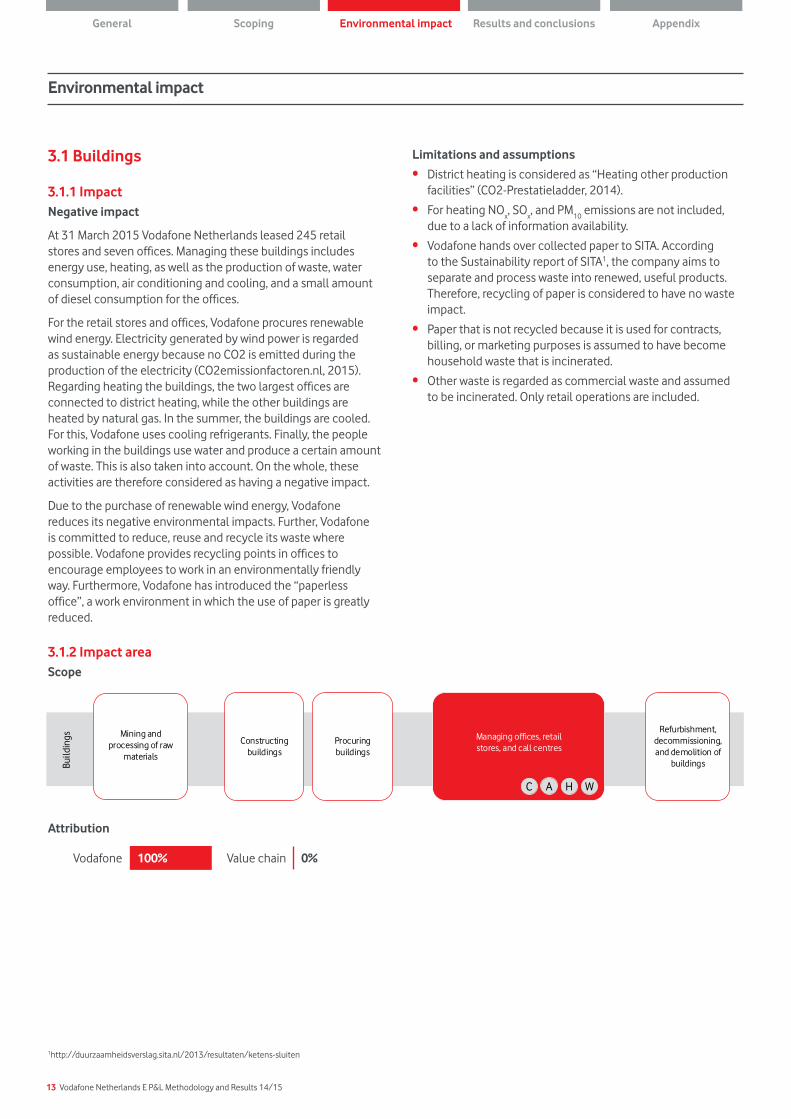
At 31 March 2015 Vodafone Netherlands leased 245 retail stores and seven offices. Managing these buildings includes energy use, heating, as well as the production of waste, water consumption, air conditioning and cooling, and a small amount of diesel consumption for the offices.
For the retail stores and offices, Vodafone procures renewable wind energy. Electricity generated by wind power is regarded as sustainable energy because no CO2 is emitted during the production of the electricity (CO2emissionfactoren.nl, 2015). Regarding heating the buildings, the two largest offices are connected to district heating, while the other buildings are heated by natural gas. In the summer, the buildings are cooled. For this, Vodafone uses cooling refrigerants. Finally, the people working in the buildings use water and produce a certain amount of waste. This is also taken into account. On the whole, these activities are therefore considered as having a negative impact.
Due to the purchase of renewable wind energy, Vodafone reduces its negative environmental impacts. Further, Vodafone is committed to reduce, reuse and recycle its waste where possible. Vodafone provides recycling points in offices to encourage employees to work in an environmentally friendly way. Furthermore, Vodafone has introduced the “paperless office”, a work environment in which the use of paper is greatly reduced.
3.1.2 Impact areaScope
Limitations and assumptions
• District heating is considered as “Heating other production facilities” (CO2-Prestatieladder, 2014).
• For heating NOx, SO
x, and PM
10 emissions are not included,
due to a lack of information availability.
• Vodafone hands over collected paper to SITA. According to the Sustainability report of SITA1, the company aims to separate and process waste into renewed, useful products. Therefore, recycling of paper is considered to have no waste impact.
• Paper that is not recycled because it is used for contracts, billing, or marketing purposes is assumed to have become household waste that is incinerated.
• Other waste is regarded as commercial waste and assumed to be incinerated. Only retail operations are included.
Environmental impact
1http://duurzaamheidsverslag.sita.nl/2013/resultaten/ketens-sluiten
Attribution
Vodafone 100% Value chain 0%
Scoping Environmental impact Results and conclusions AppendixGeneral
Build
ings
Han
dset
sTa
blet
sVo
dafo
ne
Thui
sD
emat
eria
lisat
ion
M2M
Net
wor
k
Constructingbuildings
Procuringbuildings
Manufacturing components
Assembling (tablets and accessories)
Managing offices, retail stores, and call centres
Refurbishment, decommissioning, and demolition of
buildings
Re-using tablets
Recycling materials
Disposal
Using phones
Functionalities
Dematerialisation – Carbon abatement
Rolling out network
Running network
Extracting raw materials
Manufacturing Operation/use End-of-life
Mining and processing of raw materials
Manufacturing components
Assembling (handsets and accessories)
Manufacturing components
Assembling (modems and TV
boxes)
Manufacturing components
Assembling (network
equipment)
Re-using handsets
Recycling materials
Disposal
Re-using modems and TV boxes
Recycling materials
Disposal
Re-using network equipment
Recycling materials
Disposal
Mining and processing of raw
materials
Enablement of technology
Functionalities
Mining and processing of raw materials
Mining and processing of raw
materials
Mining and processing of raw
materials
Mining and processing of raw materials
Manufacturing components
Assembling (M2M modems)
Re-using M2M modems
Recycling materials
Disposal
C C CC C A
W
C A H W
C A H WC A H WC A H WC A H WC A H W
C C C
C
W
C A H WC A H WC A H WC A H W
Serv
icin
g cu
stom
ers
by
empl
oyee
s Business travel Company cars
Commuting
C A
C AC A
STCU
DO
RP
C
A
H
W
GHG emissions
Other air emissions
Water consumption
Waste production
Distribution
C A
Using tablets Distribution
Using Vodafone ThuisC A
DistributionC A
M2M – Carbon abatement
Using M2M connectivity
C A H W
C
Office equipment (i.e. desk/laptop)
14 Vodafone Netherlands E P&L Methodology and Results 14/15
Environmental impact
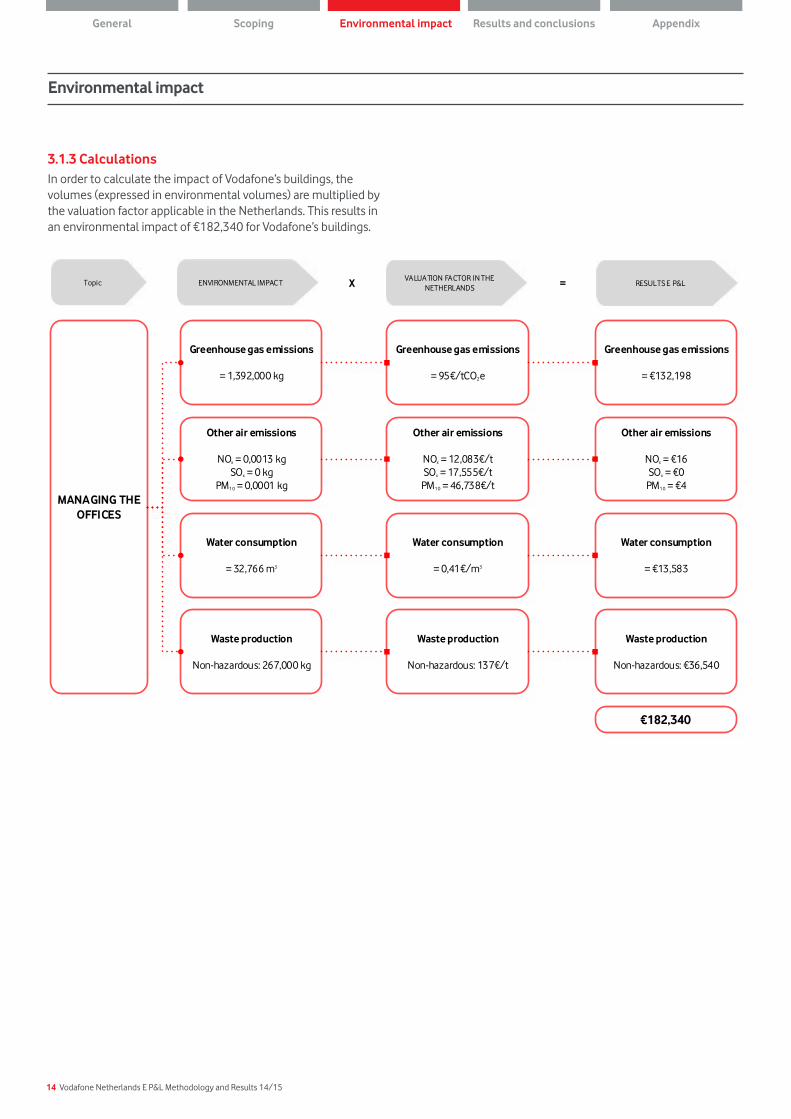
3.1.3 CalculationsIn order to calculate the impact of Vodafone’s buildings, the volumes (expressed in environmental volumes) are multiplied by the valuation factor applicable in the Netherlands. This results in an environmental impact of €182,340 for Vodafone’s buildings.
MANAGING THE OFFICES
Other air emissions
NOx = 0,0013 kgSOx = 0 kg
PM10 = 0,0001 kg
Greenhouse gas emissions
= 1,392,000 kg
Water consumption
= 32,766 m3
Waste production
Non-hazardous: 267,000 kg
Other air emissions
NOx = 12,083€/tSOx = 17,555€/t
PM10 = 46,738€/t
Greenhouse gas emissions
= 95€/tCO2e
Water consumption
= 0,41€/m3
Waste production
Non-hazardous: 137€/t
Other air emissions
NOx = €16SOx = €0
PM10 = €4
Greenhouse gas emissions
= €132,198
Water consumption
= €13,583
Waste production
Non-hazardous: €36,540
Topic ENVIRONMENTAL IMPACTVALUATION FACTOR IN THE
NETHERLANDSX RESULTS E P&L=
€183,340
Scoping Environmental impact Results and conclusions AppendixGeneral
182,340
15 Vodafone Netherlands E P&L Methodology and Results 14/15
Environmental impact
3.2 Network
3.2.1 ImpactNegative impact
Extracting raw materials & manufacturing
On 31 March 2015, Vodafone had 4852 radio base station (RBS) sites in the Netherlands to ensure nationwide coverage. But sites are not the only items necessary to run the network. Control & core nodes, transmission & IP core network, and third party data centres are pivotal for offering a high speed data network. To calculate the impact of the manufacturing of those network components, the life cycle analysis (LCA) of Malmodin et al. (2014) is used. In this LCA, annual manufacturing impact of all network parts, including rolling out the network and extracting raw materials, is calculated.
Running the network
Generally, the most significant environmental impact from the operations of a mobile telecommunications company, is the impact of the energy it uses to run its network. However, Vodafone purchases only renewable wind energy for its network, which can be considered as not having an impact on the environment (CO2emissionfactoren.nl, 2015). This reduces the negative impact of Vodafone significantly. However, not all masts are connected to the grid. Off-grid masts operate on diesel generators and therefore have a negative impact.
End-of-life
Vodafone recycles almost all its network equipment. Only ≈1.5% of the network is not useful in terms of recycling or refurbishing. Based on internal documentation, this is mainly due to technical restrictions on circuit boards.
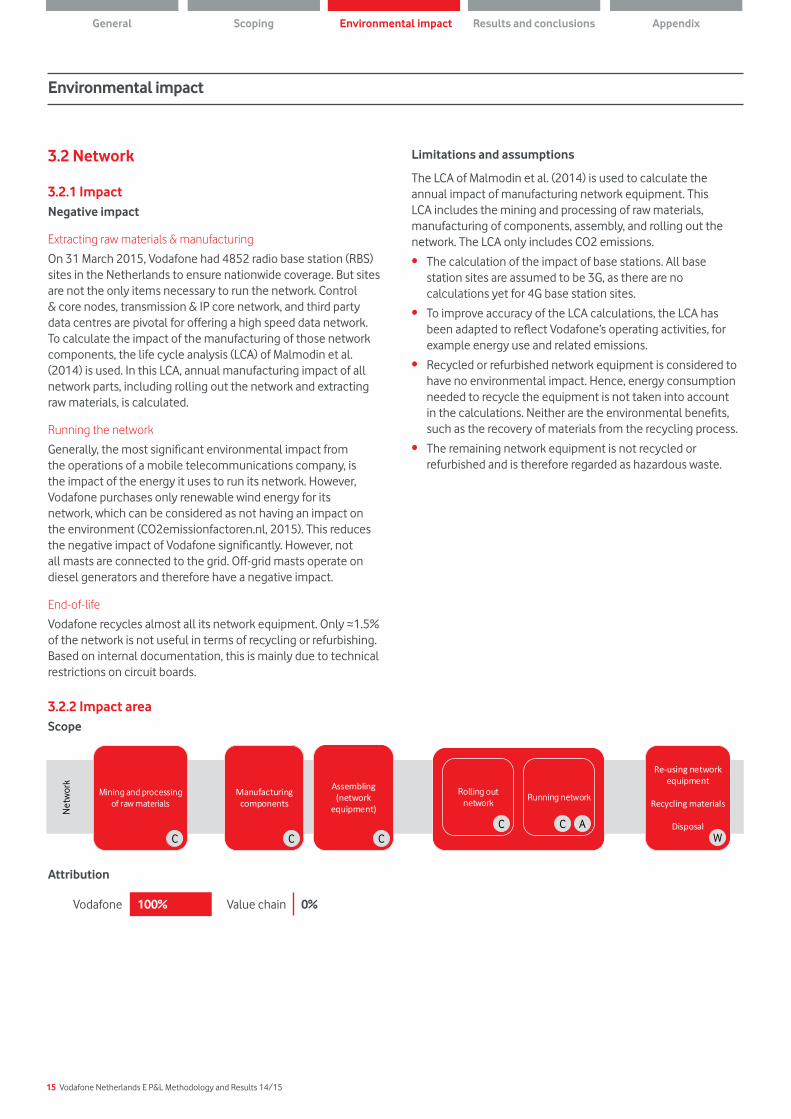
3.2.2 Impact areaScope
Limitations and assumptions
The LCA of Malmodin et al. (2014) is used to calculate the annual impact of manufacturing network equipment. This LCA includes the mining and processing of raw materials, manufacturing of components, assembly, and rolling out the network. The LCA only includes CO2 emissions.
• The calculation of the impact of base stations. All base station sites are assumed to be 3G, as there are no calculations yet for 4G base station sites.
• To improve accuracy of the LCA calculations, the LCA has been adapted to reflect Vodafone’s operating activities, for example energy use and related emissions.
• Recycled or refurbished network equipment is considered to have no environmental impact. Hence, energy consumption needed to recycle the equipment is not taken into account in the calculations. Neither are the environmental benefits, such as the recovery of materials from the recycling process.
• The remaining network equipment is not recycled or refurbished and is therefore regarded as hazardous waste.
Attribution
Vodafone 100% Value chain 0%
Scoping Environmental impact Results and conclusions AppendixGeneral
Build
ings
Han
dset
sTa
blet
sVo
dafo
ne
Thui
sD
emat
eria
lisat
ion
M2M
Net
wor
k
Constructingbuildings
Procuringbuildings
Manufacturing components
Assembling (tablets and accessories)
Managing offices, retail stores, and call centres
Refurbishment, decommissioning, and demolition of
buildings
Re-using tablets
Recycling materials
Disposal
Using phones
Functionalities
Dematerialisation – Carbon abatement
Rolling out network
Running network
Extracting raw materials
Manufacturing Operation/use End-of-life
Mining and processing of raw materials
Manufacturing components
Assembling (handsets and accessories)
Manufacturing components
Assembling (modems and TV
boxes)
Manufacturing components
Assembling (network
equipment)
Re-using handsets
Recycling materials
Disposal
Re-using modems and TV boxes
Recycling materials
Disposal
Re-using network equipment
Recycling materials
Disposal
Mining and processing of raw
materials
Enablement of technology
Functionalities
Mining and processing of raw materials
Mining and processing of raw
materials
Mining and processing of raw
materials
Mining and processing of raw materials
Manufacturing components
Assembling (M2M modems)
Re-using M2M modems
Recycling materials
Disposal
C C CC C A
W
C A H W
C A H WC A H WC A H WC A H WC A H W
C C C
C
W
C A H WC A H WC A H WC A H W
Serv
icin
g cu
stom
ers
by
empl
oyee
s Business travel Company cars
Commuting
C A
C AC A
STCU
DO
RP
C
A
H
W
GHG emissions
Other air emissions
Water consumption
Waste production
Distribution
C A
Using tablets Distribution
Using Vodafone ThuisC A
DistributionC A
M2M – Carbon abatement
Using M2M connectivity
C A H W
C
Office equipment (i.e. desk/laptop)
16 Vodafone Netherlands E P&L Methodology and Results 14/15
Environmental impact
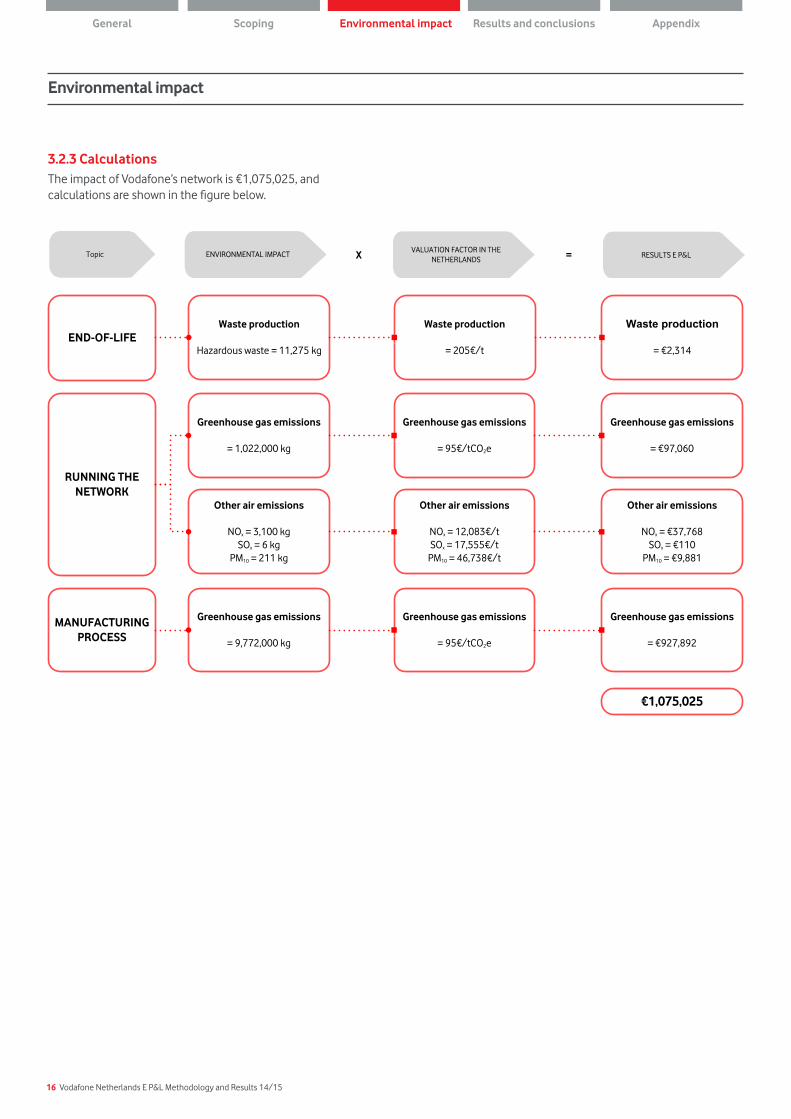
3.2.3 CalculationsThe impact of Vodafone’s network is €1,075,025, and calculations are shown in the figure below.
RUNNING THE NETWORK
Other air emissions
NOx = 3,100 kgSOx = 6 kg
PM10 = 211 kg
Greenhouse gas emissions
= 1,022,000 kg
Other air emissions
NOx = 12,083€/tSOx = 17,555€/t
PM10 = 46,738€/t
Greenhouse gas emissions
= 95€/tCO2e
Other air emissions
NOx = €37,768SOx = €110
PM10 = €9,881
Greenhouse gas emissions
= €97,060
Topic ENVIRONMENTAL IMPACTVALUATION FACTOR IN THE
NETHERLANDSX RESULTS E P&L=
€1,075,025
MANUFACTURING PROCESS
END-OF-LIFEWaste production
Hazardous waste = 11,275 kg
Waste production
= 205€/t
Waste production
= €2,314
Greenhouse gas emissions
= 9,772,000 kg
Greenhouse gas emissions
= 95€/tCO2e
Greenhouse gas emissions
= €927,892
Scoping Environmental impact Results and conclusions AppendixGeneral
17 Vodafone Netherlands E P&L Methodology and Results 14/15
3.3 Servicing customers by employees
3.3.1 ImpactNegative impact
To serve its customers Vodafone employs 3,838 employees in the Netherlands, as of 31 March 2015. These employees work either in Vodafone retail stores or in the company’s offices. Most of the people commute by car, scooter or public transport. In addition, Vodafone’s employees travel for business purposes to customers and other (foreign) premises by aeroplane, cars or public transport. Furthermore, a number of Vodafone employees have a company car. Altogether, this has a negative impact on the environment.
However, Vodafone has reduced the negative environmental impact of its employees by enabling employees to work “smart”. This implies that employees can work from wherever they want. Each employee is equipped with a laptop with mobile broadband, and a business phone. This reduces the need for employees to travel to work every day, and thus reduces CO2 emission.
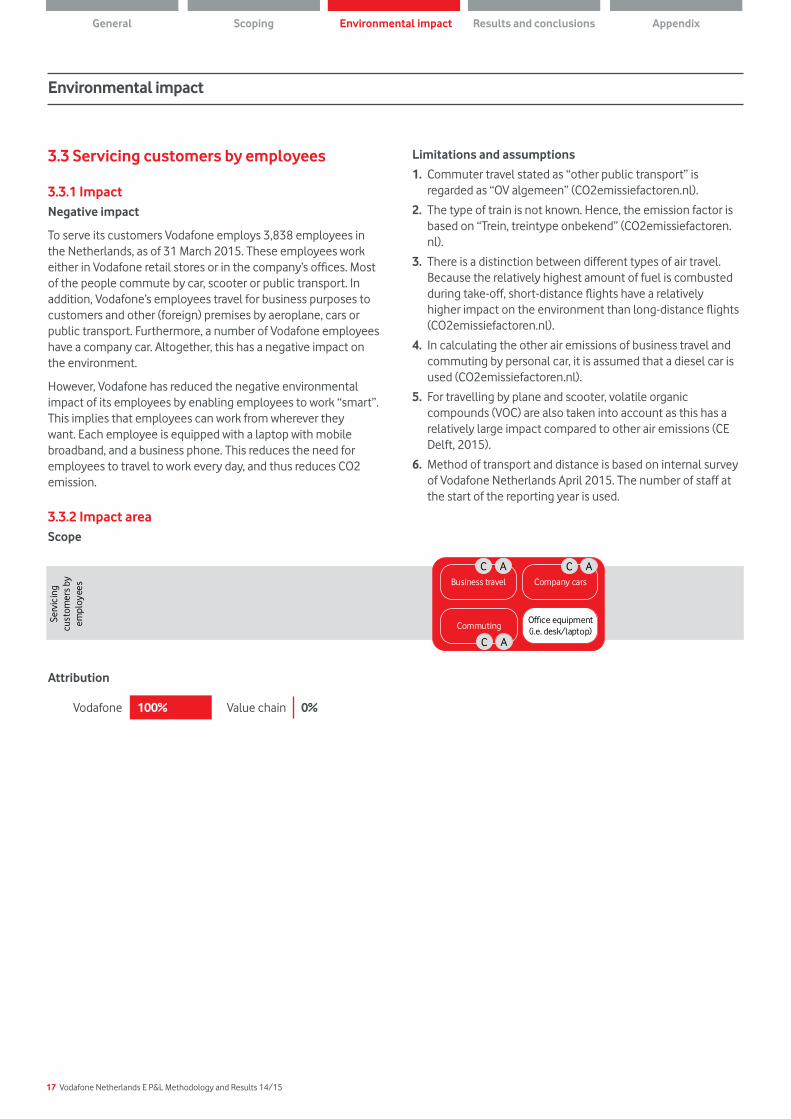
3.3.2 Impact areaScope
Attribution
Vodafone 100% Value chain 0%
Limitations and assumptions
1. Commuter travel stated as “other public transport” is regarded as “OV algemeen” (CO2emissiefactoren.nl).
2. The type of train is not known. Hence, the emission factor is based on “Trein, treintype onbekend” (CO2emissiefactoren.nl).
3. There is a distinction between different types of air travel. Because the relatively highest amount of fuel is combusted during take-off, short-distance flights have a relatively higher impact on the environment than long-distance flights (CO2emissiefactoren.nl).
4. In calculating the other air emissions of business travel and commuting by personal car, it is assumed that a diesel car is used (CO2emissiefactoren.nl).
5. For travelling by plane and scooter, volatile organic compounds (VOC) are also taken into account as this has a relatively large impact compared to other air emissions (CE Delft, 2015).
6. Method of transport and distance is based on internal survey of Vodafone Netherlands April 2015. The number of staff at the start of the reporting year is used.
Environmental impact
Scoping Environmental impact Results and conclusions AppendixGeneral
Build
ings
Han
dset
sTa
blet
sVo
dafo
ne
Thui
sD
emat
eria
lisat
ion
M2M
Net
wor
k
Constructingbuildings
Procuringbuildings
Manufacturing components
Assembling (tablets and accessories)
Managing offices, retail stores, and call centres
Refurbishment, decommissioning, and demolition of
buildings
Re-using tablets
Recycling materials
Disposal
Using phones
Functionalities
Dematerialisation – Carbon abatement
Rolling out network
Running network
Extracting raw materials
Manufacturing Operation/use End-of-life
Mining and processing of raw materials
Manufacturing components
Assembling (handsets and accessories)
Manufacturing components
Assembling (modems and TV
boxes)
Manufacturing components
Assembling (network
equipment)
Re-using handsets
Recycling materials
Disposal
Re-using modems and TV boxes
Recycling materials
Disposal
Re-using network equipment
Recycling materials
Disposal
Mining and processing of raw
materials
Enablement of technology
Functionalities
Mining and processing of raw materials
Mining and processing of raw
materials
Mining and processing of raw
materials
Mining and processing of raw materials
Manufacturing components
Assembling (M2M modems)
Re-using M2M modems
Recycling materials
Disposal
C C CC C A
W
C A H W
C A H WC A H WC A H WC A H WC A H W
C C C
C
W
C A H WC A H WC A H WC A H W
Serv
icin
g cu
stom
ers
by
empl
oyee
s Business travel Company cars
Commuting
C A
C AC A
STCU
DO
RP
C
A
H
W
GHG emissions
Other air emissions
Water consumption
Waste production
Distribution
C A
Using tablets Distribution
Using Vodafone ThuisC A
DistributionC A
M2M – Carbon abatement
Using M2M connectivity
C A H W
C
Office equipment (i.e. desk/laptop)
18 Vodafone Netherlands E P&L Methodology and Results 14/15
BUSINESS TRAVEL
Other air emissions
NOx = 2,400 kgSOx = 23 kg
PM10 = 160 kgVOC = 31 kg
Greenhouse gas emissions
= 1,134,000 kg
Other air emissions
NOx = 12,083€/tSOx = 17,555€/tPM10 = 46,738€/tVOC = 3,306€/t
Greenhouse gas emissions
= 95€/tCO2e
Other air emissions
NOx = €29,168SOx = €396
PM10 = €7,359VOC = €104
Greenhouse gas emissions
= €107,672
Topic ENVIRONMENTAL IMPACTVALUATION FACTOR IN THE
NETHERLANDSX RESULTS E P&L=
1,524,393
COMPANYCARS
Other air emissions
NOx = 6,750 kgSOx = 16 kg
PM10 = 450 kg
Greenhouse gas emissions
= 2,393,000 kg
Other air emissions
NOx = 12,083€/tSOx = 17,555€/tPM10 = 46,738€/t
Greenhouse gas emissions
= 95€/tCO2e
Other air emissions
NOx = €81,564SOx = €290
PM10 = €21,012
Greenhouse gas emissions
= €227,192
COMMUTINGOther air emissions
NOx = 24,800 kgSOx = 43 kg
PM10 = 180 kgVOC = 700 kg
Greenhouse gas emissions
= 7,001,000 kg
Other air emissions
NOx = 12,083€/tSOx = 17,555€/t
PM10 = 46,738€/tVOC = 3,306€/t
Greenhouse gas emissions
= 95€/tCO2e
Other air emissions
NOx = €299,968SOx = €749
PM10 = €81,918VOC = €2,209
Greenhouse gas emissions
= €664,790
Environmental impact
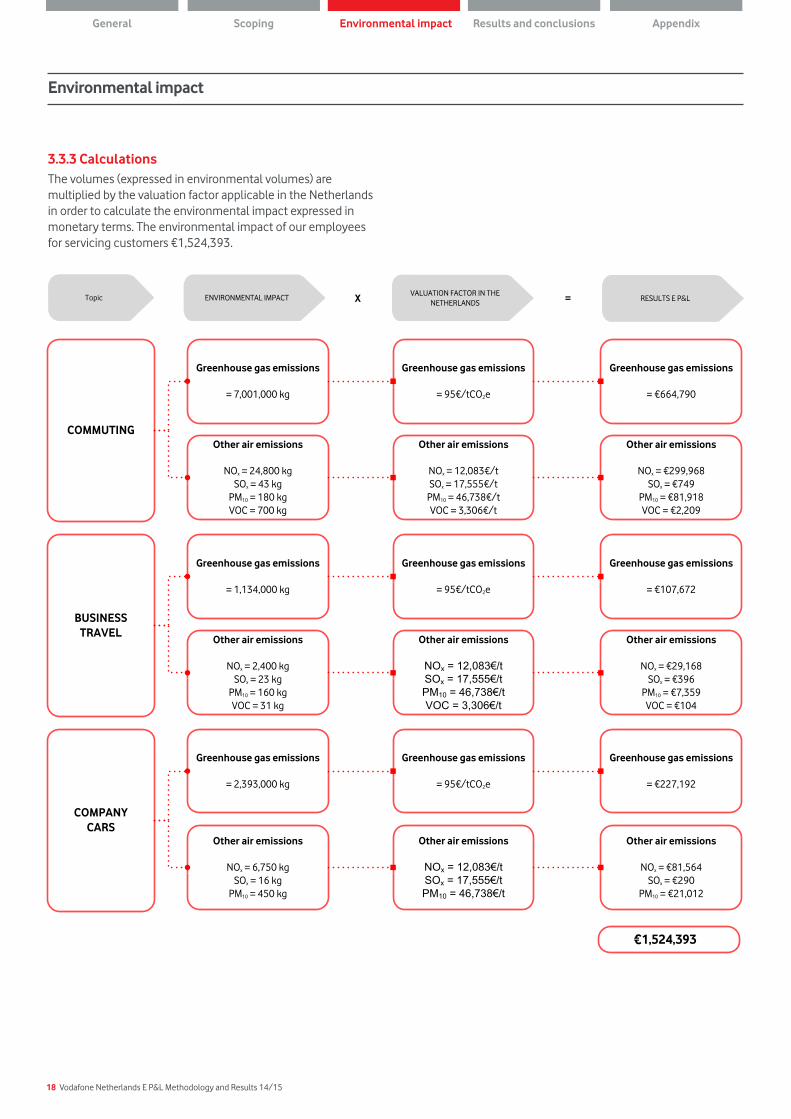
3.3.3 CalculationsThe volumes (expressed in environmental volumes) are multiplied by the valuation factor applicable in the Netherlands in order to calculate the environmental impact expressed in monetary terms. The environmental impact of our employees for servicing customers €1,524,393.
Scoping Environmental impact Results and conclusions AppendixGeneral
€
19 Vodafone Netherlands E P&L Methodology and Results 14/15
3.4 Handsets
3.4.1 ImpactNegative Impact
Life cycle analyses show that the production phase is the greatest contributor to the environmental impact of a handset (Apple, 2014; Bureau Veritas, 2011). Other environmental impacts come from transport, customer usage, and handset recycling. The entire value chain is included in the impact calculations of a mobile phone.
Extracting raw materials and manufacturing
During the production phase, raw materials are extracted and processed into components. The production of a mobile phone requires energy, precious and scarce metals, and a large amount of water. As most handsets are produced in Asia, the environmental costs for water use are assumed to be higher than in Europe, due to scarcity. Subsequently, all components of a mobile handset need to be assembled. When the handsets are completed, they are transported from Asia to the distribution centre of Vodafone Netherlands in Germany.
Operation phase
From the distribution centre in Germany, vans distribute the handsets across the Netherlands. The handsets are either delivered directly to the customer (i.e. online or telesales), to one of the 245 retail shops or to third party resellers. As the phone is delivered to the customer, the mobile has to be charged every day, which requires energy use.
End-of-life phase
In the end-of-life treatment the mobile phones are collected, dismantled, and, if applicable, components depolluted. It is assumed that the remaining parts are incinerated, put into landfill, or recycled (Bureau Veritas, 2011).
3.4.2 Impact areaScope
Limitations and assumptions
• For the calculation of the value chain impact, this E P&L has used the results of the LCA which Vodafone uses for calculating its eco-rating. This LCA was conducted by Bureau Veritas in 2011 and includes the entire value chain of a handset, including the extraction of raw materials, production, distribution, operation, and end-of-life phase. All assumptions made in this LCA are listed in Appendix C.3. This LCA is currently still the base information used for eco-rating by Forum for the Future, a British not-for-profit organisation which works with companies to create sustainable networks, and therefore considered valid.
• The impact of the distribution of the handsets from the distribution centre to the customer is based on PostNL. PostNL provides CO2 calculations per package on their website2. It is assumed that these figures also apply to the other parties that deliver packages for Vodafone. In order to include air emissions as well, it is assumed that all vans distributing the packages for Vodafone run on diesel.
• All handsets sold by Vodafone are assumed to be smartphones. According to Bureau Veritas (2011), a smartphone is a mobile phone which can connect to the internet through the 3G network.
• Bureau Veritas (2011) also includes air and water toxicity in the impact of a mobile phone. However, because there is no definition or detailed description of what air and water toxicity comprise, it is impossible to convert this environmental impact into monetary terms. Therefore, air and water toxicity are excluded.
• In calculating the water costs of producing a smartphone, the production phase is assumed to take place in China. Furthermore, it is assumed that water is scarce and therefore higher social costs are taken into account.
• Decreased performance of batteries due to ageing has not been taken into account. Therefore, total energy
Environmental impact
2http://www.postnl.nl/zakelijke-oplossingen/post-versturen/verzendopties/groene-post/co2-calculator/
Attribution
Vodafone 100% Value chain 0%
Scoping Environmental impact Results and conclusions AppendixGeneral
Build
ings
Han
dset
sTa
blet
sVo
dafo
ne
Thui
sD
emat
eria
lisat
ion
M2M
Net
wor
k
Constructingbuildings
Procuringbuildings
Manufacturing components
Assembling (tablets and accessories)
Managing offices, retail stores, and call centres
Refurbishment, decommissioning, and demolition of
buildings
Re-using tablets
Recycling materials
Disposal
Using phones
Functionalities
Dematerialisation – Carbon abatement
Rolling out network
Running network
Extracting raw materials
Manufacturing Operation/use End-of-life
Mining and processing of raw materials
Manufacturing components
Assembling (handsets and accessories)
Manufacturing components
Assembling (modems and TV
boxes)
Manufacturing components
Assembling (network
equipment)
Re-using handsets
Recycling materials
Disposal
Re-using modems and TV boxes
Recycling materials
Disposal
Re-using network equipment
Recycling materials
Disposal
Mining and processing of raw
materials
Enablement of technology
Functionalities
Mining and processing of raw materials
Mining and processing of raw
materials
Mining and processing of raw
materials
Mining and processing of raw materials
Manufacturing components
Assembling (M2M modems)
Re-using M2M modems
Recycling materials
Disposal
C C CC C A
W
C A H W
C A H WC A H WC A H WC A H WC A H W
C C C
C
W
C A H WC A H WC A H WC A H W
Serv
icin
g cu
stom
ers
by
empl
oyee
s Business travel Company cars
Commuting
C A
C AC A
STCU
DO
RP
C
A
H
W
GHG emissions
Other air emissions
Water consumption
Waste production
Distribution
C A
Using tablets Distribution
Using Vodafone ThuisC A
DistributionC A
M2M – Carbon abatement
Using M2M connectivity
C A H W
C
Office equipment (i.e. desk/laptop)

20 Vodafone Netherlands E P&L Methodology and Results 14/15
Environmental impact
• In calculating the impact of the mobile phones, each mobile phone is equally weighted. There is no distinction made based on sales figures. Therefore, the impact of mobile phones might be underestimated as large smartphones are sold more often and have a larger impact than smaller ones.
• As Apple does not co-operate with Vodafone to determine the eco score for iPhones, iPhones are not included in this analysis. However, Apple (2012, 2014) has reported greenhouse gas emissions for the iPhone 6 and iPhone 5 in an environmental report. These reported emissions are quite equal to similar smartphones. Therefore, the absence of the eco scores for iPhones is considered to have minimal impact on the final outcomes.
3.4.3 CalculationsThe volumes (expressed in environmental volumes) are multiplied by the valuation factor. According to Trucost (2013), water prices rise when water becomes more scarce. Therefore, a high water price is applied. Other prices are based on the Netherlands. In order to express the environmental impact in monetary terms, the environmental impact is multiplied with the valuation factor. This results in a total impact for mobile handsets of €14,465,883.
consumption during the mobile handset’s life cycle is underestimated. However, this estimation does not have significant impact on the total impact of handsets.
• All mobile phones sold in the financial year 2014 are included in this E P&L, even though a mobile phone can be used for more than one year. This is because Vodafone sells around the same number of mobile phones every year, which means it makes no difference if the impact of a mobile phone is spread out over its lifespan.
• The various uses of mobile phones (i.e. how they replace cameras, radios, alarm clocks, or watches) are not included due to a lack of information about the actual positive impacts, even though the functionality of mobile phones was material according to the selection criteria. Further research in the coming years might make it possible to include this in future E P&Ls.
• Bureau Veritas assumes that in the end-of-life phase, mobile phones are partially incinerated, put into landfill, and recycled. However, in the Netherlands the recycling ratio is relatively high. For example, Wecycle (2012) reports that 97% of a mobile phone is usefully recovered. Therefore the negative impact of a mobile phone is likely to be overestimated.
• The impact of water consumption and global warming potential is adjusted to the most recent impact measurement, based on the newest eco-score ratings.
Topic ENVIRONMENTAL IMPACTVALUATION FACTOR IN THE
NETHERLANDSX RESULTS E P&L=
€14,465,883
ENTIRE LIFE CYCLE
Other air emissions
C2H4 = 9 kgSO2 = 205,882 kg
PM10 = 68 kgNOx = 1,006 kg
Greenhouse gas emissions
CFC-11 = 6 gCO2 = 53,615,076 kg
Other air emissions
C2H4 = 5,63 €/kgSO2 = 17.33 €/kgPM10 = 46.14 €/kgNOx = 11.93 €/kg
Greenhouse gas emissions
CFC-11 = 45 €/kgCO2 = 0.095 €/kg
Other air emissions
C2H4 = €50SO2 = €3,614,279
PM10 = €3,181NOx = €12,158
Greenhouse gas emissions
CFC-11 = €0.27CO2 = €5,122,371
Waste production
Hazardous = 848,380 kg
Water depletion and eutrophication
dm3 = 477,279,304PO4 = 916 g
Water depletion and eutrophication
dm3 = 11.61 €/m3
PO4 = 12.43€/kg
Water depletion and eutrophication
dm3 = €5,539,716PO4 = €11
Waste production
Hazardous = 0.205 €/kg
Waste production
Hazardous = €174,079
Scoping Environmental impact Results and conclusions AppendixGeneral
21 Vodafone Netherlands E P&L Methodology and Results 14/15
3.5 Vodafone Thuis
3.5.1 ImpactNegative impact
Since 2014, Vodafone has been offering its customers the Vodafone Thuis service. This is a fixed broadband connection that includes internet and television. Customers that have ordered Vodafone Thuis receive a setup box with an internet modem and TV box. According to Malmodin, Moberg, Lunden, Finnveden, and Lovehagen (2010), end user modems represent a small but important part of the electricity use of telecom end user equipment, partly due to rather high energy consumption in standby mode.
Extracting raw materials, manufacturing and operation phase
According to Malmodin et al. (2010) the manufacture of modems/routers with a short lifetime results in emission levels of 15 kg CO2-eq per device. This includes raw materials, production, assembly and transport to the distribution centre.
Operation phase
From the distribution centre in Germany, the set up boxes are either delivered directly to the customer (i.e. online or telesales), to one of the 245 retail shops or to third party resellers. When the setup box is installed, the average modem is estimated to consume 80 kWh/year (Malmodin et al., 2014).
End-of-life phase
TV boxes and Wi-Fi modems are recollected when customers terminate their contract. As Vodafone has only recently gone operational with Vodafone Thuis, all returning TV boxes and Wi-Fi modems are still relatively new. Therefore, the devices are refurbished and used again. In the future, as this business will be more mature, end of life disposal should be included.
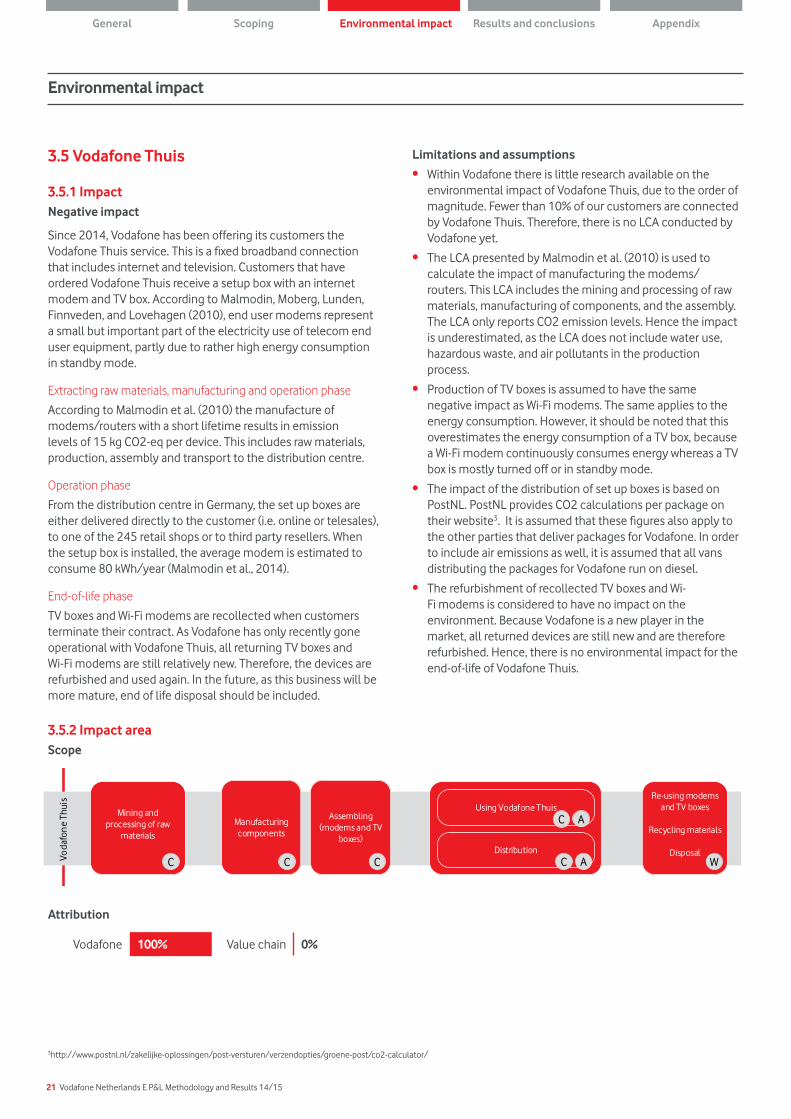
3.5.2 Impact areaScope
Attribution
Vodafone 100% Value chain 0%
Limitations and assumptions
• Within Vodafone there is little research available on the environmental impact of Vodafone Thuis, due to the order of magnitude. Fewer than 10% of our customers are connected by Vodafone Thuis. Therefore, there is no LCA conducted by Vodafone yet.
• The LCA presented by Malmodin et al. (2010) is used to calculate the impact of manufacturing the modems/routers. This LCA includes the mining and processing of raw materials, manufacturing of components, and the assembly. The LCA only reports CO2 emission levels. Hence the impact is underestimated, as the LCA does not include water use, hazardous waste, and air pollutants in the production process.
• Production of TV boxes is assumed to have the same negative impact as Wi-Fi modems. The same applies to the energy consumption. However, it should be noted that this overestimates the energy consumption of a TV box, because a Wi-Fi modem continuously consumes energy whereas a TV box is mostly turned off or in standby mode.
• The impact of the distribution of set up boxes is based on PostNL. PostNL provides CO2 calculations per package on their website3. It is assumed that these figures also apply to the other parties that deliver packages for Vodafone. In order to include air emissions as well, it is assumed that all vans distributing the packages for Vodafone run on diesel.
• The refurbishment of recollected TV boxes and Wi-Fi modems is considered to have no impact on the environment. Because Vodafone is a new player in the market, all returned devices are still new and are therefore refurbished. Hence, there is no environmental impact for the end-of-life of Vodafone Thuis.
Environmental impact
3http://www.postnl.nl/zakelijke-oplossingen/post-versturen/verzendopties/groene-post/co2-calculator/
Scoping Environmental impact Results and conclusions AppendixGeneral
Build
ings
Han
dset
sTa
blet
sVo
dafo
ne
Thui
sD
emat
eria
lisat
ion
M2M
Net
wor
k
Constructingbuildings
Procuringbuildings
Manufacturing components
Assembling (tablets and accessories)
Managing offices, retail stores, and call centres
Refurbishment, decommissioning, and demolition of
buildings
Re-using tablets
Recycling materials
Disposal
Using phones
Functionalities
Dematerialisation – Carbon abatement
Rolling out network
Running network
Extracting raw materials
Manufacturing Operation/use End-of-life
Mining and processing of raw materials
Manufacturing components
Assembling (handsets and accessories)
Manufacturing components
Assembling (modems and TV
boxes)
Manufacturing components
Assembling (network
equipment)
Re-using handsets
Recycling materials
Disposal
Re-using modems and TV boxes
Recycling materials
Disposal
Re-using network equipment
Recycling materials
Disposal
Mining and processing of raw
materials
Enablement of technology
Functionalities
Mining and processing of raw materials
Mining and processing of raw
materials
Mining and processing of raw
materials
Mining and processing of raw materials
Manufacturing components
Assembling (M2M modems)
Re-using M2M modems
Recycling materials
Disposal
C C CC C A
W
C A H W
C A H WC A H WC A H WC A H WC A H W
C C C
C
W
C A H WC A H WC A H WC A H W
Serv
icin
g cu
stom
ers
by
empl
oyee
s Business travel Company cars
Commuting
C A
C AC A
STCU
DO
RP
C
A
H
W
GHG emissions
Other air emissions
Water consumption
Waste production
Distribution
C A
Using tablets Distribution
Using Vodafone ThuisC A
DistributionC A
M2M – Carbon abatement
Using M2M connectivity
C A H W
C
Office equipment (i.e. desk/laptop)
22 Vodafone Netherlands E P&L Methodology and Results 14/15
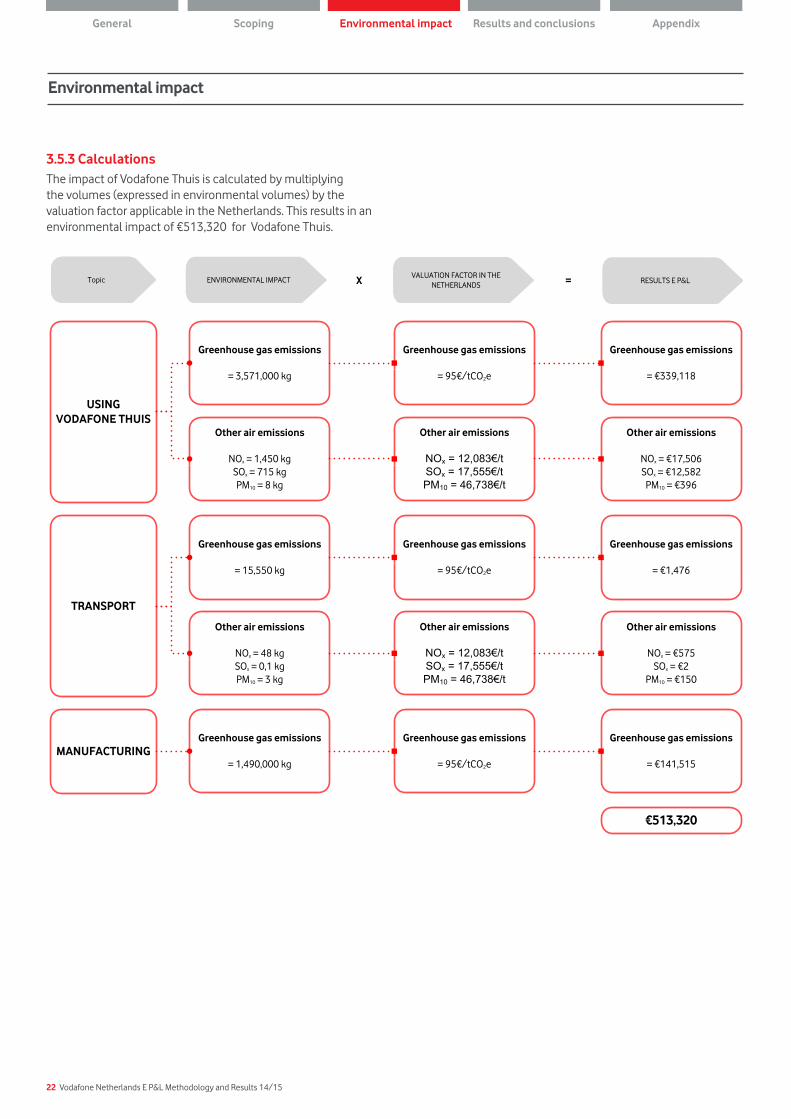
3.5.3 Calculations The impact of Vodafone Thuis is calculated by multiplying the volumes (expressed in environmental volumes) by the valuation factor applicable in the Netherlands. This results in an environmental impact of €513,320 for Vodafone Thuis.
Environmental impact
TRANSPORT
Other air emissions
NOx = 48 kgSOx = 0,1 kgPM10 = 3 kg
Greenhouse gas emissions
= 15,550 kg
Other air emissions
NOx = 12,083€/tSOx = 17,555€/tPM10 = 46,738€/t
Greenhouse gas emissions
= 95€/tCO2e
Other air emissions
NOx = €575SOx = €2
PM10 = €150
Greenhouse gas emissions
= €1,476
Topic ENVIRONMENTAL IMPACTVALUATION FACTOR IN THE
NETHERLANDSX RESULTS E P&L=
€513,320
MANUFACTURINGGreenhouse gas emissions
= 1,490,000 kg
Greenhouse gas emissions
= 95€/tCO2e
Greenhouse gas emissions
= €141,515
USING VODAFONE THUIS
Other air emissions
NOx = 1,450 kgSOx = 715 kgPM10 = 8 kg
Greenhouse gas emissions
= 3,571,000 kg
Other air emissions
NOx = 12,083€/tSOx = 17,555€/tPM10 = 46,738€/t
Greenhouse gas emissions
= 95€/tCO2e
Other air emissions
NOx = €17,506SOx = €12,582
PM10 = €396
Greenhouse gas emissions
= €339,118
Scoping Environmental impact Results and conclusions AppendixGeneral

23 Vodafone Netherlands E P&L Methodology and Results 14/15
Build
ings
Han
dset
sTa
blet
sVo
dafo
ne
Thui
sD
emat
eria
lisat
ion
M2M
Net
wor
kConstructing
buildingsProcuringbuildings
Manufacturing components
Assembling (tablets and accessories)
Managing offices, retail stores, and call centres
Refurbishment, decommissioning, and demolition of
buildings
Re-using tablets
Recycling materials
Disposal
Using phones
Functionalities
Dematerialisation – Carbon abatement
Rolling out network
Running network
Extracting raw materials
Manufacturing Operation/use End-of-life
Mining and processing of raw materials
Manufacturing components
Assembling (handsets and accessories)
Manufacturing components
Assembling (modems and TV
boxes)
Manufacturing components
Assembling (network
equipment)
Re-using handsets
Recycling materials
Disposal
Re-using modems and TV boxes
Recycling materials
Disposal
Re-using network equipment
Recycling materials
Disposal
Mining and processing of raw
materials
Enablement of technology
Functionalities
Mining and processing of raw materials
Mining and processing of raw
materials
Mining and processing of raw
materials
Mining and processing of raw materials
Manufacturing components
Assembling (M2M modems)
Re-using M2M modems
Recycling materials
Disposal
C C CC C A
W
C A H W
C A H WC A H WC A H WC A H WC A H W
C C C
C
W
C A H WC A H WC A H WC A H W
Serv
icin
g cu
stom
ers
by
empl
oyee
s Business travel Company cars
Commuting
C A
C AC A
STCU
DO
RPC
A
H
W
GHG emissions
Other air emissions
Water consumption
Waste production
Distribution
C A
Using tablets Distribution
Using Vodafone ThuisC A
DistributionC A
M2M – Carbon abatement
Using M2M connectivity
C A H W
C
Office equipment (i.e. desk/laptop)
3.6A Dematerialisation
3.6A.1 ImpactPositive impact
Dematerialisation, in economic terms, is basically doing more with less. This occurs from a combination of different products and services Vodafone offers. It includes mobile telepresence, virtual office, and mobile delivery notifications for e-commerce. By embracing these products as an organisation, people do not have the urge to travel. They can join conferences from almost anywhere using handsets, or work remotely and from home. Without the necessity to travel to work, people can reduce the emissions caused by commuting. At the same time, offices can become smaller as more people work at home. Smaller office spaces also make a lower environmental impact.
Negative impact
The negative impact of dematerialisation is the increased energy use and heating needed in the home. These increased utilities have a negative impact and have been taken into account while calculating the benefits of dematerialisation.
3.6A.2 Impact areaAccording to Carbon Trust (2015), Vodafone Netherlands can attribute ≈6% of the dematerialisation benefits to its products and services. This calculation is based on ≈28% of people working from home for a full day. Of this 28%, approximately 20% consider that either their mobile phone, laptop, or Wi-Fi is important for them to work from home and this service is provided by Vodafone.
Scope
Attribution
Vodafone 6% Value chain 94%
3.6 Impact of Vodafone’s products and servicesVodafone offers a wide range of products and services. These products and services offer various opportunities to reduce carbon emission and energy costs. The advantages of these products and services are all described in detail in the Vodafone & Accenture Carbon Connections report (2009). Briefly, they include:
• Dematerialisation – replacing physical goods, processes or travel by ‘virtual’ alternatives, such as video conferencing or e-commerce (online shopping)
• Smart grid – improving efficiency of electricity grids through active monitoring and reducing reliance on centralised electricity production
• Smart logistics – monitoring and tracking vehicles and their loads to improve the efficiency of logistics operations by utilising vehicles more fully
• Smart cities – improving traffic and utilities management
• Smart manufacturing – synchronising manufacturing operations and incorporating communication modules in manufactured products.
Environmental impact
Smart grid, smart logistics, smart cities, and smart manufacturing are all examples of smart applications, which enable customers to improve efficiency and achieve environmental benefits by using machine-2-machine (M2M) devices. The dematerialisation that occurs when people communicate or buy goods over the internet reduces the need to travel. These services will be discussed and quantified to address the positive impact other companies have due to Vodafone’s products and services.
Scoping Environmental impact Results and conclusions AppendixGeneral

24 Vodafone Netherlands E P&L Methodology and Results 14/15
Environmental impact
Limitations and assumptions
• The positive impact of dematerialisation is only expressed in avoided CO2 emissions. Other avoided air emissions, for instance, are not included.
• Dematerialisation is enabled by a mobile phone, laptop, or Wi-Fi. Therefore, the negative impact is included in the calculations of the impact of handsets and Vodafone Thuis.
• Of smart workers, 73% feel their mobile phone is an enabler for smart working.
• Assumptions made by the Carbon Trust to calculate the benefits of dematerialisation are listed in Appendix C.4.
3.6A.3 CalculationsThe impact of dematerialisation is calculated by multiplying the volumes (expressed in environmental volumes) by the valuation factor applicable in the Netherlands. This results in a positive environmental impact of €17,031,199 for dematerialisation.
Topic ENVIRONMENTAL IMPACTVALUATION FACTOR IN THE
NETHERLANDSX RESULTS E P&L=
€17,031,199
REDUCED COMMUTING AND OFFICE UTILITIES
Avoided greenhouse gas emissions
= 226,257,000 kg
Avoided greenhouse gas emissions
= 95€/tCO2e
Avoided greenhouse gas emissions
= €21,484,682
UTILITIES AT HOME
Greenhouse gas emissions
= 45,900,000 kg
Greenhouse gas emissions
= 95€/tCO2e
Greenhouse gas emissions
= €4,453,482
Scoping Environmental impact Results and conclusions AppendixGeneral
25 Vodafone Netherlands E P&L Methodology and Results 14/15
Build
ings
Han
dset
sTa
blet
sVo
dafo
ne
Thui
sD
emat
eria
lisat
ion
M2M
Net
wor
k
Constructingbuildings
Procuringbuildings
Manufacturing components
Assembling (tablets and accessories)
Managing offices, retail stores, and call centres
Refurbishment, decommissioning, and demolition of
buildings
Re-using tablets
Recycling materials
Disposal
Using phones
Functionalities
Dematerialisation – Carbon abatement
Rolling out network
Running network
Extracting raw materials
Manufacturing Operation/use End-of-life
Mining and processing of raw materials
Manufacturing components
Assembling (handsets and accessories)
Manufacturing components
Assembling (modems and TV
boxes)
Manufacturing components
Assembling (network
equipment)
Re-using handsets
Recycling materials
Disposal
Re-using modems and TV boxes
Recycling materials
Disposal
Re-using network equipment
Recycling materials
Disposal
Mining and processing of raw
materials
Enablement of technology
Functionalities
Mining and processing of raw materials
Mining and processing of raw
materials
Mining and processing of raw
materials
Mining and processing of raw materials
Manufacturing components
Assembling (M2M modems)
Re-using M2M modems
Recycling materials
Disposal
C C CC C A
W
C A H W
C A H WC A H WC A H WC A H WC A H W
C C C
C
W
C A H WC A H WC A H WC A H W
Serv
icin
g cu
stom
ers
by
empl
oyee
s Business travel Company cars
Commuting
C A
C AC ASTC
UD
ORP
C
A
H
W
GHG emissions
Other air emissions
Water consumption
Waste production
Distribution
C A
Using tablets Distribution
Using Vodafone ThuisC A
DistributionC A
M2M – Carbon abatement
Using M2M connectivity
C A H W
C
Office equipment (i.e. desk/laptop)
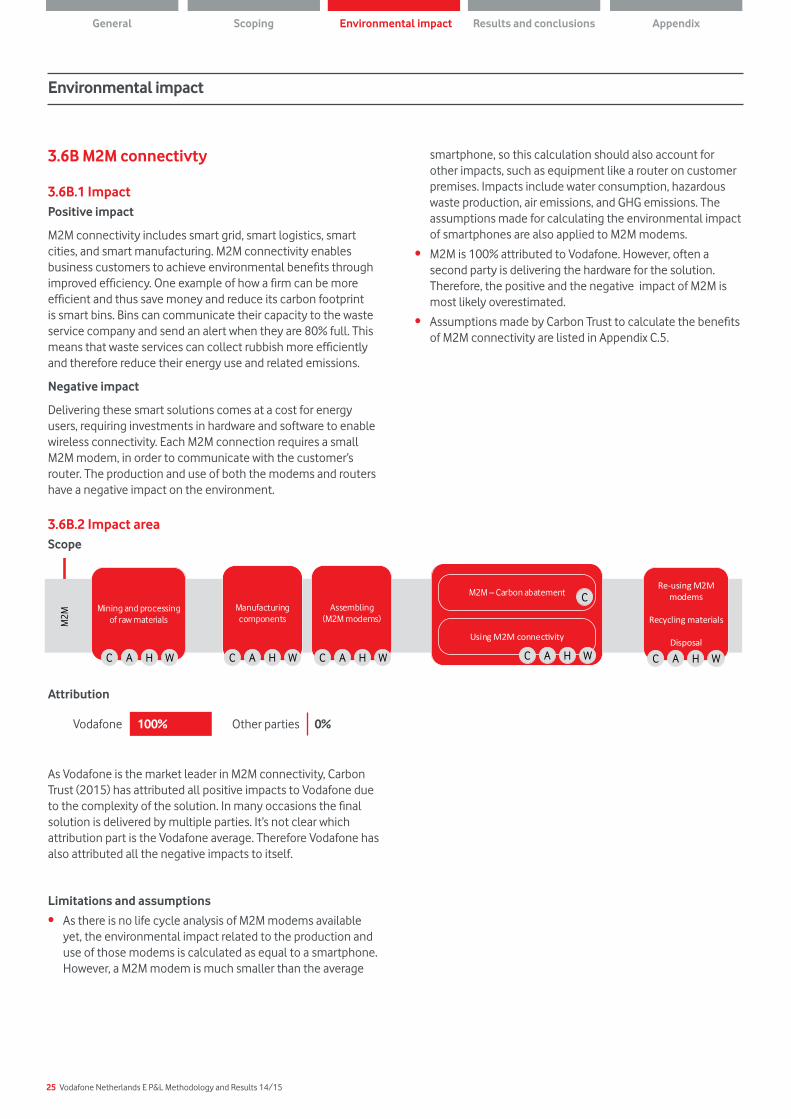
3.6B M2M connectivty
3.6B.1 ImpactPositive impact
M2M connectivity includes smart grid, smart logistics, smart cities, and smart manufacturing. M2M connectivity enables business customers to achieve environmental benefits through improved efficiency. One example of how a firm can be more efficient and thus save money and reduce its carbon footprint is smart bins. Bins can communicate their capacity to the waste service company and send an alert when they are 80% full. This means that waste services can collect rubbish more efficiently and therefore reduce their energy use and related emissions.
Negative impact
Delivering these smart solutions comes at a cost for energy users, requiring investments in hardware and software to enable wireless connectivity. Each M2M connection requires a small M2M modem, in order to communicate with the customer’s router. The production and use of both the modems and routers have a negative impact on the environment.
3.6B.2 Impact areaScope
Environmental impact
Attribution
Vodafone 100% Other parties 0%
As Vodafone is the market leader in M2M connectivity, Carbon Trust (2015) has attributed all positive impacts to Vodafone due to the complexity of the solution. In many occasions the final solution is delivered by multiple parties. It’s not clear which attribution part is the Vodafone average. Therefore Vodafone has also attributed all the negative impacts to itself.
Limitations and assumptions
• As there is no life cycle analysis of M2M modems available yet, the environmental impact related to the production and use of those modems is calculated as equal to a smartphone. However, a M2M modem is much smaller than the average
smartphone, so this calculation should also account for other impacts, such as equipment like a router on customer premises. Impacts include water consumption, hazardous waste production, air emissions, and GHG emissions. The assumptions made for calculating the environmental impact of smartphones are also applied to M2M modems.
• M2M is 100% attributed to Vodafone. However, often a second party is delivering the hardware for the solution. Therefore, the positive and the negative impact of M2M is most likely overestimated.
• Assumptions made by Carbon Trust to calculate the benefits of M2M connectivity are listed in Appendix C.5.
Scoping Environmental impact Results and conclusions AppendixGeneral
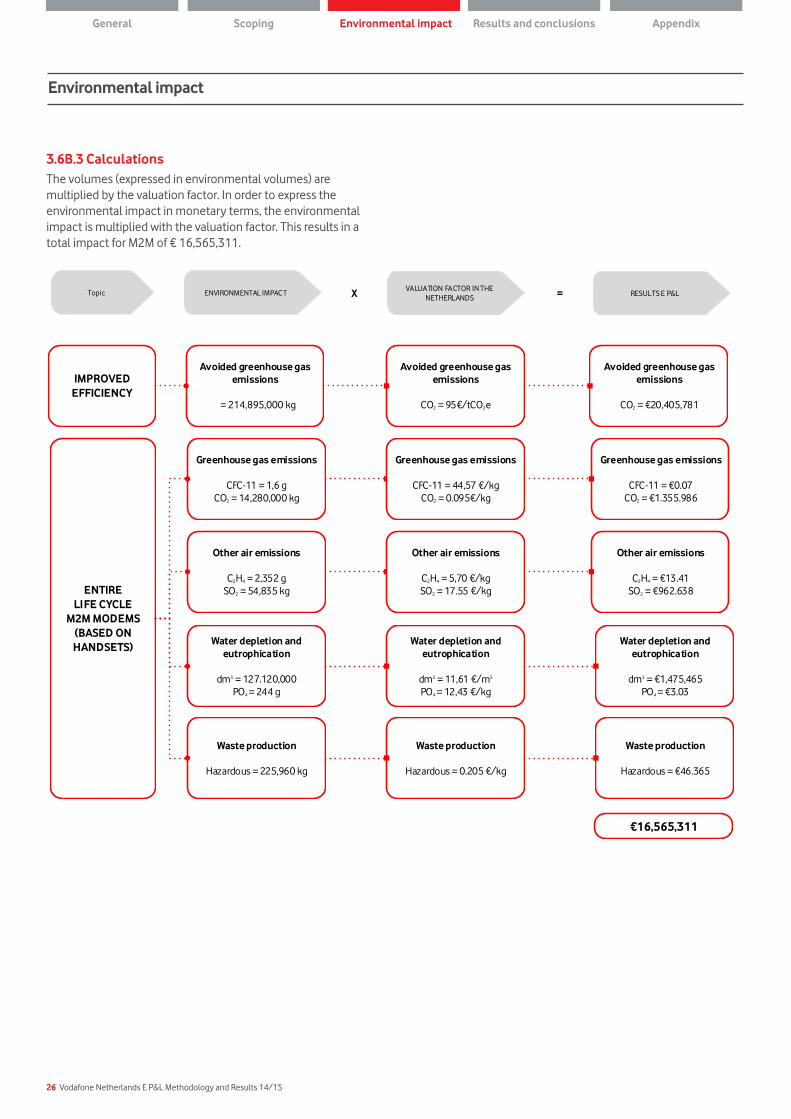
26 Vodafone Netherlands E P&L Methodology and Results 14/15
3.6B.3 CalculationsThe volumes (expressed in environmental volumes) are multiplied by the valuation factor. In order to express the environmental impact in monetary terms, the environmental impact is multiplied with the valuation factor. This results in a total impact for M2M of € 16,565,311.
Environmental impact
Topic ENVIRONMENTAL IMPACTVALUATION FACTOR IN THE
NETHERLANDSX RESULTS E P&L=
€16,565,311
ENTIRE LIFE CYCLE
M2M MODEMS (BASED ON HANDSETS)
Other air emissions
C2H4 = 2,352 gSO2 = 54,835 kg
Greenhouse gas emissions
CFC-11 = 1,6 gCO2 = 14,280,000 kg
Other air emissions
C2H4 = €13.41SO2 = €962.638
Greenhouse gas emissions
CFC-11 = €0.07CO2 = €1.355.986
Waste production
Hazardous = 225,960 kg
Water depletion and eutrophication
dm3 = 127.120,000PO4 = 244 g
Water depletion and eutrophication
dm3 = €1,475,465PO4 = €3.03
Waste production
Hazardous = €46.365
Avoided greenhouse gas emissions
= 214,895,000 kg
Avoided greenhouse gas emissions
CO2 = 95€/tCO2e
Avoided greenhouse gas emissions
CO2 = €20,405,781
IMPROVED EFFICIENCY
Other air emissions
C2H4 = 5,70 €/kgSO2 = 17.55 €/kg
Greenhouse gas emissions
CFC-11 = 44,57 €/kgCO2 = 0.095€/kg
Water depletion and eutrophication
dm3 = 11,61 €/m3
PO4 = 12,43 €/kg
Waste production
Hazardous = 0.205 €/kg
Scoping Environmental impact Results and conclusions AppendixGeneral
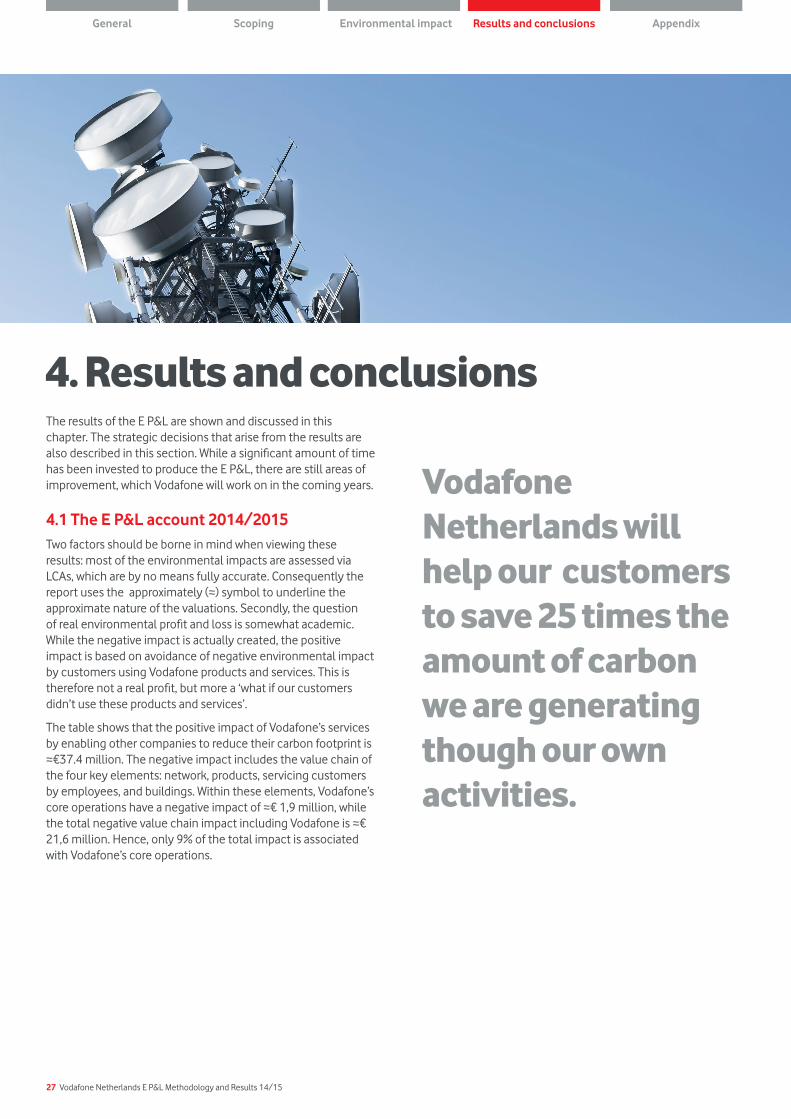
27 Vodafone Netherlands E P&L Methodology and Results 14/15
The results of the E P&L are shown and discussed in this chapter. The strategic decisions that arise from the results are also described in this section. While a significant amount of time has been invested to produce the E P&L, there are still areas of improvement, which Vodafone will work on in the coming years.
4.1 The E P&L account 2014/2015Two factors should be borne in mind when viewing these results: most of the environmental impacts are assessed via LCAs, which are by no means fully accurate. Consequently the report uses the approximately (≈) symbol to underline the approximate nature of the valuations. Secondly, the question of real environmental profit and loss is somewhat academic. While the negative impact is actually created, the positive impact is based on avoidance of negative environmental impact by customers using Vodafone products and services. This is therefore not a real profit, but more a ‘what if our customers didn’t use these products and services’.
The table shows that the positive impact of Vodafone’s services by enabling other companies to reduce their carbon footprint is ≈€37.4 million. The negative impact includes the value chain of the four key elements: network, products, servicing customers by employees, and buildings. Within these elements, Vodafone’s core operations have a negative impact of ≈€ 1,9 million, while the total negative value chain impact including Vodafone is ≈€ 21,6 million. Hence, only 9% of the total impact is associated with Vodafone’s core operations.
4. Results and conclusions
Vodafone Netherlands will help our customers to save 25 times the amount of carbon we are generating though our own activities.
Scoping Environmental impact Results and conclusions AppendixGeneral

28 Vodafone Netherlands EP&L Methodology and Results
Results and conclusions
Loss ProfitBuildings Managing the offices ≈€182,340 Dematerialisation Dematerialisation services ≈€17,031,199
Network Production
(incl. raw materials, distribu-
tion, manufacturing)
≈€927,892 Machine-2-machine M2M connections ≈€20,405,781
Running the network ≈€144,819
End-of-life ≈€2,314
Servicing customers by
employees
Commuting ≈€1,049,635
Business travel ≈€144,699
Company cars ≈€330,059
Handsets Production
(incl. raw materials)
≈€13,473,062
Distribution ≈€761,074
Operation ≈€164,556
Distribution to customer ≈€46,620
End-of-life ≈€20,570
Vodafone Thuis Production modems and TV boxes (incl. raw materials, distribution, manufacturing)
≈€141,515
Distribution to customer ≈€2,203
Operation ≈€369,602
End-of-life Vodafone Thuis ≈€0
Machine-2-machine Production M2M modems (incl. raw materials)
≈€3,588,456
Distribution M2M modems ≈€202,707
Operation M2M modems ≈€43,828
End-of-life M2M modems ≈€5,479
TOTAL ≈€21,601,430 TOTAL ≈€37,436,980
E P&L 2014/15
Scoping Environmental impact Results and conclusions AppendixGeneral

29 Vodafone Netherlands E P&L Methodology and Results 14/15
4.2 What do we learn from the results?We have evaluated the results based on the five reasons for the calculation of an environmental Profit & Loss account defined in chapter 1.
1. Strategic insights on the environmental value of the full life cycle.
Vodafone is able to create a significant amount of positive impact by its smart working and M2M solutions. These results suggest that it would be a good idea to innovate further in these type of products and services. The biggest negative impacts are created in the embedded the manufacturing of handsets. As Vodafone does not directly manufacture handsets we have low visibility and control of this supply chain and they can span several tiers or layers. Our M2M solutions have the potential to help our customers and suppliers reduce their environmental impact such as smart metering and telematics. Circular business models can be adopted to decrease the negative impact of the production of handsets including promotion of our sim-only plans to increase the use of handsets for longer, selling refurbished devices and buying back customer’s devices.
In addition, Vodafone aims to improve its own environmental impact. When the environmental impact is compared with the actual costs paid, it makes clear these additional cost sometimes are relative low (eg € 13,72 per handset) or sometimes relative high (environmental costs of commuting appr 10%-20% of total spend). These comparisons enables underpinning of strategic decision making.
2. Insights for internalisation
Carbon emissions account for 42% of the total negative environmental impact. Water for 33%, air for 24 % and waste for 1% of the total E P&L. The most material impacts are CO2, water and other air emissions. We aim to investigate what the potential future risks for our business are in relation to these areas. By identifying those water scarce areas which might impact its business continuity, the company is able to act effectively and open up the discussion with stakeholders. Furthermore, Vodafone will be able to anticipate new upcoming regulations and standards for emissions, which might impact its business. An example is already Vodafone’s new carbon ambition: Vodafone Netherlands will help our customers to save 25 times the amount of carbon we are generating though our own activities.
3. Forecasting
Vodafone aims to empower its customers. With the insights of this E P&L, the company aims to forecast how it can fulfil customer expectations based on the information it has gathered regarding the benefits the business creates for customers. With these insights, Vodafone can sharpen its risk strategies and eventually, make better investment decisions based on shared value.
4. Clarity
With this publication, Vodafone is increasing the transparency of its impacts to its share- and stakeholders. Vodafone has already communicated intermediary results and the methodology with some of its stakeholders and they encouraged the company to investigate the inclusion of social impacts in the future. Not only external stakeholders, but also internal stakeholders have been given more transparency and awareness of Vodafone’s environmental impacts across the value chain.
5. Benchmarking
This is the first year Vodafone Netherlands has conducted an E P&L. By expressing the company’s impacts in euros, the impacts across different life stages can be more easily compared. Vodafone expects more companies in its sector to publish their E P&L results. When available, the company can use these results for benchmarking. Further, it can benchmark their own performance in time.
Results and conclusions
CO2 42%
Water 33%
Air 24%
Waste 1%
Scoping Environmental impact Results and conclusions AppendixGeneral
Total environmental impact divided by indicator
- Karel Zeldenrust, Dutch Ministry of Infrastructure and the Environment
Establishing a profit and loss account for environmental issues influenced by Vodafone’s business, is a fine initiative. It will make it possible better to understand the interrelated environmental interests of both company and society and to realize as a company an actual weighting of social costs and benefits. Future business processes and investments can be therefore stimulated in the direction of creating true shared value, both for Vodafone and society as a whole.
“ “

30 Vodafone Netherlands E P&L Methodology and Results 14/15
4.3 Areas for improvementVodafone has identified the following areas of improvement which it will work on in the coming years:
• Several LCAs have been used in the E P&L. Some of them can be updated to improve the accuracy of our E P&L.
• Insights in the value chain could be improved by more dedicated LCAs including a range of indicators, next to CO2. This applies to the network, M2M modems, and SIM cards. Ericsson will publish more extensive reports about the network in the near future, which can be included in future E P&Ls.
• Major parts of Vodafone’s services are not included in this E P&L including the benefits of calling and the access to the internet. The negative impacts are already included, namely handsets and the network. Vodafone aims to investigate these positive impacts in the near future.
• The scope determination can be improved. For example, the enterprise fixed lines business is currently not included in this E P&L as a separate product. The direct negative impact is included of buildings and network. The indirect negative impact (end user equipment like routers) and any positive impacts are not part of this E P&L yet. In addition, the environmental indicators, biodiversity and land use, are excluded in this E P&L.
• Vodafone attributes all negative impacts solely to itself. More specific attribution can be investigated. Further, avoidance of carbon emissions from M2M connectivity is solely attributed to Vodafone. In the future more realistic attributions can be investigated.
• End of life of e-waste is considered very low. For network equipment, there is a full ownership of Vodafone an therefore in direct control, the recycling end of life is 100% and therefore no e-waste.. As for handsets and other customer equipment the ownership is more indirect. Based in market figures (ICT Environment Monitor 2014) in the Netherlands the assumption is that this kind of equipment is not being disposed but recycled. Additional research should make clear if this assumption is valid. All waste figures in the E P&L are related to the manufacturing of handsets, m2m equipment and Vodafone Thuis. Waste originated from to the manufacturing of Network equipment is not included due to the lack of figures.
• The monetary value of industrial final waste could be improved. Currently, a more general approach has been used to calculate the impact of the waste Vodafone creates. Vodafone can investigate whether the incineration of network equipment has higher social costs than the number that is used in this E P&L.
• Vodafone has not included externalities related to depletion of resources, due to a lack of information. Vodafone will investigate whether they can include these in the future.
Results and conclusions
Scoping Environmental impact Results and conclusions AppendixGeneral
31 Vodafone Netherlands E P&L Methodology and Results 14/15
Disclaimer
Vodafone has taken all reasonable care in writing this report. Nevertheless, it is possible that information contained in this report might not be correct, complete or up-to-date. Vodafone cannot guarantee, is not responsible for, and expressly disclaims all liability for damages of any kind arising out of use, reference to, or reliance on any information contained within the report. The information in this report is exclusively intended as general information. Although the report may include links (providing direct access) to other resources, Vodafone is not responsible for the accuracy or content of information contained in these resources. Hence, no rights can be derived from this information.
Amsterdam, 30 June 2015
We would like to express our appreciation to all those who provided us with the opportunity to complete this report. Many thanks especially to KPMG, whose contribution in stimulating suggestions and encouragement helped us to coordinate the project and to write this report.
Furthermore, we would also like to acknowledge Ericsson’s assistance in providing the necessary information regarding the network, which has been very much appreciated. A special thanks goes to Carbon Trust, that has calculated and helped with the attribution factors of dematerialisation and smart application savings. Moreover, Forum for the Future has helped substantially with their article “Earth calling” to determine the environmental impacts within the mobile telecommunication industry and the eco-rating LCA together with Bureau Veritas. Last but not least, many thanks go to the stakeholders who have helped Vodafone to improve accuracy and completeness of the scope and material areas of the E P&L.
Authors: Tjeerd Hoes and Martin de Jong
Contact: [email protected]
Acknowledgements
Scoping Environmental impact Results and conclusions AppendixGeneral
32 Vodafone Netherlands E P&L Methodology and Results 14/15
Apple (2014). iPhone 6: Environmental Report. Retrieved on 30 April, 2014, from: https://www.apple.com/environment/reports/docs/iPhone6_PER_Sept2014.pdf
Bureau Veritas (2011). Simplified Life Cycle Assessment methodology for mobile phone handsets labelling in Europe: Environmental labelling project 2011. Not available on the Internet.
CE Delft (2010). Annexes - Shadow Prices Handbook. Retrieved on 30 April, 2014, from: http://www.cedelft.eu/publicatie/shadow_prices_handbook_%3A_valuation_and_weighting_of_emissions_and_environmental_impacts/1032
CE Delft (2010). Shadow Prices Handbook. Retrieved on 30 April, 2014, from: http://www.cedelft.eu/publicatie/shadow_prices_handbook_%3A_valuation_and_weighting_of_emissions_and_environmental_impacts/1032
CE Delft (2015). STREAM personenvervoer 2014. Retrieved on 30 April, 2014, from: http://www.ce.nl/publicatie/stream_personenvervoer_2014/1478
CO2-Prestatieladder (2014). Handboek CO2-Prestatieladder 2.2. Retrieved on 30 April, 2014, from: http://www.skao.nl/images/cms/20140404_Handboek_CO_2_Prestatieladder_2_2.pdf
EPA (2013). The social Costs of Carbon. Retrieved on 30 April, 2014, from: http://www.epa.gov/climatechange/EPAactivities/economics/scc.html
ICT Environment Monitor ( 2014): http://www.ictmilieumonitor.nl/en/ictmilieumonitor2014/
Forum for the Future (2006). Earth calling… The environmental impacts of the mobile telecommunications industry. Retrieved on 30 April, 2014, from: https://www.forumforthefuture.org/sites/default/files/project/downloads/earthcalling.pdf
KPMG (2014). A New Vision of Value: Connecting corporate and societal value creation. Retrieved on 30 April, 2015, from: http://www.kpmg.com/ES/es/ActualidadyNovedades/ArticulosyPublicaciones/Documents/a-new-vision-of-value-2014.pdf
Malmodin, J.D., Moberg, A., Lunden, D., Finnveden, G., and Lovehagen, N. (2010). Greenhouse Gas Emissions and Operational Electricity Use in the ICT and Entertainment & Media Sectors. Retrieved on 30 April, 2014, from: http://onlinelibrary.wiley.com/doi/10.1111/j.1530-9290.2010.00278.x/epdf
Malmodin, J.D., Lundén, A., Andersson, G., and Nilsson, M. (2014). Life cycle assessment of ICT: Carbon footprint and operational electricity use from the operator, national, and subscriber perspective in Sweden. Retrieved on 30 April, 2014, from: http://onlinelibrary.wiley.com/doi/10.1111/jiec.12145/suppinfo
Trucost (2013). Natural Capital at Risk: the top 100 externalities of business. Retrieved on 30 April, 2014, from: http://www.naturalcapitalcoalition.org/js/plugins/filemanager/files/TEEB_Final_Report_v5.pdf
Wecycle (2012). Monitoringsverslag 2012. Retrieved on 30 April, 2014, from: http://www.wecycle.nl/uploads/pdf/Monitoringverslag/2012%20Monitoringsverslag%20Wecycle.pdf
Vodafone & Accenture (2009). Carbon Connections: Quantifying mobile’s role in tackling climate change. Retrieved on 5 May, 2014, from: http://www.vodafone.com/content/dam/vodafone/about/sustainability/2012/pdf/carbon_connections.pdf
References
Scoping Environmental impact Results and conclusions AppendixGeneral
33 Vodafone Netherlands E P&L Methodology and Results 14/15
Appendix A - Material impact areasThe elements are assessed using six criteria:
• Environmental impact indicates whether or not the area has significant impact on the environment in the mobile telecommunication industry. This information is derived from Forum for the Future (2006).
• The order of magnitude for products is based on sales figures of Vodafone. The order of magnitude for buildings and network is based on the number of buildings and radio base stations.
• Does the impact area relate to Vodafone’s mission, vision and strategy? (based on the Integrated Report of Vodafone4)
• The key interest of stakeholders: whether the stakeholders view this impact area as crucial. This is based on the materiality matrix and verified during the stakeholder dialogue that was organised to discuss the E P&L.
• The influence of Vodafone is based on whether Vodafone is able to influence this impact area. This is derived from Forum for the Future (2006). Forum for the Future has reported the spheres of control and influence of a mobile telecommunications operator.
• Ownership is derived from whether Vodafone has ownership in this impact area and if it can be directly attributed to Vodafone.
Originally, elements with three or more green check marks are included in the E P&L. However, in order to identify missing elements, the shortlist was crosschecked with the crucial stakeholder interests (from the materiality matrix5) and the strategy (based on the sustainability strategy of Vodafone6). In this crosscheck, the importance of value chain responsibility was considered crucial. Therefore, Vodafone has chosen to include the value chain of the network and the products as well.
It should be noted that the criteria to determine the scoping of the E P&L was an iterative process. The environmental impact and influence of Vodafone are based on Forum for the Future (2006). The final assessment is done by Vodafone Netherlands alone. This method can be improved by including stakeholders. Not only as one of the criteria but also in the whole process.
5. Appendix
4https://www.vodafone.nl/over-vodafone/wie-zijn-wij/feiten-en-cijfers/5http://vodafoneintegratedreport.html5magazine.nl/2012_2013/externe_omgeving#6https://www.vodafone.nl/over-vodafone/wie-zijn-wij/duurzaamheid/strategie-en-management/duurzaamheidsvisie-en-strategie.shtml
Scoping Environmental impact Results and conclusions AppendixGeneral
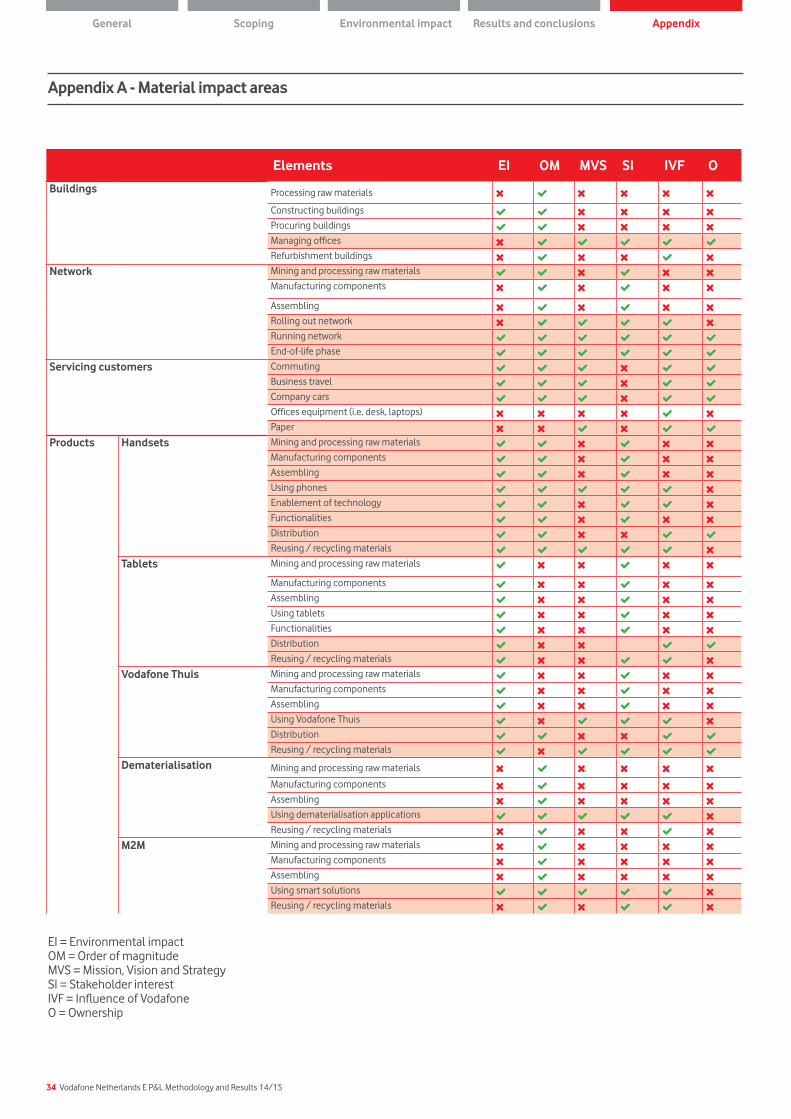
34 Vodafone Netherlands E P&L Methodology and Results 14/15
EI = Environmental impactOM = Order of magnitudeMVS = Mission, Vision and Strategy SI = Stakeholder interestIVF = Influence of Vodafone O = Ownership
Appendix A - Material impact areas
Scoping Environmental impact Results and conclusions AppendixGeneral
Elements EI OM MVS SI IVF O
Buildings Processing raw materials
Constructing buildings Procuring buildings Managing offices Refurbishment buildings
Network Mining and processing raw materials Manufacturing components
Assembling Rolling out network Running network End-of-life phase
Servicing customers Commuting Business travel Company cars Offices equipment (i.e. desk, laptops) Paper
Products Handsets Mining and processing raw materials Manufacturing components Assembling Using phones Enablement of technology Functionalities Distribution Reusing / recycling materials
Tablets Mining and processing raw materials
Manufacturing components Assembling Using tablets Functionalities Distribution Reusing / recycling materials
Vodafone Thuis Mining and processing raw materials Manufacturing components Assembling Using Vodafone Thuis Distribution Reusing / recycling materials
Dematerialisation Mining and processing raw materials
Manufacturing components Assembling Using dematerialisation applications Reusing / recycling materials
M2M Mining and processing raw materials Manufacturing components Assembling Using smart solutions Reusing / recycling materials

35 Vodafone Netherlands E P&L Methodology and Results 14/15
This Appendix shows how calculations to calculate monetary impacts were performed. In B.1 volumes are converted into environmental impacts. The method and sources used to convert environmental impacts into euros is presented in B.2.
B.1 Environmental impact calculations
B.1.1 Buildings
B.1.2 Network
Appendix B - Calculations
Volume Calculations
GHG emissions (total gas usage Nm3 * gCO2/Nm3 emission factor)
+ (kWh grey electricity consumption * gCO2/kWh emission factor)
+ (kWh renewable electricity consumption * gCO2/kWh emission factor)
+ (total litres diesel consumed * gCO2/litre emission factor)
+ (GWP of refrigerants * gCO2e/GWP emission factor)
+ (total GJ consumed for district heating * gCO2/GJ emission factor)
Air emissions (total litres diesel consumed * gNOx/litre emission factor)
+ (kWh grey electricity consumed * gNOx/kWh emission factor)
(total litres diesel consumed in offices * gSOx/litre emission factor)
+ (kWh grey electricity consumed * gSOx/kWh emission factor)
(total litres diesel consumed * gPM10
/litre emission factor) + (kWh grey electricity consumed * gPM
10/kWh emission factor)
Water (total m3 water used)
Waste (total kg other waste)
Volume Calculations
GHG emissions + (total litres diesel fuel consumed * CO2/litre diesel emission factor)
+ (kWh renewable electricity used * CO2/kWh emission factor)
+ (total number of subscribers * CO2-eq/annual manufacturing per subscriber)
Air emissions (total litres diesel fuel consumed * NOx/litre diesel emission factor)
(total litres diesel fuel consumed * SOx/litre diesel emission factor)
(total litres diesel fuel consumed * PM10
/litre diesel emission factor)
Waste (% network that is not recycled or refurbished * total kg network equipment removed)
Scoping Environmental impact Results and conclusions AppendixGeneral
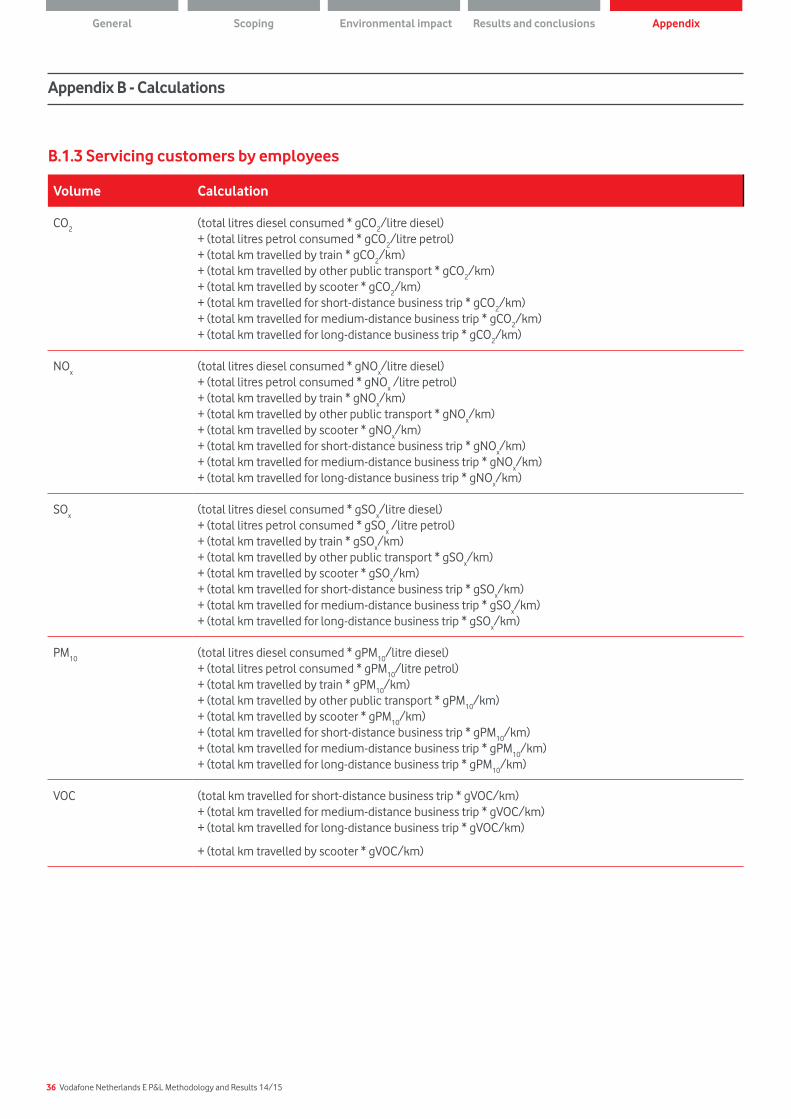
36 Vodafone Netherlands E P&L Methodology and Results 14/15
B.1.3 Servicing customers by employees
Appendix B - Calculations
Volume Calculation
CO2
(total litres diesel consumed * gCO2/litre diesel)
+ (total litres petrol consumed * gCO2/litre petrol)
+ (total km travelled by train * gCO2/km)
+ (total km travelled by other public transport * gCO2/km)
+ (total km travelled by scooter * gCO2/km)
+ (total km travelled for short-distance business trip * gCO2/km)
+ (total km travelled for medium-distance business trip * gCO2/km)
+ (total km travelled for long-distance business trip * gCO2/km)
NOx
(total litres diesel consumed * gNOx/litre diesel)
+ (total litres petrol consumed * gNOx /litre petrol)
+ (total km travelled by train * gNOx/km)
+ (total km travelled by other public transport * gNOx/km)
+ (total km travelled by scooter * gNOx/km)
+ (total km travelled for short-distance business trip * gNOx/km)
+ (total km travelled for medium-distance business trip * gNOx/km)
+ (total km travelled for long-distance business trip * gNOx/km)
SOx
(total litres diesel consumed * gSOx/litre diesel)
+ (total litres petrol consumed * gSOx /litre petrol)
+ (total km travelled by train * gSOx/km)
+ (total km travelled by other public transport * gSOx/km)
+ (total km travelled by scooter * gSOx/km)
+ (total km travelled for short-distance business trip * gSOx/km)
+ (total km travelled for medium-distance business trip * gSOx/km)
+ (total km travelled for long-distance business trip * gSOx/km)
PM10
(total litres diesel consumed * gPM10
/litre diesel) + (total litres petrol consumed * gPM
10/litre petrol)
+ (total km travelled by train * gPM10
/km) + (total km travelled by other public transport * gPM
10/km)
+ (total km travelled by scooter * gPM10
/km) + (total km travelled for short-distance business trip * gPM
10/km)
+ (total km travelled for medium-distance business trip * gPM10
/km) + (total km travelled for long-distance business trip * gPM
10/km)
VOC (total km travelled for short-distance business trip * gVOC/km) + (total km travelled for medium-distance business trip * gVOC/km) + (total km travelled for long-distance business trip * gVOC/km)
+ (total km travelled by scooter * gVOC/km)
Scoping Environmental impact Results and conclusions AppendixGeneral

37 Vodafone Netherlands E P&L Methodology and Results 14/15
Appendix B - Calculations
B.1.4 HandsetsThe environmental impact of handsets is calculated over four key life stages. According to Bureau Veritas (2011) the relative contribution of each phase of the life cycle is shown in Table 1. The table shows that most impacts are caused by the production phase. Note that Bureau Veritas (2011) has used other environmental indicators that have not been used in the rest of the E P&L. These other indicators are included, as these influence results of the environmental impact on the production of handsets.
The impacts together multiplied by the total number of mobile phones that Vodafone sold in 2014 form the total impact of handsets.
Table 1: Relative contribution of each phase of the life cycle for the average smartphone
Indicator Unit Production Distribution Use End-of-life
GHG CO2
88% 10% 1% <1%
CFC-11 96% 2% 2% <1%
Air SO2
91% 8% 2% <1%
NMVOC 94% 6% <1% <1%
Water dm3 91% 8% 2% <1%
PO4
96% 3% 1% 1%
Waste kg 99% <1% <1% <1%
Volume Calculation
GHG emissions (total number of mobile phones sold * gCFC-11/average smartphone)
(total number of mobile phones sold * gCO2/average smartphone)
Air emissions (total number of mobile phones sold * gSOx/average smartphone)
(total number of mobile phones sold * gNMVOC/average smartphone)
Water (total number of mobile phones sold * dm3/average smartphone)
(total number of mobile phones sold * gPO4/average smartphone)
Waste (total number of mobile phones sold * kg hazardous waste/average smartphone)
Scoping Environmental impact Results and conclusions AppendixGeneral
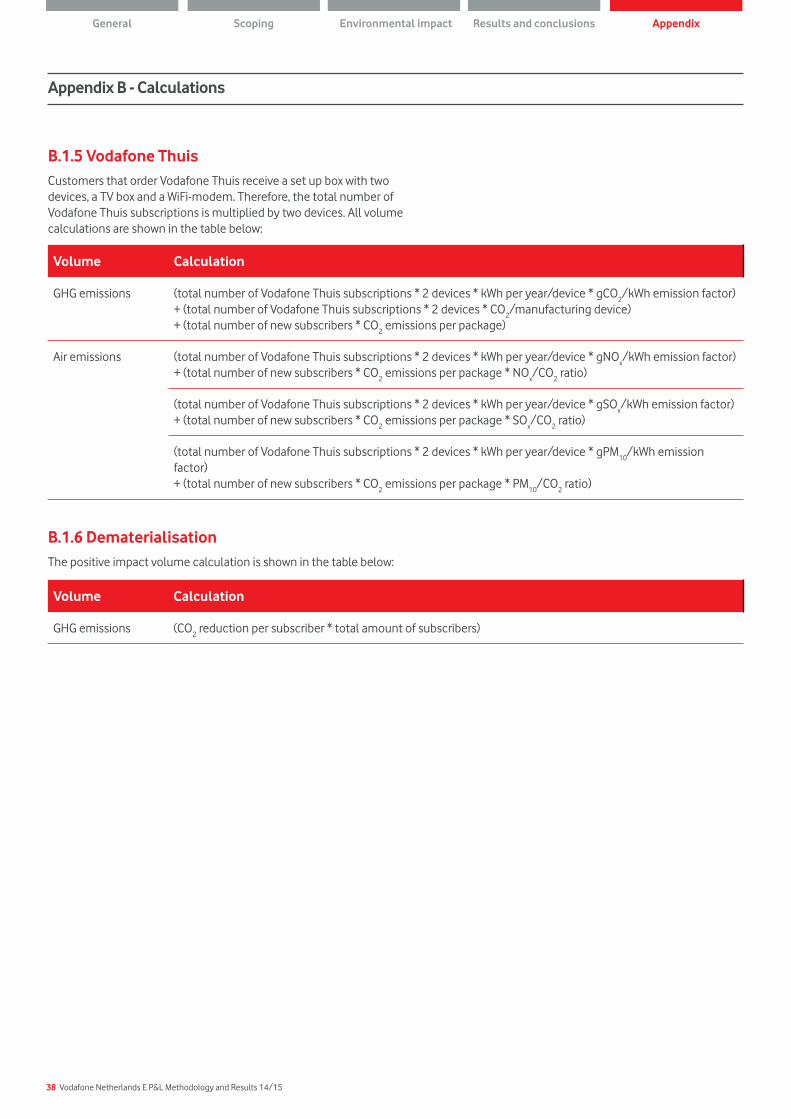
38 Vodafone Netherlands E P&L Methodology and Results 14/15
Appendix B - Calculations
B.1.5 Vodafone ThuisCustomers that order Vodafone Thuis receive a set up box with two devices, a TV box and a WiFi-modem. Therefore, the total number of Vodafone Thuis subscriptions is multiplied by two devices. All volume calculations are shown in the table below:
B.1.6 DematerialisationThe positive impact volume calculation is shown in the table below:
Volume Calculation
GHG emissions (total number of Vodafone Thuis subscriptions * 2 devices * kWh per year/device * gCO2/kWh emission factor)
+ (total number of Vodafone Thuis subscriptions * 2 devices * CO2/manufacturing device)
+ (total number of new subscribers * CO2 emissions per package)
Air emissions (total number of Vodafone Thuis subscriptions * 2 devices * kWh per year/device * gNOx/kWh emission factor)
+ (total number of new subscribers * CO2 emissions per package * NO
x/CO
2 ratio)
(total number of Vodafone Thuis subscriptions * 2 devices * kWh per year/device * gSOx/kWh emission factor)
+ (total number of new subscribers * CO2 emissions per package * SO
x/CO
2 ratio)
(total number of Vodafone Thuis subscriptions * 2 devices * kWh per year/device * gPM10
/kWh emission factor) + (total number of new subscribers * CO
2 emissions per package * PM
10/CO
2 ratio)
Volume Calculation
GHG emissions (CO2 reduction per subscriber * total amount of subscribers)
Scoping Environmental impact Results and conclusions AppendixGeneral

39 Vodafone Netherlands E P&L Methodology and Results 14/15
Appendix B - Calculations
B.1.7 M2M ConnectivityThe negative impact volume calculations are shown in the table below:
Volume Calculation
GHG emissions (new M2M connections in FY14/15 * gCFC-11/M2M modem)
(new M2M connections in FY14/15 * gCO2/M2M modem emission factor)
Air emissions (new M2M connections in FY14/15 * gSOx/M2M modem)
(new M2M connections in FY14/15 * gNMVOC/M2M modem)
Water (new M2M connections in FY14/15 * dm3/M2M modem)
(new M2M connections in FY14/15 * gPO4/M2M modem)
Waste (new M2M connections in FY14/15 * kg hazardous waste/M2M modem
The positive impact volume calculation is shown in the table below:
Volume Calculation
GHG emissions (total CO2 emissions avoided due to M2M connectivity)
Scoping Environmental impact Results and conclusions AppendixGeneral
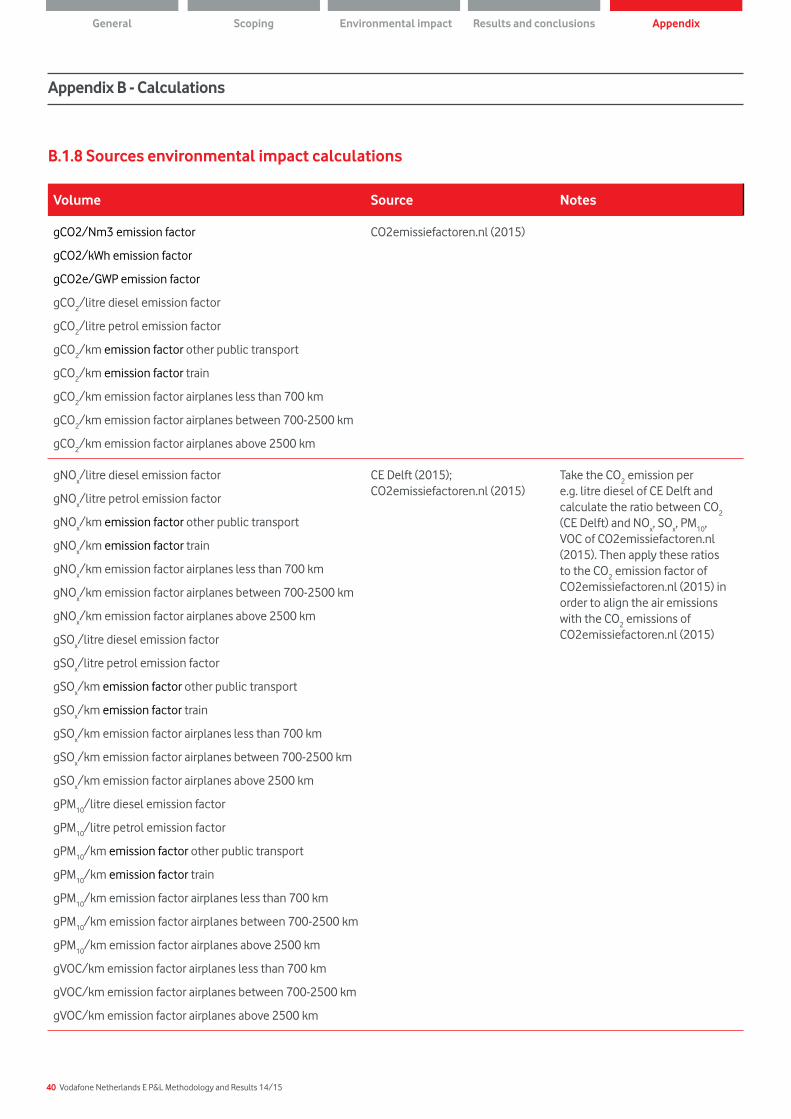
40 Vodafone Netherlands E P&L Methodology and Results 14/15
Appendix B - Calculations
B.1.8 Sources environmental impact calculations
Volume Source Notes
gCO2/Nm3 emission factor
gCO2/kWh emission factor
gCO2e/GWP emission factor
gCO2/litre diesel emission factor
gCO2/litre petrol emission factor
gCO2/km emission factor other public transport
gCO2/km emission factor train
gCO2/km emission factor airplanes less than 700 km
gCO2/km emission factor airplanes between 700-2500 km
gCO2/km emission factor airplanes above 2500 km
CO2emissiefactoren.nl (2015)
gNOx/litre diesel emission factor
gNOx/litre petrol emission factor
gNOx/km emission factor other public transport
gNOx/km emission factor train
gNOx/km emission factor airplanes less than 700 km
gNOx/km emission factor airplanes between 700-2500 km
gNOx/km emission factor airplanes above 2500 km
gSOx/litre diesel emission factor
gSOx/litre petrol emission factor
gSOx/km emission factor other public transport
gSOx/km emission factor train
gSOx/km emission factor airplanes less than 700 km
gSOx/km emission factor airplanes between 700-2500 km
gSOx/km emission factor airplanes above 2500 km
gPM10
/litre diesel emission factor
gPM10
/litre petrol emission factor
gPM10
/km emission factor other public transport
gPM10
/km emission factor train
gPM10
/km emission factor airplanes less than 700 km
gPM10
/km emission factor airplanes between 700-2500 km
gPM10
/km emission factor airplanes above 2500 km
gVOC/km emission factor airplanes less than 700 km
gVOC/km emission factor airplanes between 700-2500 km
gVOC/km emission factor airplanes above 2500 km
CE Delft (2015); CO2emissiefactoren.nl (2015)
Take the CO2 emission per
e.g. litre diesel of CE Delft and calculate the ratio between CO
2
(CE Delft) and NOx, SO
x, PM
10,
VOC of CO2emissiefactoren.nl (2015). Then apply these ratios to the CO
2 emission factor of
CO2emissiefactoren.nl (2015) in order to align the air emissions with the CO
2 emissions of
CO2emissiefactoren.nl (2015)
Scoping Environmental impact Results and conclusions AppendixGeneral

41 Vodafone Netherlands E P&L Methodology and Results 14/15
Appendix B - Calculations
gNOx/kWh emission factor
gSOx/kWh emission factor
gPM10
/kWh emission factor
Emissieregistratie CBS Elektriciteitsbalans
Go to emissieregistratie.nl > emissies 2013 > create own kaart or grafiek > select in 1.a zwaveloxiden, stikstofoxide, fijnstof > 2013 > select in 1.b emissiebronnen: elektriciteitsproductie (onder kopje energiesector) ; look up the total electricity production in the Netherlands in 2013 on CBS.nl and divide.
gCFC-11/average smartphone emission factor
gSOx/average smartphone emission factor
gNMVOC/average smartphone emission factor
dm3/average smartphone emission factor
gPO4/average smartphone emission factor
hazardous waste/average smartphone emission factor
Bureau Veritas (2011) The LCA of the eco-score is used to calculate the average environmental impact of a smartphone.
gCO2/GJ emission factor CO
2-Prestatieladder 2.2
kgCO2/annual manufacturing per subscriber base station
sites
kgCO2/annual manufacturing per subscriber control & core
nodes
kgCO2/annual manufacturing per subscriber transmission
and IP core network
kgCO2/annual manufacturing per subscriber 3rd part data
centres
kgCO2/modem
80 kWh per year/modem
Malmodin, Lunden, Andersson, and Nilsson (2014)
Volume data is based on internal data collection systems of Vodafone. Information that is gathered from external sources is described below. The calculations in B.1.1 to B.1.6. are based on these sources.
Scoping Environmental impact Results and conclusions AppendixGeneral
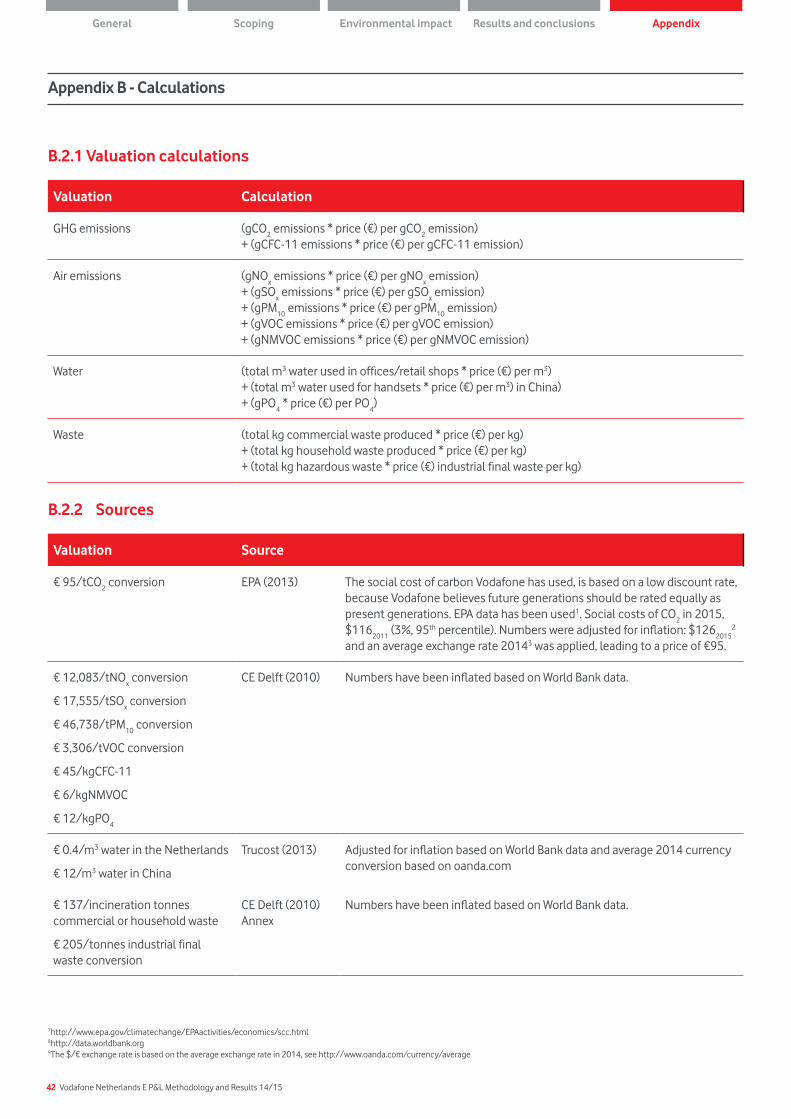
42 Vodafone Netherlands E P&L Methodology and Results 14/15
Appendix B - Calculations
B.2.1 Valuation calculations
B.2.2 Sources
Valuation Calculation
GHG emissions (gCO2 emissions * price (€) per gCO
2 emission)
+ (gCFC-11 emissions * price (€) per gCFC-11 emission)
Air emissions (gNOx emissions * price (€) per gNO
x emission)
+ (gSOx emissions * price (€) per gSO
x emission)
+ (gPM10
emissions * price (€) per gPM10
emission) + (gVOC emissions * price (€) per gVOC emission) + (gNMVOC emissions * price (€) per gNMVOC emission)
Water (total m3 water used in offices/retail shops * price (€) per m3) + (total m3 water used for handsets * price (€) per m3) in China) + (gPO
4 * price (€) per PO
4)
Waste (total kg commercial waste produced * price (€) per kg) + (total kg household waste produced * price (€) per kg) + (total kg hazardous waste * price (€) industrial final waste per kg)
Valuation Source
€ 95/tCO2 conversion EPA (2013) The social cost of carbon Vodafone has used, is based on a low discount rate,
because Vodafone believes future generations should be rated equally as present generations. EPA data has been used1. Social costs of CO
2 in 2015,
$1162011
(3%, 95th percentile). Numbers were adjusted for inflation: $1262015
2 and an average exchange rate 20143 was applied, leading to a price of €95.
€ 12,083/tNOx conversion
€ 17,555/tSOx conversion
€ 46,738/tPM10
conversion
€ 3,306/tVOC conversion
€ 45/kgCFC-11
€ 6/kgNMVOC
€ 12/kgPO4
CE Delft (2010) Numbers have been inflated based on World Bank data.
€ 0.4/m3 water in the Netherlands
€ 12/m3 water in China
Trucost (2013) Adjusted for inflation based on World Bank data and average 2014 currency conversion based on oanda.com
€ 137/incineration tonnes commercial or household waste
€ 205/tonnes industrial final waste conversion
CE Delft (2010) Annex
Numbers have been inflated based on World Bank data.
7http://www.epa.gov/climatechange/EPAactivities/economics/scc.html8http://data.worldbank.org9The $/€ exchange rate is based on the average exchange rate in 2014, see http://www.oanda.com/currency/average
Scoping Environmental impact Results and conclusions AppendixGeneral

43 Vodafone Netherlands E P&L Methodology and Results 14/15
C.1 General E P&L assumptionsFor Vodafone’s E P&L, the following general assumptions were made:
• Impact: Vodafone creates both negative and positive impacts. Negative impact reflects the societal costs caused by Vodafone’s direct and indirect emissions. Positive impact is mostly avoided impact, due to the enablement of customers.
Negative impact is partially reduced by Vodafone, for instance by purchasing renewable energy for the network. These initiatives are not labelled as positive impact, but as avoided negative impact. Hence, avoided negative impact is not calculated separately, but is included in the negative impact calculations. On the other hand, Vodafone’s products and services can have a positive impact on the environment, due to increased efficiency of customers or less need to travel.
• Attribution: this E P&L attributes all the negative impacts to Vodafone, as the company wants to show its impact through the value chain and improve its impact together with the value chain partners. However, the positive impact is more difficult to attribute solely to Vodafone. For example, smart working is only partially attributed to Vodafone since other factors, such as laptops or Wi-Fi, also enable people to work smartly. If an attribution factor is applied, this factor is based on research conducted by Carbon Trust (2015).
• Calculation and valuation: In Appendix B.1, the calculations of volumes (i.e. kWh grey electricity use) to environmental impact (i.e. CO2/kWh) are shown. In Appendix B.2. the environmental impact is converted in monetary terms (€/CO2). The sources used are listed in these appendixes as well. In cooperation with experts in this field, Vodafone has attempted to use the most appropriate volume and valuation factors.
• Sources: the most recent research in the field is used to underpin the calculations and valuation. If applicable prices have been corrected for inflation.
C.2 General content assumptionsConsidering the content of the E P&L, the following assumptions were made:
• Tablets: The sales figures of tablets in 2014 account for less than 1% of the total number of devices sold. Therefore, the total impact of tablets is considered to be not significant and is therefore excluded in this E P&L.
• Renewable energy: Wind energy is assumed to have no environmental impact, as the production of wind energy does not emit CO2 (CO2emissionfactoren.nl, 2015). The emissions resulting from construction of a wind farm are not included, as the emissions of construction are neither included for grey energy (i.e. the production of a coal plant is not included in the emission factor of grey electricity).
• Customer energy: Energy consumed by customers is regarded as grey energy (CO2-Prestatieladder, 2014).
• Resource depletion: According to CE Delft (2010), depletion of resources is not an externality as scarcity is enshrined in the market price. Therefore this E P&L will not value depletion of resources such as raw materials or energy. Vodafone aims to investigate future possibilities to include potential externalities caused by resource depletion.
• Hazardous waste: Hazardous waste is regarded as industrial final waste.
• SIM cards: the production of SIM cards is not included in the E P&L, due to a lack of information.
• Biodiversity impacts are only included through the LCA calculations of Bureau Veritas (2011), which include water eutrophication.
• Land use was not included in this E P&L. We expect not to have a significant land use impact, because most base station sites are situated on buildings, while cables for fixed connections are below street level. The only land Vodafone uses is that on which the buildings the company rents are situated.
• Carbon price: The social cost of carbon Vodafone has used, is based on a low discount rate (3%), because Vodafone believes future generations should be rated equally as present generations. This means Vodafone does not significantly discount future costs, leading to a higher social cost of carbon overall.
C.3 LCA Bureau Veritas (2011) – Environmental impact of handsetsTo calculate the impact of handsets, this E P&L has used the LCA used for calculating the eco-score rating, which was conducted by Bureau Veritas in 2011. The following assumptions per life-stage were made:
• The production phase includes extraction of raw materials, production of components and sub-parts, product assembly, customisation (if applicable), and transport between the different stages. The production phase includes, among other things, the LCD display, printed circuits, electronic components, battery, battery charger, and casing.
• The distribution phase includes:
1. The production of the packaging (cardboard box, plastic films, and user manual)
2. The transport of the packaged end product between the assembly sites and the final countries of destination.
• In the operation phase, the scenario of use considered is the following:
1. Receive or send out calls during 4.12 hours per month
2. Exchange data: 155.30 MB of data per month for mobile phones connected to 3G network
3. After each charge (the battery is 100% charged):
1. The charger, connected to the mobile phone handset, still plugged in during 6.5 hours
Appendix C - Assumptions
Scoping Environmental impact Results and conclusions AppendixGeneral
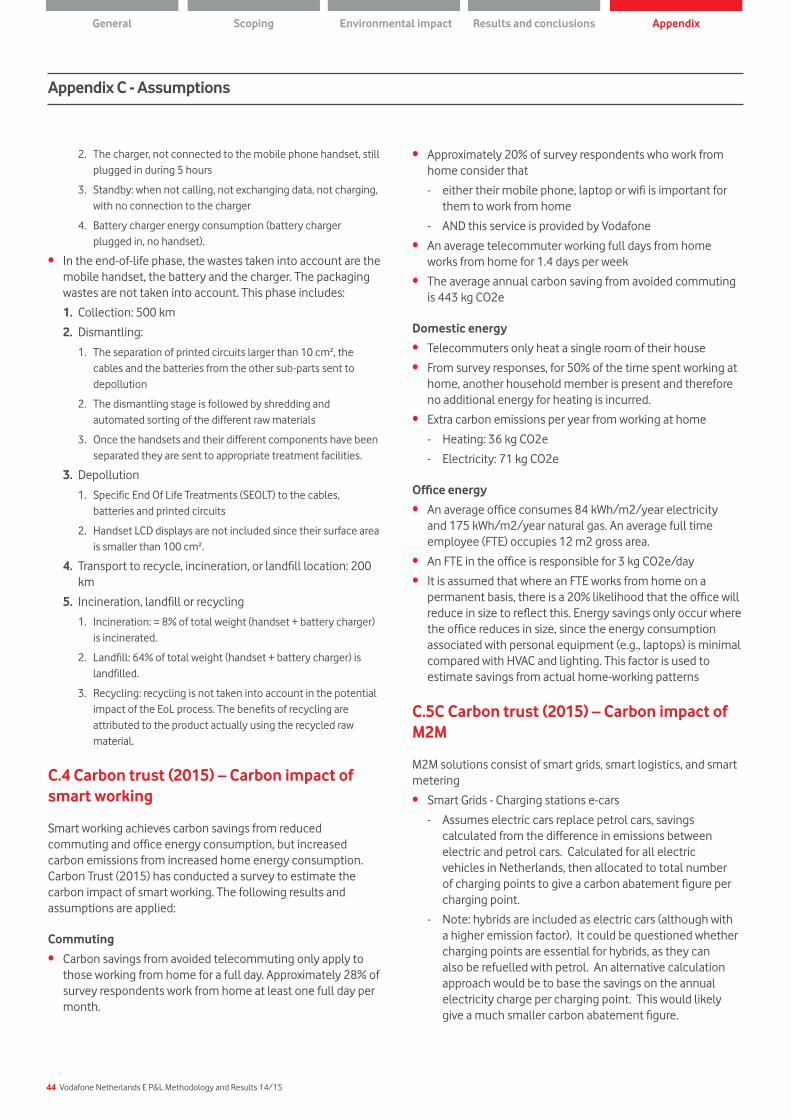
44 Vodafone Netherlands E P&L Methodology and Results 14/15
Appendix C - Assumptions
• Approximately 20% of survey respondents who work from home consider that
- either their mobile phone, laptop or wifi is important for them to work from home
- AND this service is provided by Vodafone
• An average telecommuter working full days from home works from home for 1.4 days per week
• The average annual carbon saving from avoided commuting is 443 kg CO2e
Domestic energy
• Telecommuters only heat a single room of their house
• From survey responses, for 50% of the time spent working at home, another household member is present and therefore no additional energy for heating is incurred.
• Extra carbon emissions per year from working at home
- Heating: 36 kg CO2e
- Electricity: 71 kg CO2e
Office energy
• An average office consumes 84 kWh/m2/year electricity and 175 kWh/m2/year natural gas. An average full time employee (FTE) occupies 12 m2 gross area.
• An FTE in the office is responsible for 3 kg CO2e/day
• It is assumed that where an FTE works from home on a permanent basis, there is a 20% likelihood that the office will reduce in size to reflect this. Energy savings only occur where the office reduces in size, since the energy consumption associated with personal equipment (e.g., laptops) is minimal compared with HVAC and lighting. This factor is used to estimate savings from actual home-working patterns
C.5C Carbon trust (2015) – Carbon impact of M2M
M2M solutions consist of smart grids, smart logistics, and smart metering
• Smart Grids - Charging stations e-cars
- Assumes electric cars replace petrol cars, savings calculated from the difference in emissions between electric and petrol cars. Calculated for all electric vehicles in Netherlands, then allocated to total number of charging points to give a carbon abatement figure per charging point.
- Note: hybrids are included as electric cars (although with a higher emission factor). It could be questioned whether charging points are essential for hybrids, as they can also be refuelled with petrol. An alternative calculation approach would be to base the savings on the annual electricity charge per charging point. This would likely give a much smaller carbon abatement figure.
2. The charger, not connected to the mobile phone handset, still plugged in during 5 hours
3. Standby: when not calling, not exchanging data, not charging, with no connection to the charger
4. Battery charger energy consumption (battery charger plugged in, no handset).
• In the end-of-life phase, the wastes taken into account are the mobile handset, the battery and the charger. The packaging wastes are not taken into account. This phase includes:
1. Collection: 500 km
2. Dismantling:
1. The separation of printed circuits larger than 10 cm², the cables and the batteries from the other sub-parts sent to depollution
2. The dismantling stage is followed by shredding and automated sorting of the different raw materials
3. Once the handsets and their different components have been separated they are sent to appropriate treatment facilities.
3. Depollution
1. Specific End Of Life Treatments (SEOLT) to the cables, batteries and printed circuits
2. Handset LCD displays are not included since their surface area is smaller than 100 cm².
4. Transport to recycle, incineration, or landfill location: 200 km
5. Incineration, landfill or recycling
1. Incineration: ≈ 8% of total weight (handset + battery charger) is incinerated.
2. Landfill: 64% of total weight (handset + battery charger) is landfilled.
3. Recycling: recycling is not taken into account in the potential impact of the EoL process. The benefits of recycling are attributed to the product actually using the recycled raw material.
C.4 Carbon trust (2015) – Carbon impact of smart working
Smart working achieves carbon savings from reduced commuting and office energy consumption, but increased carbon emissions from increased home energy consumption. Carbon Trust (2015) has conducted a survey to estimate the carbon impact of smart working. The following results and assumptions are applied:
Commuting
• Carbon savings from avoided telecommuting only apply to those working from home for a full day. Approximately 28% of survey respondents work from home at least one full day per month.
Scoping Environmental impact Results and conclusions AppendixGeneral
45 Vodafone Netherlands E P&L Methodology and Results 14/15
Appendix C - Assumptions
source some data to calculate this. However, the number of connections is currently very small (less than 0.5%).
• Note 2. Automation of Industrial processes. We can review this after completion of the analysis for the GeSI report, when we may have managed to source some data to calculate this. The number of connections is significant (about 10% of the total M2M connections).
• Smart Logistics - Fleet management
- This applies to cars (rather than LGV or HGV).
- An average fuel saving of 10% has been used.
• Smart Logistics - Optimised routing
- This is sat nav for cars
- Assumed an average fuel saving of 8%.
• Smart Logistics - Smart bins
- Based on the Mic-O-Data case study
• Smart Logistics - Taxi computers: connection central
- Savings due to optimising dispatch of taxis
- Assumed a fuel saving of 5%
- Unexplained anomaly that the number of M2M connections is 55% greater than the total number of taxis in the Netherlands. Have therefore arbitrarily reduced the savings by half.
• Smart Logistics - Track and trace
- This relates to tracking goods vehicles and cargo.
- It is debatable whether there is any saving associated with this.
- A scenario has been assumed that this gives a 2% fuel saving, which is applied to the annual emissions of a goods vehicle. (The emissions is calculated as a weighted average of all the LGVs and HGVs registered in the Netherlands, considering their average annual distance travelled).
- Due to this uncertainty and the large value for the savings, the total results are presented with and without the carbon abatement from ‘Track and Trace’
• Smart Logistics - Usage based car insurance
- This is based on previous Carbon Trust research.
• Smart Metering - Domestic – Electricity
- Assumes a 3% saving in household electricity due to installation of a smart meter.
• Smart Metering - Domestic – Gas
- Assumes a 3% saving in household gas due to installation of a smart meter.
Excluded categories
• Other categories for M2M connections have been excluded from the calculation of the carbon abatement. This is generally because:
- Either: the number of M2M connections is small and the carbon abatement would not be significant
- Or: we have not developed a methodology (or have no data) to support the carbon abatement calculations
- Or: there is no carbon abatement associated with the category
• Note 1. e-health. We can review this after completion of the analysis for the GeSI report, when we may have managed to
Scoping Environmental impact Results and conclusions AppendixGeneral
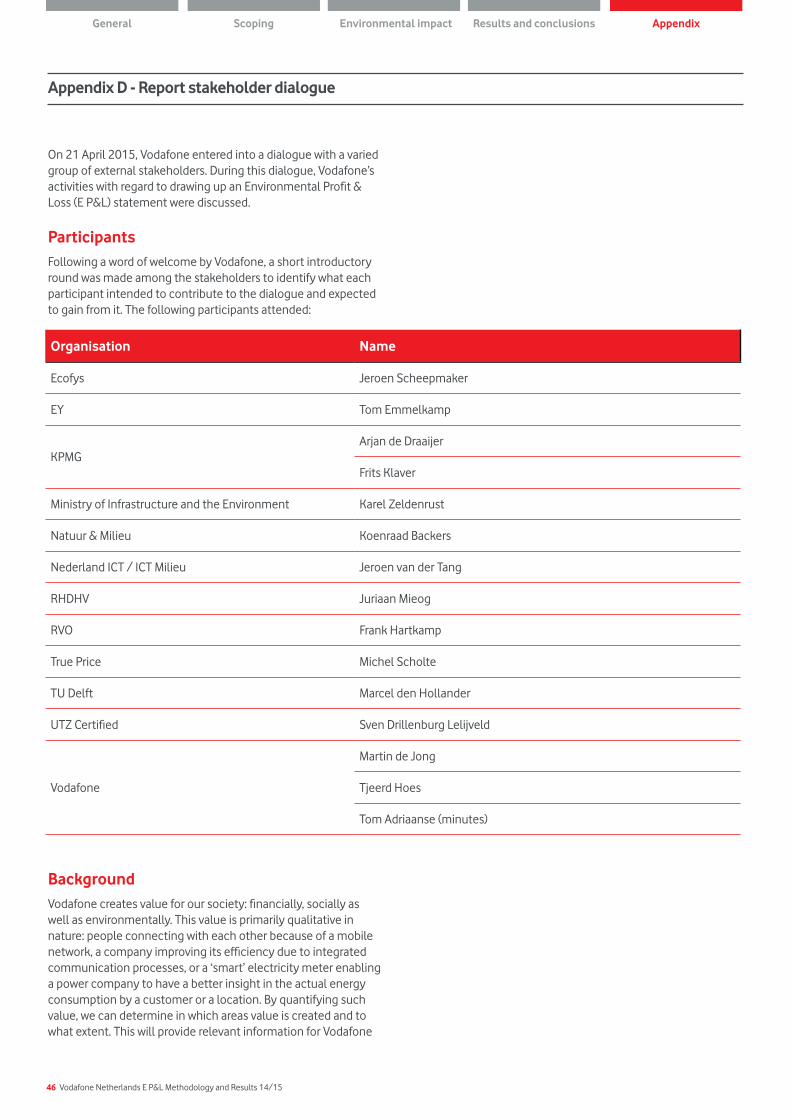
46 Vodafone Netherlands E P&L Methodology and Results 14/15
On 21 April 2015, Vodafone entered into a dialogue with a varied group of external stakeholders. During this dialogue, Vodafone’s activities with regard to drawing up an Environmental Profit & Loss (E P&L) statement were discussed.
ParticipantsFollowing a word of welcome by Vodafone, a short introductory round was made among the stakeholders to identify what each participant intended to contribute to the dialogue and expected to gain from it. The following participants attended:
BackgroundVodafone creates value for our society: financially, socially as well as environmentally. This value is primarily qualitative in nature: people connecting with each other because of a mobile network, a company improving its efficiency due to integrated communication processes, or a ‘smart’ electricity meter enabling a power company to have a better insight in the actual energy consumption by a customer or a location. By quantifying such value, we can determine in which areas value is created and to what extent. This will provide relevant information for Vodafone
Appendix D - Report stakeholder dialogue
Organisation Name
Ecofys Jeroen Scheepmaker
EY Tom Emmelkamp
KPMGArjan de Draaijer
Frits Klaver
Ministry of Infrastructure and the Environment Karel Zeldenrust
Natuur & Milieu Koenraad Backers
Nederland ICT / ICT Milieu Jeroen van der Tang
RHDHV Juriaan Mieog
RVO Frank Hartkamp
True Price Michel Scholte
TU Delft Marcel den Hollander
UTZ Certified Sven Drillenburg Lelijveld
Vodafone
Martin de Jong
Tjeerd Hoes
Tom Adriaanse (minutes)
Scoping Environmental impact Results and conclusions AppendixGeneral
47 Vodafone Netherlands E P&L Methodology and Results 14/15
Appendix D - Report stakeholder dialogue
to manage and improve its social impact. This is also the prime reason for Vodafone to draw up an environmental profit and loss account (E P&L).
In addition to this E P&L, Vodafone also aims to draw up an S (social) P&L and an FE (financial and economic) P&L in the coming years. This will quantify the entire social impact of Vodafone. Vodafone chose to start with the environment, first, because of the company’s big ambitions in this area. Second, because it was expected that Vodafone’s environmental impact would be positive and third, because quantifying the environmental impact is relatively easy due to the availability of data.
GoalVodafone’s goal in talking to stakeholders was to use the dialogue to discuss the process and the preliminary results of the E P&L and to collect input and feedback from the stakeholders in order to optimise the E P&L.
In cooperation with KPMG, Vodafone is currently mapping its environmental impact and converting this impact into euros. Vodafone will incorporate the E P&L in its annual report 2014-2015 (expected July 2015) and will ask EY to endorse the report. However, drawing up such an E P&L is new, not only for Vodafone, but also for many organisations worldwide. It is therefore conceivable that choices and assumptions are made now that in hindsight would have been assessed differently. However, for Vodafone this is by no means a reason not to continue with this method of value appraisal.
Process E P&L VodafoneDuring the dialogue, Vodafone explained how the first version of the E P&L was arrived at. Specific attention was given to the choices and assumptions adopted during the process. Two key choices were made:
• The scope of the E P&L: which activities are and are not taken into account (customer usage, Vodafone operations and further down the supply chain)
• The environmental indicators: which ones quantify the environmental impact (water, CO2-e, air pollution, waste).
1. The scope of the E P&L
Vodafone’s work to determine the scope of the E P&L was the subject of animated discussion. Vodafone’s social impact has three elements: buildings, products and the network. Vodafone pointed out that in each area, it can influence its own impact to a greater or lesser extent.
Furthermore, Vodafone pointed out that attribution is an important factor; which impact can be attributed to Vodafone? Can the whole supply chain be attributed to Vodafone? For example, energy consumption in the network is to a large degree determined by Vodafone itself, in contrast
to the decision regarding which raw materials are used in handsets. Vodafone aims to map the entire value chain of both the network and mobile handsets in its E P&L, despite the fact that Vodafone’s influence in the chain is often more limited than in its direct operations.
2. The environmental indicators
An important element of the dialogue was clarifying the choices and assumptions made by Vodafone during the process of the E P&L. This led to some discussion regarding the environmental indicators that were chosen. The chosen indicators (GHG emissions, air emissions, water use and waste) as well as other indicators (biodiversity) were discussed. Vodafone explained that the preliminary results are mainly driven by the indicator CO2. This is because data on carbon dioxide emission is widely available and because the environmental impact of Vodafone, its suppliers and its customers is mainly in the field of CO2 emission. The indicators chosen were given monetary values, based on CE Delft methodology and other parties.
Positive and negative impactsTransparency was the key word for the participants. They wanted to know why certain choices were made during the scoping and defining of the E P&L process.. As an example, the use of materials was referred to. Stakeholders wanted to know about the recycling process of materials within Vodafone. They asked where used materials go to and what is Vodafone’s role in using and collecting these materials? They also wished to know which form these materials largely occur in, whether they are mostly end products or sub-parts.
The idea of putting a monetary value on environmental impact was also subject to discussion. Some stakeholders asked if impact should be conveyed as a monetary value at all, because details may get lost when everything is reduced to one scale of measurement – ie value in euros. In contrast, other stakeholders in contrast said that monetising makes for better comparisons between indicators because interrelations are made clear.
Also discussed were the positive environmental impacts that could be attributed to Vodafone. Examples are avoided CO2 emissions by services like ‘Smart Working’, aimed at mobility in the workplace, and M2M (Machine to Machine) solutions. At least part of these impacts can be attributed to Vodafone.
A productive discussion took place regarding the added value of mapping the positive and negative environmental impacts. Vodafone explained why distinguishing between the two is interesting. A lot of focus during the discussion was given to the manner of reporting of these positive and negative impacts. It was suggested that Vodafone should start with describing its own negative impact first, before comparing this to the positive impact Vodafone has on other companies. Transparency was again the key word, with regard to being credible as a company when publishing an E P&L. It was even suggested that the
Scoping Environmental impact Results and conclusions AppendixGeneral
48 Vodafone Netherlands E P&L Methodology and Results 14/15
Appendix D - Report stakeholder dialogue
company should call the report an impact calculation, rather than an E P&L. Another suggestion was to draw up a CO2 P&L in light of the CO2 impact in the E P&L.
ReportingAs described in the previous paragraphs, the manner of reporting is considered to be very important. The concept of transparency was raised several times, especially referring to clarity and transparency of choices and assumptions during the process. If the final outcome is presented as a single figure (as opposed to a range of values), it should be clarified that an E P&L cannot produce an exact total because it always relies on certain assumptions. A suggestion was made to present Vodafone’s negative impact next to its positive impact.
Drawing up a methodology document was considered as valuable by the stakeholders. Stakeholders expect this document to describe the key assumptions that were made, for example how LCA results were interpreted, and whether these results are specific for Vodafone or more general in nature. In short, when it comes to reporting, the stakeholders’ main input was that Vodafone should be explicit and transparent in its communications.
ConclusionThe stakeholder dialogue that took place on 21 April 2015, was very useful and worthwhile in Vodafone’s view. Several important insights, from different stakeholder angles, were brought to the table and these will help optimise Vodafone’s E P&L.
Scoping Environmental impact Results and conclusions AppendixGeneral