Embed Size (px)
Citation preview

Environmental Protection Agency
Alternate Test Procedure Validation
Report: Enzymatic Reduction Method of
Nitrate-N Analysis in Drinking Water
Compiled and Written by
Wilbur H. (Bill) Campbell
and
Ellen R. Campbell
The Nitrate Elimination Co., Inc. (NECi)
334 Hecla St.
Lake Linden MI 49945
906-369-9830
906-296-1000
Submitted: November 2015
NECi ATP Drinking Water Validation Study Report 1.0
NECi Enzymatic Reduction Method for Nitrate in Drinking Water ATP Validation Report Page ii
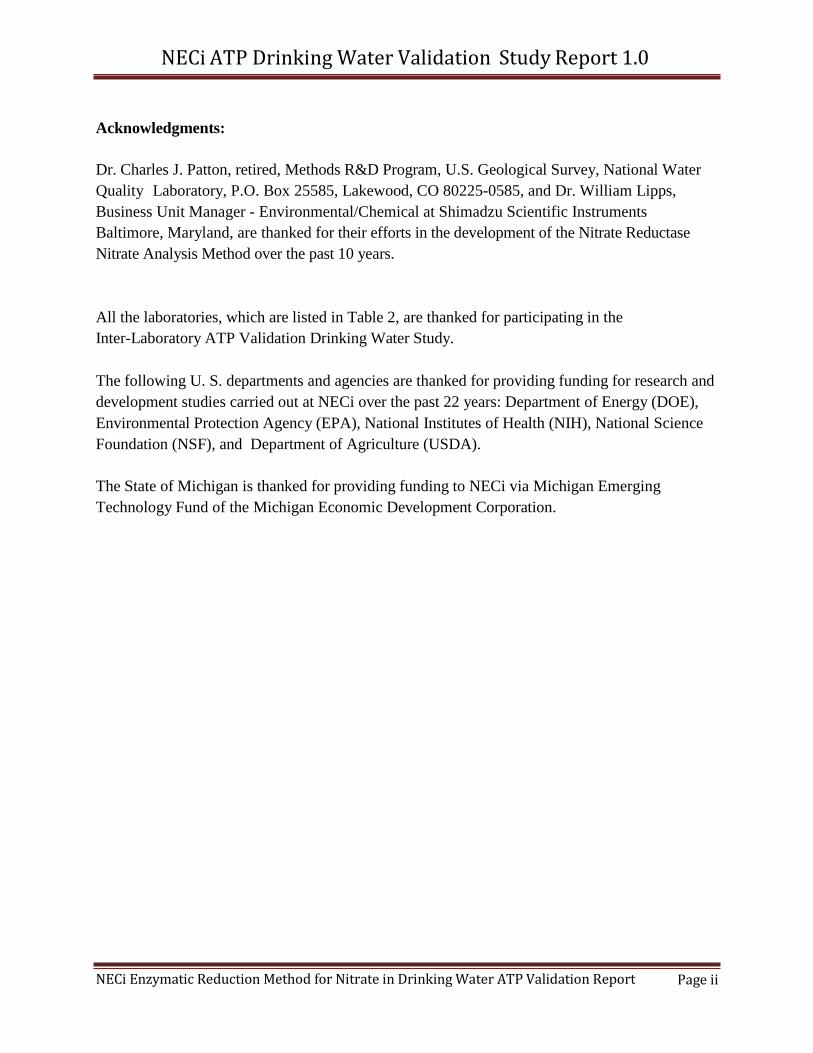
Acknowledgments:
Dr. Charles J. Patton, retired, Methods R&D Program, U.S. Geological Survey, National Water
Quality Laboratory, P.O. Box 25585, Lakewood, CO 80225-0585, and Dr. William Lipps,
Business Unit Manager - Environmental/Chemical at Shimadzu Scientific Instruments
Baltimore, Maryland, are thanked for their efforts in the development of the Nitrate Reductase
Nitrate Analysis Method over the past 10 years.
All the laboratories, which are listed in Table 2, are thanked for participating in the
Inter-Laboratory ATP Validation Drinking Water Study.
The following U. S. departments and agencies are thanked for providing funding for research and
development studies carried out at NECi over the past 22 years: Department of Energy (DOE),
Environmental Protection Agency (EPA), National Institutes of Health (NIH), National Science
Foundation (NSF), and Department of Agriculture (USDA).
The State of Michigan is thanked for providing funding to NECi via Michigan Emerging
Technology Fund of the Michigan Economic Development Corporation.
NECi ATP Drinking Water Validation Study Report 1.0
NECi Enzymatic Reduction Method for Nitrate ATP Validation Report Page iii
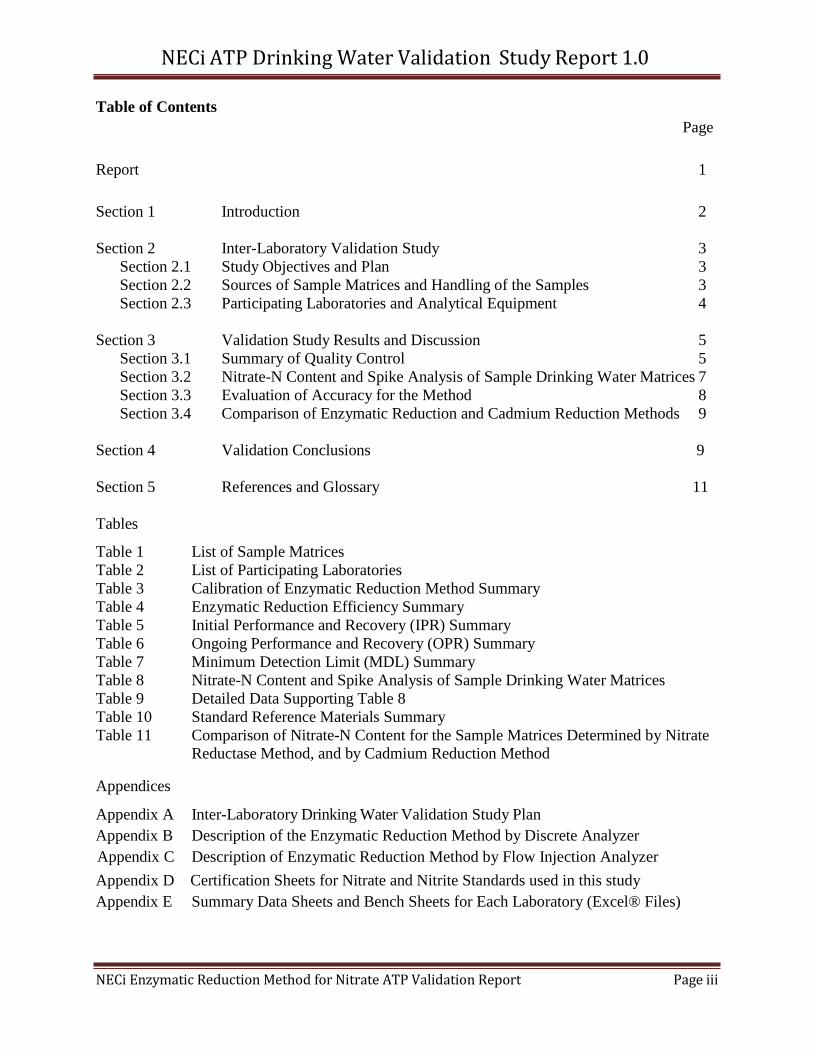
Table of Contents Page
Report 1
Section 1 Introduction 2
Section 2 Inter-Laboratory Validation Study 3
Section 2.1 Study Objectives and Plan 3
Section 2.2 Sources of Sample Matrices and Handling of the Samples 3
Section 2.3 Participating Laboratories and Analytical Equipment 4
Section 3 Validation Study Results and Discussion 5
Section 3.1 Summary of Quality Control 5
Section 3.2 Nitrate-N Content and Spike Analysis of Sample Drinking Water Matrices 7
Section 3.3 Evaluation of Accuracy for the Method 8
Section 3.4 Comparison of Enzymatic Reduction and Cadmium Reduction Methods 9
Section 4 Validation Conclusions 9
Section 5 References and Glossary 11
Tables
Table 1 List of Sample Matrices
Table 2 List of Participating Laboratories
Table 3 Calibration of Enzymatic Reduction Method Summary
Table 4 Enzymatic Reduction Efficiency Summary
Table 5 Initial Performance and Recovery (IPR) Summary
Table 6 Ongoing Performance and Recovery (OPR) Summary
Table 7 Minimum Detection Limit (MDL) Summary
Table 8 Nitrate-N Content and Spike Analysis of Sample Drinking Water Matrices
Table 9 Detailed Data Supporting Table 8
Table 10 Standard Reference Materials Summary
Table 11 Comparison of Nitrate-N Content for the Sample Matrices Determined by Nitrate
Reductase Method, and by Cadmium Reduction Method
Appendices
Appendix A Inter-Laboratory Drinking Water Validation Study Plan
Appendix B Description of the Enzymatic Reduction Method by Discrete Analyzer
Appendix C Description of Enzymatic Reduction Method by Flow Injection Analyzer
Appendix D Certification Sheets for Nitrate and Nitrite Standards used in this study
Appendix E Summary Data Sheets and Bench Sheets for Each Laboratory (Excel® Files)
NECi ATP Drinking Water Validation Study Report 1.0
NECi Enzymatic Reduction Method for Nitrate ATP Validation Report Page 1
Report
NECi ATP Drinking Water Validation Study Report 1.0
NECi Enzymatic Reduction Method for Nitrate ATP Validation Report Page 2
Section 1 Introduction
This Validation Study Report supports development of Nitrate plus Nitrite Nitrogen by Nitrate
Reductase (Campbell, et al., 2006), also called Enzymatic Reduction Method for Nitrate-N
Analysis, for use as an USEPA Alternate Test Procedure (ATP) for Tier 3 level (nationwide)
determination of nitrate plus nitrite nitrogen in drinking water (EPA, 1999). The enzyme
Nitrate Reductase (EC 1.7.1.1/2, NaR; CAS #9029-27-0) catalyzes the reduction of nitrate to
nitrite with the reducing power provided by the natural reductant, reduced Nicotinamide Adenine
Dinucleotide (NADH), which is a thermodynamically irreversible reaction.
Nitrate + NADH + H+ Nitrite + NAD
+ + H2O
This is the basis for a “green”, non-toxic method for nitrate-N analysis.
Eukaryotic NaR is a complex enzyme which contains a polypeptide chain of more than
900 amino acid residues and two metal ions (Fe3+
and Mo6+
) and three organic cofactors (Flavin
Adenine Dinucleotide (FAD), Heme, and Molybdopterin) (Campbell, 1999). Since the natural
NaR is of low abundance in plants, algae and fungi, recombinant DNA technology is utilized to
produce the enzyme from a plant NaR gene (Arabidopsis thaliana) in the yeast Pichia pastoris
which is designated AtNaR2 (Campbell et al., 2006). A second form of NaR, which is
designated YNaR1 (Barbier et al., 2004), is produced from a yeast NaR gene (Pichia angusta,
recently renamed Ogataea angusta, but originally named Hansenula polymorpha)
recombinantly expressed in the yeast Pichia pastoris.
Recombinant AtNaR2 and YNaR1 are purified from the Pichia yeast extract to near
homogeneity using immobilized metal ion affinity chromatography via the Histidine-tag built
into the recombinant gene products. The purified AtNaR2 and YNaR1 are highly stable and
can be stored frozen in a buffered solution at -80°C indefinitely. Furthermore, when the
AtNaR2 and YNaR1 are freeze-dried and stored, dry and under vacuum in an opaque package,
they can be shipped at room temperature and will remain stable for up to 6 months.
NaR-based Nitrate-N analysis is formulated as a method with a small volume, which is
ideal for modern instruments such as the automated Discrete Analyzer (DA) and Flow Injection
Analyzer (FIA). The method’s formulation consists of a biochemical buffer to maintain pH
near neutrality, the reconstituted NaR (stable for 18 hours), a precise solution of NADH, and the
small volume of sample to be analyzed for Nitrate-N content. For example, in the discrete
analyzer, the volume of buffered AtNaR2 is 55 µL, NADH 12 µL, and sample 5 µL (Patton and
Kryskalla, 2011; 2013). Compared to EPA method 353.2, where the sample is often 20 mL, the
enzymatic reduction method has obvious advantages in sample and waste handling. After the
reduction of nitrate to nitrite is complete, requiring about 10 min, the nitrite is determined
colorimetrically as in EPA method 353.2, which involves the sequential addition of
sulfanilamide (SAN) and N (1 Naphthyl)ethylenediamine dihydrochloride (NED) and
measurement at 540 ± 20 nm.
NECi ATP Drinking Water Validation Study Report 1.0
NECi Enzymatic Reduction Method for Nitrate ATP Validation Report Page 3
Section 2 Inter-Laboratory Validation Study
The details of the Inter-Laboratory Validation Study are presented in this section. The Nitrate
Elimination Co., Inc. (NECi), Lake Linden, Michigan, coordinated the Inter-Laboratory
Drinking Water Validation Study of the Enzymatic Reduction Method based on Nitrate
Reductase for determination of nitrate-N and nitrate/nitrite-N. In this study the Enzymatic
Reduction Method for nitrate-N is directly compared to the Cadmium Reduction Method for
nitrate-N (EPA Reference Method 353.2), in each participating laboratory for each sample
matrix. In addition, two published studies have compared the Enzymatic Reduction Method to
the Cd Reduction Method and demonstrated the equivalence of the two methods for
determining nitrate-N and nitrate/nitrite-N in aqueous samples (Patton and Kryskalla, 2011;
Patton and Kryskalla, 2013).
Section 2.1 Study Objective and Design Plan
The objective of the Inter-Laboratory Study of Nitrate-N Analysis by the Enzymatic Reduction
Method based on Nitrate Reductase was to demonstrate the validity of the Method according to
the Design Plan presented in Appendix A. The Design Plan was developed in accordance with
ATP Protocol for Organic and Inorganic Analytes (USEPA, 1999) in order to validate the
Method for Tier 3 (nationwide) status for Drinking Water; and Protocol for the Evaluation of
Alternate Test Procedures for Organic and Inorganic Analytes in Drinking Water, Office of
Water (MS-140), EPA 815-R-15-007, February, 2015.
The Study Plan was approved, 7July2015, by Dr. Steven Wendelken, Safe Drinking Water Act
ATP Coordinator, U.S. Environmental Protection Agency, (Steven C. Wendelken, PhD, U.S.
EPA, OGWDW/SRMD/TSC, 26 W. Martin Luther King Dr., Cincinnati, OH 45219).
The Sample Matrices analyzed in the Inter-Laboratory Drinking Water Validation Study are
listed in Table 1. The Enzymatic Reduction Method based on Nitrate Reductase is described
according to EPA format in Appendices B and C, which were incorporated in the Design Plan.
This Method was implemented by the Participating Laboratories which are listed in Table 2,
and directly compared to EPA Method 353.2.
The variety of drinking water matrices analyzed, along with direct comparison to the EPA
Reference Method, validates the Nitrate-N Analysis by the Enzymatic Reduction Method based
on Nitrate Reductase for compliance monitoring under National Primary Drinking Water
Regulations (NPDWRs).
NECi ATP Drinking Water Validation Study Report 1.0
NECi Enzymatic Reduction Method for Nitrate ATP Validation Report Page 4
Section 2.2 Sources of Sample Matrices and Handling of the Samples
The list of Sample Matrices is presented in Table 1. The sample matrices were shipped in
certified clean bottles according to the Study Plan and EPA protocols. Each sample Matrix
bottle was labeled with the designated matrix identification (i.e. DW-2, and DW-3). Certified
Nitrate Standards and Calibrants were purchased from ERA in individual, labeled bottles such
that there was no handling of these until they reached the participating Laboratories. The
packaged and sealed Sample Matrices and Nitrate Standards were shipped on “blue ice” to the
Participating Laboratories by NECi (See Table 3). According to the Design Plan, once the
Sample Matrices were shipped, the Participating Laboratories were to store them at 4°C until
they completed the analysis. Certification documents are provided in Appendix D.
Section 2.3 Participating Laboratories and Analytical Equipment
The list of Participating Laboratories is presented in Table 2. Laboratory 4 dropped out of the
study after the samples had been shipped to them and did not complete the analysis of the
samples. Two Participating Laboratories (Labs 1 and 2) were equipped with automated discrete
analyzers (DA). One Participating Laboratory (Lab 3) used a Lachat Flow Injection Analyzer
with off-line nitrate reduction as described in Appendix C. Each Participating Laboratory also
analyzed the sample matrices using an automated Cadmium Reduction Analyzer running EPA
Method 353.2.
Reagents for the Nitrate analysis, including the enzyme Nitrate Reductase (AtNaR2 or YNaR1),
were supplied to all laboratories by NECi. The enzyme (AtNaR2 or YNaR1) consisted of a
vacuum sealed, opaque pouch with a desiccant and a vial of freeze-dried AtNaR2 or YNaR1
containing one unit of enzyme activity, where the unit of enzyme activity is defined as the
amount of enzyme catalyzing the NADH-driven reduction of 1 µmol of nitrate to nitrite per min
at 30°C and pH 7.5. AtNaR2 and YNaR1 when stored in this form at room temperature (~25°C)
are stable for up to one year. Each laboratory reconstituted the enzyme in phosphate buffer, pH
7.5, at the time of analysis according to instructions provided with the enzyme packet. For each
type of DA being used in the study, a specific set of Standard Operating Procedures (SOP) has
been developed which condenses the Method in Appendix B.
NECi ATP Drinking Water Validation Study Report 1.0
NECi Enzymatic Reduction Method for Nitrate ATP Validation Report Page 5
Section 3 Validation Study Results and Discussion
The results from the Inter-Laboratory Validation Study are contained in the Excel® files in
Appendix E. The original Excel® files have been provided on a flash drive, which accompany
this Report. Included within the Summary Excel® file are the “bench sheets” where possible
and, in some cases, as PDF or other files in the directory for each laboratory in the provided
data sets. An explanation table for error codes used in the KoneLab AquaKem® DA raw data
files is provided in Appendix E. For this section of the Report, summary tables have been
prepared from the original Excel® Summary Data Sheet files (Appendix E).
Section 3.1 Summary of Quality Control
While summary data are present in this report for Quality Control Samples, it is to be understood
that all analytical analysis done in this study were for data sets that were in compliance with QC
acceptance standards. This stipulation applies for both the Enzymatic Reduction Method for
Nitrate Analysis using Nitrate Reductase and Cadmium Reduction Method for Nitrate Analysis
(Reference Method EPA 353.2).
Statistical analysis of Calibration Curves reported by each laboratory are summarized in Table
4. In many cases, the laboratories ran more than one standard curve and the summary in Table
4 represents selected statistical data. In all cases, the correlation coefficient (r2) = 0.999 or
greater. In each case, the regression fit parameters are utilized to generate an equation relating
the Absorbance @ 540 nm (or 550 nm or Area in volts/sec) to the Nitrate-N content of the
unknown sample, such that the concentration of Nitrate-N (mg N/L) can be calculated from the
Absorbance or area of the absorbance peak in the case of FIA.
Enzymatic and cadmium reduction efficiencies for each laboratory are summarized in Table 5
by showing one example for each lab. All labs found enzymatic and cadmium reduction
efficiency of 93% or greater, which meets the acceptance criterion of 90% or greater reduction
efficiency. This establishes the effectiveness of the nitrate reductase-catalyzed enzymatic
reduction of nitrate to nitrite under the conditions of the analytical method, as well as the
cadmium reduction efficiency under the conditions of the analytical method. In Lab 1, reduction
efficiencies were about the same for both methods; while Lab 2 found greater reduction
efficiency with the NaR reduction method and Lab 3 greater reduction efficiency for cadmium
reduction method.
Initial Performance and Recovery (IPR) and Ongoing Performance and Recovery (OPR) results
from all laboratories are summarized in Table 6. IPR certified standard nitrate concentration
was 2.01 mg N/L (see Appendix D). IPR individual and mean recoveries for the selected data in

NECi ATP Drinking Water Validation Study Report 1.0
NECi Enzymatic Reduction Method for Nitrate ATP Validation Report Page 6
Table 6 were from 95 to 105% for NaR Reduction Analysis, which meets the acceptance
criterion of 100 ± 10%. IPR individual and mean recoveries for the selected data in Table 6
were from 93 to 99% for Cadmium Reduction Analysis, which meets the acceptance criterion of
100 ± 10%. IPR recoveries were greater for NaR Reduction Analysis than Cadmium Reduction
Analysis in all three labs.
OPR certified standard nitrate concentrations were 2.01, 2.50, and 12.00 mg N/L (see Appendix
D). OPR mean recoveries for the selected data in Table 6 were from 96 to 104% which meets
the acceptance criterion of 100 ± 10%. All other OPR recoveries, which are not shown in Table
6, were within the acceptable range of 90 to 110% recovery(Appendix E - Excel® files).
The final Quality Control evaluation is the determination of Minimum Detection Limit (MDL)
for each laboratory’s equipment; these results are summarized in Table 7. All the MDL values
are below the level of the lowest calibrant for these analyzers (Table 4), which indicates that the
calibration curve for these analyzers is completely valid with respect to detecting nitrate-N at
the lowest level of the calibration. Lab 1 had the highest MDL values found in this study for
both the Nitrate Reductase Method on the AquaKem Discrete Analyzer, 0.0097 mg N/L, and the
Cadmium Reduction Method, 0.03436 mg N/L (Table 7). Lab 2 found almost identical MDL
values for the two methods: Nitrate Reductase Method, 0.006507 mg N/L; and Cadmium
Reduction Method, 0.006694 mg N/L. Lab 3 running the FIA system found a higher MDL for
the Nitrate Reductase Method, 0.009429, than the Cadmium Reduction Method, 0.006507 mg
N/L. Since the MDL is dependent on the analytical equipment used with the Methods, the MDL
values from the different labs cannot be compared directly.
Three published studies evaluated the MDL for Enzymatic Reduction Method for Nitrate-N
Analysis (Patton et al., 2002; Patton and Kryskalla, 2011; Patton and Kryskalla, 2013). When
the Method was run on an Air-segmented Continuous Flow Analyzer (Patton et al., 2002), the
MDL was reported to be 0.006 mg N/L. When the Method was run on a Discrete Analyzer
(Patton and Kryskalla, 2011), the MDL was reported to be 0.02 mg N/L. When the MDL of the
reference method, EPA Method 353.2, was determined on an Air-segmented Continuous Flow
Analyzer (Patton et al., 2002; Patton and Kryskalla, 2013), it was found to be 0.003 mg Nitrate-
N/L. The lower MDL for the reference method is apparently due to differences in the analyzer
equipment: Air-segmented Continuous Flow Analyzer uses the same cuvette for analyzing all
samples and blanks; and the Discrete Analyzer uses a different cuvette for every sample and
blank. Indeed, the Enzymatic Reduction Method for Nitrate-N Analysis, has a lower MDL for
the Air-segmented Continuous Flow Analyzer than the Discrete Analyzer. Although the
Discrete Analyzer uses a correction for background absorbance, it apparently does not correct for
all the differences between the cuvettes (Patton and Kryskalla, 2011).
NECi ATP Drinking Water Validation Study Report 1.0
NECi Enzymatic Reduction Method for Nitrate ATP Validation Report Page 7
Section 3.2 Nitrate-N Content and Spike Analysis of Drinking Water Matrices
Each laboratory participating in the Study analyzed local tap water (DW-1) and the tap water
spiked with 2 to 4 mg/L free chlorine (DW-1-Cl) using both Methods for Nitrate-N Analysis.
In all cases the tap water was from a regulated municipal drinking water supply: Lab 1, Chicago
City Water; Lab 2, New Haven, Connecticut, City Water; and Lab 3, Loveland, CO, City Water.
The results from Lab 1 for determination of the Nitrate-N Content and Spiking Studies are
presented in Table 8. For the NaR Reduction Method, the Nitrate Content of the “as is” tap
water (DW-1) and chlorinated tap water (DW-1-Cl), were virtually the same, 0.3237 ±
0.003698 and 0.3185 ± 0.01625 Nitrate-N mg/L, respectively, for the mean of 7 replicates and
the standard deviation (Table 8, first page). Both DW-1 and DW-1-Cl were spiked in duplicate
according to the Study Plan with 3 levels of Nitrate-N mg/L, 0.5, 1.0, and 2.5, for analysis with
the NaR Reduction Method (Table 8, first page). All the spike recoveries and recovery
percentages were within acceptable limits of 85 to 115% and the Relative Percent Difference
between the MS and MSD were also acceptable as less than 20%. There was virtually no
difference between the results of spiking studies for DW-1 and DW-1-Cl, which indicates that
chlorination of the tap water did not cause a matrix effect in the NaR Reduction Method for
these samples.
For Lab 1 applying the Cd Reduction Method, the Nitrate Content of the “as is” tap water (DW-
1) and chlorinated tap water (DW-1-Cl), were virtually the same, 0.2259 ± 0.008633 and 0.2186
± 0.007162 Nitrate-N mg/L, respectively, for the mean of 7 replicates and the standard
deviation (Table 8, second page). However, these Nitrate-N contents were lower than found by
the NaR Reduction Method. Both DW-1 and DW-1-Cl were spiked in duplicate according to
the Study Plan with 3 levels of Nitrate-N mg/L, 0.5, 1.0, and 2.5, for analysis with the Cd
Reduction Method (Table 8, second page). All the spike recoveries and recovery percentages
were within acceptable limits of 85 to 115% and the Relative Percent Difference between the
MS and MSD were also acceptable as less than 20%. There was virtually no difference
between the results of spiking studies for DW-1 and DW-1-Cl, which indicates that chlorination
of the tap water did not cause a matrix effect in the Cd Reduction Method for these samples.
Similar results were found by Lab 2 and Lab 3 for analysis of their tap water with and without
chlorination. These results are not summarized in a table in this report, but may be found in the
data included in Appendix E in the Summary Data Sheets. Labs 2 and 3, also found that there
was no matrix effect for either the NaR Reduction Method or Cd Reduction Method for
chlorination of their local tap water.
For the DW-2 High TDS Drinking Water Matrix, Lab 3 results for determination of the Nitrate-
NECi ATP Drinking Water Validation Study Report 1.0
NECi Enzymatic Reduction Method for Nitrate ATP Validation Report Page 8
N Content and Spiking Studies are presented in Table 9. For the NaR Reduction Method, the
Nitrate Content of the DW-2 was, 0.2628 ± 0.001390 Nitrate-N mg/L, respectively, for the
mean of 7 replicates and the standard deviation (Table 9, left column). DW-2 was spiked in
duplicate according to the Study Plan with 3 levels of Nitrate-N mg/L, 0.5, 1.0, and 2.5, for
analysis with the NaR Reduction Method (Table 9, left column). All the spike recoveries and
recovery percentages were within acceptable limits of 85 to 115% and the Relative Percent
Difference between the MS and MSD were also acceptable as less than 20%. Analysis of the
Nitrate Content of DW-2 with the Cd Reduction Method yielded 0.2606 ± 0.0045 Nitrate-N
mg/L (Table 9, right column). DW-2 was spiked in duplicate according to the Study Plan with
3 levels of Nitrate-N mg/L, 0.5, 1.0, and 2.5, for analysis with the Cd Reduction Method (Table
9, right column). All the spike recoveries and recovery percentages were within acceptable
limits of 85 to 115% and the Relative Percent Difference between the MS and MSD were also
acceptable as less than 20%. Thus, it is clear that the two methods produce very similar results
for DW-2 and Drinking Water with High Total Dissolved Solids does not produce a matrix
effect in either method.
For the DW-3 High TOC Drinking Water Matrix, Lab 2 results for determination of the Nitrate-
N Content and Spiking Studies are presented in Table 10 For the NaR Reduction Method, the
Nitrate Content of the DW-3 was undetectable, -0.020617 ± 0.001497 Nitrate-N mg/L,
respectively, for the mean of 7 replicates and the standard deviation (Table 10, left column).
DW-3 was spiked in duplicate according to the Study Plan with 3 levels of Nitrate-N mg/L, 0.5,
1.0, and 2.5, for analysis with the NaR Reduction Method (Table 10, left column). All the spike
recoveries and recovery percentages were within acceptable limits of 85 to 115% and the
Relative Percent Difference between the MS and MSD were also acceptable as less than 20%.
Analysis of the Nitrate Content of DW-3 with the Cd Reduction Method yielded 0.002450 ±
0.002696 Nitrate-N mg/L (Table 10, right column). DW-2 was spiked in duplicate according to
the Study Plan with 3 levels of Nitrate-N mg/L, 0.5, 1.0, and 2.5, for analysis with the Cd
Reduction Method (Table 10, right column). All the spike recoveries and recovery percentages
were within acceptable limits of 85 to 115% and the Relative Percent Difference between the
MS and MSD were also acceptable as less than 20%. Thus, it is clear that the two methods
produce very similar results for DW-2 and Drinking Water with High Total Organic Carbon
does not produce a matrix effect in either method.
3.3 Evaluation of the Accuracy of the Method
There was one reference standard analyzed by all the Participating Laboratories in this study
(Table 11). The standard was SR-1 (ERA #698) with certified target value = 5.14 ± 0.094 mg
N/L. Since this level of Nitrate-N content is greater than the highest calibrant for most the
Participating Laboratories for either method, the matrix was diluted prior to analysis. Lab 1
running the Cd Reduction Method had a calibration range going up to 20 mg Nitrate-N/L and did
NECi ATP Drinking Water Validation Study Report 1.0
NECi Enzymatic Reduction Method for Nitrate ATP Validation Report Page 9
not need to dilute the sample prior to analysis with this method. Each Lab found the mean
Nitrate-N content SR-1 to be within 10% of the ERA certified value using both methods (Table
11). Clearly, both methods are equally accurate for determining Nitrate-N content.
3.4 Comparison of the Enzymatic Reduction Method to the Cadmium Reduction Method
Every Drinking Water Sample Matrix analyzed in this Validation Study listed in Table 1 was
analyzed by both the Nitrate Reductase Reduction and Cadmium Reduction Method, the EPA
Reference Method (EPA Method 353.2). In general, no significant difference was found
between the results obtained by the Nitrate Reductase Method and the Cadmium Reduction
Method in Nitrate-N content in mg/L within the statistical limits of the methods in any of the
Drinking Water Matrices. Perhaps, the greatest difference between the two methods was found
for analysis of Nitrate-N content of DW-3 by Lab 2 (Table 10). Here it was found that the
Sample Matrix had undetectable Nitrate-N content by the NaR Reduction Method, but that it
had 3 ppb Nitrate-N by the Cd Reduction Method; however, this level of Nitrate-N is below the
MDL of the method reported in Table 7. Lab 1 also analyzed DW-3 by both methods and found
36 ppb by the NaR Reduction Method, and an undetectable level by Cd Reduction Method.
Clearly, the two methods gave similar results for this Drinking Water Matrix at the limit of
detection of Nitrate-N in water.
With regard to Matrix Spike analysis, DW-1, DW-1-Cl, DW-2, DW-3 (see Table 1) were all
analyzed by the Matrix Spike protocol using both the NaR Reduction Method and the Cd
Reduction Method (Table 8, 9, and 10). No differences were found in the results of these
studies. The results showed that none of these matrices produced a Matrix Effect on the results
of either Method by demonstration of completely acceptable Spike Recoveries and acceptable
comparison between the pairs of each Spike MS and MSD.
Section 4 Validation Conclusions
The USEPA requires for Tier 3 (nationwide) validation of an Alternate Test Procedure (ATP)
Method that three different laboratories analyze the analyte content of one sample of three
different finished drinking water matrices (EPA, 1999). Thus, the ATP Method will be in
compliance with the Safe Drinking Water Act (CWA) and validate the ATP Method for
compliance monitoring under National Primary Drinking Water Regulations (NPDWRs).
For the Enzymatic Reduction Method for Nitrate-N Analysis, the requirements of Tier 3
validation were met by analysis of three different finished drinking water matrices (see Table 1
for list of Drinking Water Sample Matrices analyzed in this study and Tables 8, 9, and 10 for
NECi ATP Drinking Water Validation Study Report 1.0
NECi Enzymatic Reduction Method for Nitrate ATP Validation Report Page 10
details of the analysis by 3 of the 4 laboratories listed in Table 2). The spiking studies of the
Drinking Water Sample Matrices (spikes of 0.5, 1.0 and 2.5 mg Nitrate-N/L analyzed in
duplicate) indicated that there was little or no matrix effect on the Method by the three drinking
water matrices (Table 8, 9, and 10); including chlorination of tap water.
Accuracy of the Method was shown to be very high by analysis of the standard reference SR-1
(Table 11) and the precision of the Quality Control results (Tables 6). The MDL evaluation of the
equipment used in the study demonstrated that the Method has a detection limit of
0.050 mg N/L or less on the DA and FIA analyzers used in the study (Table 7). Few interfering
substances, if any, were discovered in the present study. Previous analysis of interferences with
specific compounds showed that there was little interference with the Method (Patton and
Kryskalla, 2011; Patton and Kryskalla, 2013). See also data on interferences in The Method
description in Appendix B.
Comparison of the analysis of the three drinking water matrices and the reference standard by
the Enzymatic Reduction Method and the certified Cadmium Reduction Method (EPA Method
353.2) indicated that very similar results were obtained (Table 8, 9, and 10). Previous studies
have also found the two methods yielded similar results (Patton et al., 2002; Patton and
Kryskalla, 2011; 2013; Ringuet et al., 2011).
In summary, the Enzymatic Reduction Method for Nitrate-N Analysis has been validated by a
robust Inter-Laboratory Study of Drinking Water Sample Matrices. All laboratories analyzing
the Sample Matrices met all Quality Control criteria for valid analyses prior to analyzing the
samples. The Calibration Curve, Nitrate Reduction Efficiency, and IPR/OPR recoveries (Tables
4, 5, and 6) were within the acceptable range before analyzing the unknown Sample Matrices.
Analysis of certified Nitrate Standards indicated that the Method is highly accurate and capable
of providing definitive analysis of Nitrate-N content of Drinking Water in the field. For
Discrete Analyzers running the Method, the MDL ranged from 0.0066 to
0.0097 mg N/L; while the Flow Injection Analyzer had an MDL = 0.0094 (Table 7). Thus, the
requirements of the Tier 3 level Alternate Test Procedure Protocol have been met for validation
of the Enzymatic Reduction Method for Nitrate-N Analysis by the Inter-Laboratory Validation
Study reported herein. The Method is ready for compliance monitoring under National Primary
Drinking Water Regulations (NPDWRs).
NECi ATP Drinking Water Validation Study Report 1.0
NECi Enzymatic Reduction Method for Nitrate ATP Validation Report Page 11
Section 5 References and Glossary
Protocol for EPA Approval of Alternate Test Procedures for Organic and Inorganic Analytes in
Wastewater and Drinking Water, USEPA, 1999. http://water.epa.gov/scitech/methods/cwa/atp/upload/2007_02_06_methods_atp_EPA821B98003.pdf
Protocol for the Evaluation of Alternate Test Procedures for Organic and Inorganic Analytes in
Drinking Water, Office of Water (MS-140), EPA 815-R-15-007, February 2015
http://water.epa.gov/scitech/drinkingwater/labcert/upload/epa815r15007.pdf
Barbier, GG, JC Joshi, ER Campbell & WH Campbell (2004) Purification and biochemical
characterization of simplified eukaryotic nitrate reductase expressed in Pichia pastoris.
Protein Expression & Purification. 37: 61-71.
Campbell, Wilbur H. (1999) Nitrate Reductase Structure, Function and Regulation: Bridging the
Gap between Biochemistry and Physiology, Annual Review of Plant Physiology and Plant
Molecular Biology 50:277-303.
Campbell, Wilbur H., P Song, GG Barbier (2006) Nitrate Reductase for Nitrate Analysis in
Water. Environmental Chemistry Letters, 4: 69-73.
Patton CJ, AE Fischer, WH Campbell & ER Campbell (2002) Corn leaf nitrate reductase: A
nontoxic alternative to cadmium for photometric nitrate determinations in water samples by
air-segmented continuous-flow analysis. Environmental Science and Technology, 36: 729-
35.
Patton, C.J., and Kryskalla, J.R., 2011, Colorimetric determination of nitrate plus nitrite in water
by enzymatic reduction, automated discrete analyzer methods: U.S. Geological Survey
Techniques and Methods, book 5, chap. B8, 34 p. (Available on line at
http://pubs.usgs.gov/tm/05b08/)
Patton, C.J., and Kryskalla, J.R., 2013, Analytical properties of some commercially available
nitrate reductase enzymes evaluated as replacements for cadmium in automated, semi-
automated, and manual colorimetric methods for determination of nitrate plus nitrite in water,
USGS Scientific Investigations Report 2013-5033 (http://pubs.usgs.gov/sir/2013/5033/).
Ringuet, R., L. Sassano, and Z. L. Johnson (2011) A Suite of microplate reader-based
colorimetric methods to quantify ammonium, orthophosphate, and silicate concentrations for
aquatic nutrient monitoring. Journal of Environmental Monitoring, 13: 370-376.
NECi ATP Drinking Water Validation Study Report 1.0
NECi Enzymatic Reduction Method for Nitrate ATP Validation Report Page 12
Glossary:
DA = Automated Discrete Analyzer
ERA = http://www.eraqc.com/
FIA = Flow Injection Analyzer
IPR = Initial Performance and Recovery
OPR = Ongoing Performance and Recovery
MDL = Method Detection Limit
(http://www.gpo.gov/fdsys/pkg/CFR-2012-title40-vol24/pdf/CFR-2012-title40-vol24-
part136- appB.pdf)
MS = Matrix Spike
MSD = Matrix Spike Duplicate
QA = Quality Assurance
QC = Quality Control
SDWA= Safe Drinking Water Act
TDS = Total Dissolved Solids
TOC = Total Organic Carbon
Doc = Inter laboratory Validation Study Plan for Drinking Water 4.0.docx
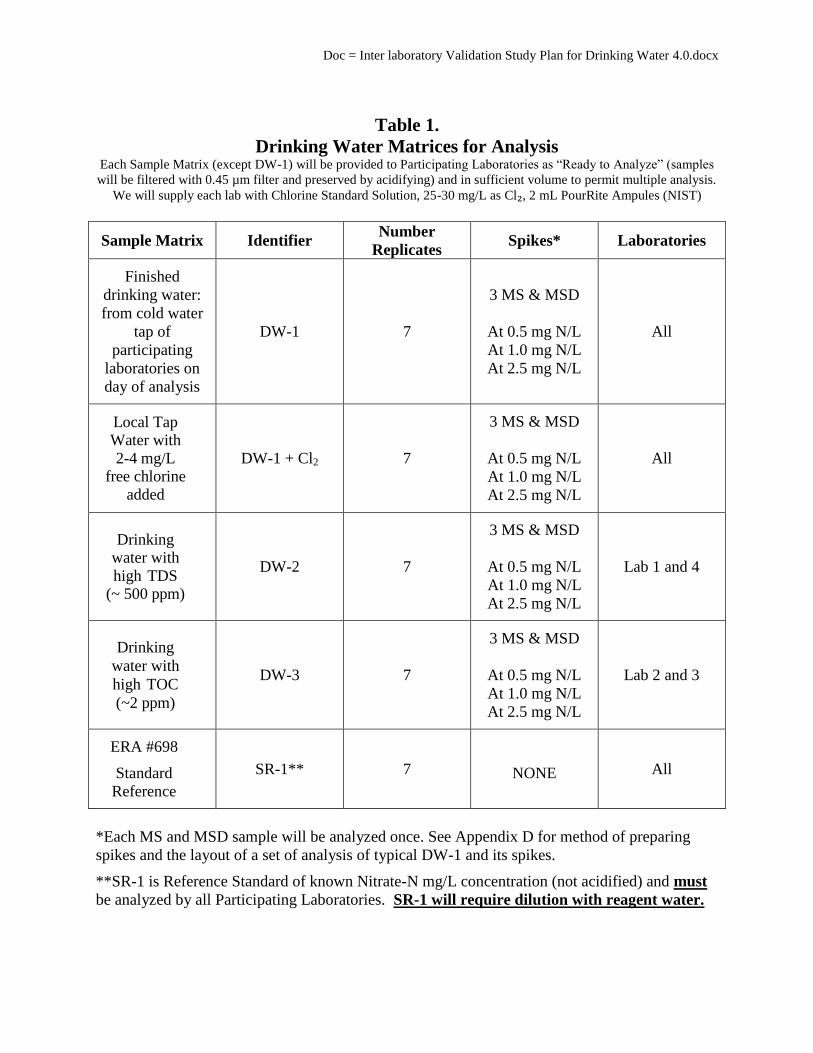
Table 1.
Drinking Water Matrices for Analysis Each Sample Matrix (except DW-1) will be provided to Participating Laboratories as “Ready to Analyze” (samples
will be filtered with 0.45 µm filter and preserved by acidifying) and in sufficient volume to permit multiple analysis.
We will supply each lab with Chlorine Standard Solution, 25-30 mg/L as Cl₂, 2 mL PourRite Ampules (NIST)
Sample Matrix Identifier Number
Replicates Spikes* Laboratories
Finished
drinking water:
from cold water
tap of
participating
laboratories on
day of analysis
DW-1 7
3 MS & MSD
At 0.5 mg N/L
At 1.0 mg N/L
At 2.5 mg N/L
All
Local Tap Water with
2-4 mg/L free chlorine
added
DW-1 + Cl2 7
3 MS & MSD
At 0.5 mg N/L
At 1.0 mg N/L
At 2.5 mg N/L
All
Drinking water with
high TDS (~ 500 ppm)
DW-2 7
3 MS & MSD
At 0.5 mg N/L
At 1.0 mg N/L
At 2.5 mg N/L
Lab 1 and 4
Drinking
water with
high TOC
(~2 ppm)
DW-3 7
3 MS & MSD
At 0.5 mg N/L
At 1.0 mg N/L
At 2.5 mg N/L
Lab 2 and 3
ERA #698
Standard
Reference
SR-1** 7 NONE All
*Each MS and MSD sample will be analyzed once. See Appendix D for method of preparing
spikes and the layout of a set of analysis of typical DW-1 and its spikes.
**SR-1 is Reference Standard of known Nitrate-N mg/L concentration (not acidified) and must
be analyzed by all Participating Laboratories. SR-1 will require dilution with reagent water.
Doc = Inter laboratory Validation Study Plan for Drinking Water 4.0.docx
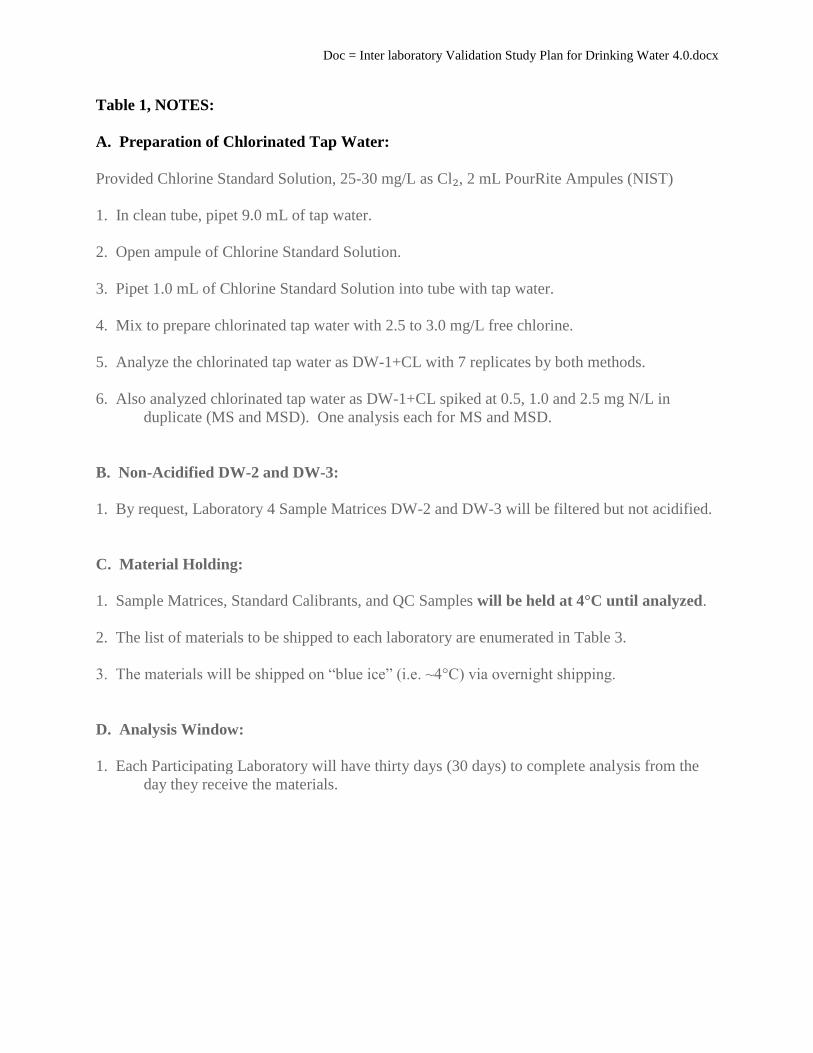
Table 1, NOTES:
A. Preparation of Chlorinated Tap Water:
Provided Chlorine Standard Solution, 25-30 mg/L as Cl₂, 2 mL PourRite Ampules (NIST)
1. In clean tube, pipet 9.0 mL of tap water.
2. Open ampule of Chlorine Standard Solution.
3. Pipet 1.0 mL of Chlorine Standard Solution into tube with tap water.
4. Mix to prepare chlorinated tap water with 2.5 to 3.0 mg/L free chlorine.
5. Analyze the chlorinated tap water as DW-1+CL with 7 replicates by both methods.
6. Also analyzed chlorinated tap water as DW-1+CL spiked at 0.5, 1.0 and 2.5 mg N/L in
duplicate (MS and MSD). One analysis each for MS and MSD.
B. Non-Acidified DW-2 and DW-3:
1. By request, Laboratory 4 Sample Matrices DW-2 and DW-3 will be filtered but not acidified.
C. Material Holding:
1. Sample Matrices, Standard Calibrants, and QC Samples will be held at 4°C until analyzed.
2. The list of materials to be shipped to each laboratory are enumerated in Table 3.
3. The materials will be shipped on “blue ice” (i.e. ~4°C) via overnight shipping.
D. Analysis Window:
1. Each Participating Laboratory will have thirty days (30 days) to complete analysis from the
day they receive the materials.
Doc = Inter laboratory Validation Study Plan for Drinking Water 4.0.docx
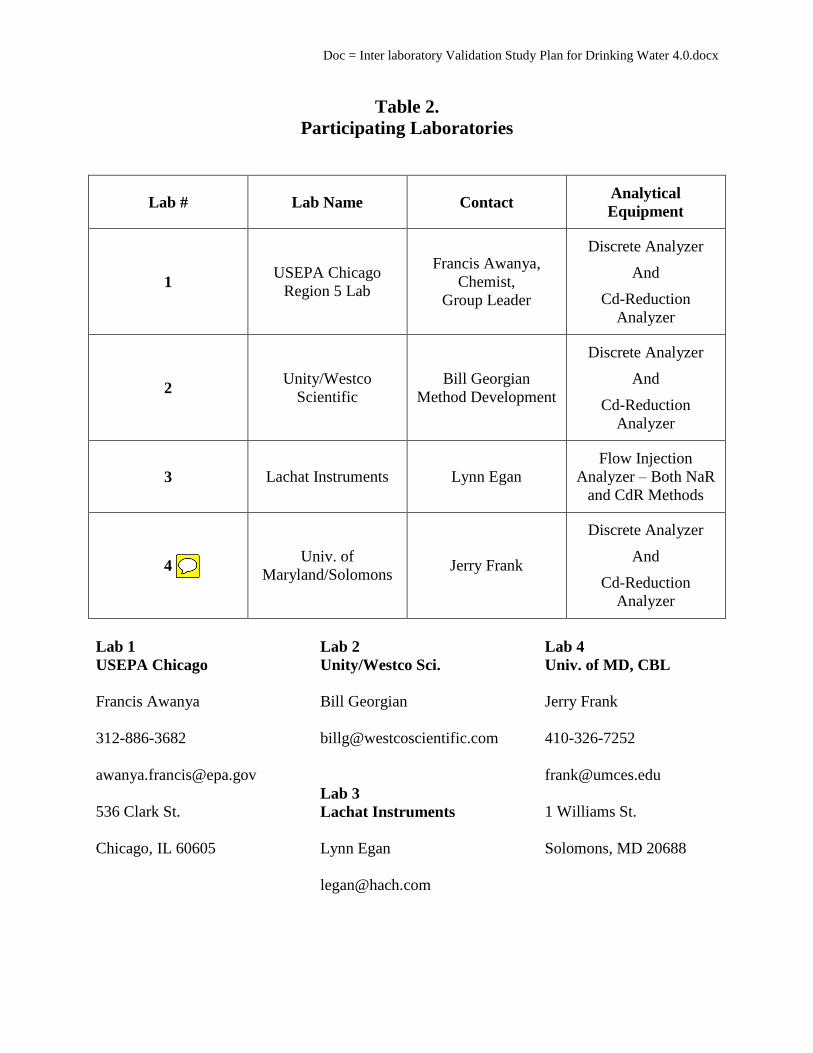
Table 2.
Participating Laboratories
Lab # Lab Name Contact Analytical
Equipment
1 USEPA Chicago
Region 5 Lab
Francis Awanya,
Chemist,
Group Leader
Discrete Analyzer
And
Cd-Reduction
Analyzer
2 Unity/Westco
Scientific
Bill Georgian
Method Development
Discrete Analyzer
And
Cd-Reduction
Analyzer
3 Lachat Instruments Lynn Egan
Flow Injection
Analyzer – Both NaR
and CdR Methods
4 Univ. of
Maryland/Solomons Jerry Frank
Discrete Analyzer
And
Cd-Reduction
Analyzer
Lab 1
USEPA Chicago
Francis Awanya
312-886-3682
536 Clark St.
Chicago, IL 60605
Lab 2
Unity/Westco Sci.
Bill Georgian
Lab 3
Lachat Instruments
Lynn Egan
Lab 4
Univ. of MD, CBL
Jerry Frank
410-326-7252
1 Williams St.
Solomons, MD 20688

Table 3
List of Materials Shipped to Four (4) Participating Labs
And
Two (2) Complete Sets Retained by NECi
Certification Documents for Items are in Appendix D
Item Source Preparation Volume (mL) Date Shipped
DW-2 NECi NECi 50
8Jul2015
DW-3 ERA NECi 50
SR-1 ERA NECi 50
Chlorine Standard
Solution Hach Sealed Ampule 2.0
2.01 mg Nitrate-N/L ERA NECi 50
2.50 mg Nitrate-N/L ERA NECi 50
15.0 mg Nitrate-N/L ERA NECi 50
50.0 mg Nitrate-N/L ERA NECi 50
1000 mg/L Nitrite-N ERA NECi 10
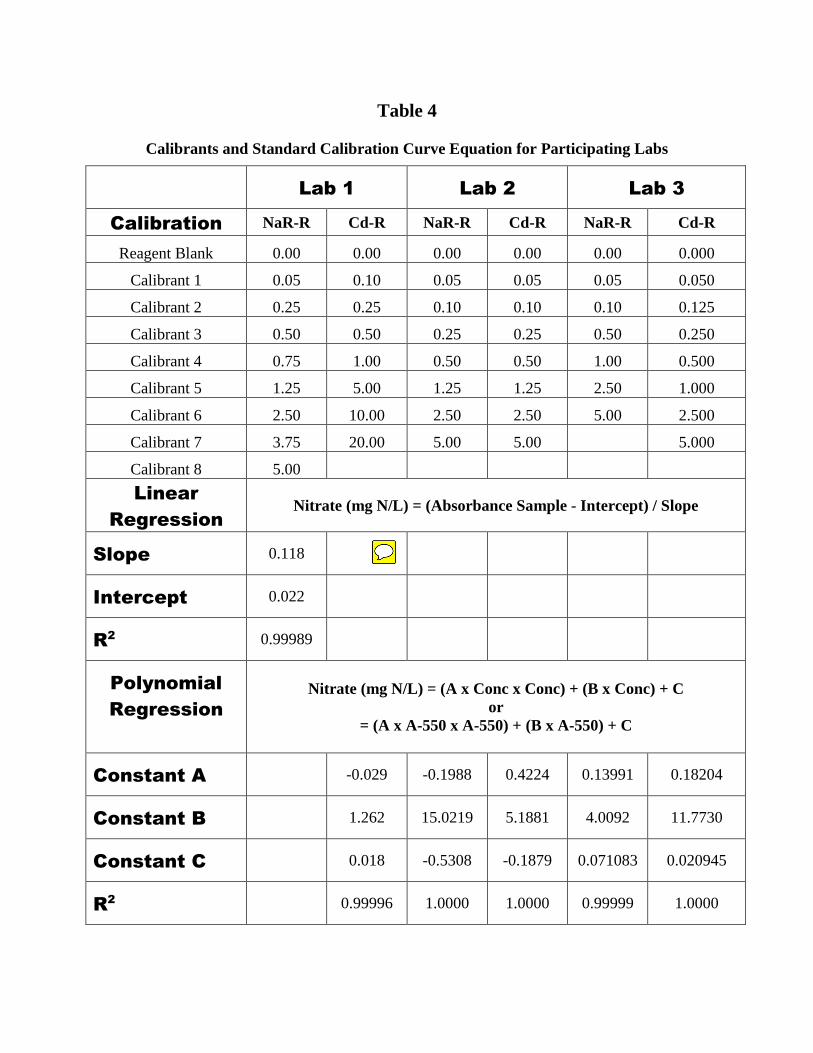
Table 4
Calibrants and Standard Calibration Curve Equation for Participating Labs
Lab 1 Lab 2 Lab 3
Calibration NaR-R Cd-R NaR-R Cd-R NaR-R Cd-R
Reagent Blank 0.00 0.00 0.00 0.00 0.00 0.000
Calibrant 1 0.05 0.10 0.05 0.05 0.05 0.050
Calibrant 2 0.25 0.25 0.10 0.10 0.10 0.125
Calibrant 3 0.50 0.50 0.25 0.25 0.50 0.250
Calibrant 4 0.75 1.00 0.50 0.50 1.00 0.500
Calibrant 5 1.25 5.00 1.25 1.25 2.50 1.000
Calibrant 6 2.50 10.00 2.50 2.50 5.00 2.500
Calibrant 7 3.75 20.00 5.00 5.00 5.000
Calibrant 8 5.00
Linear
Regression
Nitrate (mg N/L) = (Absorbance Sample - Intercept) / Slope
Slope 0.118
Intercept 0.022
R2 0.99989
Polynomial
Regression
Nitrate (mg N/L) = (A x Conc x Conc) + (B x Conc) + C
or
= (A x A-550 x A-550) + (B x A-550) + C
Constant A -0.029 -0.1988 0.4224 0.13991 0.18204
Constant B 1.262 15.0219 5.1881 4.0092 11.7730
Constant C 0.018 -0.5308 -0.1879 0.071083 0.020945
R2
0.99996 1.0000 1.0000 0.99999 1.0000

Table 5
Enzymatic and Cadmium Reduction Efficiency
Evaluated using 2.50 Nitrate-N mg/L and 2.50 Nitrite-N mg/L
Lab 1 Lab 2 Lab 3
NaR-R Cd-R NaR-R Cd-R NaR-R Cd-R
Nitrate
Absorbance
540 nm,
550 nm,
Or Area/sec
0.318 0.495 0.2080 0.4915 9.162 28.501
Nitrite
Absorbance
540 nm,
550 nm,
Or Area/sec
0.341 0.527 0.1963 0.5082 8.997 27.381
Catalytic
Reduction
Efficiency
(NO3/NO
2)
Percent
93.2551%
93.9279%
105.9603%
96.7139%
101.8339%
104.0904%
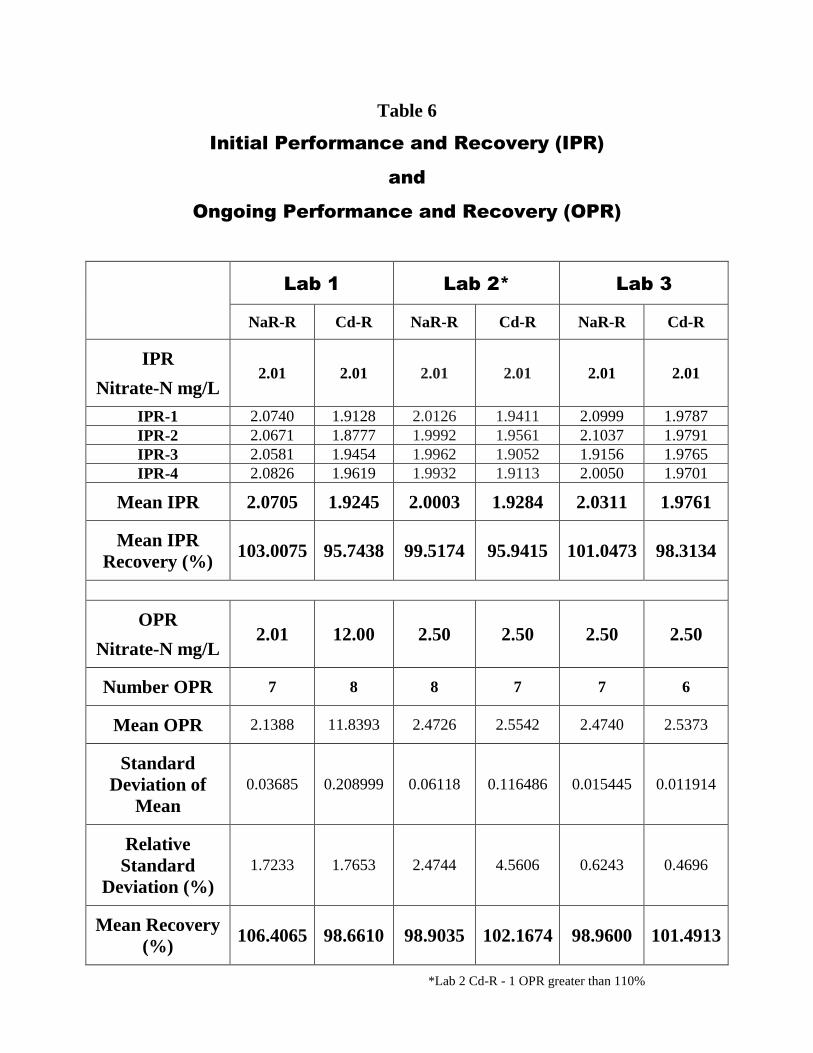
Table 6
Initial Performance and Recovery (IPR)
and
Ongoing Performance and Recovery (OPR)
Lab 1 Lab 2* Lab 3
NaR-R Cd-R NaR-R Cd-R NaR-R Cd-R
IPR
Nitrate-N mg/L 2.01 2.01 2.01 2.01 2.01 2.01
IPR-1 2.0740 1.9128 2.0126 1.9411 2.0999 1.9787
IPR-2 2.0671 1.8777 1.9992 1.9561 2.1037 1.9791
IPR-3 2.0581 1.9454 1.9962 1.9052 1.9156 1.9765
IPR-4 2.0826 1.9619 1.9932 1.9113 2.0050 1.9701
Mean IPR 2.0705 1.9245 2.0003 1.9284 2.0311 1.9761
Mean IPR
Recovery (%) 103.0075 95.7438 99.5174 95.9415 101.0473 98.3134
OPR
Nitrate-N mg/L 2.01 12.00 2.50 2.50 2.50 2.50
Number OPR 7 8 8 7 7 6
Mean OPR 2.1388 11.8393 2.4726 2.5542 2.4740 2.5373
Standard
Deviation of
Mean
0.03685 0.208999 0.06118 0.116486 0.015445 0.011914
Relative
Standard
Deviation (%)
1.7233 1.7653 2.4744 4.5606 0.6243 0.4696
Mean Recovery
(%) 106.4065 98.6610 98.9035 102.1674 98.9600 101.4913
*Lab 2 Cd-R - 1 OPR greater than 110%

Table 7
Minimum Detection Limit
Abbreviations: DA, Discrete Analyzer; FIA, Flow Injection Analyzer
Lab 1 Lab 2 Lab 3
NaR-R Cd-R NaR-R Cd-R NaR-R Cd-R
Analytical
Equipment DA DA DA DA FIA FIA
Spike
mg Nitrate-N/L 0.050 0.050 0.025 0.020 0.010 0.025
MDL
mg Nitrate-N/L 0.0097 0.03436 0.006507 0.006694 0.009429 0.006507
Ratio
Spike/MDL 5.1453 1.4553 3.8422 2.9877 1.0606 3.8422

Table 8
See attached PDF
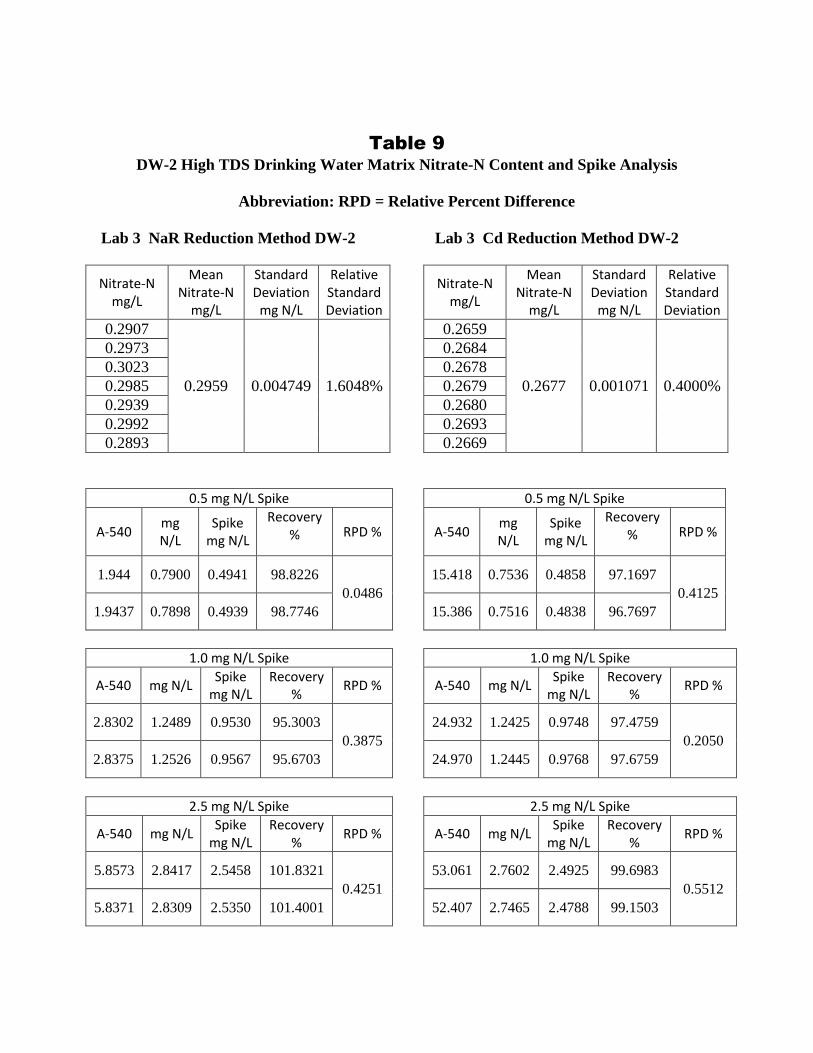
Table 9
DW-2 High TDS Drinking Water Matrix Nitrate-N Content and Spike Analysis
Abbreviation: RPD = Relative Percent Difference
Lab 3 NaR Reduction Method DW-2
Nitrate-N mg/L
Mean Nitrate-N
mg/L
Standard Deviation
mg N/L
Relative Standard Deviation
0.2907
0.2959 0.004749 1.6048%
0.2973
0.3023
0.2985
0.2939
0.2992
0.2893
0.5 mg N/L Spike
A-540 mg N/L
Spike mg N/L
Recovery % RPD %
1.944 0.7900 0.4941 98.8226
0.0486
1.9437 0.7898 0.4939 98.7746
1.0 mg N/L Spike
A-540 mg N/L Spike
mg N/L Recovery
% RPD %
2.8302 1.2489 0.9530 95.3003
0.3875
2.8375 1.2526 0.9567 95.6703
2.5 mg N/L Spike
A-540 mg N/L Spike
mg N/L Recovery
% RPD %
5.8573 2.8417 2.5458 101.8321
0.4251
5.8371 2.8309 2.5350 101.4001
Lab 3 Cd Reduction Method DW-2
Nitrate-N mg/L
Mean Nitrate-N
mg/L
Standard Deviation
mg N/L
Relative Standard Deviation
0.2659
0.2677 0.001071 0.4000%
0.2684
0.2678
0.2679
0.2680
0.2693
0.2669
0.5 mg N/L Spike
A-540 mg N/L
Spike mg N/L
Recovery % RPD %
15.418 0.7536 0.4858 97.1697
0.4125
15.386 0.7516 0.4838 96.7697
1.0 mg N/L Spike
A-540 mg N/L Spike
mg N/L Recovery
% RPD %
24.932 1.2425 0.9748 97.4759
0.2050
24.970 1.2445 0.9768 97.6759
2.5 mg N/L Spike
A-540 mg N/L Spike
mg N/L Recovery
% RPD %
53.061 2.7602 2.4925 99.6983
0.5512
52.407 2.7465 2.4788 99.1503
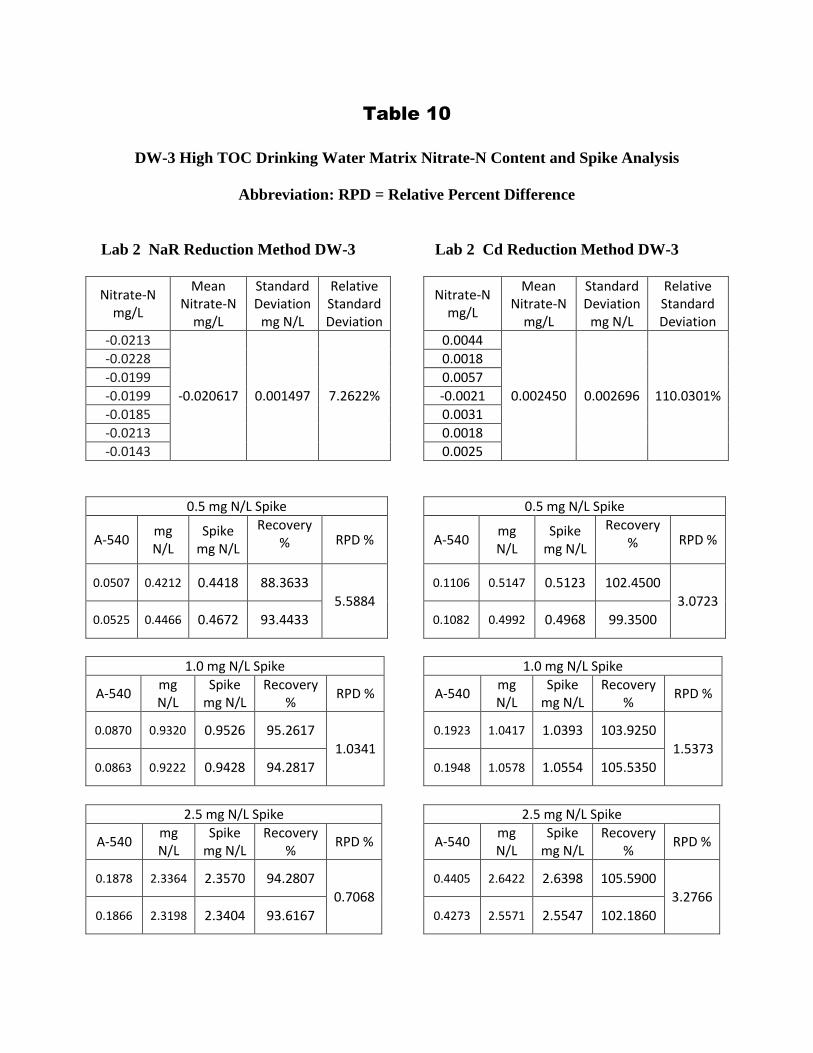
Table 10
DW-3 High TOC Drinking Water Matrix Nitrate-N Content and Spike Analysis
Abbreviation: RPD = Relative Percent Difference
Lab 2 NaR Reduction Method DW-3
Nitrate-N mg/L
Mean Nitrate-N
mg/L
Standard Deviation
mg N/L
Relative Standard Deviation
-0.0213
-0.020617 0.001497 7.2622%
-0.0228
-0.0199
-0.0199
-0.0185
-0.0213
-0.0143
0.5 mg N/L Spike
A-540 mg N/L
Spike mg N/L
Recovery % RPD %
0.0507 0.4212 0.4418 88.3633
5.5884 0.0525 0.4466 0.4672 93.4433
1.0 mg N/L Spike
A-540 mg N/L
Spike mg N/L
Recovery %
RPD %
0.0870 0.9320 0.9526 95.2617
1.0341
0.0863 0.9222 0.9428 94.2817
2.5 mg N/L Spike
A-540 mg N/L
Spike mg N/L
Recovery %
RPD %
0.1878 2.3364 2.3570 94.2807
0.7068
0.1866 2.3198 2.3404 93.6167
Lab 2 Cd Reduction Method DW-3
Nitrate-N mg/L
Mean Nitrate-N
mg/L
Standard Deviation
mg N/L
Relative Standard Deviation
0.0044
0.002450 0.002696 110.0301%
0.0018
0.0057
-0.0021
0.0031
0.0018
0.0025
0.5 mg N/L Spike
A-540 mg N/L
Spike mg N/L
Recovery % RPD %
0.1106 0.5147 0.5123 102.4500
3.0723 0.1082 0.4992 0.4968 99.3500
1.0 mg N/L Spike
A-540 mg N/L
Spike mg N/L
Recovery %
RPD %
0.1923 1.0417 1.0393 103.9250
1.5373
0.1948 1.0578 1.0554 105.5350
2.5 mg N/L Spike
A-540 mg N/L
Spike mg N/L
Recovery %
RPD %
0.4405 2.6422 2.6398 105.5900
3.2766
0.4273 2.5571 2.5547 102.1860
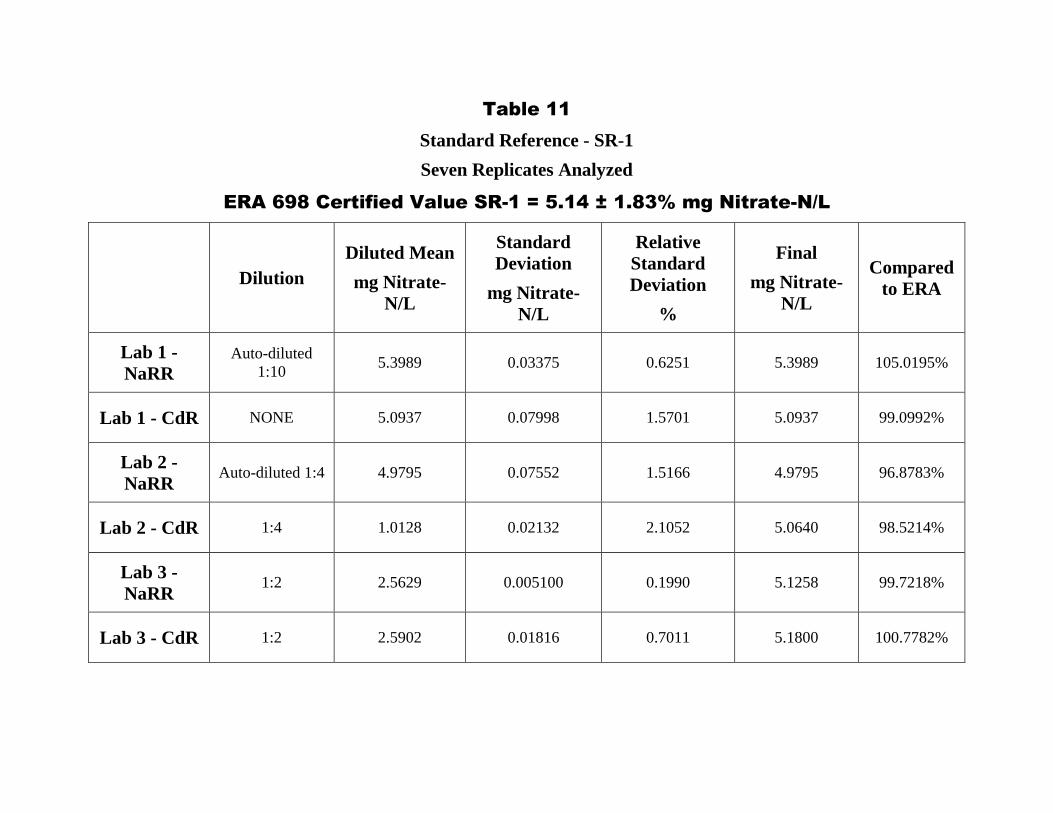
Table 11
Standard Reference - SR-1
Seven Replicates Analyzed
ERA 698 Certified Value SR-1 = 5.14 ± 1.83% mg Nitrate-N/L
Dilution
Diluted Mean
mg Nitrate-
N/L
Standard
Deviation
mg Nitrate-
N/L
Relative
Standard
Deviation
%
Final
mg Nitrate-
N/L
Compared
to ERA
Lab 1 -
NaRR
Auto-diluted
1:10 5.3989 0.03375 0.6251 5.3989 105.0195%
Lab 1 - CdR NONE 5.0937 0.07998 1.5701 5.0937 99.0992%
Lab 2 -
NaRR Auto-diluted 1:4 4.9795 0.07552 1.5166 4.9795 96.8783%
Lab 2 - CdR 1:4 1.0128 0.02132 2.1052 5.0640 98.5214%
Lab 3 -
NaRR 1:2 2.5629 0.005100 0.1990 5.1258 99.7218%
Lab 3 - CdR 1:2 2.5902 0.01816 0.7011 5.1800 100.7782%