Embed Size (px)
Citation preview
_______________________________________________________________________________________ Digby Wells and Associates (South Africa) (Pty) Ltd Co. Reg. No. 2010/008577/07. Turnberry Office Park, 48 Grosvenor Road, Bryanston, 2191. Private Bag X10046, Randburg, 2125, South Africa Tel: +27 11 789 9495, Fax: +27 11 069 6801, [email protected], www.digbywells.com _______________________________________________________________________________________ Directors: GE Trusler (C.E.O), GB Beringer, LF Koeslag, J Leaver (Chairman)*, NA Mehlomakulu*, DJ Otto *Non-Executive _______________________________________________________________________________________
Environmental Regulatory
Process Required to Amend and
Consolidate the Sigma Colliery:
Mooikraal Environmental
Management Programme Report,
Sasolburg, Free State
Social Baseline Profile
Project Number:
SAS5175
Prepared for:
Sasol Mining (Pty) Ltd
November 2018
Digby Wells Environmental i
This document has been prepared by Digby Wells Environmental.
Report Type: Social Baseline Profile
Project Name:
Environmental Regulatory Process Required to Amend and
Consolidate the Sigma Colliery: Mooikraal Environmental
Management Programme Report, Sasolburg, Free State
Project Code: SAS5175
Name Responsibility Signature Date
Nonka Byker Report compiler
November 2018
Barbara Wessels Report reviewer
November 2018
This report is provided solely for the purposes set out in it and may not, in whole or in part, be used for any other purpose
without Digby Wells Environmental prior written consent.
Social Baseline Profile
Environmental Regulatory Process Required to Amend and Consolidate the Sigma Colliery: Mooikraal Environmental Management Programme Report, Sasolburg, Free State
SAS5175
Digby Wells Environmental ii
TABLE OF CONTENTS
1 Introduction ....................................................................................................................... 1
1.1 Project Description .................................................................................................. 1
2 Methodology...................................................................................................................... 4
2.1 Definition of the study areas .................................................................................... 4
2.2 Data collection ......................................................................................................... 5
2.3 Compilation of a socio-economic baseline profile .................................................... 5
3 Socio-Economic Baseline Profile ...................................................................................... 6
3.1 Regional study area ................................................................................................ 6
3.1.1 Fezile Dabi District Municipality ........................................................................ 6
3.1.2 Metsimaholo Local Municipality ........................................................................ 6
3.1.3 Ngwathe Local Municipality .............................................................................. 7
3.2 Local Study Area ..................................................................................................... 8
3.2.1 Population size, growth rate and migration ..................................................... 10
3.2.2 Demographic characteristics .......................................................................... 11
3.2.3 Education ....................................................................................................... 11
3.2.4 Employment and income ................................................................................ 12
3.2.5 Access to services .......................................................................................... 14
3.3 Site-specific study area ......................................................................................... 15
3.3.1 Population size, growth rate and migration ..................................................... 17
3.3.2 Demographic characteristics .......................................................................... 17
3.3.3 Education ....................................................................................................... 18
3.3.4 Employment and income ................................................................................ 18
3.3.5 Access to services .......................................................................................... 20
4 Conclusions ..................................................................................................................... 21
5 References ...................................................................................................................... 24
Social Baseline Profile
Environmental Regulatory Process Required to Amend and Consolidate the Sigma Colliery: Mooikraal Environmental Management Programme Report, Sasolburg, Free State
SAS5175
Digby Wells Environmental iii
LIST OF FIGURES
Figure 3-1: Overview of local study area ............................................................................... 9
Figure 3-2: Education profile of the local study area ............................................................ 12
Figure 3-3: Employment profile of the local study area ........................................................ 13
Figure 3-4: Annual household income profile of the local study area ................................... 14
Figure 3-5: Overview of services in the local study area ...................................................... 15
Figure 3-6: Overview of site-specific study area .................................................................. 16
Figure 3-7: Education profile of the site-specific study area................................................. 18
Figure 3-8: Employment profile of the site-specific study area ............................................. 19
Figure 3-9: Annual household income profile of the site-specific study area ........................ 20
Figure 3-10: Overview of municipal services in the site-specific study area ......................... 21
LIST OF TABLES
Table 3-1: Population size and distribution in the local study area ...................................... 10
Table 3-2: Population size and distribution per ward in the local study area ........................ 10
Table 3-3: Population group distribution in the local study area ........................................... 11
Table 3-4: Population size and distribution per ward in the site-specific study area ............. 17
Table 3-5: Population group distribution in the site-specific study area ............................... 17
Table 4-1: Summary of the socio-economic baseline profile ................................................ 22
Social Baseline Profile
Environmental Regulatory Process Required to Amend and Consolidate the Sigma Colliery: Mooikraal Environmental Management Programme Report, Sasolburg, Free State
SAS5175
Digby Wells Environmental 1
1 Introduction
The Sasol Mining (Pty) Ltd (Sasol Mining), Sigma Colliery, Mooikraal consists of two
components, the operational shaft “Mooikraal” (hereafter referred to as Mooikraal) and the
coal handling facility “3 Shaft Complex” (hereafter referred to as 3 Shaft).
Mooikraal is an operational underground coal mine located near Sasolburg. It currently
operates under a consolidated Mining Right (Reference No. FS 30/5/1/2/2/2/1/221) and
approved amended Environmental Management Programme (EMP) (Reference No.
30/5/1/2/3/2/1 (221) EM) granted in April 2016. The authorisation permits the undertaking of
various activities associated with the underground coal mining operation.
Mooikraal also holds a separate approved Environmental Authorisation (EA) (Reference No.
EMB/28/14/43 dated 09 March 2015) for 10 and 7 Ml/day (Ml/day) water transfer pipelines.
The 7 Ml/day pipeline authorises the transport of water from the Kleinvlei Ventilation Shaft
and the 10 Ml/day pipeline is authorised to transport water from the Mooikraal Pollution
Control Dam (PCD) to the Sasolburg Operations.
Mooikraal is now proposing to reconfigure and relocate the conveyer belt series and existing
crusher facility currently located at the 3 Shaft primary plant area. In addition Mooikraal also
wishes to amend and consolidate the approved Mooikraal EMPr to include all activities and
properties associated with the proposed operations. An environmental regulatory process is
thus required to obtain the necessary EA and associated approvals.
Through this environmental authorisation process, it is intended that the following will be
undertaken:
■ Listed Activities now triggered in terms of the Environmental Impact Assessment (EIA)
Regulations 2014 (as amended) (Government Notice No. R. 982 of 4 December 2014
as amended by Government Notice No. R.326 of 7 April 2017) referred to hereinafter
as the EIA regulations, 2014 (as amended) promulgated under the National
Environmental Management Act, 1998 (Act No. 107 of 1998) (NEMA) will be applied
for; and
■ Incorporate all activities at the Mooikraal and 3 Shaft operations into an amended
EMPr so as to ensure that all activities are lawfully executed.
*This report is limited to an updated baseline profile for the surrounding socio-economic
environment. It does not include a detailed impact assessment or any mitigation measures.
1.1 Project Description
Mooikraal is located approximately 18 kilometres (km) from the Sigma Defunct Colliery and
18 km southwest of Sasolburg in the Fezile Dabi District Municipality, Free State Province.
The mine began operation in 2005 and has a Life of Mine (LoM) of 34 years until 2039.
Social Baseline Profile
Environmental Regulatory Process Required to Amend and Consolidate the Sigma Colliery: Mooikraal Environmental Management Programme Report, Sasolburg, Free State
SAS5175
Digby Wells Environmental 2
Mooikraal is extracting coal utilising the underground bord and pillar mining method,
however in some areas high extraction mining is taking place. The coal is transported via a
conveyor belt underground and brought to surface via an incline/ decline shaft which is also
used to enter the mine. The coal is then stored in a silo. Subsequently the coal is conveyed
via an 18 km conveyor belt (MK3 – KM8 Belt) from Mooikraal to 3 Shaft where the coal is
crushed, screened and then stockpiled before it is transported to Sasolburg Operations for
further use.
The following infrastructure is currently present at Mooikraal:
■ Incline shaft, coal silo and emergency coal throw out area;
■ Ventilation Shaft (Kleinvlei Shaft and various downcasts);
■ PCDs;
■ Three sumps (wash bay, fuel storage, shaft);
■ Clean and dirty water channels;
■ Explosive magazine;
■ Material and equipment storage area;
■ Soil stockpiles;
■ Waste Rock Dump (WRD);
■ Sewage Treatment Plant (STP);
■ Waste storage area / ISO Yard;
■ Workshops, warehouses and wash bay;
■ Bulk fuel and oil storage area;
■ Chemical storage area;
■ Electricity supply structures including pylons, transformers and bunds, cabling;
■ Boreholes (rescue and water monitoring);
■ Access roads;
■ Box-cut material storage area;
■ Dust suppression storage area and bund;
■ Borrow pits;
■ Coal conveyor belt and associated infrastructure such as transfer stations;
■ 10 Ml pipeline from Mooikraal to Sasolburg Operations;
■ 7 Ml pipeline from Kleinvlei Shaft to Sasolburg Operations; and
Social Baseline Profile
Environmental Regulatory Process Required to Amend and Consolidate the Sigma Colliery: Mooikraal Environmental Management Programme Report, Sasolburg, Free State
SAS5175
Digby Wells Environmental 3
■ Administration buildings and change houses.
The following infrastructure is present at 3 Shaft:
■ Primary plant area (including a crusher facility), stockpile area (including stacker
reclaimer for Run of Mine (ROM) and imported coal)
■ 4 Shaft coal bunker;
■ Coal conveyor belt;
■ Haul roads for imported coal truck transport ;
■ Bulk fuel and oil storage area and workshops;
■ Waste storage area;
■ Weighbridge;
■ Contractors storage yard;
■ Workshops (diesel and boiler);
■ Chemical storage area;
■ Administration buildings and change houses;
■ Pipelines;
■ Dirty water storage dam; and
■ Old dams currently not in use and proposed to be demolished.
The following activities are proposed to be undertaken as part of this project:
■ Demolition of the existing conveyor belt, crushing facility and coal bunker which is
currently situated within a wetland at the 3 Shaft (primary plant);
■ Relocation/reconstruction the primary plant (crusher facility) to the concreted
stockpile area (to remain within the 3 Shaft footprint);
■ Installing a conveyor belt from the MK8 transfer point to the stockpile area which will
traverse a delineated wetland (within the 3 Shaft footprint);
■ Proposed upgrade of the storm water management system at 3 Shaft;
■ Rehabilitation of the existing wetland at 3 Shaft;
■ Drilling of exploration, monitoring and rescue boreholes within the approved
Mooikraal Mining Right area and 3 Shaft;
■ Incorporate all activities at Mooikraal, Kleinvlei, 3 Shaft and along both servitudes
into the EMPr;
■ Incorporate the 7 and 10 Ml/day pipeline EA into the EMPr; and
Social Baseline Profile
Environmental Regulatory Process Required to Amend and Consolidate the Sigma Colliery: Mooikraal Environmental Management Programme Report, Sasolburg, Free State
SAS5175
Digby Wells Environmental 4
■ Incorporate all properties located within Mooikraal, Kleinvlei, 3 Shaft and along both
servitudes into the EMPr.
2 Methodology
The activities undertaken as part of the compilation of this baseline profile are outlined
below.
2.1 Definition of the study areas
Study areas were defined based on the type of risks and impacts each area is expected to
experience as a result of the proposed project. The social risks and impacts of a project can
be divided into three broad categories, as follows:
■ Impacts related to the physical intrusion of project infrastructure and project-
related activities on the surrounding environment;
■ Impacts related to the economic pull of a Project, which occurs when a Project
exerts changes on job creation, in-migration of workers and job-seekers, multiplier
effects in the local and regional economy – all of which can lead to an increased risk
of social pathologies and community conflict. These impacts can typically be
expected in settlements and towns closest to the Project; and
■ Indirect or induced risks and impacts that are by-products or ripple-effects of the
risks and impacts in the foregoing two categories. These could include increased
pressure on local services and resources (as a result of population influx), multiplier
effects in the local and regional economy (as a result of the creation of new jobs and
project-related expenditure), macroeconomic benefits of the project and benefits
derived from corporate social investment by the project proponent.
Accordingly, three concentric study areas were defined for the purposes of this study,
corresponding to the three categories of impacts listed above. The study areas are as
follows:
■ The regional study area – the area likely to experience the indirect or induced
impacts of the project. This area is defined as the Fezile Dabi District Municipality
(FDDM), the Ngwathe Local Municipality (NLM) and Metsimaholo Local Municipality
(MLM).
■ The local study area – the area likely to experience impacts related to the
“economic pull” exerted by the project. This area is defined as the areas adjacent to
project infrastructure, namely (a) Sasolburg, located directly adjacent the site-specific
study area and made up of Metsimaholo Wards 15, 16 and 17, and (b) Zamdela, a
lower-income residential area just south of Sasolburg, made up of Metsimaholo
Wards 2, 6, 8, 9, 10, 12, 13 and 21 (Wards 7 and 19 have been excluded – the
former is mostly made up of an industrial zone, while the latter consists mostly of
Social Baseline Profile
Environmental Regulatory Process Required to Amend and Consolidate the Sigma Colliery: Mooikraal Environmental Management Programme Report, Sasolburg, Free State
SAS5175
Digby Wells Environmental 5
agricultural land. The inclusion of these wards would skew the residential data for the
other wards by, for example, enlarging the geographical area).
■ The site-specific study area – the area likely to experience impacts related to the
physical intrusion by project infrastructure and project-related activities. This study
area is defined as the municipal wards in which the proposed project infrastructure is
located, namely Ngwathe Ward 7 and Metsimaholo Wards 1, 11 and 14.
2.2 Data collection
The information presented in this document was obtained through a desktop review of
available documents to obtain relevant baseline socio-economic information on the different
study areas. Documents reviewed include the following:
■ Integrated Development Plans (IDPs) of the local and district municipalities;
■ Census 2011 data, reworked according to the new 2016 municipal ward boundary
delineations;
■ Community Survey 2016 data;
■ Previous reports concerning the same project area, specifically the Social
Assessment for the proposed Sigma Colliery Ash Backfilling Project completed by
Digby Wells in 2013; and
■ Available maps and satellite imagery.
2.3 Compilation of a socio-economic baseline profile
On the basis of the information collected through the desktop review, a socio-economic
baseline profile was compiled of the study areas defined in Section 2.1. Topics considered
as part of this profile include the following:
■ Population size, growth rate and migration;
■ Demographic characteristics;
■ Education;
■ Employment and income; and
■ Access to services.
Social Baseline Profile
Environmental Regulatory Process Required to Amend and Consolidate the Sigma Colliery: Mooikraal Environmental Management Programme Report, Sasolburg, Free State
SAS5175
Digby Wells Environmental 6
3 Socio-Economic Baseline Profile
3.1 Regional study area
3 Shaft and large parts of the conveyor belt are located in the MLM, whereas Mooikraal and
a small portion of the conveyor belt are located in the NLM. Both these municipalities form
part of the FDDM.
3.1.1 Fezile Dabi District Municipality
The FDDM is one of five district municipalities in the Free State Province; its neighbouring
municipalities include Sedibeng (Gauteng), Gert Sibande (Mpumalanga), Dr Kenneth
Kaunda (North West), Lejweleputswa (Free State) and Thabo Mofutsanyane (Free State).
Fezile Dabi covers an area of about 20 900 km2 and has a population of approximately 500
000 people (just less than a fifth of the Free State province’s total population) resident in 38
different settlements, four of which are farming settlements, 15 formal urban towns, 17 urban
townships and two informal urban settlements.
The FDDM is not only home to the Sasol Ltd. group, but also produces a large percentage of
South Africa’s grain crops including maize, wheat and sunflowers. This area’s climate is
ideal for cultivation and supports its rich biodiversity. The district municipality is a major
tourist destination as it plays host to South Africa’s 7th World Heritage Site, the Vredefort
Dome, the world’s largest and oldest meteorite crater. It also boasts with an array of nature
reserves and the Vaal Dam, which is a main source of water (FDDM IDP, 2017-2022).
The FDDM consists of four local category B municipalities namely Moqhaka, Ngwathe,
Metsimaholo and Mafube. As previously indicated, parts of the Project is located along the
outskirts of Sasolburg in the MLM, the smallest local municipality in the FDDM.
3.1.2 Metsimaholo Local Municipality
The MLM is located in the north-eastern quadrant of the FDDM and at 1 720 km2, is the
smallest geographical area of the district. In 2016, it was home to 163 564 people – a slight
increase over 2011’s population of 149 107 people (this represents an average increase of
around 2 900 people per annum, or an annual population growth rate of approximately
1.9%). The population density is fairly low at 86.7 people per km2, which is typical of a rural
area (although it can be expected that the population density will be higher in towns, such as
Sasolburg). Based on the calculated population growth rate of 1.9% per annum, the 2018
population size is an estimated 169 779 people.
Sasolburg is the most prominent contributor to the local municipality’s economy and is the
only town in the district where the private sector dominates the public sector, due to the
predominant contribution Sasol makes to the chemical industry. As this town is located in the
heart of worldly renowned coalfield, the Vereeniging-Sasolburg Coalfield, the economy is
Social Baseline Profile
Environmental Regulatory Process Required to Amend and Consolidate the Sigma Colliery: Mooikraal Environmental Management Programme Report, Sasolburg, Free State
SAS5175
Digby Wells Environmental 7
also supported by the manufacturing of a vast range of by-products, namely fuels, olefins,
waxes, alcohols, tar products, inorganic chemicals, rubber, gases, plastics, fertilizers, etc.
Migration into the municipality is focused towards Sasolburg, Deneysville and Oranjeville
(including their lower income residential areas) - presumably due to the existing mining
activities and the proximity of these areas to retail, factory, and industrial work opportunities.
The migrant population consist of mostly unemployed job-seekers from rural areas in the
MLM and neighbouring municipalities. People are also moving from smaller towns in the
district into Sasolburg.1
Coalfields are regarded as the dominant economic potential for the Sasolburg and Zamdela
area, whereas agriculture is more dominant in the Oranjeville/Metsimaholo and rural areas of
the municipality (MLM IDP, 2016/17).
3.1.3 Ngwathe Local Municipality
The NLM is situated in the northern part of the FDDM. It covers a geographical area of 7 066
km2 and in 2016, was home to 118 906 people. This represents a negative population
growth rate of around -0.3% per annum from the population size recorded in the 2011
Census, which was 120 521 people. If this negative population growth rate continued, the
current day (2018) population size would be an estimated 118 193 people.
The NLM is largely rural in nature, which is evident in the population density of around 17
people per km2. Major towns in the NLM include Parys, Heilbron, Koppies, Vredefort and
Edenville.
Parys is located some 27 km west of the Mooikraal colliery and is the closest town within the
NLM to any of the Project infrastructure. Parys is located on the banks of the Vaal Rivier, in
close proximity to the Vredefort Dome World Heritage site, Gauteng (Johannesburg) and the
Northwest (Potchefstroom), which makes it an ideal tourist destination.
The local economy of the NLM have grown at roughly the same rate of the province, at
around 3.2% per annum. Key sectors within the NLM include trade and catering, finance and
business services, manufacturing, construction, government services and transport. The
economic sectors employing the largest number of people are trade and catering,
community services, agriculture, government and construction services (NLM IDP, 2017-
2022). People in general are still fairly disconnected from economic opportunities – this is
due to the geographic layout of the municipality and the subsequent lack of transport.
1 Metsimaholo Local Municipality. (2012). Spatial Development Framework: 2012 / 2013 (newer SDF not yet
available).
Social Baseline Profile
Environmental Regulatory Process Required to Amend and Consolidate the Sigma Colliery: Mooikraal Environmental Management Programme Report, Sasolburg, Free State
SAS5175
Digby Wells Environmental 8
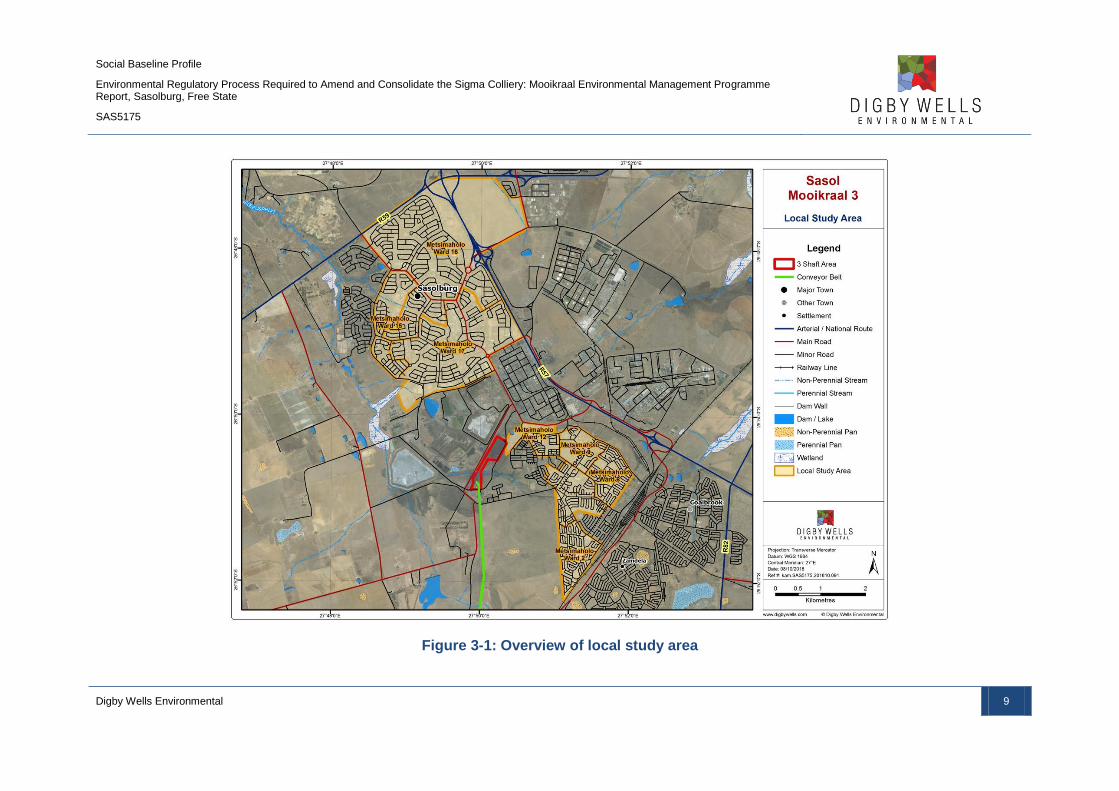
3.2 Local Study Area
As mentioned previously, the local study area is defined as Sasolburg (MLM Wards 15, 16
and 17)2, and Zamdela (MLM Wards 2, 8, 9, 10, and 12) - see Figure 3-1 for an overview of
the local study area. The wards have been combined for each area (i.e. Sasolburg and
Zamdela) in the discussions that follow, to give an integrated overview of the area.
2 MLM Ward 7 has been excluded from the baseline profile as it is an industrial zone – the inclusion of this ward
data could skew the residential data of the other wards.
Social Baseline Profile
Environmental Regulatory Process Required to Amend and Consolidate the Sigma Colliery: Mooikraal Environmental Management Programme Report, Sasolburg, Free State
SAS5175
Digby Wells Environmental 9
Figure 3-1: Overview of local study area
Social Baseline Profile
Environmental Regulatory Process Required to Amend and Consolidate the Sigma Colliery: Mooikraal Environmental Management Programme Report, Sasolburg, Free State
SAS5175
Digby Wells Environmental 10
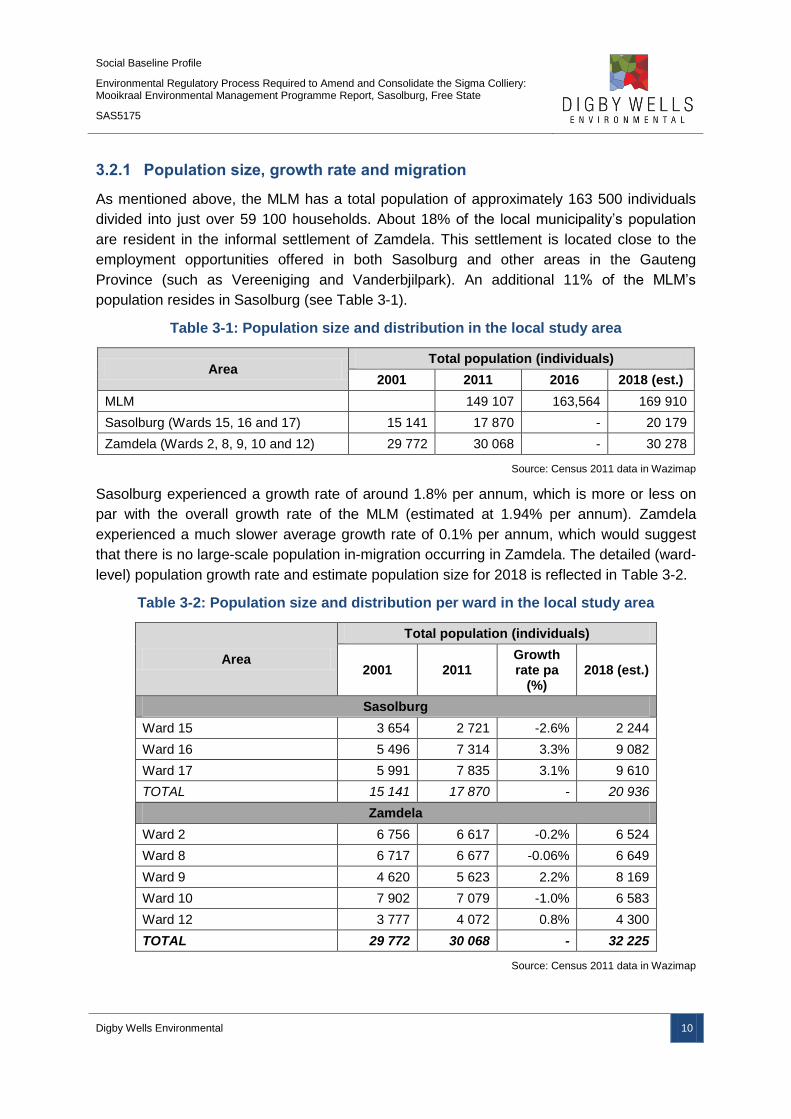
3.2.1 Population size, growth rate and migration
As mentioned above, the MLM has a total population of approximately 163 500 individuals
divided into just over 59 100 households. About 18% of the local municipality’s population
are resident in the informal settlement of Zamdela. This settlement is located close to the
employment opportunities offered in both Sasolburg and other areas in the Gauteng
Province (such as Vereeniging and Vanderbjilpark). An additional 11% of the MLM’s
population resides in Sasolburg (see Table 3-1).
Table 3-1: Population size and distribution in the local study area
Area Total population (individuals)
2001 2011 2016 2018 (est.)
MLM 149 107 163,564 169 910
Sasolburg (Wards 15, 16 and 17) 15 141 17 870 - 20 179
Zamdela (Wards 2, 8, 9, 10 and 12) 29 772 30 068 - 30 278
Source: Census 2011 data in Wazimap
Sasolburg experienced a growth rate of around 1.8% per annum, which is more or less on
par with the overall growth rate of the MLM (estimated at 1.94% per annum). Zamdela
experienced a much slower average growth rate of 0.1% per annum, which would suggest
that there is no large-scale population in-migration occurring in Zamdela. The detailed (ward-
level) population growth rate and estimate population size for 2018 is reflected in Table 3-2.
Table 3-2: Population size and distribution per ward in the local study area
Area
Total population (individuals)
2001 2011 Growth rate pa
(%) 2018 (est.)
Sasolburg
Ward 15 3 654 2 721 -2.6% 2 244
Ward 16 5 496 7 314 3.3% 9 082
Ward 17 5 991 7 835 3.1% 9 610
TOTAL 15 141 17 870 - 20 936
Zamdela
Ward 2 6 756 6 617 -0.2% 6 524
Ward 8 6 717 6 677 -0.06% 6 649
Ward 9 4 620 5 623 2.2% 8 169
Ward 10 7 902 7 079 -1.0% 6 583
Ward 12 3 777 4 072 0.8% 4 300
TOTAL 29 772 30 068 - 32 225
Source: Census 2011 data in Wazimap
Social Baseline Profile
Environmental Regulatory Process Required to Amend and Consolidate the Sigma Colliery: Mooikraal Environmental Management Programme Report, Sasolburg, Free State
SAS5175
Digby Wells Environmental 11
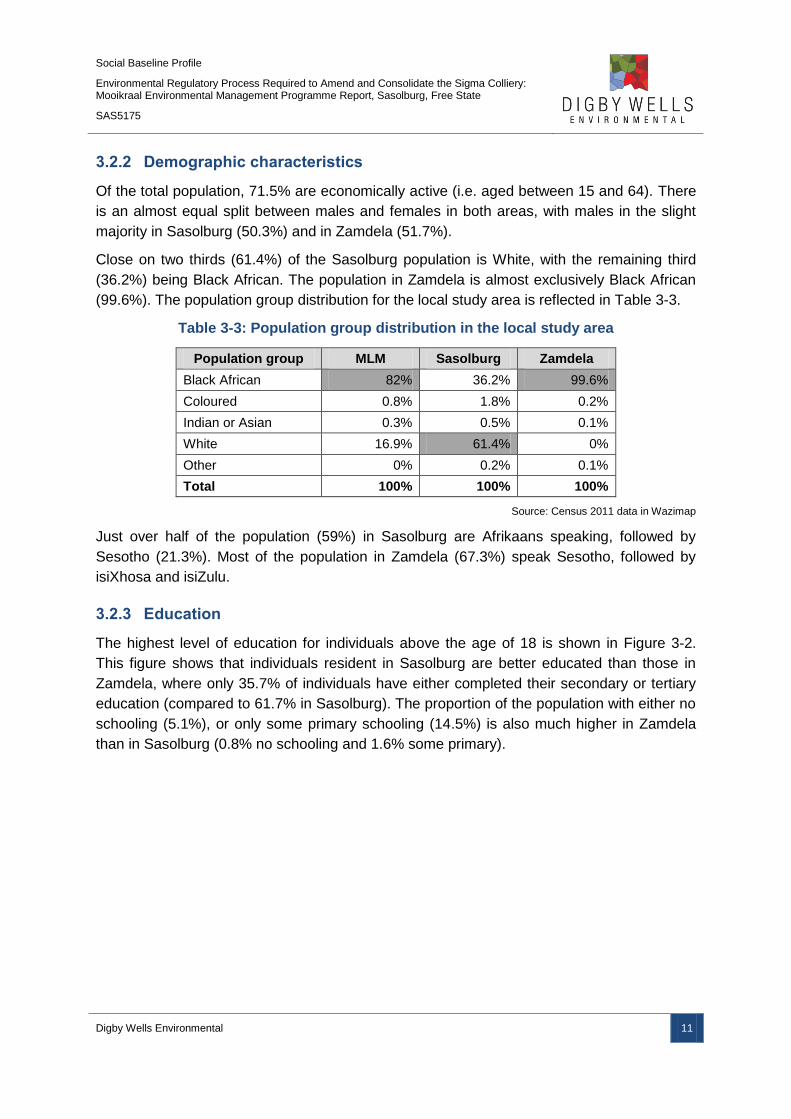
3.2.2 Demographic characteristics
Of the total population, 71.5% are economically active (i.e. aged between 15 and 64). There
is an almost equal split between males and females in both areas, with males in the slight
majority in Sasolburg (50.3%) and in Zamdela (51.7%).
Close on two thirds (61.4%) of the Sasolburg population is White, with the remaining third
(36.2%) being Black African. The population in Zamdela is almost exclusively Black African
(99.6%). The population group distribution for the local study area is reflected in Table 3-3.
Table 3-3: Population group distribution in the local study area
Population group MLM Sasolburg Zamdela
Black African 82% 36.2% 99.6%
Coloured 0.8% 1.8% 0.2%
Indian or Asian 0.3% 0.5% 0.1%
White 16.9% 61.4% 0%
Other 0% 0.2% 0.1%
Total 100% 100% 100%
Source: Census 2011 data in Wazimap
Just over half of the population (59%) in Sasolburg are Afrikaans speaking, followed by
Sesotho (21.3%). Most of the population in Zamdela (67.3%) speak Sesotho, followed by
isiXhosa and isiZulu.
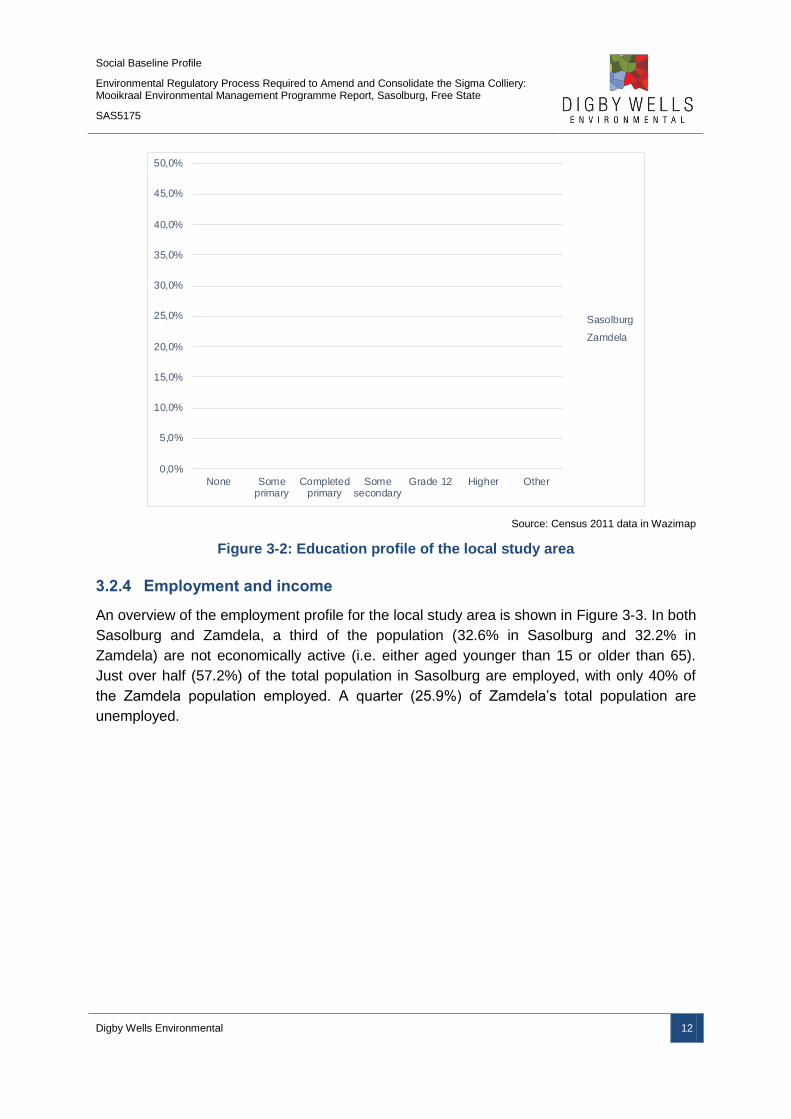
3.2.3 Education
The highest level of education for individuals above the age of 18 is shown in Figure 3-2.
This figure shows that individuals resident in Sasolburg are better educated than those in
Zamdela, where only 35.7% of individuals have either completed their secondary or tertiary
education (compared to 61.7% in Sasolburg). The proportion of the population with either no
schooling (5.1%), or only some primary schooling (14.5%) is also much higher in Zamdela
than in Sasolburg (0.8% no schooling and 1.6% some primary).
Social Baseline Profile
Environmental Regulatory Process Required to Amend and Consolidate the Sigma Colliery: Mooikraal Environmental Management Programme Report, Sasolburg, Free State
SAS5175
Digby Wells Environmental 12
Source: Census 2011 data in Wazimap
Figure 3-2: Education profile of the local study area
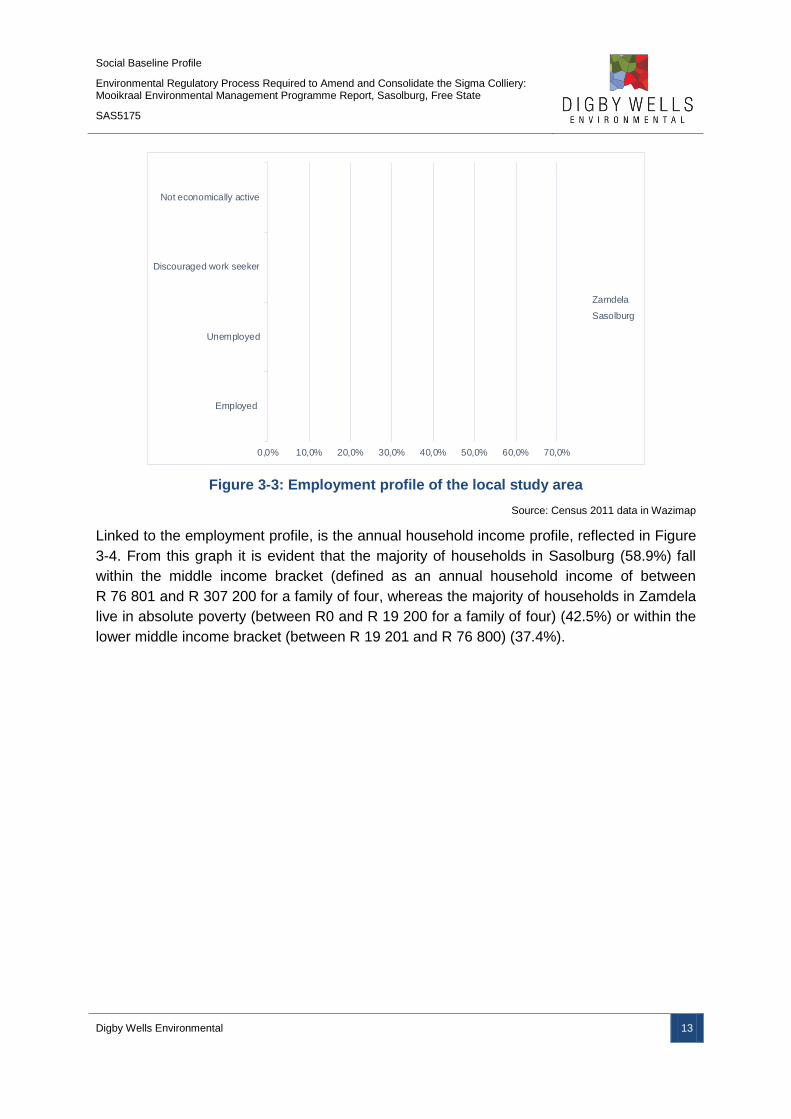
3.2.4 Employment and income
An overview of the employment profile for the local study area is shown in Figure 3-3. In both
Sasolburg and Zamdela, a third of the population (32.6% in Sasolburg and 32.2% in
Zamdela) are not economically active (i.e. either aged younger than 15 or older than 65).
Just over half (57.2%) of the total population in Sasolburg are employed, with only 40% of
the Zamdela population employed. A quarter (25.9%) of Zamdela’s total population are
unemployed.
0,0%
5,0%
10,0%
15,0%
20,0%
25,0%
30,0%
35,0%
40,0%
45,0%
50,0%
None Someprimary
Completedprimary
Somesecondary
Grade 12 Higher Other
Sasolburg
Zamdela
Social Baseline Profile
Environmental Regulatory Process Required to Amend and Consolidate the Sigma Colliery: Mooikraal Environmental Management Programme Report, Sasolburg, Free State
SAS5175
Digby Wells Environmental 13
Figure 3-3: Employment profile of the local study area
Source: Census 2011 data in Wazimap
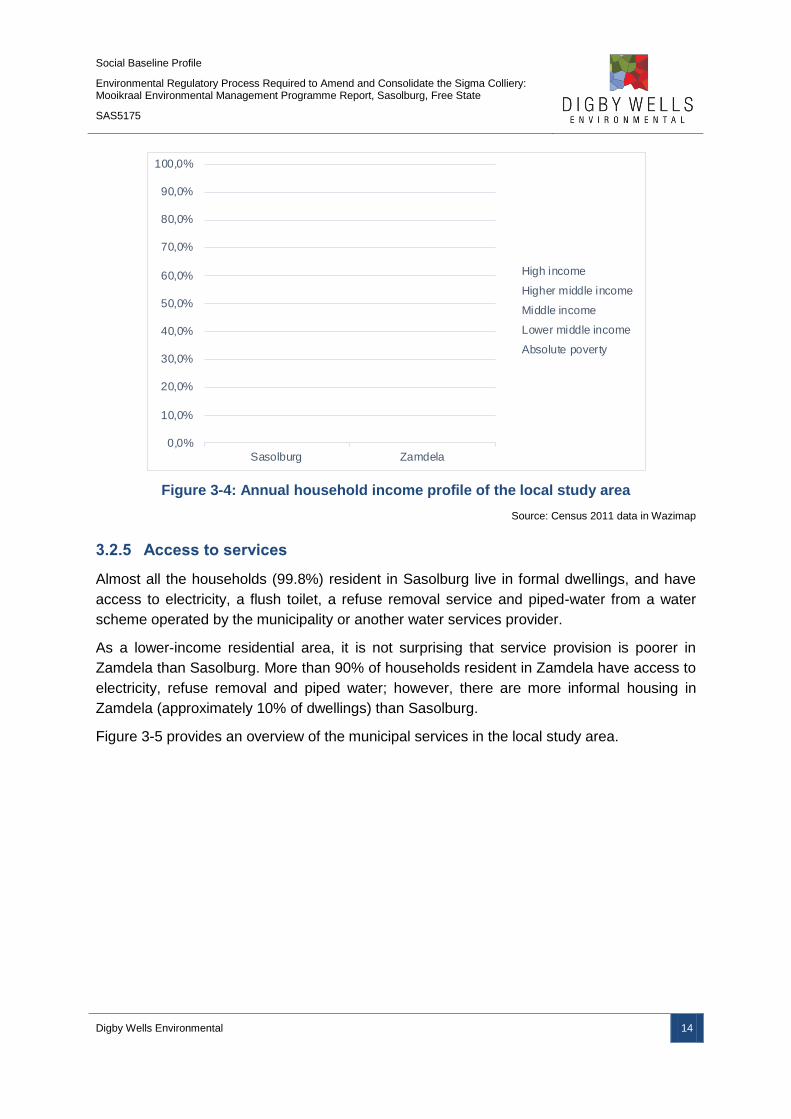
Linked to the employment profile, is the annual household income profile, reflected in Figure
3-4. From this graph it is evident that the majority of households in Sasolburg (58.9%) fall
within the middle income bracket (defined as an annual household income of between
R 76 801 and R 307 200 for a family of four, whereas the majority of households in Zamdela
live in absolute poverty (between R0 and R 19 200 for a family of four) (42.5%) or within the
lower middle income bracket (between R 19 201 and R 76 800) (37.4%).
0,0% 10,0% 20,0% 30,0% 40,0% 50,0% 60,0% 70,0%
Employed
Unemployed
Discouraged work seeker
Not economically active
Zamdela
Sasolburg
Social Baseline Profile
Environmental Regulatory Process Required to Amend and Consolidate the Sigma Colliery: Mooikraal Environmental Management Programme Report, Sasolburg, Free State
SAS5175
Digby Wells Environmental 14
Figure 3-4: Annual household income profile of the local study area
Source: Census 2011 data in Wazimap
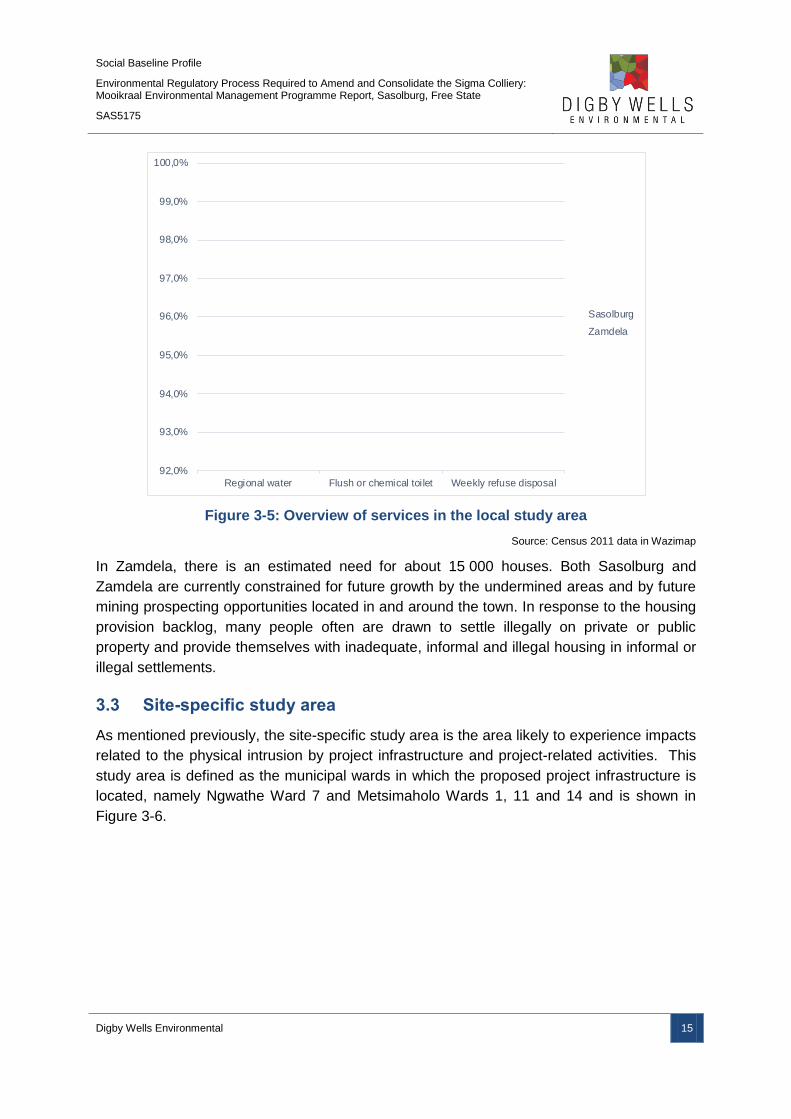
3.2.5 Access to services
Almost all the households (99.8%) resident in Sasolburg live in formal dwellings, and have
access to electricity, a flush toilet, a refuse removal service and piped-water from a water
scheme operated by the municipality or another water services provider.
As a lower-income residential area, it is not surprising that service provision is poorer in
Zamdela than Sasolburg. More than 90% of households resident in Zamdela have access to
electricity, refuse removal and piped water; however, there are more informal housing in
Zamdela (approximately 10% of dwellings) than Sasolburg.
Figure 3-5 provides an overview of the municipal services in the local study area.
0,0%
10,0%
20,0%
30,0%
40,0%
50,0%
60,0%
70,0%
80,0%
90,0%
100,0%
Sasolburg Zamdela
High income
Higher middle income
Middle income
Lower middle income
Absolute poverty
Social Baseline Profile
Environmental Regulatory Process Required to Amend and Consolidate the Sigma Colliery: Mooikraal Environmental Management Programme Report, Sasolburg, Free State
SAS5175
Digby Wells Environmental 15
Figure 3-5: Overview of services in the local study area
Source: Census 2011 data in Wazimap
In Zamdela, there is an estimated need for about 15 000 houses. Both Sasolburg and
Zamdela are currently constrained for future growth by the undermined areas and by future
mining prospecting opportunities located in and around the town. In response to the housing
provision backlog, many people often are drawn to settle illegally on private or public
property and provide themselves with inadequate, informal and illegal housing in informal or
illegal settlements.
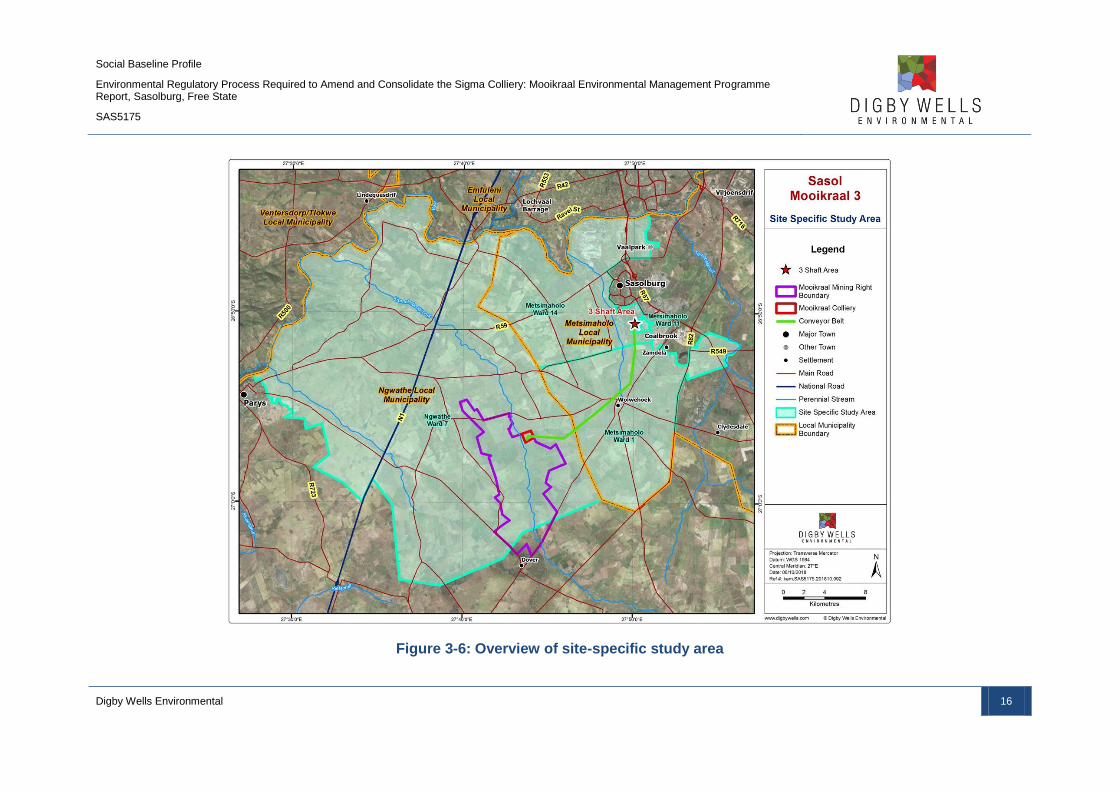
3.3 Site-specific study area
As mentioned previously, the site-specific study area is the area likely to experience impacts
related to the physical intrusion by project infrastructure and project-related activities. This
study area is defined as the municipal wards in which the proposed project infrastructure is
located, namely Ngwathe Ward 7 and Metsimaholo Wards 1, 11 and 14 and is shown in
Figure 3-6.
92,0%
93,0%
94,0%
95,0%
96,0%
97,0%
98,0%
99,0%
100,0%
Regional water Flush or chemical toilet Weekly refuse disposal
Sasolburg
Zamdela
Social Baseline Profile
Environmental Regulatory Process Required to Amend and Consolidate the Sigma Colliery: Mooikraal Environmental Management Programme Report, Sasolburg, Free State
SAS5175
Digby Wells Environmental 16
Figure 3-6: Overview of site-specific study area
Social Baseline Profile
Environmental Regulatory Process Required to Amend and Consolidate the Sigma Colliery: Mooikraal Environmental Management Programme Report, Sasolburg, Free State
SAS5175
Digby Wells Environmental 17
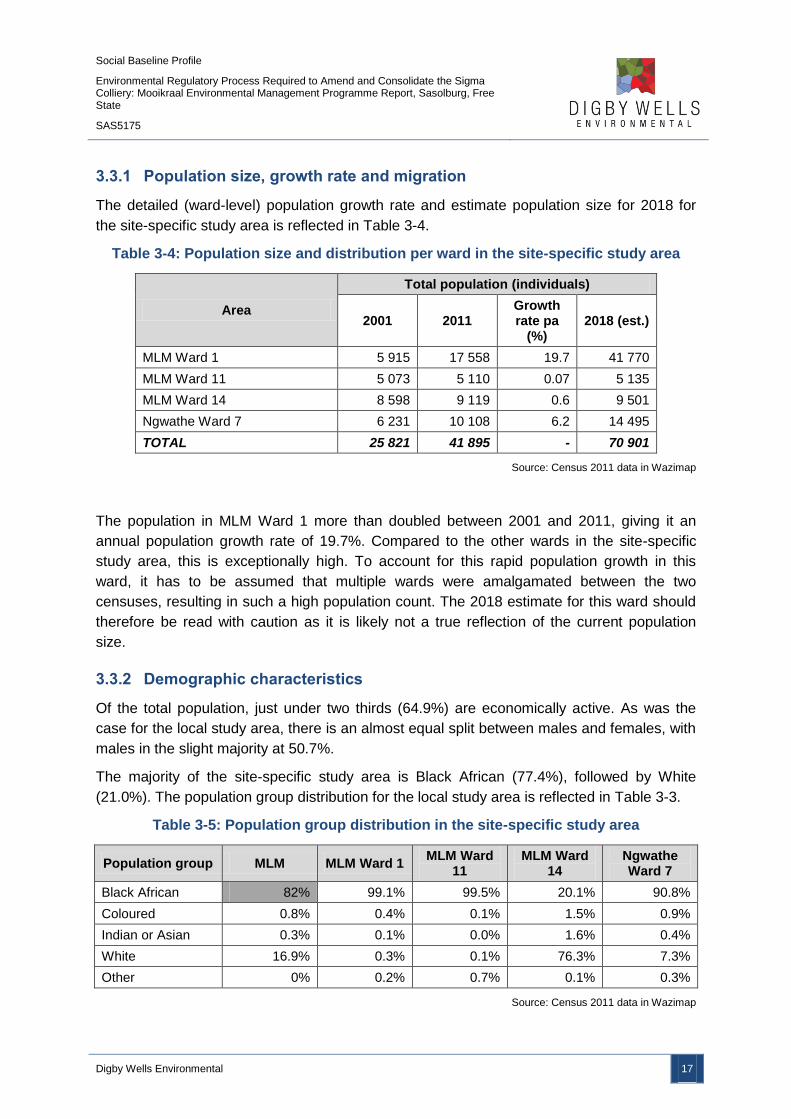
3.3.1 Population size, growth rate and migration
The detailed (ward-level) population growth rate and estimate population size for 2018 for
the site-specific study area is reflected in Table 3-4.
Table 3-4: Population size and distribution per ward in the site-specific study area
Area
Total population (individuals)
2001 2011 Growth rate pa
(%) 2018 (est.)
MLM Ward 1 5 915 17 558 19.7 41 770
MLM Ward 11 5 073 5 110 0.07 5 135
MLM Ward 14 8 598 9 119 0.6 9 501
Ngwathe Ward 7 6 231 10 108 6.2 14 495
TOTAL 25 821 41 895 - 70 901
Source: Census 2011 data in Wazimap
The population in MLM Ward 1 more than doubled between 2001 and 2011, giving it an
annual population growth rate of 19.7%. Compared to the other wards in the site-specific
study area, this is exceptionally high. To account for this rapid population growth in this
ward, it has to be assumed that multiple wards were amalgamated between the two
censuses, resulting in such a high population count. The 2018 estimate for this ward should
therefore be read with caution as it is likely not a true reflection of the current population
size.
3.3.2 Demographic characteristics
Of the total population, just under two thirds (64.9%) are economically active. As was the
case for the local study area, there is an almost equal split between males and females, with
males in the slight majority at 50.7%.
The majority of the site-specific study area is Black African (77.4%), followed by White
(21.0%). The population group distribution for the local study area is reflected in Table 3-3.
Table 3-5: Population group distribution in the site-specific study area
Population group MLM MLM Ward 1 MLM Ward
11 MLM Ward
14 Ngwathe Ward 7
Black African 82% 99.1% 99.5% 20.1% 90.8%
Coloured 0.8% 0.4% 0.1% 1.5% 0.9%
Indian or Asian 0.3% 0.1% 0.0% 1.6% 0.4%
White 16.9% 0.3% 0.1% 76.3% 7.3%
Other 0% 0.2% 0.7% 0.1% 0.3%
Source: Census 2011 data in Wazimap
Social Baseline Profile
Environmental Regulatory Process Required to Amend and Consolidate the Sigma Colliery: Mooikraal Environmental Management Programme Report, Sasolburg, Free State
SAS5175
Digby Wells Environmental 18
Just over half of the population (54.2%) in the study area speak Sesotho – the exception
being Ward 14 where the majority (70.7%) are Afrikaans speaking.
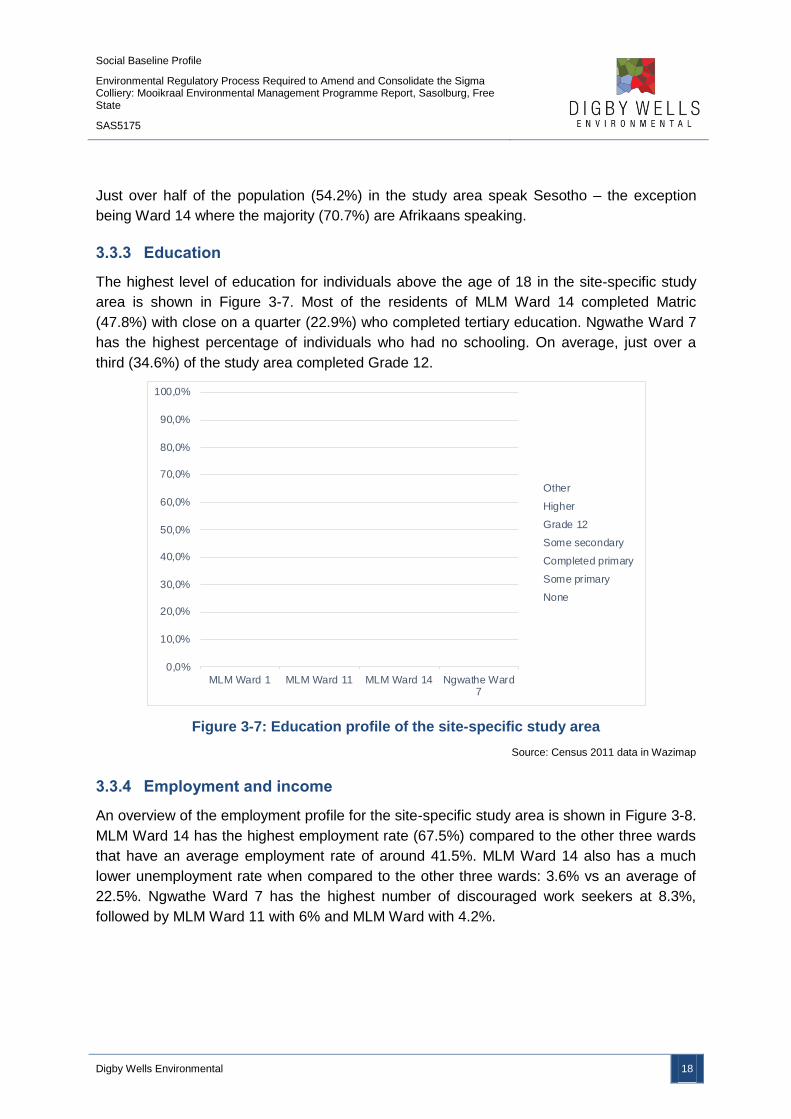
3.3.3 Education
The highest level of education for individuals above the age of 18 in the site-specific study
area is shown in Figure 3-7. Most of the residents of MLM Ward 14 completed Matric
(47.8%) with close on a quarter (22.9%) who completed tertiary education. Ngwathe Ward 7
has the highest percentage of individuals who had no schooling. On average, just over a
third (34.6%) of the study area completed Grade 12.
Figure 3-7: Education profile of the site-specific study area
Source: Census 2011 data in Wazimap
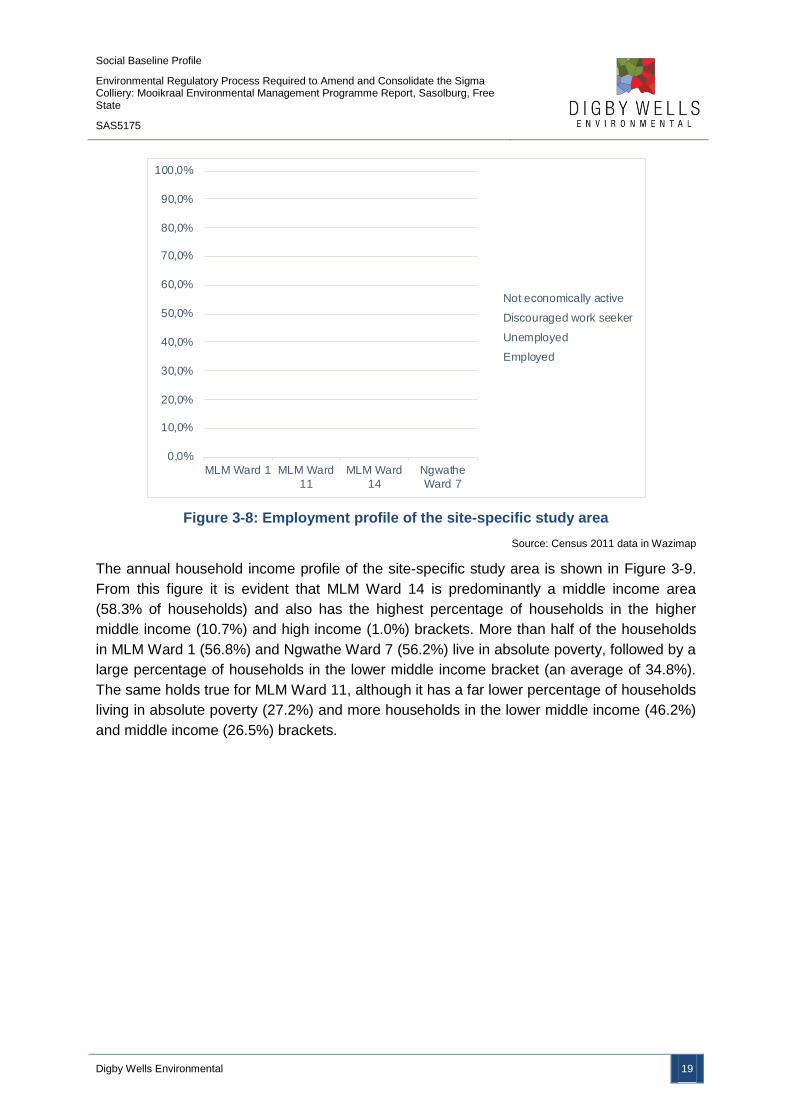
3.3.4 Employment and income
An overview of the employment profile for the site-specific study area is shown in Figure 3-8.
MLM Ward 14 has the highest employment rate (67.5%) compared to the other three wards
that have an average employment rate of around 41.5%. MLM Ward 14 also has a much
lower unemployment rate when compared to the other three wards: 3.6% vs an average of
22.5%. Ngwathe Ward 7 has the highest number of discouraged work seekers at 8.3%,
followed by MLM Ward 11 with 6% and MLM Ward with 4.2%.
0,0%
10,0%
20,0%
30,0%
40,0%
50,0%
60,0%
70,0%
80,0%
90,0%
100,0%
MLM Ward 1 MLM Ward 11 MLM Ward 14 Ngwathe Ward7
Other
Higher
Grade 12
Some secondary
Completed primary
Some primary
None
Social Baseline Profile
Environmental Regulatory Process Required to Amend and Consolidate the Sigma Colliery: Mooikraal Environmental Management Programme Report, Sasolburg, Free State
SAS5175
Digby Wells Environmental 19
Figure 3-8: Employment profile of the site-specific study area
Source: Census 2011 data in Wazimap
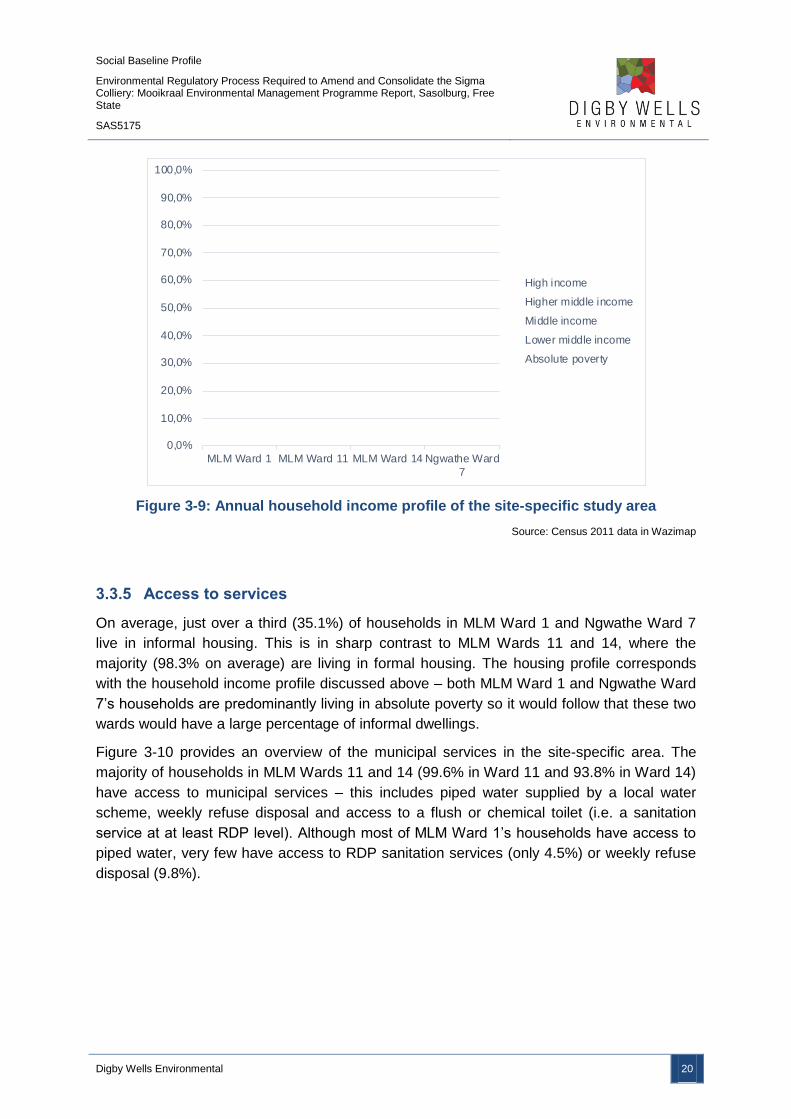
The annual household income profile of the site-specific study area is shown in Figure 3-9.
From this figure it is evident that MLM Ward 14 is predominantly a middle income area
(58.3% of households) and also has the highest percentage of households in the higher
middle income (10.7%) and high income (1.0%) brackets. More than half of the households
in MLM Ward 1 (56.8%) and Ngwathe Ward 7 (56.2%) live in absolute poverty, followed by a
large percentage of households in the lower middle income bracket (an average of 34.8%).
The same holds true for MLM Ward 11, although it has a far lower percentage of households
living in absolute poverty (27.2%) and more households in the lower middle income (46.2%)
and middle income (26.5%) brackets.
0,0%
10,0%
20,0%
30,0%
40,0%
50,0%
60,0%
70,0%
80,0%
90,0%
100,0%
MLM Ward 1 MLM Ward
11
MLM Ward
14
Ngwathe
Ward 7
Not economically active
Discouraged work seeker
Unemployed
Employed
Social Baseline Profile
Environmental Regulatory Process Required to Amend and Consolidate the Sigma Colliery: Mooikraal Environmental Management Programme Report, Sasolburg, Free State
SAS5175
Digby Wells Environmental 20
Figure 3-9: Annual household income profile of the site-specific study area
Source: Census 2011 data in Wazimap
3.3.5 Access to services
On average, just over a third (35.1%) of households in MLM Ward 1 and Ngwathe Ward 7
live in informal housing. This is in sharp contrast to MLM Wards 11 and 14, where the
majority (98.3% on average) are living in formal housing. The housing profile corresponds
with the household income profile discussed above – both MLM Ward 1 and Ngwathe Ward
7’s households are predominantly living in absolute poverty so it would follow that these two
wards would have a large percentage of informal dwellings.
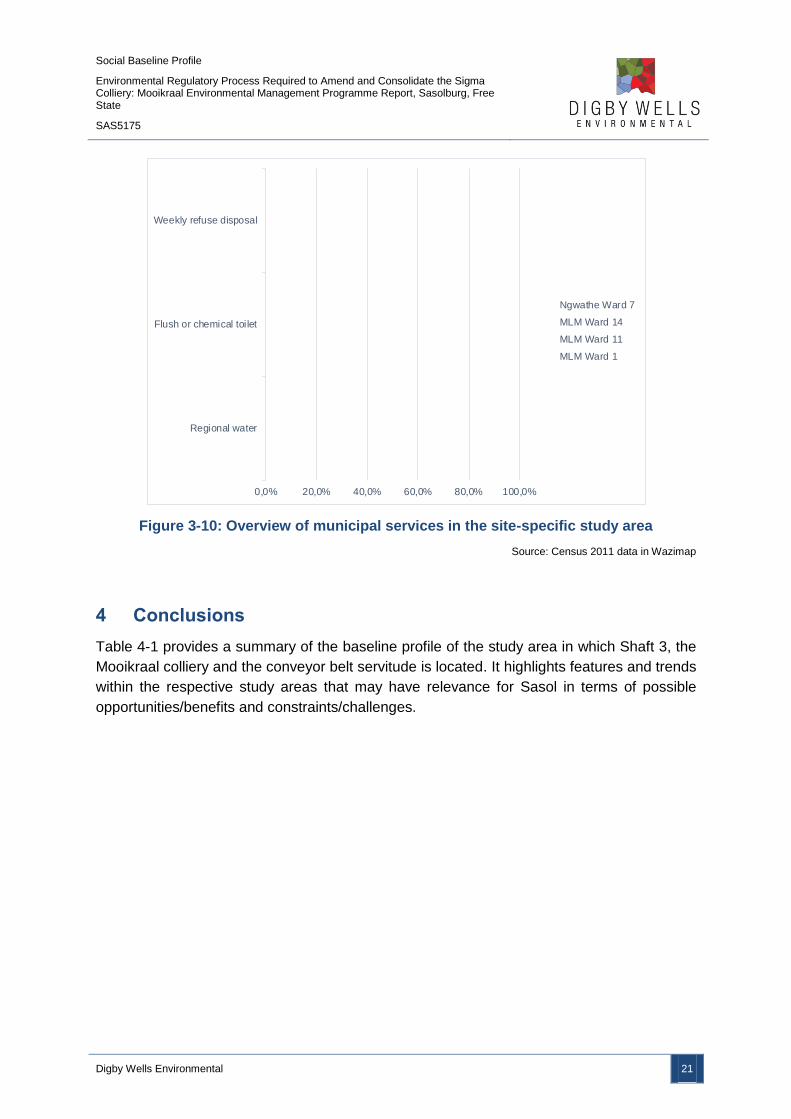
Figure 3-10 provides an overview of the municipal services in the site-specific area. The
majority of households in MLM Wards 11 and 14 (99.6% in Ward 11 and 93.8% in Ward 14)
have access to municipal services – this includes piped water supplied by a local water
scheme, weekly refuse disposal and access to a flush or chemical toilet (i.e. a sanitation
service at at least RDP level). Although most of MLM Ward 1’s households have access to
piped water, very few have access to RDP sanitation services (only 4.5%) or weekly refuse
disposal (9.8%).
0,0%
10,0%
20,0%
30,0%
40,0%
50,0%
60,0%
70,0%
80,0%
90,0%
100,0%
MLM Ward 1 MLM Ward 11 MLM Ward 14 Ngwathe Ward
7
High income
Higher middle income
Middle income
Lower middle income
Absolute poverty
Social Baseline Profile
Environmental Regulatory Process Required to Amend and Consolidate the Sigma Colliery: Mooikraal Environmental Management Programme Report, Sasolburg, Free State
SAS5175
Digby Wells Environmental 21
Figure 3-10: Overview of municipal services in the site-specific study area
Source: Census 2011 data in Wazimap
4 Conclusions
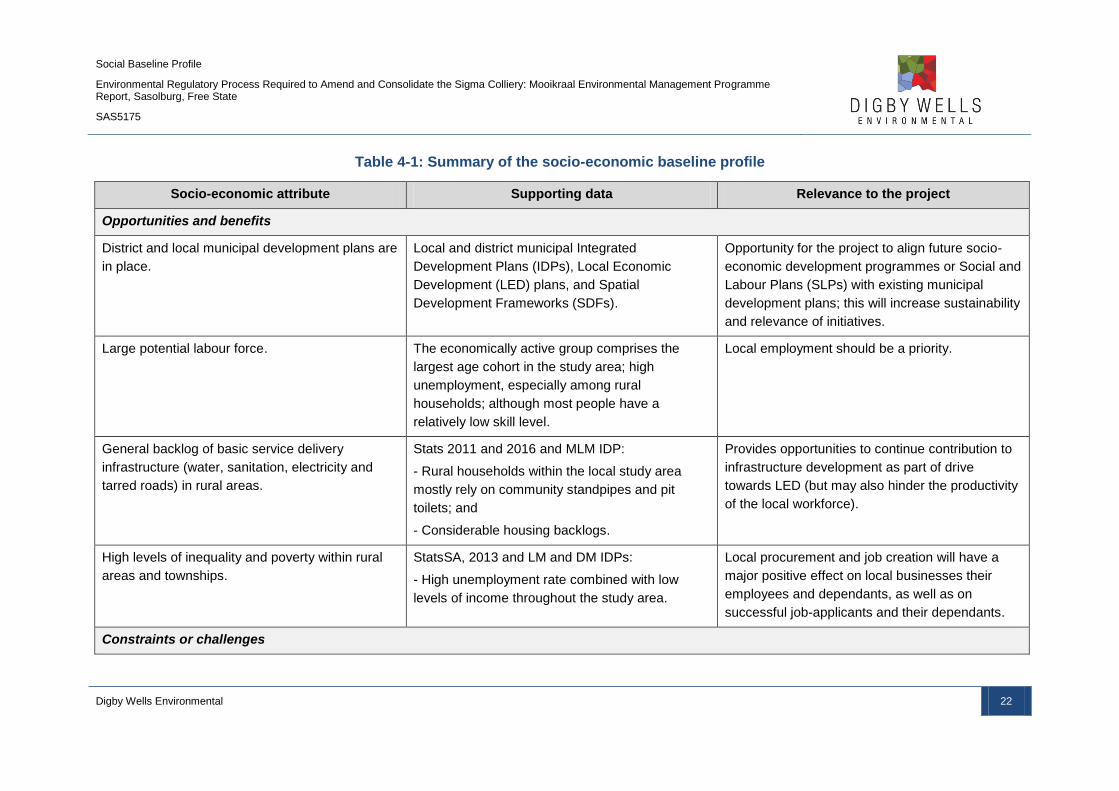
Table 4-1 provides a summary of the baseline profile of the study area in which Shaft 3, the
Mooikraal colliery and the conveyor belt servitude is located. It highlights features and trends
within the respective study areas that may have relevance for Sasol in terms of possible
opportunities/benefits and constraints/challenges.
0,0% 20,0% 40,0% 60,0% 80,0% 100,0%
Regional water
Flush or chemical toilet
Weekly refuse disposal
Ngwathe Ward 7
MLM Ward 14
MLM Ward 11
MLM Ward 1
Social Baseline Profile
Environmental Regulatory Process Required to Amend and Consolidate the Sigma Colliery: Mooikraal Environmental Management Programme Report, Sasolburg, Free State
SAS5175
Digby Wells Environmental 22
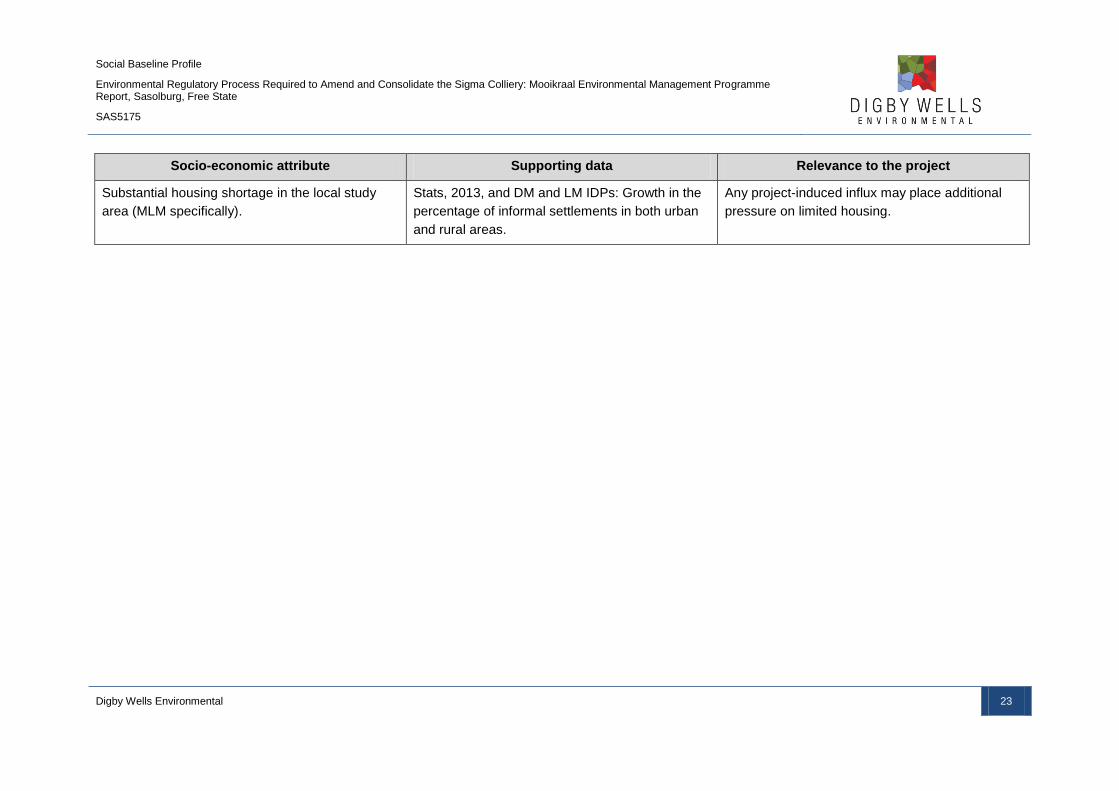
Table 4-1: Summary of the socio-economic baseline profile
Socio-economic attribute Supporting data Relevance to the project
Opportunities and benefits
District and local municipal development plans are
in place.
Local and district municipal Integrated
Development Plans (IDPs), Local Economic
Development (LED) plans, and Spatial
Development Frameworks (SDFs).
Opportunity for the project to align future socio-
economic development programmes or Social and
Labour Plans (SLPs) with existing municipal
development plans; this will increase sustainability
and relevance of initiatives.
Large potential labour force. The economically active group comprises the
largest age cohort in the study area; high
unemployment, especially among rural
households; although most people have a
relatively low skill level.
Local employment should be a priority.
General backlog of basic service delivery
infrastructure (water, sanitation, electricity and
tarred roads) in rural areas.
Stats 2011 and 2016 and MLM IDP:
- Rural households within the local study area
mostly rely on community standpipes and pit
toilets; and
- Considerable housing backlogs.
Provides opportunities to continue contribution to
infrastructure development as part of drive
towards LED (but may also hinder the productivity
of the local workforce).
High levels of inequality and poverty within rural
areas and townships.
StatsSA, 2013 and LM and DM IDPs:
- High unemployment rate combined with low
levels of income throughout the study area.
Local procurement and job creation will have a
major positive effect on local businesses their
employees and dependants, as well as on
successful job-applicants and their dependants.
Constraints or challenges
Social Baseline Profile
Environmental Regulatory Process Required to Amend and Consolidate the Sigma Colliery: Mooikraal Environmental Management Programme Report, Sasolburg, Free State
SAS5175
Digby Wells Environmental 23
Socio-economic attribute Supporting data Relevance to the project
Substantial housing shortage in the local study
area (MLM specifically).
Stats, 2013, and DM and LM IDPs: Growth in the
percentage of informal settlements in both urban
and rural areas.
Any project-induced influx may place additional
pressure on limited housing.
Social Baseline Profile
Environmental Regulatory Process Required to Amend and Consolidate the Sigma Colliery: Mooikraal Environmental Management Programme Report, Sasolburg, Free State
SAS5175
Digby Wells Environmental 24
5 References
Digby Wells Environmental (2013). Social Assessment for the proposed Sigma Colliery Ash
Backfilling Project.
Fezile Dabi District Municipality. Integrated Development Plan (2017-2022).
Stats SA (2011 & 2016). Interactive census results accessed through Wazimap
(www.wazimap.co.za).
Vanclay, F. (2002). Conceptualising Social Impacts. In: Environmental Impact Assessment
Review 22 (2002: pp. 183– 211).