Embed Size (px)
Citation preview
0
Environmental risk assessment of pesticides in Ethiopia:
A case of surface water systems
Berhan Mellese Teklu

1
Environmental risk assessment of pesticides in Ethiopia: A
case of surface water systems
Berhan Mellese Teklu

2
Thesis committee
Promotor
Prof. Dr P.J. van den Brink
Professor of Chemical Stress Ecology
Wageningen University
Other members
Prof. Dr T. Murk, Wageningen University
Prof. Dr N.M. (Nico) van Straalen, Vrije Universiteit Amsterdam
Dr M.G. Vijver, LeidenUniversity
Prof. Dr J. Gunnarsson, Stockholm University, Sweden
This Research was conducted under the auspices of the Graduate School for Socio-Economic and
Natural Sciences of the Environment (SENSE)
3
Environmental risk assessment of pesticides in Ethiopia: A case of surface water systems
Berhan Mellese Teklu
Thesis
submitted in fulfilment of the requirements for the degree of doctor
at Wageningen University
by the authority of the Rector Magnificus
Prof. Dr A.P.J. Mol
in the presence of the
Thesis Committee Appointed by the Academic Board
to be defended in public
on Monday 20 June 2016
at 1.30 p.m. in the Aula.

4
Berhan Mellese Teklu
Environmental risk assessment of pesticides in Ethiopia: A case of surface water systems,
146 pages.
PhD thesis, Wageningen University, Wageningen, NL (2016)
With references, with summary in English
ISBN: 978-94-6257-810-4
DOI: 10.18174/380652

5
The research for this PhD dissertation was funded by the Dutch Embassy in Ethiopia/FAO under a
PRRP (Pesticide Risk Reduction Programme) implemented by the MoA (Ministry of Agriculture)/and
Altera/WUR. The PhD project is part of Work package D- Sustainability of the developed systems, in
which capacity building towards development of technical and scientific platform is undertaken.

6
‘’Risk assessment is the mark of an instructed mind to rest easy with the degree of precision which thenature of the subject permits and not to seek an exactness where only an approximation of the truth is possible.’’
(Aristotle)
7
Dedicated to my Beloved Mother Fana Kidane
8
Contents:
Chapter 1 General Introduction....................................................................................................
9
Chapter 2 Surface water risk assessment of pesticides in Ethiopia..............................................
17
Chapter 3 Sensitivity of Ethiopian aquatic macroinvertebrates to the pesticides endosulfan
and diazinon, compared to literature data.................................................................
41
Chapter 4Impacts of nutrients and pesticides from small- and large-scale agriculture on the
water quality of Lake Ziway, Ethiopia..........................................................................
62
Chapter 5 Monitoring and risk assessment of pesticides at irrigation systems in Debra
Zeit, Ethiopia....................................................................................................
81
Chapter 6 General discussion and concluding remarks..........................................................
107
Summary............................................................................................................................
117
Bibliography.......................................................................................................
121
Abbreviations...................................................................................................
132
Acknowledgment.............................................................................................
138
Short biography................................................................................................
141
Publications........................................................................................................
143
Colophon............................................................................................................
144
Educational Certificate the SENSE Research School..............................................
145

9
Chapter 1
General Introduction

10
Agriculture and pesticides
Over the past five decades, pesticides have played a major role in ensuring food security by
helping to increase agricultural production and control vectors of disease (Matthews, 2006).
Nevertheless, there has been increasing criticism of the negative impacts, ever since Rachel Carson
alerted the world to the side-effects of some pesticides in the environment (Carson, 1962). Pesticides
are most commonly used as plant protection products. Their main benefits are increasing crop yields
or productivity by protecting crops from diseases, pests and weeds, and preventing the deterioration
of crop products in storage and extending the shelf-life of fruits and vegetables to maintain
marketability (Aktar et al 2009). When carefully applied only when needed, pesticides can contribute
to increased productivity and allow us to feed and protect the growing human population
(Matthews, 2006). The recent introduction of a number of different chemical groups to pesticides
has enhanced agricultural production by providing crop producers with a variety of options for better
control of pests on the one hand, while minimising their side-effects on the other (Taylor et al. 2007).
Agricultural intensification and pesticide use in Ethiopia and the global trend
Agriculture in Ethiopia forms the basis of the country's economy. About 84% of the country’s
population are engaged in agriculture and generate income for their households to sustain their
livelihood. The government has committed itself to intensifying the sector through technological
advancement and the use of state-of-the-art agricultural inputs such as fertilisers and pesticides.
Ethiopia’s agriculture used to be mainly dominated by small-scale farmers practicing subsistence
farming, which are dominated by low inputs and low technology farming systems. This was
considered to be the main cause of the low production and productivity of farmers; hence the
government is promoting the use of agrochemicals throughout the country to increase production
and productivity (CSA, 2012).
The use of pesticides in Ethiopia to control crop pests can be traced back to the mid-1940s,
when arsenic and later on BHC in bran bait were used to control desert locust outbreaks. The use of
agricultural inputs including pesticides was introduced to smallholder farmers since the 1960s via
agricultural extension systems. Since then the use of pesticides has shown a steady growth and with
the current development of the flower-growing sector, average imports of pesticides have grown to
over 2400 tons per annum (Assefa, 2010) (Fig 1). In recent years, the import and use of pesticides in
Ethiopia has grown rapidly, as this is also part of a development plan to intensify agriculture with the
objective of increasing food production and expanding the floriculture industry (Amera and Abate,
2008; PHRD, 2015).
11
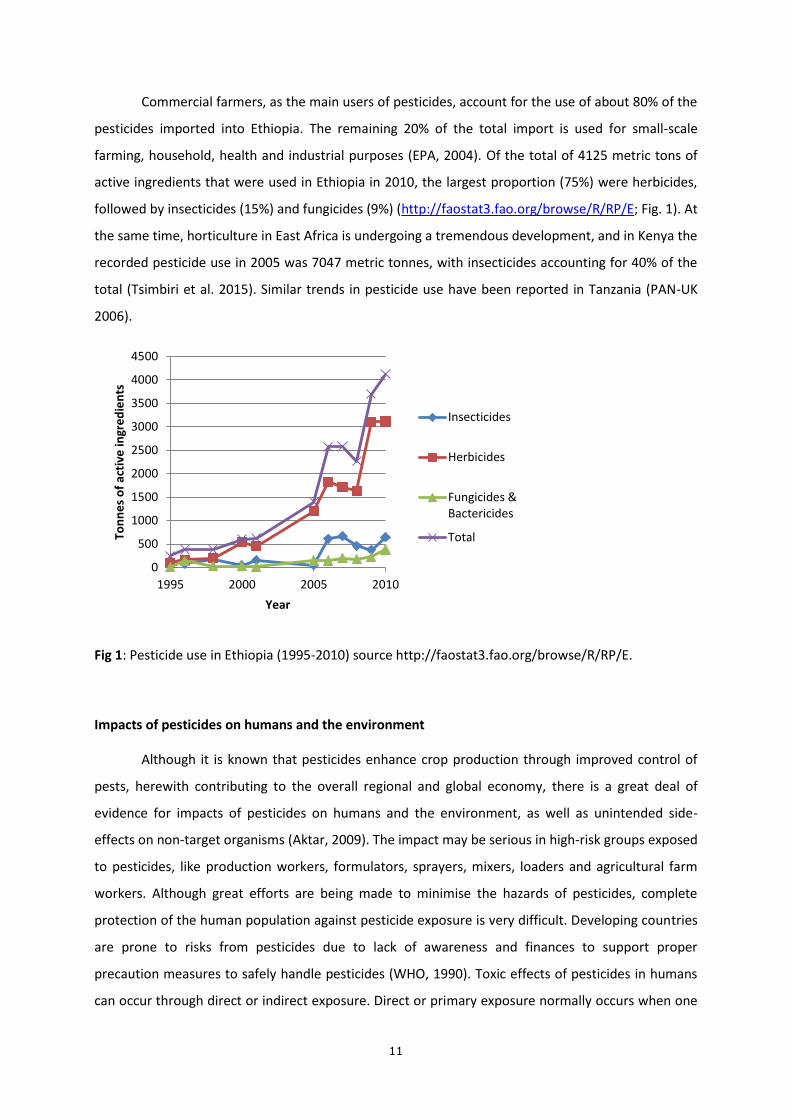
Commercial farmers, as the main users of pesticides, account for the use of about 80% of the
pesticides imported into Ethiopia. The remaining 20% of the total import is used for small-scale
farming, household, health and industrial purposes (EPA, 2004). Of the total of 4125 metric tons of
active ingredients that were used in Ethiopia in 2010, the largest proportion (75%) were herbicides,
followed by insecticides (15%) and fungicides (9%) (http://faostat3.fao.org/browse/R/RP/E; Fig. 1). At
the same time, horticulture in East Africa is undergoing a tremendous development, and in Kenya the
recorded pesticide use in 2005 was 7047 metric tonnes, with insecticides accounting for 40% of the
total (Tsimbiri et al. 2015). Similar trends in pesticide use have been reported in Tanzania (PAN-UK
2006).
Fig 1: Pesticide use in Ethiopia (1995-2010) source http://faostat3.fao.org/browse/R/RP/E.
Impacts of pesticides on humans and the environment
Although it is known that pesticides enhance crop production through improved control of
pests, herewith contributing to the overall regional and global economy, there is a great deal of
evidence for impacts of pesticides on humans and the environment, as well as unintended side-
effects on non-target organisms (Aktar, 2009). The impact may be serious in high-risk groups exposed
to pesticides, like production workers, formulators, sprayers, mixers, loaders and agricultural farm
workers. Although great efforts are being made to minimise the hazards of pesticides, complete
protection of the human population against pesticide exposure is very difficult. Developing countries
are prone to risks from pesticides due to lack of awareness and finances to support proper
precaution measures to safely handle pesticides (WHO, 1990). Toxic effects of pesticides in humans
can occur through direct or indirect exposure. Direct or primary exposure normally occurs when one
0
500
1000
1500
2000
2500
3000
3500
4000
4500
1995 2000 2005 2010
Ton
ne
s o
f ac
tive
ingr
ed
ien
ts
Year
Insecticides
Herbicides
Fungicides &Bactericides
Total

12
comes into direct contact with the chemicals during application, transport or storage. Indirect or
secondary exposure comes from exposure through polluted environments or the ingestion of food
treated with pesticides (Tadeo, 2008). Pesticide exposure is associated with a wide range of human
health hazards, ranging from short-term impacts like headaches and nausea to chronic impacts such
as cancer, reproductive disorders, endocrine disruption, birth defects and immune system disorders
(Perry et al. 2015; Bouman 2004; 2006 ;Olaya - Contrras et al. 1998; Oesterlund, 2014).
The environmental impact of pesticides consists of the negative effects of pesticides on non-
target species. Pesticide residues may contaminate surface waters, e.g. through runoff from treated
plants and soil, or through spray drift during application (Konstantinou et al., 2006). This implies that
aquatic flora and fauna may be subject to damage by pesticides when concentrations exceed the
threshold levels in the surface water systems. Moreover pesticide use may also impact groundwater,
soil and beneficial soil organisms, as well as on airborne organisms like birds and bees, and can
damage non-target terrestrial plants and animals. All of these have been reported in many scientific
studies (Vijver and van den Brink, 2014; Diepens et al., 2014; Cole and Bagchi 1995; Andreu and Pico
2004). Investigations in eastern and other parts of Africa have reported similar health and
environmental impacts of pesticides (Macharia 2015; Ansara-Ross et al 2008).
Pesticide registration in Ethiopia: adoption of risk assessment as a registration tool
The first Pesticide Registration and Control Special Decree No. 20/1990 was issued in Ethiopia
in 1990 to regulate imports, sales, distribution and use of pesticides. Pesticide registration was
started in 1996, six years after the decree was issued. Between the years 1996 and 2011 a total of
274 pesticides were registered, the majority being insecticides (PHRD, 2015). Registration of
agrochemicals in Ethiopia involves one simple efficacy trial and a quick first-tier assessment of the
pesticide’s properties, e.g. their basic physicochemical properties and WHO classification status,
supplied by the registrant from databases like the WHO risk classification, EPA classification of active
ingredients or the European Pesticides Properties Database (PPDB). According to an assessment
based on the WHO classification, it has been reported that of the 231 pesticides assessed for
registration, 133 (58%) were found to be in the low-risk category in the WHO classification, and 16
(7%) in the extremely hazardous classes Ia and Ib (Fig 2) (Assefa 2010).

13
Fig 2. Risk categories of registered pesticides in Ethiopia based on WHO classification (Assefa 2010)
Realising the increased need for more pesticide imports both in type and quantity, there was
a need to adopt a better registration system, which gives fast and reliable results. The system should
also improve the current situation, which allows pesticides to be used that are believed to be risky to
endpoints that were formerly not considered, including the protection of non-target organisms like
bees and birds, aquatic ecosystems, non-target arthropods, terrestrial ecosystems and non-target
plants. Other endpoints that need to be considered include occupational health issues like risks to
indoor applicators and outdoor/indoor workers and the protection of groundwater and surface
water as a source of drinking water and shelter for aquatic organisms.
This was the reason why the Pesticide Risk Reduction Programme (PRRP)-Ethiopia was
launched in 2010. This is a programme for pesticide registration and post-registration jointly set up
by the Ministry of Agriculture of the Federal Republic of Ethiopia (MoA), the State of the
Netherlands, represented by the Ministry of Foreign Affairs/ForeignTrade and Development
Cooperation, and the Technical Cooperation Programme (TCP) of the Food and Agricultural
Organisation of the United Nations (FAO). It generally concerns pesticide registration and
management. The programme covers all aspects of pesticide legislation in the agricultural and public
health sectors, setting up a sustainable system, and capacity building for pesticide registration, as
well as a holistic plan for post-registration measures: monitoring, inspection, quality control, storage
and capacity building.The present PhD project, together with two others on human health effects
and policy issues, was part of this programme, coming under work package D. This package concerns
16, 7%
133, 58%
42, 18%
40, 17%extremely hazardous (WHO class Ia and Ib)
very hazardous (WHO class II)
moderately hazardous WHO classs III)
low risk (WHO class U)
14
the sustainability of the developed systems, and involves capacity building for the development of a
technical and scientific platform.
After a series of consultation workshops with relevant stakeholders and background studies
including an inventory of agro-environmental characteristics and existing environmental standards in
Ethiopia, the project introduced a tool called PRIMET_Registration_Ethiopia_1.1. This tool can be
used to assess the risks for all the endpoints in a relatively short time, as long as the data needed as
input for the software is provided by the importer (Deneer et al 2014; Wipfler et al 2014). The
present PhD project tried to evaluate the applicability of this risk assessment tool, using the case of
surface water systems in Ethiopia as an example. Surface water was selected since the country is
endowed with plenty of surface water resources which may be subject to contamination by pesticide
residues.
Overall aim of the thesis
Current developmental activities in Ethiopia are resulting in intensified agricultural activity
both at small-scale and commercial levels. It is believed that both the types and amounts of
pesticides used in Ethiopia are increasing at an alarming rate (Fig. 1). Whereas the country has huge
water resources, and is sometimes even referred as the water tower of Africa, there are clear
indications that all of the country’s surface water systems, especially the river and pond systems, are
under a clear and present threat from possible pesticide contamination. This PhD project therefore
aimed to assess the environmental risks posed by the extensive use of pesticides in the surface water
systems in Ethiopia.
Research Objectives
The following research objectives are discussed in this thesis
1. Investigating the applicability of model-based risk assessment to predict environmental
concentrations in the Ethiopian surface water systems, as part of the
PRIMET_Registration_Ethiopia_1.1.
2. Performing simple chemical monitoring programmes to show the status of residues in
Ethiopian surface waters and undertake single-species toxicity tests to compare sensitivity
with European species.

15
Outline of thesis
Chapter 2 describesscenarios for future use in the pesticide registration procedures in
Ethiopia, designed for 3 specific Ethiopian locations, which should be protective for the whole of
Ethiopia. The scenarios estimate pesticide concentrations in surface water resulting from agricultural
use, for a small stream and for two types of small ponds. Seven pesticides were selected since they
were estimated to carry the highest risk to humans on the basis of volume of use, application rate
and acute and chronic human toxicity, assuming exposure as a result of the consumption of surface
water. Potential ecotoxicological risks were not considered as a selection criterion at this stage.
Estimates of exposure concentrations in surface water were established using modelling software
also applied in the EU registration procedure (PRZM and TOXSWA). Input variables included
physicochemical properties and data such as crop calendars, irrigation schedules, meteorological
information and detailed application data which were specifically tailored to the Ethiopian situation.
Chapter 3discusses the feasibility of undertaking single-species toxicity testing by
circumventing the need for analytical verification of the test solution concentration. Experiments
were performed with three aquatic arthropods; one crustacean (Diaphanosoma brachyurum) and
two insects (Anopheles pharoensis and Culexpipiens). Two pesticides (endosulfan and diazinone)
were tested. All species–pesticide combinations were used in duplicate to estimate the intra-
laboratory variation in test results. Daphnia magna was also tested, to compare the test results
directly with values from the literature. The studies were conducted at Addis Ababa University,
AratKillo Campus, in the Fisheries and Limnology Laboratory. Species for the experiment were either
collected from fresh undisturbed water bodies in the periphery of Addis or brought in from a
Fisheries Research Centre of the Ethiopian Institute of Agricultural Research (EIAR), which rears them
for scientific purposes.
Chapter 4presents results of water quality monitoring in Lake Ziway in Ethiopia. The
objective of this study was to assess the possible change in water quality variables in the Lake Ziway
area due to expanding agricultural activity, including very large-scale flower farming practices close
to the lake. In addition to analysing the residues of more than 300 pesticides by taking water samples
to the Altic laboratory in the Netherlands twice between the years 2014 and 2015, this study made a
risk assessment using additional data from previous work by (Jansen and Harmsen, 2011). Both acute
and chronic risks were determined for humans using surface water as a source of drinking water,
using the acceptable daily intake(ADI) and the acute reference dose (ARfD) values.Pesticide residues
detected in each sampling period were first used to determine the acute ETR (exposure toxicity ratio)
using predicted no effect concentrations (PNECs). Species sensitivity distribution (SSDs) and HC5
concentrations (hazardous concentration protective of 95% of the population) were determined in a
16
second-tier risk assessment.This paper also discusses values of the physicochemical parameters of
the lake for the year 2011-2015 and compares them with the Ethiopian or WHO standard for drinking
water.
Chapter 5 Discusses the status of organo-chlorine pesticides (OCPs) in samples from rivers
and temporary ponds near agricultural activities. The study was done at the Wedecha and Belbela
irrigation system, by taking samples from the Belbela and Wedecha rivers and temporary ponds
formed at the end of the rainy season close to the rivers and agricultural plots. The study also
assessed the risks posed by the current use of pesticides by small-scale farmers, using the
PRIMET_Ethiopia_1.1. model. It includes a worst-case scenario protective of the Wedecha and
Belbela irrigation system, using the actual application rate and frequency reported by farmers in the
area as input data. Further first- and second-tier risk assessments were performed to assess the risks
posed by the measured OCP levels to humans and aquatic organisms. Similar risk assessment was
performed for the reported current pesticide use by small-scale farmers
Chapter 6 presents a general discussion of the results reported in the previous chapters in
order to describe the overall status of the pesticide risk assessment for surface water systems in
Ethiopia. It also indicates a way forward for future risk assessment and monitoring studies in
Ethiopia.
17
Chapter 2
Surface water risk assessment of pesticides in Ethiopia
Berhan M. Teklu a,b, Paulien I. Adriaanse c, Mechteld M.S. Ter Horst c, John W. Deneer c, Paul J. Van den Brink a,c,
a Department of Aquatic Ecology and Water Quality Management, Wageningen University,
Wageningen University and Research Centre, P.O. Box 47, 6700 AA Wageningen, The Netherlands
b The College of Natural Sciences, University of Addis Ababa, 4 Kiklo Campus, Addis Ababa, Ethiopia
c Alterra, Wageningen University and Research centre, P.O. Box 47, 6700 AA Wageningen, The
Netherlands
This paper has been published inScience of the Total Environment (2015), 508 : 566–574.
18
Abstract
Scenarios for future use in the pesticide registration procedure in Ethiopia were designed for
3 separate Ethiopian locations, which are aimed to be protective for the whole of Ethiopia. The
scenarios estimate concentrations in surface water resulting from agricultural use of pesticides for a
small stream and for two types of small ponds. Seven selected pesticides were selected since they
were estimated to bear the highest risk to humans on the basis of volume of use, application rate
and acute and chronic human toxicity, assuming exposure as a result of the consumption of surface
water. Potential ecotoxicological risks were not considered as a selection criterion at this stage.
Estimates of exposure concentrations in surface water were established using modelling software
also applied in the EU registration procedure (PRZM and TOXSWA). Input variables included physico-
chemical proper-ties, and data such as crop calendars, irrigation schedules, meteorological
information and detailed application data which were specifically tailored to the Ethiopian situation.
The results indicate that for all the pesticides investigated the acute human risk resulting from the
consumption of surface water is low to negligible, whereas agricultural use of chlorothalonil,
deltamethrin, endosulfan and malathion in some crops may result in medium to high risk to aquatic
species.The predicted environmental concentration estimates are based on procedures similar to
procedures used at the EU level and in the USA. Addition of aquatic macrophytes as an
ecotoxicological endpoint may constitute a welcome future addition to the risk assessment
procedure. Implementation of the methods used for risk characterization constitutes a good step
forward in the pesticide registration procedure in Ethiopia.
19
Introduction
Agriculture is often referred to as the backbone of the Ethiopian economy. Over 80% of the
people living in the rural areas are dependent on agriculture. Recent developments in the country
brought about intensification of farming activities, both in acreage and in the use ofextrinsic inputs
like pesticides and fertilisers (Ethiopia Investment Agency, 2012). This is evidenced by the latest
increase in intensive commercial agricultural activities, including large scale flower farming in the
country. The pesticide consumption of small-scale farmers is also in-creasing at a high rate despite
the poor knowledge about the (eco-) toxicological properties of pesticides and inappropriate
handling of agrochemicals (Taddese and Asferachew, 2008).
Ethiopia has 11 fresh and 9 saline lakes of major importance, 4 crater lakes, over 12 major
swamps or wetlands and more than 96 rivers, and is for that reason sometimes referred to as the
water tower of Africa. The majority of the lakes are found in the Rift Valley Basin. The total surface
area of these natural and artificial lakes in Ethiopia is about 7500 km2, and most of Ethiopian lakes
are rich in fish (Awulachew et al., 2007). Besides these larger water bodies many small rivers and
(temporary) ponds exist. Because small water bodies are more vulnerable for pesticide
contamination than larger water bodies, the risk assessment focusses on these smaller water bodies.
In view of the current intensification of agricultural activities and increased intensity of
pesticide use, in combination with the abundance of surface water bodies in the country, the risk
posed to humans and the environment from application of pesticides may be increasing. Hence there
is a growing need for the adoption of a scientifically sound pesticide registration procedure that
filters out pesticides causing damage to humans and the environment. So, a sound risk assessment
tool for quantifying risks is essential. In this light the Pesticide Risk Reduction Programme — Ethiopia
(PRRP-Ethiopia), a joint collaborative project on pesticide registration and post-registration aiming to
develop a sound tool for quantitative risk assessment, was initiated in 2010 (www.prrp-ethiopia.org).
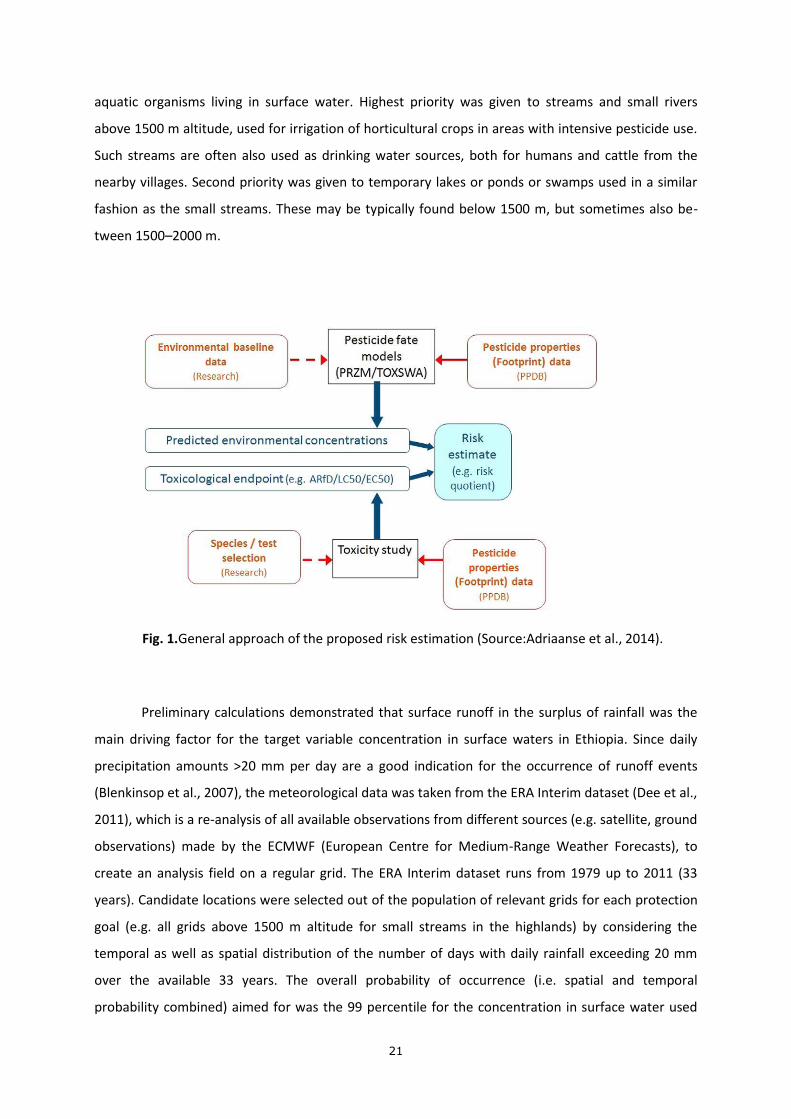
Pesticide risk assessment is typically based on a framework as depicted in Fig. 1, comparing
estimated exposure to toxicologically relevant values of a compound. Generally, application
scenarios and pesticide properties, as well as data on pesticide use and data obtained through
toxicological studies, are used as input for models. Despite the many challenges faced in the
implementation and acceptance in risk assessment, adoption of this framework is essential to make a
scientific informed decision on the admittance of a pesticide on the market (Brock et al., 2006; Van
den Brink, 2013).
20
Aquatic risk assessment in Ethiopia has until now not included such tools. Some of the few
monitoring studies undertaken (Prabu, 2009;Prabu et al., 2011) concentrate on heavy metal pollution
and assessment of the physico-chemical characteristics of the Awash tributary rivers Akaki (Small and
Greater) in Addis Ababa and Huluka and Aleltu Rivers of Ambo. These studies indicated an increased
heavy meal pollution downstream the rivers Huluka and Aleltu and increased concentration of heavy
metals in waters of Akaki rivers and residues in vegetables produced using these rivers as a source of
irrigation. Investigation by Jansen and Harmsen (2011) on samples taken from surface waters around
agricultural fields and effluent waters from commercial farms showed concentrations of pesticides
above 0.1 μg/L, hence not meeting the European standards for drinking water(URL: http://eur-
lex.europa. eu/legal-content/EN/TXT/PDF/?uri=CELEX:31998L0083&from=EN).
This study presents results on risk assessment for humans and aquatic life for 7 pesticides
currently in use in Ethiopia. The risk assessment is based on principles underlying the EU aquatic risk
assessment and is presently being implemented in the registration procedure for pesticides in
Ethiopia.
The objectives of this study are (i) to assess the suitability of the pro-posed protection goals
and scenario locations for risk assessment procedures under development in Ethiopia, (ii) to evaluate
the applicability of the combination of PRZM and TOXSWA exposure models for assessing the
exposure concentration in a realistic worst-case acute surface water risk assessment of agricultural
chemicals in Ethiopia, (iii) to evaluate the risk posed by a few of the already registered pesticides to
surface water organisms and humans, based on Exposure Toxicity Ratios (ETR) calculations and (iv) to
gain a preliminary perspective on the feasibility of pre-registration risk assessment, using the
outlined principles, in Ethiopia.
Materials and methods
Selection of protection goals and scenario locations
The selection of protection goals was discussed in workshops with Ethiopian experts of the
Animal and Plant Health Regulatory Directorate (APHRD), Addis Ababa University (AAU), Institute of
Biodiversity Conservation (IBC) and Ethiopian Institute of Agricultural Research (EIAR) (www.prrp-
ethiopia.org). The selected protection goals were humans directly using surface water as drinking
water (especially in surface water that is used for consumption without prior purification) and
21
aquatic organisms living in surface water. Highest priority was given to streams and small rivers
above 1500 m altitude, used for irrigation of horticultural crops in areas with intensive pesticide use.
Such streams are often also used as drinking water sources, both for humans and cattle from the
nearby villages. Second priority was given to temporary lakes or ponds or swamps used in a similar
fashion as the small streams. These may be typically found below 1500 m, but sometimes also be-
tween 1500–2000 m.
Fig. 1.General approach of the proposed risk estimation (Source:Adriaanse et al., 2014).
Preliminary calculations demonstrated that surface runoff in the surplus of rainfall was the
main driving factor for the target variable concentration in surface waters in Ethiopia. Since daily
precipitation amounts >20 mm per day are a good indication for the occurrence of runoff events
(Blenkinsop et al., 2007), the meteorological data was taken from the ERA Interim dataset (Dee et al.,
2011), which is a re-analysis of all available observations from different sources (e.g. satellite, ground
observations) made by the ECMWF (European Centre for Medium-Range Weather Forecasts), to
create an analysis field on a regular grid. The ERA Interim dataset runs from 1979 up to 2011 (33
years). Candidate locations were selected out of the population of relevant grids for each protection
goal (e.g. all grids above 1500 m altitude for small streams in the highlands) by considering the
temporal as well as spatial distribution of the number of days with daily rainfall exceeding 20 mm
over the available 33 years. The overall probability of occurrence (i.e. spatial and temporal
probability combined) aimed for was the 99 percentile for the concentration in surface water used

22
for drinking water. Out of the selected candidate locations final scenario locations were selected with
the aid of additional criteria: (i) presence of the protection goal within the selected (80 * 80 km2)
location (grid), (ii) the presence of crops with high use of pesticides within the grid and (iii) well
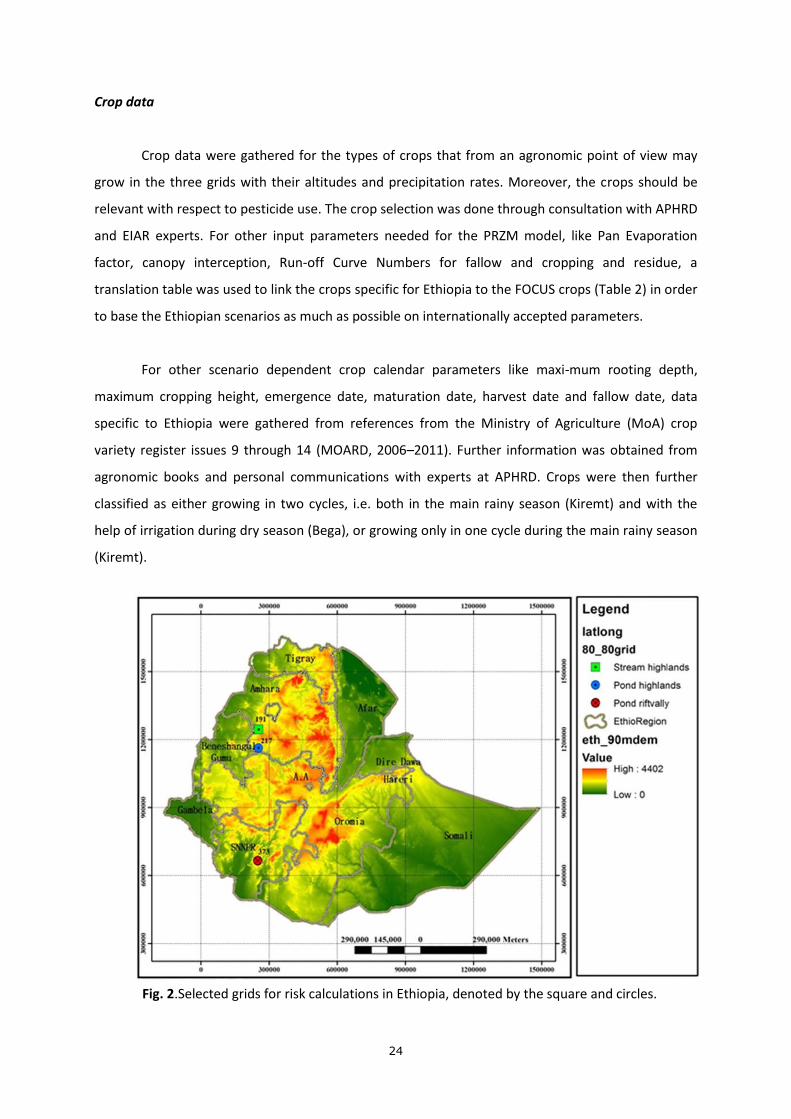
populated. In this way three locations were selected for the protection goals of small streams in the
highlands (grid 191, Table 1, Fig. 2) and of temporary ponds in the highlands and in the Rift Valley
(grids 373 and 217, respectively). For simplicity the same scenario locations were used to estimate
realistic worst-case exposure concentrations for the aquatic ecosystem. For the aquatic ecosystem a
less strict standard than for drinking water for humans was judged to be acceptable and therefore a
90 percentile overall probability (i.e. the EU standard) was obtained by lowering the temporal
probability, while selecting one of the 33 maximum yearly concentrations. Further details on
selection of protection goals and scenario locations are provided in Adriaanse et al. (2014).
Selection of models and calculation of exposure concentrations
The models chosen to calculate the runoff and fate of the pesticides in the surface water
were the Pesticide Root Zone Model (PRZM) and the TOXic substances in Surface WAters model
(TOXSWA), respectively. These models are also used in the EU registration procedures (FOCUS, 2001;
EC, 2011). PRZM is a one-dimensional, dynamic, compartmental model that can be used to simulate
pesticide movement in unsaturated soil systems within and immediately below the plant root zone
(Carsel et al., 1998). TOXSWA is a pseudo-two-dimensional numerical model describing pesticide
behaviour in the water layer and its underlying sediment at the edge-of-field scale (Adriaanse, 1996,
1997; Adriaanse et al., 2013). These models were parameterized using the EU-FOCUS R4 scenario
characteristics for PRZM (the scenario with worst case soil properties for runoff of the 4 EU Runoff
scenarios) and the EU FOCUS R1 pond scenario for TOXSWA (FOCUS, 2001), but using Ethiopiancrop
data (MOARD, 2006–2011), irrigation data (Adriaanse et al., 2014) and meteorology data (Dee et al.,
2011). The EU Drift calculator was used to estimate drift deposition (FOCUS, 2001), relatively low
depositions, representing 70 percentile probability, were used to avoid stacking extreme entry route
occurrences in the ponds, which would result in unrealistically high exposure estimates.
23
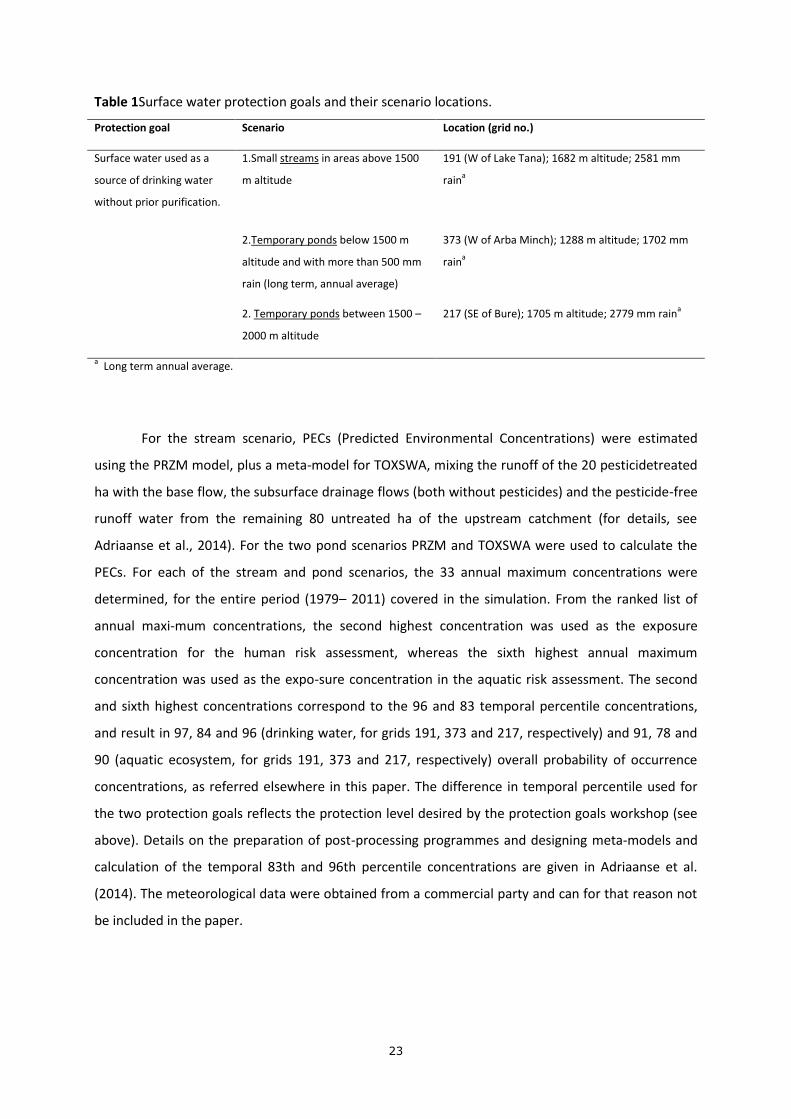
Table 1Surface water protection goals and their scenario locations.
Protection goal Scenario Location (grid no.)
Surface water used as a
source of drinking water
without prior purification.
1.Small streams in areas above 1500
m altitude
191 (W of Lake Tana); 1682 m altitude; 2581 mm
raina
2.Temporary ponds below 1500 m
altitude and with more than 500 mm
rain (long term, annual average)
373 (W of Arba Minch); 1288 m altitude; 1702 mm
raina
2. Temporary ponds between 1500 –
2000 m altitude
217 (SE of Bure); 1705 m altitude; 2779 mm raina
a Long term annual average.
For the stream scenario, PECs (Predicted Environmental Concentrations) were estimated
using the PRZM model, plus a meta-model for TOXSWA, mixing the runoff of the 20 pesticidetreated
ha with the base flow, the subsurface drainage flows (both without pesticides) and the pesticide-free
runoff water from the remaining 80 untreated ha of the upstream catchment (for details, see
Adriaanse et al., 2014). For the two pond scenarios PRZM and TOXSWA were used to calculate the
PECs. For each of the stream and pond scenarios, the 33 annual maximum concentrations were
determined, for the entire period (1979– 2011) covered in the simulation. From the ranked list of
annual maxi-mum concentrations, the second highest concentration was used as the exposure
concentration for the human risk assessment, whereas the sixth highest annual maximum
concentration was used as the expo-sure concentration in the aquatic risk assessment. The second
and sixth highest concentrations correspond to the 96 and 83 temporal percentile concentrations,
and result in 97, 84 and 96 (drinking water, for grids 191, 373 and 217, respectively) and 91, 78 and
90 (aquatic ecosystem, for grids 191, 373 and 217, respectively) overall probability of occurrence
concentrations, as referred elsewhere in this paper. The difference in temporal percentile used for
the two protection goals reflects the protection level desired by the protection goals workshop (see
above). Details on the preparation of post-processing programmes and designing meta-models and
calculation of the temporal 83th and 96th percentile concentrations are given in Adriaanse et al.
(2014). The meteorological data were obtained from a commercial party and can for that reason not
be included in the paper.
24
Crop data
Crop data were gathered for the types of crops that from an agronomic point of view may
grow in the three grids with their altitudes and precipitation rates. Moreover, the crops should be
relevant with respect to pesticide use. The crop selection was done through consultation with APHRD
and EIAR experts. For other input parameters needed for the PRZM model, like Pan Evaporation
factor, canopy interception, Run-off Curve Numbers for fallow and cropping and residue, a
translation table was used to link the crops specific for Ethiopia to the FOCUS crops (Table 2) in order
to base the Ethiopian scenarios as much as possible on internationally accepted parameters.
For other scenario dependent crop calendar parameters like maxi-mum rooting depth,
maximum cropping height, emergence date, maturation date, harvest date and fallow date, data
specific to Ethiopia were gathered from references from the Ministry of Agriculture (MoA) crop
variety register issues 9 through 14 (MOARD, 2006–2011). Further information was obtained from
agronomic books and personal communications with experts at APHRD. Crops were then further
classified as either growing in two cycles, i.e. both in the main rainy season (Kiremt) and with the
help of irrigation during dry season (Bega), or growing only in one cycle during the main rainy season
(Kiremt).
Fig. 2.Selected grids for risk calculations in Ethiopia, denoted by the square and circles.
25
Choice of compounds
Some pesticides to use as case studies were chosen from a list of more than 100 actives in
more than 200 formulated products, based on Ethiopian sales volumes in 2010 (kindly provided by
the Ethiopian Ministry of Agriculture) in combination with human toxicity data, by making prior
rankings based on the ratio of sales volume to Acute Reference Dose (ARfD) or the Acceptable Daily
Intake (ADI), when the ARfD was not available (2,4-D). Additional requirements were the availability
of necessary data with regard to pesticide properties and that the compound is potentially used at
these selected locations (Table 3).
Physico-chemical properties of pesticides
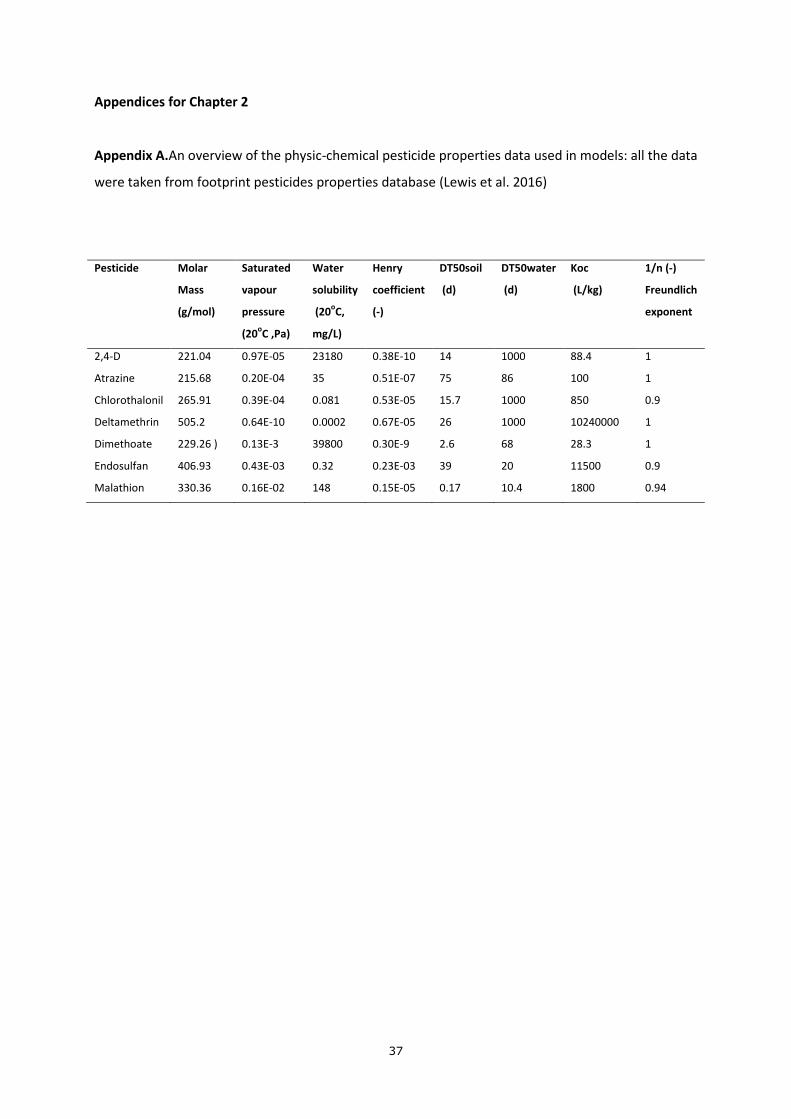
Pesticide data including their molar mass, saturated vapour pressure at 20 °C, water
solubility, half-life of transformation in soil (DT50soil), half-life of transformation in water (DT50water),
dissociation constant (pKa), coefficient for sorption on soil based on organic carbon content (Koc), and
their Freundlich exponent (1/n) were taken from the footprint Pesticide Properties Database (Lewis
et al. 2016) (Appendix A).
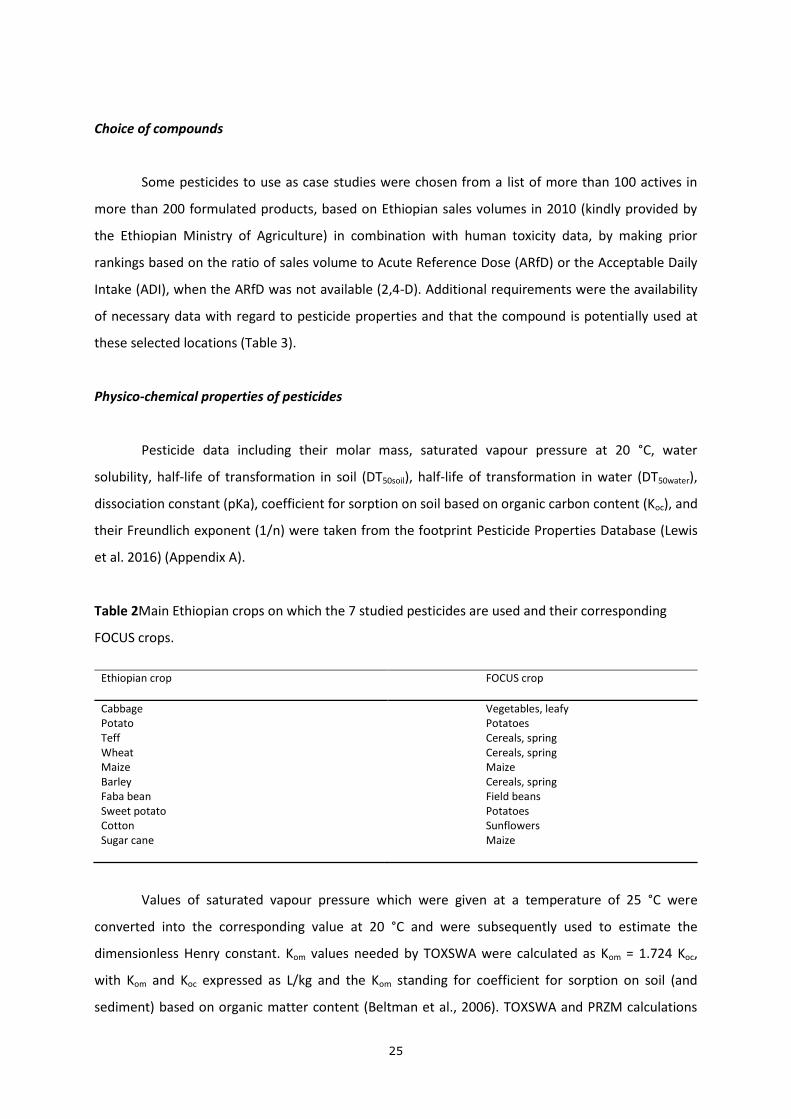
Table 2Main Ethiopian crops on which the 7 studied pesticides are used and their corresponding
FOCUS crops.
Ethiopian crop FOCUS crop
Cabbage Vegetables, leafy Potato Potatoes Teff Cereals, spring Wheat Cereals, spring Maize Maize Barley Cereals, spring Faba bean Field beans Sweet potato Potatoes Cotton Sunflowers Sugar cane Maize
Values of saturated vapour pressure which were given at a temperature of 25 °C were
converted into the corresponding value at 20 °C and were subsequently used to estimate the
dimensionless Henry constant. Kom values needed by TOXSWA were calculated as Kom = 1.724 Koc,
with Kom and Koc expressed as L/kg and the Kom standing for coefficient for sorption on soil (and
sediment) based on organic matter content (Beltman et al., 2006). TOXSWA and PRZM calculations
26
internally both use temperature corrected values for physico-chemical properties, using an Arrhenius
type of equation. During actual registration of a pesticide, properties of pesticides would be obtained
from the registration file required by the registration authorities, enabling a more rigid data quality
check. For this paper the data were taken from footprint for demonstration purposes only.
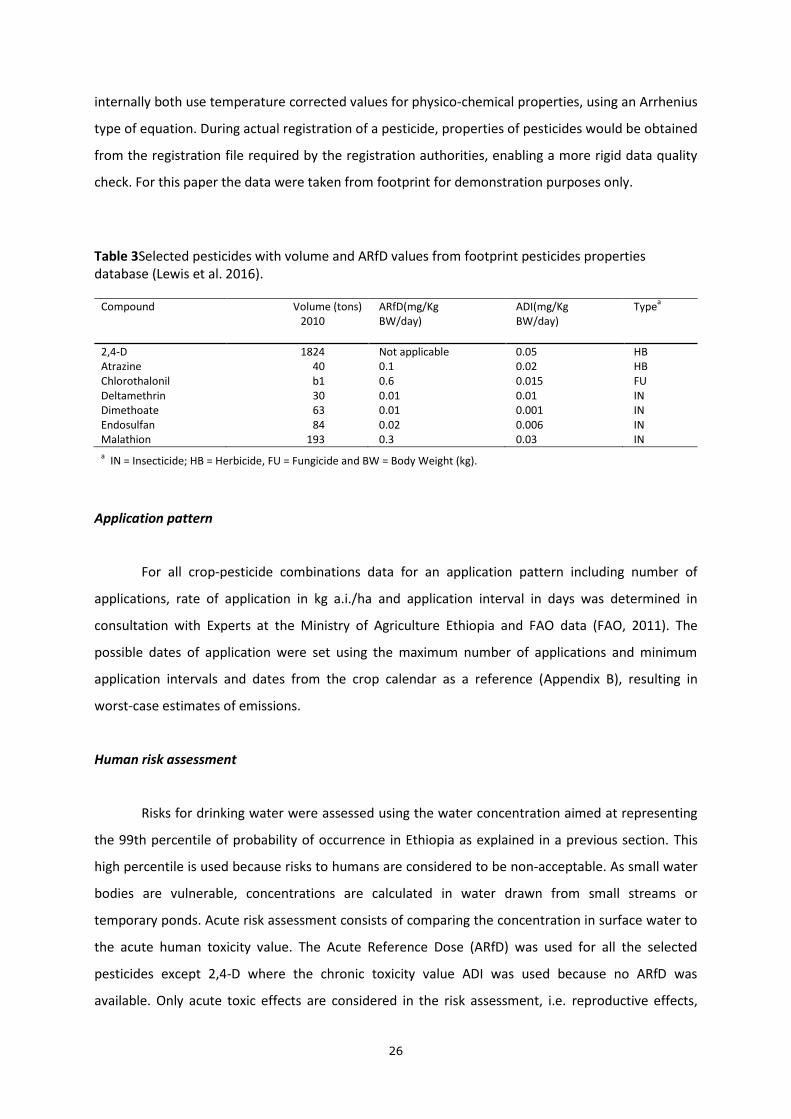
Table 3Selected pesticides with volume and ARfD values from footprint pesticides properties database (Lewis et al. 2016).
Compound Volume (tons) ARfD(mg/Kg ADI(mg/Kg Typea
2010 BW/day) BW/day)
2,4-D 1824 Not applicable 0.05 HB Atrazine 40 0.1 0.02 HB Chlorothalonil b1 0.6 0.015 FU Deltamethrin 30 0.01 0.01 IN Dimethoate 63 0.01 0.001 IN Endosulfan 84 0.02 0.006 IN Malathion 193 0.3 0.03 IN
a IN = Insecticide; HB = Herbicide, FU = Fungicide and BW = Body Weight (kg).
Application pattern
For all crop-pesticide combinations data for an application pattern including number of
applications, rate of application in kg a.i./ha and application interval in days was determined in
consultation with Experts at the Ministry of Agriculture Ethiopia and FAO data (FAO, 2011). The
possible dates of application were set using the maximum number of applications and minimum
application intervals and dates from the crop calendar as a reference (Appendix B), resulting in
worst-case estimates of emissions.
Human risk assessment
Risks for drinking water were assessed using the water concentration aimed at representing
the 99th percentile of probability of occurrence in Ethiopia as explained in a previous section. This
high percentile is used because risks to humans are considered to be non-acceptable. As small water
bodies are vulnerable, concentrations are calculated in water drawn from small streams or
temporary ponds. Acute risk assessment consists of comparing the concentration in surface water to
the acute human toxicity value. The Acute Reference Dose (ARfD) was used for all the selected
pesticides except 2,4-D where the chronic toxicity value ADI was used because no ARfD was
available. Only acute toxic effects are considered in the risk assessment, i.e. reproductive effects,

27
carcinogenicity or endocrine disruptive effects are not considered in the risk assessment. The
Estimated Short Term Intake (ESTI) was calculated with Eq. (1), using a body weight of 60 kg and
assuming a large portion (LP) of intake of 6 L drinking water per day. The value of 6 L is triple the
amount indicated by WHO (WHO, 2011) and is used because of high temperatures and possible high
physical exertion. ESTI expresses the intake of a pesticide as a percentage of the total acceptable
intake for one person in one day for acute toxicity.
ESTI = LP _dw × PE C99th
ARfD ×BW 100% eq. (1)
With:
ESTI = Estimated Short Term Intake (-)
LP_dw = Large Portion of drinking water (L/day;
PEC99th = 99th percentile concentration in the selected surface water (µg/L);
ARfD = Acute Reference Dose (µg/Kg BW*d) and
BW = Body Weight (kg).
Environmental risk assessment
Risks for aquatic organisms were estimated using the water concentration aimed at
representing the 90th percentile of probability of occurrence in Ethiopia as explained in a previous
section. This percentile is commonly used in EU registration procedures for risks for the aquatic
ecosystem, and reflects a somewhat less strict need for protection of aquatic organisms compared to
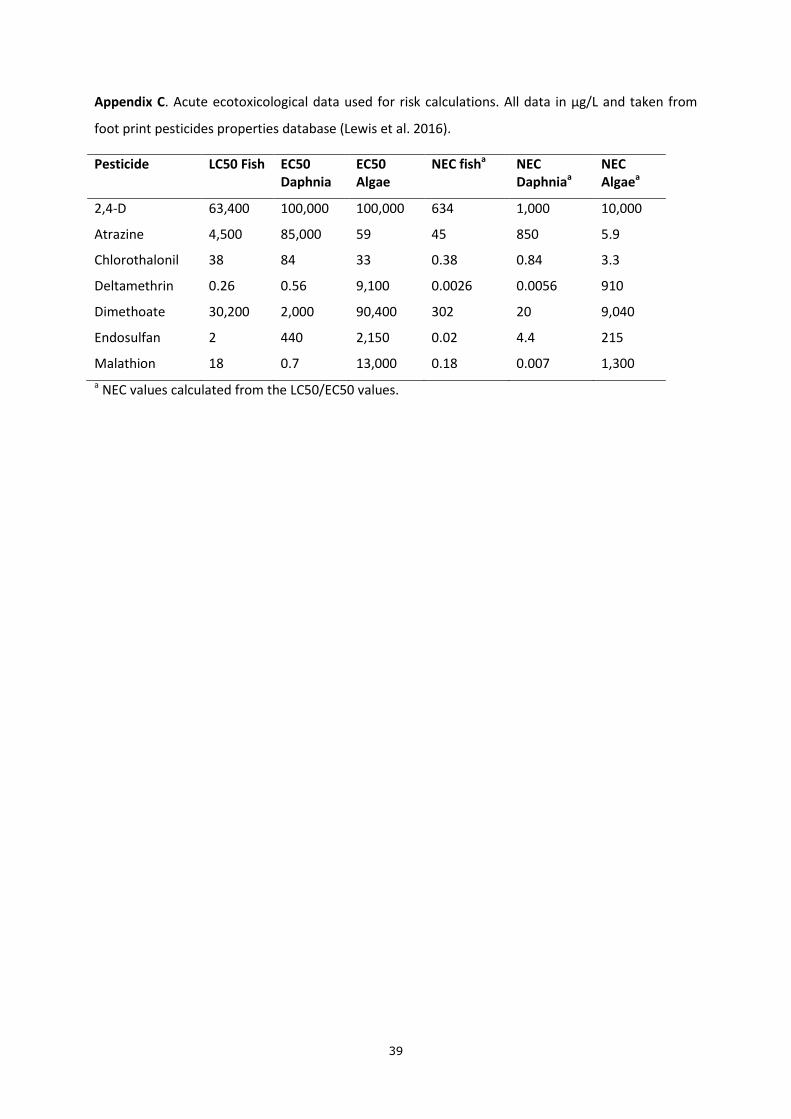
humans. The No Effect Concentrations (NEC) values for aquatic organisms were estimated from the
acute ecotoxicity data (LC50 and EC50) values for Daphnia, algae and fish taken from the footprint
pesticides properties database (Lewis et al. 2016). Toxicity to-wards rooted macrophytes, possibly a
useful future addition to the risk assessment procedure, is not yet considered. NEC was calculated for
each species by multiplying its EC/LC50 by an extrapolation factor, which was species dependent
(Eqs. (2)–(4)). These values were calculated in correspondence with the calculation of NEC values
(μg/L) for the surface water system as is commonly done in lower tiers of the EU registration
procedure and also applied by Peeters et al. (2008) (Appendix C).
28
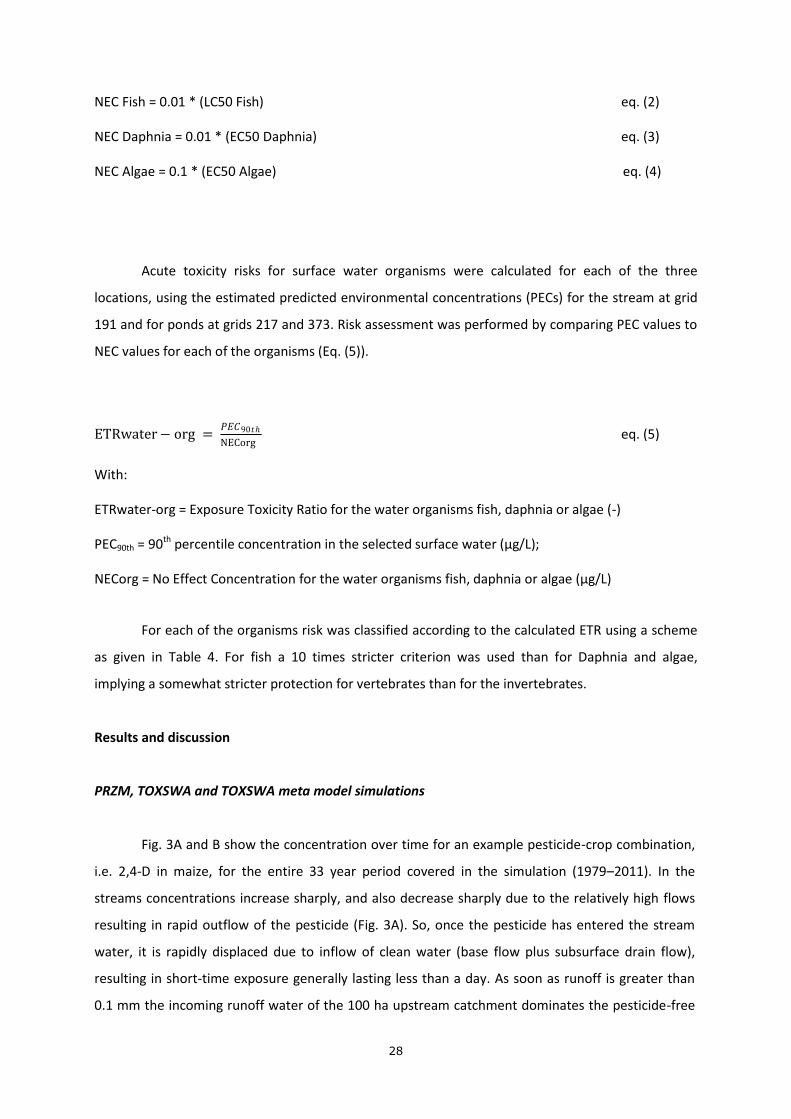
NEC Fish = 0.01 * (LC50 Fish) eq. (2)
NEC Daphnia = 0.01 * (EC50 Daphnia) eq. (3)
NEC Algae = 0.1 * (EC50 Algae) eq. (4)
Acute toxicity risks for surface water organisms were calculated for each of the three
locations, using the estimated predicted environmental concentrations (PECs) for the stream at grid
191 and for ponds at grids 217 and 373. Risk assessment was performed by comparing PEC values to
NEC values for each of the organisms (Eq. (5)).
ETRwater− org = 𝑃𝐸𝐶90𝑡ℎ
NECorg eq. (5)
With:
ETRwater-org = Exposure Toxicity Ratio for the water organisms fish, daphnia or algae (-)
PEC90th = 90th percentile concentration in the selected surface water (µg/L);
NECorg = No Effect Concentration for the water organisms fish, daphnia or algae (µg/L)
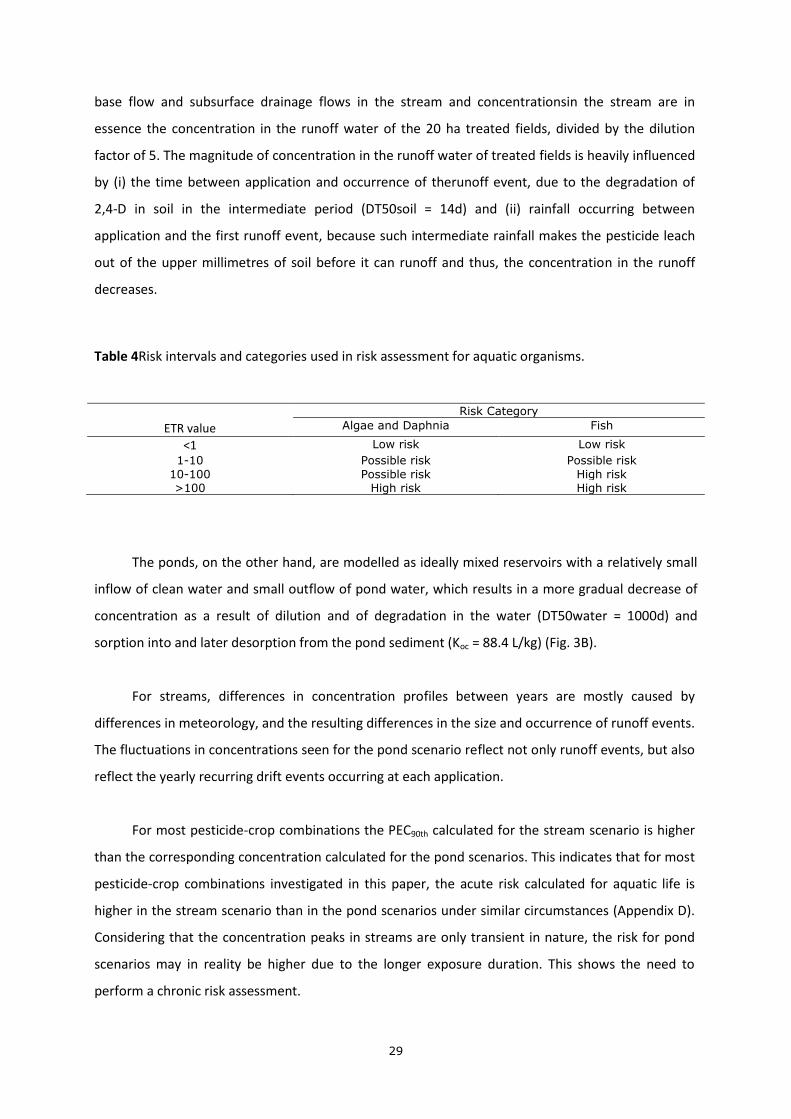
For each of the organisms risk was classified according to the calculated ETR using a scheme
as given in Table 4. For fish a 10 times stricter criterion was used than for Daphnia and algae,
implying a somewhat stricter protection for vertebrates than for the invertebrates.
Results and discussion
PRZM, TOXSWA and TOXSWA meta model simulations
Fig. 3A and B show the concentration over time for an example pesticide-crop combination,
i.e. 2,4-D in maize, for the entire 33 year period covered in the simulation (1979–2011). In the
streams concentrations increase sharply, and also decrease sharply due to the relatively high flows
resulting in rapid outflow of the pesticide (Fig. 3A). So, once the pesticide has entered the stream
water, it is rapidly displaced due to inflow of clean water (base flow plus subsurface drain flow),
resulting in short-time exposure generally lasting less than a day. As soon as runoff is greater than
0.1 mm the incoming runoff water of the 100 ha upstream catchment dominates the pesticide-free
29
base flow and subsurface drainage flows in the stream and concentrationsin the stream are in
essence the concentration in the runoff water of the 20 ha treated fields, divided by the dilution
factor of 5. The magnitude of concentration in the runoff water of treated fields is heavily influenced
by (i) the time between application and occurrence of therunoff event, due to the degradation of
2,4-D in soil in the intermediate period (DT50soil = 14d) and (ii) rainfall occurring between
application and the first runoff event, because such intermediate rainfall makes the pesticide leach
out of the upper millimetres of soil before it can runoff and thus, the concentration in the runoff
decreases.
Table 4Risk intervals and categories used in risk assessment for aquatic organisms.
ETR value
Risk Category
Algae and Daphnia Fish
<1 Low risk Low risk
1-10 Possible risk Possible risk
10-100 Possible risk High risk >100 High risk High risk
The ponds, on the other hand, are modelled as ideally mixed reservoirs with a relatively small
inflow of clean water and small outflow of pond water, which results in a more gradual decrease of
concentration as a result of dilution and of degradation in the water (DT50water = 1000d) and
sorption into and later desorption from the pond sediment (Koc = 88.4 L/kg) (Fig. 3B).
For streams, differences in concentration profiles between years are mostly caused by
differences in meteorology, and the resulting differences in the size and occurrence of runoff events.
The fluctuations in concentrations seen for the pond scenario reflect not only runoff events, but also
reflect the yearly recurring drift events occurring at each application.
For most pesticide-crop combinations the PEC90th calculated for the stream scenario is higher
than the corresponding concentration calculated for the pond scenarios. This indicates that for most
pesticide-crop combinations investigated in this paper, the acute risk calculated for aquatic life is
higher in the stream scenario than in the pond scenarios under similar circumstances (Appendix D).
Considering that the concentration peaks in streams are only transient in nature, the risk for pond
scenarios may in reality be higher due to the longer exposure duration. This shows the need to
perform a chronic risk assessment.

30
Fig. 3.Concentrations as a function of time for the stream (A, grid 191) and pond (B, grid373)
scenario for 2,4-D in maize.
PECs for the same pesticide may differ significantly between their use on different crops,
even when application rates are similar. For example the PEC99th for 2,4-D of the crops maize and teff
for the stream scenario are 2.9 and 58.4 respectively, i.e. differing by a factor 20. This difference is
mainly the result of the differences in the moment of pesticide application which is 10th of March
for maize while it is 10th of July for teff. This brings about a huge difference in the size of runoff
water and pesticide fluxes entering the streams, since for these crops and their timing of application,
the meteo-irrigation data for the 33years interval vary significantly between March (dry season) and
July (rainy season). When application times are close, PECs are also close, which is for instance
obvious from the PEC90th results of 2,4-D for teff and wheat, 58.4 and 49.2 respectively (application
dates are 10th of July for teff and 5th of July for wheat) (Tables 6 and 9).
Although the realistic worst case PECs are based upon a scenario se-lection procedure going
beyond the current state-of-the-art for surface water scenarios in e.g. the EU and the USA, the

31
scenario selection procedure can be considerably improved using simulated PECs for the entire
country, instead of days with daily rainfall above 20 mm. This is already common practice in e.g.
scenario definition for exposure of soil organ-isms to pesticides in the EU (Tiktak et al., 2013).
Parameterisation and running the suite of runoff and surface water fate models, including more
detailed information on e.g. soils, land use and hydrology would result in geographically distributed
PECs for the series of 33 years for Ethiopia. After repeating the procedure for a range of pesticides,
candidate grids can be selected according to the wished overall probability of occurrence of the PEC,
valid for the highest possible number of compounds.
Little validation of the PRZM and TOXSWA models has been done in the sense that for a
range of situations (the validation domain) the validity of simulated mechanistic processes has been
tested for a defined target output parameter for a range of compounds. Singh and Jones (2002)
demonstrated that PRZM provides a reasonable estimate of pesticide runoff at the edge of a field, by
analysing nine different runoff field studies. However, Young and Carleton (2006) proved that
random se-lection of the daily Runoff Curve Number from a distribution performed better than the
Curve Number calculation based on soil moisture, currently implemented in PRZM. The variability in
rainfall-runoff relation-ship for a 1.75 acre catchment in Oklahoma was better characterized by the
modified PRZM model than by the original model (Young and Carleton, 2006). For the TOXSWA
model Adriaanse et al. (2013) demonstrated that measured concentration-time profiles in water and
sediment of a stagnant ditch can only be well mimicked after calibration of the laboratory-measured
degradation rate in water and properties of the upper millimetres of sediment instead of using 5-cm
averaged values. So, continuing validation efforts are needed, involving adequate experiments with
measured site-specific system parameters and pesticide properties and that include situations and
compounds representing Ethiopia.
Sound validation of models requires a careful measurement of all relevant system and
physico-chemical input parameters, preferably established by an uncertainty and sensitivity analysis
(Jones and Mangels, 2002; Carbone et al., 2002; Westein et al., 1998). If relevant input parameters
may not be correctly estimated or cannot be verified comparing model output (and certainly output
from a suite of coupled models), to field measurements raises concerns about its usefulness and
validity, especially if contributions from non-modelled point sources cannot be excluded for the field
measurements. In addition, if populations of simulations and field measurements are compared, it is
crucial to demonstrate that the compared populations of simulations and field measurements
represent similar environmental conditions and that for each comparison the application regimes are
identical (Knäbel et al., 2012 and two ensuing rebuttals: Bach and Hollis, 2013; Reichenberger, 2013).
32
Results human risk assessment
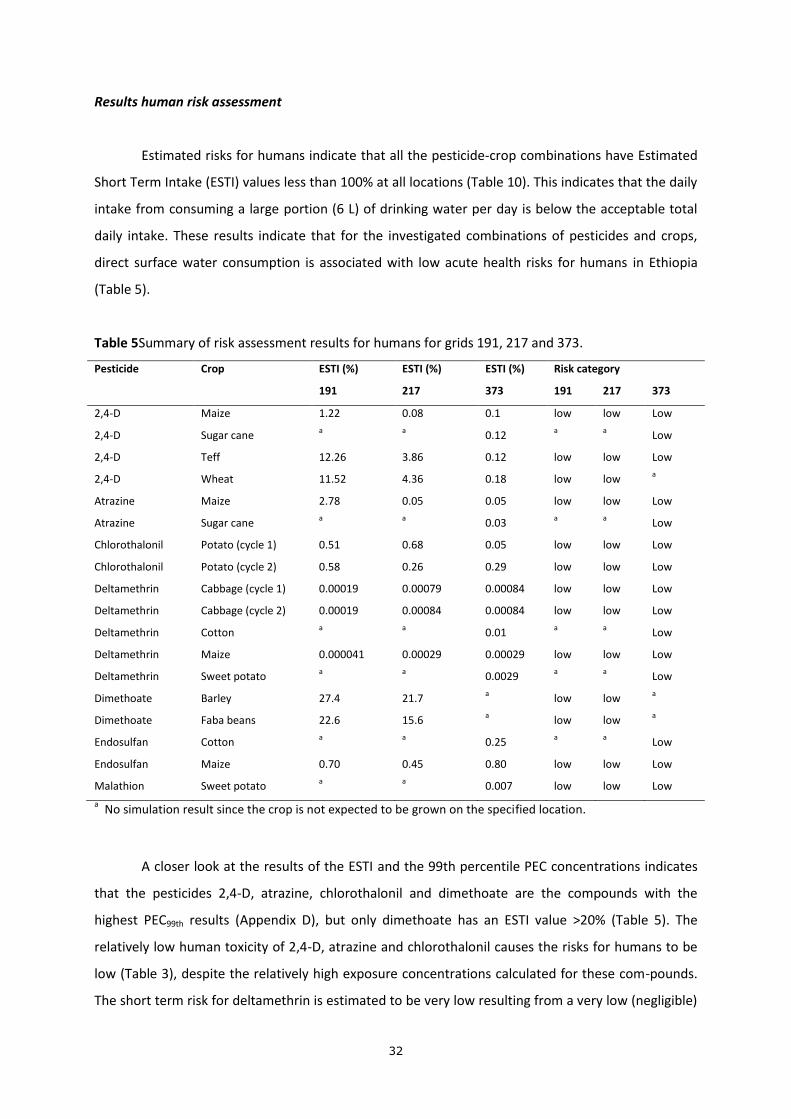
Estimated risks for humans indicate that all the pesticide-crop combinations have Estimated
Short Term Intake (ESTI) values less than 100% at all locations (Table 10). This indicates that the daily
intake from consuming a large portion (6 L) of drinking water per day is below the acceptable total
daily intake. These results indicate that for the investigated combinations of pesticides and crops,
direct surface water consumption is associated with low acute health risks for humans in Ethiopia
(Table 5).
Table 5Summary of risk assessment results for humans for grids 191, 217 and 373.
Pesticide Crop ESTI (%)
191
ESTI (%)
217
ESTI (%)
373
Risk category
191 217 373
2,4-D Maize 1.22 0.08 0.1 low low Low
2,4-D Sugar cane a
a 0.12
a
a Low
2,4-D Teff 12.26 3.86 0.12 low low Low
2,4-D Wheat 11.52 4.36 0.18 low low a
Atrazine Maize 2.78 0.05 0.05 low low Low
Atrazine Sugar cane a
a 0.03
a
a Low
Chlorothalonil Potato (cycle 1) 0.51 0.68 0.05 low low Low
Chlorothalonil Potato (cycle 2) 0.58 0.26 0.29 low low Low
Deltamethrin Cabbage (cycle 1) 0.00019 0.00079 0.00084 low low Low
Deltamethrin Cabbage (cycle 2) 0.00019 0.00084 0.00084 low low Low
Deltamethrin Cotton a
a 0.01
a
a Low
Deltamethrin Maize 0.000041 0.00029 0.00029 low low Low
Deltamethrin Sweet potato a
a 0.0029
a
a Low
Dimethoate Barley 27.4 21.7 a low low
a
Dimethoate Faba beans 22.6 15.6 a low low
a
Endosulfan Cotton a
a 0.25
a
a Low
Endosulfan Maize 0.70 0.45 0.80 low low Low
Malathion Sweet potato a
a 0.007 low low Low
a No simulation result since the crop is not expected to be grown on the specified location.
A closer look at the results of the ESTI and the 99th percentile PEC concentrations indicates
that the pesticides 2,4-D, atrazine, chlorothalonil and dimethoate are the compounds with the
highest PEC99th results (Appendix D), but only dimethoate has an ESTI value >20% (Table 5). The
relatively low human toxicity of 2,4-D, atrazine and chlorothalonil causes the risks for humans to be
low (Table 3), despite the relatively high exposure concentrations calculated for these com-pounds.
The short term risk for deltamethrin is estimated to be very low resulting from a very low (negligible)

33
PEC99th concentration calculated for both the stream and the pond scenarios.
The highest uncertainty in the human risk assessment is that the contribution of other
foodstuffs to the ESTI is unknown. So it is un-known whether an ESTI value of 20% is posing a risk to
humans in combination with exposure through foodstuffs from a normal Ethiopian diet or the
Ethiopian diet. An example of such a diet is the one defined by the WHO GEMS (Global
Environmental Monitoring System) cluster diets (WHO, 2005). In this classification all countries of the
world are classified in 13 diets for different regions, based on agricultural and trade data. The
Ethiopian diet is clustered together with central African coastal countries and this diet composition
could be used to perform an initial risk assessment using MRLs (Maximum Residue Levels) or
measured residues to evaluate the contribution of drinking water to the overall exposure through
foods. Van den Brink et al. (2013) performed a similar analysis of the toxicity of using surface
Table 6.Summary of risk assessment results for aquatic organism grids 191 (stream highland), 217
(pond highland) and 373 (pond lowland).
Pesticide Crop ETR values for grid 191
ETR values for grid 217
ETR values for grid 373
Algae Daphnia Fish Algae Daphnia Fish Algae Daphnia Fish
2,4-D Maize <0.1 <0.1 <0.1 <0.1 <0.1 <0.1 <0.1 <0.1 <0.1 2,4-D Sugar cane <0.1 <0.1 <0.1 2,4-D Teff <0.1 <0.1 <0.1 <0.1 <0.1 <0.1 <0.1 <0.1 <0.1 2,4-D Wheat <0.1 <0.1 <0.1 <0.1 <0.1 <0.1 <0.1 <0.1 <0.1 Atrazine Maize 2.64 <0.1 0.35 <0.1 <0.1 <0.1 <0.1 <0.1 <0.1 Atrazine Sugar cane <0.1 <0.1 <0.1
Chlorothalonil Potato (cycle 1) 8.58 33.69 74.47 9.69 38.09 84.21 0.48 1.90 4.21
Chlorothalonil Potato (cycle 2) 10.09 39.64 87.63 4.30 16.90 37.34 4.79 18.81 41.58
Deltamethrin Cabbage (cycle 1) <0.1 <0.1 <0.1 <0.1 0.14 0.30 <0.1 0.16 0.33
Deltamethrin Cabbage (cycle 2) <0.1 <0.1 <0.1 <0.1 0.15 0.32 <0.1 0.15 0.32
Deltamethrin Cotton <0.1 1.18 2.54 Deltamethrin Maize <0.1 <0.1 <0.1 <0.1 <0.1 0.12 <0.1 <0.1 0.11 Deltamethrin Sweet potato <0.1 0.52 1.11 Dimethoate Barley <0.1 1.31 <0.1 <0.1 0.83 <0.1 Dimethoate Faba beans <0.1 1.09 <0.1 <0.1 0.64 <0.1 Endosulfan Cotton <0.1 <0.1 13.0 Endosulfan Maize <0.1 0.25 55 <0.1 0.13 29.5 <0.1 0.14 31.5 Malathion Sweet potato <0.1 30.0 1.17
water as drinking water, as well as the consumption of fish and macrophytes obtained from this
surface water, for Thailand and Sri Lanka. They concluded that no single food item caused the
exceedences of human toxicity reference values and that the risks are not associated with a single
34
crop. Therefore it is of importance to assess the risk of the total diet and not only for single items in
order to obtain an estimation of the overall risk (Van den Brink et al., 2013).
Results aquatic ecosystem risk assessment
The ETRs for all the compounds and crops along the three locations (grids) indicates that 2,4-
D and deltamethrin are low risks for all the aquatic organisms (algae, Daphnia and fish) at the stream
scenario 191. However atrazine, chlorothalonil, dimethoate and endosulfan, have possible and high
risks across the representative organisms (Table 6).
For the highland pond scenario 217, the pesticides 2,4-D, atrazine, deltamethrin and
dimethoate pose low risks for algae, Daphnia and fish, while chlorothalonil and endosulfan have
possible risks for algaeand Daphnia and high risk for fish (Table 6). In the lowland pond scenario (grid
373), 2,4-D and atrazine are with low risks for all the representative organisms, while chlorothalonil,
deltamethrin, endosulfan and malathion pose possible and high risks for some of the pesticide-crop
combinations (Table 6). All the high risks recorded for fish are mainly due to the implementation of a
ten times stricter risk categorization for fish which was considered necessary for the stricter
protection of fish and other surface water vertebrates. The highest estimated risk category is taken
as representative for the overall risk for all the aquatic organisms within a grid.
One of the challenges of the aquatic risk assessment of pesticides in (sub-)tropical regions is
the absence of sensitivity data of local species (Rico et al., 2011). Daam and Van den Brink (2010)
reviewed the literature on the differences in sensitivity between (sub-) tropical and temperate
species and concluded that no systematic difference in sensitivity could be found. Teklu (pers.
comment) performed toxicity tests with three invertebrate species indigenous to Ethiopia and
concluded that the sensitivity of these species to the pesticides endosulfan and diazinon was
comparable to values present in the literature for taxonomically related species. This means that
toxicity data from other geographical areas can probably be used to perform a risk assessment for an
Ethiopian situation. NEC estimates based on single species toxicity data of Daphnia magna will result
in a conservative risk assessment for the compounds evaluated in this study, but might
underestimate the risks to invertebrates for neonicotinoids and insect growth regulators (Brock and
Van Wijngaarden, 2012). It is, therefore, recommended to include other invertebrate species like
Chironomus riparius and Americamysis bahia in the NEC calculations when these pesticide groups are
considered.

35
Conclusion and recommendation
For the pesticide-crop combinations investigated, estimated short term risks for humans
from using surface water as a source of drinking water are quite small. Possible and high risks are
estimated for aquatic organisms for some pesticides-crop combinations. The ESTI and ETR
calculations and risk estimates are based on a procedure very similar to the risk assessment
procedure at EU level, as outlined by EFSA (2013). Input on crops, meteorology, irrigation and
application pattern were tailored to the Ethiopian situation, including the distinctly innovative use of
a 33-year meteorological data series, thus increasing the reliability of the results obtained. A close
look at the comparison between PECs with-in pesticides, crops and locations, and pond versus
stream scenario indicates that results are logical and differences can be explained. However,
ultimately the usefulness of model calculations for registration purposes requires validation of model
outcomes using field measurements and validation studies on, especially the fate assessment, are
needed.
Protection goals were set after discussion with the appropriate stakeholders; small water
bodies close to intensive agriculture and relatively densely populated areas were selected, in order to
simulate realistic, vulnerable situations. Evaluating the spatial and temporal variation of the main
driving factor, runoff, for concentrations in the small water bodies, 99th and 90th percentile
probability of occurrence scenario locations were selected, that thus protect the large majority of the
aimed small water bodies across Ethiopia. The final decision on adoption of the model calculations
for a formal pre-registration risk assessment of pesticides depends upon agreement by the Ethiopian
government and all the stakeholders participating in the pesticide import and distribution channel.
As the accuracy of results depends on the availability and quality of the available input data retrieval
of pesticide application pattern and quality control of all submitted pesticide physico-chemical and
ecotoxicological properties for all the registered pesticides in Ethiopia is recommended. Performing
the risk assessment for all registered pesticides accordingly is a possible next step, which will give
insight in the impact on the number of registered pesticides in Ethiopia after implementation of the
proposed pre-registration risk assessment procedure.
Implementation of the methods described for risk characterization constitute a good step
forward in the pesticide registration procedure in Ethiopia. Addition of aquatic macrophytes as an
ecotoxicological endpoint may constitute a welcome future addition to the risk assessment
procedure.
36
Acknowledgements
The present study was funded by the Pesticide Risk Reduction Programme — Ethiopia (PRRP-
Ethiopia), a joint collaborative project on pesticide registration and post-registration between the
Ministry of Agriculture of the Federal Republic of Ethiopia, and the State of the Netherlands
represented by the Ministry of Foreign Affairs/for Development Cooperation and the Technical
Cooperation Programme (TCP) of the Food and Agricultural Organisation of the United Nations.
Appendix A. Supplementary data
37
Appendices for Chapter 2
Appendix A.An overview of the physic-chemical pesticide properties data used in models: all the data
were taken from footprint pesticides properties database (Lewis et al. 2016)
Pesticide Molar
Mass
(g/mol)
Saturated
vapour
pressure
(20oC ,Pa)
Water
solubility
(20oC,
mg/L)
Henry
coefficient
(-)
DT50soil
(d)
DT50water
(d)
Koc
(L/kg)
1/n (-)
Freundlich
exponent
2,4-D 221.04 0.97E-05 23180 0.38E-10 14 1000 88.4 1
Atrazine 215.68 0.20E-04 35 0.51E-07 75 86 100 1
Chlorothalonil 265.91 0.39E-04 0.081 0.53E-05 15.7 1000 850 0.9
Deltamethrin 505.2 0.64E-10 0.0002 0.67E-05 26 1000 10240000 1
Dimethoate 229.26 ) 0.13E-3 39800 0.30E-9 2.6 68 28.3 1
Endosulfan 406.93 0.43E-03 0.32 0.23E-03 39 20 11500 0.9
Malathion 330.36 0.16E-02 148 0.15E-05 0.17 10.4 1800 0.94

38
Appendix B.Data on pesticide application patterns for different crop pesticide combinations
Pesticide Use Crop Number of
applications
Rate of
application
(kg a.i./ha)
Application
interval
(days)
Possible crop stage during
application
Dimethoate Russian wheat
aphids
Barley 2 0.6 7 E-1/2 M (29 July, 5 Aug)
Faba beans 2 0.48 7 E-1/2 M (23 July, 30 July)
Endosulfan African bollworm,
Leafhoppers
Cotton 6 1.05 7-10 E-1/2M (12 July, 19 July, 26
July, 2 Aug, 9 Aug, 16 Aug)
Maize 2 0.7 7-10 E-1/2M (10 April, 17 April)
Deltamethrin African bollworm
Leafhoppers
Cotton 5 0.18 7 E-1/2 M (12 July, 19 July, 26
July, 2 Aug, 9 Aug)
Maize 1 0.021 - E-1/2 M (17 April)
Cabbage 5 0.025 10 E-1/2 M
1st (4 June, 14 June, 24 June, 4
July, 14 July)
2nd (21 Nov, 1 Dec, 11 Dec, 21
Dec, 31 Dec)
Sweet
potato
4 0.09 7-10 E-1/2 M (19 July, 26 July, 2
Aug, 9 Aug)
2,4-D Broad leaf weeds Wheat 1 1.44 - E-1/2M (10 July)
Teff 1 1.44 - E-1/2M (5 July)
Maize 1 1.44 - E-1/2M (10 March)
Sugar cane 1 2.88 - E-1/2M (2 Jan)
Malathion Sweet potato
butterfly
Sweet
potato
7 1 10 E-1/2 M (10 July, 20 July, 30
July, 9 Aug, 19 Aug, 29 Aug, 8
Sept )
Atrazine Both grass and
broadleaf weeds
Maize 1 1.75 - (10 March)
Sugar cane 1 1.75 - (2 Jan)
Chlorothalonil Late blight Potato 3 1.5 7-14 E-1/2E
1st(12 July, 19 July, 26 July)
2nd (19 Jan, 26 Jan, 1 Feb)
E = before emergence; E - ½M = emergence to halfway maturation; ½M – M = halfway maturation to
maturation; M – H = maturation to just before harvest
39
Appendix C. Acute ecotoxicological data used for risk calculations. All data in μg/L and taken from
foot print pesticides properties database (Lewis et al. 2016).
Pesticide LC50 Fish EC50 Daphnia
EC50 Algae
NEC fisha NEC Daphniaa
NEC Algaea
2,4-D 63,400 100,000 100,000 634 1,000 10,000
Atrazine 4,500 85,000 59 45 850 5.9
Chlorothalonil 38 84 33 0.38 0.84 3.3
Deltamethrin 0.26 0.56 9,100 0.0026 0.0056 910
Dimethoate 30,200 2,000 90,400 302 20 9,040
Endosulfan 2 440 2,150 0.02 4.4 215
Malathion 18 0.7 13,000 0.18 0.007 1,300
a NEC values calculated from the LC50/EC50 values.
40
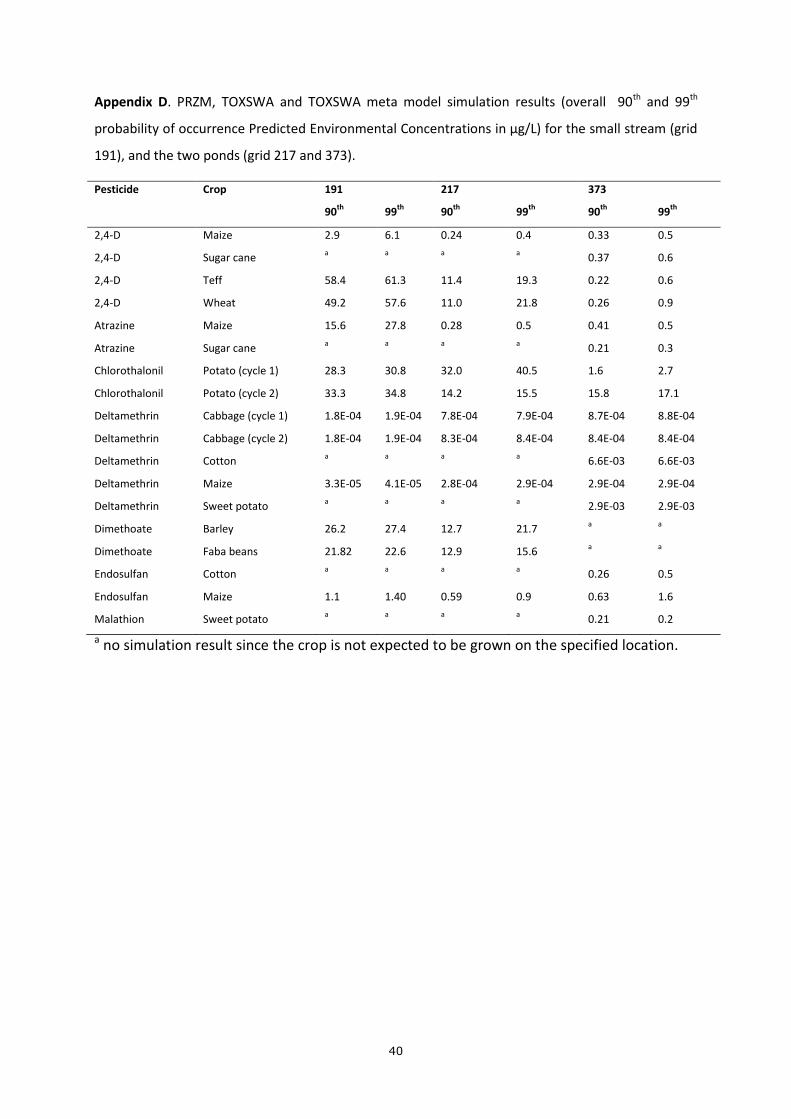
Appendix D. PRZM, TOXSWA and TOXSWA meta model simulation results (overall 90th and 99th
probability of occurrence Predicted Environmental Concentrations in μg/L) for the small stream (grid
191), and the two ponds (grid 217 and 373).
Pesticide Crop 191 217 373
90th
99th
90th
99th
90th
99th
2,4-D Maize 2.9 6.1 0.24 0.4 0.33 0.5
2,4-D Sugar cane a
a
a
a 0.37 0.6
2,4-D Teff 58.4 61.3 11.4 19.3 0.22 0.6
2,4-D Wheat 49.2 57.6 11.0 21.8 0.26 0.9
Atrazine Maize 15.6 27.8 0.28 0.5 0.41 0.5
Atrazine Sugar cane a
a
a
a 0.21 0.3
Chlorothalonil Potato (cycle 1) 28.3 30.8 32.0 40.5 1.6 2.7
Chlorothalonil Potato (cycle 2) 33.3 34.8 14.2 15.5 15.8 17.1
Deltamethrin Cabbage (cycle 1) 1.8E-04 1.9E-04 7.8E-04 7.9E-04 8.7E-04 8.8E-04
Deltamethrin Cabbage (cycle 2) 1.8E-04 1.9E-04 8.3E-04 8.4E-04 8.4E-04 8.4E-04
Deltamethrin Cotton a
a
a
a 6.6E-03 6.6E-03
Deltamethrin Maize 3.3E-05 4.1E-05 2.8E-04 2.9E-04 2.9E-04 2.9E-04
Deltamethrin Sweet potato a
a
a
a 2.9E-03 2.9E-03
Dimethoate Barley 26.2 27.4 12.7 21.7 a
a
Dimethoate Faba beans 21.82 22.6 12.9 15.6 a
a
Endosulfan Cotton a
a
a
a 0.26 0.5
Endosulfan Maize 1.1 1.40 0.59 0.9 0.63 1.6
Malathion Sweet potato a a
a
a 0.21 0.2
a no simulation result since the crop is not expected to be grown on the specified location.
41
Chapter 3
Sensitivity of Ethiopian aquatic macroinvertebrates to the pesticides
endosulfan and diazinon, compared to literature data.
Berhan M. Teklu1,2, Negussie Retta2, Paul J. Van den Brink1,3
1 Department ofAquatic Ecology and Water Quality Management, Wageningen University,
Wageningen University and Research centre, P.O. Box 47, 6700 AA Wageningen, The Netherlands
2 College of Natural Sciences, University of Addis Ababa, 4 Kiklo Campus, Addis Ababa, Ethiopia
3 Alterra, Wageningen University and Research centre, P.O. Box 47, 6700 AA Wageningen, The
Netherlands
Manuscript pending acceptance for publication by Ecotoxicology after revisions
42
Abstract
The aims of the present study were to present a methodology for toxicity tests that can be used
when analytical resources to verify the test concentrations are limited, and to evaluate whether the
sensitivity of a limited number of Ethiopian species to pesticides differs from literature values for,
mainly, temperate species. Acute toxicity tests were performed using three Ethiopian aquatic
invertebrate species, one crustacean (Diaphanosoma brachyurum) and two insects (Anopheles
pharoensis and Culex pipiens)and using the pesticides endosulfan and diazinon. All species–pesticide
combinations were tested in duplicate to estimate the consistency, i.e. the intra-laboratory variation,
in test results. Daphnia magna was tested as well to allow the test results to be compared directly
with values from the literature. Results indicate that the differences between the EC50s obtained for
D. magna in this study and those reported in the literature were less than a factor of 2. This indicates
that the methodology used is able to provide credible toxicity values. The results of the duplicated
tests showed intra-laboratory variation in EC50 values of up to a factor of 3, with one test showing a
difference of a factor of 6 at 48h. Comparison with available literature results for arthropod species
using species sensitivity distributions (SSDs) indicated that the test results obtained in this study fit
well in the log-normal distribution of the literature values. We conclude that the methodology of
performing multiple tests to check for consistency of test results and performing tests with D. magna
for comparison with literature values to check for accuracy is able to provide reliable effect threshold
levels and that the tested Ethiopian species did not differ in sensitivity from the arthropod species
reported on in the literature.
Keywords single-species toxicity tests; tropics; ecological risk assessment; species sensitivity
distribution; Africa

43
Introduction
The current intensification of agricultural activities in Ethiopia results in a steady increase in
both the types and quantities of agrochemicals (Taddese and Asferachew, 2008). Pesticides may,
however, cause risks to aquatic ecosystems through contamination by spray drift, run-off, drainage
and accidental spills. To prevent environmental harm from the application of these agrochemicals, it
is essential to perform a prospective environmental risk assessment before registering a pesticide
(Teklu et al., 2015). Estimating the risks of pesticides to the aquatic ecosystem includes an effect
assessment which is often based on acute and chronic laboratory tests of the toxicity of these
compounds to aquatic species. Brock et al. (2006) noted the importance of acute toxicity tests with
fish, algae and invertebrates for the first tier in the risk assessment of pesticides, in order to identify
ecosystem components whose sensitivity should be further evaluated in higher-tier risk assessment
procedures (Van den Brink, 2013). These tests also help the retrospective chemical risk assessment,
by identifying species that are sensitive to pesticide pollution, so that the presence or absence of a
sensitive species in an area may be an indication of the pollution status of that particular area (e.g.
Wahizatul, et al, 2011), although the absence of a species may have other causes as well.
At present, such an assessment often depends on the results of toxicity tests performed with
temperate species, as data on tropical species are scarce (Kwok et al., 2007). Risk assessments
performed for tropical ecosystems should be (partially) based on toxicity data for tropical species,
since differences in sensitivity might be expected (Daam and Van den Brink, 2010), although
empirical data suggest no systematic differences in sensitivity (e.g. Kwok et al., 2007; Rico et al.,
2010). Gathering sensitivity data for local species enables further examination of whether European
and North American data can be extrapolated to other geographical areas (Hose and Van den Brink
2004; Maltby et al., 2005). Although Ethiopia is located in the tropical region, the risk assessment for
pesticide registration is solely dependent on the available temperate acute toxicity data (Teklu et al,
2015). Only a few toxicity tests have been performed with Ethiopian species, one example being a
study evaluating the effect of the poisonous extract of the plant Milletia ferrugineaon Baetidae
(mayflies) and Hydropsychididae (caddisflies) (Karunamoorthi et al., 2009).
Besides the laboratory infrastructure needed to perform these tests, one other challenge to
conducting such tests in a developing country like Ethiopia is the availability of analytical equipment
and the costs of analyses to verify the test concentrations used in the experiments. In this paper we
present a simple methodology that circumvents the need for test concentration verification, which
might be helpful for future aquatic risk assessment in Ethiopia or elsewhere in the developing world,
where the availability of analytical laboratory equipment is limited. The proposed methodology
44
includes performing multiple tests to check for consistency of test results and performing tests with
D. magna for comparison with literature values to check for accuracy.
The objectives of the current study were (i) to produce toxicity data for local Ethiopian
species, (ii) to compare the sensitivity of the Ethiopian species with literature data which relates
mainly to temperate species and (iii) to present a simple methodology for conducting tests which
reduces the need for analytical verification of the exposure concentrations.
Materials and methods
Test compounds
One organochlorine (endosulfan) and one organophosphate (diazinon) insecticide were
chosen as model compounds to evaluate the effects of pesticides on Ethiopian aquatic
macroinvertebrates. This choice was based on their frequency of use in Ethiopia, available temperate
toxicity data and the results of a previously performed risk assessment for Ethiopian aquatic
ecosystems (Teklu et al., 2015). The pesticides, containing 99% active ingredient (endosulfan or
diazinon) were obtained from the Adami Tulu Pesticide Processing S.C. in Addis Ababa, Ethiopia.
Test organisms
The sensitivity of two crustaceans (Daphnia magna and Diaphanosoma brachyurum) and two
insect species (Anopheles pharoensis and Culex pipiens) was assessed for both endosulfan and
diazinon. D. magna individuals were obtained from the National Fisheries and Aquaculture Research
Centre (part of the Ethiopian Institute of Agricultural Research) while D. brachyurum and A.
pharoensis were collected from the Koka area and C. pipiens from the Entoto natural park located in
the periphery of Addis Ababa. Insect larvae were kept for two days for acclimatization in the
laboratory in a tray with water from the collection site and introduced to test water. Second and
third instar larvae were used in the tests. All collected larvae were maintained in the laboratory until
emergence, and the flying adult stage was used for further identification. D. magna and D.
brachyurum were cultured in the laboratory in a culturing dish with water from the collection site,
and the tests were started when enough individuals of similar size and age category were available.
All arthropods were identified using a standard identification key and in consultation with Addis
Ababa University experts (Hopkins 1952; Verrone 1962).D. magna was selected because it is the
most important international standard test species and could thus be used to validate the test
45
performance against literature data. The other species were selected based on their availability and
non-cannibalistic behaviour and to include species from both the insect and the crustacean groups.
Second instar individuals were used for the tests with the insect species, while individuals younger
than 24h were used for the tests with the crustaceans.
Toxicity tests
All toxicity experiments were performed at the Fisheries and Limnology Laboratory of Addis
Ababa University College of Natural Sciences, in accordance with the OECD’s Daphnia sp. protocol
(OECD, 2004). The acute toxicity tests were performed using seven concentrations (including
control), with three replications per treatment. The toxicity tests used a static exposure extended for
96 h with a single pesticide spiking at the beginning of the test while establishing treatments.The
dissipation from the water phase during the 96h experimental test period was expected to be low for
endosulfan (DT50hydrolysis = 20 days, pH = 7, T=20 °C, Lewis et al., 2016) and 50% for diazinon
(DT50hydrolysis = 138 days, pH = 7, T=20 °C, Lewis et al., 2016). All tests were done in 1.5 L glass jars
filled with 1 or 0.5 L of water for insects and crustaceans, respectively. The crustaceans used were
the cultured individuals, while insects were introduced into the test water after two days of
acclimatization. Dechlorinated tap water was used for the crustaceans, while insects were tested in
filtrated (mesh size 1-1.5 nm) water from the collection site. Stock solutions of 100 mg/L were
prepared using demineralised water for both pesticides, using absolute ethanol (0.1%) as a solvent in
view of the low and moderate water solubility of the substances (Lewis et al., 2016), leading to an
ethanol content of 0.003% at the highest endosulfan concentration and of 0.0004% at the highest
diazinon concentration. Test concentrations were prepared following successive serial dilutions
stirred thoroughly for 15 seconds for each replication. Concentrations were chosen in such a way
that no effects were expected at the lowest concentration and 100% effects at the maximum
concentration, using a published EC50 value from a related temperate species as a reference, while
the concentrations in between were geometrically spaced (see supplementary information for the
concentrations evaluated). In each test, ten individuals were added to each replicate, assuming non
cannibalistic behaviour of all test species. During the experiments the average temperature was 20 ±
0.25 °C, dissolved oxygen (DO) averaged 4.57 ± 0.41 mg/L and pH 6.52 ± 0.13. Measurements were
performed at the beginning and end of the experiment using a portable dissolved oxygen (Handy
Polaris, OxyGuard, USA) and pH meter (WTW multi 340i, USA).
Invertebrate immobility was taken as an endpoint for assessing the effects of endosulfan and
diazinon, as described in Rubach et al. (2011). All pesticide–species combinations were tested twice,
46
except for the test with endosulfan and D. magna. In most tests, counting was done every 24h until
the end of the test (96h), while two tests were only evaluated after 48 and 96h (see supplementary
material).
Analytical verification of stock solution
Samples of the stock solutions were taken to Wageningen (The Netherlands) in glass vials for
analytical verification of the concentration. Some decrease in the concentration of the stock
solutions of diazinon and endosulfan was expected as they were stored for 9 months in a fridge at 5
°C at an Addis Ababa University (AAU) laboratory and for 3 months frozen (in Wageningen). To verify
the actual concentration of the stock solutions (100 mg/L) at the time of testing, the expected
degradation during the storage period was calculated using the degradation rates available in the
literature. It was assumed that no degradation took place while frozen, since both pesticides are
moderately volatile given their saturated vapour pressure and associated Henry coefficients of
0.000025 (diazinon) and 0.00043 (endosulfan) (Lewis et al., 2016). The DT50 values of endosulfan
and diazinon found in the literature for a pH of 5 were established at 25 and 20 °C, respectively. The
effect of the lower temperature in the fridge (5 °C) on the degradation was accounted for using a
correction to the rate determined at reference conditions. This was calculated with the Arrhenius
equation (Boesten, 1986), using the molar Arrhenius activation energy for hydrolysis of pesticides in
water, 75,000 J/mol (Deneer et al., 2010). Since the degradation of diazinon is expected to be mainly
driven by hydrolysis and, therefore, pH dependent, we also measured the pH of the solution before
analytical verification of the test compound.
After storage of the stock solutions in Addis Ababa and Wageningen, the concentrations in
the stock solutions were verified by means of GC-ECD. For this purpose, dilutions of the stock
solutions were prepared for both diazinon (50-fold) and endosulfan (10,000-fold). Samples (3 µL)
were injected at an inlet temperature of 250 °C with a split ratio of 1:20 on a HP5MS column (15 m x
0.25 mm with 0.25 µm film thickness). The oven was operated under isothermal conditions at a
temperature of 180 °C, while the ECD was set at a temperature of 300 °C. The retention times were
found to be 8.15 min. (diazinon) and 12.35 min. (endosulfan), respectively. Calculation of the
concentrations was based on external standards.

47
Data analysis
The EC10 and EC50 values and their 95% confidence intervals were estimated after 24, 48, 72,
and 96 h by log-logistic regression using the number of immobile individuals per replicate as input
(Rubach et al., 2011). The test was considered valid when the immobilisation observed in the
controls was 10% or less at 48 h and 20% or less at 96 h. The48 h value is based on the acceptance
criteria of the OECD protocols, which is 10% for the 24h Daphnia sp. test and 15% for the 48h
Chironomus sp. test. The test results were considered to be invalid when a control immobilisation
higher than 10 % was observed at 48 h or higher than 20% was observed at 96 h. Results from
duplicate tests were considered to be different when the 96 h EC50 values differed by a factor of 3 or
more (Boxall et al., 2001; Baird et al., 1989). Since some of the 96 h test results were invalid, the
comparisons were also made based on 48 h values. The 48 h EC50 and 96 h EC50 values of D. magna
were compared in the same way with those reported in the in the ECOTOX data base
(www.epa.gov/ecotox, assessed on 22-12-2015).
In order to compare our findings with those available in the literature, species sensitivity
distributions (SSDs) were constructed for each combination of exposure time (48h and 96h) and
pesticide (endosulfan and diazinon) (Posthuma et al. 2002). This was done using the ETX2.0 program
(Van Vlaardingen et al. 2004), which fits a log-normal model to the data. For each SSD, the median
50% and 5% hazardous concentration (HC50 and HC5) and its standard deviation (SD) were
calculated. The goodness-of-fit was tested using the Anderson–Darling test for normality. The data
used for the construction of the SSDs of both pesticides for arthropods were extracted from the valid
test results from the current study and the ECOTOX database (www.epa.gov/ecotox, accessed on 22
December 2015). When multiple values were available for the same species, the geometric mean
was calculated.
Results and Discussion
Analytical verification of stock solution
According to the analytical results, diazinon had decreased from the nominal concentration
of the stock solution of 100 mg/L to a concentration as low as 0.70 mg/L at pH = 4, while endosulfan
had decreased to 80 mg/L at pH=5 during the 9 months stay in the fridge at 5 °C (Table 1).
The literature provided DT50 values for both chemicals for a pH of 5 (Table 1). After
correction for the temperature, endosulfan was predicted to be very stable at 5°C (DT50 = 806 d),

48
while the half-life of diazinon was much shorter (62 d). The calculated concentrations for both
chemicals were in the same range as the measured ones (Table 1). The mismatch between the
calculated concentration for diazinon of 4.6 μg/L and the measured concentration of 0.70 μg/L might
be explained by the lower pH in the sample (4) than for which the DT50 was determined (5), since it
may be expected that the hydrolysis rate of diazinon is higher at a pH of 4 than of 5 (Lewis et al.,
2016). This means that it is likely that at the start of the experiments the stock solution was indeed
around 100 mg/L for both compounds. We therefore recommend to analytically verify the test
concentrations, if this is possible at the test facility, but when this is not possible to at least store
some of the stock solution for analytical verification later in a suitable laboratory. It is important to
take the properties of the pesticide (e.g. DT50) into account before assuming the validity of this
methodology.
Toxicity of endosulfan and diazinon
For diazinon, the first test with A. pharoensis (37%), D. brachyurum (33%) and D. magna
(23%) exceeded the 20% threshold level at 96 h, while none exceeded the 10% threshold at 48
h(Table 2). All other tests performed showed a control immobilisation < 20% at 96 h, while all
performed tests showed control immobilisations of < 10% at 48 h, which is the duration of the test
on which the criterion of 10% is based (OECD, 2004). The tests showed large differences between 48
h and 96 h values. On average the difference was a factor of 13, while the minimum and maximum
factor was 1.8 and 65, respectively. This indicates that, when field exposure is expected to be longer
than 2 days, the 48 h toxicity values might not be a good predictor for effects and tests with a longer
duration are needed.
The test results for endosulfan indicated that, based on the 96h values, C. pipiens and D.
brachyurum proved to be the most sensitive species, followed by A. pharoensis, while D. magna was
the least sensitive species (Table 2). In contrast, D. magna proved to be the most sensitive organism
for diazinon, followed by the other crustacean species and the two insect species (Table 2).
In order to check the accuracy of our test approach we compared the values obtained for D.
magna with literature values. The ECOTOX database yielded geometric mean 48 and 96 h endosulfan
EC50 values of 356 (n=20) and 54 (n=2) µg/L for D. magna, respectively. These values are within a
factor of 2 of the corresponding values found by us, which were 181 and 98.4 µg/L, respectively
(Tables 2 and 3). For diazinon, only a 48 h EC50 of 1.30 µg/L for D. magna could be calculated from
the available data in the ECOTOX database. One test result was deleted from the obtained data, since
it resulted in an extremely deviating 48 h LC50, which was 162 times higher than the geometric mean
49
of the other values (n=5). The literature value was within a factor of 2 of the 48 h EC50 values
obtained in this study (0.875 and 1.11 µg/L) (Tables 2 and 3). Since the variation in threshold levels
between laboratories can be substantial due to genetic and environmental variability and their
interaction (Baird et al., 1989), the small differences observed here indicate that the lack of analytical
verification of the test concentrations did not disqualify the data we found in this study.
In order to check the consistency of our test approach we compared the values obtained in
the different tests we performed with the same pesticide–species combinations. Based on the EC50s,
only one pesticide–species combination showed a difference larger than a factor of 3 between the
test results. The 48 h EC50 values resulting from the two tests performed with D. brachyurum and
diazinon showed a difference of almost a factor of 6, while no comparison could be made at 96 h
because the control immobilisation at 96 h in one of the tests was too high (Tables 2 and 3). None of
the other tests showed any systematic differences in sensitivity between the 48h and 96h
observations, indicating that the experimental set-up we used resulted in intra-laboratory variations
in test results up to a factor of 2 (Table 3), which has also been observed for other laboratories
(Boxall et al., 2001).
Comparison of experimental results with literature data
Fig. 1 shows the SSDs for endosulfan and diazinon we found for the different observation
periods (see Appendices A-D for the included data). Only the 48h diazinon SSD failed the Anderson-
Darling test for normality due to the inclusion of two very insensitive crab species in the SSD. Figure 1
shows that the species tested in this paper were located in the upper (insensitive) part of the
endosulfan SSDs, while the same species were located in the middle to lower (sensitive) parts of the
diazinon SSDs (Fig. 1). This shows that the toxicity values found in this study are not substantially
different from those found in the ECOTOX database and therefore that, at least for these
compounds, available data from the literature can be used for an Ethiopian risk assessment, as was
done in Teklu et al. (2015).
The endosulfan 48 h HC5 of 0.094 μg/L (0.026-0.26) and the 96 h HC5 of 0.047 μg/L (0.011-
0.15) seem lower than the value reported by Hose and Van den Brink (2004) of 0.19 μg/L (0.10-0.59).
But this is a result of the use of a different distribution (Reciprocal Weibull) since a similar HC5 of
0.083 μg/L (0.017-0.27) is calculated when the same data are fitted by a log-normal distribution, and
also pass the Anderson Darling test. Maltby et al. (2005) reported an HC5 for diazinon of 0.36 μg/L
(0.13-0.77), which is only slightly higher than the 48 h HC5 of 0.24 μg/L (0.049-0.76) and the 96 h HC5
of 0.24 μg/L (0.074-0.55) found in our study. This is of course not remarkable, as these values are
partly based on the same data.

50
At the species level, the endosulfan 48 h EC50 value of D. brachyurum was in between the
other 48 h LC50 values reported for other water fleas, while its 96 h value was a factor of 4 lower
than the 96 h LC50 reported for D. magna(Appendix A and B), possibly as a result of the use of
another endpoint (immobilisation versus mortality). The endosulfan 48 h EC50 values reported for
the two tested dipteran species (A. pharoensis and C. pipiens) were quite similar to the 48 h LC50
reported for two other dipterans (Chironomus riparius and Culex fatigans). No 96 h EC50 or LC50
data were available for other dipteran species, but our results were in between values for other
insect (ephemeropteran, plecopteran and zygopteran) species. The 48 h EC50 value of D.
brachyurum for diazinon was higher than the 48 h LC50 value reported for other cladoceran species
while its 96 h EC50 value was in between the 96 h LC50 values of two other cladoceran species
(Appendix C and D). The 48 h and 96 h EC50 values for the two tested dipteran species (A. pharoensis
and C. pipiens) were in between the 48 h and 96 h LC50 reported for two other dipterans (C. riparius
and Chironomus tentans). So also at the species level there were no systematic differences in
sensitivity present between the species tested in this paper and those found in the ECOTOX
database.
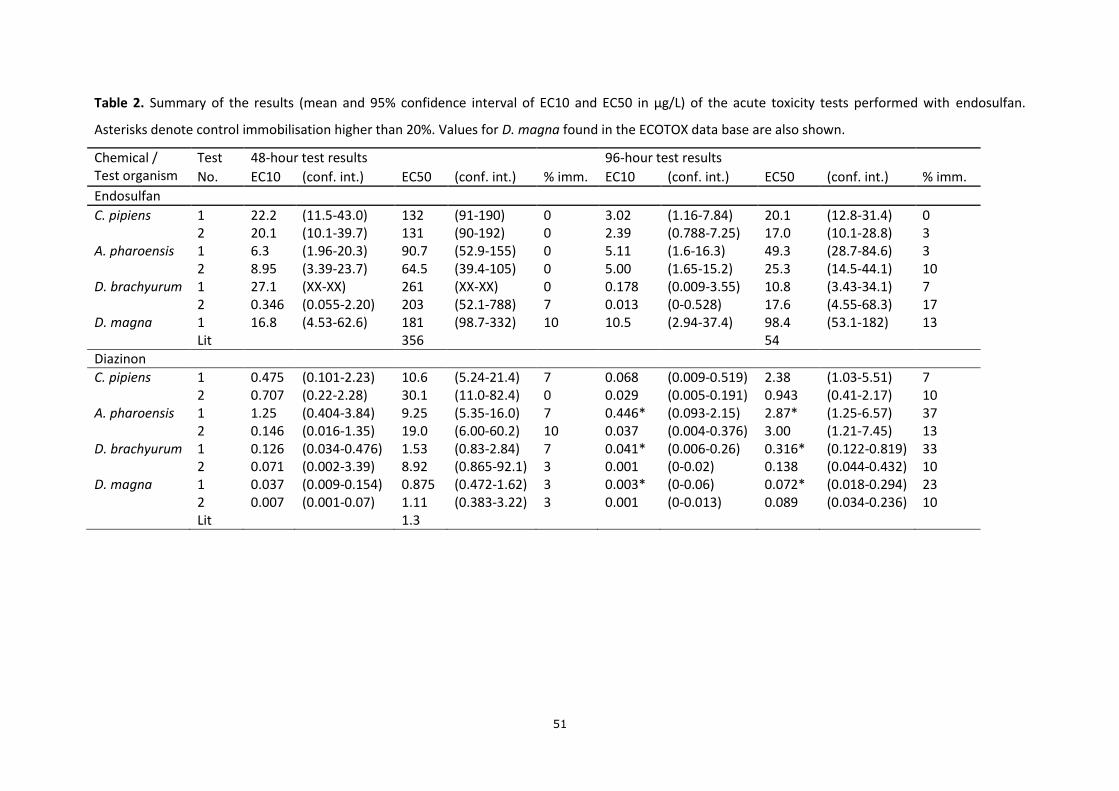
51
Table 2. Summary of the results (mean and 95% confidence interval of EC10 and EC50 in μg/L) of the acute toxicity tests performed with endosulfan.
Asterisks denote control immobilisation higher than 20%. Values for D. magna found in the ECOTOX data base are also shown.
Chemical / Test organism
Test 48-hour test results 96-hour test results
No. EC10 (conf. int.) EC50 (conf. int.) % imm. EC10 (conf. int.) EC50 (conf. int.) % imm.
Endosulfan
C. pipiens 1 22.2 (11.5-43.0) 132 (91-190) 0 3.02 (1.16-7.84) 20.1 (12.8-31.4) 0 2 20.1 (10.1-39.7) 131 (90-192) 0 2.39 (0.788-7.25) 17.0 (10.1-28.8) 3 A. pharoensis 1 6.3 (1.96-20.3) 90.7 (52.9-155) 0 5.11 (1.6-16.3) 49.3 (28.7-84.6) 3 2 8.95 (3.39-23.7) 64.5 (39.4-105) 0 5.00 (1.65-15.2) 25.3 (14.5-44.1) 10 D. brachyurum 1 27.1 (XX-XX) 261 (XX-XX) 0 0.178 (0.009-3.55) 10.8 (3.43-34.1) 7 2 0.346 (0.055-2.20) 203 (52.1-788) 7 0.013 (0-0.528) 17.6 (4.55-68.3) 17 D. magna 1 16.8 (4.53-62.6) 181 (98.7-332) 10 10.5 (2.94-37.4) 98.4 (53.1-182) 13 Lit 356 54
Diazinon
C. pipiens 1 0.475 (0.101-2.23) 10.6 (5.24-21.4) 7 0.068 (0.009-0.519) 2.38 (1.03-5.51) 7 2 0.707 (0.22-2.28) 30.1 (11.0-82.4) 0 0.029 (0.005-0.191) 0.943 (0.41-2.17) 10 A. pharoensis 1 1.25 (0.404-3.84) 9.25 (5.35-16.0) 7 0.446* (0.093-2.15) 2.87* (1.25-6.57) 37 2 0.146 (0.016-1.35) 19.0 (6.00-60.2) 10 0.037 (0.004-0.376) 3.00 (1.21-7.45) 13 D. brachyurum 1 0.126 (0.034-0.476) 1.53 (0.83-2.84) 7 0.041* (0.006-0.26) 0.316* (0.122-0.819) 33 2 0.071 (0.002-3.39) 8.92 (0.865-92.1) 3 0.001 (0-0.02) 0.138 (0.044-0.432) 10 D. magna 1 0.037 (0.009-0.154) 0.875 (0.472-1.62) 3 0.003* (0-0.06) 0.072* (0.018-0.294) 23 2 0.007 (0.001-0.07) 1.11 (0.383-3.22) 3 0.001 (0-0.013) 0.089 (0.034-0.236) 10 Lit 1.3
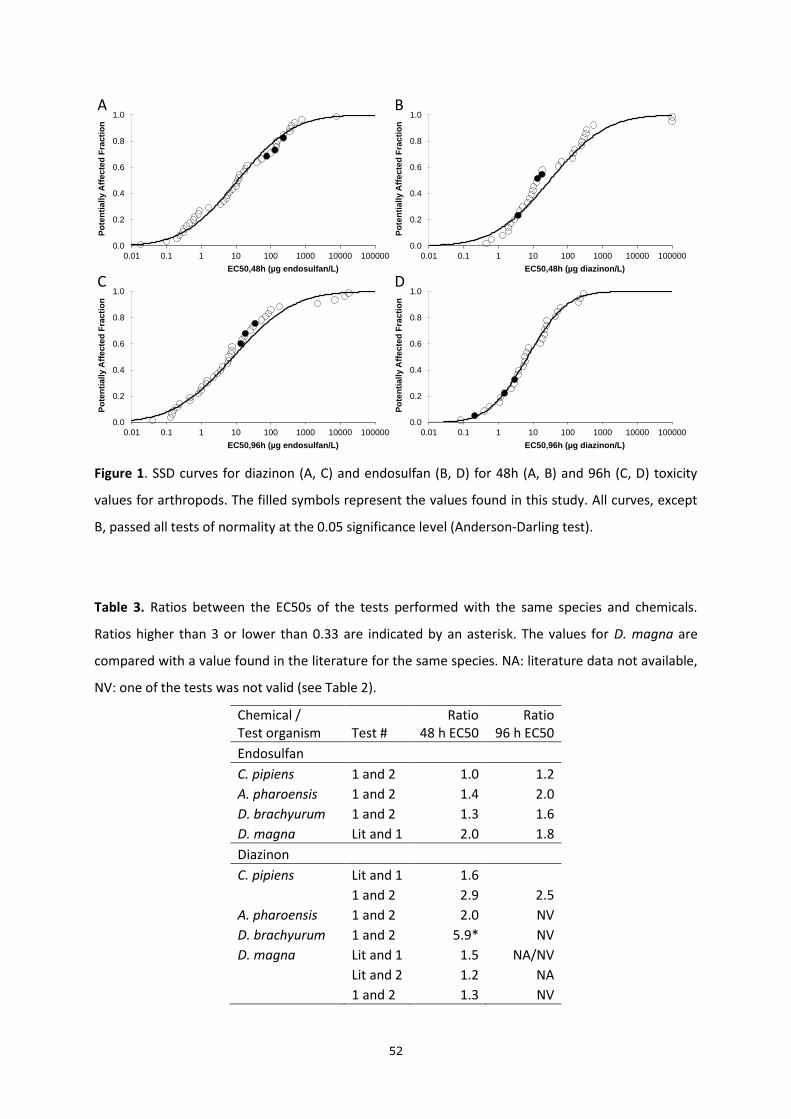
52
Figure 1. SSD curves for diazinon (A, C) and endosulfan (B, D) for 48h (A, B) and 96h (C, D) toxicity
values for arthropods. The filled symbols represent the values found in this study. All curves, except
B, passed all tests of normality at the 0.05 significance level (Anderson-Darling test).
Table 3. Ratios between the EC50s of the tests performed with the same species and chemicals.
Ratios higher than 3 or lower than 0.33 are indicated by an asterisk. The values for D. magna are
compared with a value found in the literature for the same species. NA: literature data not available,
NV: one of the tests was not valid (see Table 2).
Chemical / Test organism Test #
Ratio 48 h EC50
Ratio 96 h EC50
Endosulfan
C. pipiens 1 and 2 1.0 1.2
A. pharoensis 1 and 2 1.4 2.0
D. brachyurum 1 and 2 1.3 1.6
D. magna Lit and 1 2.0 1.8
Diazinon
C. pipiens Lit and 1 1.6
1 and 2 2.9 2.5
A. pharoensis 1 and 2 2.0 NV
D. brachyurum 1 and 2 5.9* NV
D. magna Lit and 1 1.5 NA/NV
Lit and 2 1.2 NA
1 and 2 1.3 NV
0.0
0.2
0.4
0.6
0.8
1.0
0.01 0.1 1 10 100 1000 10000 100000
Po
ten
tia
lly A
ffe
cte
d F
rac
tio
n
EC50,48h (µg endosulfan/L)
A
0.0
0.2
0.4
0.6
0.8
1.0
0.01 0.1 1 10 100 1000 10000 100000
Po
ten
tia
lly A
ffe
cte
d F
rac
tio
n
EC50,96h (µg diazinon/L)
D
0.0
0.2
0.4
0.6
0.8
1.0
0.01 0.1 1 10 100 1000 10000 100000
Po
ten
tia
lly A
ffe
cte
d F
rac
tio
n
EC50,96h (µg endosulfan/L)
C
0.0
0.2
0.4
0.6
0.8
1.0
0.01 0.1 1 10 100 1000 10000 100000
Po
ten
tia
lly A
ffe
cte
d F
rac
tio
n
EC50,48h (µg diazinon/L)
B
53
Evaluation of methodology and outlook
The results in the present study provide a methodology for performing single-species acute toxicity
studies in developing countries with limited resources to verify the concentrations analytically. By
performing a test with D. magna, the most tested aquatic species in the world, we enabled the
results to be calibrated against literature data. Performing duplicate experiments yields the intra-
laboratory variation in test results, which includes the errors made in the dosing of the test systems.
The fact that no systematic differences in test results were found between the Ethiopian
species and the values obtained from the literature, which mainly relate to temperate species, does
not mean that no test protocols should be developed for indigenous species. Since it is important to
test indigenous species, e.g. because they are charismatic, economically important or can be used
also for in-situ testing, technical protocols should be developed showing how to handle and test
indigenous aquatic invertebrates in developing countries.
Compliance with Ethical Standards
- Conflict of Interest: The present study was funded by the Pesticide Risk Reduction Programme –
Ethiopia (PRRP-Ethiopia), a collaborative project on pesticide registration and post-registration
jointly set up by the Ministry of Agriculture of the Federal Republic of Ethiopia, and the State of
the Netherlands represented by the Ministry of Foreign Affairs/Foreign Trade and Development
Cooperation, and the Technical Cooperation Programme (TCP) of the Food and Agricultural
Organisation of the United Nations.The authors declare that they have no conflict of interest.
- Research involving human participants and/or animals: This article does not contain any studies
with human participants or vertebrate animals performed by any of the authors
Informed consent: Informed consent was obtained from all individual participants included in the
study.
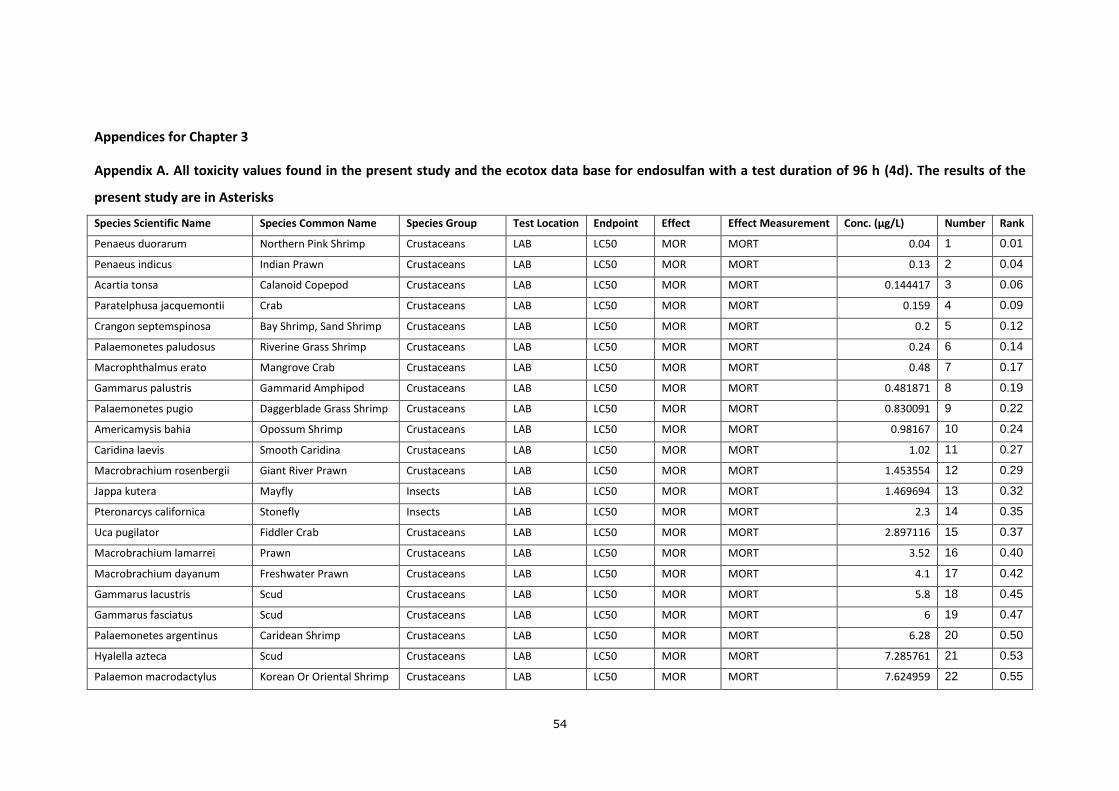
54
Appendices for Chapter 3
Appendix A. All toxicity values found in the present study and the ecotox data base for endosulfan with a test duration of 96 h (4d). The results of the
present study are in Asterisks
Species Scientific Name Species Common Name Species Group Test Location Endpoint Effect Effect Measurement Conc. (µg/L) Number Rank
Penaeus duorarum Northern Pink Shrimp Crustaceans LAB LC50 MOR MORT 0.04 1 0.01
Penaeus indicus Indian Prawn Crustaceans LAB LC50 MOR MORT 0.13 2 0.04
Acartia tonsa Calanoid Copepod Crustaceans LAB LC50 MOR MORT 0.144417 3 0.06
Paratelphusa jacquemontii Crab Crustaceans LAB LC50 MOR MORT 0.159 4 0.09
Crangon septemspinosa Bay Shrimp, Sand Shrimp Crustaceans LAB LC50 MOR MORT 0.2 5 0.12
Palaemonetes paludosus Riverine Grass Shrimp Crustaceans LAB LC50 MOR MORT 0.24 6 0.14
Macrophthalmus erato Mangrove Crab Crustaceans LAB LC50 MOR MORT 0.48 7 0.17
Gammarus palustris Gammarid Amphipod Crustaceans LAB LC50 MOR MORT 0.481871 8 0.19
Palaemonetes pugio Daggerblade Grass Shrimp Crustaceans LAB LC50 MOR MORT 0.830091 9 0.22
Americamysis bahia Opossum Shrimp Crustaceans LAB LC50 MOR MORT 0.98167 10 0.24
Caridina laevis Smooth Caridina Crustaceans LAB LC50 MOR MORT 1.02 11 0.27
Macrobrachium rosenbergii Giant River Prawn Crustaceans LAB LC50 MOR MORT 1.453554 12 0.29
Jappa kutera Mayfly Insects LAB LC50 MOR MORT 1.469694 13 0.32
Pteronarcys californica Stonefly Insects LAB LC50 MOR MORT 2.3 14 0.35
Uca pugilator Fiddler Crab Crustaceans LAB LC50 MOR MORT 2.897116 15 0.37
Macrobrachium lamarrei Prawn Crustaceans LAB LC50 MOR MORT 3.52 16 0.40
Macrobrachium dayanum Freshwater Prawn Crustaceans LAB LC50 MOR MORT 4.1 17 0.42
Gammarus lacustris Scud Crustaceans LAB LC50 MOR MORT 5.8 18 0.45
Gammarus fasciatus Scud Crustaceans LAB LC50 MOR MORT 6 19 0.47
Palaemonetes argentinus Caridean Shrimp Crustaceans LAB LC50 MOR MORT 6.28 20 0.50
Hyalella azteca Scud Crustaceans LAB LC50 MOR MORT 7.285761 21 0.53
Palaemon macrodactylus Korean Or Oriental Shrimp Crustaceans LAB LC50 MOR MORT 7.624959 22 0.55

55
Species Scientific Name Species Common Name Species Group Test Location Endpoint Effect Effect Measurement Conc. (µg/L) Number Rank
Caridina weberi Pugnose Caridina Crustaceans LAB LC50 MOR MORT 7.761294 23 0.58
D. brachyurum Water Flea Crustaceans LAB EC50 IMM IMM 13.78695* 24 0.60
Cancer magister Dungeness Or Edible Crab Crustaceans LAB LC50 MOR MORT 14.8 25 0.63
Enallagma sp. Damselfly Insects LAB LC50 MOR MORT 17.5 26 0.65
C. pipiens Midge Insects LAB EC50 IMM IMM 18.48513* 27 0.68
Penaeus monodon Jumbo Tiger Prawn Crustaceans LAB LC50 MOR MORT 26.32 28 0.71
Nanosesarma sp. Crab Crustaceans LAB LC50 MOR MORT 31 29 0.73
A. pharoensis Midge Insects LAB EC50 IMM IMM 35.31699* 30 0.76
Daphnia magna Water Flea Crustaceans LAB LC50* MOR MORT 54.42793 31 0.78
Tigriopus japonicus Harpacticoid Copepod Crustaceans LAB LC50 MOR MORT 70 32 0.81
Ischnura sp. Damselfly Insects LAB LC50* MOR MORT 87.65044 33 0.83
Procambarus clarkii Red Swamp Crayfish Crustaceans LAB LC50 MOR MORT 100.7571 34 0.86
Scylla serrata Crab Crustaceans LAB LC50 MOR MORT 178 35 0.88
Barytelphusa cunicularis Crab Crustaceans LAB LC50 MOR MORT 2256.426 36 0.91
Oziotelphusa senex ssp. senex Crab Crustaceans LAB LC50 MOR MORT 7060.041 37 0.94
Zilchiopsis collastinensis Freshwater Crab Crustaceans LAB LC50 MOR MORT 13469.31 38 0.96
Barytelphusa guerini Freshwater Crab Crustaceans LAB LC50 MOR MORT 17780 39 0.99
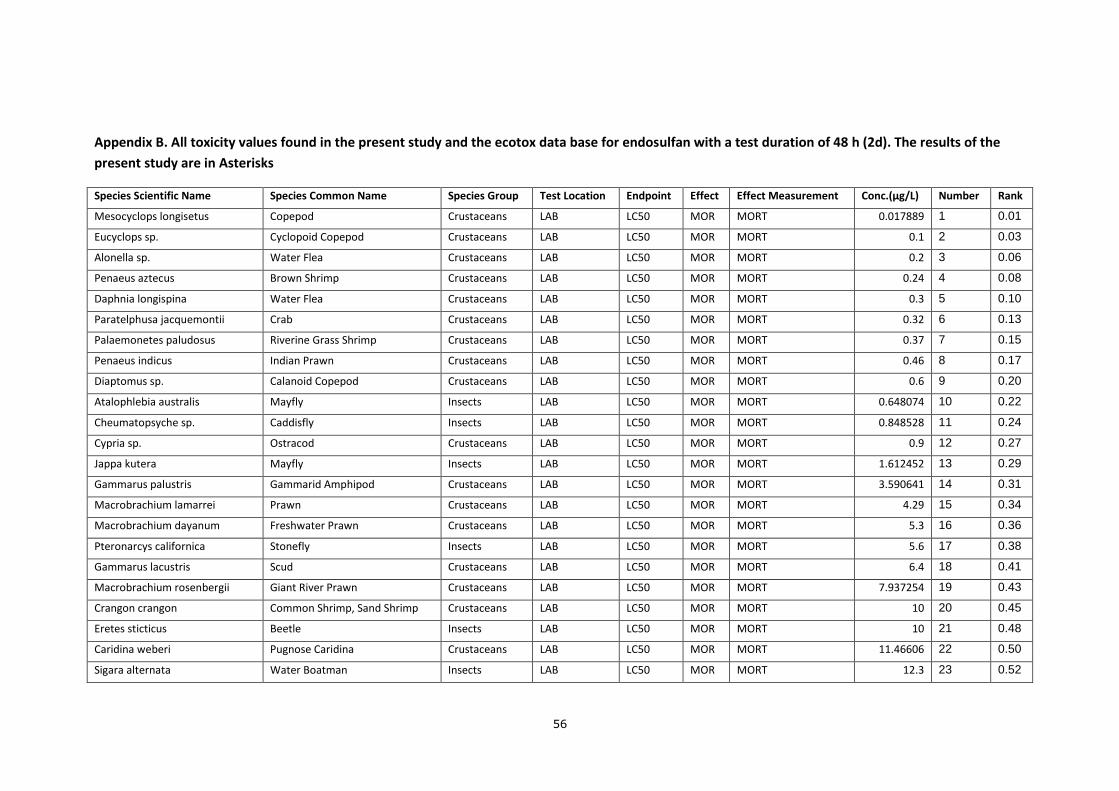
56
Appendix B. All toxicity values found in the present study and the ecotox data base for endosulfan with a test duration of 48 h (2d). The results of the
present study are in Asterisks
Species Scientific Name Species Common Name Species Group Test Location Endpoint Effect Effect Measurement Conc.(µg/L) Number Rank
Mesocyclops longisetus Copepod Crustaceans LAB LC50 MOR MORT 0.017889 1 0.01
Eucyclops sp. Cyclopoid Copepod Crustaceans LAB LC50 MOR MORT 0.1 2 0.03
Alonella sp. Water Flea Crustaceans LAB LC50 MOR MORT 0.2 3 0.06
Penaeus aztecus Brown Shrimp Crustaceans LAB LC50 MOR MORT 0.24 4 0.08
Daphnia longispina Water Flea Crustaceans LAB LC50 MOR MORT 0.3 5 0.10
Paratelphusa jacquemontii Crab Crustaceans LAB LC50 MOR MORT 0.32 6 0.13
Palaemonetes paludosus Riverine Grass Shrimp Crustaceans LAB LC50 MOR MORT 0.37 7 0.15
Penaeus indicus Indian Prawn Crustaceans LAB LC50 MOR MORT 0.46 8 0.17
Diaptomus sp. Calanoid Copepod Crustaceans LAB LC50 MOR MORT 0.6 9 0.20
Atalophlebia australis Mayfly Insects LAB LC50 MOR MORT 0.648074 10 0.22
Cheumatopsyche sp. Caddisfly Insects LAB LC50 MOR MORT 0.848528 11 0.24
Cypria sp. Ostracod Crustaceans LAB LC50 MOR MORT 0.9 12 0.27
Jappa kutera Mayfly Insects LAB LC50 MOR MORT 1.612452 13 0.29
Gammarus palustris Gammarid Amphipod Crustaceans LAB LC50 MOR MORT 3.590641 14 0.31
Macrobrachium lamarrei Prawn Crustaceans LAB LC50 MOR MORT 4.29 15 0.34
Macrobrachium dayanum Freshwater Prawn Crustaceans LAB LC50 MOR MORT 5.3 16 0.36
Pteronarcys californica Stonefly Insects LAB LC50 MOR MORT 5.6 17 0.38
Gammarus lacustris Scud Crustaceans LAB LC50 MOR MORT 6.4 18 0.41
Macrobrachium rosenbergii Giant River Prawn Crustaceans LAB LC50 MOR MORT 7.937254 19 0.43
Crangon crangon Common Shrimp, Sand Shrimp Crustaceans LAB LC50 MOR MORT 10 20 0.45
Eretes sticticus Beetle Insects LAB LC50 MOR MORT 10 21 0.48
Caridina weberi Pugnose Caridina Crustaceans LAB LC50 MOR MORT 11.46606 22 0.50
Sigara alternata Water Boatman Insects LAB LC50 MOR MORT 12.3 23 0.52
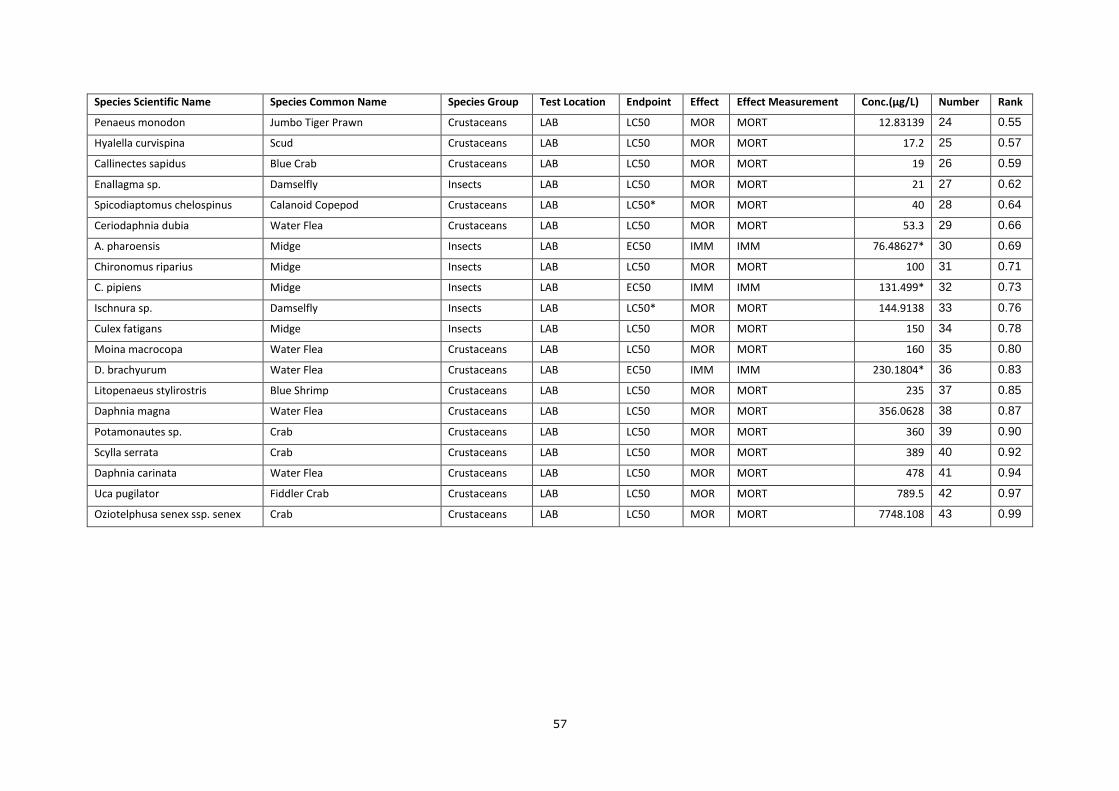
57
Species Scientific Name Species Common Name Species Group Test Location Endpoint Effect Effect Measurement Conc.(µg/L) Number Rank
Penaeus monodon Jumbo Tiger Prawn Crustaceans LAB LC50 MOR MORT 12.83139 24 0.55
Hyalella curvispina Scud Crustaceans LAB LC50 MOR MORT 17.2 25 0.57
Callinectes sapidus Blue Crab Crustaceans LAB LC50 MOR MORT 19 26 0.59
Enallagma sp. Damselfly Insects LAB LC50 MOR MORT 21 27 0.62
Spicodiaptomus chelospinus Calanoid Copepod Crustaceans LAB LC50* MOR MORT 40 28 0.64
Ceriodaphnia dubia Water Flea Crustaceans LAB LC50 MOR MORT 53.3 29 0.66
A. pharoensis Midge Insects LAB EC50 IMM IMM 76.48627* 30 0.69
Chironomus riparius Midge Insects LAB LC50 MOR MORT 100 31 0.71
C. pipiens Midge Insects LAB EC50 IMM IMM 131.499* 32 0.73
Ischnura sp. Damselfly Insects LAB LC50* MOR MORT 144.9138 33 0.76
Culex fatigans Midge Insects LAB LC50 MOR MORT 150 34 0.78
Moina macrocopa Water Flea Crustaceans LAB LC50 MOR MORT 160 35 0.80
D. brachyurum Water Flea Crustaceans LAB EC50 IMM IMM 230.1804* 36 0.83
Litopenaeus stylirostris Blue Shrimp Crustaceans LAB LC50 MOR MORT 235 37 0.85
Daphnia magna Water Flea Crustaceans LAB LC50 MOR MORT 356.0628 38 0.87
Potamonautes sp. Crab Crustaceans LAB LC50 MOR MORT 360 39 0.90
Scylla serrata Crab Crustaceans LAB LC50 MOR MORT 389 40 0.92
Daphnia carinata Water Flea Crustaceans LAB LC50 MOR MORT 478 41 0.94
Uca pugilator Fiddler Crab Crustaceans LAB LC50 MOR MORT 789.5 42 0.97
Oziotelphusa senex ssp. senex Crab Crustaceans LAB LC50 MOR MORT 7748.108 43 0.99
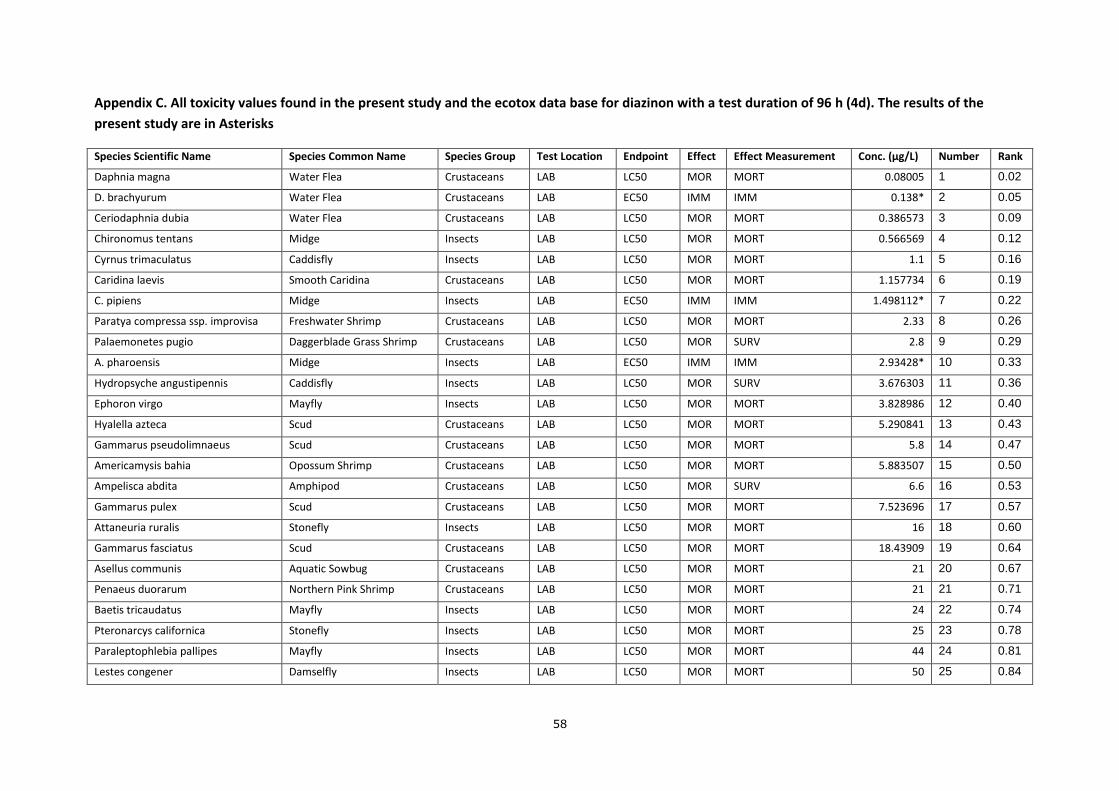
58
Appendix C. All toxicity values found in the present study and the ecotox data base for diazinon with a test duration of 96 h (4d). The results of the
present study are in Asterisks
Species Scientific Name Species Common Name Species Group Test Location Endpoint Effect Effect Measurement Conc. (µg/L) Number Rank
Daphnia magna Water Flea Crustaceans LAB LC50 MOR MORT 0.08005 1 0.02
D. brachyurum Water Flea Crustaceans LAB EC50 IMM IMM 0.138* 2 0.05
Ceriodaphnia dubia Water Flea Crustaceans LAB LC50 MOR MORT 0.386573 3 0.09
Chironomus tentans Midge Insects LAB LC50 MOR MORT 0.566569 4 0.12
Cyrnus trimaculatus Caddisfly Insects LAB LC50 MOR MORT 1.1 5 0.16
Caridina laevis Smooth Caridina Crustaceans LAB LC50 MOR MORT 1.157734 6 0.19
C. pipiens Midge Insects LAB EC50 IMM IMM 1.498112* 7 0.22
Paratya compressa ssp. improvisa Freshwater Shrimp Crustaceans LAB LC50 MOR MORT 2.33 8 0.26
Palaemonetes pugio Daggerblade Grass Shrimp Crustaceans LAB LC50 MOR SURV 2.8 9 0.29
A. pharoensis Midge Insects LAB EC50 IMM IMM 2.93428* 10 0.33
Hydropsyche angustipennis Caddisfly Insects LAB LC50 MOR SURV 3.676303 11 0.36
Ephoron virgo Mayfly Insects LAB LC50 MOR MORT 3.828986 12 0.40
Hyalella azteca Scud Crustaceans LAB LC50 MOR MORT 5.290841 13 0.43
Gammarus pseudolimnaeus Scud Crustaceans LAB LC50 MOR MORT 5.8 14 0.47
Americamysis bahia Opossum Shrimp Crustaceans LAB LC50 MOR MORT 5.883507 15 0.50
Ampelisca abdita Amphipod Crustaceans LAB LC50 MOR SURV 6.6 16 0.53
Gammarus pulex Scud Crustaceans LAB LC50 MOR MORT 7.523696 17 0.57
Attaneuria ruralis Stonefly Insects LAB LC50 MOR MORT 16 18 0.60
Gammarus fasciatus Scud Crustaceans LAB LC50 MOR MORT 18.43909 19 0.64
Asellus communis Aquatic Sowbug Crustaceans LAB LC50 MOR MORT 21 20 0.67
Penaeus duorarum Northern Pink Shrimp Crustaceans LAB LC50 MOR MORT 21 21 0.71
Baetis tricaudatus Mayfly Insects LAB LC50 MOR MORT 24 22 0.74
Pteronarcys californica Stonefly Insects LAB LC50 MOR MORT 25 23 0.78
Paraleptophlebia pallipes Mayfly Insects LAB LC50 MOR MORT 44 24 0.81
Lestes congener Damselfly Insects LAB LC50 MOR MORT 50 25 0.84
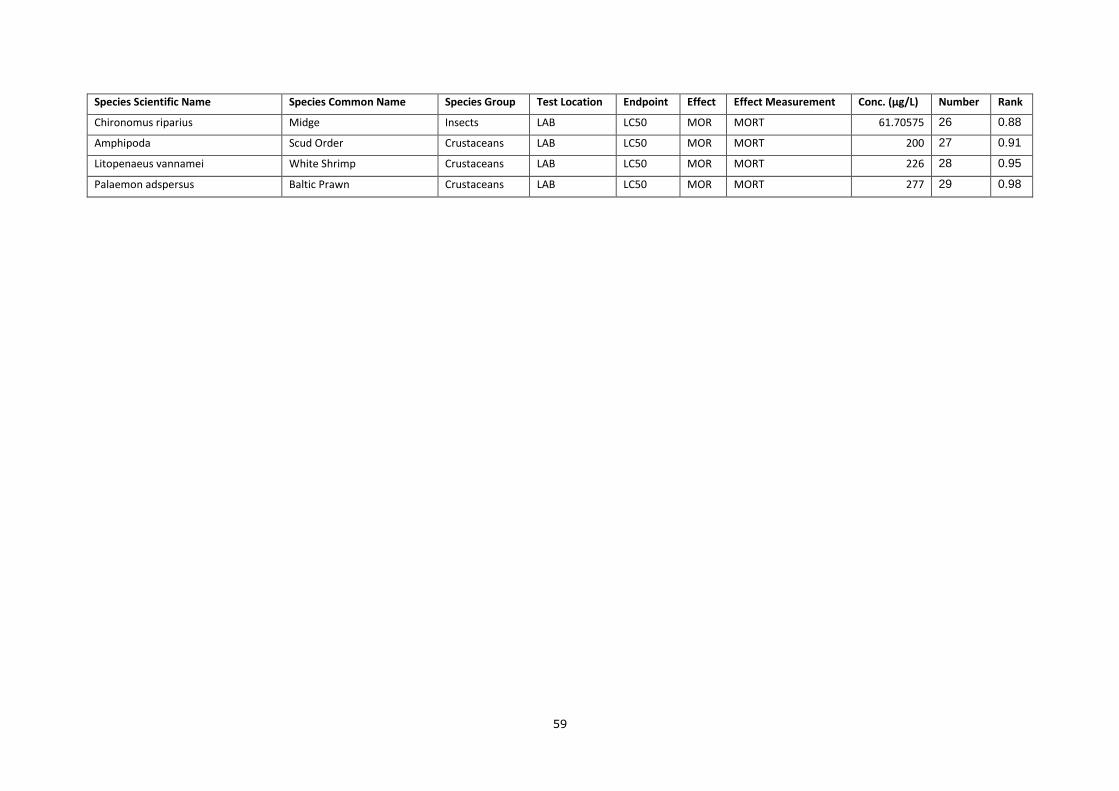
59
Species Scientific Name Species Common Name Species Group Test Location Endpoint Effect Effect Measurement Conc. (µg/L) Number Rank
Chironomus riparius Midge Insects LAB LC50 MOR MORT 61.70575 26 0.88
Amphipoda Scud Order Crustaceans LAB LC50 MOR MORT 200 27 0.91
Litopenaeus vannamei White Shrimp Crustaceans LAB LC50 MOR MORT 226 28 0.95
Palaemon adspersus Baltic Prawn Crustaceans LAB LC50 MOR MORT 277 29 0.98
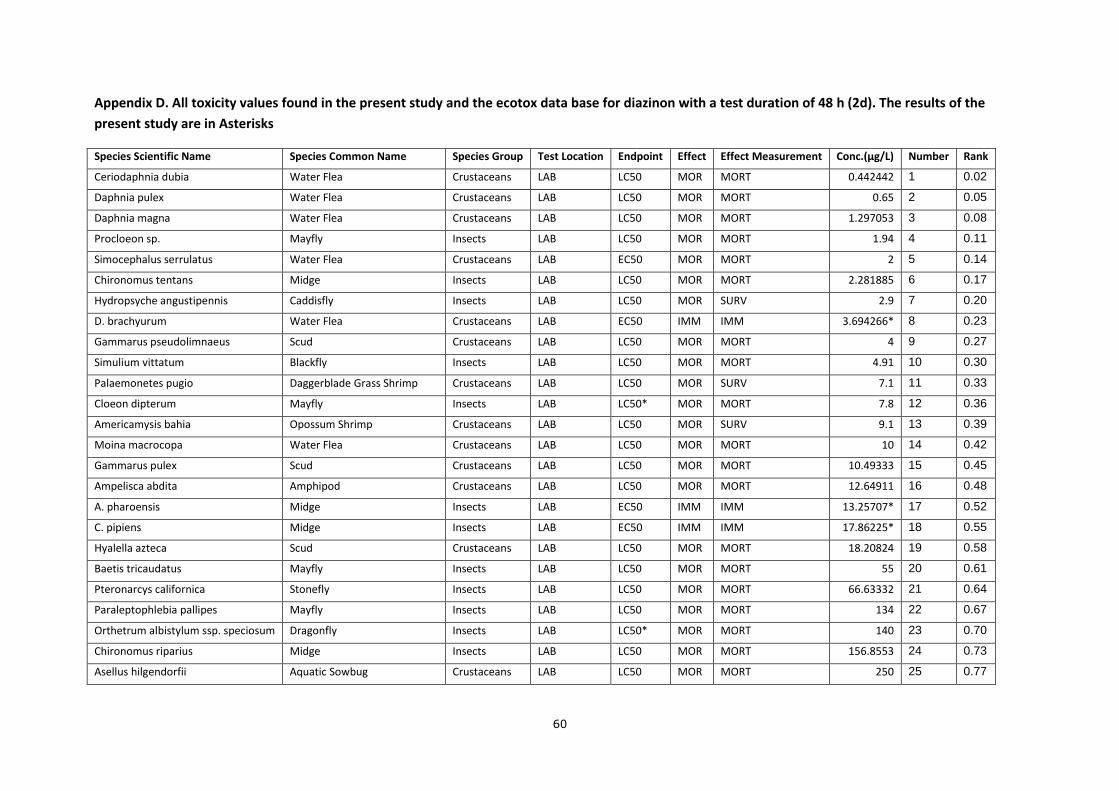
60
Appendix D. All toxicity values found in the present study and the ecotox data base for diazinon with a test duration of 48 h (2d). The results of the
present study are in Asterisks
Species Scientific Name Species Common Name Species Group Test Location Endpoint Effect Effect Measurement Conc.(µg/L) Number Rank
Ceriodaphnia dubia Water Flea Crustaceans LAB LC50 MOR MORT 0.442442 1 0.02
Daphnia pulex Water Flea Crustaceans LAB LC50 MOR MORT 0.65 2 0.05
Daphnia magna Water Flea Crustaceans LAB LC50 MOR MORT 1.297053 3 0.08
Procloeon sp. Mayfly Insects LAB LC50 MOR MORT 1.94 4 0.11
Simocephalus serrulatus Water Flea Crustaceans LAB EC50 MOR MORT 2 5 0.14
Chironomus tentans Midge Insects LAB LC50 MOR MORT 2.281885 6 0.17
Hydropsyche angustipennis Caddisfly Insects LAB LC50 MOR SURV 2.9 7 0.20
D. brachyurum Water Flea Crustaceans LAB EC50 IMM IMM 3.694266* 8 0.23
Gammarus pseudolimnaeus Scud Crustaceans LAB LC50 MOR MORT 4 9 0.27
Simulium vittatum Blackfly Insects LAB LC50 MOR MORT 4.91 10 0.30
Palaemonetes pugio Daggerblade Grass Shrimp Crustaceans LAB LC50 MOR SURV 7.1 11 0.33
Cloeon dipterum Mayfly Insects LAB LC50* MOR MORT 7.8 12 0.36
Americamysis bahia Opossum Shrimp Crustaceans LAB LC50 MOR SURV 9.1 13 0.39
Moina macrocopa Water Flea Crustaceans LAB LC50 MOR MORT 10 14 0.42
Gammarus pulex Scud Crustaceans LAB LC50 MOR MORT 10.49333 15 0.45
Ampelisca abdita Amphipod Crustaceans LAB LC50 MOR MORT 12.64911 16 0.48
A. pharoensis Midge Insects LAB EC50 IMM IMM 13.25707* 17 0.52
C. pipiens Midge Insects LAB EC50 IMM IMM 17.86225* 18 0.55
Hyalella azteca Scud Crustaceans LAB LC50 MOR MORT 18.20824 19 0.58
Baetis tricaudatus Mayfly Insects LAB LC50 MOR MORT 55 20 0.61
Pteronarcys californica Stonefly Insects LAB LC50 MOR MORT 66.63332 21 0.64
Paraleptophlebia pallipes Mayfly Insects LAB LC50 MOR MORT 134 22 0.67
Orthetrum albistylum ssp. speciosum Dragonfly Insects LAB LC50* MOR MORT 140 23 0.70
Chironomus riparius Midge Insects LAB LC50 MOR MORT 156.8553 24 0.73
Asellus hilgendorfii Aquatic Sowbug Crustaceans LAB LC50 MOR MORT 250 25 0.77

61
Species Scientific Name Species Common Name Species Group Test Location Endpoint Effect Effect Measurement Conc.(µg/L) Number Rank
Litopenaeus vannamei White Shrimp Crustaceans LAB LC50 MOR MORT 255 26 0.80
Attaneuria ruralis Stonefly Insects LAB LC50 MOR MORT 294 27 0.83
Palaemon adspersus Baltic Prawn Crustaceans LAB LC50 MOR MORT 330 28 0.86
Gammarus lacustris Scud Crustaceans LAB LC50 MOR MORT 338.3785 29 0.89
Orconectes propinquus Crayfish Crustaceans LAB LC50 MOR MORT 537 30 0.92
Carcinus maenas Green Crab Crustaceans LAB LC50 MOR MORT 100000 31 0.95
Crangon crangon Common Shrimp, Sand Shrimp Crustaceans LAB LC50 MOR MORT 100000 32 0.98
62
Chapter 4
Impacts of nutrients and pesticides from small- and large-scale agriculture on
the water quality of Lake Ziway, Ethiopia
Berhan M. Teklu1,2, Amare Hailu3, Daniel A. Wiegant3, Bernice S. Scholten1, Paul J. Van den Brink1,4,*
1 Department ofAquatic Ecology and Water Quality Management, Wageningen University,
Wageningen University and Research centre, P.O. Box 47, 6700 AA Wageningen, The Netherlands
2 The College of Natural Sciences, University of Addis Ababa, Arat Kilo campus, Addis Ababa, Ethiopia
3 Horn of Africa Regional Environment Centre and Network, Addis Ababa University, P.O. Box 80773,
Addis Ababa, Ethiopia
4 Alterra, Wageningen University and Research centre, P.O. Box 47, 6700 AA Wageningen, The
Netherlands
This manuscript has been published on ESPR (2016), DOI 10.1007/s11356-016-6714-1
63
Abstract:
The area around Lake Ziway in Ethiopia is going through a major agricultural transformation
with both small-scale farmers and large horticultural companies using pesticides and fertilisers at an
increased rate. To be able to understand how this influences the water quality of Lake Ziway, water
quality data was gathered to study the dynamics of pesticide concentrations and physicochemical
parameters for the years from 2009 to 2015. Results indicate that for some physicochemical
parameters, including pH, potassium and iron, over 50% of the values were above the Maximum
Permissible Limit of the Ethiopian standard for drinking water. The insecticide spiroxamine poses a
high chronic risk when the water is used for drinking water, while the estimated intake of diazinon
was approximately 50% of the acceptable daily intake. Higher-tier risk assessment indicated that the
fungicide spiroxamine poses a high acute risk to aquatic organisms, while possible acute risks were
indicated for the insecticides deltamethrin and endosulfan. Longer-term monitoring needs to be
established to show the water quality changes across time and space, and the current study can be
used as a baseline measurement for further research in the area as well as an examplefor other
surface water systems in Ethiopia and Africa.
64
Introduction
The current major agricultural transformation of Africa is increasing the anthropogenic
sources of pollution, which are becoming a major concern for the environment (Pretty et al. 2011).
One such example is the developments in the Central Rift Valley (CRV) of Ethiopia, where smallholder
horticulture farmers and large-scale flower growing companies are located around Lake Ziway. The
land-use records of the area for the year 2006 indicate that the area of irrigated agriculture in the
Lake Ziway catchment has increased up to 5000 ha since 1973. The total area of small-scale
agriculture in the Meki River catchment (situated in the catchment of Lake Ziway) has been recorded
to be of the order of 7300 ha, with a sharp increase especially after the year 1999 (Jansen et al.
2007). Farmers and companies in the area use pesticides and chemical fertilisers, which may affect
the water quality of the lake and the surrounding surface waters through the release of some trace
elements and residues from the agricultural fields into the surface waters (Jansen and Harmsen
2011).Although in most cases, both organic and inorganic pollutants are subjected to biodegradation,
biotransformation and abiotic processes that reduce concentrations in the environment, this will not
be the case for contaminants like persistent organic pesticides and heavy metals. These compounds
may cause damage to aquatic organisms and humans because of their bioaccumulation in the food
chain and high toxicity (Van Leeuwen and Vermeire 2007).
Hence, monitoring organic and inorganic pollutants in surface waters is essential to assess
their risks to aquatic ecosystems and human health. The increased use of fertilisers by smallholders
and enterprises, the increased volumes of (untreated) urban waste water and the reduced outflow
from Lake Ziway to the Bulbula River can cause eutrophication, which can result in turbid water, algal
blooms, fish mortality, and poor quality of drinking water (Jansen and Harmsen 2011). In general,
surface water is used as a source of drinking water in many rural parts of Ethiopia, so the Pesticide
Risk Reduction Programme — Ethiopia (PRRP) has declared that priority should be given to the
protection of Ethiopian surface waters as a source of drinking water for humans and as an important
habitat for aquatic life (Teklu et al. 2015; Adriaanse et al. 2015).
In Ethiopia, this has only sporadically been done for specific water bodies for a longer period
of time, mainly due to a lack of finances, skilled professionals and internationally certified
laboratories. Moreover, the presence of very few nationally certified laboratories which can provide
reliable results of residue analysis is hampering their publication as the societal sensitivity of the
results implies that values have to be reliable.

65
Although a number of studies are being conducted in the Lake Ziway area catchment, most
of them focussed on studying the hydro-geochemistry of waters around Lake Ziway by analysing
samples from groundwater and surface waters using only a single measurement (Gashaw 1999), and
on determining the Low Molecular Mass (LMM) trace element species in the Ethiopian CRV lakes
including Lake Ziway (Masresha et al. 2011). Others focus on the heavy metals and organochlorine
pesticides present in fish species, sediment and water samples, and the correlations between them
(Nigussie et al. 2010; Dsikowitzky et al. 2012; Yohannes et al. 2014).These studies detected e.g.
dichlorodiphenyltrichloroethanes (DDTs), hexachlorocyclohexanes (HCHs), chlordanes, heptachlors
and heavy metals in organs of fish species in Lake Ziway.
To address the problems identified above, the present research aimed to obtain a better
understanding of the water quality changes in Lake Ziway across time and space. To this end, a range
of physicochemical parameters were repeatedly measured. In addition, the study monitored
pesticide concentrations at several sampling points in Lake Ziway, and compared the results with
previously reported pesticide concentrations in the lake. To assess the potential risks of the
measured pesticide concentrations to aquatic life, a tiered risk assessment, including Species
Sensitivity Distributions (SSD), was conducted. Overall, this study provides a comprehensive analysis
of the water quality of Lake Ziway’s and its surrounding area, which so far has been described only to
a limited extent.
The objectives of this study were (i) to determine the changes in the water quality of Lake
Ziway across time and space; (ii) to evaluate whether the physicochemical and nutrient values of the
water samples exceed international standards for drinking water. (iii) to show the correlations
between the various physicochemical parameters and their levels at the sampling locations, by
performing a multivariate analysis; (iv) to examine the changes in the types and concentrations of
pesticides recorded in the area and (v) to assess the risks posed by pesticides to aquatic organisms
and to the use of the surface water as drinking water.
Materials and methods
Description of the study area
The study was conducted at Lake Ziway, which is located in the CRV zone of Ethiopia (Fig. 1).
It is situated in the East Showa zone of the Oromia region at about 160 km from Addis Ababa. Lake
Ziway has an open water area of 434 km2, with an average depth of 4 m, and an elevation of 1636 m
above sea level. The Ziway Catchment is situated in between 7°15’N to 8°30’N latitude and 38°E to
39°30’E longitude, covering a total area of about 7300 km2 (Hughes and Hughes 1992). The lake has
66
flat swampy margins on all sides except the south and south-west, and is fed by many streams. The
two main rivers, Meki and Ketar, flow into the lake, while one river, Bulbula, flows out of the lake
(Jansen et al. 2007). Horticultural industries are situated between Lake Ziway and the main highway,
at altitudes ranging between 1600–1700 m above sea level (Sahle and José 2013).
Sample collection
Under close supervision and facilitation by HoA-REC&N, the sample collection and analysis of
physicochemical parameters by the nationally certified laboratory of Horticoop Ethiopia started by
mid-2013 and continued until the beginning of 2015, once a month. During this period samples were
collected with the assistance of the local research institutions. At first, samples were collected from
13 locations, and this number increased to 18 between October 2014 and February 2015 (Fig. 1). The
number of sampling locations was increased to better describe the spatial variability of the water
quality parameters. In addition, seven samples were taken for pesticide residue analysis in August
2014 and March 2015, very close to the sampling locations used in previous research by Jansen and
Harmsen (2011) (Fig. 1). Pesticide samples were shipped to Altic B.V. (NEN-EN-ISO/IEC 17025
accredited laboratory) in the Netherlands for pesticide residue analysis. Samples were preserved by
adding 1 mL of acid, placed in a deepfreeze container and shipped in accordance with the US-EPA
protocol for shipping and sample submission procedures for analytical services (US-EPA 2014). The
commercial flower farms are expected to be characterised by a year-round nutrient load, whereas on
the small-scale irrigated farms, high nutrient loads are expected between February and April and
between June and October.
Grab sampling technique was used for all sampling activities (Forrest 2000). The containers
were cleaned with distilled water and rinsed two to three times with water at the sampling point
before the sample was taken. The collected water was thoroughly mixed and checked to see if all
organic matter such as leaves, rags, twigs and other floating materials had been removed. All
collected 1 L samples were placed in a labelled sample container and stored in a refrigerator at 4°C.
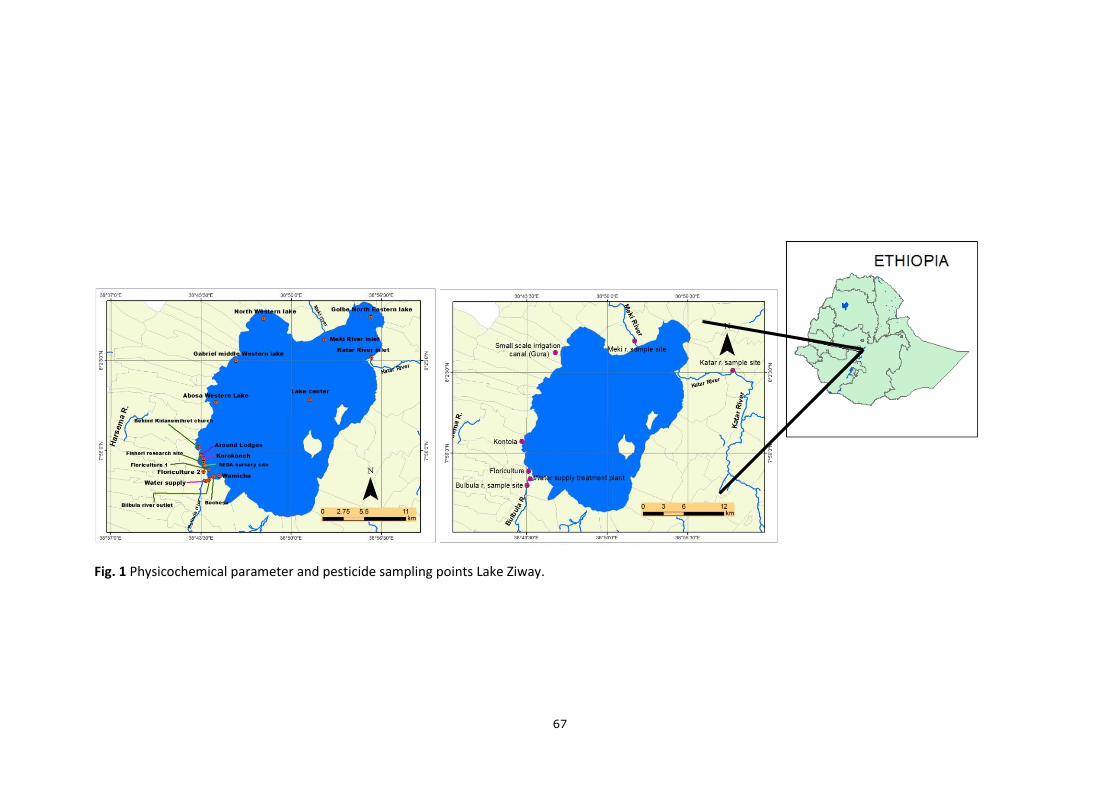
67
Fig. 1 Physicochemical parameter and pesticide sampling points Lake Ziway.
68
Physiochemical properties and pesticide residues
At Horticoop Ethiopia, the nutrients N, Ca, Mg, Na, S, P, Si, Cu, B, Fe, K, Mn, Mo and Zn
concentrations were measured simultaneously using an optimised and frequently calibrated device
for inductively coupled plasma analysis. Chloride was analysed by titration against AgNO3 solution
and by weighing the precipitated chloride, bicarbonate was analysed by titration of the sample with
HCl solution,ammonium-nitrogen and nitrate-nitrogen (NH4+N, NO3-N) were analysed by
spectrophotometric analysis (Janway 63 UK 2009) and pH and electrical conductivity (EC) were
measured by direct reading in the water sample using an electrode pH meter (pH 06, Holland 2006)
and an EC Meter (EC 93 Holland 2010). All samples were filtered through a Whitman No 42 filter
paper before further analysis was done. Samples sent to the Dutch lab (Altic B.V.) were analysed for
more than 300 pesticide residues. Samples were extracted using dichloromethane and petroleum
ether, while analysis was performed using standard GC-ECD, GC-MS/MS and LC-MS/MS techniques
(Chauhan et al. 2014; Adeyemi et al. 2011; Pitt 2009).
Data analysis
The Ethiopian Maximum Permissible Limits (MPL) as listed by Ministry of Health (MoH, 2011)
and the World Health Organisation (WHO, 2010) were used to identify those physicochemical
parameters which exceeded the MPL. A multivariate analysis was done to assess the variation in the
values of the physicochemical parameters across time and space (Van den Brink et al. 2003a). To this
end, a redundancy analysis (RDA) was performed using the measured physicochemical parameters as
response variables, while using the sampling locations and sampling dates as explanatory variables.
The significance of the explanatory variables was evaluated by a Monte Carlo permutation test
following the RDA. More information on the interpretation of RDA-derived biplots can be found in
Van den Brink et al. (2003a).
Pesticide concentrations were available for four sampling dates. Data from two sampling
dates in 2009 and 2010 was taken from Jansen and Harmsen (2011), while the 2014 and 2015 data
was collected for the present study. Pesticide residues detected in each sampling period were first
used to determine the acute exposure toxicity ratio (ETR) using predicted no-effect concentrations
(PNECs) based on acute values for fish, daphnia, and algae for each detected pesticide, as described
in Teklu et al. (2015) and Wipfler et al. (2014), and are given below in (eqs. 1-3). The ETR was
computed by dividing the measured concentration by the PNEC, using the maximum value of
concentrations and the minimum value of the three PNECs for risk (ETR) calculation. SSDs and HC5
(hazardous concentration protective of 95% of the population) concentrations were determined

69
using acute toxicity data for additional species from the US-EPA database (www.epa.gov/ecotox) and
the ETX 2.0. software (Van Vlaardingen et al. 2003). In the second-tier risk assessment the HC5 values
were used as PNEC values, following the recommendations by Maltby et al. (2005; 2009) and Van
den Brink et al. (2006) for short-term exposure. For insecticides, the 1–7 days EC50 arthropod data
was included in the SSD. The SSDs of the fungicides included 2–21 days EC50 data for vertebrates, 1–
7 days EC50 data for invertebrates, 2–28 days EC50 data for macrophytes and 1–7 days EC50 data for
algae (Maltby et al. 2005 and 2009; Van den Brink et al. 2006). In case more than one value was
available for a species, the geometric mean of the available values was used. Human health risk
assessment was carried out for pesticides exceeding the EU’s threshold level for drinking waters of
0.1 μg/L (Dolan et al. 2013). Risks to humans was determined using the highest detected
concentrations. Chronic and acute health risks were calculated using acceptable daily intake (ADI)
and acute reference dose (ARfD) values, respectively. Estimated short term intake (ESTI) and the
internationally estimated daily intake (IEDI) values were determined to indicate acute and chronic
risks to humans from drinking surface water as a source of drinking water. Back ground calculation
formulas are given in Teklu et al. (2015), Wipfler et al. (2014) and Adriaanse et al. (2015) and eq. (1).
Risks were categorised as ETR < 1: negligible to low risk; 1 < ETR < 10: possible risk and ETR > 10: high
risk to aquatic organisms, and as ESTI or IEDI > 100%: high risk and ESTI or IEDI < 100%: low to
negligible risk for humans assuming surface water is used as a source of drinking water.
IEDI = DI × 𝑃𝑐𝑜𝑛𝑐𝑒𝑛𝑡𝑟𝑎𝑡𝑖𝑜𝑛
ADI ∗𝐹𝑑𝑤 ×BW 100% eq.(1)
With: IEDI = internationally estimated daily intake, expressed as % of the total acceptable intake of
the pesticide during a lifetime (%); DI = daily intake (L/d); Pconcentration = measured highest Pesticide
concentration in (μg/L); ADI = acceptable daily intake, expressed in μg pesticide per kg BW per day
(μg/kg*d); Fdw= fraction of ADI allocated to drinking water (-) and BW = body weight (kg). BW was
set at 60 kg, DIat 2 L/d and the fraction of ADI allocated to drinking water at 0.1 for Ethiopia.
Results and discussion
Physicochemical parameters
Table 1 summarises the maximum, minimum and average values of all measured
physicochemical parameters. The column headed ‘Percentage of values above the MPL’ shows that
more than 50% of collected samples exceeded the MPL for the following parameters: pH (59%),

70
potassium (87%) and iron 100%); while less than 10% of the observed values exceeded the MPL for
the parameters EC, ammonium, nitrate and boron (7%), sodium (6%) and manganese (1%). All
observed values for calcium, magnesium and chloride were below the MPL. The amounts of
phosphorus, zinc, copper and molybdenum found in this study were either zero or too low to be
detected (<0.01 mg/L) so they can be considered to be below the MPL even though no specific value
was available. They can therefore be considered as posing no risk to human health (Table 1). The RDA
biplot (Fig. 2) displays the temporal and spatial variation of the nutrients and physicochemical
parameters. It appears that the sampling point at the Bulbula River had a high correlation with the
vertical axis, which explains 20% of the variation among the physicochemical parameters, while the
horizontal axis, where floriculture 1, the main liquid waste outlet point of the floriculture area, had a
high correlation, explains 34% (p < 0.01). These results are in line with recorded changes in land-use,
which show that the numbers of both commercial (floriculture, horticulture and viticulture) and
irrigated small-scale farming activities are increasing rapidly in the Lake Ziway catchment and its
surrounding area. The accompanying contamination of the lake and other water bodies as a result of
the use of intensive agriculture inputs like fertilisers may pose risks to human health when the water
is used as drinking water (Jansen et al. 2007).

71
Fig. 2 RDA biplot showing the correlations between sampling date and site and the
physicochemical parameters. Sampling date and site explained a significant part of the variation in
physicochemical parameter values (44%; p = 0.01) levels. Of this variation, 34% is displayed on the
horizontal axis and another 20% on the vertical axis. See Fig. 1 for locations of sampling points.
Previous research results on the Lake Ziway and CRV area indicated that the percentages of
measurements exceeding the MPL where 13% for pH and 1% for EC, while 28% of the iron levels
were reported to exceed the MPL (Reimann et al. 2003). The single measurement values of pH (8.5)
and EC (463 µS/cm) reported in Gashaw (1999) are comparable to the mean results obtained in this
study of 8.5 and 474 µS/cm, respectively. Further comparison of these values with a study done in a
Kenyan Lake shows that the pH and EC values there were within the WHO (Ethiopian) Maximum
Permissible limits for pH (7.5-8.5) and EC (566-601 µS/cm) (Ouma and Mwamburi 2014). In the
present study, higher EC values were found for sampling points near the floriculture area (Fig 2). In
an aquatic environment, EC is an important and simple indicator to characterise the pollution status
Oct-13Feb-14
Jun-14
Oct-14
Feb-15
Jun-13
Bochesa
Bulb
Supply
Flori2
SEDA Fish
Kore
Lodges
Church
Flori1
Bulbula
Katar
Abosa
Gabriel
NW-Lake
Centre
Golbe
Wamicha EC
pH
Ammonium
Nitrate
Phosphate
Potassium
Calcium
Magnesium
Sodium
Sulphur
Chlorine
Bicarbonate
Silicon
Iron
ManganeseZinc
Boron
Copper
Molybdenum

72
of surface waters, as a sudden increase in conductivity can indicate the presence of more dissolved
ions, which may have an impact on aquatic life and water quality.
Table 1 Results for physicochemical and nutrient parameters in this study: (n): number of
observations, Min: Minimum value, Mean: Mean of all observations, Max: Maximum value, Ethiopian
(WHO) MPL: Ethiopian Maximum Permissible Limits for drinking water as listed in MoH (2011) and
WHO (2010), which are similar.
Nutrient/physicochemical
parameter
(n) Min. Mean Max. Ethiopian
(WHO) MPL
% of values
above MPL
pH (-) 87 7.6 8.5 9.0 6.5-8.5 59
EC (µS/cm) 87 140 474 1740 1000 7
Ammonium (NH4+; mg/L) 87 0.01 0.64 3.1 1.5 7
Nitrate( NO3-; mg/L) 87 0.06 26 296 50 7
Phosphorus (mg/L) 87 <0.01 <0.01 <0.01 NA <MPL
Potassium (mg/L) 87 0.33 14 53 1.5 87
Calcium (mg/L) 87 0.43 18 39 75 <MPL
Magnesium (mg/L) 87 0.38 8.1 29 50 <MPL
Sodium (mg/L) 87 3.2 72 337 200 6
Sulphur (mg/L) 87 0.09 3.8 20 NA NA
Chloride (mg/L) 87 0.35 15 38 250 <MPL
Bicarbonate (mg/L) 87 3.9 257 704 NA NA
Silicon (mg/L) 87 0.53 18 81 NA NA
Iron (mg/L) 87 0.06 2. 6 29 0.3 100
Manganese (mg/L) 87 <0.01 0.033 0.90 0.5 1
Zinc (mg/L) 87 <0.01 <0.01 <0.01 5 <MPL
Boron (mg/L) 87 <0.01 0.22 5.7 0.3 7
Copper (mg/L) 87 <0.01 <0.01 <0.01 2 <MPL
Molybdenum (mg/L) 87 <0.01 <0.01 <0.01 NA <MPL

73
Pesticide detection
The pesticide residue analysis, including the results from the earlier study by Jansen and
Harmsen (2011), indicated that overall detections of pesticides showed an increasing trend across
the sampling years, but decreased in final year of our study, with lower amounts of pesticides
detected in 2015 (Fig. 3). Relatively few different types of pesticides were detected in the Meki and
Ketar rivers, Bulula and water supply treatment plant areas, while the floriculture area had the
highest total number of detections of pesticides, followed by Kontola and Gura (Fig. 3). High
detection results are ascribed to the growing trend towards land-use change on the small- and large-
scale farms in the vicinity (Jansen et al. 2007). The environmental impact from the expansion of
large-scale flower farms in Ethiopia in general and around Lake Ziway area in particular is of major
concern for many environmentalists (Getu 2009). The trend towards increasing use of pesticides in
the small-scale irrigated area as the sole pest management technique in the CRV also caused the high
residue detections in the Kontola and Gura areas until the year 2014. This was shown by a survey
conducted by the Pesticide Action Network- United Kingdom (PAN-UK) on the pesticide use and
management by small-scale farmers in the CRV of Ethiopia. The survey found that 97% of
respondents reported using pesticides once or twice a year, and about 91% of the farmers who were
interviewed prepared their pesticides close to water sources used by local people for drinking,
cooking and other household purposes. 61% of the respondents washed their pesticide sprayers and
other equipment on the farm field (PAN-UK, 2006). The decreasing number of detections in the
floriculture area in the years 2014 and 2015 might be associated with the recent innovations in liquid
waste management. Flower farms are increasingly adopting mechanisms to minimise the
environmental impacts of pesticides in the surrounding surface water systems, e.g. by constructing
soakaway pits and wetlands to meet the standards of fair trade as a sustainable certified flower
producer (Teklu et al. 2015).

74
Fig. 3 Numbers of detections over the years of sampling at different sampling locations. Note: mk =
Meki and Ketar rivers; kg = Kontola and Gura.; fl = floriculture ; wstp = water supply treatment plant;
bu = Bulbula. Note that values for 2009 and 2010 are taken from Jansen and Harmsen (2011).
Detection of DDT was reported by the earlier Jansen and Harmsen (2011) study, though no
DDT was detected in the samples taken by HoA-REC&N. Small amounts of other pesticides found in
the earlier study may be a result of the dilution and decay of pesticides in oxygen-rich river waters
(Jansen and Harmsen 2011).
Acute risks of pesticides to aquatic organisms
The results of the first tier-risk assessment (Table 2) show that chlofentezin,sulphur,
spiroxamine and methomyl pose a high acute risk to aquatic organisms, with highest ETR values of
13, 11, 190 and 36, respectively. The table shows that the first-tier risk assessment based on PNEC
values indicates higher risk values than the ETR based on HC5 values. This is consistent with the
principles of the tiered approach, i.e. greater realism and less conservatism at higher tiers (Brock et
al. 2006; Wheeler et al. 2002). There are, however, two exceptions, viz. spiroxamine and endosulfan.
The lower and upper limits of HC5 and HC50 and the number of data points on which the SSD was
based are provided as (Appendix A)
Model-based risk assessment of pesticides in surface waters in Ethiopia indicates that
endosulfan is predicted to pose high risks in lowland ponds in Ethiopia (ETR 32, with a PEC of 0.63
μg/L); while deltamethrin is predicted to pose only a possible risk (ETR = 2.5, with a PEC of 0.0066
0
5
10
15
20
25
30
35
2009 2010 2014 2015
Nu
mb
er
of
de
tect
ion
s (#
)
Year
mk
kg
fl
wstp
bu
75
μg/L) (Teklu et al. 2015). Although there are many explanations for this difference in concentrations,
the most obvious one is the fact that the predicted values represent the 90th percentile of the 33-
year predicted environmental concentration (PEC) values just after application (Adriaanse et al. 2015;
Teklu et al. 2015), while a measured value is just the outcome of an ordinary measurement not
necessarily taken close a pesticide application in space and time. In our study, the highest risk
quotient for aquatic organisms for endosulfan was ETR 2.9, with the highest measured concentration
(0.14 μg/L) found in the area of the Meki and Ketar rivers, while the highest measured concentration
of deltamethrin, with an ETR of 4.1, was found at the water supply treatment plant, with a measured
concentration of 0.01 μg/L; both are in the possible risk category (Table 2).
The overall acute risk assessment for aquatic organisms based on HC5 values indicates high
risk values for the locations Kontola and Gura (spiroxamine: 317), floriculture (spiroxamine: 22) and
Bulbula (spiroxamine: 38), based on a stricter risk category (ETR > 10) (Table 2). Spiroxamine is a
fungicide which has been authorised for the control of the powdery mildew infestation that prevails
in flowers in Ethiopia, and which is also used in most European countries. Spiroxamine has a short
half-life in the water phase (0.8 d). Algae are most sensitive to spiroxamine, followed by
invertebrates and fish (Lewis et al. 2016; PHRD 2015). Though no data is available to compare the
amounts and frequency of use of this fungicide in small- and large-scale farms, it is probable that a
high risk is associated with the frequent use of this pesticide for fungal disease control in the area
(Table 2).

76
Table 2 Risks to aquatic organisms calculated from 1st tier PNEC values (μg/L) and 2nd tier SSD HC5
values (μg/L). Only pesticide – location combinations with a first tier ETR > 1 are included in the table.
Pesticides Location year of highest
detection
Maximum concentration (µg/L) (n = 4)
PNEC 1st tier
ETR 1st tier
SSD HC5
ETR SSD
Sulphur mk 2010 7.0 0.63 11 690 0.01
Endosulfan mk 2014 0.14 0.10 1.4 0.05 2.9
Diazinon kg 2014 0.28 0.10 2.8 0.51 0.55
Dodemorph kg 2014 32 22 1.5 NA NA
Lufenuron kg 2014 0.080 0.01 6.2 NA NA
Spiroxamine kg 2014 57 0.30 190 0.18 317
Sulphur kg 2010 3.0 0.63 4.8 690 <0.01
Teflubenzuron kg 2014 0.03 0.03 1.1 0.47 0.07
Methomyl fl 2009 2.7 0.08 36 11 0.26
Spiroxamine fl 2009 4.0 0.30 13 0.18 22
Teflubenzuron fl 2014 0.05 0.03 1.8 0.47 0.10
Trifloxystrobin fl 2010 0.34 0.15 2.3 1.3 0.27
Carbendazim fl 2009 9.1 1.5 6.1 19 0.48
Chlofentezin fl 2010 0.10 0.01 13 NA NA
Deltamethrin wtp 2014 0.01 <0.01 3.8 <0.01 4.1
Diazinon wtp 2014 0.41 0.10 4.1 0.51 0.80
Endosulfan wtp 2014 0.10 0.10 1.0 0.05 2.1
Lufenuron wtp 2014 0.02 0.01 1.4 NA NA
Pyraclostrobin wtp 2015 0.06 0.06 1.0 0.35 0.18
Sulphur wtp 2010 10 0.63 16 690 0.01
Teflubenzuron wtp 2014 0.08 0.03 2.9 0.47 0.17
Spiroxamine bu 2014 6.9 0.30 23 0.18 38
Note: ETR <1 : negligible/low risk; ETR > 1 : possible risk; ETR > 10 : high risk; mk = Meki and Ketar
rivers kg = Kontola and Gura.; fl = floriculture ; wtp = water supply treatment plant; bu = Bulbula.NA:
not available.
Human risk assessment
The human risk assessment was performed for values exceeding the European 0.1 µg/L
standard (Table 3), and indicated that no acute risk to humans is present when the surface water is

77
used as a source of drinking water (Table 4). This result is in line with Teklu et al. (2015), in which
seven registered pesticides were evaluated using model-based risk assessment, and all were found to
pose low or negligible acute risks to human health. The fungicide spiroxamine poses a high chronic
risk to humans while the insecticide diazinon has the second highest IEDI value (47%), followed by
methomyl (36%) and metalaxyl (25%) (Table 4). It is unknown whether pesticides with values above
10% will pose a risk when exposure through other food sources than water are also taken into
account. Further investigation is required to assess the presence of high risk in combination with
other food sources for the Ethiopian case, in order to get an overall risk estimation for these
pesticides (Van den Brink et al. 2003b; Teklu et al. 2015).
Table 3 Measured pesticides concentrations above 0.1 µg/L (data from this paper and from Jansen
and Harmsen 2011)
Location #>EU 0.1µg/L pesticide
with the
highest
score
pesticide
with the
lowest score
max value
(µg/L)
min
value
(µg/L)
Meki and Ketar 7 Metalaxyl Endosulfan 59 0.095
Kontola and Gura 9 Spiroxamine Cyprodinil 57 0.11
Floriculture 33 Boscalid Clofentezine 13 0.17
Water supply
treatment plant
4 Sulphur Endosulfan 10 0.061
Bulbula 4 Spiroxamine Buprofezin 6.9 0.081
Examination of the number of detections indicates that the locations Kontola and Gura, and
floriculture had the highest numbers of pesticide detections (Fig. 3). The fungicides metalaxyland
spiroxamine reported the highest concentrations, 59 and 57 µg/L, respectively (Table 3). Metalaxyl is
a registered fungicide sold as Folio Gold 537.5 SC for the control of botrytis and downy mildew in
flowers in Ethiopia and in some parts of European countries as well (Lewis et al. 2016; PHRD 2015).
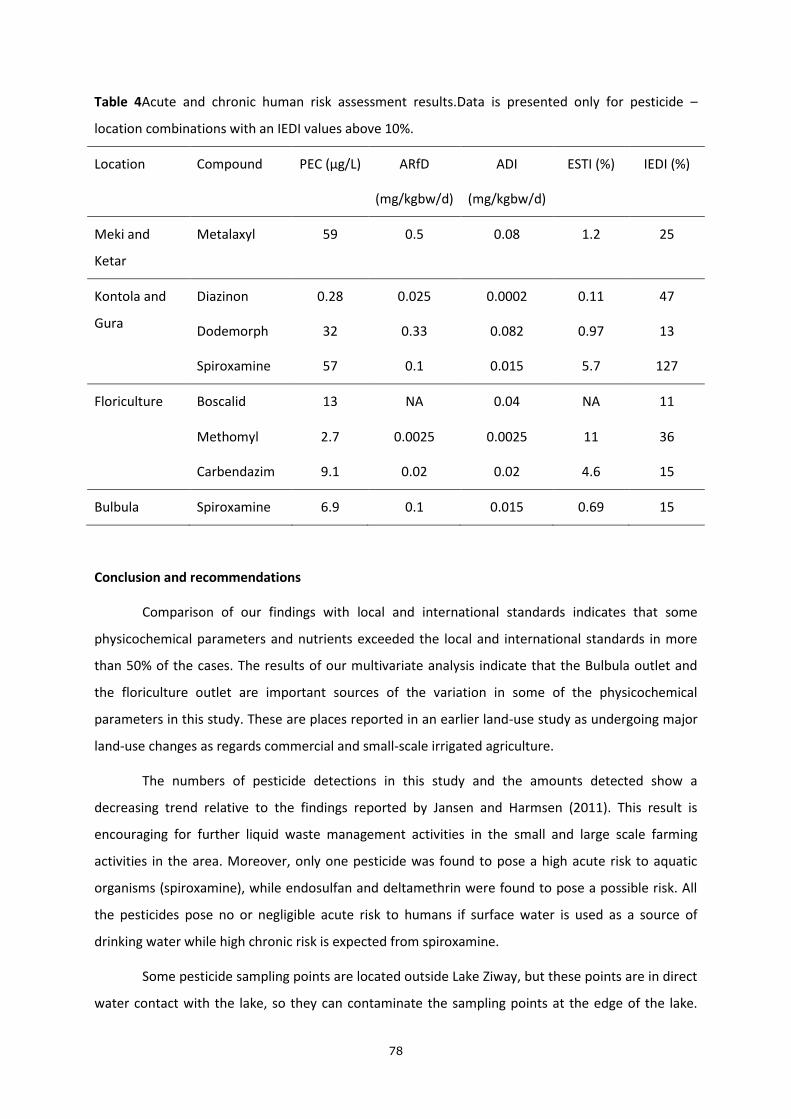
78
Table 4Acute and chronic human risk assessment results.Data is presented only for pesticide –
location combinations with an IEDI values above 10%.
Location Compound PEC (µg/L) ARfD
(mg/kgbw/d)
ADI
(mg/kgbw/d)
ESTI (%) IEDI (%)
Meki and
Ketar
Metalaxyl 59 0.5 0.08 1.2 25
Kontola and
Gura
Diazinon 0.28 0.025 0.0002 0.11 47
Dodemorph 32 0.33 0.082 0.97 13
Spiroxamine 57 0.1 0.015 5.7 127
Floriculture Boscalid 13 NA 0.04 NA 11
Methomyl 2.7 0.0025 0.0025 11 36
Carbendazim 9.1 0.02 0.02 4.6 15
Bulbula Spiroxamine 6.9 0.1 0.015 0.69 15
Conclusion and recommendations
Comparison of our findings with local and international standards indicates that some
physicochemical parameters and nutrients exceeded the local and international standards in more
than 50% of the cases. The results of our multivariate analysis indicate that the Bulbula outlet and
the floriculture outlet are important sources of the variation in some of the physicochemical
parameters in this study. These are places reported in an earlier land-use study as undergoing major
land-use changes as regards commercial and small-scale irrigated agriculture.
The numbers of pesticide detections in this study and the amounts detected show a
decreasing trend relative to the findings reported by Jansen and Harmsen (2011). This result is
encouraging for further liquid waste management activities in the small and large scale farming
activities in the area. Moreover, only one pesticide was found to pose a high acute risk to aquatic
organisms (spiroxamine), while endosulfan and deltamethrin were found to pose a possible risk. All
the pesticides pose no or negligible acute risk to humans if surface water is used as a source of
drinking water while high chronic risk is expected from spiroxamine.
Some pesticide sampling points are located outside Lake Ziway, but these points are in direct
water contact with the lake, so they can contaminate the sampling points at the edge of the lake.
79
Even though it is believed that the overall dilution factor of the lake will reduce the concentration
within the lake, maximum care should be taken in controlling liquid farm wastes on both the small-
and large-scale farms. This requires constant interventions in liquid waste management in these
areas. Commercial horticultural farms that produce vegetables and cut flowers need to develop or
improve the use of mechanical and biological pest management techniques to reduce the use of
synthetic chemicals. Together with the relevant authorities, they should extend their best practices
for safe ecological pest management and their successful waste water control and treatment
experiences to the surrounding small-scale horticulture farms, while waste coming from the
commercial farms must also be regularly assessed.
Further investigations should focus on refining the results of this study and further
investigating the dynamics of pesticides and physicochemical parameters and their exceedance of
the Maximum Permissible Limits of the Ethiopian standard, or the exceedance of the EU 0.1 µg/L
standard in the case of pesticides. The chronic risk to humans and aquatic organisms also needs to be
assessed, as some of the pesticides may be used regularly. Future studies should also consider
studying the ecological risk due to mixtures of pesticides. Planning a continuous monitoring
campaign together with all stakeholders concerned, including commercial and small-scale farmers
and governmental and non-governmental organisations is important to ensure sustainable water
quality in the Ziway Lake catchment.
Acknowledgment: This study was funded by Horn of Africa Regional Environmental Centre and
Networks (HoA-REC&N) in collaboration with the Pesticide Risk Reduction Programme — Ethiopia
(PRRP-Ethiopia), a joint collaborative project on pesticide registration and post-registration of the
Ministry of Agriculture of the Federal Republic of Ethiopia, and the State of the Netherlands
represented by the Ministry of Foreign Affairs/Foreign Trade and Development Cooperation, and the
Technical Cooperation Programme (TCP) of the Food and Agricultural Organisation of the United
Nations. The regular monitoring activities were coordinated and facilitated by the Horn of Africa
Regional Environment Centre and Network (HoA-REC&N) in collaboration with the Ziway Fisheries
Resources Research Centre (ZFRRC) and Ziway Soil Research Centre (ZSRC)

80
Appendices for Chapter 4
Appendix A.HC5/HC50 values and the lower and upper limits of HC5 and HC50 values
Pesticides #of
data
points
HC5
(µg/L)
LL HC5
(µg/L)
ULHC5
(µg/L)
HC50
(µg/L)
LLHC50
(µg/L)
ULHC50
(µg/L)
Sulphur 7 6.90E+02 2.91E+00 9.87E+00 2.02E+05 1.83E+04 2.24E+06
Endosulfan 37 4.83E-02 1.15E-02 1.15E-01 6.25E+00 2.77E+00 1.41E+00
Diazinon 34 5.06E-01 1.88E-01 1.07E+00 1.23E+01 7.04E+00 2.15E+01
Spiroxamine 8 1.80E-01 6.97E-04 3.19E+00 1.19E+02 9.50E+00 1.50E+00
Teflubenzuron 6 4.69E-01 1.08E-03 7.10E+00 1.07E+02 8.35E+00 1.38E+03
Methomyl 21 1.06E+01 3.69E+00 2.19E+01 1.29E+02 7.34E+01 2.27E+02
Trifloxystrobin 12 1.27E+00 2.24E+01 3.62E+00 2.12E+01 8.94E+00 5.01E+01
Carbendazim 11 1.91E+01 1.45E+00 8.63E+01 9.52E+02 2.70E+02 3.36E+03
Deltamethrin 12 2.43E-03 2.73E-04 9.07E-03 8.39E-02 2.83E-02 2.48E-01
Pyraclostrobin 14 3.49E-01 2.89E-02 1.67E+00 3.13E+01 8.85E+00 1.11E+02
81
Chapter 5
Monitoring and risk assessment of pesticides in irrigation systems in Debra Zeit, Ethiopia.
Berhan M. Teklu1,2, Paulien I. Adriaanse3, Paul J. Van den Brink1,3,*
1 Department ofAquatic Ecology and Water Quality Management, Wageningen University, Wageningen University and Research centre, P.O. Box 47, 6700 AA Wageningen, The Netherlands
2 The College of Natural Sciences, University of Addis Ababa, 4 Kilo campus, Addis Ababa, Ethiopia
3 Alterra, Wageningen University and Research centre, P.O. Box 47, 6700 AA Wageningen, The Netherlands
Manuscript submitted for publication toChemosphere
82
Abstract
Since Ethiopia is going through a rapid transformation of its agricultural sector, the growing
use of pesticides may pose increasing risks to the environment and human health. In order to assess
the environmental and human health risks of the current pesticide use as well as the legacy risks due
to the past use of organochlorine pesticides (OCPs), a monitoring programme and risk assessment
was carried out for the Wedecha-Belbela irrigation system in the Debra Zeit area. The Wedecha and
Belbela rivers and adjacent temporary ponds were sampled and examined for the presence of OCPs
between August and October 2014, while data on the current pesticide use by small- and large-scale
farmers was collected by interviews. The usage patterns were evaluated for risks to adjacent aquatic
ecosystems and for the use of these ecosystems as a source of drinking water, using the
PRIMET_Registration_Ethiopia_1.1 model. Samples for OCP detection were collected from three pre-
identified river sites and temporary ponds representing the upstream, middle and downstream
sections of the irrigation system. The samples were collected in five sampling periods, which were
chosen to represent different crop development stages as well as seasonal variations in the study
area. Results indicate that most of the 18 target OCPs were not detected above the detection limit,
while heptachlor epoxide (isomer B) and g-chlordane may pose chronic risks when surface water is
used as drinking water. Endosulfan and g-chlordane pose high risks to aquatic organisms at first-tier
level. Calculated acute risks to humans for all nine pesticides used by small-scale farmers were low.
Current pesticide use data by small-scale farmers in first- and second-tier risk assessment indicated
that lambda-cyhalothrin, endosulfan, profenofos, and diazinon may pose a high risk to aquatic
organisms.

83
Introduction
Due to the ongoing agricultural transformation in Ethiopia, the impact of pesticides on
human health and the environment has recently become a major concern (Teklu et al., 2015). In such
a dynamic era, it is important to evaluate the risks caused by the legacy use of hazardous substances
like organochlorine pesticides (OCPs), as well as assessing the risks of current pesticide use to human
health and the environment in locations with past and current use of pesticides, like the Wedecha-
Belbela irrigation system in Ethiopia. The use of OCPs has been banned or partially restricted in
developed nations, but they are still being used for agricultural and public health purposes in
developing countries, including for the control of agricultural pests as well as mosquitoes (Westbrom
et al. 2008; Safford and Jones 1997; Wei et al. 2007). Although most OCPs are banned from Ethiopian
agriculture following the enforcement of the Stockholm convention in 2004 (Fiedler et al. 2013), DDT
has been used for indoor spraying purposes in malaria control. Illegal use to control agricultural pest
controls has, however, been reported on various occasions, and endosulfan is widely used for insect
pest control in vegetables, even though it is registered only for controlling pests in cotton (Mengistie
et al. 2015).
It is therefore important to evaluate the risks of current environmental concentrations of
OCPs, as they are among the serious pollutants of global concern (Tenabe et al. 1994). They are
known for their environmental persistence, their ability to bioaccumulate and biomagnify in the food
chain, and their chronic toxicity to wildlife and humans. Hence, OCPs are categorized among the
POPs (persistent organic pollutants), an example of which is DDT, which stays in the environment for
a long time (4-30 years). Other chlorinated pesticides share this persistence due to their resistance to
biochemical degradation once released into the environment (Elvira et al. 2011; Jones and De Voogt
1999). The impacts of OCPs on human and animal health include failure of the reproductive system
and increased cancer risk (Perry et al. 2015; Bouman 2004), immune system malfunction (Repetto
and Baliga 1996), endocrine disruption (Mnif et al. 2011), pancreatic cancers (Andreotti et al. 2009)
and breast cancers (Olaya - Contrras et al. 1998).
Monitoring the amounts of OCPs in different environmental matrices including water is
important, since the assessment of the risks posed by these highly controversial pesticides to the
environment and human health has to be based on scientific research. According to the EU
guidelines the allowable residual limit concentration of OCPs in drinking water is 0.1μg/L (Jansen and
Harmsen 2011). Little work has been done on monitoring the residues of OCPs in surface waters in
Ethiopia, and most of the studies have concentrated on evaluating the OCP and heavy metals residue
levels in big Rift valley lakes like Ziway and Hawasa, focusing on quantifying the residue levels in fish
(Abayneh et al. 2003; Dsikowitzkyet al. 2012; Yohannes et al. 2013). Some other studies in Africa

84
examined the status of organochlorine pesticides in freshwater systems, and detected a number of
OCPs in water samples (Awofolu and Fatoki 2003; Adeyemi et al. 2011).
The current use of pesticides in Ethiopia has been surveyed at local and national level.
National level (2000- 2010) data showed that the average import of pesticides has now grown to
over 2400 tonnes per annum, with an overall increasing trend and with herbicides making up the
lion’s share (www.prrp-ethiopia.org). At local level, a survey of pesticide use conducted by FAO in the
Dugda and Ada districts found that small-scale farmers were using higher application frequencies
than commercial farmers in the same area. In addition, mismanagement in handling, transporting,
storing and applying pesticides has been reported (FAO, 2012 unpublished). In a similar survey
undertaken by the Pesticide Action Network-United Kingdom (PAN-UK) on pesticide use and
management by small-scale farmers around the Central Rift Valley, Ethiopia, 97% of the respondents
reported using pesticides once or twice a year, and about 91% of them prepared their pesticides
close to water sources used by local people for drinking, cooking and other household purposes,
while 61% washed their pesticides sprayers and other equipment on the farm field (PAN-UK, 2006). A
similar study indicated that farmers applied pesticides in violation of standard recommendations,
used unsafe storage facilities, ignored risks and safety instructions, did not use protective devices
when applying pesticides and disposed of containers unsafely. The same study found that 74% of the
farmers mixed their pesticides close to a river and that 96% did not know that pesticides can cause
damage to water bodies, while 88% indicated an increase in their pesticide use in the past 5 years
(Mengistie et al., 2016).
Objectives of the present study were to (i) assess the current OCP residue levels in the
Wedecha-Belbela irrigation system, (ii) quantify the risk posed by the OCPs to humans and aquatic
organisms, (iii) determine the risks from actual pesticide use by small-scale farmers at the Wedecha-
Belbela irrigation system using the PRIMET-Registration_Ethiopia_1.1 model (Wipfler et al. 2014),
and (iv) compare actually measured concentrations of endosulfan with predicted environmental
concentration (PEC) values obtained with the PRIMET-Registration_Ethiopia_1.1 model.
Materials and Methods
The study area
The study area is located in the Oromia region, Debra Zeit, some 55 km south of Addis Ababa.
The Wedecha-Belbela irrigation system is situated in this area, where elevation ranges from 1,895 m
at the downstream end of the irrigation system to 2,437 m in the upstream highlands. It has an
average annual rainfall of 815 mm, and annual average minimum and maximum temperatures of
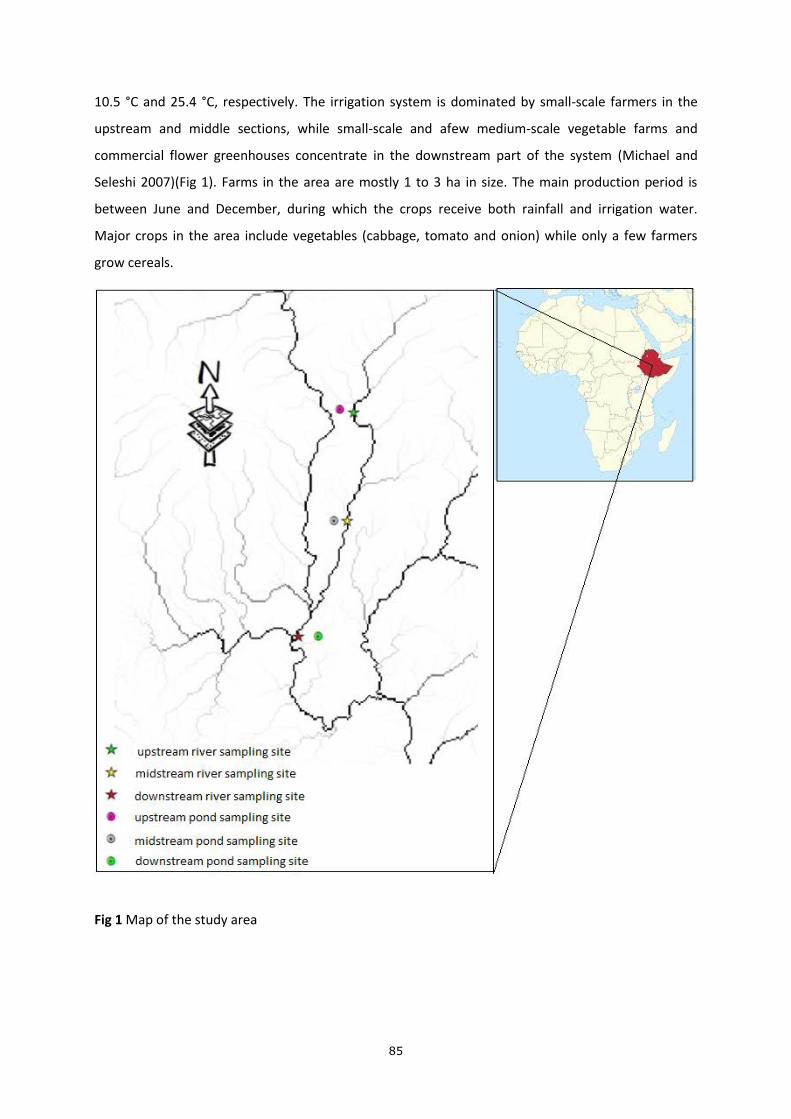
85
10.5 °C and 25.4 °C, respectively. The irrigation system is dominated by small-scale farmers in the
upstream and middle sections, while small-scale and afew medium-scale vegetable farms and
commercial flower greenhouses concentrate in the downstream part of the system (Michael and
Seleshi 2007)(Fig 1). Farms in the area are mostly 1 to 3 ha in size. The main production period is
between June and December, during which the crops receive both rainfall and irrigation water.
Major crops in the area include vegetables (cabbage, tomato and onion) while only a few farmers
grow cereals.
Fig 1 Map of the study area
86
Sample and data collection and laboratory analysis of OCPs
Samples were collected from three river sampling sites in the Wedecha and Belbela rivers,
and three temporary ponds, representing the upstream, midstream and downstream parts of the
irrigation system. The river sampling sites were at elevations of 2190, 1935 and 1879 m, while the
pond sampling sites were situated at 2228, 1943 and 1882 m (Appendix A). Locations were chosen
based on the presence of a small- or large-scale farming activity by the side of the river/canal or pond
sampling sites.
Samples were collected during five sampling periods, encompassing the crop development
stages as well as seasonal variations in the study area. A total of 15 samples were taken by sampling
three river sites four times and one sample from each of the three additional temporary ponds,
which were only formed at the end of rainy season.
A hand grab method was used to collect the water samples in 4 L amber glass bottles.
Collected water was thoroughly mixed in a bucket and transferred to the 4 L amber bottles,
supplemented with some drops of sodium thiosulfate as a preservative and filled up to the seal,
leaving no space for air bubbles to be included. Properly sealed samples were taken to the quality
monitoring and pesticide testing laboratory of the Ethiopian Ministry of Agriculture and stored at 4
°C (Forrest 2000). Together with the water sample collection, the physiological parameters of the
water, including pH, temperature, dissolved oxygen (DO) and electrical conductivity (EC) were
measured using a Handy Polaris (OxyGuard, USA) and a WTW multi 340i (WTW, USA) meter. The
total dissolved solids (TDS) and total suspended solids (TSS) of the water were measured at a
laboratory (JIJE laboglass plc; http://jijelaboglassplc.com/), which is ISO/IEC 17025:2005 accredited
by the Ethiopian National Accreditation Office. TSS was measured by filtering (mesh size 1.12µm) and
drying in an oven at 103–105 °C (Clesceri et al. 1999), while TDS was measured using a TDS meter
(TDS_EZ water quality tester HM-Digital USA).
Samples were analysed at the laboratory of the Plant Health Regulatory Directorate (PHRD)
(accredited by the Ethiopian National Accreditation Office) for pesticide residues. For all 15 samples,
quality control was implemented, to keep the laboratory assessment free from unnecessary
interference and cross-contamination (Adeyemi et al. 2011; Kashyap et al. 2005). A simple
liquid/liquid extraction method followed by a solid phase extraction florisil clean-up was used (Żwir-
Ferenc and Biziuk 2006; De Koning et al. 2009; Awofolu and Fatoki 2003). Analysis was performed by
screening for the 18 OCPs using a gas chromatograph (GC) with an electron capture detector (ECD)
(Agilent Technologies Inc., Palo Alto, CA, USA). OCP standards (99.95%) for 18 target chemicals were
purchased from Restek Ltd, New Haven, CT, USA. A column (Stx-clpesticides 30 m x 250 μm x 0.25
87
μm) was used to separate and analyse extracted samples, with 1 μL volume being injected
automatically. GC temperature was programmed at 120 °C; 225 °C and 280 °C, at an injector and
detector temperature of 230 °C . Helium was used as a carrier gas at a flow rate of 1 mL/min, while
nitrogen was used as a makeup gas at a flow rate of 60 mL/min (Chauhan et al. 2014; Adeyemi et al.
2011; Pitt 2009).
Calculation of PECs for nine pesticides used by small scale farmers using PRIMET_Ethiopia_1.1
Data on current pesticide use was collected by interviewing 15 representative small-scale
farmers from the upstream, midstream and downstream parts of the river; in addition, seven large-
scale farms located along the downstream part of the river were also surveyed. Farmers were
considered to be representative when farming close to the river or a large irrigation canal. Data for
the small-scale farmers was verified by the district agricultural experts in the area. In addition, some
basic information about resource ownership and use and awareness of pesticide application was
collected using a simple questionnaire. Since the entry routes of pesticides into surface water
fromgreenhouse production systems are very different from those from crops grown in fields
outside, a greenhouse scenario is not included in the PRIMET_Registration_Ethiopia_1.1 model, so it
was not possible to calculate the PEC values for the surrounding surface waters regarding the usage
data of the large-scale greenhouse farmers.
The physicochemical data for the reported pesticides was obtained from the Footprint
pesticides properties database (Lewis et al. 2016). When multiple application schemes were recorded
for an active ingredient, the one with the highest application rate was evaluated. The actual
application rate and frequency of use were used in the risk calculations (Appendix B). The two
scenarios for (i) small streams in areas above 1500 m (grid 191, see Teklu et al., 2015 for explanation)
and (ii) temporary ponds in areas between 1500-2000 m (grid 217) as incorporated in
PRIMET_Registration_Ethiopia_1.1. correspond well to the situation in our study area, considering
the altitude and the presence of intensive agricultural activity adjacent to the river and the
temporary ponds in the Debra Zeit area. However, the long-term annual rainfall in the two scenarios
(2581 and 2779 mm) is clearly higher than the reported rainfall for the Wedecha-Belbela irrigation
system with its supplementary irrigation. Two dominant crops (cabbage crop cycle 1 and tomato crop
cycle 1, i.e. non-irrigated crop cycles grown during the rainy season) were selected as representative
crops grown in the area, based on observations and after discussions with the farmers. Pesticide data
including their molar mass, saturated vapour pressure at 20 °C, water solubility, half-life of
transformation in soil (DT50soil), half-life of transformation in water (DT50water), dissociation constant
88
(pKa), and coefficient of sorption to soil based on organic carbon content (Koc), were obtained from
the Footprint pesticide properties database (Lewis et al. 2016) (Appendices C and D).
89
Risk assessment
Acute and chronic risks to humans and aquatic organisms from detected OCPs
For the OCPs we detected, the risks to humans were determined using the highest detected
concentrations. Chronic and acute health risks were calculated using acceptable daily intake (ADI)
and acute reference dose (ARfD) values, respectively. Estimated short-term intake (ESTI) and the
internationally estimated daily intake (IEDI) values were determined to indicate acute and chronic
risks to humans from using surface water as a source of drinking water. Background calculation
formulas are given below and in other publications (Teklu et al. 2015; Wipfler et al. 2014; Adriaanse
et al. 2015; Deneer et al. 2014). The ESTI was determined using a body weight of 60 kg and assuming
a large portion of drinking water (LP_dw) of 6 L per day. The value of 6 L is triple the amount used by
the WHO (WHO, 2011) as daily intake. We nevertheless chose this high value in assessing the acute
risks to humans, as 6 L represents a worst-case scenario accounting for incidental high intakes, e.g.
during hard labour on the land on hot days (eqs. 1 and 2).
Similarly, both acute and chronic risks to aquatic organisms were determined using the
measured OCP concentrations. A first-tier risk assessment was performed for aquatic organisms by
calculating the exposure-to-toxicity ratio (ETR) by estimating acute and chronic no-effect
concentrations (NECs) from the corresponding EC50, LC50 or NOEC values for three representative
aquatic organisms (fish, Daphnia, and algae) (eqs. 3-8)(Lewis et al. 2016) (Appendix E). A second-tier
risk assessment was performed for ETR values >1 using HC5 (hazardous concentration protective of
95% of the population) values from chronic species sensitivity distributions (SSDs). SSDs were
calculated and HC5 concentrations determined using data from the US-EPA database
(www.epa.gov/ecotox). Using the ETX 2.0.software (Van Vlaardingen et al. 2003) to calculate the
HC5, data was selected as discussed by Maltby et al. (2005). In the second tier the HC5 values were
used as NEC values (Teklu et al. 2015). Risk category intervals were as follows; 0–1 equals low risk for
algae, Daphnia and fish; 1–100 medium risk for algae and Daphnia; 1–10, medium risk for fish; >100
high risk for Daphnia and algae and >10 high risk for fish (Teklu et al 2015). All risk calculations for the
detected OCPs were performed by hand, using the highest concentration detected.
ESTI = LP _dw × OCP concentration
ARfD ×BW 100% eq. (1)
With: ESTI = estimated short-term intake (%); LP_dw = Large portion of drinking water (L/day);
OCPconcentration = measured OCP concentrations (µg/L); ADI = acceptable daily intake (µg/Kg BW*d);
ARfD = acute reference dose (µg/Kg BW*d) and BW = body weight (kg).

90
IEDI = DI × 𝑂𝐶𝑃𝑐𝑜𝑛𝑐𝑒𝑛𝑡𝑟𝑎𝑡𝑖𝑜𝑛
ADI ∗𝐹𝑑𝑤 ×BW 100% eq.(2)
With: IEDI = internationally estimated daily intake, expressed as % of the total acceptable intake of
the pesticide during a lifetime (%); DI = daily intake (L/d); ECPconcentration = measured OCP
concentration in (μg/L); ADI = acceptable daily intake, expressed in μg pesticide per kg BW per day
(μg/kg*d); Fdw= fraction of ADI allocated to drinking water (-) and BW = body weight (kg). BW was
set at 60 kg, DIat 2 L/d and the fraction of ADI allocated to drinking water at 0.1 for Ethiopia.
ETRwater_org = 𝑂𝐶𝑃𝑐𝑜𝑛𝑐𝑒𝑛𝑡𝑟𝑎𝑡𝑖𝑜𝑛
𝑁𝐸𝐶org (acute or chronic ) eq.(3).
With:
OCPconcentration = measured OCP concentrations (µg/L)and
NECorg(acute/chronic) = acute or chronic no-effect concentration for the respective aquatic organism (fish, Daphnia or algae) (µg/L).
Where:
NECfish acute= 0.01 * LC50 of fish (µg/L) eq. (4)
NECdaphniaacute= 0.01 * EC50 of Daphnia (µg/L) eq. (5)
NECalgaeacute= 0.1 * EC50 of algae (µg/L) eq. (6)
NECfish chronic = 0.1 * NOEC of fish (µg/L) eq. (7)
NECdaphnia chronic = 0.1 * NOEC of Daphnia (µg/L) eq. (8)
Acute risks to humans and aquatic organisms for nine pesticides used by small-scale farmers
Nine pesticides in current use by the small-scale farmers were evaluated for the risks they may pose
to aquatic organisms and humans, using the PRIMET_Registration_Ethiopia_1.1. model (Wipfler et al
2014). A lower-tier risk assessment was performed to calculate exposure concentrations based on
the incorporated exposure scenarios and threshold levels of effects, using the NEC calculations as
provided above (Teklu et al. 2015). Risks were calculated using the cabbage crop cycle 1 and tomato
crop cycle 1, which are non-irrigated crops grown during the rainy season, as this is the main
production time in the area.
91
Second-tier risks were calculated using acute SSD and HC5 values. Data from the US-EPA
database (www.epa.gov/ecotox) were included and the ETX 2.0. software (Van Vlaardingen et al.
2003) was used to calculate the HC5s. Data was selected as discussed by Maltby et al. (2005). The
calculated HC5s were used as NEC values (Teklu et al. 2015).
Results and discussion
Measured water physical properties
Values of physicochemical parameters measured in this study are given in Annex 1. No correlation
was found between the physicochemical parameters and the residues detected in this study. EC and
pH were found to be within the maximum permissible limits set by the WHO (WHO 2010; Teklu et al.
2016) while the value for the total suspended solids in the samples was at a maximum during the
period of land preparation and sowing, indicating high erosion at the onset of the rainy season in the
area. Average pH and temperature of the river and pond sites sampled in this study were 7.62 and
20.4 °C, respectively. This justified the use of the DT50 aqueous hydrolysis at pH 7 for the
PRIMET_Registration_Ethiopia_1.1 model calculations (Appendix F).
Pesticide use and PEC values for the nine pesticides used by small scale farmers
The results of the survey on pesticide use and handling by small-scale farmers show that 69%
of the respondents did not know that spray drift and run-off can be a possible source of pesticide
pollution to the surrounding surface waters. The majority (91%) did not maintain a safe distance
from the river (or canal) while spraying pesticides, and 71% of the farmers mixed pesticides and
washed pesticide containers near the river/canal. Eighty-two percent of all farmers had increased the
frequency and dosage of pesticide applications in the past five years, and 67% of them mentioned
pest resistance as the major reason for the increment, while 67% indicated they had recently been
trained in pesticide application methods (n=45) (Table 1). Almost all pesticide types were used by the
small-scale farmers with increasing amounts and frequencies of application, except for the herbicides
pyroxsulam and glyphosate, for which no change was found. Flower farms data showed that they all
followed the prescribed dosage and frequency of application. These results are in line with Mengistie
et al. (2016) and FAO (2012 unpublished) who found that small-scale farmers use higher application
rates and frequencies than recommended. A similar increase of 47% in pesticide application rate per
hectare and per season was reported by small-scale vegetable producers in Kenya (Macharia 2015).
Although pest resistance has been reported as the main reason for the increment by small-scale
farmers, the lack of awareness regarding pesticide handling issues could also explain the difference in

92
pesticide misuse between small-scale and large-scale farmers (Mengistie et al. 2016). The general
description on the current status of the liquid waste management by these farms are provided in
Table 2.
Table 1Training and knowledge on pesticide handling and application trends
Question Response (%) (n=45)
Trained on pesticide application methods yes no
66.6 33.4
Understand pesticide labelling yes no
64.4 35.6
Fate of used pesticide containers: throw it to the river, used as drinking water container burn them, sell them use them as kerosene container
0
8.9 60
11.1 20
Know drift and runoffs can be case for surface water pollution
yes no
31.1 68.9
Keep safety distance from canal/river while spraying Yes No
8.9
91.1
Place of pesticide mixing and container washing near river/cannel, at home, in the field (farm)
71.1 8.9 20
Increment of pesticide amount and frequency used before five years
increase decreased no change
82.2
0 17.8
Reason for increment everyone increase, pest resistance, pesticide sellers said so, for trial
22.2 66.7
0 11.1
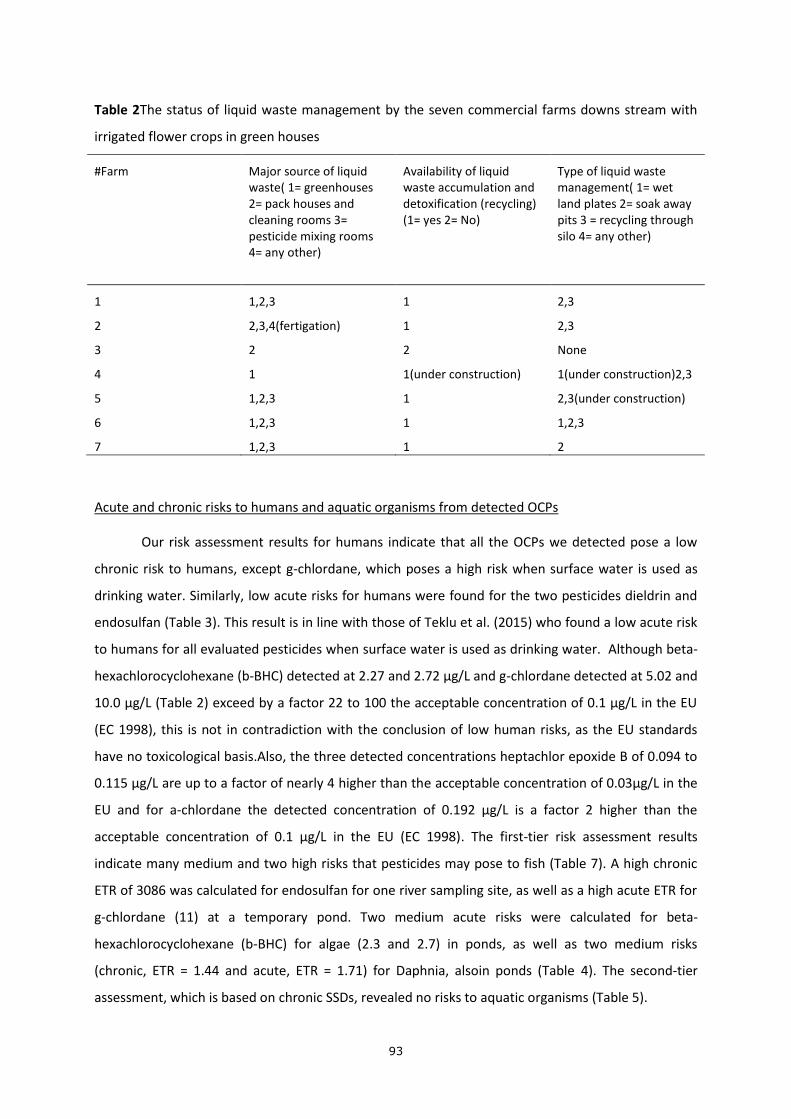
93
Table 2The status of liquid waste management by the seven commercial farms downs stream with
irrigated flower crops in green houses
#Farm Major source of liquid waste( 1= greenhouses 2= pack houses and cleaning rooms 3= pesticide mixing rooms 4= any other)
Availability of liquid waste accumulation and detoxification (recycling) (1= yes 2= No)
Type of liquid waste management( 1= wet land plates 2= soak away pits 3 = recycling through silo 4= any other)
1 1,2,3 1 2,3
2 2,3,4(fertigation) 1 2,3
3 2 2 None
4 1 1(under construction) 1(under construction)2,3
5 1,2,3 1 2,3(under construction)
6 1,2,3 1 1,2,3
7 1,2,3 1 2
Acute and chronic risks to humans and aquatic organisms from detected OCPs
Our risk assessment results for humans indicate that all the OCPs we detected pose a low
chronic risk to humans, except g-chlordane, which poses a high risk when surface water is used as
drinking water. Similarly, low acute risks for humans were found for the two pesticides dieldrin and
endosulfan (Table 3). This result is in line with those of Teklu et al. (2015) who found a low acute risk
to humans for all evaluated pesticides when surface water is used as drinking water. Although beta-
hexachlorocyclohexane (b-BHC) detected at 2.27 and 2.72 µg/L and g-chlordane detected at 5.02 and
10.0 µg/L (Table 2) exceed by a factor 22 to 100 the acceptable concentration of 0.1 µg/L in the EU
(EC 1998), this is not in contradiction with the conclusion of low human risks, as the EU standards
have no toxicological basis.Also, the three detected concentrations heptachlor epoxide B of 0.094 to
0.115 µg/L are up to a factor of nearly 4 higher than the acceptable concentration of 0.03µg/L in the
EU and for a-chlordane the detected concentration of 0.192 µg/L is a factor 2 higher than the
acceptable concentration of 0.1 µg/L in the EU (EC 1998). The first-tier risk assessment results
indicate many medium and two high risks that pesticides may pose to fish (Table 7). A high chronic
ETR of 3086 was calculated for endosulfan for one river sampling site, as well as a high acute ETR for
g-chlordane (11) at a temporary pond. Two medium acute risks were calculated for beta-
hexachlorocyclohexane (b-BHC) for algae (2.3 and 2.7) in ponds, as well as two medium risks
(chronic, ETR = 1.44 and acute, ETR = 1.71) for Daphnia, alsoin ponds (Table 4). The second-tier
assessment, which is based on chronic SSDs, revealed no risks to aquatic organisms (Table 5).
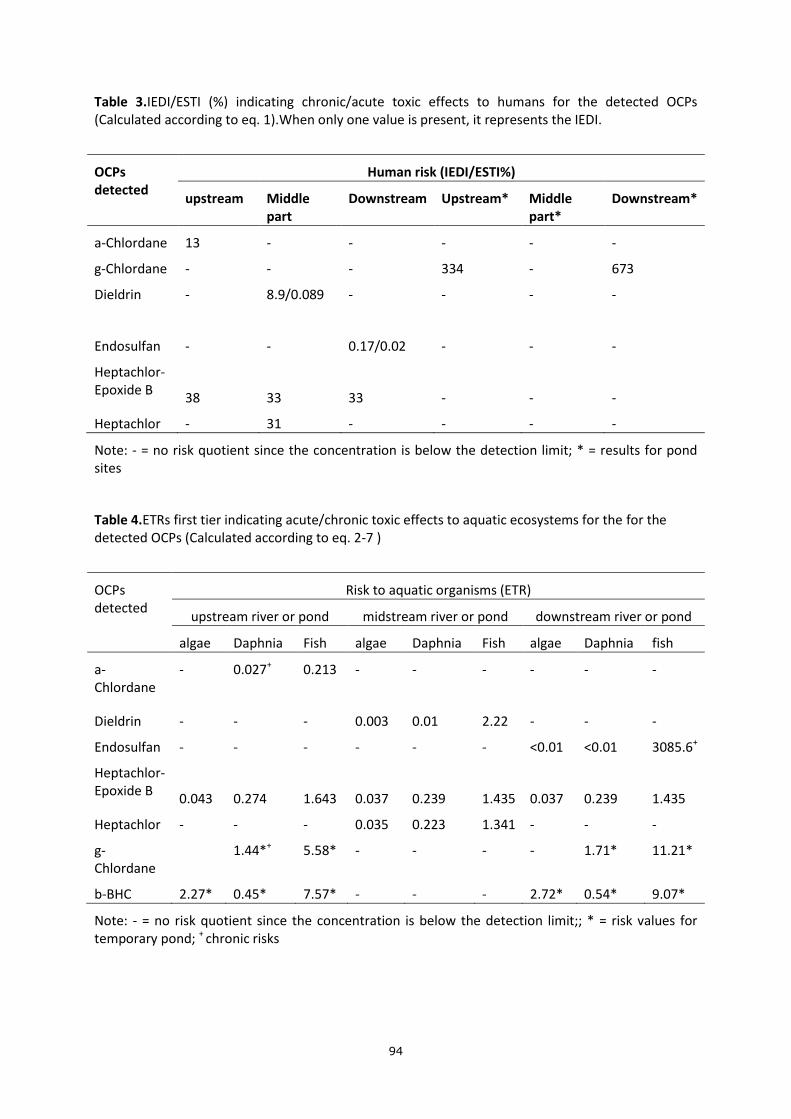
94
Table 3.IEDI/ESTI (%) indicating chronic/acute toxic effects to humans for the detected OCPs (Calculated according to eq. 1).When only one value is present, it represents the IEDI.
OCPs detected
Human risk (IEDI/ESTI%)
upstream Middle part
Downstream Upstream* Middle part*
Downstream*
a-Chlordane 13 - - - - -
g-Chlordane - - - 334 - 673
Dieldrin - 8.9/0.089
- - - -
Endosulfan - - 0.17/0.02 - - -
Heptachlor- Epoxide B
38
33
33
-
-
-
Heptachlor - 31 - - - -
Note: - = no risk quotient since the concentration is below the detection limit; * = results for pond sites
Table 4.ETRs first tier indicating acute/chronic toxic effects to aquatic ecosystems for the for the detected OCPs (Calculated according to eq. 2-7 )
OCPs detected
Risk to aquatic organisms (ETR)
upstream river or pond midstream river or pond downstream river or pond
algae Daphnia Fish algae Daphnia Fish algae Daphnia fish
a-Chlordane
- 0.027+
0.213 - - - - - -
Dieldrin - - - 0.003 0.01 2.22 - - -
Endosulfan - - - - - - <0.01 <0.01 3085.6+
Heptachlor- Epoxide B
0.043
0.274
1.643
0.037
0.239
1.435
0.037
0.239
1.435
Heptachlor - - - 0.035 0.223 1.341 - - -
g-Chlordane
1.44*+ 5.58* - - - - 1.71* 11.21*
b-BHC 2.27* 0.45* 7.57* - - - 2.72* 0.54* 9.07*
Note: - = no risk quotient since the concentration is below the detection limit;; * = risk values for temporary pond; + chronic risks
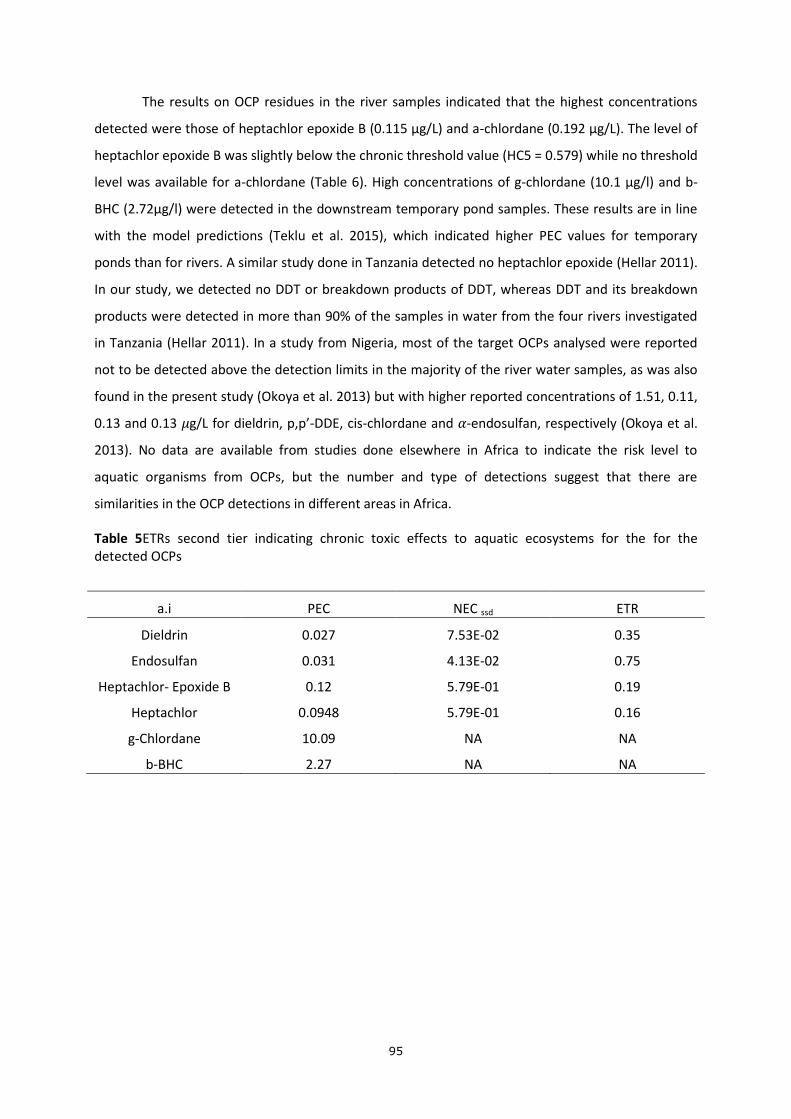
95
The results on OCP residues in the river samples indicated that the highest concentrations
detected were those of heptachlor epoxide B (0.115 µg/L) and a-chlordane (0.192 µg/L). The level of
heptachlor epoxide B was slightly below the chronic threshold value (HC5 = 0.579) while no threshold
level was available for a-chlordane (Table 6). High concentrations of g-chlordane (10.1 µg/l) and b-
BHC (2.72µg/l) were detected in the downstream temporary pond samples. These results are in line
with the model predictions (Teklu et al. 2015), which indicated higher PEC values for temporary
ponds than for rivers. A similar study done in Tanzania detected no heptachlor epoxide (Hellar 2011).
In our study, we detected no DDT or breakdown products of DDT, whereas DDT and its breakdown
products were detected in more than 90% of the samples in water from the four rivers investigated
in Tanzania (Hellar 2011). In a study from Nigeria, most of the target OCPs analysed were reported
not to be detected above the detection limits in the majority of the river water samples, as was also
found in the present study (Okoya et al. 2013) but with higher reported concentrations of 1.51, 0.11,
0.13 and 0.13 𝜇g/L for dieldrin, p,p’-DDE, cis-chlordane and 𝛼-endosulfan, respectively (Okoya et al.
2013). No data are available from studies done elsewhere in Africa to indicate the risk level to
aquatic organisms from OCPs, but the number and type of detections suggest that there are
similarities in the OCP detections in different areas in Africa.
Table 5ETRs second tier indicating chronic toxic effects to aquatic ecosystems for the for the detected OCPs
a.i PEC NEC ssd ETR
Dieldrin 0.027 7.53E-02 0.35
Endosulfan 0.031 4.13E-02 0.75
Heptachlor- Epoxide B 0.12 5.79E-01 0.19
Heptachlor 0.0948 5.79E-01 0.16
g-Chlordane 10.09 NA NA
b-BHC 2.27 NA NA
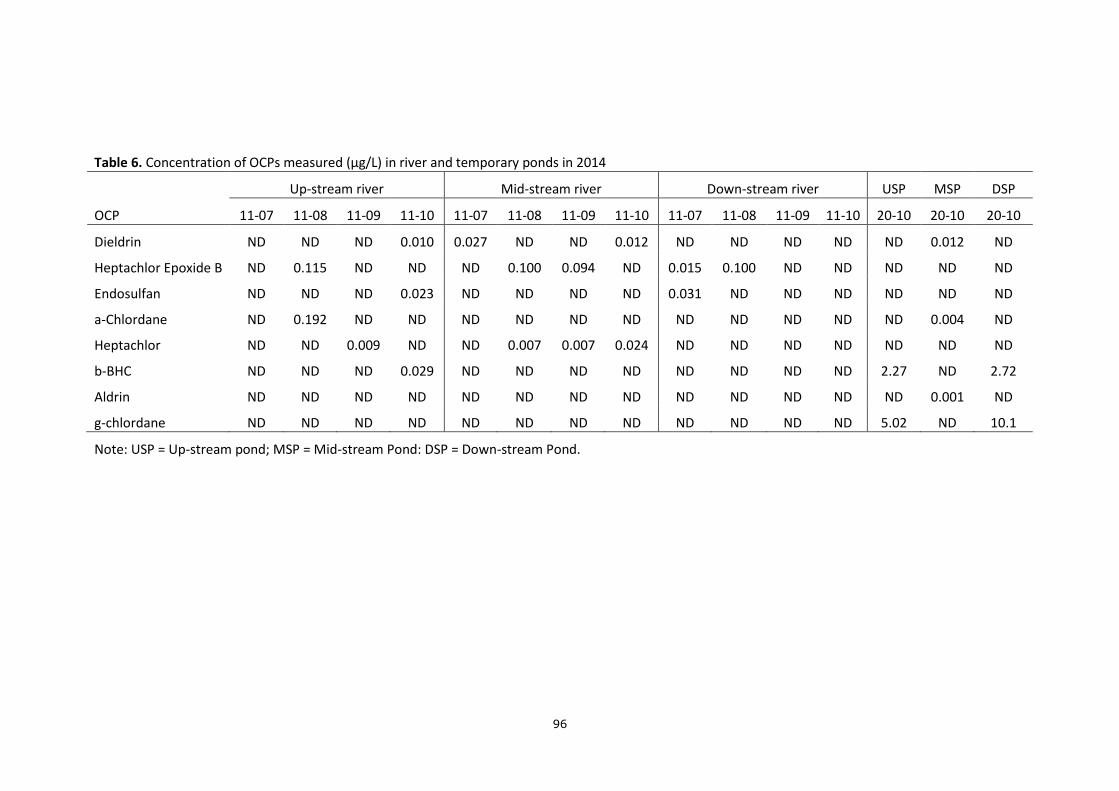
96
Table 6. Concentration of OCPs measured (µg/L) in river and temporary ponds in 2014
Up-stream river Mid-stream river Down-stream river USP MSP DSP
OCP 11-07 11-08 11-09 11-10 11-07 11-08 11-09 11-10 11-07 11-08 11-09 11-10 20-10 20-10 20-10
Dieldrin ND ND ND 0.010 0.027 ND ND 0.012 ND ND ND ND ND 0.012 ND
Heptachlor Epoxide B ND 0.115 ND ND ND 0.100 0.094 ND 0.015 0.100 ND ND ND ND ND
Endosulfan ND ND ND 0.023 ND ND ND ND 0.031 ND ND ND ND ND ND
a-Chlordane ND 0.192 ND ND ND ND ND ND ND ND ND ND ND 0.004 ND
Heptachlor ND ND 0.009 ND ND 0.007 0.007 0.024 ND ND ND ND ND ND ND
b-BHC ND ND ND 0.029 ND ND ND ND ND ND ND ND 2.27 ND 2.72
Aldrin ND ND ND ND ND ND ND ND ND ND ND ND ND 0.001 ND
g-chlordane ND ND ND ND ND ND ND ND ND ND ND ND 5.02 ND 10.1
Note: USP = Up-stream pond; MSP = Mid-stream Pond: DSP = Down-stream Pond.
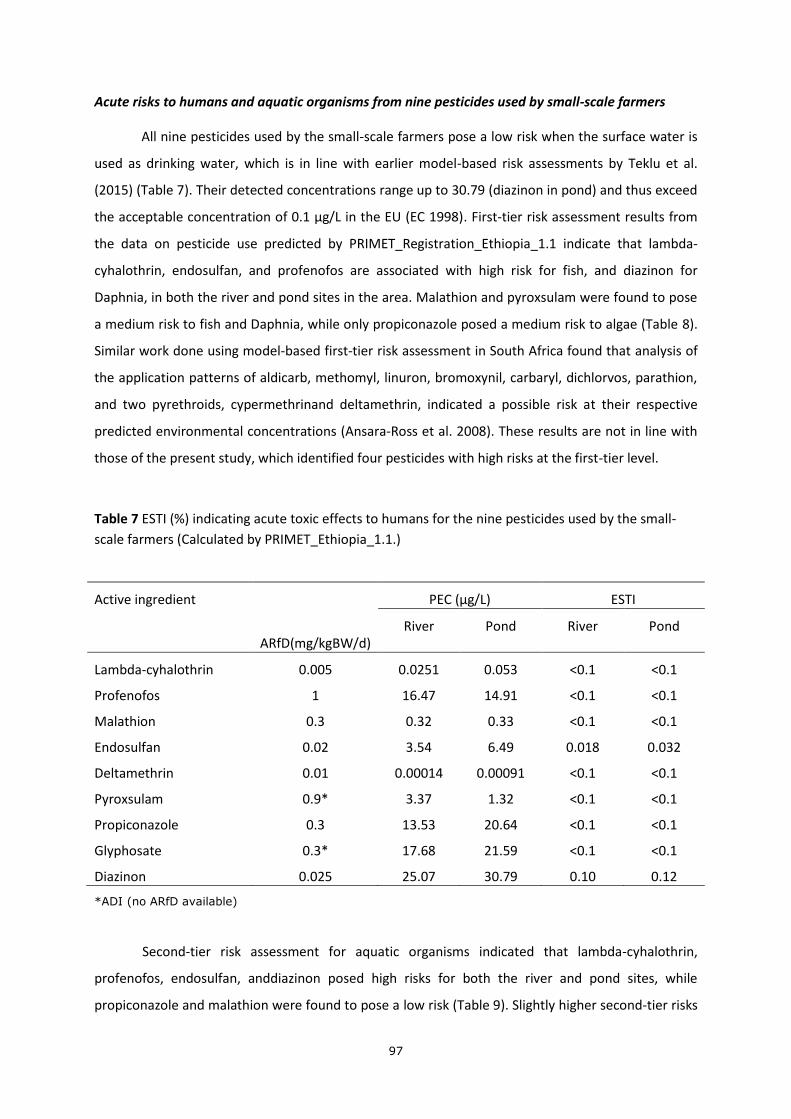
97
Acute risks to humans and aquatic organisms from nine pesticides used by small-scale farmers
All nine pesticides used by the small-scale farmers pose a low risk when the surface water is
used as drinking water, which is in line with earlier model-based risk assessments by Teklu et al.
(2015) (Table 7). Their detected concentrations range up to 30.79 (diazinon in pond) and thus exceed
the acceptable concentration of 0.1 µg/L in the EU (EC 1998). First-tier risk assessment results from
the data on pesticide use predicted by PRIMET_Registration_Ethiopia_1.1 indicate that lambda-
cyhalothrin, endosulfan, and profenofos are associated with high risk for fish, and diazinon for
Daphnia, in both the river and pond sites in the area. Malathion and pyroxsulam were found to pose
a medium risk to fish and Daphnia, while only propiconazole posed a medium risk to algae (Table 8).
Similar work done using model-based first-tier risk assessment in South Africa found that analysis of
the application patterns of aldicarb, methomyl, linuron, bromoxynil, carbaryl, dichlorvos, parathion,
and two pyrethroids, cypermethrinand deltamethrin, indicated a possible risk at their respective
predicted environmental concentrations (Ansara-Ross et al. 2008). These results are not in line with
those of the present study, which identified four pesticides with high risks at the first-tier level.
Table 7 ESTI (%) indicating acute toxic effects to humans for the nine pesticides used by the small-
scale farmers (Calculated by PRIMET_Ethiopia_1.1.)
Active ingredient
ARfD(mg/kgBW/d)
PEC (µg/L) ESTI
River Pond River Pond
Lambda-cyhalothrin 0.005 0.0251 0.053 <0.1 <0.1
Profenofos 1 16.47 14.91 <0.1 <0.1
Malathion 0.3 0.32 0.33 <0.1 <0.1
Endosulfan 0.02 3.54 6.49 0.018 0.032
Deltamethrin 0.01 0.00014 0.00091 <0.1 <0.1
Pyroxsulam 0.9* 3.37 1.32 <0.1 <0.1
Propiconazole 0.3 13.53 20.64 <0.1 <0.1
Glyphosate 0.3* 17.68 21.59 <0.1 <0.1
Diazinon 0.025 25.07 30.79 0.10 0.12
*ADI (no ARfD available)
Second-tier risk assessment for aquatic organisms indicated that lambda-cyhalothrin,
profenofos, endosulfan, anddiazinon posed high risks for both the river and pond sites, while
propiconazole and malathion were found to pose a low risk (Table 9). Slightly higher second-tier risks
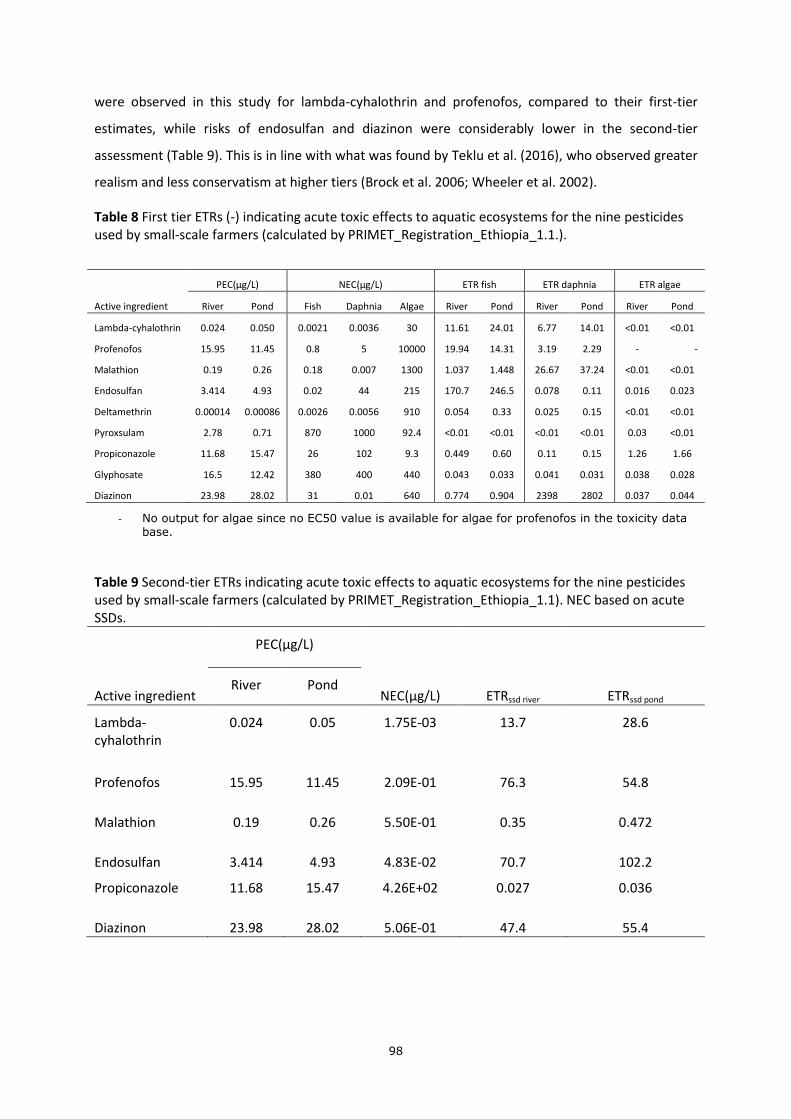
98
were observed in this study for lambda-cyhalothrin and profenofos, compared to their first-tier
estimates, while risks of endosulfan and diazinon were considerably lower in the second-tier
assessment (Table 9). This is in line with what was found by Teklu et al. (2016), who observed greater
realism and less conservatism at higher tiers (Brock et al. 2006; Wheeler et al. 2002).
Table 8 First tier ETRs (-) indicating acute toxic effects to aquatic ecosystems for the nine pesticides used by small-scale farmers (calculated by PRIMET_Registration_Ethiopia_1.1.).
PEC(µg/L) NEC(µg/L) ETR fish ETR daphnia ETR algae
Active ingredient River Pond Fish Daphnia Algae River Pond River Pond River Pond
Lambda-cyhalothrin 0.024 0.050 0.0021 0.0036 30 11.61 24.01 6.77 14.01 <0.01 <0.01
Profenofos 15.95 11.45 0.8 5 10000 19.94 14.31 3.19 2.29 - -
Malathion 0.19 0.26 0.18 0.007 1300 1.037 1.448 26.67 37.24 <0.01 <0.01
Endosulfan 3.414 4.93 0.02 44 215 170.7 246.5 0.078 0.11 0.016 0.023
Deltamethrin 0.00014 0.00086 0.0026 0.0056 910 0.054 0.33 0.025 0.15 <0.01 <0.01
Pyroxsulam 2.78 0.71 870 1000 92.4 <0.01 <0.01 <0.01 <0.01 0.03 <0.01
Propiconazole 11.68 15.47 26 102 9.3 0.449 0.60 0.11 0.15 1.26 1.66
Glyphosate 16.5 12.42 380 400 440 0.043 0.033 0.041 0.031 0.038 0.028
Diazinon 23.98 28.02 31 0.01 640 0.774 0.904 2398 2802 0.037 0.044
- No output for algae since no EC50 value is available for algae for profenofos in the toxicity data base.
Table 9 Second-tier ETRs indicating acute toxic effects to aquatic ecosystems for the nine pesticides used by small-scale farmers (calculated by PRIMET_Registration_Ethiopia_1.1). NEC based on acute SSDs.
Active ingredient
PEC(µg/L)
NEC(µg/L)
ETRssd river
ETRssd pond River Pond
Lambda-cyhalothrin
0.024 0.05 1.75E-03 13.7 28.6
Profenofos 15.95 11.45 2.09E-01 76.3 54.8
Malathion 0.19 0.26 5.50E-01 0.35 0.472
Endosulfan 3.414 4.93 4.83E-02 70.7 102.2
Propiconazole 11.68 15.47 4.26E+02 0.027 0.036
Diazinon 23.98 28.02 5.06E-01 47.4 55.4

99
Comparison of endosulfan as a detected OCP and as model prediction PEC value
We expected higher concentrations of endosulfan than of other OCPs in river and/or pond
samples, since this pesticide is currently used by farmers (see results of interviews). The residue
levels found in our study were, however, quite low, with a highest detected concentration of
0.03µg/L. This is lower than the levels predicted in a recent model-based study (Teklu et al. 2015),
with the model predicted PEC values of 1.3 µg/L and 0.6 µg/L for the grids 191 and 217, respectively,
for Maize.These values are even much lower than those obtained by the
PRIMET_Registration_Ethiopia_1.1, with PECs of 3.14 and 4.93 μg/L for the cabbage and tomato
crops in the river and pond scenarios respectively in the present study (Table 8). There are many
explanations for this difference, the most obvious of which is that the predicted values represent the
90th percentile of the 33-year PEC values just after application (Adriaanse et al. 2015; Teklu et al.
2015), while a measured value just results from one ordinary measurement. Other possible reasons
include a difference in the amounts and frequency of applications of endosulfan as actually used by
the farmers and the values used for the PEC calculations (Baveye et al. 2007). The difference in the
annual rainfall between the DebreZeit area (815 mm) and the scenario locations, i.e. grids 191 (2581
mm) and 217 (2779 mm), is considerable, which will result inhigher incidences of runoff with higher
PECs in the scenarios than in the Wedecha-Belbela irrigation system (Adriaanse et al. 2015).
Moreover, the measurements were not made when endosulfan was being applied adjacent to fields
or just after a run-off event, while PRIMET_Registration_Ethiopia_1.1 calculates peak concentrations
immediately after application or run-off, which might also explain the difference.
Generally, higher PEC values were calculated for the river and pond scenarios by
PRIMET_Registration_Ethiopia_1.1 when actual use patterns were used as input (Table 8) than when
using usage patterns based on good agricultural practices (GAP) (Teklu et al. 2015). Endosulfan PEC
values found by Teklu et al. (2015) are based on a worst-case scenario when GAP is followed, while
the present study used the actual application rate and frequency to predict the values, which
explains the higher concentrations.
To conclude, the calculated concentrations are expected to be protective against risks in the
Wedecha-Belbela irrigation system, as the long-term annual average rainfall in the two scenarios is
higher than those in the irrigation system. Grid 191 is the worst-case scenario for all rivers above
1500 m in Ethiopia and was considered to provide a protective PEC value for the river sites in the
present study (Appendix F). Grid 217 represents a worst-case scenario for temporary ponds with an
altitude of 1500-2000 m (Adriaanse et al 2015) and was considered to provide a protective PEC value
for the midstream and downstream pond sampling sites in the present study (Appendix F).

100
Our study was unable to quantify the risks of pesticide use for aquatic ecosystems near
greenhouses. The scenario for such systems is different from those included in the
PRIMET_Registration_Ethiopia_1.1 model, for instance in that all spray activity takes place indoors.
Most large-scale farmers reported possessing a mechanism for recycling liquid waste from their
greenhouses, besides the use of soakaway pits and wetlands for further detoxification of liquid
wastes to protect the surrounding soil and surface waters. Future studies need to concentrate on the
applicability of these systems and the generation of plausible scenarios for surface water risk
assessment of pesticides for Ethiopian greenhouse systems. Moreover, the two grids (191 and 217)
from the PRIMET_Registration_Ethiopia_1.1 represent vulnerable exposure situations in Ethiopia
(and thus not average situations), i.e. the 99th-percentile worst case for drinking water and the 90th-
percentile worst case for aquatic organisms, of all possible situations in time and space in Ethiopia.
Comparison of the elevation, rainfall pattern (i.e. total annual average, period, and if possible
number of events >20 mm/d per year) and agricultural crops between the small stream scenario (grid
191) and the pond scenario (grid 217) with those of the Wedecha-Belbela irrigation system showed
that the grid scenarios provided a worst case scenario for the irrigation system.
Acknowledgements
The present study was funded by the Pesticide Risk Reduction Programme — Ethiopia (PRRP-
Ethiopia), a joint collaborative project on pesticide registration and post-registration between the
Ministry of Agriculture of the Federal Republic of Ethiopia, and the State of the Netherlands
represented by the Ministry of Foreign Affairs/for Development Cooperation and the Technical
Cooperation Programme (TCP) of the Food and Agricultural Organisation of the United Nations.

101
Appendices for Chapter 5
Appendix A. Measured physico-chemical parameters at the different sampled locations and sampling times.
Sampling location and
(elevation (m))
Sampling time in 2014
EC µS/cm
pH
DO(mg/L)
T (oC)
TDS (mg/L)
TSS (mg/L)
TS(mg/L)
Crop development stage
Upstream river (2190 m)
11-07 670 7.82 7.45 18.9 420 1180 1600 land preparation
11-08 420 6.96 5.46 19.3 260 1060 1320 seedling
11-09 560 7.65 6.45 20.1 370 700 1070 flowering
11-10 545 7.45 7.45 22.1 320 240 560 maturity
Midstream river(1935 m)
11-07 490 8.17 6.34 22.2 310 750 1060 land preparation
11-08 570 7.45 6.34 20.1 360 1190 1550 seedling
11-09 520 8.12 4.34 20.4 330 440 770 flowering
11-10 598 6.97 7.45 22.2 380 260 640 maturity
Downstream river(1879m)
11-07 320 7.52 6.22 19.5 200 1460 1660 land preparation
11-08 616 7.98 7.22 19.8 390 810 1200 seedling
11-09 440 7.34 6.34 21.4 280 670 950 flowering
11-10 470 8.21 8.98 21.4 300 500 800 maturity
USP (2228 m) 20-10 360 7.34 7.56 22.5 220 320 540 maturity
MSP (1943 m) 20-10 510 7.98 5.45 21.3 320 180 500 maturity
DSP (1882 m) 20-10 540 7.34 7.34 22.1 340 1260 1600 maturity
Note: Note: USP = Upstream Pond; MSP = Midstream Pond: DSP = Downstream; EC = Electrical Conductivity; DO = Dissolved Oxygen; T = Temperature; TDS = Total Dissolved Solids; TSS = Total Suspended Solids; TS = Total Solids (Dissolved + Suspended).

102
Appendix B.Pesticide use by small-scale farmers, according to GAP and applied according to farmers
Active ingredient
Type
Substance group
Conc. a.i. in produ
ct g/kg
or g/L
Method of
application
Dose of formulat
ed product According to GAP (kg/ha or
L/ha)
Actual dose of
formulated
product (kg/ha or
L/ha )
Appl. rate
according to
GAP (g a.i./ha)
Actual
Appl. rate (g
a.i./ha)
actual
Prescribed # of
application/
cropping season
Actual number
of applicati
on
Application
intervals (Accordi
ng to GAP as well as actual)
(d)
Crop type in PRIMET_Ethio
pia
Application start
Lambda-cyhalothrin
IN Pyrethroid 80 spray 0.4 1.2 32 96 3 6 7 C1st July 15
Profenofos IN Organophosphate
720 spray 1.5 3.5 1080 2520 2 4 20 T1st July 15
Malathion IN Organophosphate
500 spray 1.5 3.5 750 1750 2 4 25 T1st July 15
Endosulfan IN Organochlorine 350 spray 2.5 3.5 875 1225 2 4 20 T1st July 15
Deltamethrin IN Pyrethroid 60 spray 1 1.5 60 90 2 4 15 C1st July 15
Pyroxsulam HB Triazolopyrimidine
450 spray 0.4 0.4 180 180 1 1 T1st June 15
Propiconazole FU Triazole 250 spray 1 2.5 250 625 2 4 7 T1st July 15
Glyphosate HB Phosphonoglycine
480 spray 4 4 1920 1920 1 1 C1st June 15
Diazinon IN Organophosphate
600 spray 2 2.5 1200 1500 2 3 15 C1st July 15
Note : C1st = Cabbage first cycle; T1st = Tomato first cycle
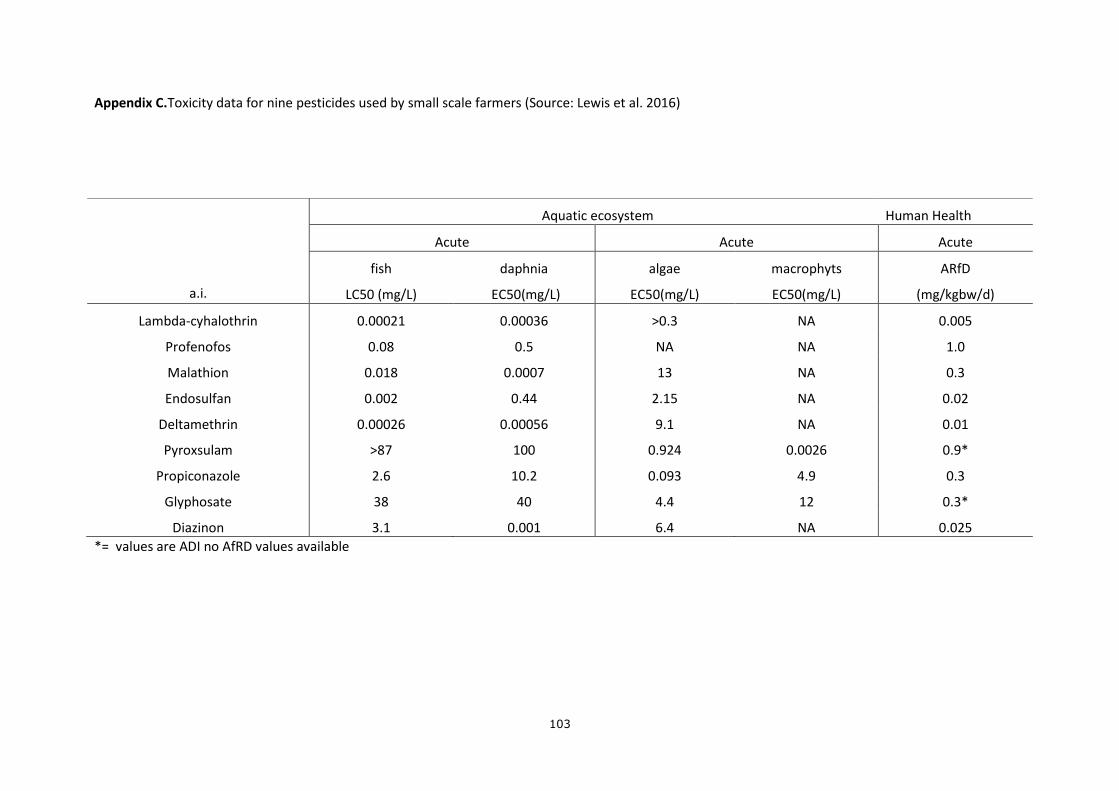
103
Appendix C.Toxicity data for nine pesticides used by small scale farmers (Source: Lewis et al. 2016)
*= values are ADI no AfRD values available
a.i.
Aquatic ecosystem Human Health
Acute Acute Acute
fish
LC50 (mg/L)
daphnia
EC50(mg/L)
algae
EC50(mg/L)
macrophyts
EC50(mg/L)
ARfD
(mg/kgbw/d)
Lambda-cyhalothrin 0.00021 0.00036 >0.3 NA 0.005
Profenofos 0.08 0.5 NA NA 1.0
Malathion 0.018 0.0007 13 NA 0.3
Endosulfan 0.002 0.44 2.15 NA 0.02
Deltamethrin 0.00026 0.00056 9.1 NA 0.01
Pyroxsulam >87 100 0.924 0.0026 0.9*
Propiconazole 2.6 10.2 0.093 4.9 0.3
Glyphosate 38 40 4.4 12 0.3*
Diazinon 3.1 0.001 6.4 NA 0.025
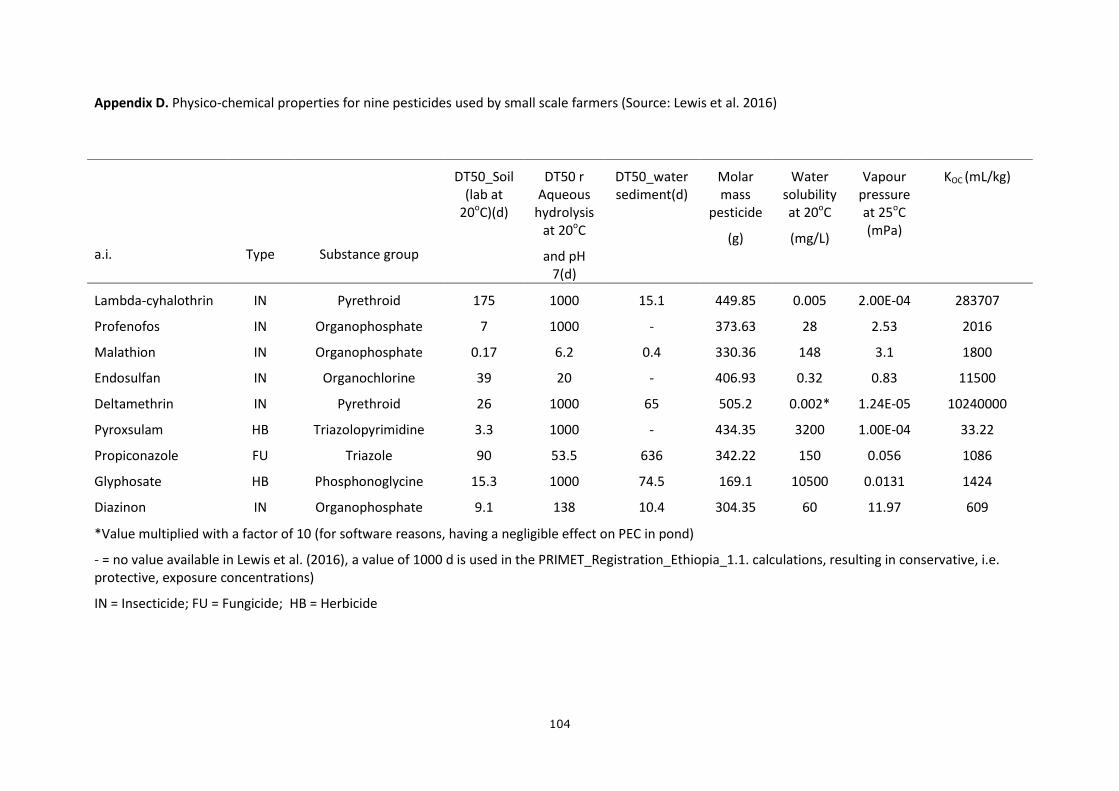
104
Appendix D. Physico-chemical properties for nine pesticides used by small scale farmers (Source: Lewis et al. 2016)
*Value multiplied with a factor of 10 (for software reasons, having a negligible effect on PEC in pond)
- = no value available in Lewis et al. (2016), a value of 1000 d is used in the PRIMET_Registration_Ethiopia_1.1. calculations, resulting in conservative, i.e. protective, exposure concentrations)
IN = Insecticide; FU = Fungicide; HB = Herbicide
a.i.
Type
Substance group
DT50_Soil (lab at
20oC)(d)
DT50 r Aqueous
hydrolysis at 20oC
and pH 7(d)
DT50_water sediment(d)
Molar mass
pesticide
(g)
Water solubility at 20oC
(mg/L)
Vapour pressure at 25oC (mPa)
KOC (mL/kg)
Lambda-cyhalothrin IN Pyrethroid 175 1000 15.1 449.85 0.005 2.00E-04 283707
Profenofos IN Organophosphate 7 1000 - 373.63 28 2.53 2016
Malathion IN Organophosphate 0.17 6.2 0.4 330.36 148 3.1 1800
Endosulfan IN Organochlorine 39 20 - 406.93 0.32 0.83 11500
Deltamethrin IN Pyrethroid 26 1000 65 505.2 0.002* 1.24E-05 10240000
Pyroxsulam HB Triazolopyrimidine 3.3 1000 - 434.35 3200 1.00E-04 33.22
Propiconazole FU Triazole 90 53.5 636 342.22 150 0.056 1086
Glyphosate HB Phosphonoglycine 15.3 1000 74.5 169.1 10500 0.0131 1424
Diazinon IN Organophosphate 9.1 138 10.4 304.35 60 11.97 609

105
Appendix E.The ADI,ARfD and aquatic toxicity data for detected OCPs (Source: Lewis et al. 2016)
OCP detected
ARfD
(mg/kgBW/d)
ADI
(mg/kgBW/d)
Algae Daphnia Fish
NECchronic fish
NECchronic daphnia
NECacute fish
NECacute daphnia
EC50 (mg/L)
NOEC
(mg/L)
EC50
(mg/L)
NOEC
(mg/L)
LC50
(mg/L)
NOEC
(mg/L)
a-Chlordane
NA 0.0005 NA NA 5.9 0.07 0.9 NA NA 7 0.9 5.9
g-Chlordane
NA 0.0005 NA NA 5.9 0.07 0.9 NA NA 7 0.9 5.9
b-BHC NA NA 1 NA 5 NA 0.3 NA NA NA 0.3 5
Dieldrin 0.003 0.0001 10 NA 0.025 NA 0.012 NA NA NA 0.012 2.5
Endosulfan 0.02 0.006 215 NA 0.44 NA 0.002 0.0000001 0.00001
NA 0.02 4.4
Heptachlor Epoxide B
NA 0.0001 2.7 NA 0.042 NA 0.007 3.29 329 NA 0.07 0.42
Heptachlor NA 0.0001 2.7 NA 0.42 NA 0.07 3.29 329 NA 0.07 0.42
Note: NA = Not Available; ADI = Acceptable Daily Intake; ARfD = Acute reference dose; EC/LC50 = Effect/Lethal concentrations
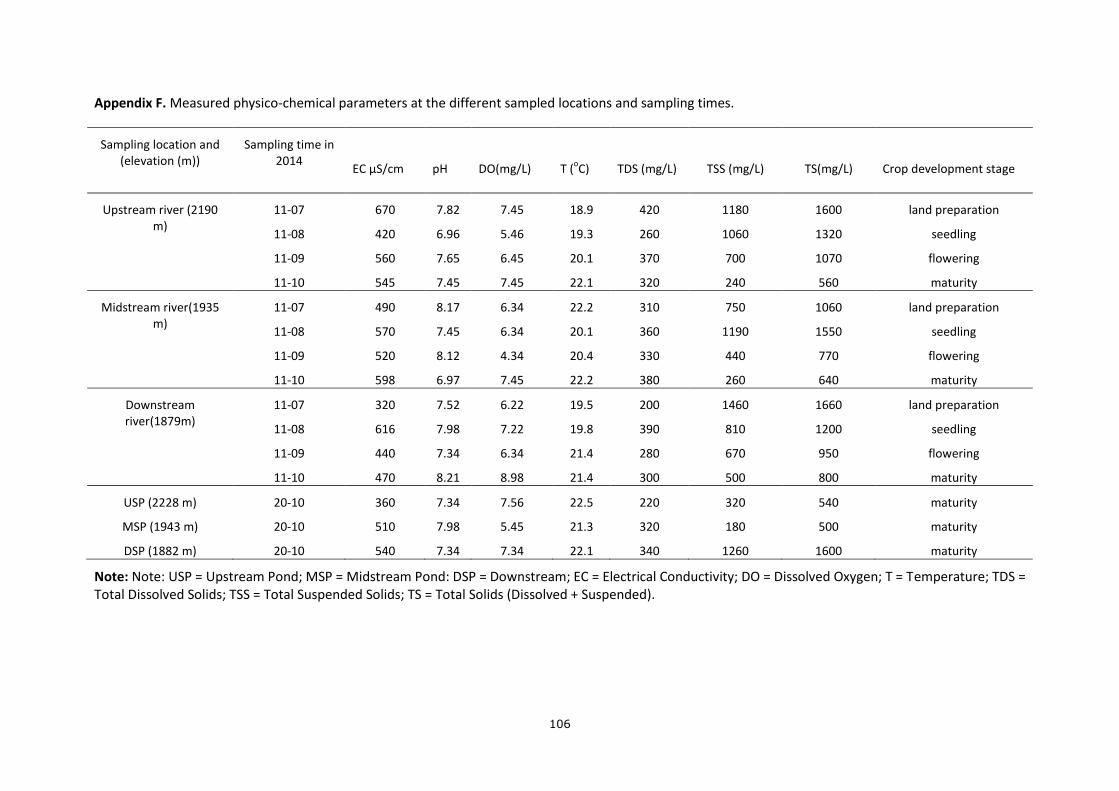
106
Appendix F. Measured physico-chemical parameters at the different sampled locations and sampling times.
Sampling location and (elevation (m))
Sampling time in 2014
EC µS/cm
pH
DO(mg/L)
T (oC)
TDS (mg/L)
TSS (mg/L)
TS(mg/L)
Crop development stage
Upstream river (2190 m)
11-07 670 7.82 7.45 18.9 420 1180 1600 land preparation
11-08 420 6.96 5.46 19.3 260 1060 1320 seedling
11-09 560 7.65 6.45 20.1 370 700 1070 flowering
11-10 545 7.45 7.45 22.1 320 240 560 maturity
Midstream river(1935 m)
11-07 490 8.17 6.34 22.2 310 750 1060 land preparation
11-08 570 7.45 6.34 20.1 360 1190 1550 seedling
11-09 520 8.12 4.34 20.4 330 440 770 flowering
11-10 598 6.97 7.45 22.2 380 260 640 maturity
Downstream river(1879m)
11-07 320 7.52 6.22 19.5 200 1460 1660 land preparation
11-08 616 7.98 7.22 19.8 390 810 1200 seedling
11-09 440 7.34 6.34 21.4 280 670 950 flowering
11-10 470 8.21 8.98 21.4 300 500 800 maturity
USP (2228 m) 20-10 360 7.34 7.56 22.5 220 320 540 maturity
MSP (1943 m) 20-10 510 7.98 5.45 21.3 320 180 500 maturity
DSP (1882 m) 20-10 540 7.34 7.34 22.1 340 1260 1600 maturity
Note: Note: USP = Upstream Pond; MSP = Midstream Pond: DSP = Downstream; EC = Electrical Conductivity; DO = Dissolved Oxygen; T = Temperature; TDS = Total Dissolved Solids; TSS = Total Suspended Solids; TS = Total Solids (Dissolved + Suspended).
107
Chapter 6
General discussion and concluding remarks
108
Agricultural productivity in sub-Saharan African countries has increased through the use of high-tech
production systems and increased amounts of inputs, to meet the ever increasing demand for food
due to disproportionate population growth (Berhanu, 2012; Pretty et al. 2011). The rapid
transformation from subsistence, low-input agriculture to commercial, large-scale, high-input and
high-tech agriculture is essential and has been going on in the past few decades in Ethiopia. This has
turned the country into one of the few in the region with a rapid economic growth, and seeking to
grow even faster to ensure food self-sufficiency and become one of the middle-income countries in
the decade to come (Brixiova and Ncube, 2013; Berhanu, 2012).
Since such ambitious goals can only be achieved by increasing the use of inputs like fertilisers
and agrochemicals, their intensive application is now commonly observed in Ethiopia. However,
pesticide use practices by small-scale farmers in Ethiopia often violate recommendations like the use
of safe storage facilities, complying with health and safety instructions, using protective devices
when applying pesticides, and safe disposal of pesticide containers (Negatu et al., 2016; Mengistie et
al., 2016). Similarly, large-scale production agriculture, including the horticultural and flower farms,
also fails to adhere to international safety standards for the environmental and for workers
(Mengistie et al., 2014).
The problem of irrational use of inputs has been aggravated by the lack of a scientifically and
logistically up-to-date registration and post-registration systems in Ethiopia. According to Mengistie
et al. (2015), the organisation of the pesticide supply chain in Ethiopia is fragmented. The
environment and human health hardly played a role in pesticides handling by the different supply
chain actors, which has been dominated by immediate profit motives.Although Ethiopia has long ago
developed a legal framework for pesticide registration and control, pesticides are still registered,
traded and used inappropriately (Mengistie et al., 2014). Under such circumstances, negative impacts
of uncontrolled pesticide use on the environment and human health are inevitable.
In order to address the above problems, the Pesticide Risk Reduction Programme (PRRP) was
introduced. In addition to the present PhD project, two more PhD projects have been initiated under
this programme. One focusses on environmental policy and governance issues associated with
pesticides in Ethiopia (Mengistie et al., 2014; 2015; 2016) while the other focuses on the overall
health impacts of pesticides in Ethiopia (Negatu et al., 2016). A general description of the PRRP
programme is provided in the Introduction to this thesis, and on (http://www.prrp-ethiopia.org/).
The research reported on in the present thesis aimed to perform risk assessments of
pesticide use for surface waters in Ethiopia, and to develop new tools and approaches to better
protect these surface waters. Ethiopia has been called the water tower of Africa, which implies there

109
is an urgent need for action to change the current state of pesticide registration by increasing its
level of protection for major environmental concerns including the country’s surface water systems
(Chapter 1).
Although ideally, environmental risk assessment should be performed using the best
available methods, data availability, costs and efficiency need to be considered whenever making an
assessment (Posthuma et al., 2008). In order to achieve this goal, tiered approaches can be used in
environmental risk assessment schemes to support the registration of plant protection products
(Campbell et al., 1999; Boesten et al., 2007). The overall idea of the tiered approach is to start with a
conservative, simple approach and to only do additional, more complex work if necessary, that is,
when the first assessment suggests the presence of risks (Brock et al., 2011;VanLeeuwen and
Vermeire, 2007) (Figure 1).
Fig. 1. Tiers in the risk-assessment process (Brock et al. 2011).
Performing higher-tier risk assessments requires more advanced studies to provide more
realistic input, with greater complexity and data requirement, while lower tiers require less effort
and are less costly (Boesten et al., 2007; Solomon et al., 2008). Therefore it is very important to
evaluate the different options available for such an assessment in a developing country like Ethiopia.
In this thesis I evaluated which tools can be used to perform risk assessments to protect surface
waters both as a source of drinking water and as a habitat for non-target organisms, including algae,
Daphnia, and fish. In this synthesis I focus on the way risk assessment was performed in the studies
reported on in the different chapters, following the principles of the tiered approach, to arrive at
2
3
1
4
Simple(few data)
Complex(many data)
Realistic
ConservativeStandard lab tests + assessment factor
Lab tests with additional species / refined exposure test /TK-TD models
Population and community level experiments and models
Field studies and landscape-level models
110
different results when using data from monitoring and laboratory studies. I also discuss its feasibility
in the Ethiopian situation, pointing out constraints and ideas that need future attention (Chapters2,
3, 4 and 5).
Risk assessment for registration of pesticides in the Ethiopian and European contexts
European regulations on pesticides include the use of a first-tier risk assessment which requires a
minimum of data, followed by higher-tier risk assessments. Following this hierarchical procedure
implies an increasing need for data for the assessment and increasing complexity (Brock et al. 2011;
Campbell et al. 1999). The European Plant Protection Products directive describes the procedures
which every pesticide is obliged to pass through in a risk assessment process before they can be
admitted on the European market (European Commission, 2002).
In Ethiopia, pesticide registration has so far been based on the simple first-tier assessment,
by evaluating to which WHO pesticide category the pesticide belongs and performing a simple test to
evaluate the pesticide’s effectiveness. This evaluation does not include the assessment of the
negative impacts that the pesticide may have on non-target organisms, humans or the environment
in general. This is why many pesticides that are banned in Europe are still in use in Ethiopia (Lewis et
al. 2016). It is therefore important to evaluate the currently registered pesticides for their effects on
human health and non-target organisms at risk (Chapter 1).
This evaluation requires revising the registration system currently in use in Ethiopia for
registering pesticides, and developing a new system that is adapted to the Ethiopian situation, a
system that can also be used as a prototype for similar countries elsewhere in Africa. It was for this
purpose that the PRIMET_Ethiopia_registration_1.1 model was developed by the Alterra ERA
(Environmental Risk Assessment) group in the context of the PRRP project (Wipfler et al. 2014). This
tool is suitable for registration purposes and is currently ready to be implemented by the Plant
Health Regulatory Directorate (PHRD) in Ethiopia. The first chapter of this thesis reports on a study
evaluating seven pesticides, selected on the basis of volume of use and toxicity, for their acute risks
to humans and surface water aquatic organisms, using this newly developed model. The protection
goal was defined as surface water as a source of drinking water and as a habitat for surface water
organisms, as was decided at a consultative workshop by PRRP-Ethiopia (Adriaanse et al. 2015).
111
Model-based risk assessment for regulatory purposes in developing countries
The use of model-based risk assessment for developing countries like Ethiopia is a new approach,
which therefore needs careful consideration before it is applied. Difficulties have to be overcome to
arrive at the point which more advanced countries have reached at present. Model-based risk
assessment has its own general limitations and strengths, and is widely applied for assessing the fate
and increasingly also to assess the effects of pesticides for registration purposes in Europe (FOCUS,
2001; Forbes et al., 2009; Galic et al., 2010; Dohmen et al., 2015; De Laender et al., 2014). The
development of the integrated fate, effects, and risk assessment model called
PRIMET_Registration_Ethiopia_1.1 is believed to take the current registration system in Ethiopia a
big step forward. In order to test and evaluate the model, the risks to surface water systems posed
by seven selected pesticides used in Ethiopia were assessed, and the results are described in Chapter
2.
The main constraints on the introduction of such models in Ethiopia include bringing the
model to the attention of all stakeholders, including the government, who are believed to be
affected by the adoption of this tool, and convincing them that the risk assessments represent
realistic worst-case outcomes. Since the model needs a minimum of input data, it is believed that all
the data needed to run the model can be gathered easily by the registrants. Therefore, the
implementation of this modelling framework will give a better estimate of the risk posed by the
pesticides currently in use and those to be registered in the future, than using the old registration
system, which only included a hazard assessment. The new tool is expected to support decision-
making on registration of new pesticides and banning risky ones that are already on the shelf.
Comparing monitoring results with predicted environmental concentrations, and the applicability
of single-species toxicity tests
Despite the above constraints, this PhD project tried to investigate the use of model-based prediction
for risk quantification, using Ethiopian surface water systems as a target protection goal. Model
prediction values obtained in this study were compared with concentrations measured in a
monitoring scheme implemented in a river, temporary ponds and effluent entry points of a lake in
Ethiopia.
Some of the predicted environmental concentration (PEC) values for Ethiopian surface water
resulting from the PRIMET_Registration_Ethiopia_1.1 model (Chapter 2) can be compared with
concentration measurements from monitoring studies (Chapters 4 and 5). Taking the case of
endosulfan as an example, we found higher 90th/99th percentile PEC values for endosulfan calculated
112
by the model (Chapter 2) than were measured in Lake Ziway and the Wedecha and Belbela irrigation
system (Chapters 4 and 5) (Table 1). This difference was expected, as
PRIMET_Registration_Ethiopia_1.1 presents the worst-case concentrations (90th/99th percentile),
while our measurements represent average concentrations. Furthermore, the model-based PEC is
expected to occur next to an agricultural field to which a pesticide has recently been applied, located
next to a watercourse and where the watercourse can be reached by spray drift or a run-off event.
By contrast, the samples used for pesticide identification were taken at a chosen time and place in a
region where pesticides are applied. Hence, the model can be considered valid to be used for
registration purposes, but further model validation studies need to be conducted in parallel.
On the other hand, lower PEC values for endosulfan have been reported in similar studies in
South Africa (Ansara-Ross et al. 2008) (Table 1). The discrepancy might result from a difference in the
scenario parameters considered in South Africa and Ethiopia. The actual endosulfan concentrations
measured in our studies were lower than literature values reported from Nigeria, but slightly higher
than those reported from Brazil. Such differences are expected, as the actual usage pattern of
endosulfan in these different locations varies, and as differences may be expected in the efficiency of
the analytical verifications used in these different studies (Adeyemi et al.2015; Nwakwoala et al.,
1991; Raposo Junior et al., 2007) (Table 1).
The toxicity studies we performed with endosulfan and diazinon, using three Ethiopian
arthropod species and Daphnia magna, showed that the results of the D. magna tests were very
comparable to literature values. This implies that performing tests in duplicate to check the
consistency of the results and at the same time testing D. magna as a benchmark, that is, checking
the accuracy of the method in the local circumstances, might be a suitable protocol for performing
toxicity studies in developing countries where resources to analytically verify the test concentrations
are limited (Chapter 3). A similar study conducted on Amazonian freshwater organisms came to a
similar conclusion, namely that the use of water quality criteria derived from laboratory toxicity data
for temperate species will result in a sufficient protection level for Amazonian freshwater organisms
(Rico et al., 2011). The results reported in the present thesis and results of studies in some other
parts of the tropical world support the use of temperate species data for risk assessments in
developing countries, until more data has been compiled. Nevertheless, there are opportunities for
the establishment of tropical standard test species in the future if more emphasis is put on further
toxicity studies with more local macroinvertebrate species.

113
Table 1: PECs calculated and residues determined for endosulfan as reported in this thesis and in
studies elsewhere in Africa and Brazil. Note: maximum PECs and residue levels are given.
PEC this thesis
(µg/L)
PEC literature
(µg/L)
Residue this thesis
(µg/L)
Residue literature
(µg/L)
1.3 (Chapter 4)
4.93 (Chapter 2)
0.0026 (Ansara-Ross et al. 2008) South Africa
0.03 (Chapter 5)
0.10 (Chapter 3)
0.355 (Adeyemi et al. 2015) Nigeria
0.43 (Nwakwoala and Osibanjo et al., 1992)
Nigeria
0.003 (Raposo and Nilva, 2007) Brazil
Overview of ETR/ESTI/IEDI results
This thesis starts with a model-based risk assessment for seven selected pesticides. The selection was
based on volume of use and acute toxicity to humans, with exposure toxicity ratio / estimated short-
term intake (ETR/ESTI) outputs based on PRZM/TOXWA predictions (Chapter 2). The next risk
assessment produced ETR values based on concentrations measured in a monitoring study in Lake
Ziway (Chapter 4).Risks were further calculated in a higher-tier assessment using hazardous
concentration 5% (HC5) values derived from species sensitivity distribution (SSD) analyses. The
assessment included monitoring results obtained previously by Jansen and Harmsen (2011). Chronic
risks to humans using internationally estimated daily intake (IEDI) values were also introduced
(Chapters 4 and 5). Results of analysing organo-chlorine pesticide (OCP) residues at sampling sites in
rivers and temporary ponds were evaluated in terms of their risks to the environment and human
health, using the framework proposed by Teklu et al. (2015). Current usage data obtained from
interviews with small-scale farmers in the Debra Zeit area were also evaluated in terms of risks, using
the PRIMET_Registration_Ethiopia_1.1 model. Chronic risks to aquatic organisms and SSDs using
NOEC values were also introduced in this chapter. Both acute and chronic risks were also determined
for the identified OCPs. Only in a few cases were aquatic organisms found to be at high to moderate
risk from some pesticides, while the overall risk assessment for humans using surface water as a
source of drinking water predicted low to negligible acute risks (Chapter 5). On the other hand, the
pesticides spiroxamine and g-chlordane were found to present high chronic risk to humans (Chapters
4 and 5, respectively). In all cases, lower-tier risk assessments were characterised by greater
conservatism, and required less effort and data (Chapter 2), while higher-tier assessments were
characterised by greater realism but also by greater effort and data requirements (Chapters 4 and 5).
All results were in line with the principles of the tiered approach mentioned above. These findings
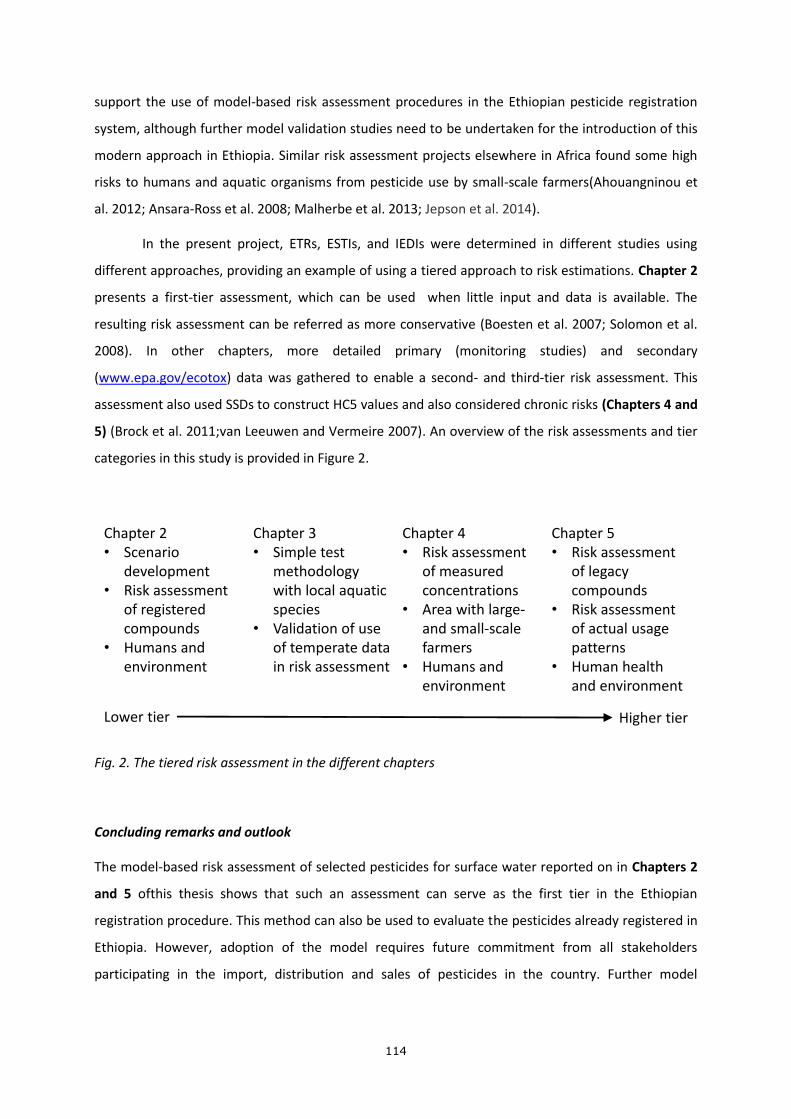
114
support the use of model-based risk assessment procedures in the Ethiopian pesticide registration
system, although further model validation studies need to be undertaken for the introduction of this
modern approach in Ethiopia. Similar risk assessment projects elsewhere in Africa found some high
risks to humans and aquatic organisms from pesticide use by small-scale farmers(Ahouangninou et
al. 2012; Ansara-Ross et al. 2008; Malherbe et al. 2013; Jepson et al. 2014).
In the present project, ETRs, ESTIs, and IEDIs were determined in different studies using
different approaches, providing an example of using a tiered approach to risk estimations. Chapter 2
presents a first-tier assessment, which can be used when little input and data is available. The
resulting risk assessment can be referred as more conservative (Boesten et al. 2007; Solomon et al.
2008). In other chapters, more detailed primary (monitoring studies) and secondary
(www.epa.gov/ecotox) data was gathered to enable a second- and third-tier risk assessment. This
assessment also used SSDs to construct HC5 values and also considered chronic risks (Chapters 4 and
5) (Brock et al. 2011;van Leeuwen and Vermeire 2007). An overview of the risk assessments and tier
categories in this study is provided in Figure 2.
Fig. 2. The tiered risk assessment in the different chapters
Concluding remarks and outlook
The model-based risk assessment of selected pesticides for surface water reported on in Chapters 2
and 5 ofthis thesis shows that such an assessment can serve as the first tier in the Ethiopian
registration procedure. This method can also be used to evaluate the pesticides already registered in
Ethiopia. However, adoption of the model requires future commitment from all stakeholders
participating in the import, distribution and sales of pesticides in the country. Further model
Chapter 2• Scenario
development• Risk assessment
of registered compounds
• Humans and environment
Lower tier Higher tier
Chapter 3• Simple test
methodology with local aquatic species
• Validation of use of temperate data in risk assessment
Chapter 4• Risk assessment
of measured concentrations
• Area with large-and small-scale farmers
• Humans and environment
Chapter 5• Risk assessment
of legacy compounds
• Risk assessment of actual usage patterns
• Human health and environment

115
validation studies need to be conducted to further strengthen the reliability of using this model for
the Ethiopian context.
The results of the monitoring studies reported on in Chapters 4 and 5 of this thesis indicate
that some pesticides pose a risk to surface water aquatic organisms; this was found for e.g.
spiroxamine, lambda-cyhalothrin, profenofos, endosulfan and diazinone in the Debra Zeit and Lake
Ziway areas. Follow-up studies need to concentrate on these pesticides to decide on their
registration status. This calls for a better monitoring of the pesticide use and liquid waste
management at commercial and small-scale farms in close proximity to lakes like Ziway and rivers
like Wedecha and Belbela. More effort should also be invested in developing a scenario for large-
scale agriculture in greenhouses, since the present tool, which was developed to conduct risk
assessments for surface waters, cannot address greenhouse farming. The assessment results show
that, overall, acute human health risks posed by using surface water as a source of drinking water
can be described as low or negligible.
The single-species toxicity tests we performed with three Ethiopian macroinvertebrate
species showed that data relating to temperate species can be used to perform risk assessment for
registration purposes until better local data is obtained (Chapter 3). There is, however, a need for a
refined technical protocol for standardised toxicity tests with minimum requirements in terms of
funding and laboratory facilities in developing countries like Ethiopia.
The overall conclusion of this thesis implies that there is a need to adopt a more structured
and scientific method of risk assessment before registration. The political decision to adopt the tool
developed by PRRP Ethiopia needs careful consideration. Already registered pesticides should be
screened using PRIMET_Registration_Ethiopia_1.1 model, followed by screening pesticides to be
registered in the country in the future. Further experimental and monitoring studies, model
validation studies and nationwide monitoring also need to be considered. If such measures are
implemented successfully, other African countries can use the experience gained by PRRP Ethiopia as
a baseline for future activities related to the safe handling of pesticides, by quantifying risks to non-
target aquatic organisms and humans before considering these products for registration. Future
monitoring should take place at a national level, and a standardised laboratory for pesticide residue
analysis should be established in the country so that analytical verification and all kinds of toxicity
studies can easily be done for all matrices, and results can be used for regulatory purposes (Fig. 3).

116
Fig. 3. Future measures for better implementation of pesticide registration system in Ethiopia.
Political decision for adopting registration tool
developed by PRRP project
Involve concerned stakeholders like
GOs, NGOs, industry
Evaluate the currently registered
pesticides using PRIMET
Adoption of PRIMET for newly registered
pesticides
Ban risky pesticides
Fate and model validation studies
National monitoring activities and
establishment of standard laboratories

117
Summary
118
The current increase in application rate and usage frequency of application of pesticides in Ethiopia
pose direct risks to surface water aquatic organisms and humans using surface water as a source of
drinking water in rural parts of the country. Therefore it is important to quantify the risks and show
the current status of the surface water systems in Ethiopia as regards exposure from pesticide
applications. An important tool for the regulation of pesticide-related issues is that of model-based
risk assessment, which is currently being used in Europe and elsewhere in the world. Checking the
suitability of input data like EC50 values is also important, as this data is currently only available from
tests done on temperate species. Subsequent monitoring activities to check the actual residue levels
of pesticides in rivers and temporary ponds adjacent to extensive farming activities also provide
some idea of the current status of the surface water systems. Combining all this knowledge is
believed to bring the current pesticide registration system in Ethiopia one step closer to a more
reliable approach, protecting non-target organisms as well as the health of humans at risk.
Chapter 1 of this thesis introduces the current status of pesticide use in Ethiopia compared
with global trends and statistics. It describes the urgent need to protect the Ethiopian surface water
systems, as the country is endowed with a great many of them and pesticide use is increasing rapidly.
This requires an improved registration system for pesticides, which includes tools specifically
applicable in the local situation.The present PhD project therefore aimed to assess the
environmental risks posed by the extensive use of pesticides in the surface water systems in
Ethiopia.The research objectives of the studies reported on in this thesis were to investigate the
applicability of model-based risk assessment to predict environmental concentrations in the
Ethiopian surface water systems using the PRIMET_Registration_Ethiopia1.1 model, as well as to
perform simple chemical monitoring programmes to show the status of residues in Ethiopian surface
waters and undertake single-species toxicity tests to compare sensitivities with those of European
species.
Chapter 2 addresses the applicability of the model-based risk assessment used currently in
the European system, after adjustment to the Ethiopian situation. Seven pesticides, selected on the
basis of their toxicity and volume of import, were evaluated. Results of this study indicated that
some crop–pesticide combinations posed a risk to aquatic organisms (fish, Daphnia), even when
good agricultural practices were implemented in pesticide application. No acute health risks were
found for humans using surface water as a source of drinking water for any of the pesticides
evaluated.
Toxicity values for risk assessment based on results of tests done only on temperate species
need to be verified, by evaluating whether the sensitivity of tropical species is different from
temperate ones. We did an experiment to verify this, which is reported on in Chapter 3. The test
119
strategy was such that the results obtained for Daphnia magna could be compared with literature
values to evaluate the accuracy of the strategy. All local species were evaluated in duplicate tests to
assess the consistency of the results. We believe that these checks on accuracy and consistency make
it possible to (partially) circumvent the need for analytical verification of the test concentrations. The
results of this study indicated no systematic differences in sensitivity between the temperate and
Ethiopian species as regards the effects of the pesticides endosulfan and diazinon on three
arthropods. Future research is needed to confirm these results by developing a suitable protocol for
such studies in developing countries with local tropical species.
A monitoring project in Lake Ziway (Chapter 4) was performed by screening water samples
for more than 300 pesticides. The findings indicated that some of the pesticides posed risks to
aquatic organisms, while only one pesticide (spiroxamine) posed a high chronic risk to humans using
surface water as a source of drinking water. Long-term monitoring taking account of spatial and
temporal variations by determining pesticide residue levels at major entry points to big
impoundments like Lake Ziway provides an overview of their current pollution status. The findings of
Chapter 4 indicated that it is not only the commercial farms but also the small-scale farms in the
Meki Ziway area which need careful monitoring, as several pesticide residues exceeded the European
drinking water standard of 0.1 µg/L in these areas. Careful liquid waste management to protect entry
points to Lake Ziway is also important for both small- and large-scale farming activities in the area.
In developing countries like Ethiopia, organochlorine pesticides (OCPs) like endosulfan are
still on the list of registered pesticides, even though they have long since been banned from the
European system. Chapter 5 presents the results of a monitoring project in the Wedecha and Belbela
irrigation system. The study was mainly done to check the residue levels of OCPs in the river and
temporary ponds in the area, and also tried to assess the risks posed by the current use of pesticides
by small-scale farmers, by taking the actual application rate and frequency and assuming that the
worst-case scenario for surface waters of PRIMET_Registration_Ethiopia_1.1 model is applicable in
the area. Results of this study revealed that some OCPs were detected at some sampling sites in
rivers and temporary ponds, even though no residues were detected in most of the samples and any
residues detected were found in low concentrations. The risk assessment for the current usage data
using the PRIMET_Registration_Ethiopia_1.1 model indicated that some pesticides pose high risks to
aquatic organisms. The model predicted no acute risk to humans using surface water as a source of
drinking water, although a high chronic risk was predicted from the OCP g-chlordane that was
detected.
The major findings of this thesis are discussed in Chapter 6, like the results for endosulfan as
a model output are compared with the residue levels found in the monitoring activities undertaken

120
as part of the PhD project. I also discussed the differences and similarities in the ETR/ESTI values
reported throughout the project and the status of model-based risk assessment in the Ethiopian and
European contexts, as well as the need for further action to put the results presented in this thesis in
particular, and of the PRRP in general, into practice.

121
Bibliography

122
Abayneh A, Taddese W, and Chandravanshi BS (2003). Trace metals in selected fish species from
lakes Awassa and Ziway, Ethiopia. Ethiop. j. sci., 26(2):103–114, 2003.
Adeyemi D, Anyakora C, Ukpo G, Adedayo A and Darko G (2011). Evaluation of the levels of
organochlorine pesticide residues in water samples of Lagos Lagoon using solid phase
extraction method. Journal of Environmental Chemistry and Ecotoxicology Vol. 3(6), pp. 160-
166.
Adriaanse PI, Boesten JJTI, Crum SJH. Estimating degradation rates in outdoor stagnant water based
on inverse modeling with TOXSWA: a case study with prosulfocarb. Pest Manag. Sci.
2013;69:755–67.
Adriaanse PI, Ter Horst MMS, Teklu BM, Deneer JW, Woldeamanuel A and Boesten JJTI (2015).
Development of scenarios for drinking water produced from groundwater and surface water
for use in the pesticide registration procedure of Ethiopia. Alterra report 2674. Wageningen,
The Netherlands, pp 309.
Adriaanse PI. Exposure assessment of pesticides in field ditches: the TOXSWA model. Pestic. Sci.
1997;49:210–2.
Adriaanse PI. Fate of pesticides in field ditches: the TOXSWA model. Report, 90Wageningen, The
Netherlands: DLO Winand Staring Centre; 1996.
Adriaanse, et al. Development of scenarios for drinking water from groundwater and from surface
water for use in the registration procedure of Ethiopia.Report. Wageningen, The Netherlands:
Alterra; 2014.
Ahouangninou C, Martin T, Edorh P, Bio-Bangana S, Samuel O, St-Laurent L, Dion S and Fayomi B
(2012). Characterization of Health and Environmental Risks of Pesticide Use in Market-
Gardening in the Rural City of Tori-Bossito in Benin, West Africa.Journal of Environmental
Protection.3 : 241-248.
Aktar, Wasim , Sengupta Dwaipayan , Chowdhury Ashim (2009). Impact of pesticide use in
agriculture: their benefits and hazards. Interdisc Toxicol. 2009; (1): 1–12.
Amera T and Abate A (2008). An assessment of pesticide use, practices and hazards in the Ethiopian
Rift Valley in 2007, Institute for Sustainable Development (ISD) and Pesticide Action Network
(PAN-UK), Addis Ababa.
Andreotti G, Freeman L, Hou L, Coble J, Rusiecki J, Hoppin J, Silverman D and Alavanja M.(2009).
Agricultural Pesticide Use and Pancreatic Cancer Risk in the Agricultural Health Study
Cohort.Int J Cancer. 124(10): 2495–2500.
Andreu V and Pico’ Y. (2004). Determination of pesticides and their degradation products in soil:
critical review and comparison of methods. Trends Anal Chemistry 23: 772–789.
Ansara-Ross TM, Wepener V, Van den Brink PJ and Ross MJ (2008).Probabilistic risk assessment of
the environmental impacts of pesticides in the Crocodile (west) Marico catchment, North-West
Province. Water SA 34: 637 – 644.
Assefa G (2010). Pesticide use in Ethiopia, Ministry of Agriculture.www.prrp-ethiopia.org/index.../6-
2012-april-workshop?...pesticide-use
Awulachew SBY, Yilma AD, Loulseged M, Loiskandl W, Ayana M, Alamirew T. Water resources and
irrigation development in Ethiopia. Working Paper, 123. Colombo, Sri Lanka: IWMI; 2007.
Bach M, Hollis J. Comment on “Regulatory FOCUS Surface Water Models Fail to Predict In-secticide
123
Concentrations in the Field”. Environ. Sci. Technol. 2013;47:1177–8.
Baird DJ, Barber I, Bradley M, Calow P, Soares AMVM (1989) The Daphnia bioassay: a critique.
Hydrobiologia 188/189: 403-406.
Baveye P, Mysiak J and Laba M (2007).Uncertainties in environmental modelling and consequences
for policy making. Proceedings of the NATO advanced study institute. Springer. Dordrecht, The
Netherlands.
Beltman WHJ, Ter Horst MMS, Adriaanse PI, De Jong A. Manual of FOCUS_TOXSWA ver-sion
2.2.1.Alterra-rapport, 586. Wageningen, The Netherlands: Alterra; 2006.
Berhanu K (2012). The Political Economy of Agricultural Extension in Ethiopia: Economic Growth and
Political Control. Future Agriculture (FA) Political Economy of Agricultural Policy in Africa
(PEAPA).Working paper 042.
Blenkinsop S, Fowler HJ, Dubus IG, Nolan BT, Hollis JM. Developing climatic scenarios for pesticide
fate modelling in Europe. Environ. Pollut. 2007;154:219–31.
Boesten JJTI (1986) Behaviour of herbicides in soil: simulation and experimental assessment.
Doctoral thesis. Wageningen University, Wageningen, The Netherlands
Bouman H (2004). South Africa and the Stockholm on Persistent organic pollutants. Afr. J. Sci., 100:
323-328.
Boxall A, Brown C, Barrett K (2001). Higher Tier Laboratory Aquatic Toxicity Testing.Cranfield
University, Silsoe, Beds MK45 4DT, UK.
Brixiova Z and Ncube M (2013).Entrepreneurship and the Business Environment in Africa: An
Application to Ethiopia. Institute for the Study of Labour. ISL Report No. 7553.
Brock TCM, Art GHP, ten Hulscher TEM, de Jong FMW, Luttik R, Roex EWM, Smit CE and van Vliet
PJM (2011). Aquatic effect assessment for plant protection products.Alterra, part of
Wageningen UR. Alterra Report 2235.
Brock TCM, Arts GHP, Maltby L, Van den Brink PJ.Aquatic risks of pesticides, ecological protection
goals and common aims in EU legislation.Integr. Environ. Assess. Manag. 2006;2:e20–46.
Brock TCM, Van Wijngaarden RPA. Acute toxicity tests with Daphnia magna, Americamysis bahia,
Chironomus riparius and Gammarus pulex and implications of new EU require-ments for the
aquatic effect assessment of insecticides. Environ. Sci. Pollut. Res. 2012; 19:3610–8.
Campbell PJ, Arnold DJS, Brock TCM, Grandy NJ, Heger W, Heimbach F, Masund SJ, Streloke M. (eds.)
1999. Guidance document on Higher Tier Aquatic Risk Assessment of Pesticides (HARAP).
SETAC-Europe, Brussles, Belgium.
Carbone JP, Havens PL, Warren-Hicks W. Validation of pesticide root zone model 3.12: employing
uncertainty analysis. Environ. Toxicol. Chem. 2002;21:1578–90.
Carsel RF, Imho JC, Hummel PR, Cheplick JM, Donigan AS. PRZM-3, a Model for Predicting Pesticide
and Nitrogen Fate in the Crop Root and Unsaturated Soil Zones: User's Manual for Release 3.0.
Athens (GA): National Exposure Laboratory, Office of research and Development, U.S.
Environmental Protection Agency, Athens, Georgia; 1998.
Carson R. (1962).Silent spring.Houghton Mifflin ; Cambridge, Mass. : Riverside Press. Boston. USA
Chauhan A, Goyal MK, Chauhan P (2014) GC-MS Technique and its analytical applications in science
and technology. J Anal Bioanal Tech 5:222.
Clesceri, L. S., Arnold, E. G., & Andrew, D. E. (Eds.). (1999). Standard method for the examination of
water and waste water (20 ed.). American Public Health Association andAmerican Water
Works Association.
124
CSA (2012). Statistical report on area and production of crops and farm management practices,
Central Statistical Agency, statistical bulletin 532, Addis Ababa.
Daam MA, Van den Brink PJ. Implications of differences between temperate and tropical freshwater
ecosystems for the ecological risk assessment of pesticides. Ecotoxicology 2010;19:24–37.
De Koning S, Janssen HG and Brinkman UAT (2009). Modern Methods of Sample Preparation for GC
Analysis.Chromatographia Supplement 69: 2009.
De Laender F, van den Brink PJ, Colin RJ and Antonio DG (2014). The ChimERA project: coupling
mechanistic exposure and effect models into an integrated platform for ecological risk
assessment. Environ Sci Pollut Res. DOI 10.1007/s11356-014-2605-5.
Dee DP, Uppala SM, Simmons AJ, Berrisford P, Poli P, Kobayashi S, Andrae U, Balmaseda MA, Balsamo
G, Bauer P, Bechtold P, Beljaars ACM, van de Berg L, Bidlot J, Bormann N, Delsol C, Dragani R,
Fuentes M, Geer AJ, Haimberger LS, Healy B, Hersbach H, Hólm EV, Isaksen L, Kållberg P, Köhler
M, Matricardi M, McNally AP, Monge-Sanz BM, Morcrette JJ, Park BK, Peubey C, de Rosnay P,
Tavolato C, Thépaut JN, Vitart F. The ERA-interim reanalysis: configuration and performance of
data assimilation sys-tem. Q. J. R. Meteorol. Soc. 2011;137:553–97.
Deneer JW, Adriaanse PI, de Boer P, Busschers M, Lahr J, Van der Schoor C, Van Vliet P and
Woldeamanual A. (2014). A Scientific evaluation system for the registration of pesticides in
Ethiopia. Wageningn, The Netherlands. Altera report 2547.
Deneer JW, Beltman WHJ, Adriaanse PI (2010) Transformation reactions in TOXSWA: transformation
reactions of plant protection products in surface water. Alterra report 2074. Alterra,
Wageningen, The Netherlands.
Dohmen GP, Preuss TG, Hamer M, Galic N, Strauss T, van den Brink PJ, De Laender F,and Bopp S
(2015) Population-Level Effects and Recovery of Aquatic Invertebrates after Multiple
Applications of an Insecticide. Integrated Environmental Assessment and Management. 9999:
1–15.
Dolan T, Howsam P, Parsons DJ, and Whelan MJ (2013).Is the EU Drinking Water Directive Standard
for Pesticides in Drinking Water Consistent with the Precautionary Principle?. Environ. Sci.
Technol.,10: 4999–5006.
Dsikowitzky L, Mengesha M, Dadebo E, Carlos Eduardo deCarvalho EV and Sindern S (2012)
Assessment of heavy metals in water samples and tissuesof edible fish species from Awassa
and Koka Rift ValleyLakes, Ethiopia.Environ Monit Assess, 185. 3177-3131.
EFSA, European Food Safety Authority. Guidance on tiered risk assessment for plant pro-tection
products for aquatic organisms in edge-of-field surface waters. EFSA J. 2013; 11:3290.
Elvira VB,Philipp M,Lars G,Katrin Vand Ole RN (2011). Occurrence of organochlorine pesticides in
indoor dust.J. Environ. Monit.,13: 522.
EPA (2004).Environmental Impact Assessment Guideline on Pesticides, the Federal Environmental
Protection Authority, Addis
Ababa.http://www.epa.gov.et/Download/Guidelines/Pesticides.pdf
Ethiopian Investment Agency.Ethiopia Investment Guide. Addis Ababa, Ethiopia: Ethiopian
Investment Agency; 2012 (URL: http://www.ethiopianembassy.org/PDF/
Ethiopia_Investment_Guide_2012.pdf).
European Commission (2002).Guidance document on aquatic toxicology in the context of directive
91/414/EEC.Working document of the European Commission Health and Consumer Protection
Directorate-General. Brussels, Belgium.
European Commission. Regulation (EC) No 546/2011 of June 2011 of the European parliament and
125
the Council as regards uniform principles for authorisation of plant protection products. Off. J.
Eur. Union 2011;L 155:127–75.
Fan S (2008) Endosulfan risk characterization document. Volume III: environmental fate.
Environmental Monitoring Branch.Department of Pesticide Regulation.California
Environmental Protection Agency. Sacramento, CA, USA.
FAO (Food and Agricultural Organization).Pesticide use and application practices in Ethiopia along
with a case study in hotspot areas of coffee and vegetables. Report as part of
FAO/TCP/ETH/3301/D; AGAP, A Programme on Enforcement of Post-registration Capacities for
Better Pesticide Management in Ethiopia. Addis Ababa, Ethiopia: FAO and Ministry of
Agriculture; 2011.
Fiedler H, Abad E, van Bavel B, de Boer J, Bogdal C and Malisch R (2013). The need for capacity
building and first results for the Stockholm Convention Global Monitoring Plan.Trends in
Analytical Chemistry. 46: 1-206.
FOCUS (2001). FOCUS surface water scenarios in the EU evaluation process under 91/414/EEC.
Report of the FOCUS Surface Water Scenarios Workgroup, EC. Document Reference
SANCO/4802/2001-rev2., European Commission, Brussels Belgium
FOCUS (Forum for Co-Ordination of Pesticide Fate Models and Their Use). FOCUS Surface Water
Scenarios in the EU Evaluation Process Under 91/414/EEC; 2001 (Brussels, Belgium. Document
Reference SANCO/4802/2001-rev2).
Forbes VE, Hommen U, Thorbek P, Heimbach F, van den Brink PJ, WogramJ, Thulke HH, Grimm V.
2009. Ecological models in support of regulatory risk assessments of pesticides: Developing a
strategy for the future. Integr EnvironAssess Manag 5:167–172.
Forrest J (2000) Collecting Water Quality Samples for Dissolved Metals in Water. USEPA, Region 6.
Water Quality Handbook, 2nd edition. EPA, USA.
Galic N, Hommen U, Baveco JM, van den Brink PJ. 2010. Potential application of population models in
the European ecological risk assessment of chemicals II: Review of models and their potential
to address environmental protection aims. Integr Environ Assess Manag 6:338–360.
Garabrant DH, Held J, Langholz B, Peter JM and Mark TM (1992). DDT and related compounds and
risk of pancreatic cancer, J. Natl. Cancer Inst., 84: 764-771.
Gashaw H (1999) Hydrogeochemistry of waters in Lake Ziway area.25th WEDC conference. Adddis
Ababa, Ethiopia.
Getu M (2009) Ethiopian floriculture and its impact on the environment: Regulation, Supervision and
Compliance. http://www.ajol.info/index.php/mlr/article/viewFile/54011/42554
Hellar KH (2011).Pesticide residues in four rivers running through an intensive agricultural area,
Kilimanjaro, Tanzania. J. Appl. Sci. Environ. Manage. 15 : 307 – 316.
Hopkins G (1952) Mosquitoes of the Ethiopian region: larval bionomics of mosquitoes and taxonomy
of Culicine Larvae. Adlard and Son Ltd. London, UK.
Hose GC, Van den Brink PJ (2004) Confirming the species-sensitivity distribution concept for
endosulfan using laboratory, mesocosm, and field data. Arch Environ Contam Toxicol 47: 511–
520.
Hughes RH, Hughes JS (1992) A directory of African wetlands. Gland, Switzerland, Nairobi, Kenya and
Cambridge, UK: IUCN,UNEP and WCMC. Cambridge, UK
Jansen HC, Harmsen J (2011) Pesticide monitoring in the Central Rift Valley 2009-2010. Report
2083.Alterra. Wageningen, The Netherlands http://library.wur.nl/WebQuery/clc/1966024
126
Jansen HC, Hengsdijk H, Legesse D, Ayenew T, Hellegers P and Spliethoff P (2007) Land and water
resources assessment in the Ethiopian Central Rift Valley. Report
1585.Alterra.Wageningen.The Netherlands.http://library.wur.nl/WebQuery/wurpubs/364475
Jepson PC, Guzy M, Blaustein K, Sow M, Sarr M, Mineau P and Kegley S (2014). Measuring pesticide
ecological and health risks in West African agriculture to establish an enabling environment for
sustainable intensification.DOI: 10.1098/rstb.2013.0491
Jones KC and de Voogt P (1999). Persistent organic pollutants (POPs): state of the science. Environ.
Pollut. 100: 209-221.
Jones RL, Mangels G. Review of the validation of models used in the federal insecticide, fungicide and
rodenticide act environmental exposure assessments. Environ. Toxicol. Chem. 2002;21:1535–
44.
Karunamoorthi K, Bishaw D, Mulat T (2009) Toxic effects of traditional Ethiopian fish poisoning plant
Milletia ferruginea (Hochst) seed extract on aquatic macroinvertebrates. Eur Rev Med
Pharmacol Sci 13: 179-185.
Kashyap SM, Pandya GH, Wachasunder SD and Kondawar VK (2005).QC/AC aspects of GC-MS
analytical instrument for environmental analysis.Indian Journal of Chemical Technology. 12:
477-487.
Knäbel A, Stehle S, Schäfer RB, Schulz R. Regulatory FOCUS surface water models fail to predict
insecticide concentrations in the field. Environ. Sci. Technol. 2012;46: 8397–404.
Kole RK and Bagchi MM (1995).Pesticide residues in aquatic environment and their possible
ecological hazards. J. Inland Fish. Soc. India, 27: 79-89.
Kolpin DW, Thurman EW and Lingart SM (1998). The environmental occurrence of herbicides: The
importance of degradates in ground water. Bull. Environ. Contam.Toxicol., 35: 385-90.
Konstantinou J.K., Hela D.G. and Albanis T.A. (2006).The status of pesticide pollution in surface
waters (rivers and lakes) of Greece. Part I. Review on occurrence and levelsg. Environmental
Pollution. 141: 555-570.
Kwok KWH, Leung KMY, Chu VKH, Lam PKS, Morritt D, Maltby L, Brock TCM, Van den Brink PJ, Warne
MStJ, Crane M (2007) Comparison of tropical and temperate freshwater species sensitivities to
chemicals: implications for deriving safe extrapolation factors. Integr Environ Assess Manag 3:
49-67.
Larissa D, Mesfin M, Elias D, Carlos EVC and Sven S (2012).Assessment of heavy metals in water
samples and tissues of edible fish species from Awassa and Koka Rift Valley Lakes,
Ethiopia.Environ Monit Assess. DOI 10.1007/s10661-012-2777-8.
Lewis KA, Tzilivakis J, Warner D and Green A (2016). An international database for pesticide risk
assessments and management. Human and Ecological Risk Assessment: An International
Journal.
Macharia I (2015).Pesticides and Health in Vegetable Production in Kenya.BioMed Research
International. Article ID 241516. http://dx.doi.org/10.1155/2015/241516.
Malherbe W, van Vuren JHJ and Wepener V(2013). Preliminary risk assessment of common-use
pesticides using PRIMET and PERPEST pesticide risk models in a semi-arid subtropical region.
Water SA .39: 5.
Maltby L, Blake N, Brock TCM, and Van den brink PJ (2005) Insecticide species sensitivity
distributions: importance of test species selection and relevance to aquatic ecosystems.
Environmental Toxicology and Chemistry, 24 : 379–388.

127
Maltby L, Brock TCM, and Van den brink PJ (2009) Fungicide risk assessment for aquatic ecosystems:
importance of interspecific variation, toxic mode of action, and exposure regime. Environ. Sci.
Technol. 43:7556–7563.
Masresha EA, Skipperud L, Rosseland BO, Zinabu GM, Meland S, Teien H, Salbu B (2011) Speciation of
selected trace elements in three Ethiopian Rift Valley Lakes (Koka, Ziway, and Awassa) and
their major inflows. Science of the Total Environment 409: 3955–3970.
Matthews GA (2006). Pesticides: Health, Safety and the Environment, Blackwell Publishing, Oxford.
Oesterlund AH, Thomsen JF, Sekimpi DK, Maziina J, Racheal A and Jørs E (2014). Pesticide knowledge,
practice and attitude and how it affects the health of small-scale farmers in Uganda: a cross-
sectional study, African Health Sciences, 14: 420-433.
Mengistie BT, Mol APJ and Oosterveer P (2016). Pesticide use practices in the central rift valley of
Ethiopia. Environ Dev Sustain. DOI 10.1007/s10668-015-9728-9.
Mengistie BT, Mol APJ and Oosterveer P (2015).Private environmental governance in the Ethiopian
pesticide supply chain: importation, distribution and use. NJAS: Wageningen Journal of Life
Sciences. 76: 65-73.
Mengistie BT, Mol APJ Oosterveer P and Simane B (2014).Information, motivation and resources: the
missing elements in agricultural pesticide policy implementation in Ethiopia. International
Journal of Agricultural Sustainability 13: 240-256.
Michael MG and Seleshi BA (2007).Irrigation Practices in Ethiopia:Characteristics of Selected
Irrigation Schemes. International Water Management Institute. Working Paper 124
Mnif W, Hassine AI, Bouaziz A, Bartegi A, Thomas O and Roig B (2011). Effect of Endocrine Disruptor
Pesticides: A Review. Int. J. Environ. Res. Public Health. 8: 2265-2303
MOARD. Crop Development Department Crop Variety Register Issue No: 9–14. Addis Ababa.
Ethiopia: Ministry of Agriculture and Rural Development of Ethiopia; 2006–2011.
MoH (2011) National drinking water quality monitoring and surveillance strategy.Federal Democratic
Republic of Ethiopia, Ministry of Health. Addis
Ababa.http://www.cmpethiopia.org/content/download/384/2301/file/National%20drinking%
20water%20quality%20monitoring%20and%20surveillance%20strategy.pdf.
Negatu B, Kromhout H, Mekonnen Y, Vermeulen R (2016). Use of chemical pesticides in Ethiopia: a
cross-sectional comparative study on knowledge attitude and practice of farmers and farm
workers in three farming systems. Ann. Occup. Hyg.
Nigussie K, Chandravanshi SB and Wondimu T (2010) Correlation among trace metals in Tilapia
(Oreochromis niloticus), sedimentand water samples of lakes Awassa and Ziway, Ethiopia. Int.
J. Biol. Chem. Sci. 4: 1641-1656.
Nwankwoala AU and Osibanjo O (1992). Baseline levels of selected organochlorine pesticide residues
in surface waters in Ibadan (Nigeria) by electron capture gas chromatography. Sci. Total
Environ., 119: 179-190.
Okoya AA, Ogunfowokan AO, Asubiojo OI, and Torto N (2013).Organochlorine Pesticide Residues in
Sediments and Waters from Cocoa Producing Areas of Ondo State, Southwestern
Nigeria.Hindawi Publishing Corporation. Article ID 131647.
http://dx.doi.org/10.1155/2013/131647
Olaya - Contrras P, Rodríguez - Villamil J, Posso-Valencia H J and Cortez JE (1998).Organochlorine
exposure and breast cancer risk in Colombian women Cad. Saúde Pública, Rio de Janeiro. 14
(3) : 125-132.

128
Organisation for Economic Co-operation and Development (2004) OECD guideline for testing of
chemicals: Daphnia sp., acute immobilisation test, No. 202. Paris, France.
Ouma H and Mwamburi J (2014) Spatial variations in nutrients and other physicochemical variables
in the topographically closed Lake Baringo freshwater basin (Kenya). Lakes and Reservoirs:
Research and Management. 19: 11–23.
PAN-UK (2006) Pesticide Use, Accumulations and Impacts: A Case Study in the Rift Valley, Ethiopia
Environment and Social Assessment International.
http://www.panuk.org/archive/Projects/Obsolete/Pesticide%20Use%20Accumulation%20and
%20Impacts.pdf
Peeters F, Van den Brink PJ, Vlaming J, Groenwold J, Beltman W, Boesten J. PRIMET version 2.0,
technical description and manual. Report, 1648Wageningen, The Netherlands: Alterra; 2008.
Perry MJ, Young HA, Grandjean P, Halling J, Petersen MS, Martenies SE, Karimi P and Weihe P
(2015).Sperm Aneuploidy in Faroese Men with Lifetime Exposure to
Dichlorodiphenyldichloroethylene (DDE) and Polychlorinated Biphenyl (PCB) Pollutants.
Environ Health Perspect DOI: 10.1289/ehp.1509779
PHRD (2015) List of Registered Pesticides as of June 2015. Ministry of Agriculture Plant Health
Regulatory Directorate. Ethiopia.
http://www.moa.gov.et/documents/93665/4536019/List+of+Registered+Pesticides+as+of+Jun
e+%2C%202015-.pdf/34309f8f-f790-4119-ac55-5d0b52a52ff2
Pitt JJ (2009) Principles and Applications of Liquid Chromatography- Mass Spectrometry in Clinical
Biochemistry.Clin Biochem Rev. 30: 19–34.
Posthuma L, de Zwart D, Solomon KR and Brock TCM (2008).Guidance on the application of
extrapolation methods in ecological exposure and effects characterization of chemicals. SETAC
Press & CRC Press, Boca Raton, Fl, USA, pp. 281-322.
Posthuma L, Suter GW, Traas TP (2002) Species sensitivity distributions in ecotoxicology.Lewis, Boca
Raton, FL, USA.
Prabu P, Wondimu L, Tesso M. Assessment of water quality of Huluka and Alaltu rivers of Ambo,
Ethiopia. Ambo University College. J. Agric. Sci. Technol. 2011;13:131–8.
Prabu P. Impact of heavy metal contamination of Akaki River of Ethiopia on soil and metal toxicity on
cultivated vegetable crops.Electron. J. Environ. Agric. Food Chem. 2009;8: 818–27.
Pretty J, Toulmin C, and Williams S (2011) Sustainable intensification in African agriculture.
International Journal of Agricultural Sustainability: 9, 5–24.
Raposo JLJ and Nilva R (2007). Determination of organochlorine pesticides in ground water samples
using solid-phase microextraction by gas chromatography-electron capture detection. Talanta,
72: 1833-1841.
Reichenberger S. Comment on “Regulatory FOCUS Surface Water Models Fail to Predict Insecticide
Concentrations in the Field; Environ. Sci. Technol. 2012, 46, 8397–8404″. Environ. Sci. Technol.
2013;47:3015–6.
Reimann C, Bjorvatnb K, Frengstada B, Melakuc Z, Tekle-Haimanotc R, and Siewers U (2003) Drinking
water quality in the Ethiopian section of the East African Rift Valley I—data and health aspects.
The Science of the Total Environment. 311: 65–80.
Repetto R and Baliga SS (1996). Pesticides and the immune system: The public health risks. World
Resource Institute.
129
Rico A, Geber-Correa R, Campos P, Garcia M, Waichman A, Van den Brink PJ (2010) Effect of
parathion-methyl on Amazonian fish and freshwater invertebrates: a comparison of sensitivity
with temperate data. Arch Environ Contam Toxicol 58: 765-771.
Rico A, Waichman AV, Geber-Corrêa R, Van den Brink PJ.Effects of malathion and carbendazim on
Amazonian freshwater organisms: comparison of tropical and temperate species sensitivity
distributions and water quality criteria. Ecotoxicology 2011;20:625–34.
Rubach MN, Crum SJH, Van den Brink PJ (2011) Variability in the dynamics of mortality and
immobility responses of freshwater arthropods exposed to chlorpyrifos. Arch Environ Contam
Toxicol 60: 708-721.
Safford R J and Jones C G (1997).Did organochlorine pesticide use cause declines in Mauritian forest
birds? Biodiversity and Conservation 6: 1445-1451.
Sahle A and José P (2013) Environmental life cycle assessment of Ethiopian rose cultivation. Science
of the Total Environment 443: 163–172.
Seleshi B., Aster Y., Mekonnen L., WIllibald L., Mekonnen A., and Tena A. ( 2007). Water Resources
and Irrigation Development in Ethiopia.IWMI working paper 123, Addis Ababa, Ethiopia.
Singh P, Jones RL. Comparison of pesticide root zone model 3.12: runoff predictions with field data.
Environ. Toxicol. Chem. 2002;21:1545–51.
Solomon KR., Brock TCM, de Zwart D, Dyer SD, Posthuma L, Richards SM, Sanderson H, Sibley PK and
van den Brink PJ (Eds) (2008). Extrapolation practice for ecotoxicological effect
characterization of chemicals.SETAC Press & CRC Press, Boca Raton, Fl, USA, 380 pp.
Taddese A, Asferachew A. An assessment of pesticide use: Pesticides and hazards in the Ethiopian
Rift Valley. Africa Stock Piles Programme. Institute for Sustainable Develop-ment and Pesticide
Action network; 2008. (URL: http://www.thenrgroup.net/theme/ PAN-
ecotox/pdf/annex_6_ethiopia_mini-project_report.pdf).
Taylor L.E., Holly A.G. and Kirk M. (2007). Pesticide development: a brief look at the history. Texas A
and M publication. 805-124.
Teklu BM, Adriaanse PI, Ter Horst MMS, Deneer JW and Van den Brink PJ(2015) Surface water risk
assessment of pesticides in Ethiopia. Science of the Total Environment. 508: 566–574.
Teklu BM, Hailu A, Wiegant DA, Scholten BS and Van den Brink PJ (2015b).Impacts of nutrients and
pesticides from small- and large-scale agriculture on the water quality of Lake Ziway,
Ethiopia.Environmental Sciences and Pollution Research. (on press).
Tenabe S, Iwata H and Tatsukawa R (1994).Global contamination by persistent organochlorines and
thier Eco toxicological impact on marine mammals.The science of total environment. 154: 163-
177.
Tiktak A, Boesten JJTI, Egsmose M, Gardi C, Klein M, Vanderborght J. European scenarios for
exposure of soil organisms to pesticides. J. Environ. Sci. Health B 2013;48:703–16.
Tsimbiri PF, Moturi WN, Sawe J, Henley P and Bend JR (2015).Health Impact of Pesticides on
Residents and Horticultural Workers in the Lake Naivasha Region, Kenya.Occupational Diseases
and Environmental Medicine, 2015, 3, 24-34.
US-EPA (2014) Sample submission procedures for the office of analytical services and quality
assurance (OASQA) laboratory branch.Environmental protection Agency. Fort Meade, MD,
USA. http://www2.epa.gov/sites/production/files/2015-07/documents/sample-submission-
procedures-rev13.pdf
Van den Brink PJ (2013) Assessing aquatic population and community level risks of pesticides.
Environ Toxicol Chem 32: 972 – 973.

130
Van den Brink PJ, Blake N, Brock TCM., and Maltby L (2006) Predictive Value of Species Sensitivity
Distributions for Effects of Herbicides in Freshwater Ecosystems. Human and Ecological Risk
Assessment. 12: 645–674.
Van den Brink PJ, Sureshkumar N, Daam MA, Domingues I, Milwain GK, Beltman WHJ, Perera M,
Warnajith P, Satapornvanit K. Environmental and Human Risks of Pesticide Use in Thailand and
Sri Lanka. Results of a Preliminary Risk Assessment. Alterra-Report 789, Wageningen, The
Netherlands; 2013.
Van den Brink PJ, Van den Brink NW, Ter Braak CJF (2003a) Multivariate analysis of ecotoxicological
data using ordination: demonstrations of utility on the basis of various examples. Australasian
Journal of Ecotoxicology. 9:141-156
Van den Brink PJ. Assessing aquatic population and community level risks of pesticides. Environ.
Toxicol. Chem. 2013;32:972–3.
Van Leeuwen CJ, Vermeire TG (eds) (2007) Risk assessment of chemicals: an introduction. Springer,
Dordrecht, The Netherlands.
Van Vlaardingen P, Traas TP, Aldenberg T (2003) Normal distribution based hazardous concentration
and potentially affected fraction. ETX-2000. Rijksinstituut voor Volksgezondheid en Milieu,
Bilthoven, The Netherlands http://nl.sitestat.com/rivm/rivm-
nl/s?link.en.documents_and_publications.scientific.reports.2005.februari.etx_2_0_a_progra
m_to_calculate_hazardous_concentrations_and_fraction_affected_based_on_normally_dist
ributed_toxicity_data.download_pdf&ns_type=pdf&ns_url=http%3A%2F%2Fwww.rivm.nl%2
Fdsresource%3Fobjectid=rivmp:15695&type=org&disposition=inline&ns_nc=1
Verrone G (1962) Outline for the determination of malarial mosquitoes in Ethiopia, Anopheline
larvae. Mosquito News 22: 394–401.
Wahizatul AA, Long SH, Ahmad A (2011)Composition and distribution of aquatic insect communities
in relation to water quality in two freshwater streams of Hulu Terengganu, Terengganu. J
Sustain Sci Manage 6: 148-155.
Wei D, Kameya T and Urano K (2007). Environmental management of pesticidal POPs in China: Past,
present and future. Environment International. 33: 894–902.
Westbom R,Ahmed H,Negussie M,Negussie R,Lennart M and Erland B (2008). Assessment of
organochlorine pesticide pollution in Upper Awash Ethiopian state farm soils using selective
pressurized liquid extraction. Chemosphere. 8: 1181-1187.
Westein E, Jansen MJW, Adriaanse PI, Beltman WHJ. Sensitivity analysis of the TOXSWA model
simulating fate of pesticides in surface waters. Report, 154Wageningen, The Netherlands: DLO
Winand Staring Centre; 1998.
Wheeler JR, Grist EPM, Leung KMY, Morritt D and Crane M (2002) Species sensitivity distributions:
data and model choice. Marine Pollution Bulletin.45 : 192–202.
WHO (2010) Rapid assessment of drinking water quality in the Federal Democratic Republic of
Ethiopia.Country Report.World Health
Organization.http://www.wssinfo.org/fileadmin/user_upload/resources/RADWQ_Ethiopia.pdf
.
WHO. Global Environment Monitoring System — Food Contamination Monitoring and Assessment
Programme (GEMS/Food): GEMS/Food Consumption Cluster Diets; 2005 (URL:
http://www.who.int/foodsafety/chem/gems/en/index1.html).
WHO. Guidelines for Drinking-Water QualityFourth ed.; 2011 (URL: http://whqlibdoc.
who.int/publications/2011/9789241548151_eng.pdf).

131
WHO.Public Health Impact of Pesticides Used in Agriculture. (1990). World Health Organization,
Geneva: 88.
Wik M, Pingali P, and Broca S (2008). Global Agricultural Performance: Past Trends and Future
Prospects. Background paper for the world development report.
William J, Tagoe L, Drechsel P, Kelderman P, Gijzen H and Nyarko E (2008). Accumulation of
Persistence Organochlorine contaminants in milk and serum of farmers from Ghana. Environ.
Res. 106: 17-26.
Wipfler EL, Adriaanse PI, ter Horst MMS, Vlaming J, Van den Brink PJ, Peeters FM, Deneer JW,
Boesten JJTI and Groenwold JG (2014).PRIMET_Registration_Ethiopia_1.1, technical
description and manual. A decision support system for assessing pesticide Risk in theTropics to
Man, Environment and Trade, for pesticide registration in Ethiopia. Wageningen, The
Netherlands. Altera report 2573.
Yohannes YB, Ikenaka Y, Nakayama S, Saengtienchai A, Watanabe K and Ishizuka M (2013).
Organochlorine pesticides and heavy metals in fish from Lake Awassa, Ethiopia: Insights from
stable isotope analysis. Chemosphere, 91: 857–863.
Yohannes YB, Ikenaka Y, Saengtienchai A, Watanabe KP, Nakayama SMM, and Ishizuka M (2014)
Concentrations and human health risk assessment of organochlorine pesticides in edible fish
species from a Rift Valley lake – Lake Ziway, Ethiopia. Ecotoxicology and Environmental Safety,
106, 95-101.
Young DF, Carleton JN. Implementation of a probabilistic curve number method in the PRZM runoff
model. Environ. Model Softw. 2006;21:1172–9.
Żwir-Ferenc A and Biziuk M (2006)Solid Phase Extraction Technique – Trends, Opportunities and
Applications. Polish J. of Environ. Stud. Vol. 15, No. 5 (2006), 677-690

132
Abbreviations
133
% : percent
< : Less than
> : Greater than
°C : degree celsius
µm : micro meter
µS/cm : micro Siemens per centimetre
1/n : Freundlich exponent
a.i. : Active ingredient
AA : Addis Ababa
AAU : Addis Ababa University
ADI : Acceptable Daily Intake
APHRD : Animal and Plant Health Directorate
ARfD : Acute Reference Dose
B : Boron
BW : Body Weight
Ca : Calcium
Cm : Centimetres
CRV : Central Rift Valley
Cu : Copper
d : days
DDT : dichlorodiphenyltrichloroethane
DO : Dissolved Oxygen
DT50soil : Half-life of transformation in soil
DT50water, : half-life of transformation in water
EC : Electrical Conductivity
EC50 : Median Effect Concentration
ECMWF : European Centre for Medium-Range Weather Forecasts
134
EIAR : Ethiopian Institute of Agricultural Research
ERA : Environmental Risk Assessment
ESTI : Estimated Short Term Intake
ETR : Exposure Toxicity Ratio
EU : European Union
FAO : Food and Agriculture Organization
Fe : Iron
FOCUS : Forum for the Coordination of Pesticide Fate Models
g a.i./ha : gram active ingredient per hectare
g/Kg : gram per kilogram
g/L : gram per litter
GC_ECD : Gas Chromatography with Electron Capture Detector
GC_MS : Gas Chromatography_ Mass Spectrometry
h : Hour
ha : hectare
HC5 : Hazard Concentration for 5% of the population predicted from ssd curve
HC50 : Hazard Concentration for 50% of the population predicted from ssd curve
HCH : hexachlorocyclohexane
HCl : Hydrochloric Acid
HoA REC&N : Horn of Africa Regional Environment Centre and Network
IBC : Institute of Biodiversity Conservation
IEDI : Internationally Estimated Daily Intake
J/mol : joules per mole
K : Potassium
Kg : Kilogram
Kg/ha : kilogram per hectare
Km2 : Square Kilometres

135
Koc : Coefficient for sorption on soil based on organic carbon content
L : Litter
L/ha : Litter per hectare :
LC/MS : Liquid Chromatography / Mass Spectrometry
LC50 : Median Lethal Concentration
LL HC5 : Lower Limit Hazard Concentration for 5% of the population
LLHC50 : Lower Limit Hazard Concentration for 50% of the population
LMM : Low Molecular Mass
LP_dw : Large Portion of drinking water
m : Meter
mg : milligram
Mg : Magnesium
mg/kgbw/d : milligram per kilogram body weight per day
mg/L : milligram per litter
mL/Kg : milliliter per killogram
ml/min : millilitre per minute
mm : millimetre
Mn : Manganese
Mo : Molybdenum
MoA : Ministry of Agriculture
MOARD : Ministry of Agriculture and Rural Development
MoH : Ministry of health
mPa : Vapour pressure
MPL : Maximum Permissible Limits
MRLs : Maximum Residue Levels
NA : Not Available
Na : Sodium
136
NEC : No Effect Concentrations
NH4+N : Ammonium- Nitrogen
nm : Nano Meter
No3-N : Nitrate-Nitrogen
OCPs : Organo Chlorine Pesticides
OECD : Organization for Economic Co-operation and Development
OPs : Organophosphates
P : Phosphorus
PAN-UK : Pesticide Action Network- United Kingdom
PEC : Predicted Environmental Concentration
PEC90th : 90th percentile concentration in the selected surface water
PEC99th : 99th percentile concentration in the selected surface water
PHRD : Plant Health Regulatory Directorate
pKa : Dissociation constant
PNEC : Predicted No Effect Concentrations
POPs : Persistent Organic Pollutants
PPDB : Pesticide Properties Database
PRIMET : Pesticide Risks in the tropics to Man Environment and Trade
PRRP : Pesticide Risk Reduction Programme
PRZM : Pesticides in Root Zone Model
PSMS : Pesticide Stock Management System of
RDA : Redundancy Analysis
S : South
S : Sulphur
SE : South East
Si : Silicon
SPE : Solid Phase Extraction
137
SSD : Species Sensitivity Distribution
T : Temperature
TCP : Technical Cooperation Programme
TDS : The Total Dissolved Solids
TOXSWA : TOXic substances in Surface WAters
TSS : Total Soluble Solids
ULHC5 : Upper Limit Hazard Concentration for 5% of the population
ULHC50 : Upper Limit Hazard Concentration for 50% of the population
UN : United Nations
US-EPA : Unites States Environmental Protection Agency
W : West
WHO : World Health Organization
WHO GEMS : World Health Organization Global Environmental Monitoring System
ZFRRC : Ziway Fisheries Resources Research Centre
Zn : Zink
ZSRC : Ziway Soil Research Centre
μg/L : micro gram per litter

138
Acknowledgment
139
This doctoral study has been a big working experience that makes me upgrade my academic,
communication and social skills. It has been a privilege to be involved in such a highly recognised
university and working with everyone around was quite an experience. The entire almost five years
between the Netherlands and Ethiopia has been a kind of sweet adventure for me.
First of all I would like to express my deepest gratitude for my supervisor Prof. Dr. Paul van
den Brink for all his advice, efforts and guidance towards a more profound output. Without his
dedication and supreme guidance and sharp and honest criticism this thesis wouldn’t be a
reality.Paul, I would like to thank you for all the support, close supervision and guidance starting
from the very beginning. Your kind and cheerful approach makes me even dig more and strive to
know more whenever I faced perplexing and difficult subjects. You were always there to answer all
my questions and clarify my confusions. Moreover, those sweet dinners that you invited us to your
home making us familiarize with your lovely family is something that will remain in my heart.
My deepest gratitude goes to a Paulien. You were the most enlightening person I ever met
and I had gained much knowledge on the subject risk assessment working with you in two of my
papers and in the document preparation for the PRRP_Ethiopia. I am also grateful for all the dinner
invitations and for showing me the adventure of ice-skating the first time I came to the Netherlands,
which I was repeatedly found on the ground.
A special thanks goes to John Deneer for all the valuable suggestions and comments working
with one of my manuscript. You have been there to clarify all the things in association with the
physicochemical properties of pesticides needed for running the PRZM and TOXWA models. It has
also been a great privilege to work with Mechtold in writing scripts for running models.
All the ERA team working with in the PRRP_Ethiopia project need much respect and
gratitude. Floor thanks for all the guidance and leadership, and all the team working around the
PHRD for being there for me whenever I needed help.
Special thanks also go to Prof. Nigussie Reta of the Addis Ababa University in facilitating the
lab for doing my single species toxicity experiment. Also thanks for looking at the manuscript and
supervising this PhD project. I owe deepest and heartiest gratitude for all the laboratory workers at
the PHRD pesticide residue monitoring lab in handling my water samples to be analysed for some 18
target OCPs and the AAU fishery laboratory technician kassahun and Hiwot and my friend Zelalem.
Naod from the Adea district Agricultural office deserves my warmest thanks for his facilitation and
support in field activities together with my Brother Ermias. My gratitude will remain incomplete if I
140
don’t mention the HoAREC&N team Danial, Amare for working in one of my manuscript and sharing
their data and for all the professional comments and suggestions throughout the manuscript
preparation. Bernice I would like to thank you for all the professional comments and suggestions
working on the same paper.
My deepest gratitude once again goes to my fellow PhD stress group members, Jugk, Zhang,
Jacqui, Noel, Andreu, Andreas, Mauricio, Concilliaand former PhD Mazhar for sharing ideas with
you. The same thanks goes to my fellow Ethiopian PhDs with in PRRP_Ethiopia, Bealy and Beyene,
for being there with me starting from the beginning.
I also express my profound respect to the Aquatic Ecology and Water Quality Management
Group (AEW) for hosting me as a PhD student and for all the memorable lunch talks that helps me
increase broaden my scope in research.
Finally It gives me a great pleasure to thank my family here in the Netherlands and in
Ethiopia for the constant encouragement and support you gave. Nebiyat, , Bereket, Nurya, Tomas,
Gergis, Genet, Yemane and Sami from the Netherlands and all the sweet family that I have no space
to mention here from Ethiopia. I feel very honoured to be the second person to be with a PhD in the
family, the first one goes to Dr. Getachew who is a husband of my lovely and kind sister Elleni who
both were of great inspiration and help throughout this process. The deepest thanks again goes to
my sweet and kind Mother Fana. You have been therefore me starting from the beginning taking me
up to this level as a single mom. I pray so that the future brings all the beautiful things available in
the universe to you.
Berhan Mellese Teklu
Wageningen University
June 2016

141
Short Biography
‘’Our lives are a sum total of the choices we have made’’
(Wayne Dyer)

142
Berhan Mellese Teklu (1976) was born in
Ethiopa in a place called Sefere Selam
(meaning a village for peace) found in a
commercial area called Mesalemia in the
capital city Addis Ababa. He is the seventh son
of Mellese Teklu (late, 1990) and Fana Kidane.
His late father was a surveyor at the then
Ethiopian Roads Authority, while his mother is
a house wife. His mom took the responsibility
of raising him as a single mom struggling
through an utter poverty faced because of the
reality created by the dictatorial and absolute
command economy of the time.
Berhan when getting through the high school education had the chance to join Haromaya
University known for specializing in Agricultural Sciences and had a BSc. degree in Plant Sciences
(2000). Right after graduation he had the chance to get hired as a junior instructor at Alage
Agricultural Vocational and Technical College found some 220 kms away from Addis Ababa. He then
joined the Addis Ababa University to study entomology at the department biology and had his MSc
degree in the year 2008. Right after having his MSc he worked for a short time in a private company
and joined the Ministry of Agriculture of the Extension Directorate.
In the year 2011 he was awarded a scholarship through project called PRRP_Ethiopia funded by
the Dutch government to peruse his doctoral degree in the University of Wageningen, The
Netherlands, in what is called ‘a sandwich setting’. He then started his PhD in the Aquatic Ecology
and Water Quality Management Group of the Wageningen University supervised by Prof. Dr. Paul
van den Brink and locally co supervised by Prof. Nigussie Retta of the Addis Ababa University. In his
doctoral thesis he tried to put forward the Environmental risk assessment of pesticides in Ethiopia
especially considering surface waters as the main protection goals which is quite a new science and a
different approach for the country Ethiopia.
During his PhD Berhan has participated in several workshops organized by the PRRP_Ethiopia and
also attended one SETAC conference held in Barcelona. He also took several courses and participated
in document preparation in connection with PRRP project. In his spare time Berhan likes playing
football and watching movies. After his dissertation, Berhan Plans to investigate the possibilities of
implementing the model based risk assessment of pesticides for improving the pesticide registration
system of Ethiopia or elsewhere in Africa, he is also looking forward to work in future projects related
to pesticide fate and effect studies in Africa or elsewhere in the world.
143
Publications
Teklu BM, Adriaanse PI, Ter Horst MMS, Deneer JW and Van den Brink PJ(2015). Surface water risk
assessment of pesticides in Ethiopia.Science of the Total Environment.508: 566–574.
Adriaanse PI, Ter Horst MMS, Teklu BM, Deneer JW, Woldeamanuel A and Boesten JJTI (2015).
Development of scenarios for drinking water produced from groundwater and surface water
for use in the pesticide registration procedure of Ethiopia. Altera report 2674. Wageningen.The
Netherlands.
Teklu, BM, Tekie H, McCartney M, and Kibret S (2010): The effect of physical water quality and water
level changes on the occurrence and density of Anopheles mosquito larvae around the
shoreline of the Koka reservoir, central Ethiopia, Hydrol. Earth Syst. Sci., 14, 2595-2603,
doi:10.5194/hess-14-2595-2010
Teklu BM, Retta N and Van den Brink PJ (2016).Sensitivity of Ethiopian aquatic macroinvertebrates to
the pesticides endosulfan and diazinon, compared to literature data. Ecotoxicology. (in press).
Teklu BM, HailuA, Wiegant DA, Scholten BS and Van den Brink PJ (2016).Impacts of nutrients and
pesticides from small- and large-scale agriculture on the water quality of Lake Ziway, Ethiopia.
Environmental Sciences and Pollution Research.DOI 10.1007/s11356-016-6714-1.
Submitted
Teklu BM, Adriaanse PI, and Van den Brink PJ (2016).Monitoring and risk assessment of pesticides in irrigation systems in Debra Zeit, Ethiopia.Chemosphere.
144
Colophon
Thesis lay out by: Author
Thesis cover design by: Proefschriftmaken.nl
Printing: Proefschriftmaken.nl

145

146