Embed Size (px)
Citation preview

ORIGINAL ARTICLE
doi:10.1111/j.1558-5646.2011.01526.x
ENVIRONMENTAL ROBUSTNESS ANDTHE ADAPTABILITY OF POPULATIONSAlexander J. Stewart,1,2, Todd L. Parsons,1 and Joshua B. Plotkin1,3
1Department of Biology, University of Pennsylvania, Philadelphia, 19104, Pennsylvania2CoMPLEX, University College London, Physics Building, Gower Street, London WC1E 6BT, United Kingdom
3E-mail: [email protected]
Received March 30, 2011
Accepted November 15, 2011
Recent work has shown that genetic robustness can either facilitate or impede adaptation. But the impact of environmental
robustness on adaptation remains unclear. Environmental robustness helps ensure that organisms consistently develop the same
phenotype in the face of “environmental noise” during development. Under purifying selection, those genotypes that express the
optimal phenotype most reliably will be selectively favored. The resulting reduction in genetic variation tends to slow adaptation
when the population is faced with a novel target phenotype. However, environmental noise sometimes induces the expression
of an alternative advantageous phenotype, which may speed adaptation by genetic assimilation. Here, we use a population-
genetic model to explore how these two opposing effects of environmental noise influence the capacity of a population to
adapt. We analyze how the rate of adaptation depends on the frequency of environmental noise, the degree of environmental
robustness in the population, the distribution of environmental robustness across genotypes, the population size, and the strength
of selection for a newly adaptive phenotype. Over a broad regime, we find that environmental noise can either facilitate or impede
adaptation. Our analysis uncovers several surprising insights about the relationship between environmental noise and adaptation,
and it provides a general framework for interpreting empirical studies of both genetic and environmental robustness.
KEY WORDS: Adaptation, mutations, population genetics.
Robustness and adaptability are fundamental and seemingly con-
flicting properties of biological systems (de Visser et al. 2003;
Lenski et al. 2006; Wagner 2008; Draghi et al. 2010). An organ-
ism is robust if it can reliably produce a given phenotype across
a range of environmental and genetic perturbations. But adapt-
ability requires that alternative phenotypes be expressed so that
a population can adapt to new conditions. Naively, it seems that
the more robust an organism is, the less frequently it expresses
alternative phenotypes, and so the less adaptable (or evolvable)
the population will be. However, recent work demonstrates that
genetic robustness can either facilitate or impede a population’s
capacity to adapt to a novel environment (Wagner 2008; Draghi
et al. 2010). The relationship between adaptation and environmen-
tal robustness—that is, the robustness of an individual’s expressed
phenotype against nonheritable perturbations—remains unclear.
There are reasons to believe that environmental noise may fa-
cilitate adaptation. It is well known that genetic and environmental
perturbations often have similar phenotypic effects on an organ-
ism. As a result, occasionally expressing alternative phenotypes
by environmental noise might help speed adaptation via “genetic
assimilation”—that is, by promoting those individuals who will
subsequently evolve the adaptive phenotype by mutation (Ancel
and Fontana 2000; Rutherford 2003; Earl and Deem 2004; Gibson
and Dworkin 2004; Masel 2005; Meyers et al. 2005). But there
are also reasons to believe that environmental noise may impede
adaptation: noise will select for the most environmentally robust
genotypes, thus reducing neutral standing genetic variation in a
given environment and thereby slowing adaptation to a new tar-
get phenotype (Hermisson and Wagner 2004; Wagner et al. 1997;
van Nimwegen et al. 1999; Masel and Trotter 2010). Therefore,
1 5 9 8C© 2012 The Author(s). Evolution C© 2012 The Society for the Study of Evolution.Evolution 66-5: 1598–1612

ENVIRONMENTAL ROBUSTNESS AND THE ADAPTABILITY OF POPULATIONS
we might expect a complex relationship between environmental
noise, environmental robustness, and the rate at which a popula-
tion adapts to a novel environment. It is this relationship that is
the focus of this article.
Phenocopy and Genetic Assimilation
Genetic and environmental perturbations often have similar phe-
notypic effects—a phenomenon known as “phenocopy.” Pheno-
copy was first discovered in the classic studies of Goldschmidt
(1935) and Waddington (1953a), and it has since been observed
at many different levels of biological organization, including
protein-coding sequence, mRNA and protein structures, individ-
ual gene expression patterns, regulatory or metabolic network
dynamics, and entire developmental pathways (Table 1).
The classic example of the phenocopy concept comes from
studies of heat shock in Drosophila (Waddington 1942, 1953a,b,
1959). Waddington found that the type of phenotypic variation in-
duced by heat shock could subsequently be produced by genetic
changes accrued over several generations of artificial selection
(Waddington 1953a). In other words, a phenotype that was ini-
tially produced as the result of an environmental stimulus was
subsequently produced in the absence of that stimulus as the re-
sult of genetic changes—a process called “genetic assimilation.”
The mechanistic basis for genetic assimilation in these heat shock
experiments has been traced, in part, to the behavior of the molec-
ular chaperone Hsp90 (Rutherford and Lindquist 1998; Chow and
Chan 1999; Rutherford 2003; Sangster et al. 2004), which buffers
the effects of standing genetic variation by aiding protein fold-
ing. When the function of Hsp90 is impaired, either through heat
shock or through mutation, previously cryptic genetic variation is
revealed as phenotypic variation. Any such phenotypic variation
that is adaptive can quickly become fixed through genetic as-
similation (Ancel and Fontana 2000; Gibson and Dworkin 2004;
Jarosz and Lindquist 2010; Masel and Trotter 2010).
Environmental perturbations can also lead to phenocopy in a
constant genetic background (i.e., even without standing cryptic
genetic variation). One of the most important examples of this
occurs in the secondary structures of RNA and protein molecules
(Ancel and Fontana 2000; Bloom et al. 2006). Although the major-
ity of genetically identical sequences fold to the same, minimum
energy structure, some adopt higher energy structures. The alter-
native structures that a molecule can assume generally correspond
to the minimum energy structures associated with the genotypes
available by mutation to that molecule (Ancel and Fontana 2000;
Bloom et al. 2006). The degree to which these alternative phe-
notypes are expressed depends on environmental factors, such as
temperature. In this case, phenocopy occurs on a constant genetic
background, without the need for cryptic genetic variation.
In this study, we will not specify a specific phenotype of
interest (e.g., RNA secondary structure) or a specific mechanism
of phenocopy (e.g., a chaperone-mediated capacitor), but rather
we will explore in greater generality how environmental robust-
ness influences a population’s capacity to adapt, assuming that
genetic and environmental perturbations tend to produce similar
phenotypes.
Variation in the Degree of Environmental
Robustness among Genotypes
The degree to which an individual is robust to environmental noise
may depend upon the individual’s genotype. When a population
is under stabilizing selection for a given phenotype, and when
genotypes vary in their environmental robustness, selection will
tend to concentrate the population at the highly robust genotypes.
The strength of this effect will increase as the frequency of envi-
ronmental perturbations increases. As a result of this effect, the
population will harbor less genetic diversity when environmental
perturbations occur more frequently, which in turn will reduce
the speed with which the population adapts to a new target phe-
notype. Thus, genotypic variation in environmental robustness
can influence the adaptability of a population (Masel and Trotter
2010). (We use the term adaptability, which is more accurate in
this context than the term evolvability). Standing genetic diversity
increases the speed of adaptation both by increasing the probabil-
ity that the population harbors adaptable individuals at the time
of the environmental shift and by increasing the rate at which
such individuals are produced following the environmental shift.
Therefore, standing genetic diversity is important for adaptation
when adaptable genotypes are rare.
Presentation Outline
We will construct a general, population-genetic model to explore
the effects of environmental robustness on adaptability. Our model
assumes the concept of phenocopy and it also allows for variation
in environmental robustness across genotypes. On the one hand,
the phenocopy phenomenon has been shown to aid the adaptation
of a population following an environmental shift in the presence of
environmental noise (Ancel and Fontana 2000; Rutherford 2003;
Earl and Deem 2004; Gibson and Dworkin 2004; Masel 2005;
Meyers et al. 2005). But on the other hand, as discussed above,
variation in environmental robustness across a neutral network
tends to reduce genetic variation prior to an environmental shift
(i.e., under stabilizing selection) when noise is present, and thus
slows adaptation (Wagner et al. 1997; Hermisson and Wagner
2004; Masel and Trotter 2010). These two forces therefore have
opposite influences on the capacity of a population to adapt to
a new environment. Here, we resolve how these opposing forces
interact to determine the adaptability of populations subject to
environmental noise.
The article is structured as follows. We begin by introduc-
ing a general model for the evolution of a population on an
EVOLUTION MAY 2012 1 5 9 9

ALEXANDER J. STEWART ET AL.
Table 1. Examples of phenocopy observed in different biological systems.
Phenotype Genetic perturbation Environmental perturbation References
Protein misfolding Mutations at protein-codingregions
Errors in transcription ortranslation
Goldsmith and Tawkik (2009),Meyerovich et al. (2010)
Incorrectly transcribedmRNA
Mutations at stop codons Accidental read through ofstop codons
Masel and Bergman (2003)
Protein/mRNA misfolding Mutations to coding regions Temperature induced noise Ancel and Fontana (2000),Bloom et al. (2006)
Protein/mRNA misfolding Knockout of molecularchaperone Hsp90
Heat shock Rutherford and Lindquist(1998)
Incorrect protein expressionlevel
Mutations to regulatoryregions
Intrinsic/extrinsic noise Raj and van Oudenaarden(2008)
Incorrect gene expressionpattern
Gene knockout resulting inloss of buffering in genenetwork
Large environmentalperturbation
Levy and Siegal (2008), Siegaland Bergman (2002),Lopez-Maury et al. (2008),Wagner and Wright (2007)
Incorrectly executeddevelopmental/ metabolicpathway
Mutation resulting in loss ofredundancy in pathways
Large environmentalperturbation
McLoughlin and Copley(2008), Tawkik (2010)
arbitrary neutral network, with an arbitrary distribution of en-
vironmental robustness across the network. We consider a popu-
lation initially adapted to one environment (one target phenotype)
and then subsequently exposed to a new environment (a different
target phenotype). We treat our model analytically to recover the
full probability distribution of the time required to adapt to the
new target phenotype. We next discuss a simplified neutral net-
work with constant mutational robustness in which we separate
genotypes into classes of high and low environmental robustness.
This simple model is used to develop intuition for how environ-
mental robustness affects adaptability. Finally, we summarize our
results and discuss future directions, including how our frame-
work might be used to interpret systematic studies in quantitative
genetics.
A Population-Genetic ModelOur general model is based on the Moran process from popula-
tion genetics, in which each haploid individual in a population
of constant size reproduces at a rate determined by its relative
fitness, with its offspring replacing a randomly chosen individual.
During reproduction, the offspring may acquire a mutation, which
changes its genotype from that of its parent. Different genotypes
may encode for different phenotypes; fitness is determined by
comparing an individual’s phenotype to the phenotype selected
by the current environment, as described below.
In a given environment that selects for a specific phenotype,
we will focus our analysis on the set of all genotypes that encode
that phenotype. The set of such genotypes is called a “neutral
network” because mutations among them do not change an indi-
vidual’s encoded phenotype. The structure of mutations among
the genotypes on the neutral network is defined by the adjacency
matrix M, which has entries mi j = 1, if genotype i can mutate to
genotype j without changing the phenotype, and mi j = 0 other-
wise. We define the mutational robustness, qi , of genotype i as
the proportion of all mutations that do not change its phenotype.
More specifically, we define
qi = 1
L
∑j
mij, (1)
where L denotes the total number of different mutations that could
arise in an individual (e.g., the length of its binary genome). The
mutational robustness, qi , therefore quantifies the chance that a
mutant offspring of an individual with genotype i will remain
on the neutral network (i.e., will still express the same pheno-
type), or not. Each genotype also has an associated environmental
robustness, φi , discussed in more detail below.
When an individual of genotype i is chosen to reproduce,
a mutation occurs with probability μ. The mutation rate μ is
therefore the genome wide mutation. We have typically chosen a
mutation rate of μ = 10−3 in our simulations, corresponding to a
genome of about 105 nucleotides (see Supporting Information). If
a mutation occurs, the resulting offspring remains on the neutral
network (i.e., encodes the same phenotype) with probability qi .
In this case, the offspring nonetheless has a new genotype, which
is drawn uniformly among i’s neutral neighbors (i.e., from the
set of genotypes j with mi j = 1). With probability 1 − qi , on the
other hand, the resulting offspring encodes a different phenotype
and thus lies outside of the neutral network.
Following the work of Draghi et al. (2010), we assume
that each genotype has a set of K alternative phenotypes that
1 6 0 0 EVOLUTION MAY 2012

ENVIRONMENTAL ROBUSTNESS AND THE ADAPTABILITY OF POPULATIONS
constitute its phenotypic neighborhood—that is, the set of possi-
ble phenotypes that can be produced by a nonneutral mutation.
These K phenotypes are drawn uniformly from a total of P possi-
ble alternative phenotypes. We make the simplifying assumption
that phenotypic neighborhoods are independent, such that the
K phenotypes accessible to a genotype are redrawn whenever a
mutation occurs. When a mutation produces an individual lying
outside the neutral network, its resulting phenotype is drawn from
the K alternatives that belong to its phenotypic neighborhood. The
form of genotype–phenotype map described above corresponds to
evolution in a space of infinite genotypes, such that each mutation
results in an entirely new genotype entering the population. Our
model specifies the effects of such mutations on the phenotype,
using summary statistics such as K , q , and P . Such a statisti-
cal description of the genotype–phenotype map provides a very
good approximation to evolution on an explicit, finite genotype–
phenotype map, such as the RNA folding landscape (Draghi
et al. 2010). Furthermore, we demonstrate in the Supporting In-
formation that our results hold even when we relax the statistical
assumptions described here and allow for correlations between
the phenotypic neighborhoods of neighboring genotypes.
As described so far, our model is identical to the one explored
by Draghi et al. (2010), and it can be used to study how muta-
tional robustness influences the process of adaptation. To study
environmental robustness, we will extend the model by assuming
that when an individual produces an offspring, the offspring expe-
riences an environmental perturbation with probability ε. Such an
environmental perturbation may result in the offspring develop-
ing a different phenotype from the “intended” phenotype. In other
words, when a perturbation occurs, an offspring may express a
different phenotype than the one encoded by its genotype. The per-
turbation is specific to the development of that offspring alone,
and it does not affect other individuals in the population. The
parameter ε therefore measures the amount of noise that occurs
during the development of an individual, which we call environ-
mental noise. If such an environmental perturbation occurs during
a reproduction event, the resulting individual adopts its intended
phenotype with probability φi . With probability 1 − φi , however,
the offspring is not robust to the environmental perturbation and
the offspring adopts an alternative phenotype. The parameter φi
therefore describes the robustness of genotype i against environ-
mental noise.
We assume that the alternative phenotypes that result from
mutation in an individual and those that result from environmen-
tal perturbation are the same—so that when an environmental
perturbation produces an individual with an alternative pheno-
type, that alternative phenotype is drawn from the K phenotypes
that constitute its phenotypic neighborhood (i.e., the same set
of phenotypes the individual can produce by mutation). This as-
sumption captures the concept of phenocopy—namely that ge-
netic and environmental perturbations tend to produce a simi-
lar set of phenotypes—whose longstanding empirical support we
have described above.
We consider a haploid population of N asexuals that re-
produce according to the Moran process and occupy a neutral
network of the type described above. We assume that initially the
phenotype associated with the focal neutral network is optimal
for the environment, and we assign it fitness one without loss
of generality. All alternative phenotypes are strongly deleterious,
and assigned fitness zero (or, equivalently, any selective deficit
� 1/N [van Nimwegen et al. 1999; Draghi et al. 2010]). After a
long period of stabilizing selection, we assume that an environ-
mental shift occurs, such that one of the P alternative phenotypes
now has a selective advantage, s, over the initial phenotype. The
newly adaptive phenotype is chosen uniformly from among the P
alternative phenotypes. Once the environmental shift occurs, we
study the adaptation time—defined as the time required for the
population to produce an individual whose genotype encodes the
newly adaptive phenotype. (Once one such adaptive genotype is
produced, the subsequent probability of and time to its fixation
are well understood for asexuals, according to classical popula-
tion genetics [Ewens 2004]; however, explicit calculation of this
quantity may be difficult or impossible in the presence of clonal
interference or in sexual populations). The adaption time is a ran-
dom variable whose properties depend on how the population is
distributed across the neutral network, and on the extent to which
phenocopy speeds adaptation by occasionally producing individ-
uals with the adaptive phenotype. As the rate of environmental
perturbation, ε, increases, the first of these two effects, increased
selection for genotypes with high environmental robustness, will
reduce genetic diversity and make it more and more difficult for
the population to explore the neutral network, thus slowing adap-
tation. However, the second of these two effects, phenocopy, will
result in more frequent expression of the adaptive phenotype,
which will tend to speed adaptation by promoting those individu-
als who are a single mutation away from the adaptive phenotype.
How strongly these two opposing effects influence adaptation
time, and under what conditions, is the central problem we seek
to resolve.
Following Draghi et al. (2010), we separate the neutral
network into adaptable genotypes and nonadaptable genotypes.
Adaptable genotypes are one mutation away from the newly adap-
tive phenotype, whereas nonadaptable genotypes do not contain
the newly adaptive phenotype in their phenotypic neighborhoods
(see Fig. 1 ). In the presence of environmental perturbations ε > 0
(and provided environmental robustness is not complete, i.e., pro-
vided φ �= 1), adaptable genotypes gain a direct selective advan-
tage in our model, compared to nonadaptable individuals with
the same environmental robustness, because they occasionally
express the newly adaptive phenotype.
EVOLUTION MAY 2012 1 6 0 1

ALEXANDER J. STEWART ET AL.
Figure 1. Depiction of genotypes (dots) and phenotypes (colors).
In this example, the initially adaptive phenotype is indicated by
red, and the newly adaptive phenotype following the environ-
mental shift is indicated by blue. Dark red indicates genotypes
that are adaptable (i.e., those that can express the adaptive phe-
notype either by environmental noise or genetic mutation); light
red indicates genotypes that are nonadaptable. All other pheno-
types, shown here as black or green, are deleterious. Although
some genotypes are shown as only neighboring other genotypes
of the same color, in reality, all genotypes will always have neigh-
bors that code for a different phenotype.
AnalysisWe focus on the situation in which adaptable individuals are rare
at the time of the environmental shift, meaning that the number
of adaptable individuals is O(√
N ) or smaller. We further assume
that the probability of environmental perturbation in an individual,
ε, is sufficiently small that the selective advantage of adaptable
genotypes after the environmental shift is O( 1√N
) or smaller. The
less realistic case in which adaptable individuals are common is
analyzed in Supporting Information.
In our regime of interest, following the environmental shift,
the frequencies of nonadaptable genotypes behave nearly deter-
ministically, and so their dynamics can be accurately approxi-
mated by ordinary differential equations (ODEs). In particular,
if we let Xi denote the frequency of nonadaptable genotype i
in the population, then we can approximate the dynamics by the
following system of ODEs:
d Xi
dt=
⎛⎝σi −
∑j /∈A
σ j X j
⎞⎠ Xi . (2)
Here, A denotes the set of adaptable genotypes, and σi denotes
the selective coefficient of genotype i , which we define below.
The sum∑
j /∈A σ j X j gives the mean fitness of genotypes that
are not adaptable. Loosely speaking, the nonadaptable types be-
have in a deterministic manner because we have assumed they are
common at the time of the environmental shift. We formally jus-
tify this deterministic approximation for nonadaptable genotypes
in Supporting Information, and we demonstrate below that this
approach provides a highly accurate approximation of our model
by comparing it to Monte Carlo simulations of the exact Moran
process.
Unlike the nonadaptable types, the adaptable types are as-
sumed rare at the time of the environmental shift, and so we can-
not use a deterministic approximation. Instead, we approximate
the behavior of the adaptable genotypes by deriving a diffusion
approximation of the Moran process (see Supporting Informa-
tion). The resulting diffusion approximation can be described by
a stochastic differential equation (SDE), which is similar to an
ODE except that the instantaneous dynamics involve Brownian
motion. In particular, we have derived the following SDE to ap-
proximate the (stochastic) dynamics of the frequencies of each
adaptable genotype, j :
dY j =[(
σ j −∑i /∈A
σi Xi
)Y j + θ
∑k /∈A
mk j Xk
]dt + √
2Y j dB j (t).(3)
The notation used to express equation (3) is the standard notation
for SDEs (Gardiner 2004), in which B j (t) denotes independent
Brownian motions. Intuitively, the SDE above indicates that the
change in frequency of genotype j , �Y j , in a small interval of
time, �t , is a Gaussian random variable with mean(σ j −
∑i /∈A
σi Xi
)Y j + θ
∑k /∈A
mkj Xk
and standard deviation
√2Y j .
Here, Y j denotes the number of individuals, rescaled by 1√N
, at
adaptable genotype j (see Supporting Information). A denotes
the set of adaptable genotypes, θ = Nμ denotes the population-
scaled mutation rate, and σ j denotes selection coefficients de-
fined below. The various terms in this SDE each have intuitive
interpretations. As is typical in population-genetic models, the
instantaneous mean change in the frequency of genotype j is
determined by two terms, the first due to selection and the sec-
ond due to mutation; whereas the instantaneous variance in the
change of genotype j’s frequency is determined by its current
frequency, which encodes the effect of genetic drift. The vari-
ance term arising from genetic drift has a somewhat unusual form
and it involves a√
2Y j because we have scaled the population of
1 6 0 2 EVOLUTION MAY 2012

ENVIRONMENTAL ROBUSTNESS AND THE ADAPTABILITY OF POPULATIONS
adaptable genotypes by 1√N
, instead of the more typical 1N (see
Supporting Information). We formally justify this diffusion ap-
proximation for adaptable genotypes in Supporting Information,
and we demonstrate below that this approach provides a highly
accurate approximation of our model by comparing it to Monte
Carlo simulations of the exact Moran process.
The selection terms in equations (2) and (3) arise from envi-
ronmental perturbations, which cause selective differences among
genotypes on the neutral network. For a nonadaptable genotype
i , such a perturbation will either have no effect (with probabil-
ity φi ), or it will produce a strongly deleterious phenotype with
probability (1 − φi ). Thus, the expected fitness of a nonadaptable
genotype i is 1 − (1 − φi )ε, and the selection coefficient on such
individuals is:
σi√N
= −(1 − φi )ε, i /∈ A. (4)
Likewise, adaptable genotypes express a deleterious phenotype
with probability K−1K (1 − φi )ε, and they express the newly advan-
tageous target phenotype, which has fitness 1 + s, with probability1K (1 − φi )ε. Therefore, the selection coefficient for an adaptable
genotype is
σi√N
= 1 + s
K(1 − φi )ε − (1 − φi )ε, i ∈ A. (5)
The factor 1/√
N appears the two equations above because we
have assumed the selection coefficients are O(
1√N
)(see Sup-
porting Information).
Finally, we note that, following the environmental shift,
adaptable genotypes mutate to the newly adaptive phenotype at
rate μ(
1−qi
K
). This flux into the newly adaptive phenotype, along
with equations (2) and (3), can be used to solve analytically for
the distribution of waiting times for a newly adaptive genotype to
arise in the population. In particular, we can compute the mean
time it takes for a population to adapt to a novel environment, for
an arbitrary neutral network with arbitrary variation in environ-
mental and genetic robustness across the neutral genotypes. The
full analytical solution to this problem is given in the Supporting
Information.
A Simplified ModelWe now consider a simplified version of the model above, which
will allow us to develop intuition about the effects of environmen-
tal robustness on adaptability. We assume that all genotypes have
the same mutational robustness, q . Each genotype on the neutral
network is assigned either high or low environmental robustness,
denoted by φH and φL . Following a neutral mutation, genotypes
with high environmental robustness produce other genotypes with
high environmental robustness with probability πH (and there-
fore produce genotypes with low environmental robustness with
probability 1 − πH ), whereas genotypes with low environmental
robustness produce other genotypes with low environmental ro-
bustness with probability πL (and therefore produce genotypes
with low environmental robustness with probability 1 − πL ). The
neutral network now consists of four distinct classes of genotypes:
high environmental robustness and adaptable, high environmental
robustness and nonadaptable, low environmental robustness and
adaptable, and low environmental robustness and nonadaptable.
The mutation rates among these four genotypes, and between
the adaptable and the newly adaptive genotypes, are summarized
in Figure 2. Henceforth, we analyze our model in terms of the
population density at these four classes of genotypes, rather than
in terms of the frequencies of each individual genotype. Each
class represents a large number of distinct genotypes and there-
fore harbors much genetic diversity. As the rates of mutations
into a particular class increase, this corresponds to increasing the
number of distinct genotypes within that class, and thus increases
the genetic diversity within the class. Figure 2 shows the rates of
mutations between and within classes.
In our simplified model, the mutational robustness, q , is
the same for all genotypes. Therefore, we henceforth refer to
genotypes of high and low robustness, with the understand-
ing that this means genotypes of high and low environmental
robustness.
The parameters πH and πL provide a measure of how clus-
tered the genotypes of high and low robustness are on the neu-
tral network. In particular, an individual with a high-robustness
genotype will undergo 11−πH
neutral mutations, on average, be-
fore it encounters a genotype of low robustness. Similarly, an
individual with a low-robustness genotype will undergo 11−πL
mutations, on average, before it encounters a genotype of high
robustness. Moreover, the overall fraction of genotypes in the
neutral network that have high robustness is given by 1−πL2−(πL +πH )
(Fig. 3).
In the case of this simplified model, we can use equations
(3)–(5) to write down the SDEs for the diffusion process as-
sociated with the two adaptable types (those of high and low
environmental robustness):
dYH =[σH YH + qθ
K
P(πH X H + (1 − πL )X L )
]dt
+√2YH d BH (t)
(6)
dYL =[σL YL + qθ
K
P((1 − πH )X H + πL X L )
]dt
+√2YLd BL (t),
(7)
where X H and X L denote the fraction of the population at high
and low robustness nonadaptable genotypes, and YH and YL
EVOLUTION MAY 2012 1 6 0 3

ALEXANDER J. STEWART ET AL.
Non-adaptable Adaptable
High ro-bustness
Low ro-bustness
High ro-bustness
Low ro-bustness
Newlyadaptive
μqπH 1 − KP
μqπHKP
μqπL 1 − KP
μqπLKP
μq(1 − πH) μq(1 − πL)
μq 1 − KP
μqKP
μ1−qK
μ1− qK
Figure 2. Rates of mutation among the four classes of genotypes, in our simplified model. Genotypes are either adaptable with
high environmental robustness (top right), adaptable with low environmental robustness (bottom right), nonadaptable with high
environmental robustness (top left), or nonadaptable with low environmental robustness (bottom left). Mutations change genotypes of
high robustness (filled circles) to genotypes of low robustness (open circles) with probability q(1 − πH ), and from low (pink) to high (red)
robustness with probability q(1 − πL ). Mutations change nonadaptable genotypes (left) to adaptable genotypes (right) with probability
q(1 − K
P
)and adaptable to nonadaptable with probability q K
P . Adaptable genotypes mutate to a genotype encoding the newly adaptive
phenotype with probability 1−qK . Mutations within classes are also indicated.
denote the number of individuals, rescaled by 1√N
(see Supporting
Information), at high- and low-robustness adaptable genotypes.
As before, the deterministic part of the system consists of a selec-
tion term, and an influx term due to mutation from nonadaptable
to adaptable types. We note that when the adaptable types are
rare, the probability of back mutation is rare, and thus it does not
appear in our limiting diffusions, as justified in the Supporting In-
formation. Following the environmental shift, the selection terms
σH and σL , for the high- and low-robustness adaptable genotypes,
respectively, are given by
σH√N
= ε1 + s
K(1 − φH ) + ε (φH − φL ) X L (8)
σL√N
= ε1 + s
K(1 − φL ) − ε (φH − φL ) X H . (9)
These selection coefficients have an intuitive interpretation. The
first term in equation (8) and equation (9) represents the selective
advantage of adaptable genotypes over the rest of the popula-
tion that results from their occasionally expressing the newly
adaptive phenotype. In particular, such individuals express an
alternative phenotype with probability ε (1 − φ), and that alter-
native phenotype will be adaptive, with selective benefit s, with
probability 1K . The second terms in equations (8) and (9) rep-
resent the strength of selection on genotypes of high and low
robustness in the population. These can be understood as follows:
high-robustness genotypes gain a selective advantage ε (φH − φL )
over low-robustness genotypes (because they express deleteri-
ous alternative phenotypes less frequently). This results in a se-
lective advantage for high-robustness genotypes in equation (8)
and a selective disadvantage for low-robustness genotypes inm
equation (9).
Since both terms in equation (8) favor high-robustness
adaptable genotypes, σH is always positive. However, for low-
robustness genotypes, one term gives a selective advantage and
the other term a selective disadvantage; therefore, σL can be either
positive or negative.
Finally, the influx terms in equation (6) and equation (7)
depend on πH and πL —that is, on how genotypes of high and
low robustness are clustered across the network.
In the Results section, we will use the analytical equations
above to study how the various factors in our model influence the
1 6 0 4 EVOLUTION MAY 2012

ENVIRONMENTAL ROBUSTNESS AND THE ADAPTABILITY OF POPULATIONS
Figure 3. Illustration of mutations within and between classes
for different clusterings of individual genotypes. Left—genotypes
with high environmental robustness (filled circles) are tightly clus-
tered, and tend to neighbor one another rather than genotypes
with low environmental robustness (empty circles). This corre-
sponds to πH ∼ 1. Right—genotypes with high environmental
robustness tend not to neighbor other genotypes of the same
type. This corresponds to πH ∼ 0. When genotypes of the high-
robustness type tend to neighbor each other, the population can
spread to many different genotypes and the degree of genetic
diversity in the population increases.
capacity of a population to adapt. We will also compare our ana-
lytic approximation for the mean adaptation time to exact Monte
Carlo simulations of the Moran process. Simulations are carried
out with populations of N = 10,000 individuals. An individual is
chosen to reproduce with a probability determined by its fitness
relative the population as a whole. The chosen individual produces
a viable offspring provided the offspring does not suffer a delete-
rious mutation or a deleterious environmental perturbation. Muta-
tions occur at rate μ = 10−3, across the entire genome. A mutation
will change the offspring’s genotype, phenotypic neighborhood,
and environmental robustness as described above (see Fig. 2). The
offspring produced in such a reproduction event replaces an in-
dividual selected randomly from the population. Simulations are
stopped whenever an individual arises whose genotype encodes
the newly adaptive phenotype. The waiting time before such an
adaptation arises is averaged over 10,000 replicate simulations, to
produce the mean waiting time plotted in the figures below.
ResultsWe focus on the case in which the population has evolved for a
long time in response to selection for a given phenotype, and has
reached its equilibrium distribution on the neutral network prior
to the environmental shift. Since we are interested in the influ-
ence of environmental robustness on adaptation, we keep fixed
the population-scaled mutation rate, θ = Nμ, mutational robust-
ness, q , number of phenotypic neighbors, K , and total number
of alternative phenotypes, P; and we vary the other parameters:
the degree of environmental robustness, φH , φL , the clustering of
high- and low-robustness genotypes, πH , πL , the selective advan-
tage of the newly adaptive phenotype, s, and the probability that
an individual experiences environmental noise ε.
Prior to the environmental shift, approximately all nonadapt-
able individuals will have high robustness (i.e., X H = 1 and
X L = 0), since we have assumed high-robustness genotypes have
a selective advantage over low-robustness genotypes O(√
N ) (see
Supporting Information). Following the environmental shift, the
dynamics of the nonadaptable individuals are approximated by
the ODE in equation (2). Substituting these values in equa-
tions (6)–(9), we see that the selection terms vary with the en-
vironmental robustness of the different genotypes, φH and φL ,
with the rate of environmental perturbations, ε, and with the
strength of selection for the newly adaptive type, s. However,
the mutational influx of adaptable genotypes depends only on
how genotypes of high robustness are distributed in the neutral
network, πH .
Our central question—how do opposing influences of envi-
ronmental robustness resolve to affect adaptation time?—is most
naturally addressed by considering how adaptation time varies
with the probability that an individual experiences an environ-
mental perturbation during development, ε. However, this rela-
tionship is complex, and its form depends on the distribution of
high-robustness genotypes, πH , the degree of environmental ro-
bustness of different genotypes, φH and φL , and the strength of
selection for the newly adaptive phenotype, s. Therefore, we be-
gin by considering the relationship between these parameters and
adaptation time, before considering the frequency of environmen-
tal perturbations.
DEPENDENCE OF ADAPTATION TIME ON THE
CLUSTERING OF ROBUST GENOTYPES
We begin by considering how the clustering of high-robustness
genotypes influences adaptation time. Varying πH from 0 to 1
will increase the clustering of high-robustness genotypes. When
πH ∼ 1, the neutral neighbors of high-robustness genotypes are
almost always other high-robustness genotypes; whereas when
πH ∼ 0, the neutral neighbors of high-robustness genotypes are
almost always low-robustness genotypes (Fig. 3).
There are two distinct selective regimes that correspond to
qualitatively different ways in which adaptation time varies with
πH . When 1+sK < 1, adaptable genotypes with high robustness
are selected for more strongly than adaptable genotypes with low
robustness (i.e., σH > σL ), and adaptation time decreases as πH
increases (Fig. 4 ). In contrast, when 1+sK > 1, adaptable genotypes
with low robustness are selected for more strongly than adaptable
genotypes with high robustness (σH < σL ), and adaptation time
increases as πH increases (Fig. 4).
The first of these two regimes, 1+sK < 1, is more realistic be-
cause we expect the size of the phenotypic neighborhood, K , to
be much greater than 1 and the selective advantage, s, of the
newly adaptive phenotype to be less than 1, typically. In the
most realistic scenario, therefore, adaptation time will decrease
EVOLUTION MAY 2012 1 6 0 5

ALEXANDER J. STEWART ET AL.
Figure 4. Mean adaptation time as a function of the clustering
of high-robustness genotypes, πH . As πH increases, the proba-
bility that a high-robustness genotype neighbors another high-
robustness genotype increases (i.e., more clustering). When 1+sK <
1 (red line), this causes a decrease in the mean adaptation time of
the population. When 1+sK > 1 (blue line), this causes a increase in
mean adaptation time. Plots show populations of N = 10,000 indi-
viduals, with μ = 0.001, ε = 0.1, P = 100, K = 5, q = 0.5, φH = 0.9,
and φL = 0.1 with s = 1 (red line) and s = 5 (blue line). Lines indi-
cate the analytic solution to our model, whereas dots indicate the
means of 10,000 replicate Monte Carlo simulations.
with increasing πH —that is, it takes longer for the population
to adapt when high-robustness genotypes are not clustered. The
intuition underlying this result is simple. Prior to the environ-
mental shift, high-robustness genotypes are always selectively
favored (because environmental perturbations are always dele-
terious). At the same time, after the environmental shift, high-
robustness adaptable genotypes are more selectively favored than
low-robustness adaptable genotypes, that is, σH > σL in equa-
tions 8–9. The more tightly clustered high-robustness genotypes
are (i.e., the larger πH ), the more often neutral mutations to geno-
types of high robustness will produce other genotypes of high
robustness. As a result, there is more standing neutral genetic
variation in the population prior to the environmental shift, be-
cause there are a greater number of distinct genotypes within
the class of high environmental robustness. This in turn causes
adaptable genotypes to be produced at a higher rate after the envi-
ronmental shift, speeding adaptation. In contrast, if 1+sK > 1, low-
robustness adaptable genotypes are selectively favored over high-
robustness adaptable genotypes, that is, σH < σL in equations
(8)–(9). Therefore, increasing the clustering of high-robustness
genotypes increases the neutral genetic variation in the popula-
tion prior to the environmental shift, but decreases the rate at
which advantageous adaptable genotypes are produced after the
environmental shift. These two effects oppose each other, and we
find that the overall effect is to slow adaptation. The adaptive dy-
namics in these differing regimes can be illustrated through time
series plots of the frequency of high- and low-robustness adapt-
able genotypes in the different selective regimes (see Supporting
Information).
Here, we have focused on the distribution of high-robustness
genotypes, πH , assuming that the clustering of low-robustness
genotypes, πL , remains fixed. Varying the clustering of low-
robustness genotypes does not affect adaptation time if, as we
have assumed, the population is at equilibrium prior to the envi-
ronmental shift (eqs. 6 and 7).
DEPENDENCE OF ADAPTATION TIME ON THE
STRENGTH OF ENVIRONMENTAL ROBUSTNESS
We now consider how variation in the strength of environmen-
tal robustness (parameters φH and φL ) affects adaptation time.
As Figure 5 shows adaptation time always increases with in-
creasing φH (i.e., when the robustness of the high-robust type is
increased, adaptation is slower). There are two distinct reasons for
this, associated with the selection terms in equation (8) and equa-
tion (9). First, as φH increases, the (postshift) selection term for
high-robustness adaptable genotypes decreases (this can be seen
directly from eq. 8, setting X H = 1 and X L = 0, but it is also
intuitive: as φH increases, the chance that a high-robust genotype
expresses the adaptive phenotype decreases), so that the popu-
lation is less likely to flow toward these adaptable genotypes,
which slows adaptation. Second, as φH increases, the selective
term for low-robustness adaptable genotypes also decreases (this
can be seen directly from eq. 9, with X H = 1 and X L = 0 but
it is also intuitive: as φH increases, the selective disadvantage of
a low-robustness genotype compared to the rest of the popula-
tion becomes greater), which again retards flow toward adaptable
genotypes and slows adaptation.
Varying the environmental robustness of low-robustness
genotypes, φL , has a more complex effect on adaptation time.
Increasing φL has no effect on the selective advantage of high-
robustness adaptable genotypes. However, it has conflicting
effects on the selective advantage of low-robustness adaptable
genotypes (as seen in eq. 9). On the one hand, increasing φL de-
creases the probability that an environmental perturbation on a
low-robustness adaptable genotype will produce the newly adap-
tive phenotype. However, increasing φL also reduces the probabil-
ity that an environmental perturbation on a low-robustness adapt-
able genotype will produce a deleterious phenotype. Whether
the overall selection term σL is increasing or decreasing with
φL therefore depends on how advantageous it is to produce the
newly adaptive phenotype. This depends on the ratio 1+sK . When
1+sK < 1, the selection term σL for the low-robustness adaptable
genotypes increases as φL increases (eq. 9); as a result, adapta-
tion time decreases as φL increases. When 1+sK > 1, the selection
term for the low-robustness adaptable genotypes decreases as φL
1 6 0 6 EVOLUTION MAY 2012
ENVIRONMENTAL ROBUSTNESS AND THE ADAPTABILITY OF POPULATIONS
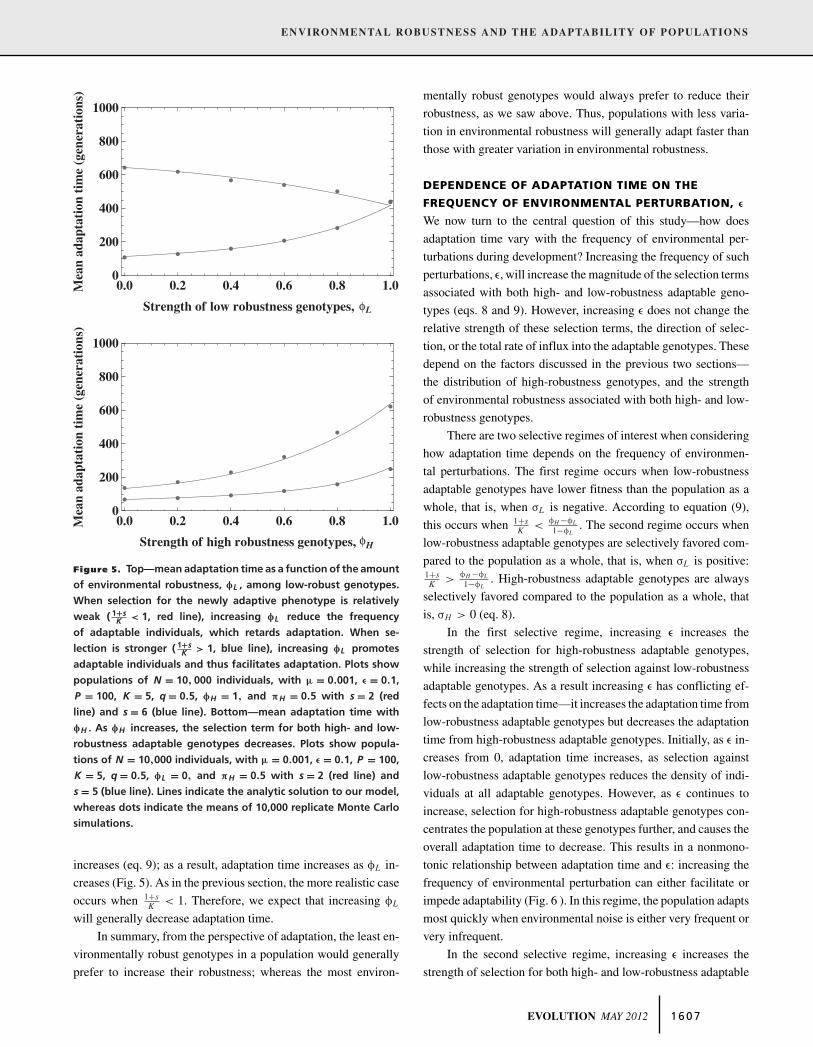
Figure 5. Top—mean adaptation time as a function of the amount
of environmental robustness, φL , among low-robust genotypes.
When selection for the newly adaptive phenotype is relatively
weak ( 1+sK < 1, red line), increasing φL reduce the frequency
of adaptable individuals, which retards adaptation. When se-
lection is stronger ( 1+sK > 1, blue line), increasing φL promotes
adaptable individuals and thus facilitates adaptation. Plots show
populations of N = 10, 000 individuals, with μ = 0.001, ε = 0.1,
P = 100, K = 5, q = 0.5, φH = 1, and πH = 0.5 with s = 2 (red
line) and s = 6 (blue line). Bottom—mean adaptation time with
φH . As φH increases, the selection term for both high- and low-
robustness adaptable genotypes decreases. Plots show popula-
tions of N = 10,000 individuals, with μ = 0.001, ε = 0.1, P = 100,
K = 5, q = 0.5, φL = 0, and πH = 0.5 with s = 2 (red line) and
s = 5 (blue line). Lines indicate the analytic solution to our model,
whereas dots indicate the means of 10,000 replicate Monte Carlo
simulations.
increases (eq. 9); as a result, adaptation time increases as φL in-
creases (Fig. 5). As in the previous section, the more realistic case
occurs when 1+sK < 1. Therefore, we expect that increasing φL
will generally decrease adaptation time.
In summary, from the perspective of adaptation, the least en-
vironmentally robust genotypes in a population would generally
prefer to increase their robustness; whereas the most environ-
mentally robust genotypes would always prefer to reduce their
robustness, as we saw above. Thus, populations with less varia-
tion in environmental robustness will generally adapt faster than
those with greater variation in environmental robustness.
DEPENDENCE OF ADAPTATION TIME ON THE
FREQUENCY OF ENVIRONMENTAL PERTURBATION, ε
We now turn to the central question of this study—how does
adaptation time vary with the frequency of environmental per-
turbations during development? Increasing the frequency of such
perturbations, ε, will increase the magnitude of the selection terms
associated with both high- and low-robustness adaptable geno-
types (eqs. 8 and 9). However, increasing ε does not change the
relative strength of these selection terms, the direction of selec-
tion, or the total rate of influx into the adaptable genotypes. These
depend on the factors discussed in the previous two sections—
the distribution of high-robustness genotypes, and the strength
of environmental robustness associated with both high- and low-
robustness genotypes.
There are two selective regimes of interest when considering
how adaptation time depends on the frequency of environmen-
tal perturbations. The first regime occurs when low-robustness
adaptable genotypes have lower fitness than the population as a
whole, that is, when σL is negative. According to equation (9),
this occurs when 1+sK <
φH −φL
1−φL. The second regime occurs when
low-robustness adaptable genotypes are selectively favored com-
pared to the population as a whole, that is, when σL is positive:1+sK >
φH −φL
1−φL. High-robustness adaptable genotypes are always
selectively favored compared to the population as a whole, that
is, σH > 0 (eq. 8).
In the first selective regime, increasing ε increases the
strength of selection for high-robustness adaptable genotypes,
while increasing the strength of selection against low-robustness
adaptable genotypes. As a result increasing ε has conflicting ef-
fects on the adaptation time—it increases the adaptation time from
low-robustness adaptable genotypes but decreases the adaptation
time from high-robustness adaptable genotypes. Initially, as ε in-
creases from 0, adaptation time increases, as selection against
low-robustness adaptable genotypes reduces the density of indi-
viduals at all adaptable genotypes. However, as ε continues to
increase, selection for high-robustness adaptable genotypes con-
centrates the population at these genotypes further, and causes the
overall adaptation time to decrease. This results in a nonmono-
tonic relationship between adaptation time and ε: increasing the
frequency of environmental perturbation can either facilitate or
impede adaptability (Fig. 6 ). In this regime, the population adapts
most quickly when environmental noise is either very frequent or
very infrequent.
In the second selective regime, increasing ε increases the
strength of selection for both high- and low-robustness adaptable
EVOLUTION MAY 2012 1 6 0 7

ALEXANDER J. STEWART ET AL.
Figure 6. Mean adaptation time as a function of the probability
of environmental perturbation, ε. When selection for the newly
adaptive phenotype is relatively strong ( 1+sK >
φH −φL1−φL
, blue line),
increasing amounts of environmental perturbation promotes all
types of adaptable genotypes, facilitating adaptation. When se-
lection is weaker ( 1+sK <
φH −φL1−φL
, red line) increasing ε has con-
trary effects on the low-robust and high-robust adaptable indi-
viduals; in this regime, the relationship between mean adapta-
tion time and probability of environmental perturbation is non-
monotonic (increasing and then decreasing). Plots show popula-
tions of N = 10,000 individuals, with μ = 0.001, P = 100, K = 5,
q = 0.5, φH = 0.9, φL = 0.1, and πH = 0.1 with s = 2 (red line) and
s = 5 (blue line). Lines indicate the analytic solution to our model,
whereas dots indicate the means of 10,000 replicate Monte Carlo
simulations.
genotypes, and it therefore always decreases adaptation time. In
this regime, more environmental noise always speeds adaptation.
In summary, when environmental fluctuations are rare
(ε ∼ 0), increasing their frequency can either impede or facilitate
adaptation depending on the strength of selection for the newly
adaptive phenotype. However, when environmental fluctuations
are common (ε ∼ 1), increasing their frequency will always speed
adaptation.
We have also studied how the clustering of high-robustness
genotypes influences the relationship between environmental per-
turbations and mean adaptation time (see Supporting Informa-
tion).
DEPENDENCE OF ADAPTATION TIME ON
MUTATIONAL ROBUSTNESS
We have also studied how environmental noise can influence the
relationship between mutational robustness and adaptability. Pre-
vious work has shown that, in the absence of environmental noise,
intermediate levels of mutational robustness produce the fastest
rates of adaptation (Wagner 2008; Draghi et al. 2010). We find that
the addition of environmental noise does not qualitatively change
the relationship between mutational robustness and adaptation
(see Supporting Information).
DiscussionThe expression of a phenotype is inherently noisy. As a result,
when a population experiences purifying selection, those geno-
types that express the optimal phenotype more reliably will be
selectively favored. This is the key insight behind Waddington’s
concept of environmental canalization, developed over half a cen-
tury ago (Waddington 1942, 1953a,b, 1959). Nevertheless, the
extent to which environmental robustness evolves in response to
noise, and how this phenomenon impacts evolution over longer
time scales, as the optimal phenotype itself changes, is not fully
understood.
When canalization fails, environmental noise elicits the ex-
pression of an alternative phenotype in an individual. The result-
ing phenotype is often then a phenocopy—that is, a phenotype
that mimics the effect of a mutation, but is not heritable. When a
population is faced with a new environment, the phenocopy phe-
nomenon may speed adaptation, because it allows some individu-
als to express adaptive phenotypes without waiting for mutations.
However, when a population is adapted to the current environ-
ment, environmental noise tends to concentrate the population on
the most robust genotypes, which will reduce genetic diversity
and the capacity for adaptation. We have sought to elucidate how
these two conflicting effects of environmental robustness resolve
in determining the adaptability of populations.
We have employed a general population-genetic model that
was previously used to study the interplay between mutational
robustness and adaptability (Draghi et al. 2010). Our model spec-
ifies a fitness landscape in terms of the properties of a neutral
network of genotypes. Whenever an individual develops an al-
ternative phenotype as a result of environmental perturbation, it
develops into one of the K phenotypes accessible by mutation;
this assumption encodes the concept of phenocopy in our model-
ing framework.
We have studied the relationship between environmental
noise and adaptation time—that is, the time required for a pop-
ulation, initially in equilibrium, to acquire a new target pheno-
type following an environmental shift. In our simplest model, the
adaptation time depends on several parameters: the frequency of
environmental perturbations (ε), the selective advantage of the
novel target phenotype (s), the levels of environmental robustness
among genotypes on the neutral network (φH and φL ), and the
clustering of genotypes with high environmental robustness (πH ).
The interplay of these parameters gives rise to a surprisingly rich
set of behaviors, which are summarized in Table 2.
The relationship between environmental and mutational ro-
bustness may be further complicated if both are allowed to vary
1 6 0 8 EVOLUTION MAY 2012

ENVIRONMENTAL ROBUSTNESS AND THE ADAPTABILITY OF POPULATIONS
Table 2. Summary of results.
Parameter varied Selective regime Mean adaptation time
High-robustness genotype clustering, πH1+sK < 1 Decreasing
High-robustness genotype clustering, πH1+sK ≥ 1 Increasing
Low-robustness genotype clustering, πL All ConstantHigh environmental robustness level, φH All IncreasingLow environmental robustness level, φL
1+sK < 1 Decreasing
Low environmental robustness level, φL1+sK ≥ 1 Increasing
Rate of environmental perturbation, ε 1+sK <
φH −φL
1−φLNonmonotonic (increasing then decreasing)
Rate of environmental perturbation, ε 1+sK ≥ φH −φL
1−φLDecreasing
Mutational robustness, q All Nonmonotonic (decreasing then increasing)
across the neutral network simultaneously. Our analysis has as-
sumed the simplest case—when environmental and mutational
robustness vary independently. Even in this simple case, we have
found a rich diversity of possible behaviors (Table 2). The as-
sumption of independence is partly supported by the few sys-
tematic empirical studies of mutational and environmental ro-
bustness. Such studies have found that polymorphisms affecting
mutational robustness map to different loci than those influencing
environmental robustness (Proulx et al. 2007; Fraser and Schadt
2010; Lehner 2010), suggesting that these traits may be largely
independent. Nonetheless, the impact of covariation in these two
types of robustness (Hermisson and Wagner 2004; Lehner 2010;
Meiklejohn and Hartl 2002; Proulx et al. 2007; Wagner et al.
1997) remains an important topic for future research.
It is interesting to contrast our results on environmental noise
with quantitative studies of the Baldwin effect, which also de-
scribe the genetic reinforcement of initially nonhereditary traits
(Ancel 1999, 2000). Whereas we have focused here on the ten-
sion between costs and benefits of randomly expressing an al-
ternative phenotype during development, studies of the Baldwin
effect have been concerned with the tension between the adaptive
advantage and inherent cost of phenotypic plasticity—that is, the
ability of an individual to express a range of phenotypes and to
deterministically choose among these the most fit phenotype in
the current environment. In other words, in our study, the pheno-
type expressed by an individual is subject to random perturbation,
whereas in studies of the Baldwin effect, the expressed pheno-
type is chosen deterministically: if an individual has the ability
to express the optimal phenotype with its range of alternatives,
it will. Models of the Baldwin effect have uncovered a complex
interplay between the rate at which the environment changes, the
degree of phenotypic plasticity in a population, and the rate of
adaptation (Ancel 1999, 2000). We have studied a different phe-
nomenon, but likewise found a complex relationship between the
amount of development noise and the rate of adaptation. Both
phenomena (phenotypic plasticity and environmental robustness)
highlight the complex relationship between environmentally in-
duced phenotypic variation and the capacity for a population to
adapt.
A phenomenon analogous to the Baldwin effect may occur
in our system if the newly adapted individual that first fixes in
the population has low robustness (analogous to high plasticity
in the models of [Ancel 1999, 2000]); whereas subsequent sta-
bilizing selection will then select for a high-robustness (adapted)
individual. This situation is more likely to occur in the regime
σL > σH .
In deriving our analytical results, we have relied on three
strong assumptions: a neutral mutation completely redraws an in-
dividual’s phenotypic neighborhood; the number of phenotypes,
K , in a genotype’s neighborhood does not vary across the neutral
network; and alternative phenotypes are generally lethal. Relaxing
each of these assumptions does not change our qualitative results
(see Supporting Information). In particular, we relax the first as-
sumption by introducing a parameter, f , which is the fraction of K
neighbors that are redrawn following a neutral mutation. Allowing
such correlations between the phenotypic neighborhoods of neu-
tral neighbors affects the rate at which individuals arrive at adapt-
able genotypes through mutation, but it preserves the qualitative
relationships between adaptability and environmental robustness
reported above. Our qualitative results are also unchanged if the
size of the phenotypic neighborhood, K , varies with genotype.
In this case, however, the selective regimes described in Table 2
now depend on the average value of 1+sK . Finally, our qualitative
results are unaltered if alternative phenotypes are moderately dele-
terious rather than lethal; however, the different selective regimes
described in Table 2 would then depend on s, K , and the size
of the fitness penalty suffered by nonadaptive alternative pheno-
types (see Supporting Information). We have limited our analysis
to the regime in which the newly adaptive type is always favored
over the initially fit phenotype, regardless of its environmental
robustness. However, it is possible to imagine scenarios in which
s is sufficiently small that newly adaptive genotypes with low
robustness are deleterious compared to high-robustness individu-
als of the initially fit phenotype. This situation will occur when s
EVOLUTION MAY 2012 1 6 0 9

ALEXANDER J. STEWART ET AL.
is O(ε) or smaller (see Supporting Information). To study adapt-
ability in this case, we must determine the waiting time until
a newly adaptive individual with high robustness is produced.
However, the qualitative relationships we observe in this case
are the same as those described in the main text (see Supporting
Information).
In this article, we have considered adaptation to a single en-
vironmental shift. It would also be interesting to study repeated
environmental shifts. To do so will require analyzing the adapta-
tion time of a population which is not at equilibrium on its neutral
network when the next environmental shift occurs. Accounting
for such repeated transient dynamics should be possible in our
modeling framework, but it will certainly be nontrivial. The rela-
tionship between the rate of environmental shifts and the evolution
of the environmental robustness thus remains an interesting area
for future research.
Our modeling framework has allowed for substantial varia-
tion in robustness among a large set of genotypes. This framework
is appropriate if many sites across an organism’s genome can in-
dependently influence its robustness, such as might be expected
if networks of interacting genes jointly determine an organism’s
phenotype. In fact, the widespread contribution of many genomic
sites to robustness has been directly observed in organisms rang-
ing from yeast to plants and vertebrates (Fraser and Schadt 2010).
The framework for our study is therefore rather different from
models restricted to a specific locus (such as the HSP90 locus or a
DNA repair locus) that alone determines variation in robustness.
Despite longstanding interest in phenotypic robustness, the
role of robustness in adaptation remains a topic of active investi-
gation. In contrast to most theoretical work, which has focused on
how mutational robustness influences adaptation (de Visser et al.
2003; Lenski et al. 2006; Wagner 2008; Draghi et al. 2010), this
study provides a framework for analyzing the effects of environ-
mental robustness. Although we have uncovered a complex set of
possible behaviors (summarized in Table 2), one important gen-
eral observation emerges: environmental perturbations can either
facilitate or impede adaptation. These results have been derived
in a general theoretical framework, and so they should apply to
abroad range of biological situations and systems.
Theoretical studies of environmental robustness must even-
tually be reconciled with empirical data, either from surveys of
standing variation or, ideally, from evolution experiments. Fortu-
nately, there is an extensive literature based on quantitative ge-
netics that describes empirical patterns of environmental robust-
ness in organisms, including yeast, plants, and mammals (Mackay
and Lyman 2005; Hall et al. 2007; Nogami et al. 2007; Sangster
et al. 2008; Fraser and Schadt 2010). Such studies typically find
a broad array of traits (morphological, life-history, and gene ex-
pression levels) that are buffered against environmental noise and,
furthermore, extensive standing genetic variation in the degree of
such buffering among individuals. Thus, environmental robust-
ness is apparently selected for in many natural populations, in
accordance with theoretical expectations for a population under
stabilizing selection for a target phenotype (Wagner et al. 1997;
Hermisson and Wagner 2004); but a natural population typically
also contains variation in the degree of environmental robustness
among genotypes. Our analysis suggests that the existence of ro-
bust variants in a population, and also the variation in robustness
among individuals, will have a significant impact on the popula-
tion’s capacity to adapt to a novel environment. Thus, the concept
of canalization, first considered by Waddington for populations
under stabilizing selection, plays an important role in shaping the
evolution of populations as they adapt to new environments over
longer timescales.
ACKNOWLEDGMENTSWe thank members of the Plotkin lab for constructive comments and input.JBP acknowledges support from the James S. McDonnell Foundation, theAlfred P. Sloan Foundation, the David and Lucille Packard Foundation,the Burroughs Wellcome Fund, Defense Advanced Research ProjectsAgency (HR0011-05-1-0057), and the US National Institute of Allergyand Infectious Diseases (2U54AI057168).
LITERATURE CITEDAncel, L. W. 1999. A quantitative model of the Simpson-Baldwin effect. J.
Theor. Biol. 196:197–209.———. 2000. Undermining the Baldwin expediting effect: does phenotypic
plasticity accelerate evolution? Theor. Popul. Biol. 58: 307–319.Ancel, L. W., and W. Fontana. 2000. Plasticity, evolvability, and modularity
in rna. J. Exp. Zool. 288: 242–283.Bloom, J., S. Labthavikul, C. Otey, and F. Arnold. 2006. Protein stability
promotes evolvability. PNAS 103: 5869–5874.Chow, K., and K. Chan. 1999. Stress-induced phenocopy of C. elegans de-
fines functional steps of sensory organ differentiation. Develop. Growth.Differ.41: 629–637.
Draghi, J., T. Parsons, G. Wagner, and J. Plotkin. 2010. Mutational robustnesscan facilitate adaptation. Nature 436: 353–355.
Earl, D., and M. Deem. 2004. Evolvability is a selectable trait. PNAS 101:11531–11536.
Ewens, W. J. 2004. Mathematical population genetics, vol. v. 27.2nd ed. Springer, New York. Available at http://www.loc.gov/catdir/enhancements/fy0818/2003065728-d.html.
Fraser, H., and E. Schadt. 2010. The quantitative genetics of phenotypicrobustness. PLoS ONE 5: e8635.
Gardiner, C. W. 2004. Handbook of stochastic methods for physics, chemistry,and the natural sciences. 3rd ed. Springer, Berlin. Available at http://www.loc.gov/catdir/enhancements/fy0818/2004043676-d.html.
Gibson, G., and I. Dworkin. 2004. Uncovering cryptic genetic variation. Nat.Rev. Genet. 5: 681–690.
Goldschmidt, R. 1935. Gen und aussencharakter. Biologisches Zentralblatt55: 535–554.
Goldsmith, M., and D. Tawkik. 2009. Potential role of phenotypic mutationsin the evolution of protein expression and stability. PNAS 106: 6197–6202.
Hall, M. C., I. Dworkin, M. C. Ungerer, and M. Purugganan. 2007. Geneticsof microenvironmental canalization in Arabidopsis thaliana. Proc. Natl.Acad. Sci. USA 104: 13717–13722.
1 6 1 0 EVOLUTION MAY 2012

ENVIRONMENTAL ROBUSTNESS AND THE ADAPTABILITY OF POPULATIONS
Hermisson, J., and G. P. Wagner. 2004. The population genetic theory ofhidden variation and genetic robustness. Genetics 168: 2271–2284.
Jarosz, D. F., and S. Lindquist. 2010. Hsp90 and environmental stress trans-form the adaptive value of natural genetic variation. Science 330: 1820–1824.
Lehner, B. 2010. Genes confer similar robustness to environmental, stochastic,and genetic perturbations in yeast. PLoS ONE 5: e9035.
Lenski, R., J. Barrick, and C. Ofria. 2006. Balancing robustness and evolv-ability. PLoS Biol. 4: e428.
Levy, S. F., and M. L. Siegal. 2008. Network hubs buffer environmentalvariation in Saccharomyces cerevisiae. PLoS Biol. 6: e264.
Lopez-Maury, L., S. Marguerat, and J. Bahler. 2008. Tuning gene expression tochanging environments: from rapid responses to evolutionary adaptation.Nat. Rev. Genet. 9: 583–593.
Mackay, T. F., and R. F. Lyman. 2005. Drosophila bristles and the natureof quantitative genetic variation. Philos. Trans. R. Soc. Lond. B 360:1513–1527.
Masel, J. 2005. Evolutionary capacitance may be favored by natural selection.Genetics 170: 1359–1371.
Masel, J., and A. Bergman. 2003. The evolution of the evolvability propertiesof the yeast prion [psi+]. Evolution 57: 1498–1512.
Masel, J., and M. Trotter. 2010. Robustness and evolvability. Trends Genet.26: 406–414.
McLoughlin, S., and S. Copley. 2008. A compromise required by gene sharingenables survival: implications for evolution of new enzyme activities.PNAS 105: 13497–13502.
Meiklejohn, C. D., and D. L. Hartl. 2002. A single mode of canalization.Trends Ecol. Evol. 17: 468–473.
Meyerovich, M., G. Mamou, and S. Ben-Yehuda. 2010. Visualizing higherror levels during gene expression in living bacterial cells. PNAS 107:11543–11548.
Meyers, L., F. Ance, and M. Lachmann. 2005. Evolution of genetic potential.PLoS Comput. Biol. 1: e32.
van Nimwegen, E., J. P. Crutchfield, and M. Huynen. 1999. Neutral evolutionof mutational robustness. PNAS 96: 9716–9720.
Nogami, S., Y. Ohya, and G. Yvert. 2007. Genetic complexity and quantitativetrait loci mapping of yeast morphological traits. PLoS Genet. 3: e31.
Proulx, S., S. Nuzhdin, and D. Promislow. 2007. Direct selection on geneticrobustness revealed in the yeast transcriptome. PLoS ONE 2: e911.
Raj, A., and A. van Oudenaarden. 2008. Nature, nurture, or chance: stochasticgene expression and its consequences. Cell 135: 216–226.
Rutherford, S. 2003. Between genotype and phenotype: protein chaperonesand evolvability. Nat. Rev. Genet. 4: 263–274.
Rutherford, S., and S. Lindquist. 1998. Hsp90 as a capacitor for morphologicalevolution. Nature 396: 336–342.
Sangster, T. A., S. Lindquist, and C. Queitsch. 2004. Under cover: causes,effects and implications of hsp90-mediated genetic capacitance. BioEs-says 26: 348–362.
Sangster, T. A., N. Salathia, S. Undurraga, R. Milo, K. Schellenberg,S. Lindquist, and C. Queitsch. 2008. Hsp90 affects the expression ofgenetic variation and developmental stability in quantitative traits. Proc.Natl. Acad. Sci. USA 105: 2963–2968.
Siegal, M. L., and A. Bergman. 2002. Waddington’s canalization re-visited: developmental stability and evolution. PNAS 99: 10528–10532.
Tawkik, D. 2010. Messy biology and the origins of evolutionary innovations.Nat. Chem. Biol. 6: 692–696.
de Visser, J. A., J. Hermisson, G. P. Wagner, L. Ancel Meyers, H. Bagheri-Chaichian, J. L. Blanchard, L. Chao, J. M. Cheverud, S. F. Elena, W.Fontana, et al. 2003. Perspective: Evolution and detection of geneticrobustness. Evolution 57: 1959–1972.
Waddington, C. 1942. Canalization of development and the inheritance ofacquired characteristics. Nature 150: 563–565.
Waddington, C. 1953a. The Baldwin effect, genetic assimilation and home-ostasis. Evolution 7: 386–387.
Waddington, C. 1953b. Genetic assimilation of an acquired character. Evolu-tion 7: 118–126.
———. 1959 Evolutionary systems—animal and human. Nature 183:1634–1638.
Wagner, A. 2008. Robustness and evolvability: a paradox resolved. Proc. R.Soc. Lond. B 275: 91–100.
Wagner, A., and J. Wright. 2007. Alternative routes and mutationalrobustness in complex regulatory networks. Biosystems 88: 163–172.
Wagner, G. P., G. Booth, and H. Bagheri-Chaichian. 1997. A populationgenetic theory of canalization. Evolution 51:329–347.
Associate Editor: Max Reuter
EVOLUTION MAY 2012 1 6 1 1

ALEXANDER J. STEWART ET AL.
Supporting InformationThe following supporting information is available for this article:
Figure S1. Correlated phenotypic neighbourhood—Mean adaptation time as a function of the probability of environmental
perturbation, ε.
Figure S2. Variation in size of phenotypic neighbourhood—plots show populations of N = 10,000 individuals, with μ = 0.001,
P = 100, K̄ = 5, q = 0.5, φH = 0.9, φL = 0.1 and πH = 0.5 with s = 2 (red line) and s = 8 (blue line).
Figure S3. Nonlethal deleterious mutations—plots show populations of N = 10,000 individuals, with μ = 0.001, P = 100, K =10, q = 0.2, φH = 0.9, φL = 0.1 and πH = 0.5, d = 0.2 with s = 0.5 (red line) and s = 3 (blue line).
Figure S4. Deleterious low robustness adaptive genotype—plots show populations of N = 10,000 individuals, with μ = 0.001,
P = 100, K = 5, q = 0.5 and s = 0.05.
Figure S5. Mean adaptation time as a function of the probability of environmental perturbation, ε, in the regime 1+sK <
φH −φL
1−φL.
Figure S6.The mean adaptation time as a function of mutational robustness, q.
Figure S7. Most realistic selective regime with s/K = 0.2, πH = 0.5 and πL = 0.5.
Figure S8. Less realistic selective regime with s/K = 1.2, πH = 0.5 and πL = 0.5.
Figure S9. Most realistic selective regime with s/K = 0.2, πH = 0.5 and πL = 0.1.
Table S1. Model parameters.
Supporting Information may be found in the online version of this article.
Please note: Wiley-Blackwell is not responsible for the content or functionality of any supporting information supplied by the
authors. Any queries (other than missing material) should be directed to the corresponding author for the article.
1 6 1 2 EVOLUTION MAY 2012

Environmental robustness and the adaptability of
populations: Supporting Information
Alexander J. Stewart12, Todd L. Parsons1, Joshua B. Plotkin1
November 9, 2011
1Department of Biology, University of Pennsylvania, Philadelphia, PA, USA2CoMPLEX, University College London, Physics Building, Gower Street, London WC1E 6BT,
UK

1 Analytical results
In this section we discuss in detail how adaptation time is related to environmental robustness
by considering the full population dynamics and distribution of adaptation times for the
general model presented in the main text.
1.1 Model Description
We focus on the general model, described in the main text, consisting of a population of N
individuals evolving under the infinite alleles Moran model. Genotypes which belong to the
neutral network, are indexed by a set I of which a subset A ⊂ I are adaptable, meaning that
they are a single mutation away from a genotype which has a selective advantage once an
environmental shift occurs. We assume that at the time of the environmental shift individuals
with an adaptable genotype are rare, meaning that the number of adaptable individuals is
O
�√N
�or smaller. The less realistic case in which adaptable individuals are common is
analyzed in Supplementary Information.
Following Draghi et al. (2010) we adopt the concept of phenotypic neighbourhoods. A
mutation at genotype i is neutral with probability qi and results in a genotype which codes for
a new phenotype with probability 1−qi. When a mutation is non-neutral, the new phenotype
which results is drawn from K alternative phenotypes, which constitute the phenotypic
neighbourhood of the original genotype. TheK phenotypes of the phenotypic neighbourhood
are drawn uniformly form a total P possible alternatives. All alternative phenotypes are
assumed to be lethal prior to the environmental shift. Following the environmental shift
we assume that an alternative phenotype gains a selective advantage, and we calculate the
expected time for the population to produce an individual with such a genotype.
1

We also extend the concept of phenotypic neighbourhoods to describe the effects of
environmental perturbations on phenotypes. Environmental perturbations occur with rate �.
With probability φi an organism which experiences an environmental perturbation develops
the correct (target) phenotype, i. With probability 1− φi it develops the phenotype of one
of it’s K phenotypic neighbours. The parameter φi therefore measures the environmental
robustness of genotype i.
The per-genome mutation rate is µ and the genome length is L. We assume that all sites
mutate at the same rate so that mutations within the neutral network are described by the
adjacency matrix M which has entries mij = 1 if genotype i can mutate to genotype j, and
mij = 0 otherwise, with the mutational robustness qi of a genotype given by Eq. 1 in the
main text. In this section for notational convenience we define m̃ij =1Lmij.
In order to determine the adaptability of a population of the type described above we
study the continuous time Moran model in which all genotypes have the same death rate
and birth rates vary according to the fitness of the genotype. Therefore the birth rate of
an individual with genotype i is 1 + Si. If the number of individuals with genotype i is Zi,
the population dynamics of the Moran model are described by a continuous-time Markov
process with transitions
Zi(t)rij(Z(t))−−−−−−→ Zi(t+∆t) = Zi(t) + 1, Zj(t)
rij(Z(t))−−−−−−→ Zj(t+∆t) = Zj(t)− 1.
that occur at rate rij(Z(t)), for
rij(z)def=
�(1− µ)zi(1 + Si) + µ
�
k∈I
m̃kizk(1 + Sk)
��zj
N
�.
The first term describes the rate at which individuals with genotype i are born. The second
2

term describes the rate at which individuals of type j die. Individuals with genotype i are
born at a rate that depends on zi as well as on the strength of selection for that genotype, Si,
and the rate of mutation into and out of that genotype. Once an individual is born it replaces
an existing member of the population. The individual that is replaced is selected uniformly
at random from the existing individuals, and as a result the death rate of individuals with
genotype j is simply zj
N.
We note that alternative formulations of the Moran model, for example in which death
rates vary, or in the discrete time version in which the birth rates are normalised, will result
in the same limiting diffusions as those described below up to a rescaling of time (see e.g.
(Etheridge, 2011)). For the sake of improved clarity in what follows we will work with
transition rates which are described in terms of θ = Nµ and a rescaled selective coefficient
σi =√NSi, such that we have
rij(z) =
��1− θ
N
�zi
�1 +
σi√N
�+
θ
N
�
k∈I
m̃kizk
�1 +
σk√N
���zj
N
�
The notations adopted in what follows are summarised in Table 3 below:
[Table 1 about here.]
In order to recover the full population dynamics of the model we consider the infinitesimal
generator A of the continuous time stochastic process Z(t), which is given by (Ethier and
Kurtz, 2005)
(Af)(z) =�
i,j
rij(z) (f(z+ ei − ej)− f(z)) .
where ei is the unit vector in the direction of i.
3

1.2 Limit When Adaptable Types are Rare
Previous work (Draghi et al., 2010) showed that a closely related model to the one discussed
here has a diffusive limit when the number of adaptable individuals is O�√
N
�, while the
number of non-adaptable individuals is O (N), and time is rescaled by√N . To that end, we
consider the rescaled population Z̃i at each genotype i, where adaptable types are rescaled by
a factor√N and non-adaptable types are rescaled by a factor N . Since the rescaling differs
between adaptable and non-adaptable genotypes it is convenient to introduce the parameter
hi which tells us how a given genotype i is rescaled, i.e
Z̃i(t) = hiZi(t),
where
hi =
1√N
if i ∈ A
1N
otherwise.
We can now find the generator for the limiting process. Following (Ethier and Kurtz, 2005),
this is given by
limN→∞
AN
for
(ANf)(z̃) =�
i,j
√Nr̃ij(z̃) (f(z̃+ hiei − hjej)− f(z̃)) ,
where r̃ij(z̃) = rij
�(h−1
iz̃i)i∈I
�. Intuitively, rescaling time by
√N increases the rate of events
by the same factor, while increasing or decreasing Zi corresponds to changing Z̃i by ±hi.
Therefore, since hi is small in the large N limit, to find the limiting generator we Taylor
4

expand f(z̃+ hiei − hjej) about z̃ to obtain
(ANf)(z̃) =√N
��
i∈I
hi
�
j∈I
(r̃ij(z̃)− r̃ji(z̃))∂f
∂z̃i+
1
2
�
i∈I
h2i
�
j∈I
(r̃ij(z̃) + r̃ji(z̃))∂2f
∂z̃2i
−�
i �=j
hihj r̃ij(z̃)∂2f
∂z̃i∂z̃j+O
�N
− 32
��.
In what follows, we derive the advective terms; the other terms are derived in a similar
fashion.
To begin, we have
rij(z)− rji(z) =1
N32
�1− θ
N
�(σi − σj)zizj +
θ
N2
�
k∈I
(m̃kizj − m̃kjzi)zk
�1 +
σk√N
�
and, recalling�
j∈I zj = N ,
�
j∈I
(rij(z)−rji(z)) =1
N32
�
j∈I
�1− θ
N
�(σi−σj)zizj+
θ
N2
�
k∈I
�Nm̃ki − zi
�
j∈I
m̃kj
�zk
�1 +
σk√N
�
Thus,
√Nhi
�
j∈I
(r̃ij(z̃)− r̃ji(z̃)) =1
N
�
j∈I
h−1j
�1− θ
N
�(σi − σj)z̃iz̃j
+ hi
θ
N32
�
k∈I
h−1k
�Nm̃ki − h
−1iz̃i
�
j∈I
m̃kj
�z̃k
�1 +
σk√N
�
=1√N
�
j∈A
�1− θ
N
�(σi − σj)z̃iz̃j +
�
j �∈A
�1− θ
N
�(σi − σj)z̃iz̃j
+ θ
�
k∈A
�him̃ki −
1
Nz̃i
�
j∈I
m̃kj
�z̃k
�1 +
σk√N
�
+ θ
�
k �∈A
�√Nhim̃ki −
1√Nz̃i
�
j∈I
m̃kj
�z̃k
�1 +
σk√N
�.
5

If we now take the large population limit we find,
limN→∞
√Nhi
�
j∈I
(r̃ij(z̃)− r̃ji(z̃)) =
��j �∈A(σi − σj)z̃j
�z̃i + θ
�k �∈A m̃kiz̃k if i ∈ A
��j �∈A(σi − σj)z̃j
�z̃i otherwise.
Proceeding similarly,
limN→∞
√N
�
i∈I
h2i
�
j∈I
(r̃ij(z̃) + r̃ji(z̃)) =
2z̃i if i ∈ A
0 otherwise,
while
limN→∞
√N
�
i �=j
hihj r̃ij(z̃)∂2f
∂z̃i∂z̃j= 0.
Thus, the limiting process has generator
(Af)(z̃) =�
i �∈A
���
j �∈A
(σi − σj)z̃j
�z̃i
�∂f
∂z̃i
+�
i∈A
���
j �∈A
(σi − σj)z̃j
�z̃i + θ
�
k �∈A
m̃kiz̃k
�∂f
∂z̃i+ z̃i
∂2f
∂z̃2i
,
i.e. the limiting system may be decomposed into two components since the first sum describes
the dynamics of the non-adaptable genotypes (i /∈ A) and the second sum describes the
dynamics of the adaptable genotypes (i ∈ A). For readability, in what follows we distinguish
between the adaptable and non-adaptable types by defining
Z̃i =
Xi if i /∈ A
Yi if i ∈ A
Decomposing the limiting system into equations for the non-adaptable and adaptable types,
6

we have that the non-adaptable types correspond to the terms
�
i �∈A
���
j �∈A
(σi − σj)xj
�xi
�∂f
∂xi
This describes a system which evolves deterministically (i.e which has no stochastic compo-
nent), according to the dynamical system (see e.g. Gardiner (2004))
dXi
dt=
��
j �∈A
(σi − σj)Xj
�Xi,
which is Eq. 2 of the main text. However, the adaptable types correspond to
�
i∈A
���
j �∈A
(σi − σj)xj
�yi + θ
�
k �∈A
m̃kixk
�∂f
∂yi+ yi
∂2f
∂y2i
.
Therefore, given X(t), each adaptable type evolves according to an independent diffusion
processes, with non-autonomous rates dependent upon the non-adaptable types:
dYi =
���
j �∈A
(σi − σj)Xj
�Yi + θ
�
k �∈A
m̃kiXk
�dt+
�2YidBi(t),
for independent Brownian motions Bi(t), i ∈ A (Gardiner, 2004), which is Eq. ?? of the
main text.
1.3 The Waiting Time Distribution When Adaptable Types are
Rare
In the previous section we showed that the population at each adaptable genotype is de-
scribed by an independent diffusion process. We are interested in the time it takes for the
7

population to produce an individual with the newly adaptive genotype following an environ-
mental shift. Because adaptable genotypes evolve independently it suffices to consider the
waiting time problem for a single diffusion,
dY = (σY +M) dt+√2Y dB(t),
where for readability we omit the subscript i, and write σ =�
j �∈A(σi−σj)Xj for the selection
term and M = θ�
k �∈A m̃kiXk for the influx to each adaptable type. The first newly adaptive
genotype occurs when an individual at an adaptable genotype mutates to the newly adaptive
genotype. For a given adaptable genotype the waiting time T for the arrival of the first newly
adaptive mutant to arise is then given by the distribution
P {T > t} = E�e−ζV (t)
�,
where ζ is the rate at which the newly adaptive type is produced from an adaptable type
through mutation and V (t) is a stochastically varying rate function which depends on the
population at the adaptable genotype
V (t) =
�t
0
Y (s) ds (1)
We now make two observations:
1. While the process V (t) is not by itself Markovian, the pair (Y (t), V (t)) does satisfy the
Markov property. Now (1), is equivalent to the SDE dV (t) = Y (t) dt, so (Y (t), V (t))
8

satisfies the system of SDEs
dY = (σY +M) dt+√2Y dB(t),
dV = Y dt.
Thus, their joint density satisfies the Forward Kolmogorov Equation (Gardiner, 2004)
∂u
∂t= − ∂
∂y[(σy +M)u]− ∂
∂v[yu] +
∂2
∂y2[yu] (2)
with initial condition u(y, v, t) = δ(y0,0), the Dirac point mass at the single point (y0, 0).
2. If we set
φ(p, q, t)def= E
�e−pY (t)−qV (t)
�=
� ∞
0
� ∞
0
e−py−qv
u(y, v, t) dy dv,
which is the joint Laplace transform of Y (t) and V (t), we have
P {T > t} = φ(0, ζ, t).
Taking the Laplace transform of Eq. 10 yields
∂φ
∂t= (−p
2 + σp+ q)∂φ
∂p−Mpφ+ lim
y→0
�(σy +M)u− ∂
∂y[yu]− yu
�+ lim
v→0vu.
Now,
limy→0
(σy +M)u− ∂
∂y[yu]
9

is the flux, J(v, t) across the y = 0 boundary, which we assume to be 0 on biological grounds
(see Draghi et al. (2010) §1.2.2 for a more detailed discussion on boundary conditions), while
limy→0
yu = 0.
and
limv→0
vu = 0.
We are thus left with solving
∂φ
∂t+ (p2 − σp− q)
∂φ
∂p= −Mpφ,
which may be done via the method of characteristics. To that end, we solve
dp
p2 − σp− q= dt,
which, upon completing the square, p2 − σp− q =�p− σ
2
�2 −�q + σ
2
4
�, has solution
p(t) =2α(q)
1− Ce2α(q)t− α(q) +
σ
2(3)
where C is a constant of integration that identifies the characteristic curve and we have set
α(q) =
�����q +σ2
4
����.
Choosing the form for p(t) given in Eq. 11, we now set φ̃(t)def= φ(p(t), q, t), so that
dφ̃
dt= −Mp(t)φ̃.
10

This linear equation has solution
φ̃(t) = e−M
�t
0 p(τ) dτF (C),
for an arbitrary function F . Integrating Eq.11 yields
�t
0
p(τ) dτ = ln
����(1− C)e2α(q)t
1− Ce2α(q)t
����+�σ
2− α(q)
�t
We can now recover φ(p, q, t) by noting from Eq. 11 that
C =p− α(q)− σ
2
p+ α(q)− σ
2
e−2α(q)t
so that, after some simplification
φ(p, q, t) =
������
e2α(q)t − p−α(q)−σ
2p+α(q)−σ
2
2α(q)p+α(q)−σ
2
������
−M
e−M(σ
2−α(q))tF
�p− α(q)− σ
2
p+ α(q)− σ
2
e−2α(q)t
�
Lastly, to determine F , we observe that
φ(p, q, 0) =
� ∞
0
� ∞
0
e−py−qv
u(y, z, 0) dy dv
=
� ∞
0
� ∞
0
e−py−qv
δ(y0,0)(y, v) dy dv = e−py0 ,
so that
e−py0 = F
�p− α(q)− σ
2
p+ α(q)− σ
2
�
i.e.
F (x) = e−( 2α(q)
1−x+σ
2−α(q))y0
11

Thus,
φ(p, q, t) =
������
e2α(q)t − p−α(q)−σ
2p+α(q)−σ
2
2α(q)p+α(q)−σ
2
������
−M
e−M(σ
2−α(q))te
−
2α(q)
1−p−α(q)−σ
2p+α(q)−σ
2e−2α(q)t
+σ
2−α(q)
y0
In order to recover the desired waiting time distribution we must set p = 0 and q = ζ, which
yields
P {T > t} =
�����
�α(ζ)− σ
2
�eα(ζ)t +
�α(ζ) + σ
2
�e−α(ζ)t
2α(ζ)
�����
−M
e−M
σ
2 te
−
2α(ζ)
1+α(ζ)+σ
2α(ζ)−σ
2e−2α(ζ)t
+σ
2−α(ζ)
y0
(4)
Notice that taking σ = 0 and y0 = 0, we get
P {T > t} = sechM
��ζt
�,
which is, up to factors of two owing to the difference between Wright-Fisher and Moran
models, the result given in (Draghi et al., 2010).
Eq. 12 gives the waiting time distribution for a given adaptable genotype i to give
rise to an individual with the newly adaptive genotype. Since the population at each of
the different adaptable genotypes evolves according to an independent diffusion process, we
can calculate the waiting time distribution for each adaptable genotype independently, and
recover the expected waiting time for a full network of genotypes to give rise to the newly
adaptive genotype. This is calculated as follows: take P {Ti > t} to be the probability that
we wait for longer than t for a newly adaptive genotype to arise from adaptable genotype i.
Because these distributions are independent, the probability that we wait for longer than t
for a newly adaptive genotype to arise from any adaptable genotype is just the product over
the distributions, i.e.�
iP {Ti > t}. The mean waiting time, E [T ], for a newly adaptive
12
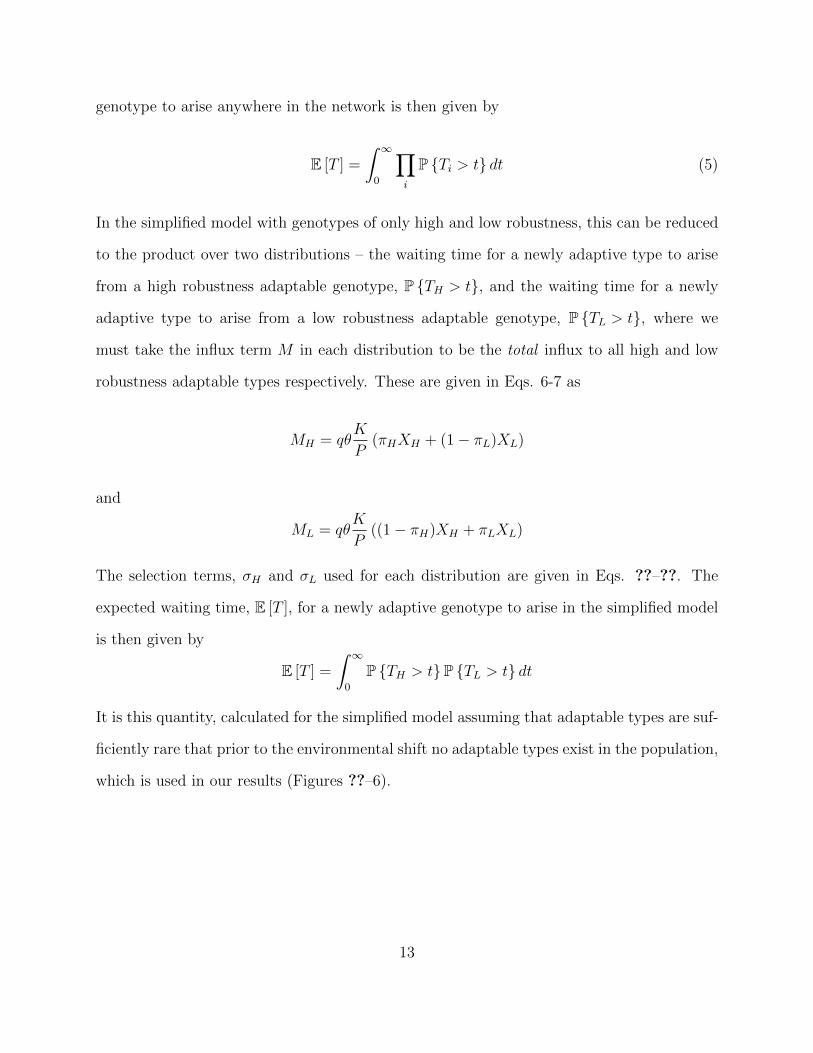
genotype to arise anywhere in the network is then given by
E [T ] =
� ∞
0
�
i
P {Ti > t} dt (5)
In the simplified model with genotypes of only high and low robustness, this can be reduced
to the product over two distributions – the waiting time for a newly adaptive type to arise
from a high robustness adaptable genotype, P {TH > t}, and the waiting time for a newly
adaptive type to arise from a low robustness adaptable genotype, P {TL > t}, where we
must take the influx term M in each distribution to be the total influx to all high and low
robustness adaptable types respectively. These are given in Eqs. 6-7 as
MH = qθK
P(πHXH + (1− πL)XL)
and
ML = qθK
P((1− πH)XH + πLXL)
The selection terms, σH and σL used for each distribution are given in Eqs. ??–??. The
expected waiting time, E [T ], for a newly adaptive genotype to arise in the simplified model
is then given by
E [T ] =
� ∞
0
P {TH > t}P {TL > t} dt
It is this quantity, calculated for the simplified model assuming that adaptable types are suf-
ficiently rare that prior to the environmental shift no adaptable types exist in the population,
which is used in our results (Figures ??–6).
13

1.4 Limit when adaptable individuals are common
In this section we determine the adaptation time when the numer of adaptable individuals
at the time of the environmental shift is O(N). In this case we say that the adaptable
individuals are “common”, compared to the case in which they are rare (i.e. O(√N)) as
described in the main text. We assume that a subset A� ⊆ A of the adaptable genotypes
are represned by O(N) individuals, so that Zi(t) = NZ̃i(t) for i ∈ A�, Zj(t) =√NZ̃j(t) for
j ∈ A−A�.
To investigate the first arrival of the advantageous type, we will consider the process stopped
when the first advantageous type arrives: we introduce a “graveyard” state ∆, and assume
that
ri,∆(z) = µmi,∆zi for i ∈ A,
r∆,i = 0 for all i ∈ I
i.e. we assume the process jumps to the graveyard state whenever some individual produces
an offspring of the selected type, whilst the process, once in the graveyard state, remains
there. This extended process has generator
�
i,j
rij(z) (f(z+ ei − ej)− f(z))−�
i∈A
ri,∆(z) (f(∆)− f(z)) .
Proceeding as before, we take
Z̃i(t) = hiZi(t),
14

where now
hi =
1√N
if i ∈ A−A�
1N
otherwise,
and time is left unscaled. Taking the limit as N → ∞, we find that the limiting generator is
�
i∈A�
θmi,∆z̃i (f(∆)− f(z̃)) .
Thus, the process reduces to a simple Markov jump process, in which after an exponentially
distributed time with rate�
i∈A�
θmi,∆z̃i,
the process jumps to the graveyard state, i.e. an individual of the advantageous type is
produced, while the frequencies of each type remain fixed at their initial values over this
timescale. Further, the rate at which advantageous offspring are produced from an individual
of type i ∈ A� is
θmi,∆z̃i,
from which we conclude that the probability that the first advantageous individual had a
parent of type i ∈ A is
P {type i} =
θmi,∆z̃i�j∈A� θmj,∆z̃j
if i ∈ A�
0 otherwise,
while
P {T ≥ t} = e−(
�i∈A� θmi,∆z̃i)t.
This expression gives the waiting time before arrival of an individual with the newly adaptive
genotype, in the case that (some) adaptable types are common at the time of the environ-
15

mental shift. In contrast to the case in which all adaptable types are rare, we see that the
waiting time in this case is exponentially distributed, and that the individual who gives rise
to the newly adaptive genotype aways comes from an adaptable genotype i ∈ A�, i.e. the
common subset of adaptable types at the time of the environmental shift. As a result, there
is a different relationship between between environmental robustness, rate of environmental
perturbations, etc. compared to the case case in which adaptable types are rare.
2 Relaxation of model assumptions
In this section we relax each of the main model assumptions used in the main text, and we
revise our analysis accordingly. We demonstrate that our qualitative results are unchanged
by relaxing these assumptions.
2.1 Mutation rates:
In our simulations we have chose a per-genome mutation rate of µ = 10−3. The reason for
this is as follows: for a non-synonymous substitution rate of 10−8, µ = 10−3 is equivalent to
a genome of 105 nucleotides. The rate of mutations that result in a newly adaptive genotype
is not µ = 10−3 but is µ(1− q)/K (see Fig 2 of the main text). In our simulations we have
typically picked K = 5 and q = 0.5 so that µ(1 − q)/K = 10−4. It corresponds to around
104 possible adaptive mutations (given our assumed per-nucleotide substitution rate). It
therefore corresponds to the case in which many genes are initially involved in adaptation.
Mutation rates between other genotype classes can be calculated in a similar way. Smaller
mutation rates between genotype classes can be achieved by choosing different values for
other parameters,. For example, taking K = 100 results in a rate of adaptive mutations
16

of ∼ 10−6. However doing this adds no new insight since we have catalogued the way the
adaptation time varies with all of our model parameters.
2.2 Correlated phenotypic neighbourhoods:
In the main text we assume that, following a mutation, the phenotypic neighbourhood of
the resulting individual is completely redrawn – that, the set of its K phenotypic neighbours
is drawn uniformally from the set of P alternatives. This results uncorrelated phenotypic
neighbourhoods amoung different genotypes. We relax this assumption by introducing a pa-
rameter f , which is the fraction of the K phenotypes in a individual’s phenotypic neighbour-
hood that are redrawn following mutation. When f = 1 we recover the case of completely
uncorrelated phenotypic neighbourhoods. When f = 0, all genotypes have the same pheno-
typic neighbourhood. Introducing f results in a modified mutation rate between adaptable
and non-adaptable types. Specifically, the rate of mutation from non-adaptable to adapt-
able types is µqfK
Pand from adaptable to non-adaptable types is µq
�1− f
K
P
�. All other
mutation rates and selective coefficients remain unchanged from those presented in the main
text. The effect of decreasing f is therefore identical to increasing P . Decreasing the rate
of influx to adaptable types tends to slow overall adaptation time, but it does not alter the
qualitative behaviour of the model described in the main text, which depends on the selective
coefficients. This is illustrated in Fig. S1 for the variation in adaptation time with rate of
environmental perturbations, �.
[Figure 1 about here.]
17

2.3 Variation in the size of phenotypic neighbourhoods with geno-
type:
Next we relax the assumption that all genotypes have exactly K phenotypic neighbours.
To do this we instead assign each of the P alternative phenotypes to the phenotypic neigh-
bourhood of a genotype with probability k, following mutation. The size of the phenotypic
neighbourhood, K, for a given genotype is therefore drawn from a binomial distribution
with mean K̄ = kP . Because phenotypic neighbourhood size varies with genotype, differ-
ent adaptable types have different selection coefficients. Adaptable types can therefore no
longer be simply separated into categories of high and low robustness. Instead they must be
separated into categories according to their environmental robustness φ and the size of their
phenotypic neighbourhood K. The selective coefficient for a high robustness genotype with
K phenotypic neighbours is given by
σH(K)√N
= �1 + s
K(1− φH) + � (φH − φL)XL (6)
and for low robustness genotypes with K phenotypic neighbours by
σL(K)√N
= �1 + s
K(1− φL)− � (φH − φL)XH . (7)
Let Y K
His the number of individuals, rescaled by
√N , at high robustness genotypes with K
phenotypic neighbours. When adaptable types are rare, the population at such genotypes
evolves according to
18

dYK
H=
�σH(K)Y K
H+G(K)qθ
K
P((1− πH)XH + πLXL)
�dt+
�2Y K
HdBH(t) (8)
Similarly, let Y K
Lis the number of individuals, rescaled by
√N , at low robustness genotypes
with K phenotypic neighbours. The population at these genotypes evolves according to
dYK
L=
�σL(K)Y K
L+G(K)qθ
K
P(πHXH + (1− πL)XL)
�dt+
�2Y K
LdBL(t) (9)
where G(K) is the probability that the genotype has K neighbours,
G(K) =
�P
K
�kK(1− k)P−K
�P
K=1
�P
K
�kK(1− k)P−K
Where we assume that all genotypes must have at least one phenotypic neighbour (i.eK ≥ 1).
Finally, the rate at which individuals with the newly adaptive genotype are produced thor-
ough mutation at adaptable genotypes with K phenotypic neighbours is µ1−q
K.
The full distribution of adaptation times from each adaptable type can be found (see Sup-
porting Information). Let P�TK
H> t
�be the waiting time distribution from high robustness
genotypes with K phenotypic neighbours, and P�TK
L> t
�be the waiting time distribution
from low robustness genotypes with K phenotypic neighbours. The expected waiting time
for an individual with the newly adaptive phenotype to arise is then
19

E [T ] =
� ∞
0
P�
K=1
P�T
K
H> t
�P�T
K
L> t
�dt.
Allowing K to vary does not change the set of qualitative behaviours described in the main
text. However it does change the parameter values for which those behaviours occur. This
is because the observed behaviours depend on whether low robustness adaptable types are
selectively favoured compared to the population prior to the environmental shift. This in
turn depends on the ratio s
K(see Table 2, main text). Because K is distributed across
a range of values, this tends to result in some low robustness genotypes being selectively
favoured and some disfavoured. Despite this, all the qualitative behaviours described in the
main text are still observed, as shown in Figure S2.
[Figure 2 about here.]
2.4 Inclusion of non-lethal deleterious mutations:
We now relax the assumption that all deleterious mutations are lethal, i.e that alternative
phenotypes have fitness 0. To do this we introduce four new classes of genotypes. Previously
we had classes
• A – High robustness and adaptable
• B – Low robustness and adaptable
• C – High robustness and non-adaptable
• D – Low robustness and non-adaptable
20
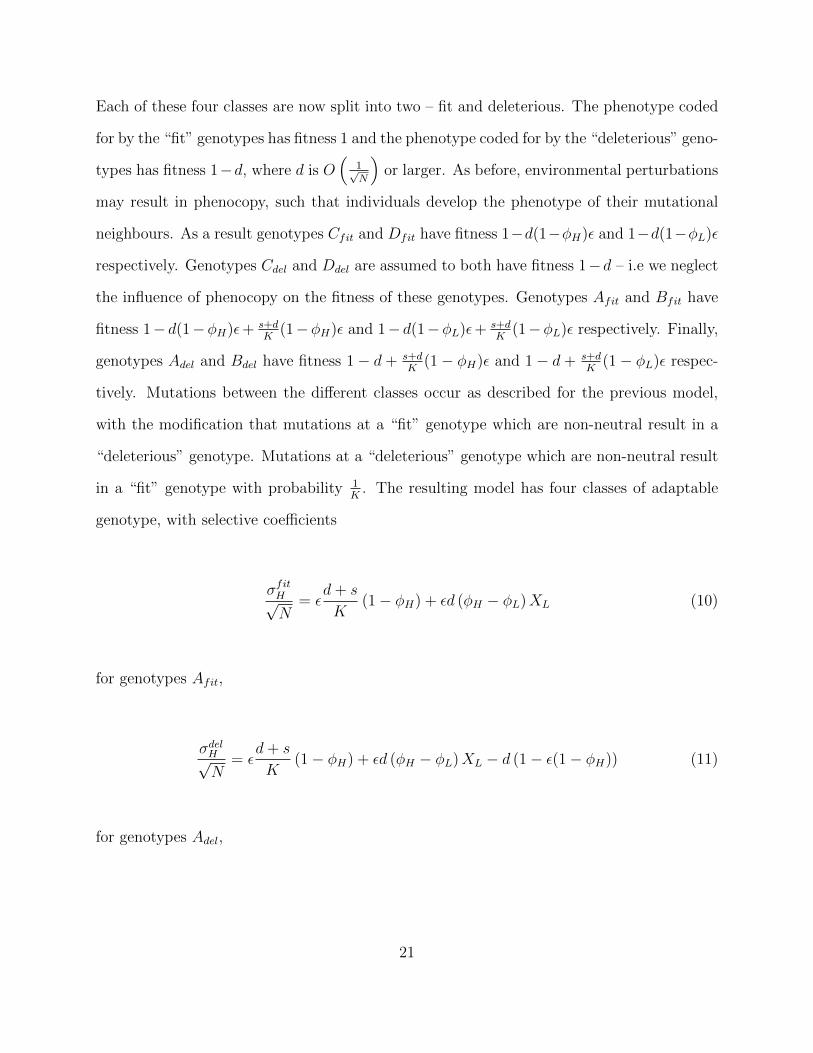
Each of these four classes are now split into two – fit and deleterious. The phenotype coded
for by the “fit” genotypes has fitness 1 and the phenotype coded for by the “deleterious” geno-
types has fitness 1−d, where d is O�
1√N
�or larger. As before, environmental perturbations
may result in phenocopy, such that individuals develop the phenotype of their mutational
neighbours. As a result genotypes Cfit and Dfit have fitness 1−d(1−φH)� and 1−d(1−φL)�
respectively. Genotypes Cdel and Ddel are assumed to both have fitness 1−d – i.e we neglect
the influence of phenocopy on the fitness of these genotypes. Genotypes Afit and Bfit have
fitness 1− d(1−φH)�+s+d
K(1−φH)� and 1− d(1−φL)�+
s+d
K(1−φL)� respectively. Finally,
genotypes Adel and Bdel have fitness 1− d+ s+d
K(1− φH)� and 1− d+ s+d
K(1− φL)� respec-
tively. Mutations between the different classes occur as described for the previous model,
with the modification that mutations at a “fit” genotype which are non-neutral result in a
“deleterious” genotype. Mutations at a “deleterious” genotype which are non-neutral result
in a “fit” genotype with probability 1K. The resulting model has four classes of adaptable
genotype, with selective coefficients
σfit
H√N
= �d+ s
K(1− φH) + �d (φH − φL)XL (10)
for genotypes Afit,
σdel
H√N
= �d+ s
K(1− φH) + �d (φH − φL)XL − d (1− �(1− φH)) (11)
for genotypes Adel,
21
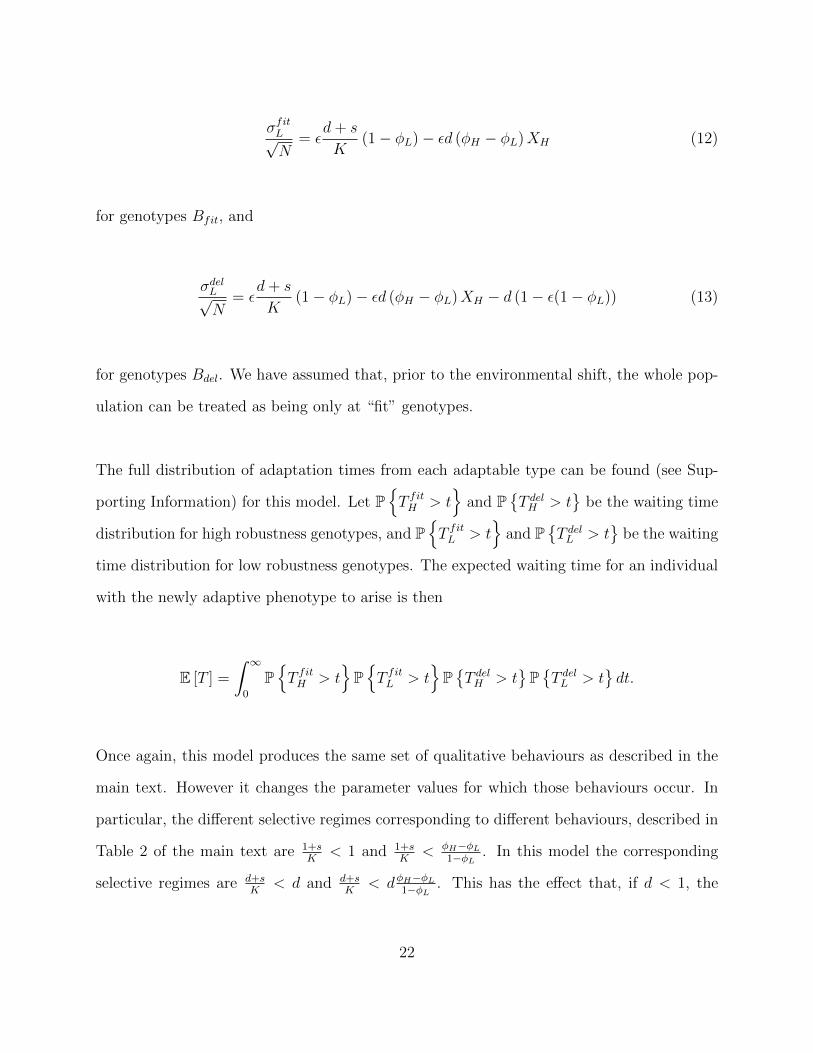
σfit
L√N
= �d+ s
K(1− φL)− �d (φH − φL)XH (12)
for genotypes Bfit, and
σdel
L√N
= �d+ s
K(1− φL)− �d (φH − φL)XH − d (1− �(1− φL)) (13)
for genotypes Bdel. We have assumed that, prior to the environmental shift, the whole pop-
ulation can be treated as being only at “fit” genotypes.
The full distribution of adaptation times from each adaptable type can be found (see Sup-
porting Information) for this model. Let P�T
fit
H> t
�and P
�T del
H> t
�be the waiting time
distribution for high robustness genotypes, and P�T
fit
L> t
�and P
�T del
L> t
�be the waiting
time distribution for low robustness genotypes. The expected waiting time for an individual
with the newly adaptive phenotype to arise is then
E [T ] =
� ∞
0
P�T
fit
H> t
�P�T
fit
L> t
�P�T
del
H> t
�P�T
del
L> t
�dt.
Once again, this model produces the same set of qualitative behaviours as described in the
main text. However it changes the parameter values for which those behaviours occur. In
particular, the different selective regimes corresponding to different behaviours, described in
Table 2 of the main text are 1+s
K< 1 and 1+s
K<
φH−φL
1−φL
. In this model the corresponding
selective regimes are d+s
K< d and d+s
K< d
φH−φL
1−φL
. This has the effect that, if d < 1, the
22

selective regime described as “unrealistic” in the main text, requiring large values of s, can
now occur for smaller values of s, making the full range of behaviours described in the main
text attainable under more realistic sets of parameters. The full range of behaviours of this
model are shown in Figure S3.
[Figure 3 about here.]
2.5 Adaptability when low robustness adaptive genotypes are se-
lected against:
Wemay also consider the case when newly adaptive genotypes with low robustness have lower
fitness than the mean population fitness. This occurs in the following scenario: Assume that
newly adaptive genotypes inherit the environmental robustness of the individual that gave
rise to them. Therefore high robustness adaptive genotypes have fitness (1 + s)(1 − (1 −
φH)�) +1K(1 − φH)� and low robustness adaptive genotypes have fitness (1 + s)(1 − (1 −
φL)�) +1K(1− φL)�. The mean fitness of the population at the environmental shift is simply
1− (1− φH)�, therefore low robustness adaptive genotypes are only selectively favoured if
(1 + s)(1− (1− φL)�) +1
K(1− φL)� > 1− (1− φH)�
i.e if
s >� ((φH − φL)K − (1− φL))
K(1− (1− φL)�)
otherwise they are selected against. When this is the case we consider that only high
23

robustness adaptive genotypes are truly adaptive, and calculate the waiting time until an
individual with this genotype arises. This is easy to do since low robustness adaptable geno-
types produce high robustness adaptive genotypes at rate (1−q)(1−πL)K
and high robustness
adaptable genotypes produce high robustness adaptive genotypes at rate (1−q)πH
K. We can
neglect the effect of low robustness adaptive genotypes mutating to produce high robustness
adaptive genotypes, since we assume that the population is initially at the non-adaptable
genotypes which cannot mutate directly to the newly adaptive genotypes. Using these modi-
fied mutation rates we determine the waiting time until a high robustness adaptive genotype
arises (assuming that s is sufficiently small that low robustness adaptive genotypes are se-
lected against). These waiting times are shown varying with the model parameters in Figure
S4 below. As can be seen the same qualitative behaviours as described for our model in the
regime 1+s
K< 1 are recovered in this case, with the addition that increasing low robustness
genotype clustering increases adaptation time (since it slows the rate of mutations from low
robustness adaptable genotypes to high robustness adaptive genotypes).
[Figure 4 about here.]
2.6 Other influences of clustering of high-robustness genotypes on
adaptation time:
We also examined how the clustering of high-robust genotypes influences the relationship
between environmental perturbations and mean adaptation time, in the regime 1+s
K<
φH−φL
1−φL
.
As described in the main text, in this regime increased clustering of high-robust genotypes
facilitates adaptation, regardless of the amount of environmental noise. In addition, Figure
5 shows that the position of the maximum adaptation time occurs at a lower value of �,
when genotypes are more clustered. In other words, clustering of robust genotypes broadens
24

the range over which increasing the frequency of environmental perturbation will facilitate
adaptation.
[Figure 5 about here.]
Dependence of adaptation time on mutational robustness:
We have also studied how environmental noise can influence the relationship between mu-
tational robustness and adaptability. Previous work has shown that, in the absence of
environmental noise, intermediate levels of mutational robustness produce the fastest rates
of adaptation (Draghi et al., 2010; Wagner, 2008). But how does adaptation time depend
on the amount of mutational robustness, q, when environmental noise is present?
We find that introducing environmental noise does not qualitatively change the way in
which adaptation time varies with mutational robustness: intermediate levels of mutational
robustness still produce the faster rates of adaptation. Nonetheless, environmental noise
does alter the quantitative aspects of this relationship (Figure 6), in two ways.
Firstly, noise can either increase or decrease overall adaptation time compared to the
case when environmental noise is absent. The direction of this effect depends on whether
adaptable individuals with low environmental robustness are selectively favored or disfavored,
that is whether 1+s
K>
φH−φL
1−φL
or 1+s
K<
φH−φL
1−φL
. As above, there is a simple intuition for
this behavior. In the first of these regimes, both types of adaptable individuals gain a
direct selective benefit in the presence of noise, speeding adaptation. In the second regime,
however, the population concentrates at genotypes with high environmental robustness, and
adaptation is generally slower (especially when noise is frequent).
25

Aside from changing the overall rate of adaptation, environmental noise also changes the
value of q that maximizes the rate of adaptation (Figure 6). That is, environmental noise
alters the level of genetic robustness that is optimal for rapid adaption.
[Figure 6 about here.]
Time series:
We plot time series data for the 4 different classes of genotype. Prior to the environmental
shift the population is in equilibrium (Fig. 7). After the environmental shift individuals
start to accumulate at adaptable genotypes due to phenocopy. Fig. 9 shows time series for
parameters identical to those shown in Fig.8, with the exception that πL has been varied
(πL = 0.5 in Fig. 7 and πL = 0.1 in Fig. 9). The fact that these two plots are the same
illustrates that piL has virtually no effect either on the equilibrium prior to the environmental
shift or on the adaptive dynamics following the environmental shift. Fig. 8 shows time series
plots for the same parameters as Fig. 7, with the exception that s has been increased (s = 1
in Fig. 8 and s = 6 in Fig. 8), such that the two cases lie in different selective regimes. We
see that in Fig. 8, in contrast to Fig. 7, individuals accumulate rapidly at low robustness
adaptable genotypes.
[Figure 7 about here.]
[Figure 8 about here.]
[Figure 9 about here.]
26

References
Draghi, J., T. Parsons, G. Wagner, and J. Plotkin, 2010. Mutational robustness can facilitate
adaptation. Nature 436:353–355.
Etheridge, A. M., 2011. Some Mathematical Models from Population Genetics, Lecture Notes
in Math, vol. 2012. Springer, Berlin Heidelberg.
Ethier, S. and T. Kurtz, 2005. Markov processes : characterization and convergence. Wiley
Interscience, Hoboken.
Gardiner, C. W., 2004. Handbook of stochastic methods for physics, chem-
istry, and the natural sciences. 3rd ed ed. Springer-Verlag, Berlin. URL
http://www.loc.gov/catdir/enhancements/fy0818/2004043676-d.html.
Wagner, A., 2008. Robustness and evolvability: a paradox resolved. Proceedings of the
Royal Society B: Biological Sciences 275:91–100.
27

List of Figures
1 Correlated phenotypic neighbourhood . . . . . . . . . . . . . . . . . . . . . . 29
2 Variation in size of phenotypic neighbourhood . . . . . . . . . . . . . . . . . 30
3 Non-lethal deleterious mutations . . . . . . . . . . . . . . . . . . . . . . . . . 31
4 Deleterious low robustness adaptive genotype . . . . . . . . . . . . . . . . . 32
5 Adaptation, environmental noise, and clustering . . . . . . . . . . . . . . . . 33
6 Adaptation and mutational robustness . . . . . . . . . . . . . . . . . . . . . 34
7 Time series 1 . . . . . . . . . . . . . . . . . . . . . . . . . . . . . . . . . . . 35
8 Time series 1 . . . . . . . . . . . . . . . . . . . . . . . . . . . . . . . . . . . 36
9 Time series 1 . . . . . . . . . . . . . . . . . . . . . . . . . . . . . . . . . . . 37
28

0.0 0.2 0.4 0.6 0.8 1.00
1000
2000
3000
4000
5000
Frequency of environmental perturbations, Ε
Adaptationtime�gene
rations�
Figure 1: Correlated phenotypic neighbourhood – Mean adaptation time as a function ofthe probability of environmental perturbation, �. Plots show different levels of correlationbetween phenotypic neighbourhoods, with f = 1 (red, uncorrelated), f = 0.5 (blue) and f =0.3 (black). As phenotypic neighbourhoods become more correlated, mean adaptation timeincreases. Plots show means of 10,000 replicate Monte-Carlo simulations with populationsof N = 10, 000 individuals, with µ = 0.001, P = 100, K = 5, q = 0.5, φH = 0.8, φL = 0.2and πH = 0.9 with s = 2.
29

0.0 0.2 0.4 0.6 0.8 1.00
200400600800100012001400
High robustness genotype clustering, ΠHL
Adaptationtime�gene
rations�
(a) Mean adaptation time as a function of high ro-bustness genotype clustering, πH
0.0 0.2 0.4 0.6 0.8 1.00
200
400
600
800
1000
Strength of low robustness genotypes, ΦL
Adaptationtime�gene
rations�
(b) Mean adaptation time as a function of robust-ness of low robust genotypes, φL
0.0 0.2 0.4 0.6 0.8 1.00
200
400
600
800
1000
Strength of low robustness genotypes, ΦH
Adaptationtime�gene
rations�
(c) Mean adaptation time as a function of robust-ness of high robust genotypes, φH
0.0 0.2 0.4 0.6 0.8 1.00
100
200
300
400
500
600
700
Frequency of environmental perturbations, Ε
Adaptationtime�gene
rations�
(d) Mean adaptation time as a function of the prob-ability of environmental perturbation, �
0.0 0.2 0.4 0.6 0.8 1.00
500
1000
1500
2000
Mutational Robustness, q
Adaptationtime�gene
rations�
(e) Mean adaptation time as a function of muta-tional robustness, q
Figure 2: Variation in size of phenotypic neighbourhood – Plots show populations of N =10, 000 individuals, with µ = 0.001, P = 100, K̄ = 5, q = 0.5, φH = 0.9, φL = 0.1 andπH = 0.5 with s = 2 (red line) and s = 8 (blue line). Lines indicate the analytic solution toour model, whereas dots indicate the means of 10,000 replicate Monte-Carlo simulations.
30

0.0 0.2 0.4 0.6 0.8 1.00
500
1000
1500
High robustness genotype clustering, ΠHL
Adaptationtime�gene
rations�
(a) Mean adaptation time as a function of high ro-bustness genotype clustering, πH
0.0 0.2 0.4 0.6 0.8 1.00
200
400
600
800
1000
Strength of low robustness genotypes, ΦL
Adaptationtime�gene
rations�
(b) Mean adaptation time as a function of robust-ness of low robust genotypes, φL
0.0 0.2 0.4 0.6 0.8 1.00
200
400
600
800
1000
Strength of low robustness genotypes, ΦH
Adaptationtime�gene
rations�
(c) Mean adaptation time as a function of robust-ness of high robust genotypes, φH
0.0 0.2 0.4 0.6 0.8 1.00
200
400
600
800
1000
Frequency of environmental perturbations, Ε
Adaptationtime�gene
rations�
(d) Mean adaptation time as a function of the prob-ability of environmental perturbation, �
0.0 0.2 0.4 0.6 0.8 1.00
200400600800100012001400
Mutational Robustness, q
Adaptationtime�gene
rations�
(e) Mean adaptation time as a function of muta-tional robustness, q
Figure 3: Non-lethal deleterious mutations – Plots show populations of N = 10, 000 individ-uals, with µ = 0.001, P = 100, K = 10, q = 0.2, φH = 0.9, φL = 0.1 and πH = 0.5, d = 0.2with s = 0.5 (red line) and s = 3 (blue line). Lines indicate the analytic solution to ourmodel, whereas dots indicate the means of 10,000 replicate Monte-Carlo simulations.
31
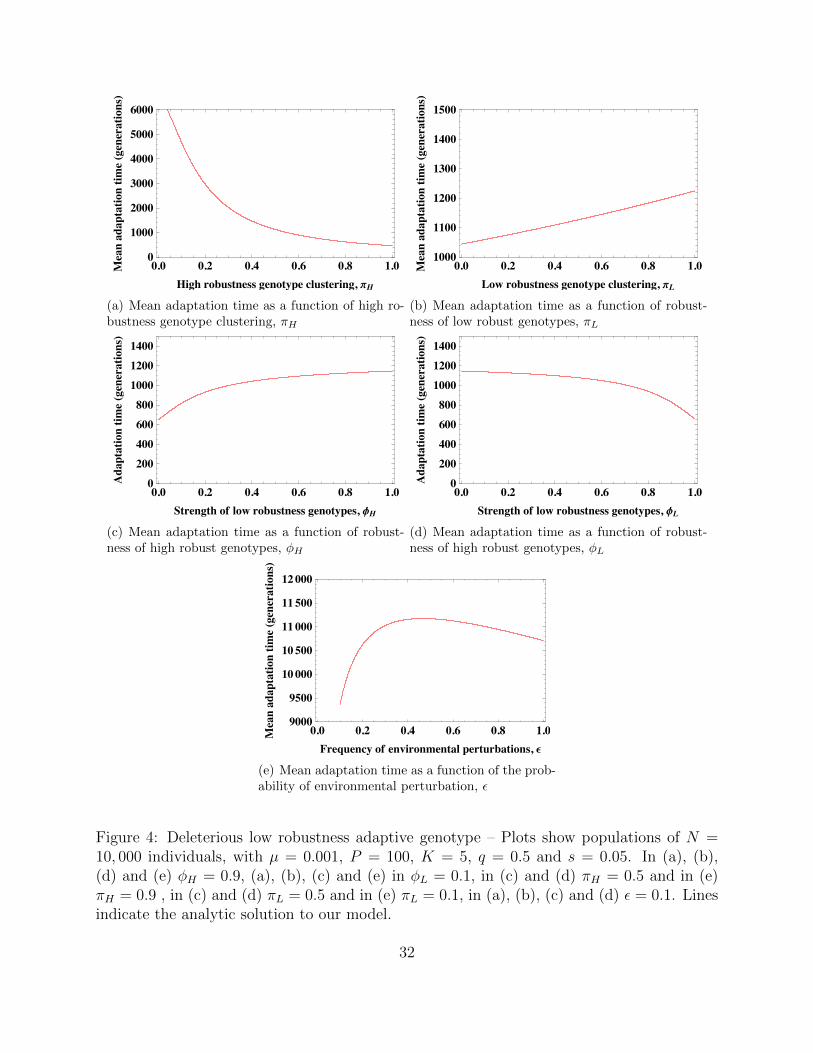
0.0 0.2 0.4 0.6 0.8 1.00
1000
2000
3000
4000
5000
6000
High robustness genotype clustering, ΠH
Meanadaptationtime�gene
rations�
(a) Mean adaptation time as a function of high ro-bustness genotype clustering, πH
0.0 0.2 0.4 0.6 0.8 1.01000
1100
1200
1300
1400
1500
Low robustness genotype clustering, ΠL
Meanadaptationtime�gene
rations�
(b) Mean adaptation time as a function of robust-ness of low robust genotypes, πL
0.0 0.2 0.4 0.6 0.8 1.00
200400600800100012001400
Strength of low robustness genotypes, ΦH
Adaptationtime�gene
rations�
(c) Mean adaptation time as a function of robust-ness of high robust genotypes, φH
0.0 0.2 0.4 0.6 0.8 1.00
200400600800100012001400
Strength of low robustness genotypes, ΦL
Adaptationtime�gene
rations�
(d) Mean adaptation time as a function of robust-ness of high robust genotypes, φL
0.0 0.2 0.4 0.6 0.8 1.09000
9500
10 000
10 500
11 000
11 500
12 000
Frequency of environmental perturbations, Ε
Meanadaptationtime�gene
rations�
(e) Mean adaptation time as a function of the prob-ability of environmental perturbation, �
Figure 4: Deleterious low robustness adaptive genotype – Plots show populations of N =10, 000 individuals, with µ = 0.001, P = 100, K = 5, q = 0.5 and s = 0.05. In (a), (b),(d) and (e) φH = 0.9, (a), (b), (c) and (e) in φL = 0.1, in (c) and (d) πH = 0.5 and in (e)πH = 0.9 , in (c) and (d) πL = 0.5 and in (e) πL = 0.1, in (a), (b), (c) and (d) � = 0.1. Linesindicate the analytic solution to our model.
32

0.0 0.2 0.4 0.6 0.8 1.00
500
1000
1500
2000
Frequency of environmental perturbations, Ε
Meanadaptationtime�gene
rations�
Figure 5: Mean adaptation time as a function of the probability of environmental pertur-bation, �, in the regime 1+s
K<
φH−φL
1−φL
. In general, adaptation is faster when high-robustgenotypes are more clustered (blue line) as opposed to less clustered (red line). Moreover,the clustering of robust genotypes broadens the range over the rate of adaptation is pos-itively correlated with the rate of environmental perturbation. Plots show populations ofN = 10, 000 individuals, with µ = 0.001, P = 100, K = 5, q = 0.5, φH = 0.9, φL = 0.1 ands = 2 with πH = 0.1 (red line) and πH = 0.3 (blue line). Lines indicate the analytic solutionto our model, whereas dots indicate the means of 10,000 replicate Monte-Carlo simulations.
33

0.0 0.2 0.4 0.6 0.8 1.00
500
1000
1500
2000
2500
Mutational Robustness, q
Meanadaptationtime�gene
rations�
Figure 6: The mean adaptation time as a function of mutational robustness, q. There isnon-monotonic relationship between mutational robustness and mean adaptation time, andthe shape of this trend is preserved even in the presence of environmental noise. However,the addition of environmental noise tends to facilitate adaptation in the regime 1+s
K>
φH−φL
1−φL
,and it retard adaptation otherwise. Moreover, the presence of environmental noise changesthe value of q that maximizes the rate of adaptation. Plots show populations of N = 10, 000individuals, with µ = 0.001, � = 0.1 P = 100, K = 5, φH = 0.9, φL = 0.1 and πH = 0.5 withs = 2 (red line) and s = 5 (blue line). The case with no environmental noise (� = 0, blackline) is also shown. Lines indicate the analytic solution to our model, whereas dots indicatethe means of 10,000 replicate Monte-Carlo simulations.
34

0 200 400 600 800 10000.925
0.93
0.935
0.94
0.945
0.95
0.955
Time (generations)
Freq
uenc
y
(a) Non-adaptable high robustness
0 200 400 600 800 10000.045
0.05
0.055
0.06
0.065
0.07
0.075
Time (generations)
Freq
uenc
y
(b) Adaptable high robustness
! "!! #!! $!! %!! &!!!"'(
"'((
"'$
"'$(
"')
"')(
"'%
"'%(
"'*
"'*( +,&!-
./01,23141567/849:
;51<=14>?
(c) Non-adaptable low robustness
! "!! #!! $!! %!! &!!!!'(
&
&'(
"
"'(
)
)'( *+&!#
,-./+01/2/345-6278
93/:;/2<=
(d) Adaptable low robustness
Figure 7: Most realistic selective regime with s/K = 0.2, πH = 0.5 and πL = 0.5 a) Non-adaptable high robustness genotypes. This shows that the prior to the environmental shiftmost of the population is at this genotype class and that following the environmental shiftthere is little change in the population at this genotype class before adaptation occurs (thereis a drop of ∼ 2%). b) Adaptable high robustness genotypes. This shows that prior tothe environmental shift the population at this genotypes class is small (due to their rarity)and that following the environmental shift and the population increases by ∼ 0.02. c) Non-adaptable low robustness genotypes. This shows that the prior to the environmental shiftthe population at this genotype class is negligible and that following the environmental shiftthere is no obvious change in the population at this genotype class before adaptation occurs.d) Adaptable high robustness genotypes. This shows that prior to the environmental shiftthe population at this genotypes class is small (due to their rarity) and that following theenvironmental shift and the population increases by ∼ 1.2 × 10⁻⁴, much less than the highrobustness adaptable genotypes (b). Plots are for N = 10, 000 individuals, with µ = 0.001,P = 100, K = 5, q = 0.5 and s = 1, φH = 0.9, φL = 0.1, πH = 0.5, πL = 0.1 and � = 0.1.Plots show averages over 1000 sample paths.
35
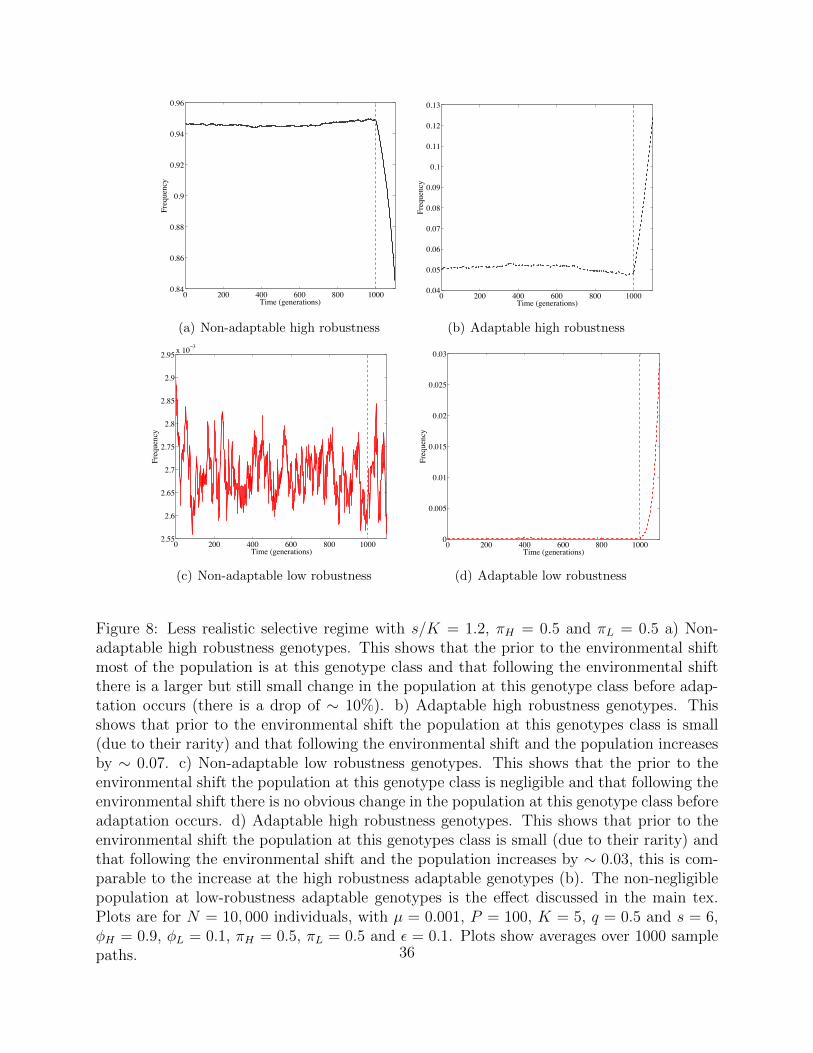
0 200 400 600 800 10000.84
0.86
0.88
0.9
0.92
0.94
0.96
Time (generations)
Freq
uenc
y
(a) Non-adaptable high robustness
0 200 400 600 800 10000.04
0.05
0.06
0.07
0.08
0.09
0.1
0.11
0.12
0.13
Time (generations)
Freq
uenc
y
(b) Adaptable high robustness
! "!! #!! $!! %!! &!!!"'((
"'$
"'$(
"')
"')(
"'%
"'%(
"'*
"'*( +,&!-
./01,23141567/849:
;51<=14>?
(c) Non-adaptable low robustness
0 200 400 600 800 10000
0.005
0.01
0.015
0.02
0.025
0.03
Time (generations)
Freq
uenc
y
(d) Adaptable low robustness
Figure 8: Less realistic selective regime with s/K = 1.2, πH = 0.5 and πL = 0.5 a) Non-adaptable high robustness genotypes. This shows that the prior to the environmental shiftmost of the population is at this genotype class and that following the environmental shiftthere is a larger but still small change in the population at this genotype class before adap-tation occurs (there is a drop of ∼ 10%). b) Adaptable high robustness genotypes. Thisshows that prior to the environmental shift the population at this genotypes class is small(due to their rarity) and that following the environmental shift and the population increasesby ∼ 0.07. c) Non-adaptable low robustness genotypes. This shows that the prior to theenvironmental shift the population at this genotype class is negligible and that following theenvironmental shift there is no obvious change in the population at this genotype class beforeadaptation occurs. d) Adaptable high robustness genotypes. This shows that prior to theenvironmental shift the population at this genotypes class is small (due to their rarity) andthat following the environmental shift and the population increases by ∼ 0.03, this is com-parable to the increase at the high robustness adaptable genotypes (b). The non-negligiblepopulation at low-robustness adaptable genotypes is the effect discussed in the main tex.Plots are for N = 10, 000 individuals, with µ = 0.001, P = 100, K = 5, q = 0.5 and s = 6,φH = 0.9, φL = 0.1, πH = 0.5, πL = 0.5 and � = 0.1. Plots show averages over 1000 samplepaths. 36

0 200 400 600 800 10000.925
0.93
0.935
0.94
0.945
0.95
Time (generations)
Freq
uenc
y
(a) Non-adaptable high robustness
0 200 400 600 800 10000.045
0.05
0.055
0.06
0.065
0.07
0.075
Time (generations)
Freq
uenc
y(b) Adaptable high robustness
! "!! #!! $!! %!! &!!!"'(
"'((
"'$
"'$(
"')
"')(
"'%
"'%(
"'*
"'*( +,&!-
./01,23141567/849:
;51<=14>?
(c) Non-adaptable low robustness
! "!! #!! $!! %!! &!!!&
&'"
&'#
&'$
&'%
"
"'"
"'#
"'$
"'% ()&!#
*+,-)./-0-123+4056
71-89-0:;
(d) Adaptable low robustness
Figure 9: Most realistic selective regime with s/K = 0.2, πH = 0.5 and πL = 0.1 Theinformation here is the same as in the previous graph, but it illustrates that changing lowrobustness genotype clustering has no impact on the dynamics of adaptation. Plots are forN = 10, 000 individuals, with µ = 0.001, P = 100, K = 5, q = 0.5 and s = 1, φH = 0.9,φL = 0.1, πH = 0.5, πL = 0.1 and � = 0.1. Plots show averages over 1000 sample paths.
37

List of Tables
1 Model Parameters . . . . . . . . . . . . . . . . . . . . . . . . . . . . . . . . . 39
38
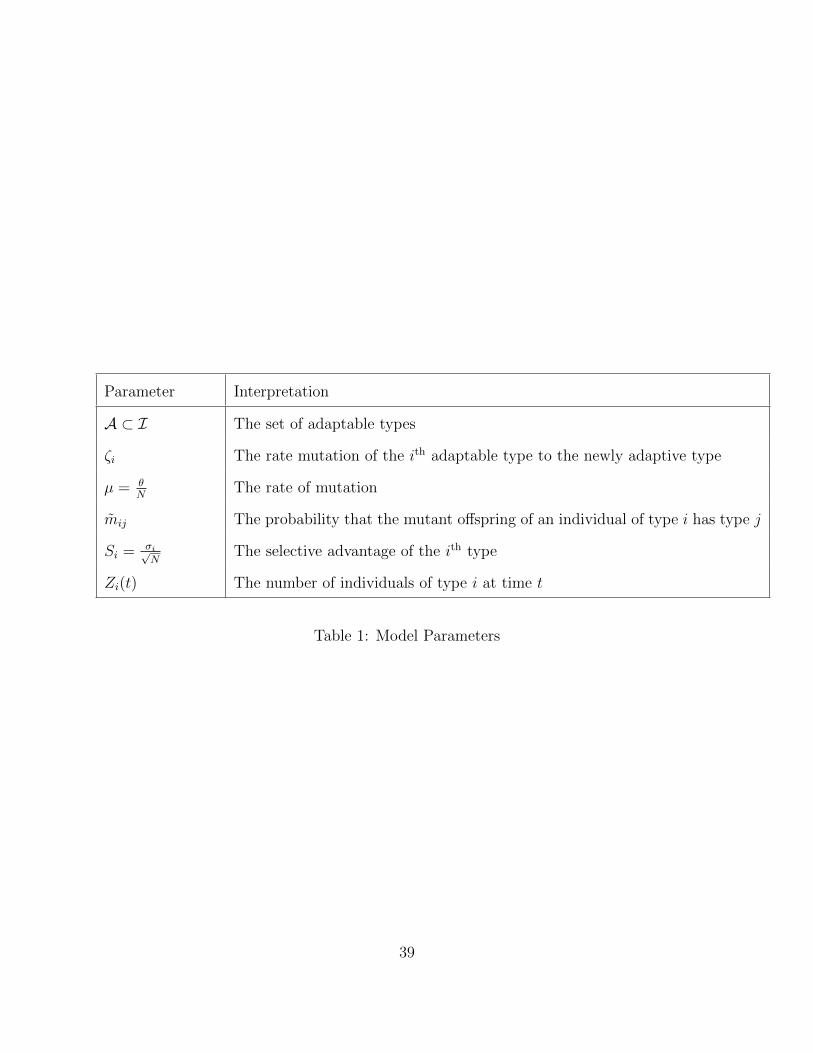
Parameter Interpretation
A ⊂ I The set of adaptable types
ζi The rate mutation of the ith adaptable type to the newly adaptive type
µ = θ
NThe rate of mutation
m̃ij The probability that the mutant offspring of an individual of type i has type j
Si =σi√N
The selective advantage of the ith type
Zi(t) The number of individuals of type i at time t
Table 1: Model Parameters
39