Embed Size (px)
Citation preview
Annual Report
Table of Contents Executive Summary ..................................................................................................................... 3
2017 Progress Report .................................................................................................................. 5
Program Achievements ............................................................................................................... 7
Membership Growth ......................................................................................................................... 7
Member Goals .................................................................................................................................... 8
Member Results ................................................................................................................................. 9
Greenhouse Gas Reductions .........................................................................................................12
Cost Savings .....................................................................................................................................13
Community Involvement ...............................................................................................................13
New Member Accomplishments ..................................................................................................14
Program Updates ........................................................................................................................ 15
Membership ................................................................................................................................ 18
Criteria ...............................................................................................................................................19
Benefits ..............................................................................................................................................20
Application Process ..................................................................................................................... 201
Conclusions .................................................................................................................................... 214
2017 ESI Members .................................................................................................................... 255
Published December 2018
3 www.ncesi.org
Executive SummaryThe N.C. Department of Environmental Quality’s Environmental Stewardship Initiative is a voluntary program that assists
and encourages facilities to use pollution prevention and innovation to meet and go beyond regulatory requirements.
The ESI takes a unique approach to supplement regulation by providing a voluntary, systematic and holistic approach
to environmental management.
Reductions and cost savings reported by members demonstrate real results and improvements to the environment and
economy in North Carolina. The ESI model addresses environmental challenges through partnerships and a voluntary,
comprehensive and innovative approach that benefits the environment and continued economic growth.
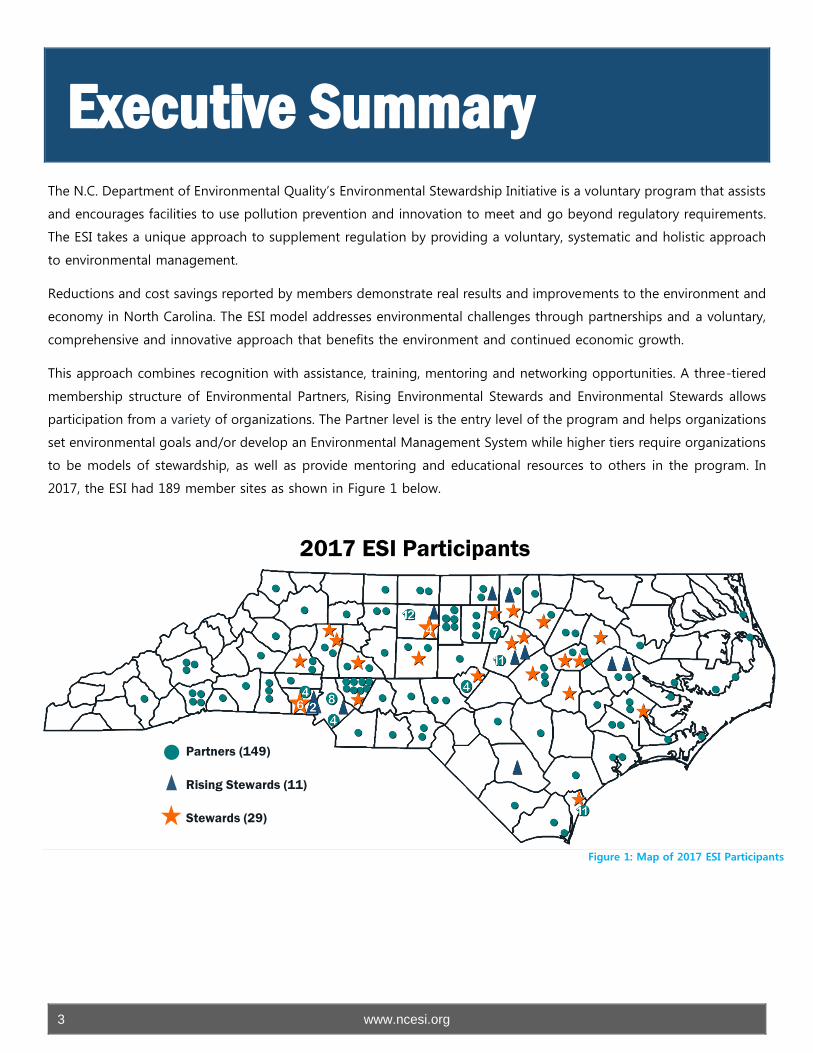
This approach combines recognition with assistance, training, mentoring and networking opportunities. A three-tiered
membership structure of Environmental Partners, Rising Environmental Stewards and Environmental Stewards allows
participation from a variety of organizations. The Partner level is the entry level of the program and helps organizations
set environmental goals and/or develop an Environmental Management System while higher tiers require organizations
to be models of stewardship, as well as provide mentoring and educational resources to others in the program. In
2017, the ESI had 189 member sites as shown in Figure 1 below.
Figure 1: Map of 2017 ESI Participants
Partners (149)
Rising Stewards (11)
Stewards (29)
2017 ESI Participants
4 www.ncesi.org
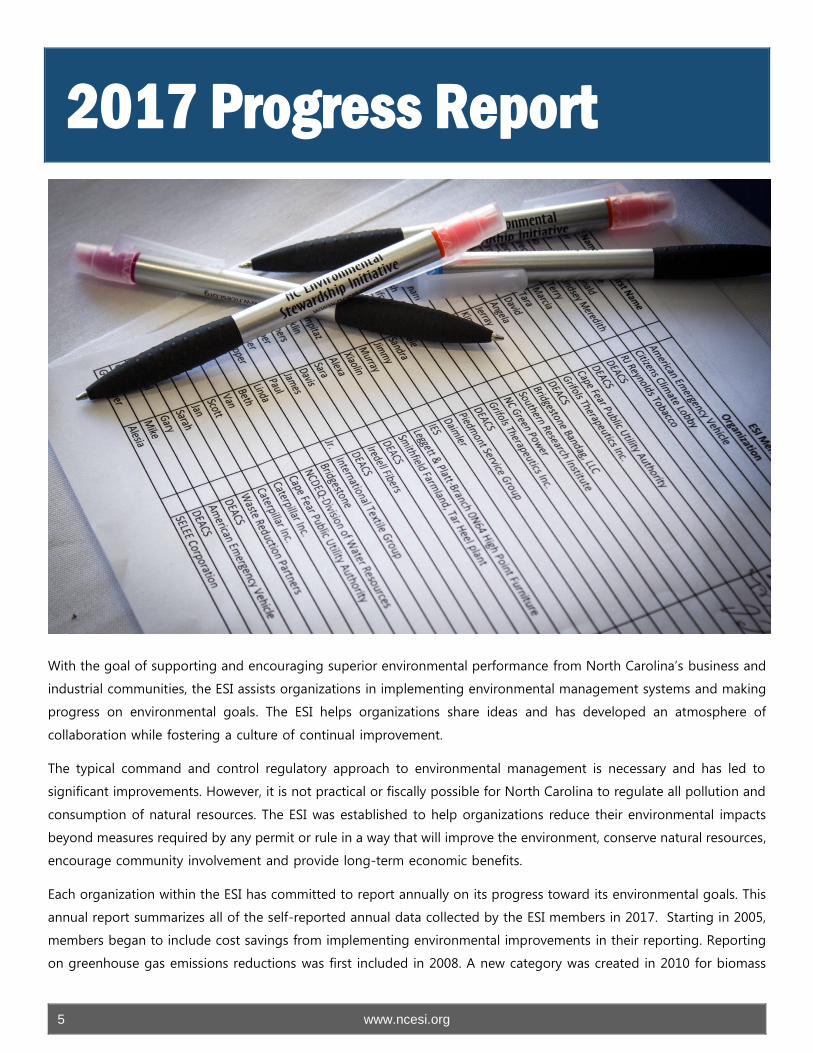
The ESI is open to any entity in North Carolina that commits to improving its environmental impact. (See the
Membership section of this report for more information on eligibility and the three levels of the program). ESI members
commit to developing environmental management systems and/or setting measurable goals that lead to continual
improvement and stewardship. In 2017, ESI members set 269 goals covering multi-media, regulated and non-regulated
impacts including energy and water conservation. Eighty-three members reported progress toward these specific goals*.
In 2017, ESI members reported the following reductions in environmental impacts as shown in Table 1.
2017 ESI MEMBERS REPORTED RESULTS
RE
DU
CT
ION
S
Air Emissions 1,694 Tons
Greenhouse Gas Emissions* 2,546 Metric Tons CO2e
Hazardous waste 105 Tons
Landfilled waste 350,911 Tons
Energy 1,093,033 mmBtu
Water Use 1,038,806,743 Gallons
Material Consumption 356 Tons
Wastewater Pollutants 6,783.38 Tons
Wastewater Volume 490,620,971 Gallons
RE
US
E Biomass Recovery** 95,625 Tons
Total Recycled Volume 97,774 Tons
TOTAL COST SAVINGS $ 8,178,746
*Indirect not reported in energy reductions
**Category created for compost/mulch related goals
Table 1: 2017 ESI Members' Reported Results
*Partners may apply to the program as a multi-site facility, which allows a collection of sites to submit a single annual report. New members must
be in the program for at least one year prior to having their results included in the overall totals. Therefore, the total number of members reporting
may be less than the total membership number.
5 www.ncesi.org
2017 Progress Report
With the goal of supporting and encouraging superior environmental performance from North Carolina’s business and
industrial communities, the ESI assists organizations in implementing environmental management systems and making
progress on environmental goals. The ESI helps organizations share ideas and has developed an atmosphere of
collaboration while fostering a culture of continual improvement.
The typical command and control regulatory approach to environmental management is necessary and has led to
significant improvements. However, it is not practical or fiscally possible for North Carolina to regulate all pollution and
consumption of natural resources. The ESI was established to help organizations reduce their environmental impacts
beyond measures required by any permit or rule in a way that will improve the environment, conserve natural resources,
encourage community involvement and provide long-term economic benefits.
Each organization within the ESI has committed to report annually on its progress toward its environmental goals. This
annual report summarizes all of the self-reported annual data collected by the ESI members in 2017. Starting in 2005,
members began to include cost savings from implementing environmental improvements in their reporting. Reporting
on greenhouse gas emissions reductions was first included in 2008. A new category was created in 2010 for biomass
6 www.ncesi.org
recovery to capture activities related to composting and mulching as a means of beneficial use by diverting waste from
landfills. In 2012, the ESI was opened to organizations not regulated through DEQ issued permits in order to increase
the program’s reach and build a larger network of organizations working together to make North Carolina a model of
environmental stewardship. The annual report form was updated for the 2016 reporting year allowing members to
provide additional reduction data that may not have been directly tied to the site’s environmental goals. Facilities were
also allowed to report in either Fiscal Year or Calendar Year spans in order to ease the capture of data. It was requested
that sites remain consistent from that point forward in the timeframe reported.
7 www.ncesi.org
Program Achievements
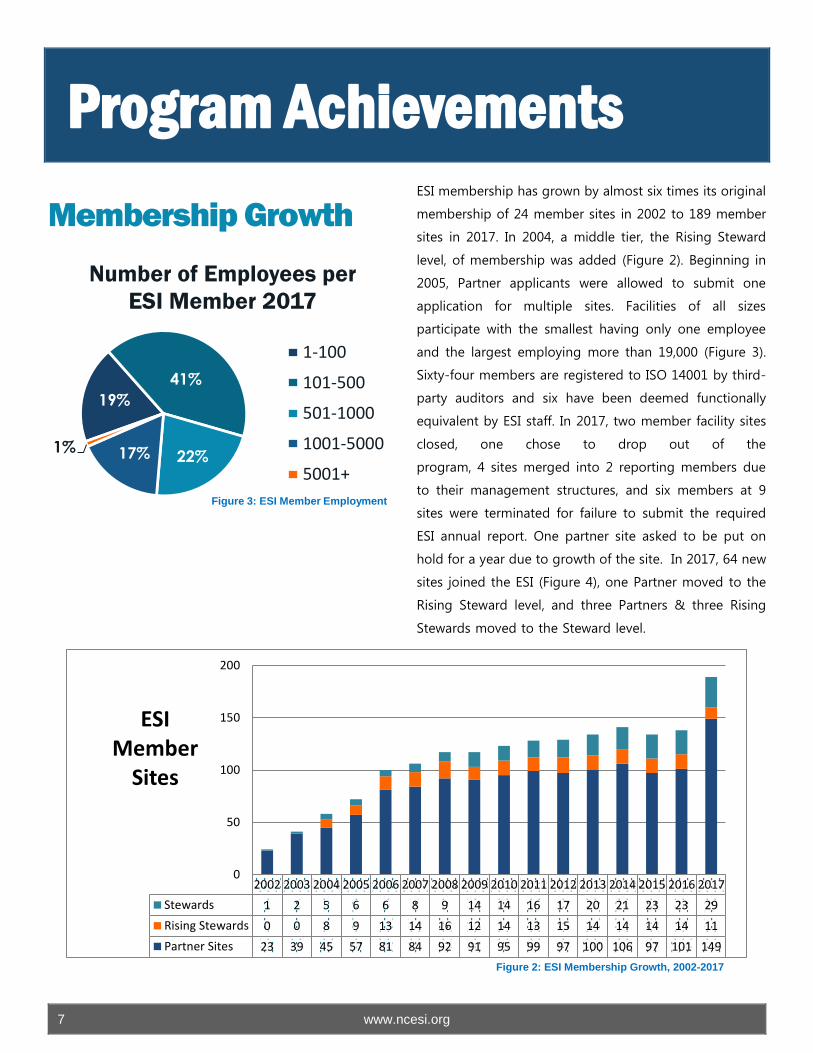
Membership Growth
ESI membership has grown by almost six times its original
membership of 24 member sites in 2002 to 189 member
sites in 2017. In 2004, a middle tier, the Rising Steward
level, of membership was added (Figure 2). Beginning in
2005, Partner applicants were allowed to submit one
application for multiple sites. Facilities of all sizes
participate with the smallest having only one employee
and the largest employing more than 19,000 (Figure 3).
Sixty-four members are registered to ISO 14001 by third-
party auditors and six have been deemed functionally
equivalent by ESI staff. In 2017, two member facility sites
closed, one chose to drop out of the
program, 4 sites merged into 2 reporting members due
to their management structures, and six members at 9
sites were terminated for failure to submit the required
ESI annual report. One partner site asked to be put on
hold for a year due to growth of the site. In 2017, 64 new
sites joined the ESI (Figure 4), one Partner moved to the
Rising Steward level, and three Partners & three Rising
Stewards moved to the Steward level.
19%
41%
22%17%1%
Number of Employees per
ESI Member 2017
1-100
101-500
501-1000
1001-5000
5001+
Figure 3: ESI Member Employment
2002 2003 2004 2005 2006 2007 2008 2009 2010 2011 2012 2013 2014 2015 2016 2017
Stewards 1 2 5 6 6 8 9 14 14 16 17 20 21 23 23 29
Rising Stewards 0 0 8 9 13 14 16 12 14 13 15 14 14 14 14 11
Partner Sites 23 39 45 57 81 84 92 91 95 99 97 100 106 97 101 149
0
50
100
150
200
ESI Member
Sites
Figure 2: ESI Membership Growth, 2002-2017
8 www.ncesi.org
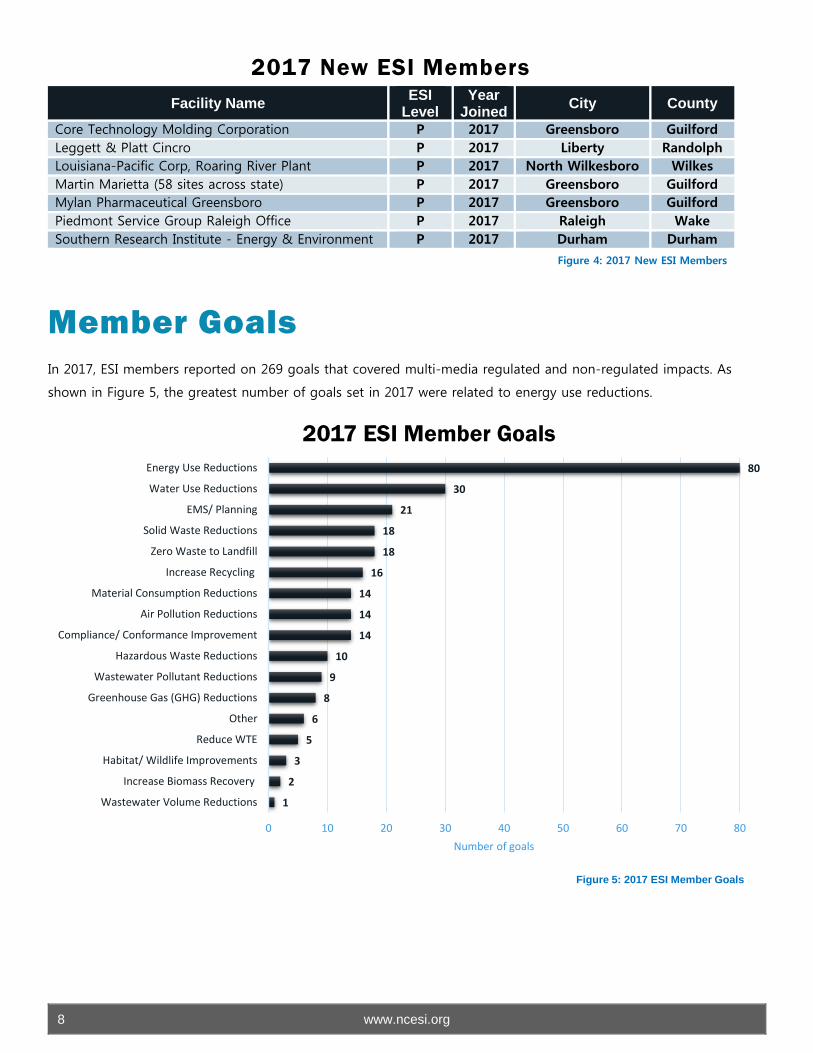
Member Goals
In 2017, ESI members reported on 269 goals that covered multi-media regulated and non-regulated impacts. As
shown in Figure 5, the greatest number of goals set in 2017 were related to energy use reductions.
1
2
3
5
6
8
9
10
14
14
14
16
18
18
21
30
80
0 10 20 30 40 50 60 70 80
Wastewater Volume Reductions
Increase Biomass Recovery
Habitat/ Wildlife Improvements
Reduce WTE
Other
Greenhouse Gas (GHG) Reductions
Wastewater Pollutant Reductions
Hazardous Waste Reductions
Compliance/ Conformance Improvement
Air Pollution Reductions
Material Consumption Reductions
Increase Recycling
Zero Waste to Landfill
Solid Waste Reductions
EMS/ Planning
Water Use Reductions
Energy Use Reductions
Number of goals
2017 ESI Member Goals
Figure 5: 2017 ESI Member Goals
2017 New ESI Members
Facility Name ESI
Level Year
Joined City County
Core Technology Molding Corporation P 2017 Greensboro Guilford
Leggett & Platt Cincro P 2017 Liberty Randolph
Louisiana-Pacific Corp, Roaring River Plant P 2017 North Wilkesboro Wilkes
Martin Marietta (58 sites across state) P 2017 Greensboro Guilford
Mylan Pharmaceutical Greensboro P 2017 Greensboro Guilford
Piedmont Service Group Raleigh Office P 2017 Raleigh Wake
Southern Research Institute - Energy & Environment P 2017 Durham Durham
Figure 4: 2017 New ESI Members
9 www.ncesi.org
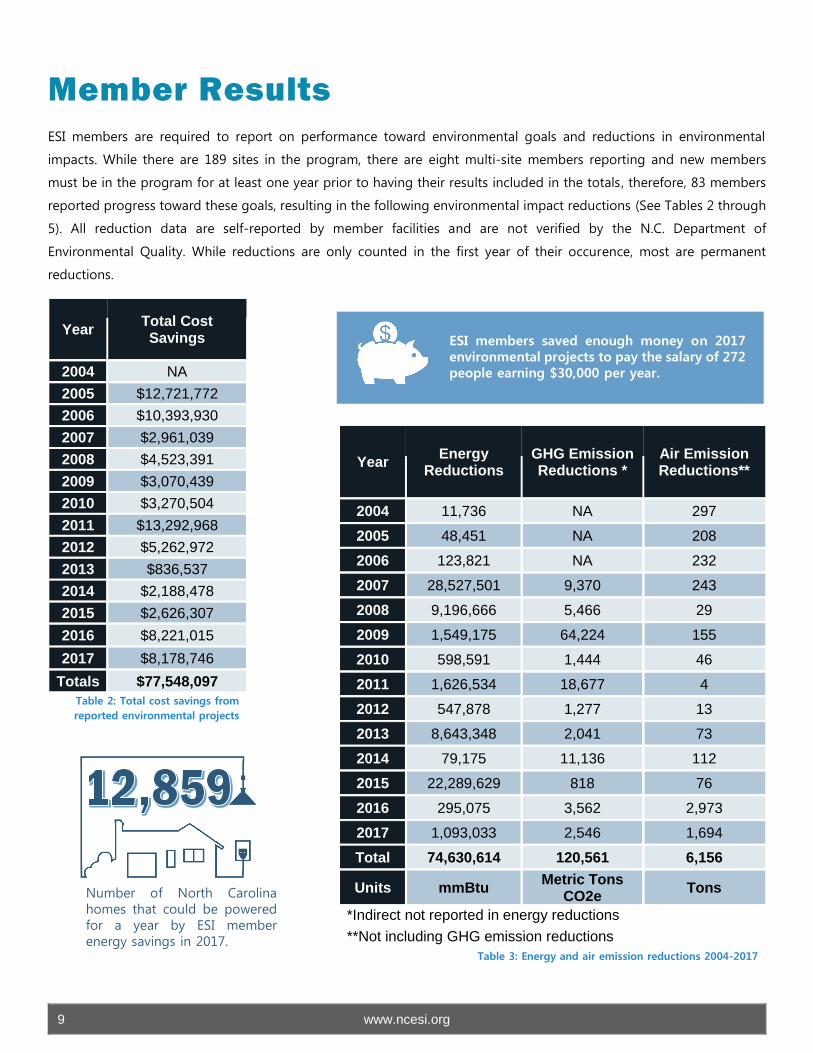
Member Results
ESI members are required to report on performance toward environmental goals and reductions in environmental
impacts. While there are 189 sites in the program, there are eight multi-site members reporting and new members
must be in the program for at least one year prior to having their results included in the totals, therefore, 83 members
reported progress toward these goals, resulting in the following environmental impact reductions (See Tables 2 through
5). All reduction data are self-reported by member facilities and are not verified by the N.C. Department of
Environmental Quality. While reductions are only counted in the first year of their occurence, most are permanent
reductions.
Year Total Cost Savings
2004 NA
2005 $12,721,772
2006 $10,393,930
2007 $2,961,039
2008 $4,523,391
2009 $3,070,439
2010 $3,270,504
2011 $13,292,968
2012 $5,262,972
2013 $836,537
2014 $2,188,478
2015 $2,626,307
2016 $8,221,015
2017 $8,178,746
Totals $77,548,097
Table 2: Total cost savings from
reported environmental projects
Year Energy
Reductions GHG Emission Reductions *
Air Emission Reductions**
2004 11,736 NA 297
2005 48,451 NA 208
2006 123,821 NA 232
2007 28,527,501 9,370 243
2008 9,196,666 5,466 29
2009 1,549,175 64,224 155
2010 598,591 1,444 46
2011 1,626,534 18,677 4
2012 547,878 1,277 13
2013 8,643,348 2,041 73
2014 79,175 11,136 112
2015 22,289,629 818 76
2016 295,075 3,562 2,973
2017 1,093,033 2,546 1,694
Total 74,630,614 120,561 6,156
Units mmBtu Metric Tons
CO2e Tons
*Indirect not reported in energy reductions
**Not including GHG emission reductions
Table 3: Energy and air emission reductions 2004-2017
Number of North Carolina homes that could be powered for a year by ESI member energy savings in 2017.
ESI members saved enough money on 2017 environmental projects to pay the salary of 272 people earning $30,000 per year.
10 www.ncesi.org
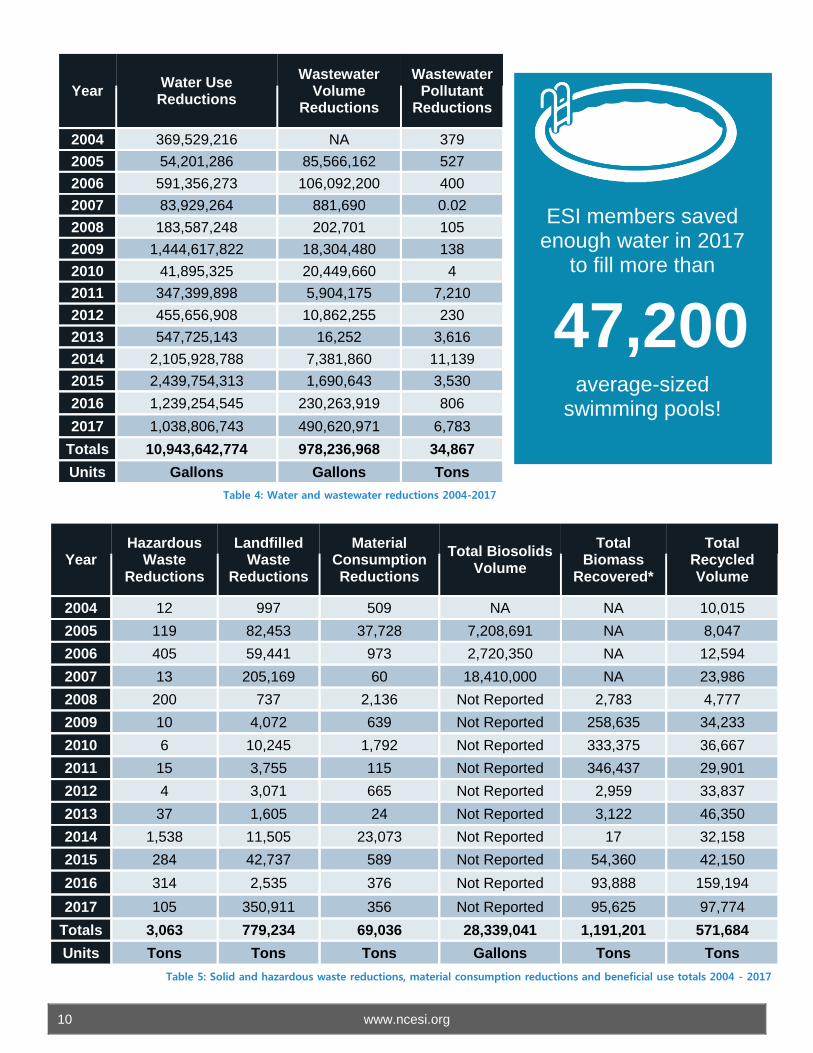
ESI members saved enough water in 2017
to fill more than
47,200 average-sized
swimming pools!
Year Water Use Reductions
Wastewater Volume
Reductions
Wastewater Pollutant
Reductions
2004 369,529,216 NA 379
2005 54,201,286 85,566,162 527
2006 591,356,273 106,092,200 400
2007 83,929,264 881,690 0.02
2008 183,587,248 202,701 105
2009 1,444,617,822 18,304,480 138
2010 41,895,325 20,449,660 4
2011 347,399,898 5,904,175 7,210
2012 455,656,908 10,862,255 230
2013 547,725,143 16,252 3,616
2014 2,105,928,788 7,381,860 11,139
2015 2,439,754,313 1,690,643 3,530
2016 1,239,254,545 230,263,919 806
2017 1,038,806,743 490,620,971 6,783
Totals 10,943,642,774 978,236,968 34,867
Units Gallons Gallons Tons
Table 4: Water and wastewater reductions 2004-2017
Year Hazardous
Waste Reductions
Landfilled Waste
Reductions
Material Consumption Reductions
Total Biosolids Volume
Total Biomass
Recovered*
Total Recycled Volume
2004 12 997 509 NA NA 10,015
2005 119 82,453 37,728 7,208,691 NA 8,047
2006 405 59,441 973 2,720,350 NA 12,594
2007 13 205,169 60 18,410,000 NA 23,986
2008 200 737 2,136 Not Reported 2,783 4,777
2009 10 4,072 639 Not Reported 258,635 34,233
2010 6 10,245 1,792 Not Reported 333,375 36,667
2011 15 3,755 115 Not Reported 346,437 29,901
2012 4 3,071 665 Not Reported 2,959 33,837
2013 37 1,605 24 Not Reported 3,122 46,350
2014 1,538 11,505 23,073 Not Reported 17 32,158
2015 284 42,737 589 Not Reported 54,360 42,150
2016 314 2,535 376 Not Reported 93,888 159,194
2017 105 350,911 356 Not Reported 95,625 97,774
Totals 3,063 779,234 69,036 28,339,041 1,191,201 571,684
Units Tons Tons Tons Gallons Tons Tons
Table 5: Solid and hazardous waste reductions, material consumption reductions and beneficial use totals 2004 - 2017
11 www.ncesi.org
Reducing energy usage, water usage and solid waste
generation as well as increased recycling were the most
common reduction goals of ESI members in 2017. Goals
of increasing biomass recovery and reducing the amount
of waste sent to energy while maintaining zero waste to
landfills were also reported.
• Eighty goals related to reducing consumption of
energy (natural gas, propane and electricity) as well as
fuel used in vehicle fleets (gasoline and diesel) were
reported. In total members reduced their usage by
more than 1,093,000 mmBtus (million British Thermal
Units, or BTUs). The majority of these reductions came
from natural gas usage reductions in 2017. The
reductions occurred even with the increased
production that came with and improving economy.
Re-lamping projects, process efficiency improvements
as well as boiler, chiller, and compressed air projects
were the main contributors to the energy reductions.
Replacement of older equipment with more efficient
devices was credited with efficiency increases which
either reduced the overall energy needed or kept
demand steady during production growth. Multiple
sites also completed energy assesments to find
opportunities for improvement. Monitoring of data
and educational campaigns also contributed to the
reductions.
• Thirty goals related to water usage were reported with
reductions of over a billion gallons of water. The vast
majority of water saved came from a paper plant
implementing a water conservation team to look for
opportunities to reduce the extremely high demand
at their site. Other reductions were due mainly to
improvements in maintenance; cooling tower
replacements; water reuse projects; new chillers and
other cooling equipment; and reductions in potable
water for landscaping.
• Eighteen goals related to solid waste reduction,
fourteen related to material consumption and sixteen
related to recycling with a reduction of almost 351,000
tons of waste going to landfill and almost 98,000 tons
of material being recycled were accomplished and
eighteen sites also indicated having zero-waste-to-
landfill goals.
• Two goals related to biomass recovery were reported,
and additional data was provided on composting and
other organic material recovery such that almost
96,000 tons of organic material was diverted from
landfills into beneficial uses.
• Five goals to reduce the amount of waste sent to
produce energy while maintaining zero waste sent to
landfill resulted in almost 24,000 tons of material
eliminated from the waste stream.
Facilities also reported reductions in air pollutants,
hazardous waste generation, wastewater volume and
pollutants discharged and greenhouse gas emissions in
2017.
• Ten goals were reported on hazardous waste
generation reductions that resulted in almost 105 tons
less of hazardous waste generated. Changes in
cleaning chemicals, a rag reuse program, inventory
management improvements, the ability to recycle
swarf (oily metal shavings and dust), and reduction of
solvent use all contributed to this reduction.
• Fourteen goals were reported on air pollutant
emission reductions of almost 1,700 tons.
• Twenty facilities reported wastewater volume
reductions of more than 490 million gallons.
However, only one facility reported a goal to reduce
wastewater discharges.
• Nine goals were related to wastewater effluent and
stormwater pollutant reductions of over 6,700 tons.
• Eight facilities reported on reduction goals related to
greenhouse gas emissions that were not included in
the energy reductions. Additional information on
GHG emissions is on the next page.
12 www.ncesi.org
Twenty-one goals related to EMS development and improvement were reported for 2017. Members were mainly
focused on upgrading their EMS to meet the updated ISO 14001:2015 standard. Members also reported on goals
related to compliance, wildlife and habitat improvements, and other environmentally related goals specific to individual
sites.
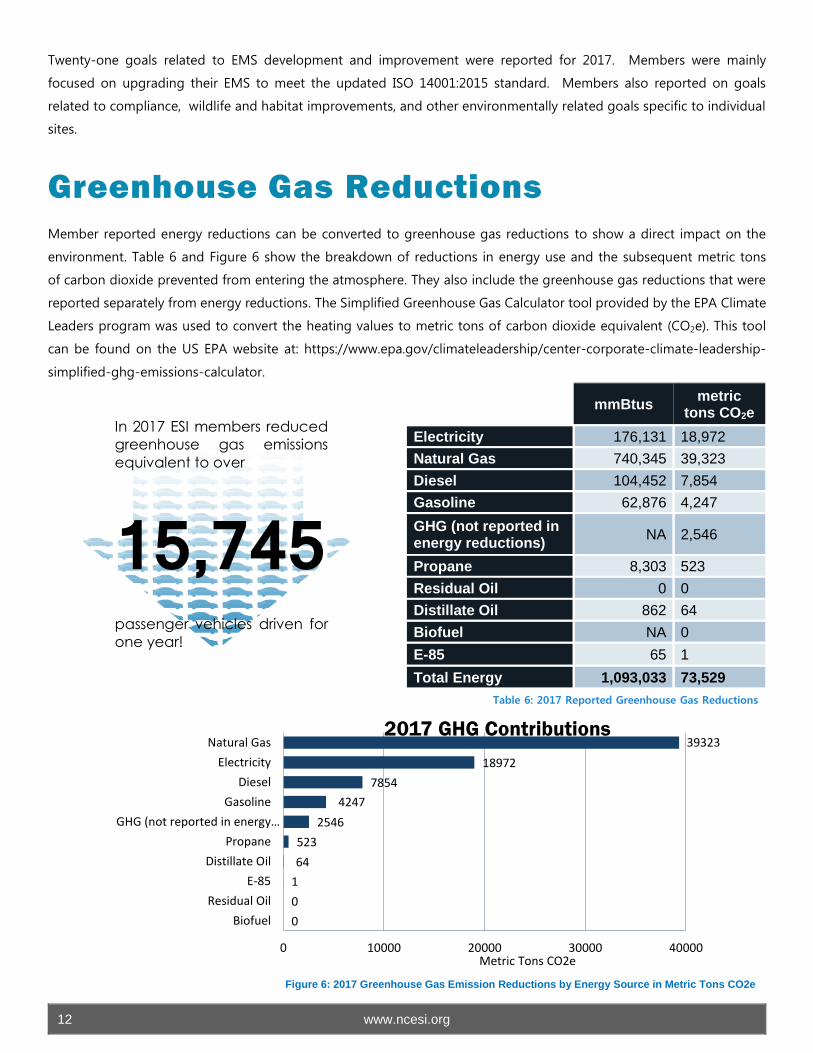
Greenhouse Gas Reductions
Member reported energy reductions can be converted to greenhouse gas reductions to show a direct impact on the
environment. Table 6 and Figure 6 show the breakdown of reductions in energy use and the subsequent metric tons
of carbon dioxide prevented from entering the atmosphere. They also include the greenhouse gas reductions that were
reported separately from energy reductions. The Simplified Greenhouse Gas Calculator tool provided by the EPA Climate
Leaders program was used to convert the heating values to metric tons of carbon dioxide equivalent (CO2e). This tool
can be found on the US EPA website at: https://www.epa.gov/climateleadership/center-corporate-climate-leadership-
simplified-ghg-emissions-calculator.
mmBtus metric
tons CO2e
Electricity 176,131 18,972
Natural Gas 740,345 39,323
Diesel 104,452 7,854
Gasoline 62,876 4,247
GHG (not reported in energy reductions)
NA 2,546
Propane 8,303 523
Residual Oil 0 0
Distillate Oil 862 64
Biofuel NA 0
E-85 65 1
Total Energy 1,093,033 73,529
Table 6: 2017 Reported Greenhouse Gas Reductions
In 2017 ESI members reduced
greenhouse gas emissions
equivalent to over
15,745 passenger vehicles driven for
one year!
0
0
1
64
523
2546
4247
7854
18972
39323
0 10000 20000 30000 40000
Biofuel
Residual Oil
E-85
Distillate Oil
Propane
GHG (not reported in energy…
Gasoline
Diesel
Electricity
Natural Gas
Metric Tons CO2e
2017 GHG Contributions
Figure 6: 2017 Greenhouse Gas Emission Reductions by Energy Source in Metric Tons CO2e
13 www.ncesi.org
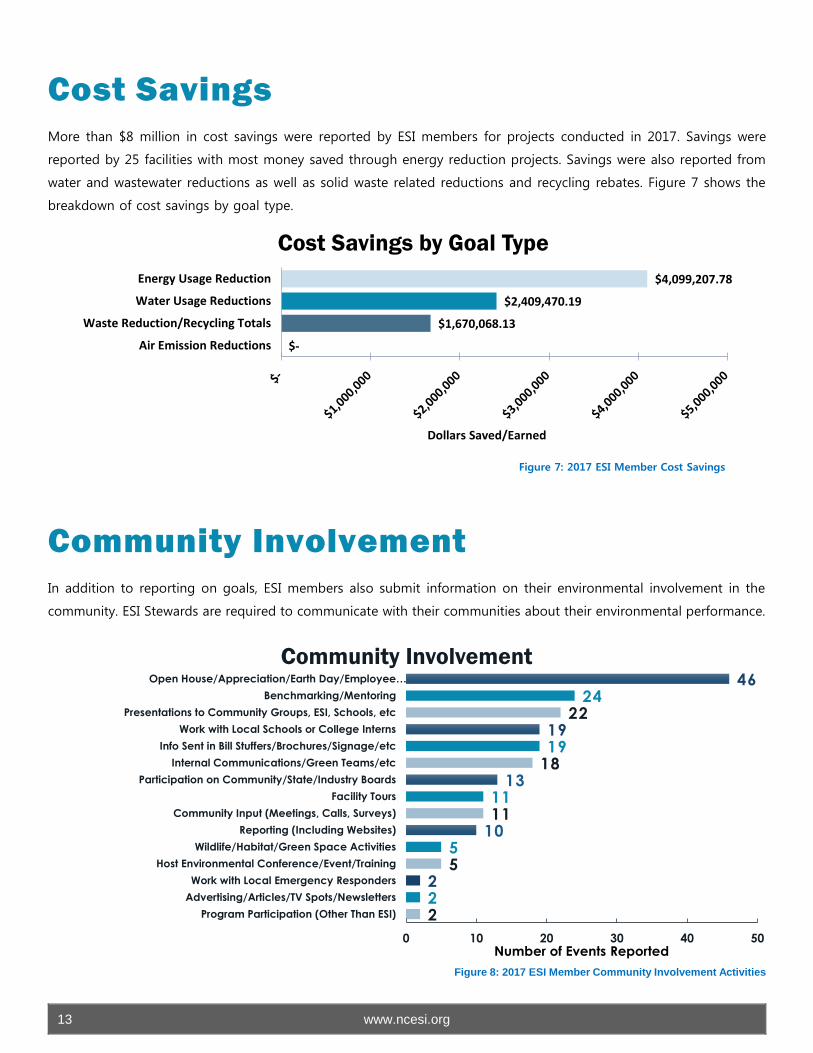
Cost Savings
More than $8 million in cost savings were reported by ESI members for projects conducted in 2017. Savings were
reported by 25 facilities with most money saved through energy reduction projects. Savings were also reported from
water and wastewater reductions as well as solid waste related reductions and recycling rebates. Figure 7 shows the
breakdown of cost savings by goal type.
Community Involvement
In addition to reporting on goals, ESI members also submit information on their environmental involvement in the
community. ESI Stewards are required to communicate with their communities about their environmental performance.
$-
$1,670,068.13
$2,409,470.19
$4,099,207.78
Air Emission Reductions
Waste Reduction/Recycling Totals
Water Usage Reductions
Energy Usage Reduction
Dollars Saved/Earned
Cost Savings by Goal Type
222
55
101111
13181919
2224
46
0 10 20 30 40 50
Program Participation (Other Than ESI)
Advertising/Articles/TV Spots/Newsletters
Work with Local Emergency Responders
Host Environmental Conference/Event/Training
Wildlife/Habitat/Green Space Activities
Reporting (Including Websites)
Community Input (Meetings, Calls, Surveys)
Facility Tours
Participation on Community/State/Industry Boards
Internal Communications/Green Teams/etc
Info Sent in Bill Stuffers/Brochures/Signage/etc
Work with Local Schools or College Interns
Presentations to Community Groups, ESI, Schools, etc
Benchmarking/Mentoring
Open House/Appreciation/Earth Day/Employee…
Number of Events Reported
Axis
Title
Community Involvement
Figure 8: 2017 ESI Member Community Involvement Activities
Figure 7: 2017 ESI Member Cost Savings
14 www.ncesi.org
Although only the Stewards are required to report these activities, other ESI members may choose to report their
activities as well. For 2017, 209 activities were reported by 45 members. Figure 8 shows the breakdown of activities.
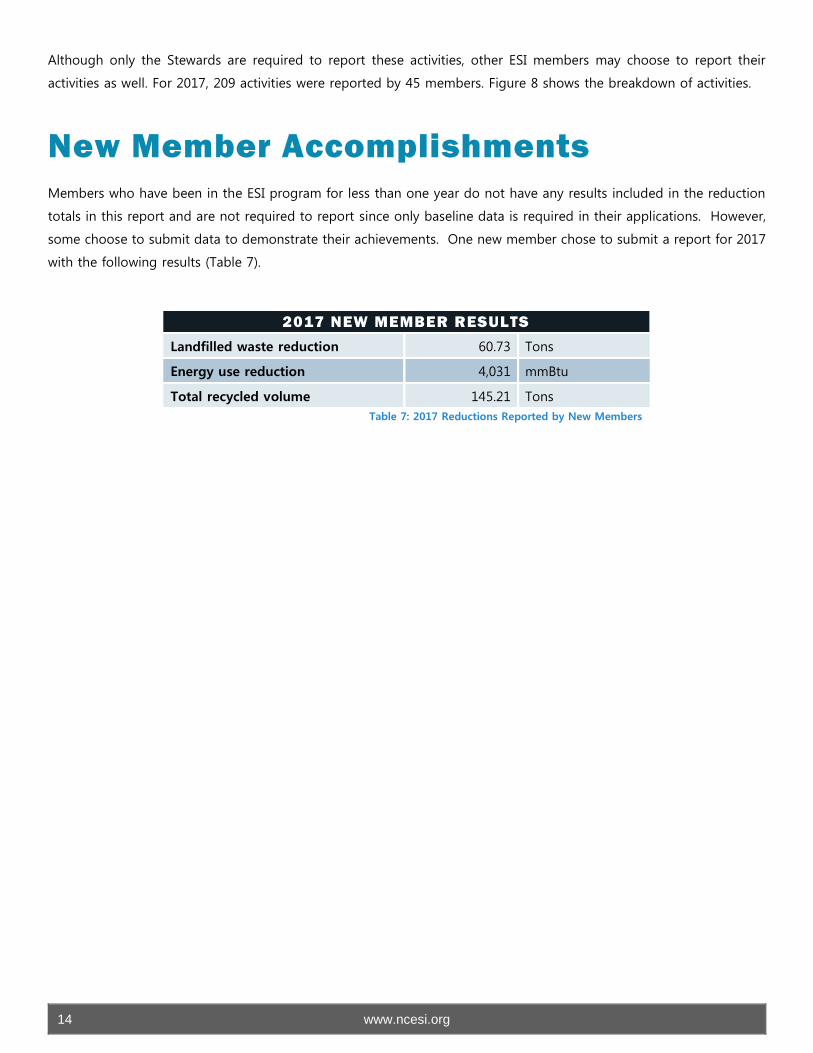
New Member Accomplishments
Members who have been in the ESI program for less than one year do not have any results included in the reduction
totals in this report and are not required to report since only baseline data is required in their applications. However,
some choose to submit data to demonstrate their achievements. One new member chose to submit a report for 2017
with the following results (Table 7).
2017 NEW MEMBER RESULTS
Landfilled waste reduction 60.73 Tons
Energy use reduction 4,031 mmBtu
Total recycled volume 145.21 Tons
Table 7: 2017 Reductions Reported by New Members
15 www.ncesi.org
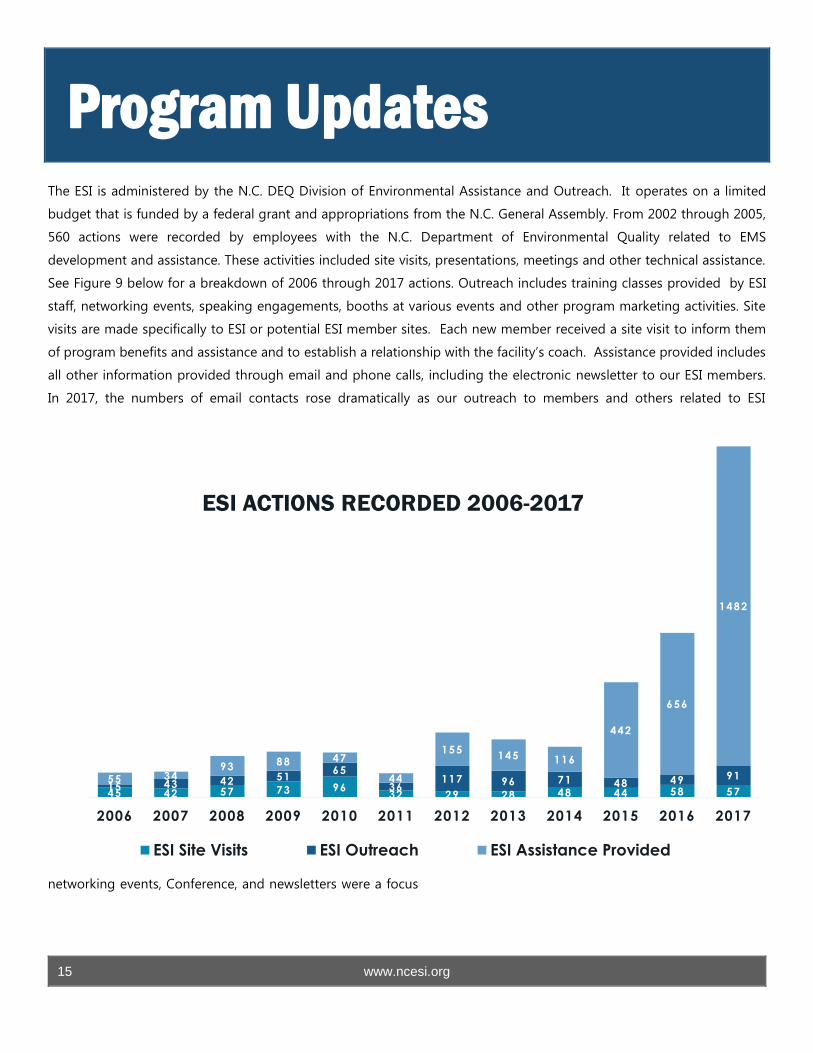
Program Updates The ESI is administered by the N.C. DEQ Division of Environmental Assistance and Outreach. It operates on a limited
budget that is funded by a federal grant and appropriations from the N.C. General Assembly. From 2002 through 2005,
560 actions were recorded by employees with the N.C. Department of Environmental Quality related to EMS
development and assistance. These activities included site visits, presentations, meetings and other technical assistance.
See Figure 9 below for a breakdown of 2006 through 2017 actions. Outreach includes training classes provided by ESI
staff, networking events, speaking engagements, booths at various events and other program marketing activities. Site
visits are made specifically to ESI or potential ESI member sites. Each new member received a site visit to inform them
of program benefits and assistance and to establish a relationship with the facility’s coach. Assistance provided includes
all other information provided through email and phone calls, including the electronic newsletter to our ESI members.
In 2017, the numbers of email contacts rose dramatically as our outreach to members and others related to ESI
networking events, Conference, and newsletters were a focus
45 42 57 73 9632 29 28 48 44 58 57
15 43 42 5165
36117 96 71 48 49 9155 34
93 88 47
44
155145 116
442
656
1482
2006 2007 2008 2009 2010 2011 2012 2013 2014 2015 2016 2017
ESI ACTIONS RECORDED 2006-2017
ESI Site Visits ESI Outreach ESI Assistance Provided
16 www.ncesi.org
In 2017, ESI Staff:
• Provided on-site ISO 14001:2015 internal auditor
training at Thomas Built Buses.
• Held ceremonies at the newest Environmental
Stewards: Uchiyama Manufacturing Corporation; Eaton
Corporation – Youngsville; Firestone Fibers & Textiles;
and Daimler Trucks North America – Mt. Holly.
• Performed verification visits at 7 Steward and 1 Rising
Steward applicant facilities.
• Performed an on-site gap analysis to assist Uchiyama
Manufacturing Corporation with conversion from the
ISO 14001:2004 to ISO 14001:2015.
• Created and provided a management update training
for the ISO 14001:2015 changes. This was created for
ASMO NC in Statesville and provided at their facility.
• Performed five-year renewal verification visits at four
Stewards and three Rising Stewards. Also performed
follow-up visits to two sites that had issues during
their previous renewal visits.
• Presented at ASEE Catawba County meeting about ESI
& DEACS services.
• Hosted booths at the Statewide Safety Conference and
Carolina Star Safety Conference.
• Held the annual ESI Members Meeting at the N.C. Art
Museum, where members networked with each other
and heard from other members and DEACS staff on
various environmental topics.
• Organized and facilitiated the ESI Networking and
Training Event at the N.C. Art Museum, which was
held the day after the Members Meeting. This training
included topics ranging from Recycling Market
updates, Stormwater self-assements, Understanding
electric bills, and ESI applications and reports.
• Held two Advisory Board meetings to review and
make recommendation to the DEQ Secretary on
program changes and Steward and Rising Steward
applications.
• Worked with the N.C. Division of Air Quality to
provide two 2-day training events on the Boiler MACT
and RICE rules. DAQ employees and ESI members
received this training at the same time. One of the
two trainings was held on-site at an ESI member
facility, the other was held at a neutral site in another
part of the state.
• Attended, presented, and had a booth at the NCMA
Energy, Environment, Health, and Safety School; a two-
day training event with multiple tracks covering many
environmental topics from compliance to
sustainability.
• Provided a series of six training modules on
environmental management systems specifically based
on the updated ISO 14001:2015 standard. The
modules were scheduled one per month beginning in
July. January through March also contained the last
three modules to complete the series that was started
in 2016.
• Created and provided training regarding conversion
from ISO 14001:2004 to ISO 14001:2015. This 2-day
class was held three times during 2017 including one
on-site at an ESI member’s facility. All were open to
ESI members as well as others who were interested.
• Arranged and participated in an Environmental
Benchmarking Series event at TE Connectivity in
Greensboro on energy reductions and compressed air.
This event was open to all ESI members and others
interested in the topic. TE Connectivity presented on
their achievements and provided site tours to
demonstrate their projects.
• Arranged and participated in an Environmental
Benchmarking Series event at Caterpillar BCP in
Sanford on solid waste challenges. This event was
open to all ESI members and others interested in the
topic. Caterpillar presented on their achievements and
provided a site tour to demonstrate their projects.
• Planned and participated in a networking event in
Randolph County with our partners at the Economic
Development Partnership of North Carolina. This
event discussed the assistance available through the
Division of Environmental Assistance and Customer
Service, including participation in the ESI, with local
organizations.
17 www.ncesi.org
• Performed four assessments to determine the
functional equivalency of member sites’ EMS with the
ISO 14001:2004 standard.
• Attended trainings on Project Management, Managing
Multiple Projects, and Facilitation.
• Performed an informational visit to one potential ESI
member and five additional coaching visits to ESI
members.
18 www.ncesi.org
Membership
Using pollution prevention and other innovative approaches, this voluntary program offers benefits and recognition to
members for developing and implementing projects to meet and go beyond regulatory requirements.
Any company or organization that operates one or more facilities in North Carolina and whose activities impact the
environment is eligible to participate in the ESI. This includes manufacturers, businesses, agribusiness, service providers,
government agencies, schools and nonprofit organizations. Members can enter the program at any of the three tiers:
Environmental Partner, Rising Environmental Steward or Environmental Steward. Membership criteria in the ESI varies
depending on the tier. In 2012, changes were made to open the Partner level to a wider range of interested
organizations while still maintaining the integrity of the program at the Steward and Rising Steward levels.
19 www.ncesi.org
Criteria
The Environmental Partner level is designed for adoption by a broad range of organizations that are interested in
beginning the process of developing a systematic approach to improving their environmental performance. In 2012,
Partners were given the option to implement measurable goals in lieu of developing an environmental management
system. Additionally, Partners are no longer required to be regulated by a DEQ issued permit to apply. Partner
applications may include multiple sites. By the end of 2017, the program had 149 Environmental Partner sites.
To be considered at the Partner level, the following criteria must be met:
• Demonstrate a commitment to compliance.
• Set environmental performance goals that include pollution prevention and are appropriate to the nature, scale
and environmental impact of the organization and/or commit to developing, implementing and maintaining
an environmental management system based on ISO 14001 or a functionally equivalent model.
• Not be under any environmental criminal indictment or conviction.
• Agree to report annually on progress toward the organization’s environmental performance goals, reductions
in environmental emissions and/or discharges, solid and hazardous waste disposal, use of energy and water
and any reportable non-compliance events.
The Rising Environmental Steward level is designed for those organizations that have a mature environmental
management program. Rising Steward applications must be for a single site. The program had eleven Rising
Environmental Stewards by Dec. 31, 2017.
Rising Environmental Steward applicants must meet all Partner criteria and the following:
• Set measureable environmental performance goals that are adopted into the framework of the EMS, and must
demonstrate improvements to performance.
• Demonstrate a mature EMS based on ISO 14001 or a functionally equivalent model. The EMS for the site must be
ISO 14001 third-party certified or be reviewed on-site and deemed functionally equivalent by DEQ staff.
• Have current or past regulatory oversight or demonstrate exemplary business and environmental practices
normally expected of Rising Stewards.
• Demonstrate commitment to meet and go beyond compliance.
The Environmental Steward level is for those organizations that display a commitment to exemplary environmental
performance beyond what is required by law. Steward applications must be for a single site. By year end 2017, the
program had 29 Environmental Stewards.
Environmental Steward applicants must meet all Partner and Rising Steward criteria and the following:
• Set aggressive environmental performance goals.
• Have a process for communication with the local community on program activities and progress toward
performance goals.
• Demonstrate how their environmental management system is integrated into core business functions.
• Agree to be a mentor to Environmental Partner and Rising Environmental Steward participants.
20 www.ncesi.org
Rising Stewards and Stewards are reassessed after five years of membership for renewal at their current level. Partner
participants are reviewed annually, through their annual report submissions, to assess progress made toward
environmental performance and overall program goals.
Benefits
All levels of ESI members are eligible for the following:
• Technical assistance on developing an environmental management system (EMS), pollution prevention
approaches, environmental management and treatment technologies and maintaining compliance with local,
state and federal regulations;
• Specialized training;
• Networking opportunities including an annual conference;
• A listserv of all ESI members as well as DEQ and WRP staff to provide answers to questions and examples of
best practices;
• Recognition of program participation;
• Use of a program logo for the achieved level;
• Coverage by U.S. EPA and DEQ self-reporting policies;
• A single point of contact within DEQ; and
• Other benefits as deemed appropriate by the Secretary based on recommendations from the Advisory Board.
Partners and Rising Stewards have the additional benefit of access to Stewards as mentors where appropriate.
Environmental Stewards have the following additional benefits:
• Formal public recognition from the Secretary of DEQ that may include an on-site award ceremony,
public announcements and press releases.
• Participation in the Steward Forum chaired by the DEQ Secretary.
• Priority membership on the ESI Advisory Board when appropriate positions are available.
During the annual members meeting, facilities accepted into the program at the Environmental Partner level receive a
certificate of recognition signed by the DEQ Secretary. Rising Environmental Stewards receive a plaque recognizing
their achievement. Environmental Stewards accepted into the ESI receive a personal letter signed by the DEQ Secretary.
The Secretary also presents Stewards with a large plaque during an on-site ceremony. DEQ highlights members’
participation in the ESI program through press releases, the ESI website, newsletters and/or social media posts.
21 www.ncesi.org
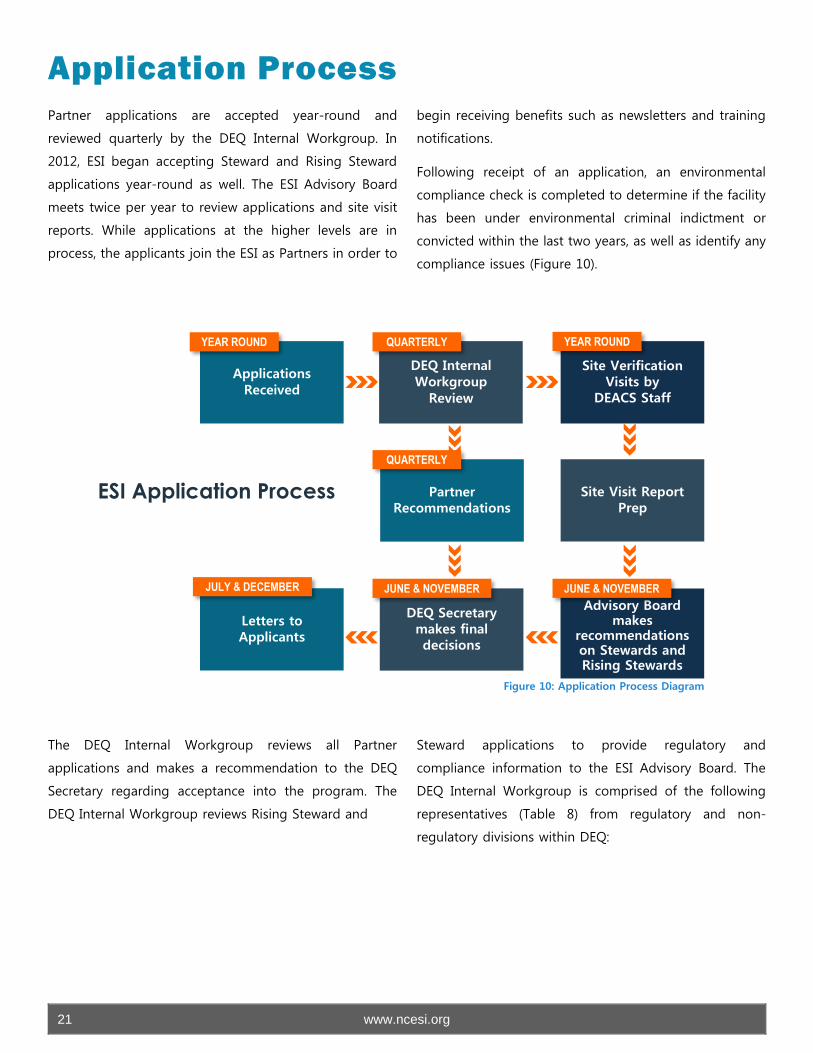
Application Process
Partner applications are accepted year-round and
reviewed quarterly by the DEQ Internal Workgroup. In
2012, ESI began accepting Steward and Rising Steward
applications year-round as well. The ESI Advisory Board
meets twice per year to review applications and site visit
reports. While applications at the higher levels are in
process, the applicants join the ESI as Partners in order to
begin receiving benefits such as newsletters and training
notifications.
Following receipt of an application, an environmental
compliance check is completed to determine if the facility
has been under environmental criminal indictment or
convicted within the last two years, as well as identify any
compliance issues (Figure 10).
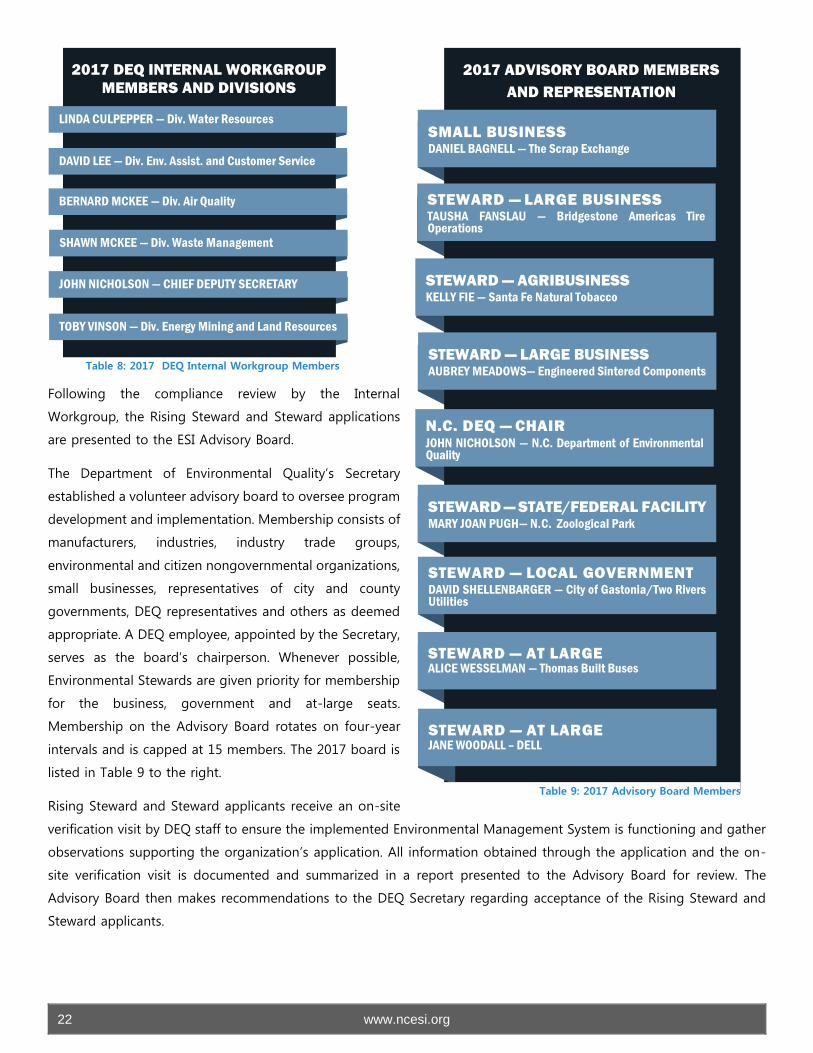
The DEQ Internal Workgroup reviews all Partner
applications and makes a recommendation to the DEQ
Secretary regarding acceptance into the program. The
DEQ Internal Workgroup reviews Rising Steward and
Steward applications to provide regulatory and
compliance information to the ESI Advisory Board. The
DEQ Internal Workgroup is comprised of the following
representatives (Table 8) from regulatory and non-
regulatory divisions within DEQ:
Letters to Applicants
DEQ Secretary makes final decisions
Advisory Board makes
recommendations on Stewards and Rising Stewards
Partner Recommendations
Site Visit Report Prep
DEQ Internal Workgroup
Review
QUARTERLY
QUARTERLY
JUNE & NOVEMBER JUNE & NOVEMBER JULY & DECEMBER
Site Verification Visits by
DEACS Staff
YEAR ROUND
Applications Received
YEAR ROUND
ESI Application Process
Figure 10: Application Process Diagram
22 www.ncesi.org
Following the compliance review by the Internal
Workgroup, the Rising Steward and Steward applications
are presented to the ESI Advisory Board.
The Department of Environmental Quality’s Secretary
established a volunteer advisory board to oversee program
development and implementation. Membership consists of
manufacturers, industries, industry trade groups,
environmental and citizen nongovernmental organizations,
small businesses, representatives of city and county
governments, DEQ representatives and others as deemed
appropriate. A DEQ employee, appointed by the Secretary,
serves as the board’s chairperson. Whenever possible,
Environmental Stewards are given priority for membership
for the business, government and at-large seats.
Membership on the Advisory Board rotates on four-year
intervals and is capped at 15 members. The 2017 board is
listed in Table 9 to the right.
Rising Steward and Steward applicants receive an on-site
verification visit by DEQ staff to ensure the implemented Environmental Management System is functioning and gather
observations supporting the organization’s application. All information obtained through the application and the on-
site verification visit is documented and summarized in a report presented to the Advisory Board for review. The
Advisory Board then makes recommendations to the DEQ Secretary regarding acceptance of the Rising Steward and
Steward applicants.
SMALL BUSINESS DANIEL BAGNELL — The Scrap Exchange
STEWARD — STATE/FEDERAL FACILITY MARY JOAN PUGH— N.C. Zoological Park
STEWARD — AT LARGE ALICE WESSELMAN — Thomas Built Buses
N.C. DEQ — CHAIR JOHN NICHOLSON — N.C. Department of Environmental Quality
STEWARD — LARGE BUSINESS TAUSHA FANSLAU — Bridgestone Americas Tire Operations
STEWARD — AGRIBUSINESS KELLY FIE — Santa Fe Natural Tobacco
STEWARD — LOCAL GOVERNMENT DAVID SHELLENBARGER — City of Gastonia/Two Rivers Utilities
STEWARD — LARGE BUSINESS AUBREY MEADOWS— Engineered Sintered Components
2017 ADVISORY BOARD MEMBERS
AND REPRESENTATION
Table 9: 2017 Advisory Board Members
2017 DEQ INTERNAL WORKGROUP
MEMBERS AND DIVISIONS
Table 8: 2017 DEQ Internal Workgroup Members
LINDA CULPEPPER — Div. Water Resources
BERNARD MCKEE — Div. Air Quality
DAVID LEE — Div. Env. Assist. and Customer Service
JOHN NICHOLSON — CHIEF DEPUTY SECRETARY
SHAWN MCKEE — Div. Waste Management
TOBY VINSON — Div. Energy Mining and Land Resources
STEWARD — AT LARGE JANE WOODALL – DELL

23 www.ncesi.org
The DEQ Secretary reviews the recommendations made by the Advisory Board and makes final decisions regarding the
recommendations. Organizations accepted into the program are usually announced in June and December of each
year.
24 www.ncesi.org
Conclusions The results from the ESI annual report show that an approach that exceeds regulatory requirements can lead to positive
impacts for regulated pollutants and non-regulated environmental and economic factors. This DEQ program is unique
in its ability to collect environmental data across media, including monetary savings associated with the environmental
improvements made. These savings to the financial and environmental bottom line help North Carolina organizations
be resilient and promote economic growth. The Environmental Stewardship Initiative encourages North Carolina
organizations to share their environmental success stories across sectors in order to provide a better environment for
everyone in the state.
25 www.ncesi.org
2017 ESI Members
Stewards
• ASMO North Carolina Inc. – Statesville
• Bridgestone Americas Tire Operations LLC –
Wilson
• City of Gastonia Crowders Creek Resource
Recovery Facility
• City of Gastonia Long Creek Resource Recovery
Facility
• City of Gastonia Water Treatment Plant
• Corning Inc. – Wilmington
• Daimler Trucks North America LLC – Cleveland
• Daimler Trucks North America LLC – Gastonia
• Daimler Trucks North America LLC – Mt. Holly
• Dell – Apex
• Eaton Corporation, Youngsville Plant Operations
• Engineered Sintered Components – Troutman
• Firestone Fibers & Textiles – Kings Mountain &
Gastonia
• Fleet Readiness Center East – Cherry Point
• GKN Driveline – Sanford Precision Forming Facility
• Grifols Therapeutics – Clayton
• Hickory Manufacturing and Technology Center,
Corning Optical Communications
• John Deere Turf Care – Fuquay-Varina
• Keihin Carolina System Technology, LLC – Tarboro
• Leggett & Platt ON64 – High Point
• N.C. Zoological Park – Asheboro
• Santa Fe Natural Tobacco Knotts Grove Campus –
Oxford
• Smithfield Packing Company – Wilson
• Stanley, Black & Decker – Kannapolis
• TE Connectivity – Pegg Rd – Greensboro
• TE Connectivity – Burgess Rd – Greensboro
• Thomas Built Buses, Inc. – High Point
• Uchiyama Manufacturing America LLC – Goldsboro
• U.S. Environmental Protection Agency – RTP
26 www.ncesi.org
Rising Stewards
• Ajinomoto North America, Inc. – Raleigh
• ASMO Greenville of North America, Inc.
• Bridgestone-Bandag, LLC – Oxford
• City of Gastonia Resource Recovery Farm
• Eaton Corporation, Raleigh Production Operations
• GKN Driveline – Roxboro
• GKN Sinter Metals – Conover
• Hyster-Yale Group – Greenville
• Mecklenburg Co. Solid Waste Operations – Charlotte
• Qorvo, Inc – Greensboro
• Smithfield Farmland – Tar Heel Facility
27 www.ncesi.org
Partners
• Alliance One International Inc. (5)*
• American Emergency Vehicles
• American Snuff Company / Taylor Brothers
• Baker Furniture – High Point
• Baker Furniture – Hildebran
• Borg Warner Thermal Systems – Fletcher
• BorgWarner Turbo Systems – Arden
• Burt's Bees Inc. – Morrisville
• Cape Fear Public Utility Authority (8)*
• Cascades Tissue Group – North Carolina Inc. –
Rockingham
• Caterpillar BCP – Clayton
• Caterpillar BCP – Sanford
• Charlotte-Mecklenburg School System
• City of Gastonia Public Works Division
• City of Hendersonville Water Treatment Plant
• City of Shelby First Broad River Wastewater
Treatment Plant
• City of Shelby Water Treatment Plant
• CommScope – Greensboro
• Core Technology Molding Corporation
• Crown Equipment – Kinston
• Domtar Paper Company, LLC – Plymouth
• Eaton – Capital Blvd – Raleigh
• Freudenburg Nonwovens – Durham
• General Electric Company – Aviation – RTP
• Haeco Airframe Services – Greensboro
• Industrial Connections & Solutions LLC – Mebane
• International Paper – Riegelwood Mill
• Iredell Fibers, Div. of Leggett & Platt – Statesville
• Kao Specialties Americas, LLC – High Point
• Liberty Tire Recycling, LLC (2)*
• Linamar Corporation
• Louisiana-Pacific Corp, Roaring River Plant
• Martin Marietta (58)*
• Michelin Aircraft Tire Co. – Norwood
• Mylan Pharmaceutical Greensboro
• NIEHS – RTP
• N.C. DOT Ferry Division (9)*
• Pfizer – Sanford
• Piedmont Service Group Raleigh Office
• PRC Industries
• PSNC Energy Carolinas Inc. (21)*
• RJ Reynolds Tobacco (3)*
• SELEE Corporation – Hendersonville
• Siemens Medical Solutions, CSG Service
Headquarters – Cary
• Smithfield Clinton Plant
• Southern Research Institute - Energy &
Environment
• Universal Leaf North America US Inc. (2)*
• Water and Sewer Authority of Cabarrus Co. (4)*
*Denotes multi-site Partners
N.C. Department of Environmental Quality
Division of Environmental Assistance and Customer Service
1639 Mail Service Center, Raleigh, NC 27699-1639
877-623-6748 (toll-free)
Cover Photo 1: Employees of Grifols Therapeutics in Clayton receive Environmental Steward recognition from Governor Roy Cooper and
DEQ Secretary Michael Regan.