Embed Size (px)
Citation preview
UN
IVE
RSITY
OF W
ATE
RLO
O | Environm
ental Sustainability Report
I
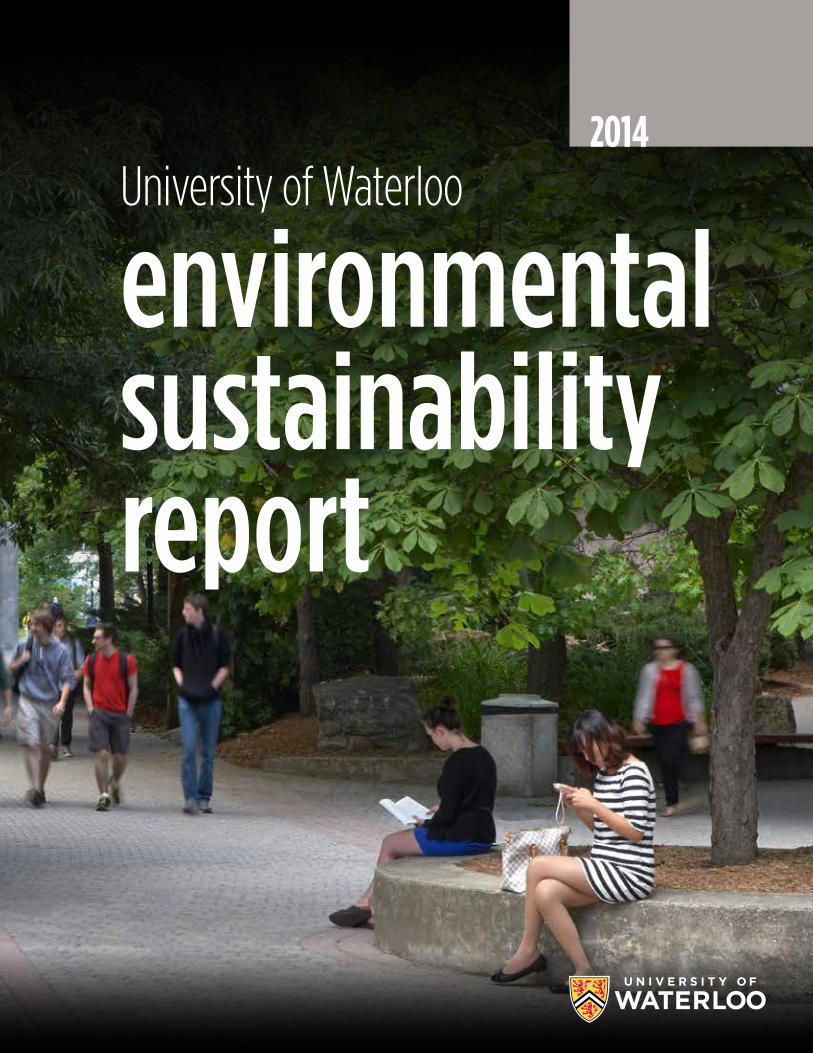
2014 University of Waterloo
environmental sustainability report

|
ADVISORY COMMITTEE
PRESIDENT’S ADVISORY COMMITTEE ON SUSTAINABILITY: Jean Andrey Dean, Faculty of Environment Committee Co-Chair
Dennis Huber Vice President, Administration and Finance Committee Co-Chair
Annette Carroll Financial Coordinator, Food Services
Taginder Clair Student, Faculty of Environment Coordinator, Sustainable Campus Initiative
Amelia Clarke Professor, Faculty of Environment
Andrew McMurry Professor, Faculty of Arts
Rachel Mitchell Graduate Student, Faculty of Environment
Bob Lemieux Dean, Faculty of Science
Ambika Opal Student, Faculty of Engineering
Peter Pillsworth Facilities Coordinator, St. Paul’s University College
Mat Thijssen Sustainability Coordinator
Rick Zalagenas Director, Maintenance and Utilities
Published: October 2015
For inquiries about this report, please contact:
MAT THIJSSEN, Sustainability Coordinator 519-888-4567, ext. 30271 [email protected]
uwaterloo.ca/sustainability
UN
IVE
RSITY
OF W
ATE
RLO
O | Environm
ental Sustainability Report
1
TABLE OF CONTENTS INTRODUCTION:
Message from the President ......................................... 2
Message from the Sustainability
Advisory Committee Co-Chairs ................................... 3
About the report .............................................................. 4
Institutional overview ..................................................... 6
ACADEMICS: Sustainability courses ..................................................... 8
Sustainability programs ................................................. 9
Sustainability research ................................................... 10
OPERATIONS: Energy ................................................................................. 14
Climate Change ................................................................ 16
Water ................................................................................... 18
Waste .................................................................................. 20
Transportation .................................................................. 22
Grounds .............................................................................. 24
Food .................................................................................... 26
Procurement ..................................................................... 28
ENGAGEMENT: Student engagement ..................................................... 30
Employee engagement .................................................. 32
Community engagement .............................................. 33
GOVERNANCE .......................................................................... 34
LOOKING FORWARD .............................................................. 36
ACKNOWLEDGEMENTS ......................................................... 37
APPENDICES APPENDIX A:
Academics ......................................................................... 38
APPENDIX B: Operations ......................................................................... 41
REFERENCES ............................................................................. 48
UNIVERSITY OF WATERLOO2
INTRODUCTION
messages from ... THE PRESIDENT
I am proud to present the University of Waterloo 2014 Environmental Sustainability Report, which reflects and builds on Waterloo’s goal of embedding sustainability deep within the University community.
Our University has a long history of leadership on
environmental issues. From establishing Canada’s first
Faculty of Environment, to building Ontario’s first LEED-
Platinum structure on a university campus, to maintaining
a thriving curriculum on water, energy, and climate change,
sustainability has always been part of who we are.
As you will read about in this report, we are building
on those strengths to achieve new successes, like a
10% decrease in waste-to-landfill in 2014, and a 7.5%
decrease in greenhouse gas intensity from 2010-2014.
We still have lots of work to do — we need to make
our facilities greener, our carbon footprint lighter, and
sustainability has to become essential to how we think
and operate at every level of the organization.
To ensure we sustain our momentum and continue
achieving tangible results, I am pleased to have the
support of our new President’s Advisory Committee
on Sustainability. This group, mandated to bring
forward ambitious, achievable goals and an action
plan to achieve them, first convened in May 2015 and
comprises faculty, student, and staff representatives.
I look forward to continuing our work together.
As you review this report, and consider how you
can contribute to our sustainability work in your
own way, remember that these efforts are essential
to Waterloo’s success over the long term. It brings
us into better alignment with our values, fosters
the long-term welfare of our natural environment,
and builds public trust.
Thank you for joining with me and the President’s
Advisory Committee on this important effort.
Sincerely,
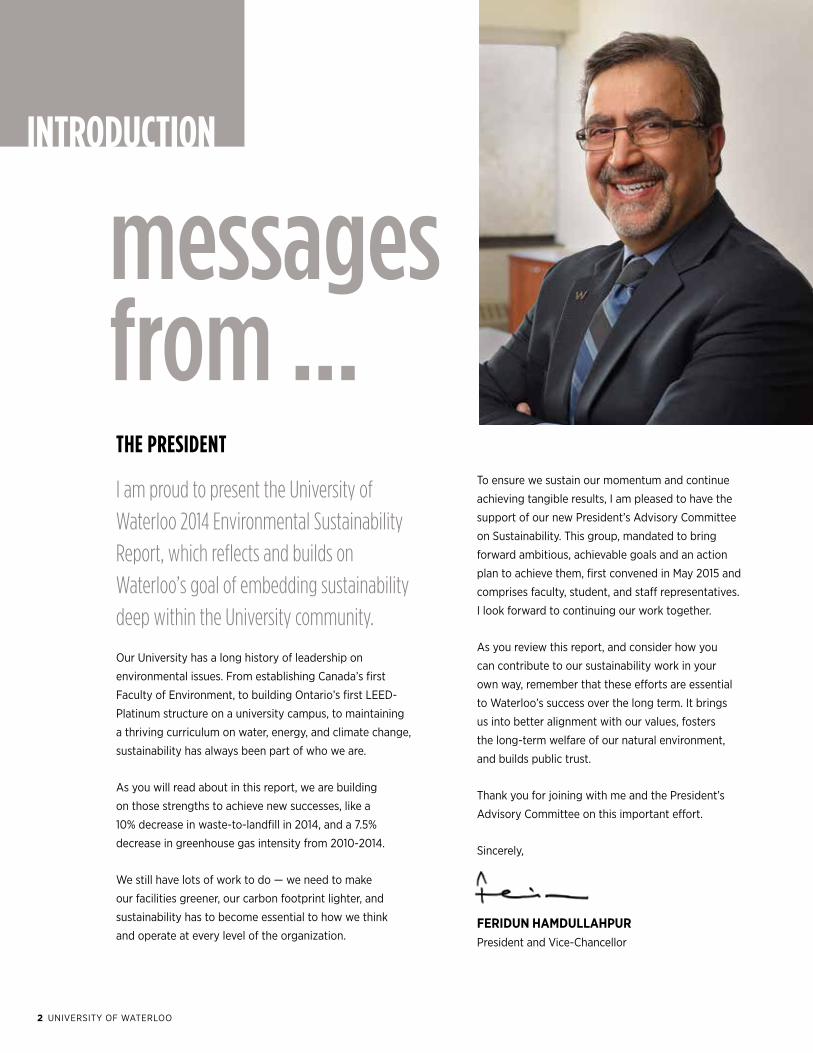
FERIDUN HAMDULLAHPUR
President and Vice-Chancellor

UN
IVE
RSITY
OF W
ATE
RLO
O | Environm
ental Sustainability Report
3
SUSTAINABILITY ADVISORY COMMITTEE CO-CHAIRS
In 2009, the University of Waterloo signed the Council of Ontario Universities’ sustainability pledge, Ontario Universities: Committed to a Greener World. By signing this pledge, the University accepted responsibility for developing and implementing strategies that address a number of environmental issues, from the resources we use to the waste that we produce.
In 2010, the first University of Waterloo Sustainable Development Report was
produced. Since that time, much has changed on campus — environmental
curricula have evolved, green technologies have been adopted, and new
practices have been implemented.
As the University of Waterloo continues to improve our campus sustainability,
two notable milestones were achieved in the winter of 2015: appointment of
a full-time Sustainability Coordinator and creation of the President’s Advisory
Committee on Sustainability. This report, entitled, University of Waterloo
2014 Environmental Sustainability Report, represents the third major
achievement of the year. The report covers the three high-level impact areas
of Academics, Operations, and Engagement, with specific indicators in each
section. And so as to be comparable with other universities, the reports uses
the recommended calculations from the Association for the Advancement of
Sustainability in Higher Education’s assessment framework, the Sustainability
Tracking, Assessment and Rating System.
We are proud of our achievements to date, and committed to moving
forward on the sustainability agenda over the coming months and years.
Sincerely,
JEAN ANDREY
Dean of Environment
DENNIS HUBER
Vice President Administration and Finance

UNIVERSITY OF WATERLOO4
INTRODUCTION
about the report Sustainability means more than just a commitment to the environment. It is about maintaining the integrated health of the environment, society, and economy for today and into the future. The University of Waterloo is committed and active
in pursuing all three dimensions of sustainability.
While other offices are tackling the social and
economic spheres, the President’s Advisory
Committee on Sustainability is tasked specifically
with our environmental performance.
As such, the 2014 Environmental Sustainability
Report highlights the University’s progress on
a number of environmental indicators, while
recognizing there are mutually reinforcing
connections with economic and social sustainability.
In this report, the term ‘sustainability’ refers
specifically to environmental sustainability.
The Spheres of Sustainability
ENVIRONMENT
SOCIETY
ECONOMY

The report covers the three high-level impact
areas of academics, operations, and engagement,
with specific data and indicators in each section.
It concludes with sections on Governance and
“Looking Forward.” For each data set or indicator,
there is supplementary methodology available
in the appendices at the end of the report.
General principles followed in the completion
of this report include:
Transparency: Presenting all relevant and available
information in order to celebrate successes and
acknowledge areas for improvement.
Clarity: Displaying technical indicators in a fashion
that is simple to understand, with details for those
who are interested.
Currency: Reflecting calendar years from
2010-2014, unless otherwise noted.
Geography: Covering all University of Waterloo
campuses, unless otherwise noted. The report
also includes information on Federated University
and Affiliated Colleges where noted.
Methodology: Utilizing a common framework and
explaining calculations. For comparability with other
universities and to enable a future full sustainability
assessment, the report uses the recommended
calculations from the STARS 2.0 technical manual
whenever possible. Created by the Association
for the Advancement of Sustainability in Higher
Education, STARS stands for the Sustainability
Tracking, Assessment, and Rating System. It is a
comprehensive tool for evaluating college and
university sustainability efforts.

UNIVERSITY OF WATERLOO6
INTRODUCTION
institutional overviewIn just half a century, the University of Waterloo, located at the heart of Canada’s technology hub, has become a leading comprehensive university with nearly 36,000 full- and part-time students in undergraduate and graduate programs. Consistently ranked Canada’s most innovative university, Waterloo is home
to advanced research and teaching in science and engineering, health,
environment, arts and social sciences. From quantum computing and
nanotechnology to clinical psychology and health sciences research,
Waterloo brings ideas and brilliant minds together, inspiring innovations
with real impact today and in the future.
As home to the world’s largest post-secondary co-operative education
program, Waterloo embraces its connections to the world and encourages
enterprising partnerships in learning, research, and commercialization.
With campuses and education centres on four continents, and academic
partnerships spanning the globe, Waterloo is shaping the future of the planet.

UN
IVE
RSITY
OF W
ATE
RLO
O | Environm
ental Sustainability Report
7
overview of sustainability at Waterloo, 2010-2014
500+sustainability courses or courses that include sustainability
239 researchers from all six faculties;
11 SUSTAINABILITY-RELATED research institutes
CLIMATE CHANGE:
4.7% decrease in emissions per capita; 7.5% decrease in emissions per
square meter (2010 to 2014)
WASTE:
10% reduction in total waste to landfill in 2014;
Student group launches on-site compost program and recycles 2,000 pounds of waste
Joining TravelWise to provide sta� and students access to: carpool matching, emergency ride home, discounted GRT passes
13 student groups on campus
Creation of Sustainability Advisory Committee
Environment 3 became the first LEED-Platinum Certified building on an Ontario university campus
WATER:
20%reduction in water
use per capita; 22% reduction in water use per square meter (2010-2014)

UNIVERSITY OF WATERLOO8
ACADEMICS As an institution of higher education, it is natural to start with an analysis of how sustainability is embedded in our academic areas. Courses, programs, and research are Waterloo’s largest impact areas as an organization, and sustainability is integrated into all areas.
sustainability coursesThe skills and theoretical and applied knowledge
developed in the classroom empower students to
solve pressing environmental challenges around
the world. This education encourages a shift to
more sustainable lifestyles. The University of
Waterloo has over 500 courses focusing on at
least one sustainability theme, or including content
related to sustainability. While there is natural
leadership within the Faculty of Environment,
there is robust curriculum across the faculties in
areas such as governance, technological innovation,
and understanding of the natural environment.
NOTES: For methodology, see Appendix A1 – Sustainability Courses
Sustainability-Related Courses
300
133
27
68
57
14 1
Coursesthat IncludeSustainability
ENV
ARTS
ENG
SCI
AHS
MATH
208Courses
Focused onSustainability
149
21
1715 6

UN
IVE
RSITY
OF W
ATE
RLO
O | Environm
ental Sustainability Report
9
Masters in Climate Change
In 2013, the University of Waterloo launched the Masters of Climate
Change program, the first of its kind in Canada. Based in the
Department of Geography and Environmental Management, the
program provides students with an interdisciplinary understanding of the complex scientific, socio-
economic, technological, and institutional issues involved in a
transition to a low-carbon economy and climate-resilient adaptation.
Collaborative Water Program
Funding from the RBC Foundation supported the launch of the
interdisciplinary Collaborative Water Program from ten
participating departments on campus. Co-ordinated by the Water Institute, the program
exposes students to the complex scientific, economic, and
governance challenges influencing global and local water issues, and connects them to visiting
scholars and experts.
sustainability programsSustainability courses do not exist as electives alone. Many programs
across campus have a strong focus on sustainability, or have streams or
applications related to sustainability. The University of Waterloo offers
58 programs across all levels and all faculties where students have
the option to study sustainability or a sustainability-related problem.
The breadth of program offerings among all six faculties indicates
the importance of embedding sustainability into many areas of a
modern education. From water flow modelling in applied mathematics
to architecture to chemistry, there are many theoretical and applied
sustainability program options for students.
Graduates from these programs bring social, technological,
and economic innovation to global challenges.
Sustainability-Related Programs
NOTES: For methodology, see Appendix A2 – Sustainability Programs
23
134
10
17
22
213
21 DIPLOMA
MASTERS
UNDERGRADUATE
PhD
58By Faculty
ENV
ENG
SCI
ARTS
MATH
AHS
58By Level

UNIVERSITY OF WATERLOO10
ACADEMICS
sustainability researchCoupled with student learning, research
is a cornerstone of university activity.
At the University of Waterloo, 239
researchers across all six faculties address
pressing sustainability issues, often in an
interdisciplinary manner. Formal research
institutes reflect strengths and activity in
the areas of climate change, water, and
energy. Research exploring terrestrial
systems, geographic mapping and
modelling, and sustainable community
planning reflects strong activity in
the land use theme, and sustainable
transportation research is underway in
the areas of infrastructure development,
planning, and green vehicles. Many
faculty members also conduct
research on more general concepts of
environmental sustainability which go
beyond any specific thematic area.
Sustainability-Themed Research from Faculty
*Note that themes are not mutually exclusive. Researchers may be included under two or more categories.
Climate Change
Number of Faculty with Research Interests/Areas*
Water
Energy
Land Use
Transportation
Biodiversity/Conservation
Food
Waste
Buildings
Air Quality
General/Other Sustainability
AHS
ARTS
ENG
ENV
MATH
SCI
0 10 20 30 40 50 60 70

UN
IVE
RSITY
OF W
ATE
RLO
O | Environm
ental Sustainability Report
11
Researchers often approach these thematic areas through the lens of environmental science to deepen
understanding of the natural environment and of human impact upon the natural world. There are also
many faculty exploring the development or application of new technologies to address sustainability
challenges, from battery technology to smart grids, and from remote sensing to wastewater filtration.
Research on policy innovation, societal changes related to environment, and economic relationships
with the environment are also prominent. The interaction between environment and health is an
emerging lens of research, as is the study of sustainability discourse and framing.
Faculty Approaches/Applications for Sustainability Research
*Note that approaches are not mutually exclusive. Researchers may be included under two or more categories.
Enivronmental Sciences
Technology
Policy/Governance
Social
Business/Economics
Health
Communications
Number of Faculty with Research Approaches/Applications*
0 20 40 60 80 100 120
102
76
68
55
43
9
8

UNIVERSITY OF WATERLOO12
ACADEMICSresearch case studies
Bryan Grimwood, Recreation and Leisure Studies
Professor Grimwood’s research on arctic tourism and environmental responsibility takes him to the Thelon River in Canada’s north, where he explores the relationships between Aboriginal communities and a sacred landscape undergoing social and ecological changes.
Steven Bednarski, History
Professor Bednarski leads a team of historians, archeologists, and paleontologists studying the impacts of climate change on a medieval village in southern England. Understanding how past communities have responded to increased rainfall, coastal flooding, and changing temperatures offers alternative perspectives on the current climate crisis.
Francis Poulin, Applied Mathematics
Professor Poulin’s calculations of ocean currents around Cape Cod help understand the conditions experienced by the endangered right whale during their spring travels. The models could one day help predict plankton blooms on which the whales depend, and will deepen insights into ocean currents in coastal waters.
Susan Tighe, Civil and Environmental Engineering
Professor Tighe is the Norman W. McLeod Professor in Sustainable Pavement Engineering and Director of the Centre for Pavement and Transportation Technology. She explores ways to make roads and surface infrastructure more sustainable by extending pavement lifespan under a changing climate and using recycled materials in pavement construction.

»»»»»»»»»»»
Ian Rowlands, Environment and Resource Studies
Professor Rowlands looks to transform the way we use and conserve energy, making it convenient for homeowners to save money and reduce energy consumption. This includes participation in projects that deploy smart grid technologies, evaluate energy policy, and deepen understanding of individual interactions with advanced building systems.
Linda Nazar, Chemistry
Recently named a Web of Science 2014 Highly Cited Researcher and Officer of the Order of Canada, Professor Nazar’s research team is developing new materials for energy storage that could double the range of electric vehicles and increase electricity grid storage capacity, while being lower cost and more sustainable than current lithium-ion technology.
RESEARCH CENTRES AND INSTITUTES
Centre for Control of Emerging Contaminants
Centre for Ecosystem Resilience and Adaptation
Centre for Groundwater Research
Centre for Pavement and Transportation Technology
Heritage Resources Centre
Interdisciplinary Centre on Climate Change
Water Institute
Waterloo Centre for Automotive Research
Waterloo Institute for Complexity Innovation
Waterloo Institute for Sustainable Energy
Waterloo Institute for Social Innovation and Resilience
NOTES: For methodology, see Appendix A3 – Sustainability Research

UNIVERSITY OF WATERLOO14
OPERATIONS
The University of Waterloo is a leader in academic activity and innovation on environmental sustainability. At a more concrete level, the operations of the physical campus offer a wide range of areas impacting Waterloo’s sustainability performance. As a large organization, these are significant. Leading by example in our campus operation and individual behaviours has the potential to improve the local environment, enhance the University’s reputation, and improve financial efficiency.
energyEnergy is one of the most widely referenced
sustainability indicators, and is important
from both an environmental and financial
perspective. As the University of Waterloo
continues to grow, the total energy consumed
by the campus has also grown. Most years had
a small increase of 3-5 per cent, while 2013
saw a 12 per cent increase in total energy use.
Energy consumption is best understood in
the context of campus size. Comparing the
energy consumed per square meter accounts
for increased space as new buildings begin
to consume energy, otherwise known as
“intensity”. Waterloo’s energy intensity has
remained consistently below the average for
other research-intensive universities in Ontario.
Total Energy Consumption
NATURAL GAS
ELECTRICITY
Giga
joules
0
200,000
2010 2011 2012 2013 2014
400,000
600,000
800,000
1,000,000
1,200,000

»»
»
»
»
Case Study: Building Design
Energy efficiency begins with building design. Ensuring the campus grows sustainably, all new buildings are designed to LEED Silver standards, at minimum. LEED stands for Leadership in Energy and Environmental Design, and is a certification system that requires buildings to meet sustainability performance thresholds. The Environment 3 building is certified LEED Platinum, the first of its kind on an Ontario university campus, and includes a solar panel array capable of generating 67,000 kWh of electricity each year.
Weather and use of space are two significant factors
influencing our energy use. Buildings need more
energy to maintain a comfortable working and learning
environment during cold winters and hot summers.
Adding up degree days — a measure of how much
the outside temperature is warmer or cooler than the
desired inside temperature — over a year is a useful
way to understand how hard the mechanical systems
worked. The graph shows a strong correlation between
local weather conditions and annual energy use,
particularly during the cold winters of 2013 and 2014.
The type of new spaces added to campus also shape
energy use. For example, Waterloo added 8,400
square meters of new laboratory space between
2012 and 2013. These facilities are vital to enable the
University’s innovative research, but they require
advanced equipment and building systems that are
more energy-intensive than classroom or office space.
Energy Intensity versus Degree Days
NOTES: For methodology, see Appendix B1 – Energy
WHAT CAN I DO?
Energy efficiency ends with the people
who use our buildings. Whether you’re
in the office, in the lab, in residence,
or at home, follow these simple tips
to save energy and money:
Turn off your computer when not in use
Charge your cellphone overnight to
balance demand on the electricity grid
Flick off the lights when you leave
your room
Keep windows closed when the heat
or cool is running
Close fume hoods in labs — every
inch a fume hood is left open costs
$200 per year in energy!0.800
1.000
1.200
1.400
1.600
1.800
2.000
0
1,000
2,000
3,000
4,000
5,000
2010 2011 2012 2013 2014
Ener
gy In
tens
ity (G
J/m2)
Annu
al De
gree
Day
s
Annual Energy Intensity (UWaterloo)
Ontario G15 Energy Intensity Average 2011/12
Annual Degree Days

UNIVERSITY OF WATERLOO16
OPERATIONS
»
»
»
Regional Carbon Initiative
Waterloo joined the Regional Carbon Initiative (RCI) in 2012 with an intent to set an emissions reduction target for campuses within Waterloo Region. The RCI offers tools and resources to a network of local organizations working to reduce their climate change emissions, and provides public recognition for successful efforts. In 2014, the University also supported the David Johnston Research and Technology Park in joining the RCI, building momentum to be the first research park in Canada to establish an emissions target.
climate change Climate change presents one of the most pressing
global sustainability issues, with effects that are
already impacting close to home. The University
of Waterloo contributes to climate change from a
number of activities. The heat blowing from a vent,
campus plows and lawnmowers, cafeteria waste,
computers, and even the water coming out of the tap
all contribute emissions. Many of these are necessary
to function as an organization, but when magnified
by the tens of thousands of people on campus every
day, they add up to over 1 per cent of all emissions
in Waterloo Region and over 3.3 per cent of all
local workplace-related emissions in 2010.
All emissions fall into three scopes under the Greenhouse Gas Protocol:
Scope 1 — Emissions created on-site,
such as through UW’s fleet and boilers
Scope 2 — Emissions from
electricity production
Scope 3 — Other emissions,
including waste, water, and
transmission and distribution
(T and D) losses
More than three-quarters of all emissions at the
University of Waterloo came from Scope 1 sources
in 2014, the vast majority of which was fuel used to
heat campus buildings. One-fifth of emissions came
from electricity use, and a very small percent came
from waste and water. It is expected that emissions
from business-related travel would also form a large
percentage of Waterloo’s emissions profile. This
data, however, is not currently available. Business
travel includes employee and student trips to offsite
locations and emissions from air travel, such as travel to
conferences. The introduction of new expense reporting
software could help quantify emissions from employee
travel in future years under the Scope 3 category.
NOTES: For methodology, see Appendix B2 – Climate Change
76.42%
2014 GHGEmissionsBy Source
2014 EmissionsBy Scope
Natural Gas Emissions
Fleet Emissions
Electricity Emissions
T and D Losses
Waste Emissions
Water Emissions
Scope 1
Scope 2
Scope 3
1.13%
0.06%
0.79%
20.39%
77.63%
20.39%
1.98%
1.21%

UN
IVE
RSITY
OF W
ATE
RLO
O | Environm
ental Sustainability Report
17
»»
Three large trends affected the University of Waterloo’s greenhouse gas (GHG)
emissions from 2010 to 2014. First, emissions from electricity use decreased
by over 30 per cent from 2010 through 2014 despite a 16 per cent increase in
electricity consumption. In 2010, electricity represented 31 per cent of Waterloo’s
emissions. This shrunk to 20 per cent by 2014. Ongoing changes to the provincial
electricity grid, including phasing out coal-fired power plants and introducing
more renewable energy, have enabled this downward trend.
Second, weather conditions increased the use of natural gas to heat campus
buildings. The proportion of natural gas emissions has increased from 61 per cent
in 2010 to 76 per cent in 2014. This is due to a declining proportion of electricity
emissions, but also two colder than normal winters. Future emissions will depend
upon local winter conditions.
Lastly, it is necessary to place these climate change emissions in the context of
campus growth. When accounting for growing floor space and the increased
number of staff, students, and faculty from 2010 to 2014, there has been:
A 4.7 per cent reduction in emissions per capita
A 7.5 per cent reduction in emissions per square meter
This result should be celebrated and form a foundation for further action.
Total GHG Emissions, 2010-2014
Carbon Intensity
WHAT CAN I DO?
Following energy savings tips will also reduce
climate change emissions at the University. Many of
our everyday activities, however, also contribute to
climate change. In fact, workplaces like UWaterloo
represent only 32 per cent of all climate change
emissions in Waterloo Region, according to our
local Climate Action Plan. The other 68 per cent
comes from transportation, our homes, agriculture,
and waste. Almost everything you do on campus to
lower your impact can also be applied at home.
Natural Gas Emissions
Fleet Emissions
Electricity Emissions
T and D Losses
Waste Emissions
Water Emissions0
5,000
10,000
15,000
20,000
25,000
30,000
35,000
40,000
45,000
Gree
enho
use G
as Em
ission
s (To
nnes
CO2-e
quiva
luent
)
2010 2011 2012 2013 2014
2010 2011 2012 2013 20140.00
10.00
20.00
30.00
40.00
50.00
60.00
70.00
80.00
0.00
200.00
400.00
600.00
800.00
1000.00
1200.00
1400.00
kg CO
2 -equ
ivalen
t per
m2
kg CO
2 -equ
ivalen
t per
perso
nEmissions Per m2 Emissions Per Person

UNIVERSITY OF WATERLOO18
OPERATIONS
»»
water use Southwestern Ontario is blessed with abundant
water supplies, but there is still a growing need for
conservation to minimize expensive new infrastructure.
The University of Waterloo uses water for grounds
maintenance, heating and cooling, and in washrooms
and residences. Many research facilities also require
substantial water to operate, such as the fish lab.
2014 saw a 15 per cent year-over-year decrease in water
use, and a 10 per cent decrease since 2010. This is a
positive trend, and occurred despite the physical and
population growth of the campus. When analyzing the
intensity of water use across campus between 2010
and 2014, there was:
A 22 per cent reduction in water use per square meter
A 20 per cent reduction in water use per capita
This points to the success of several programs, such as
low-flow showers and plumbing fixtures, and a closed-
loop circulation system that diverts a substantial
amount of cooling water from going down the drain.
NOTES: For methodology, see Appendix B3 — Water
Total Water Used
Water Intensity
Wat
er Co
nsum
ption
(m3 )
2010 2011 2012 2013 20140
100,000
200,000
300,000
400,000
500,000
600,000
700,000
800,000
602,7
47
602,6
03
602,0
31
636,0
70
537,1
93
M3 of W
ater
Use
d Per
M2
2010 2011 2012 2013 20140
0.20
0.40
0.60
0.80
1.00
1.20
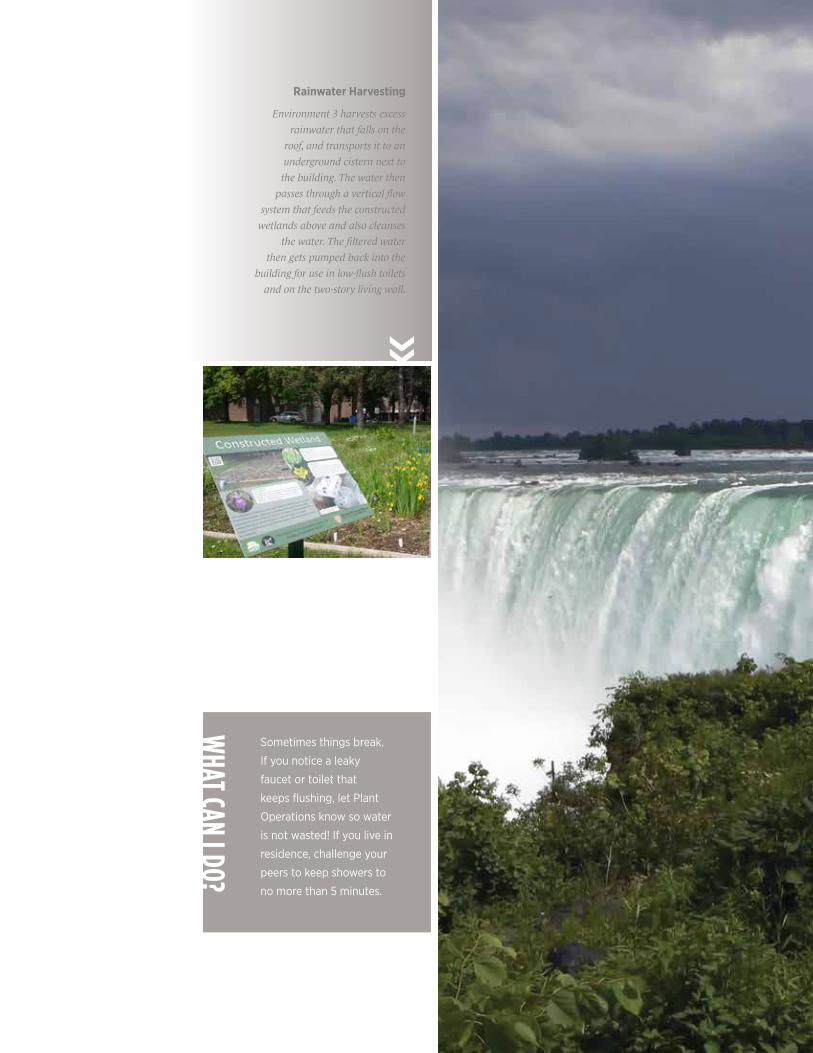
Rainwater Harvesting
Environment 3 harvests excess rainwater that falls on the
roof, and transports it to an underground cistern next to the building. The water then
passes through a vertical flow system that feeds the constructed
wetlands above and also cleanses the water. The filtered water
then gets pumped back into the building for use in low-flush toilets
and on the two-story living wall.
WHAT CAN I DO?
Sometimes things break.
If you notice a leaky
faucet or toilet that
keeps flushing, let Plant
Operations know so water
is not wasted! If you live in
residence, challenge your
peers to keep showers to
no more than 5 minutes.

UNIVERSITY OF WATERLOO20
OPERATIONS
waste Encouraging students, staff, and faculty to minimize
the campus’ waste footprint helps preserve our local
landfill sites and prolongs the lifecycle of materials.
The University of Waterloo’s waste footprint grew in
conjunction with the growth of the campus population
between 2010 and 2013, although per-capita waste
increased only slightly. There was a 10% drop in waste
sent to landfill in 2014 that should be celebrated.
A 2013 waste audit of sample buildings found that 38
per cent to 83 per cent of waste was diverted through
recycling, depending on the location. However, 67
per cent to 80 per cent of waste going to landfill could
have been diverted through an organics collection
program or through proper use of existing recycling
programs. This demonstrates that improved facilities,
programming, and education is needed to meet the
province of Ontario’s 60 per cent diversion rate target.
Future effort should also be made to quantify blue bin
and green bin data to determine an accurate diversion
rate for the whole University.
NOTES: For methodology, see Appendix B4 – Waste
Campus Waste, Including Federated University and Affiliated Colleges
Note: Blue bin data is not available, but is a large portion of Waterloo’s waste diversion
Waste Per Capita (kg/pp)
Landfill
Corrugated Cardboard
Paper Recycling
e-Waste Recycling
Campus Compost,Batteries, Bulbs
Was
te Pr
oduc
ed (T
onne
s)
2010 2011 2012 2013 20140
500
1,000
1,500
2,000
2,500
3,000
3,500
2010 2011 2012 2013 2014
Waste to Landfill Total Waste
Was
te Pe
r Per
son (
kg)
0
20.0
40.0
60.0
80.0
100.0

E-Waste
In 2010, Central Stores launched an e-Waste collection
program for used electronics. They worked with a local
responsible recycler to properly dispose over 38 tonnes of used electronic waste in 2014. This
did not include computers and electronics that were resold as
part of the Surplus Sale.
Hazardous Materials
The Safety Office also implemented programs to stop hazardous materials
in batteries and lightbulbs from going to landfill.
They have recycled more than a tonne of batteries
from 2013-2014. Over 14,000 burnt-out lamps
and light bulbs were also recycled — equivalent to 0.5kg of mercury, 65kg of phosphor, four tonnes of glass, and 51kg of metal.
Campus Compost
Campus Compost is a student-led initiative launched in 2014 to
collect organic food materials from Environment and Arts buildings. With
funding from the Waterloo Environment Students Endowment Fund, the group purchased the Compost Cow to break
down collected materials. In 2014, Campus Compost collected over 2,000
pounds of food waste and began conversations to have continuous collection across more of campus.
WHAT CAN I DO?
Reducing is better than recycling.
Try taking a pledge to go waste-
free for a week. It might sound
tricky, but it is doable! When you
need to throw something out, see if
it can be recycled first, and always
read the labels on the bins around
campus. For some inspiration,
take the #wastebucketchallenge.

UNIVERSITY OF WATERLOO22
OPERATIONS
transportation Transportation is one of the fastest-growing
sources of GHGs, and in Waterloo Region it
accounts for nearly 40 percent
of all emissions.
The University of Waterloo has the
opportunity to position itself as a local leader
in sustainable transportation. Surveys among
employees have shown that many members
of the University community already choose
sustainable commuting options.
All campuses in Waterloo Region are situated
along the emerging rapid transit corridor,
which will further enable commuting choices.
Furthermore, nearly 75 per cent of employee
survey respondents lived within 10 kilometers
of their worksite, making sustainable travel
a distinct possibility.
Employee commuting information is available through the University’s
participation in TravelWise surveys. Student commuting data is currently
unavailable, but the introduction of the student U-Pass enabled a major
shift in student transportation patterns.
The University of Waterloo owns 10 golf carts to help minimize
transportation emissions and costs for its fleet. Plant Operations, Housing
and Residences, and Parking Services use these carts for a quick and
easy way to get around campus without a full-sized car or truck. With
over 150 fleet vehicles in academic and operations roles, the University
could demonstrate leadership by sourcing more fuel-efficient or electric
vehicles where it fits the needs and usage profile.
NOTES: For methodology, see Appendix B5 – Transportation
Employee Commuting Over One Week, Fall 2014
Drove Alone
Carpooled
Transit (GRT)
Walked
Biked
Worked from Home
Other
50%
16% 11%
11%
7%
4%
1%

TravelWise
Parking Services helped the University of Waterloo join TravelWise in 2012.
Through the program, employees can access discounted transit passes, an emergency ride home program for
sustainable commuters, and carpool matching and trip tracking software.
The University is also able to share best practices on employee commuting
with other community organizations, and collaborate with regional
government and local non-profits.
Employee Commuting Changes
WHAT CAN I DO?
Getting to campus without a
car doesn’t have to be a big
deal. Try it once a week, and
you’ll be surprised at how easy
it is to carpool, bus, bike, or
walk. If everyone drove one
less day a week, it would be a
20 per cent reduction in traffic!
Drove Alone
Transit (GRT)
Cycled
Walked
Carpooled
Worked from Home
Other
Multimodal
Percentage of Sta� Trips
2012
2013
2014
0 10 20 30 40 50 60

UNIVERSITY OF WATERLOO24
OPERATIONS
grounds The University of Waterloo owns
approximately 1,000 acres of land, so
ecological grounds maintenance impacts
biodiversity, stormwater management, and
natural areas for the entire community.
The physical appearance of the campus is
also incredibly important to staff, faculty,
and current and future students. Green,
connected, and attractive campuses are
fundamental to a successful university.
Approximately half of all University lands
are under agricultural development or are
part of the Environmental Reserve. South
Campus complies with an integrated pest
management plan, which minimizes use of
chemical pesticides on campus and applies
targeted chemicals only when necessary.
In addition, the Ecology Lab gardens and
Arts-Environment Gardens meet sustainable
landscape management criteria for their
plant and soil stewardship and for utilizing
environmentally preferable materials. Plant
Operations staff completed Smart About
Salt certification developed by Landscape
Ontario, which encourages appropriate use
of salt technologies in winter.
NOTES: For methodology, see Appendix B6 – Land Management
Environmental Reserve
North Campus Developed
North Campus Agricultual
South Campus
North West Campus Agricultual
North West Campus Developed
270 acres
150 acres
130 acres
150 acres
100 acres
200 acres
Environmental Reserve
North Campus Developed
North Campus Agricultual
South Campus
North West Campus Agricultual
North West Campus Developed
270 acres
150 acres
130 acres
150 acres
100 acres
200 acres
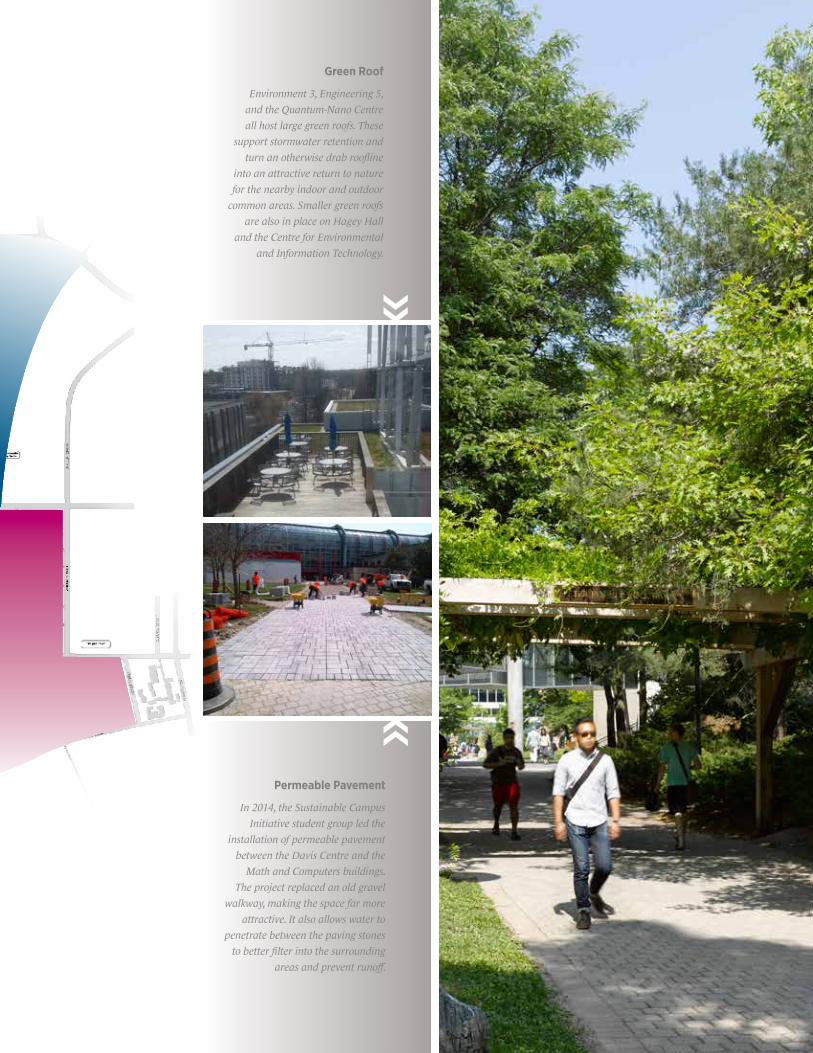
Green Roof
Environment 3, Engineering 5, and the Quantum-Nano Centre all host large green roofs. These
support stormwater retention and turn an otherwise drab roofline
into an attractive return to nature for the nearby indoor and outdoor
common areas. Smaller green roofs are also in place on Hagey Hall
and the Centre for Environmental and Information Technology.
Permeable Pavement
In 2014, the Sustainable Campus Initiative student group led the
installation of permeable pavement between the Davis Centre and the
Math and Computers buildings. The project replaced an old gravel
walkway, making the space far more attractive. It also allows water to
penetrate between the paving stones to better filter into the surrounding
areas and prevent runoff.

UNIVERSITY OF WATERLOO26
OPERATIONS
Fairtrade Certified
66%
Local and Community-Based
13.5%
food Everyone loves and needs a good meal, but food
contributes to climate change emissions, waste
generation, and land, water, and energy use. Agriculture
is one of the largest causes of deforestation and species
loss on a global scale, and there are options to reduce
its impacts. Sourcing local food dramatically reduces
transportation costs and emissions, and shifting diet to
include less meat and dairy products can also reduce
emissions and land use pressures.
Food Services has built partnerships with local suppliers
for 13.5 per cent of all food purchases, and launched the
Farm Market in 2006 to make local produce available to
the UWaterloo community. To reduce packaging waste, all
Styrofoam containers have been eliminated from campus-
run eateries. Food Services also partnered with the
Region of Waterloo to have green bins located in kitchen
preparation areas. This has helped divert a significant
amount of food waste from landfill.
Many groups across campus have collaborated to increase
the availability of Fairtrade products, which improve
the economic livelihood of farmers while supporting
sustainable farming practices. Approximately 66 per cent
of hot beverages purchased by Food Services, excluding
franchises, are Fairtrade certified.
NOTES: For methodology, see Appendix B7 - Food
Total Food Purchases
Food Services Hot Beverage Purchases
Local and Community-Based
13.5%
Fairtrade Certified
66%

Farm Market
University of Waterloo Food Services launched the Farm
Market in 2006 to provide fresh and local food for the campus. Staff and students responded
enthusiastically, with many attendees visiting the Student Life
Centre Lower Atrium during the Spring and Fall terms to pick up
delicious produce, breads, and preserves. Visit the Food Services
website to see upcoming dates!
St. Paul’s Community Gardens
The St. Paul’s Community Garden, founded by a University of Waterloo
student, has established sites both on and off campus to grow and
harvest fresh, local, and sustainable food. Through the employment of
University students and mentorship from a local farmer at Steckle
Heritage Farm, this project sells affordable produce to the cafeteria
at St. Paul’s College, as well as to students and faculty members.
WHAT CAN I DO?
We get to choose what we
eat. Visit the Farm Market and
other community markets to
find local options, and next
time you’re at a campus eatery,
look for a vegetarian option
or ask to see Fairtrade choices
when purchasing coffee.

UNIVERSITY OF WATERLOO28
OPERATIONS
procurement Making sustainable purchases is an important strategy
for the University of Waterloo to leverage its buying
power to better the environment. Organizations choosing
more sustainable cleaning and electronic products, office
supplies, and consumables decrease their environmental
footprint and also encourage suppliers to improve their
green offerings.
Procurement and Contract Services provides options for
recycled paper products, has negotiated deals with VIA
Rail for personal and business travel for the University
of Waterloo, and ensures more fuel-efficient vehicles
are available for business travel when renting. They
have also worked with the Green IT Advisory Group
to provide information and encourage the purchase
of more sustainable computers and printers.
Most paper purchases over the past year were
still on virgin paper, leaving significant room for
improvement. Several other product categories could
also be incorporated into future reporting, such as the
percent of the University’s electronics registered with the
Electronic Product Environmental Assessment Tool or the
amount of environmentally-certified cleaning products.
NOTES: For methodology, see Appendix B8 – Procurement
Recycled Paper Content in Total Paper Purchases
<10% Recycled Content
30-49% Recycled Content
50-69% Recycled Content
90-100% Recycled Content
75.10%
10.00%
12.60%
2.30%

All paper towels and bathroom tissues on campus are made from 100 per cent post-consumer recycled paper. Compared to purchasing virgin fibre, this saves annually:
2,056 trees (5 American football fields)
7.9 million litres of water (3 Olympic swimming pools)
113 (9 garbage trucks)
tonnes of waste
263tonnes of CO2 (88 cars per year)
3,322GJ of electricity (30 households per year)
WHAT CAN I DO?
If you are purchasing supplies
for your department, be
sure to look for sustainable
options. 30 per cent recycled
paper is actually cheaper
than purchasing virgin paper!
UNIVERSITY OF WATERLOO30
ENGAGEMENT Sustainability requires effort from all areas of campus. Whether it is student groups launching initiatives, staff champions leading projects in their department, or new connections with local community organizations, engaging broad areas of the University is necessary. Campus sustainability can only be realized through long-term behaviour changes that complement building and infrastructure improvements.
student engagement
At the University of Waterloo, learning extends beyond the classroom. A world-
renowned co-op program gives students practical experience to complement
their coursework, and extra-curricular activities equip students with new skills
and applied knowledge. Sustainability-related groups are also a powerful
demonstration of student interest and support for campus sustainability.
There are at least 13 student sustainability groups or organizations at Waterloo, with
focuses ranging from global conversations on climate change to tangible campus
projects. The Federation of Students and Graduate Students Association have also
integrated sustainability into their own operations. Further effort could be made to
formally support student sustainability engagement through leadership networks,
collaborative projects, and relevant opportunities for applied research on campus.
» » » » » » » » » » » » »
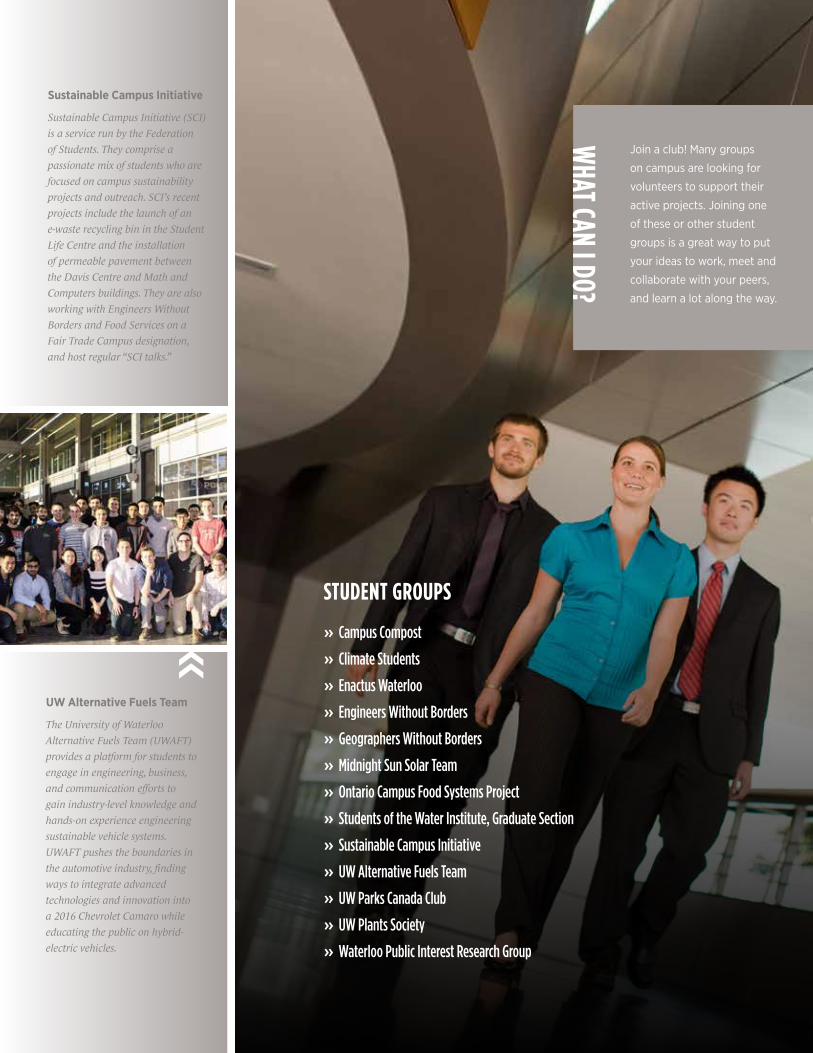
Sustainable Campus Initiative
Sustainable Campus Initiative (SCI) is a service run by the Federation of Students. They comprise a passionate mix of students who are focused on campus sustainability projects and outreach. SCI’s recent projects include the launch of an e-waste recycling bin in the Student Life Centre and the installation of permeable pavement between the Davis Centre and Math and Computers buildings. They are also working with Engineers Without Borders and Food Services on a Fair Trade Campus designation, and host regular “SCI talks.”
UW Alternative Fuels Team
The University of Waterloo Alternative Fuels Team (UWAFT) provides a platform for students to engage in engineering, business, and communication efforts to gain industry-level knowledge and hands-on experience engineering sustainable vehicle systems. UWAFT pushes the boundaries in the automotive industry, finding ways to integrate advanced technologies and innovation into a 2016 Chevrolet Camaro while educating the public on hybrid-electric vehicles.
WHAT CAN I DO?
Join a club! Many groups
on campus are looking for
volunteers to support their
active projects. Joining one
of these or other student
groups is a great way to put
your ideas to work, meet and
collaborate with your peers,
and learn a lot along the way.
STUDENT GROUPS
Campus Compost
Climate Students
Enactus Waterloo
Engineers Without Borders
Geographers Without Borders
Midnight Sun Solar Team
Ontario Campus Food Systems Project
Students of the Water Institute, Graduate Section
Sustainable Campus Initiative
UW Alternative Fuels Team
UW Parks Canada Club
UW Plants Society
Waterloo Public Interest Research Group

UNIVERSITY OF WATERLOO32
ENGAGEMENT
employee engagement
Training and empowering employees to take action on sustainability initiatives
magnifies operational efforts and ultimately develops stronger employee-
employer relationships. Many employees have already taken leadership roles
by commuting sustainably, participating in community initiatives, minimizing
their own impact, and even educating their colleagues.
Establishing stronger networks of these champions at the departmental level
will support their effectiveness across campus and enable knowledge-sharing
and mutual support. Promoting sustainability services relevant for employees
also strengthens the relationship between the University and its employees.
WHAT CAN I DO?
Be creative! Each department
faces slightly different
challenges. If you have ideas on
how to improve sustainability
performance in your area, give
it a try. Reach out to see if
others are interested, and let
the sustainability office know
where you might need support.
Library Recycling Group
In 2014, library staff noted that waste facilities were not being used properly. They collaborated with Plant Operations to conduct a waste audit of library facilities, and launched a survey with library patrons to uncover recycling attitudes and barriers. Using these results, the group is now working to rearrange the waste bins and clarify signage to improve recycling and reduce waste to landfill.
Green Offices, Great Results
In 2011, the Graduate Studies Office received an Innovation Award from the Ontario University Registrar’s Association for automating their application management and admissions process. Over 4,700 student files have since been made paperless through the automated system, and over 94,000 admissions documents were imported in 2014 alone.

UN
IVE
RSITY
OF W
ATE
RLO
O | Environm
ental Sustainability Report
33
Local Climate Change
Waterloo staff and faculty have participated eagerly in local and global initiatives to mitigate climate change. At the local level, Environment and Business students conducted a feasibility study in partnership with Sustainable Waterloo Region and REEP Green Solutions that planted seeds for Waterloo Region’s first ever Climate Action Plan. In 2013, all four local governments unanimously endorsed the 6 per cent reduction target within the plan.
Local Watershed Management
Protecting water resources is of vital importance for communities, especially in Waterloo Region. In 2014, Earth and Environmental Science professor in the Faculty of Science and Water Institute member Dave Rudolph led a team to implement a smart watershed data integration platform for the Grand River Watershed. The project, in collaboration with IBM Canada, is part of the Southern Ontario Water Consortium and integrates real-time data about hydrologic conditions and water quality from remote sensing stations across an 80 square kilometer catchment area. The data can lead to more informed decision-making and improved management for local authorities.
community engagement
Innovative research reaches beyond the classroom, the lab, and
the campus. Students, staff, and faculty make some of their largest
contributions towards environmental sustainability by applying their
knowledge and skills in the surrounding community. Community
engagement on sustainability also embeds the University as a valuable
institutional participant in the local and global society.
Many faculty and staff sit on food, energy, water, and transportation
advisory committees locally, provincially, and even internationally.
Their knowledge and expertise affects policy and decision-making.
In 2012, the University of Waterloo joined Sustainable Waterloo
Region’s local Regional Carbon Initiative to commit to reducing
greenhouse gas emissions and participate in a community-driven
program. In 2012, Waterloo also joined TravelWise, a collaboration
between the Region of Waterloo and other local organizations to
empower sustainable transportation among employees.

UNIVERSITY OF WATERLOO34
governance
»
»
»
»
»
»
GOVERNANCE
Academics, operations, and engagement ultimately
depend on support from University administration.
Sustainability efforts across these impact areas
are often collaborative and usually challenging, as
they involve changing “the way things are done”
at the operational and behavioural level. Effective
sustainability governance therefore becomes
necessary to empower momentum on campus,
manage conflict that inevitably arises under change,
and ensure that initiatives support the mission and
direction of the University. In essence, a governance
structure sustains sustainability efforts.
Momentum is growing across campus. Waterloo
approved the creation of a new full-time
sustainability coordinator position in 2014, and
the University endorsed the President’s Advisory
Committee on Sustainability in 2015. The committee
includes staff, students, faculty, and senior
administration, and has a mandate to develop a
sustainability policy, plan, and ongoing monitoring
efforts for the University.
GOVERNANCE INITIATIVES The following initiatives strengthen the high-level
support for campus sustainability.
Pledges:
Council of Ontario Universities Pledge, Ontario
Universities: Committed to a Greener World
Practices/Procedures:
All new buildings designed to LEED Silver
High efficiency lighting retrofits mandated during
all major renovations and new construction projects
Grounds minimize or eliminate use of chemical pesticides
as part of an integrated pest management plan
Office printers are centralized and default to double-
sided printing whenever possible
Directions:
Campus Master Plan highlights a pedestrian-oriented
campus and environmental stewardship/sustainability
as defining features of development

UN
IVE
RSITY
OF W
ATE
RLO
O | Environm
ental Sustainability Report
35
In Spring 2015, the President’s Advisory
Committee on Sustainability supported
the implementation of a management
framework to communicate and
coordinate efforts. The framework was
developed by REFOCUS, a division of
the non-profit Harbourfront Centre
in Toronto, with the aim of creating
effective, lasting, and value-added
sustainability change on campus.
The approach will guide the
committee’s efforts moving forward.
A PROGRAM SETUP/GOVERNANCE
1
Leadership Capacity
2 Change
Management Capacity
3
Measurement Capacity
B PROGRAM MANAGEMENT CYCLE
1
Understand Your Impact
2
Select the Best Projects
3
Report on Results

UNIVERSITY OF WATERLOO36
looking forward
»
»
»»
» »
» »
» »
» »
»
»
»
»
LOOKING FORWARD
The path to sustainability is constantly evolving.
This sustainability report outlines the University
of Waterloo’s progress over the past five years.
There have been many successes, including
continual improvement of a robust curriculum
and positive indications that energy, water,
waste, and transportation patterns are shifting.
There are also opportunities and challenges that
require tangible next steps. These include:
Launching a formal campus organics program
Designing clearer signage and better positioning
for recycling and waste bins
Strengthening sustainable purchasing options for
paper, electronics, and cleaning products
Developing a business case to sub-meter campus
buildings for utility consumption
Piloting energy reduction challenges in residences
Increasing the availability of secure bike parking
on all campuses
Integrating sustainability into student and
employee orientation and training
Creating a voluntary departmental champion
network for staff and faculty
Encouraging a student leaders network for
residences and off-campus housing
High-level or structural action should
empower these next steps to ensure project
effectiveness, connect with funding, and
support the University’s desired goals and
strategies. This systemic support includes:
Launching a campus-wide sustainability plan
Creating a sustainability policy for
the University
Facilitating collaboration between
departments
Completing a formal sustainability
assessment, such as STARS
Committing to formal targets in relevant
impact areas
Improving the collection of key data
sets to monitor progress
Embedding sustainability into University
processes and accountability
These governance changes will help to identify,
prioritize, and assign projects and initiatives
to maximize the impact and efficiency across
the University. Just as importantly, they are
key to harnessing the passion, excitement, and
commitment from many campus stakeholders
to create lasting change.

acknowledgements
This report would not have been possible
without the contributions of many
groups and individuals across campus.
Contributors and Reviewers:
Jay Athia – Institutional Analysis
and Planning
Michelle Banic – Institutional
Analysis and Planning
Micaela Buchnea-Chew – Food Services
Annette Carroll – Food Services
Jana Carson – Institutional
Analysis and Planning
Blair Clarence – Institutional
Analysis and Planning
Steve Cook – Procurement and
Contract Services
Lee Elkas – Food Services
Chris Ford – Plant Operations
Donna Foreman-Braun – Procurement
and Contract Services
Greg Friday – Safety Office
Tom Galloway – Plant Operations
Donna McCracken – Plant Operations
Joel Norris – Central Store
Paul Penner – Conrad Grebel College
Peter Pillsworth – St. Paul’s College
Beverly Raimbault – Ecology Lab
Lisa Reynolds – Human Resources
Lisa Roenspiess – Plant Operations
Sharon Rumpel – Parking Services
Travis Schmidt – Food Services
Sam Toman – Faculty of Environment
Joanne Voisin – Office of the Registrar
Rick Zalagenas – Plant Operations

UNIVERSITY OF WATERLOO38
»
»
»
»
»
APPENDIX A
academic A1 – SUSTAINABILITY COURSES
FACULTY FOCUS ON SUSTAINABILITY
INCLUDE SUSTAINABILITY
TOTAL
Applied Health Science
6 14 20
Arts 21 27 48
Engineering 17 68 85
Environment 149 133 282
Mathematics – 1 1
Science 15 57 72
TOTAL 208 300 508
Scope: Current academic calendar; undergraduate and
graduate courses
Methodology: The count of sustainability courses arose
from a scan of publically available course descriptions on
the current academic calendar. Since this report focuses
mainly on environmental sustainability, the STARS criteria
were modified according to the definitions below. Courses
were analyzed on whether they focused specifically on
environmental sustainability (or one of the major themes
within sustainability), or whether their primary focus was
on a topic other than environmental sustainability, but they
included content or an application related to sustainability.
Cross-listed courses were treated as one total course and
were weighted equally across the departments (ie, 0.5
allocated to Geography & Environmental Management
and 0.5 allocated to Earth Sciences for a shared course).
Limitations and Exclusions:
Course descriptions are not exhaustive, and it is possible
that there are many more courses that have units,
modules, or case studies related to sustainability that
were not included in the description. Further analysis
could be conducted by looking at course syllabi.
Special Topics courses were normally excluded from the
count, unless the description provided a list of specific
topics that could be related to sustainability.
The academic calendar lists all courses that are available
at the University of Waterloo, but does not indicate
whether they were actually scheduled. Further analysis
could be done through the Quest system to analyze
the number of courses and sections offered.
Definitions:
STARS criteria define a sustainability-focused course
as one in which the “primary and explicit focus is on
sustainability and/or understanding or solving one or
more major sustainability challenge.” However, they define
sustainability along the more commonly-accepted and
holistic integration of economic, social, and environmental
wellbeing. Since this report focuses on environmental
sustainability, it modified the definitions accordingly:
Sustainability-Focused Courses are courses in which
the primary or explicit focus is on environmental
sustainability or a thematic area related to sustainability,
including: climate change, energy, water, air pollution,
waste, land use, conservation/biodiversity, transportation,
food, and buildings. For example, this might include
courses on Sustainable Agriculture, Climate Change
Mitigation, or Conservation Biology.
Sustainability-Related Courses are courses where the
primary focus is on a topic other than sustainability,
but where there are sustainability units, modules, case
studies, or assignments related to sustainability. For
example, this might include a planning course where
the primary focus was on infrastructure development,
but also covered environmental criteria; it may have
also included a course where the focus was on aquatic
chemistry, but which had applications for groundwater
protection and pollution control.
UN
IVE
RSITY
OF W
ATE
RLO
O | Environm
ental Sustainability Report
39
»
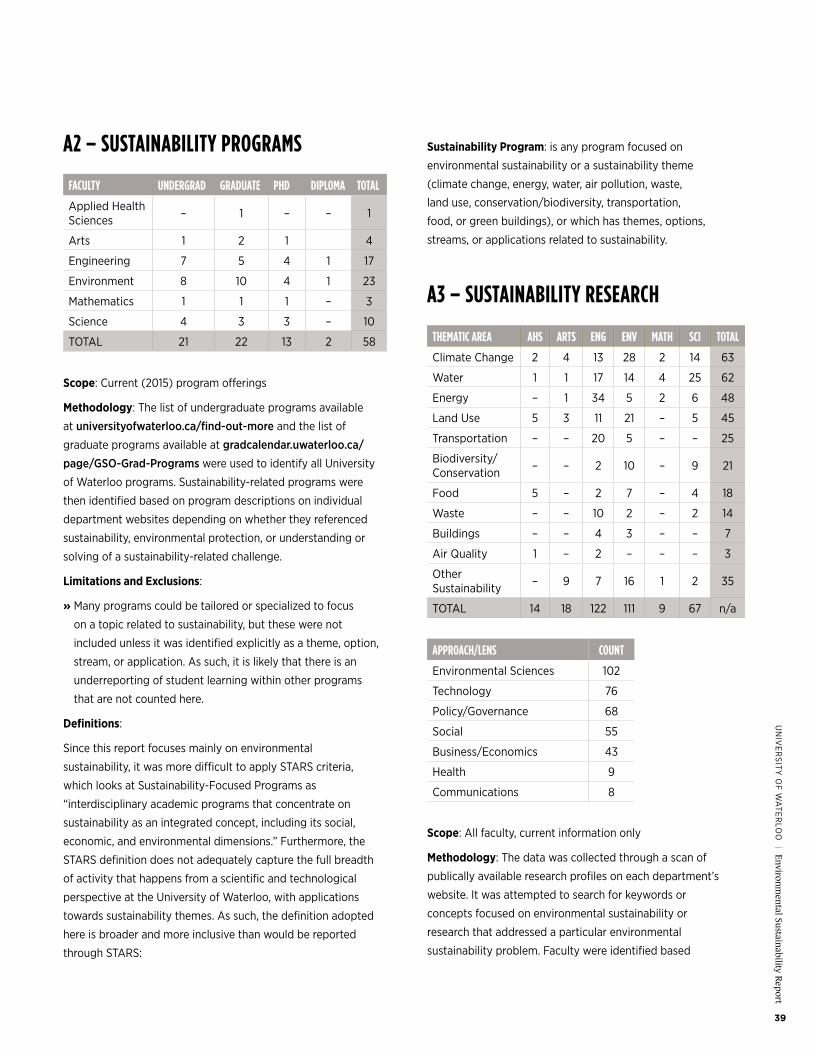
A2 – SUSTAINABILITY PROGRAMS
FACULTY UNDERGRAD GRADUATE PHD DIPLOMA TOTAL
Applied Health Sciences – 1 – – 1
Arts 1 2 1 4
Engineering 7 5 4 1 17
Environment 8 10 4 1 23
Mathematics 1 1 1 – 3
Science 4 3 3 – 10
TOTAL 21 22 13 2 58
Scope: Current (2015) program offerings
Methodology: The list of undergraduate programs available
at universityofwaterloo.ca/find-out-more and the list of
graduate programs available at gradcalendar.uwaterloo.ca/
page/GSO-Grad-Programs were used to identify all University
of Waterloo programs. Sustainability-related programs were
then identified based on program descriptions on individual
department websites depending on whether they referenced
sustainability, environmental protection, or understanding or
solving of a sustainability-related challenge.
Limitations and Exclusions:
Many programs could be tailored or specialized to focus
on a topic related to sustainability, but these were not
included unless it was identified explicitly as a theme, option,
stream, or application. As such, it is likely that there is an
underreporting of student learning within other programs
that are not counted here.
Definitions:
Since this report focuses mainly on environmental
sustainability, it was more difficult to apply STARS criteria,
which looks at Sustainability-Focused Programs as
“interdisciplinary academic programs that concentrate on
sustainability as an integrated concept, including its social,
economic, and environmental dimensions.” Furthermore, the
STARS definition does not adequately capture the full breadth
of activity that happens from a scientific and technological
perspective at the University of Waterloo, with applications
towards sustainability themes. As such, the definition adopted
here is broader and more inclusive than would be reported
through STARS:
Sustainability Program: is any program focused on
environmental sustainability or a sustainability theme
(climate change, energy, water, air pollution, waste,
land use, conservation/biodiversity, transportation,
food, or green buildings), or which has themes, options,
streams, or applications related to sustainability.
A3 – SUSTAINABILITY RESEARCH
THEMATIC AREA AHS ARTS ENG ENV MATH SCI TOTAL
Climate Change 2 4 13 28 2 14 63
Water 1 1 17 14 4 25 62
Energy – 1 34 5 2 6 48
Land Use 5 3 11 21 – 5 45
Transportation – – 20 5 – – 25
Biodiversity/ Conservation – – 2 10 – 9 21
Food 5 – 2 7 – 4 18
Waste – – 10 2 – 2 14
Buildings – – 4 3 – – 7
Air Quality 1 – 2 – – – 3
Other Sustainability – 9 7 16 1 2 35
TOTAL 14 18 122 111 9 67 n/a
APPROACH/LENS COUNT
Environmental Sciences 102
Technology 76
Policy/Governance 68
Social 55
Business/Economics 43
Health 9
Communications 8
Scope: All faculty, current information only
Methodology: The data was collected through a scan of
publically available research profiles on each department’s
website. It was attempted to search for keywords or
concepts focused on environmental sustainability or
research that addressed a particular environmental
sustainability problem. Faculty were identified based

UNIVERSITY OF WATERLOO40
APPENDIX A
»
»
»»
»
»
»
»
»
»
»
»
on both thematic areas (ie conservation, climate change,
energy) and approach (ie. science, technology, governance)
where possible. Some faculty may have research spanning
a number of thematic areas and using multiple approaches,
so the categories are not mutually exclusive.
Limitations and Exclusions:
The scan only included permanent faculty, and did
not include Adjunct faculty or Lecturers.
The scan did not include Masters or PhD research.
In some cases, faculty members did not have a link to
their research areas, making it impossible to identify
whether research was related to environmental
sustainability.
In several cases, there was difficulty distinguishing
research that had multiple applications. In such cases, the
faculty member was included if their profile specifically
referenced applications to environmental sustainability
or sustainability thematic areas. It is possible that some
research was excluded because this reference was not
made explicit, and there was insufficient disciplinary
knowledge to make an implicit connection.
Terminology varied considerably across disciplines.
It is possible that research topics were included or
excluded from misinterpretation of language.
Definitions of Impact Areas:
Environmental Sciences – Research that deepens
the understanding of a particular sustainability issue
area, such as water flows, climate change modelling,
or ecological processes
Technology – Research that develops or deploys
innovative technologies to address sustainability issue
areas, such as hybrid/electric vehicles, GIS systems,
or smart grids
Policy/Governance – Research that explores political,
management, or regulatory aspects of sustainability
issue areas
Social – Research that explores societal responses
or interactions with the natural environment, such
as community development, culture, philosophy, or
impacts on certain social groups
Business/Economics – Research that explores the
relationship of environmental sustainability within
corporations, on economies, or on natural resource
extraction and management
Health – Research that explores the links between
environment and public health, such as the impact of
climate change on disease transfer, or drinking water
sanitation
Communications – Research that explores the language,
marketing, or discourse around environmental
sustainability or specific sustainability issues

UN
IVE
RSITY
OF W
ATE
RLO
O | Environm
ental Sustainability Report
41
Annual Degree Days, 2010-2014
APPENDIX B
operations indicators
Regression Analysis of Degree Days and Energy Intensity
B1 – ENERGY Energy Source 2010 2011 2012 2013 2014
Electricity (kWh) 98,960,234 106,342,165 112,486,202 115,625,012 115,530,674
Electricity (GJ) 356,257 382,832 404,950 416,250 415,910
Natural Gas (m3) 13,347,453 13,698,510 13,777,376 16,478,861 17,553,152
Natural Gas (GJ) 497,860 510,954 513,896 614,662 654,733
Total Energy Use (GJ) 854,117 893,786 918,846 1,030,912 1,070,643
Floor Area (m2) 605,953 631,823 676,439 679,513 693,399
Degree Days 4,120 4,276 3,870 4,464 4,756
Scope: University of Waterloo only;
Methodology: Energy data is based on billed information for electricity and natural gas, and
converted into a gigajoule (GJ) equivalent. The report used recommended conversion factors
from the National Energy Board. Intensity metrics for the University of Waterloo are calculated
based on total building floor space.
Degree Days were sourced from Waterloo North Hydro’s 2015 Rate Application, as they provided
a complete and local historical data set. These were also cross-referenced with available data
from Environment Canada, although the latter record is less complete.
A linear regression analysis was used to test the influence of degree days on energy consumption,
which revealed a correlation, though the sample size was small. A similar linear regression analysis
displayed a much weaker sensitivity to floor space increases, which could reflect the type of new
floor spaces being introduced. New LEED Silver building standards, for example, may help lower
energy intensity for office or common space, while lab spaces could offset those increases in
other areas, and vice-versa.
y = 0.0002x + 0.4862R2 = 0.92227
Ener
gy In
tens
ity (G
J/m2 )
3,5001.000
1.100
1.200
1.300
1.400
1.500
1.600
3,750 4,000 4,250 4,500 4,750 5,000

UNIVERSITY OF WATERLOO42
APPENDIX B
»
»
Ontario’s Broader Public Sector (BPS) emissions reporting system provides publically available data
for the university sector. To compare the University of Waterloo with similar universities, an average
was taken from other Group of 15 Research-Intensive Universities in Ontario, namely McMaster
University, Queen’s University, University of Ottawa, University of Toronto, and University of Western
Ontario. BPS emissions data is only available for 2011 and 2012 calendar years.
Exclusions and Limitations:
For those facilities where energy data was not available or was not of sufficient quality, the facility’s
square footage was excluded from the above to avoid biasing the intensity metric. Electricity data
was available for all main campus areas — exclusions were mostly limited to offsite maintenance
locations and leased properties.
Fuel oil is used to heat some offsite buildings and to power emergency generators intermittently.
Reliable information on consumption patterns was not available, although this is expected to
have an extremely minor impact on the overall emissions profile.
Supplementary Data (Not included in main report):
Conrad Grebel
ENERGY SOURCE 2010 2011 2012 2013 2014
Electricity (kWh) 844,579 856,478 830,056 838,633 1,017,351
Electricity (GJ) 3,040 3,083 2,988 3,019 3,662
Natural Gas (m3) 164,358 169,328 154,195 199,966 204,126
Natural Gas (GJ) 6,131 6,316 5,751 7,459 7,614
Total Energy Use (GJ) 9,171 9,399 8,740 10,478 11,276
St. Paul’s
ENERGY SOURCE 2010 2011 2012 2013 2014
Electricity (kWh) 988,074 1,044,080 1,042,905 1,028,593 994,622
Electricity (GJ) 3,557 3,759 3,754 3,703 3,581
Natural Gas (m3) 164,358 169,328 154,195 199,966 204,126
Natural Gas (GJ) 6,131 6,316 5,751 7,459 7,614
Total Energy Use (GJ) 9,688 10,075 9,506 11,162 11,195
Sources:
Environment Canada, Historical Climate Data, 2015. Available online at: http://climate.weather.gc.ca/
using Advanced Search for weather stations within 25km of Kitchener.
Government of Canada, “Energy Conversion Tables,” National Energy Board, 2015. Available online at:
https://www.neb-one.gc.ca/nrg/tl/cnvrsntbl/cnvrsntbl-eng.html
Province of Ontario, “Energy use and greenhouse gas emissions for the Broader Public Sector,” 2014. Available
online at: http://www.ontario.ca/data/energy-use-and-greenhouse-gas-emissions-broader-public-sector
Waterloo North Hydro, 2015 Rate Application, Exhibit 3, 2015. Available Online at:
http://www.wnhydro.com/en/our-company/Rate_Application.asp

UN
IVE
RSITY
OF W
ATE
RLO
O | Environm
ental Sustainability Report
43
B1 – CLIMATE CHANGE SOURCE (TONNES) 2010 2011 2012 2013 2014 Scope
Natural Gas Emissions 25,352 26,018 26,168 31,299 33,340 1
Fleet Emissions 506 499 470 506 528 1
Electricity Emissions 12,864 9,996 10,574 8,903 8,896 2
Transmission and Distribution (TandD)
1,979 1,701 1,800 347 347 3
Waste emissions 488 510 521 547 492 3
Water emissions 49 35 35 31 26 3
Total Emissions 41,239 38,760 39,568 41,632 43,628 –
Floor Area (m2) 605,953 631,823 676,439 679,513 693,399 –
Population (FTE) 32,622 33,928 34,803 35,669 36,240 –
Scope: University of Waterloo only. Reporting scope includes Scope 1 Emissions, Scope 2
Emissions, and several Scope 3 Emissions under the GHG protocol.
Methodology: Scope 1 and 2 emission sources were quantified using utility bills for electricity
and natural gas, as well as invoices for fuel purchases for the University of Waterloo fleet. Scope 3
emission sources were quantified from waste invoices and allocating Transmission and Distribution
Losses according to the GHG Protocol.
Each emissions source was then multiplied by an emissions factor to calculate total emissions
according to the following table. All values are converted into carbon dioxide equivalent (CO2eq).
EMISSION SOURCE UNIT CONVERSION EMISSION FACTOR REFERENCE
Natural Gas KG CO2eq per m3 1.8994 NIR
Gasoline KG CO2eq per L 2.29906 NIR
Diesel KG CO2eq per L 2.71212 NIR
Electricity* KG CO2eq per kWh 2010: 0.13; 2011/12: 0.094; 2013/14: 0.077
NIR
Transmission and Distribution**
KG CO2eq per kWh 2010: 0.02; 2011/12: 0.016; 2013/14: 0.003
NIR
Waste to Landfill*** KG CO2eq per tonne 0.19 SWR
Water**** KG CO2eq per m3 2010: 0.08125 2011/12: 0.05875 2013/14: 0.041825
SWR
*Reflects annual upgrades to the electricity grid, which have lowered the carbon content due to the phase-out of coal power. Ontario updates emissions factors annually for the period 3-years previous and provides an estimate for the period 2 years previous, meaning that annual adjustments to historical emission factors are necessary. For example, in 2015, Ontario released finalized emission factors for 2012, and estimated emission factors for 2013. It is important to note that emission factors are different from the generation mix that is published by the Independent Electricity System Operator. This report applied the same emissions factors for 2013 and 2014, and will update both annually.
**Reflects the loss in power between generation and consumption, and from sulfur hexafluoride and other emissions released at transformers and along distribution infrastructure.
***Reflects local emissions factors, as developed by the Region of Waterloo and Sustainable Waterloo Region based on actual waste amounts reported by the Region of Waterloo.
****Reflects energy related to upstream purifying and pumping of water in Waterloo Region. This calculation yields 0.625 kWh per m3, which is then linked to electricity generation emissions factors.

UNIVERSITY OF WATERLOO44
APPENDIX B
»
»
»
»
Limitations and Exclusions:
Scope 1 and 2 Emissions from the Federated University and Affiliated Colleges were not included, as not all
institutions were able to provide source data. Scope 3 emissions from waste are included as the University of
Waterloo handles all waste for the Federated University and Affiliated Colleges and it could not be separated.
Business travel, including mileage and flight data, is likely a very large Scope 3 source of emissions for the
University of Waterloo. Unfortunately, there are no tracking systems in place that are capable of providing
data to calculate historical emissions. With the ongoing roll-out of a new expense tracking system, future
reports may be able to include business travel emissions.
Fugitive emissions under Scope 1 are not included in this report. These might include Hydroflourocarbon
(HFC) emissions generated by on-site cooling systems. Plant Operations has installed filter systems to remove
HFCs from atmospheric release, and the quantities would be immaterial to the University’s emissions profile.
Sources:
Environment Canada, National Inventory Report 2015: Greenhouse Gas Sources and Sinks in Canada, Part
2 Annex 6, Ottawa: 2015. Available online at: http://unfccc.int/national_reports/annex_i_ghg_inventories/
national_inventories_submissions/items/8812.php
Sustainable Waterloo Region, Calculating Emissions from Waste Sent to Landfill in Waterloo Region, Kitchener:
2013. Available online at: http://www.sustainablewaterlooregion.ca/files/u/WasteEmissionFactorDecision.pdf
Sustainable Waterloo Region, Calculating Emissions from Water Use and Collection in Waterloo Region,
Kitchener: 2013. Available online at: http://www.sustainablewaterlooregion.ca/wp-content/uploads/2013/12/
Water-Emission-Factor.pdf
B3 – WATER
2010 2011 2012 2013 2014
Total Water Use (Litres) 602,747 602,603 602,031 636,070 537,193
Floor Area (m2) 605,953 631,823 676,439 679,513 693,399
Population (FTE) 32,622 33,928 34,803 35,669 36,240
Scope: University of Waterloo Only
Methodology: Total water consumption was calculated using billed amounts for all campus locations.
Limitations and Exclusions:
Not all Federated University and Affiliated Colleges were able to provide utility data, so their
consumption was not included in the total.

UN
IVE
RSITY
OF W
ATE
RLO
O | Environm
ental Sustainability Report
45
»
»
»
»
»
»
B4 – WASTE WASTE STREAM 2010 2011 2012 2013 2014
Waste to landfill (kg) 2,567,370 2,686,130 2,743,180 2,878,750 2,590,550
Corrugated Cardboard (kg) 277,760 377,610 377,120 418,780 440,680
Office Paper Recycled (kg) 153,370 118,750 132,680 113,040 116,040
E-Waste Diverted (kg) 52,580 17,398 54,760 38,834 34,099
Campus Compost (kg) 907
Blue Bin Recycling (kg) unknown unknown unknown unknown unknown
Green Bin Recycling (kg) unknown unknown unknown unknown unknown
Batteries (kg) 577 565
Light Bulbs (kg)* 1,692 1,692
TOTAL WEIGHT 3,051,080 3,199,888 3,307,740 3,451,674 3,184,533
Population (FTE) 32,622 33,928 34,803 35,669 36,240
Per Capita to Landfill (kg/pp) 78.7 79.2 78.8 80.7 71.5
Per Capita Total Waste (kg/pp) 93.5 94.3 95 96.8 87.9
* A total of 4,231kg of glass, metal, and phosphor was recycled from 2013 through May 2015 from lightbulbs; since more detailed summaries are not available, results have been averaged.
Scope: All campuses, 2010-2014. Federated University and Affiliated Colleges also dispose
waste centrally through the University of Waterloo, so their streams cannot be separated.
Methodology: All data is from invoices received from the waste contractor for each stream.
Campus Compost weighs all collected material on-site.
Limitations and Exclusions:
Due to the nature of the University’s contract with the Region of Waterloo, weight information
or equivalent is not available for recycling or green bin programs, which are likely a large portion
of the campus’ waste stream. Data collected from 1-day waste audits is not of sufficient quality
to extrapolate campus-wide.
Construction and demolition waste is normally disposed separately as part of a project.
Some materials are brought directly to the Region of Waterloo landfill, such as used tires,
but these amounts are very small.
Event waste, such as for the Canada Day celebration, is not included.
Yard waste is not included, as Plant Operations normally composts and re-uses all waste on-site.
A calculation of weighted per-capita use was not possible, using the criteria established by
STARS, as not all Federated University and Affiliated Colleges were able to provide sufficient
data and centralized waste collection makes it impossible to separate these streams.

UNIVERSITY OF WATERLOO46
APPENDIX B
»
»
»
»
»
B5 – TRANSPORTATION
Scope: Waterloo Region campuses only, University of
Waterloo employees only, 2012-2014.
Methodology: Data was collected from an annual TravelWise
survey released to staff and faculty during the fall term.
Respondents answered several questions about their
commuting patterns and preferences. To calculate a mode split
for the university, respondents filled out their past five days of
travel. These were summed across all respondents, and used to
determine the number of trips taken throughout the week as a
proxy for the usage of different modes of getting to campus.
The survey launched in the fall to avoid over-representation
of active transportation during summer months, and under-
representation during winter months. It took place over a two-week period, which happened
to experience similar climatic conditions across all three survey years, leading to strong comparability.
The 2012 survey had 435 respondents, 2013 had 617 respondents, and 2014 had 313 respondents.
Percent of Employee Trips
MODE 2012 2013 2014
Drove Alone 56 56 50 Transit (GRT) 9 11 11 Cycled 10 6 7 Walked 14 8 11 Carpooled 9 15 16 Worked From Home 2 3 4 Train (GO or VIA) Other 1 1 Multimodal 1
Limitations and Exclusions:
The data does not include staff from the Federated University and Affiliated Colleges or the Stratford campus.
The data does not include undergraduate or graduate students.
As this was a voluntary survey, it is expected that there is a slight bias towards employees who are already
using sustainable transportation.
B6 –LAND MANAGEMENT
Scope: All campuses, excluding Federated University and Affiliated Colleges. 2014.
Methodology: Classifications for various land management standards were based on the STARS criteria:
Integrated Pest Management: Uses least-toxic chemicals, minimum use of chemicals, use of chemicals
only in targeted locations and only for targeted species, and a phased management approach.
Sustainable Landscape Management: All IPM criteria, plus plant stewardship, soil stewardship, use
of environmentally preferable materials, hydrology and water use, materials management and waste
minimization, and snow and ice management.

UN
IVE
RSITY
OF W
ATE
RLO
O | Environm
ental Sustainability Report
47
»
»
»
»
»
»
»
»
»
Limitations and Exclusions:
Federated University and Affiliated Colleges contract out most of their landscape management, so it is
not clear whether they follow Integrated Pest Management or Sustainable Land Management strategies.
Developed areas of North and Northwest campus are managed by a mix of University, City of Waterloo,
and private contracts.
Only 2014 data is presented, as Plant Operations has had a long-standing policy to phase out chemical
pesticides. As such there has been limited year-over-year change.
B7 – FOOD
Scope: 2014 only, University of Waterloo Food Services only.
Methodology: Data points on fair trade and local purchases are collected from Food Services based
on the purchasing classifications for 2014.
Limitations and Exclusions:
Neither metric includes campus franchises. STARS methodology requires treating franchises separately,
but data is not available for 2014.
Neither metric includes Federated University and Affiliated Colleges. All four Federated University and Affiliated
Colleges manage their catering services independently, and it was not possible to collect data for 2014.
Fairtrade does not include purchases made by faculty coffee and donut shops, although many have switched
or are in the process of switching to Fairtrade providers.
Fairtrade does not include coffee purchases made by individual departments for staff and faculty lounges.
B8 – PROCUREMENT
RECYCLED CONTENT <10% 10-29% 30-49% 50-69% 70-89% 90-100%
Per cent of total paper purchases
75.1% 0% 10% 12.6% 0% 2.3%
Scope: Paper purchases made through Procurement and Contract Services, July 2014-June 2015.
Methodology: The University of Waterloo’s paper supplier provided information on the percentage of total paper
purchases within various tiers of recycled content. The tiers are the same as those used by the STARS 2.0 technical manual.
Limitations and Exclusions:
This does not include paper sold at retail locations across the campus.
This does not include paper that departments or individuals purchased separately from Procurement and
Contract Services.

UNIVERSITY OF WATERLOO48
REFERENCES
Association for the Advancement of Sustainability in Higher Education. Sustainability Tracking,
Assessment, and Rating System: Technical Manual 2.0. Denver: 2014. Available online at:
https://stars.aashe.org/pages/about/technical-manual.html
ClimateActionWR. A Climate Action Plan for Waterloo Region: Living Smarter in 2020. Kitchener:
2013. Available online at: http://www.sustainablewaterlooregion.ca/files/u/Climate%20
Action%20Plan-Summary.pdf
Environment Canada. Historical Climate Data. 2015. Available online at: http://climate.weather.gc.ca/
using Advanced Search for weather stations within 25km of Kitchener.
Environment Canada. National Inventory Report 2015: Greenhouse Gas Sources and Sinks in Canada,
Part 2, Annex 6. Ottawa: 2015. Available online at: http://unfccc.int/national_reports/
annex_i_ghg_inventories/national_inventories_submissions/items/8812.php
Government of Canada, “Energy Conversion Tables,” National Energy Board, 2015. Available online
at: https://www.neb-one.gc.ca/nrg/tl/cnvrsntbl/cnvrsntbl-eng.html
Province of Ontario. “Energy use and greenhouse gas emissions for the Broader Public Sector.” 2014. Available
online at: http://www.ontario.ca/data/energy-use-and-greenhouse-gas-emissions-broader-public-sector
Sustainable Waterloo Region, Calculating Emissions from Waste Sent to Landfill in Waterloo Region.
Kitchener: 2013. Available online at: http://www.sustainablewaterlooregion.ca/files/u/
WasteEmissionFactorDecision.pdf
Sustainable Waterloo Region, Calculating Emissions from Water Use and Collection in Waterloo Regio., Kitchener:
2013. Available online at: http://www.sustainablewaterlooregion.ca/wp-content/uploads/2013/12Water-Emission-Factor.pdf
Waterloo North Hydro. 2015 Rate Application, Exhibit 3. Waterloo: 2015. Available Online at:
http://www.wnhydro.com/en/our-company/Rate_Application.asp

This page has been intentionally left blank.

UNIVERSITY OF WATERLOO50 |
C0
08
739200 UNIVERSITY AVENUE WEST, WATERLOO, ON, CANADA N2L 3G1 uwaterloo.ca/sustainability