Embed Size (px)
Citation preview
EPA/600/R-12-731September
2012
Environmental Technology Verification Report UNDERGROUND STORAGE TANK AUTOMATIC TANK GAUGING LEAK DETECTION SYSTEMS VEEDER-ROOT STANDARD WATER FLOAT AND
PHASE-TWO™ WATER DETECTOR
Prepared by
Under a cooperative agreement with
U.S. Environmental Protection Agency

EPA/600/R-12/731
September 2012
Environmental Technology Verification Report
ETV Advanced Monitoring Systems Center
UNDERGROUND STORAGE TANK
AUTOMATIC TANK GAUGING LEAK DETECTION SYSTEMS
VEEDER-ROOT STANDARD WATER FLOAT
AND
PHASE-TWO™ WATER DETECTOR
by Anne Marie Gregg and Amy Dindal, Battelle
John McKernan, U.S. EPA

ii
Notice
The U.S. Environmental Protection Agency, through its Office of Research and Development, partially funded and collaborated in the research described herein. This report has been subjected to the Agency’s peer and administrative review. Any opinions expressed in this report are those of the author(s) and do not necessarily reflect the views of the Agency, therefore, no official endorsement should be inferred. Any mention of trade names or commercial products does not constitute endorsement or recommendation for use.

iii
Foreword
The U.S. Environmental Protection Agency (EPA) is charged by Congress with protecting the nation’s air, water, and land resources. Under a mandate of national environmental laws, the Agency strives to formulate and implement actions leading to a compatible balance between human activities and the ability of natural systems to support and nurture life. To meet this mandate, the EPA’s Office of Research and Development provides data and science support that can be used to solve environmental problems and build the scientific knowledge base needed to manage our ecological resources wisely, understand how pollutants affect our health, and prevent or reduce environmental risks. The Environmental Technology Verification (ETV) Program has been established by the EPA to verify the performance characteristics of innovative environmental technology across all media and report this objective information to permitters, buyers, and users of the technology, thus substantially accelerating the entrance of new environmental technologies into the marketplace. Verification organizations oversee and report verification activities based on testing and quality assurance protocols developed with input from major stakeholders and customer groups associated with the technology area. ETV consists of six environmental technology centers. Information about each of these centers can be found on the Internet at http://www.epa.gov/etv/. Effective verifications of monitoring technologies are needed to assess environmental quality and to supply cost and performance data to select the most appropriate technology for that assessment. Under a cooperative agreement, Battelle has received EPA funding to plan, coordinate, and conduct such verification tests for “Advanced Monitoring Systems for Air, Water, and Soil” and report the results to the community at large. Information concerning this specific environmental technology area can be found on the Internet at http://www.epa.gov/etv/centers/center1.html.
iv
Acknowledgments
The authors wish to acknowledge the contribution of the many individuals without whom this verification testing would not have been possible. Quality assurance (QA) oversight was provided by Michelle Henderson, Laurel Staley, Teri Richardson, and Lauren Drees, EPA, and Rosanna Buhl, Zach Willenberg, and Kristin Nichols, Battelle. We gratefully acknowledge the Xerxes Corporation for providing a 6-foot diameter fiberglass underground storage tank shell, BP for donating 3,000 gallons of unleaded gasoline plus transportation and Tanknology for donating tank fittings. Additionally, we truly appreciate the in-kind analytical support from Marathon Corporation. Finally, we want to thank Dr. Samuel Gordji of the University of Mississippi and SSG Associates and Mr. Randy Jennings of the Tennessee Department of Agriculture for their review of the Quality Assurance Project Plan (QAPP) and this verification report.

v
Contents Page
Foreword ........................................................................................................................................ iii
Acknowledgments.......................................................................................................................... iv
List of Abbreviations ..................................................................................................................... ix
Chapter 1 Background .................................................................................................................... 1
Chapter 2 Technology Description ................................................................................................. 2
Chapter 3 Test Design and Procedures ........................................................................................... 4 3.1 Test Overview .......................................................................................................................... 4 3.2 Test Site Description ................................................................................................................ 6
3.2.1 JS-20 Building .................................................................................................................. 6 3.2.2 Test Vessel ........................................................................................................................ 6 3.2.3 Fuel Storage Tanker ........................................................................................................ 10 3.2.4 Waste Fuel Storage ......................................................................................................... 10
3.3 Experimental Design .............................................................................................................. 10 3.3.1 Test 1a Continuous Water Ingress Test-Minimum Detection Height ............................ 12 3.3.2 Test 1b Continuous Water Ingress Test-Smallest Detection Increment ........................ 13 3.3.3 Test 2 Water Ingress Detection of a Quick Water Dump, Then a Fuel Dump (Quick Dump) ....................................................................................................................................... 13
3.4 Experimental Procedures ....................................................................................................... 14 3.4.1 Pre-Run Preparations ...................................................................................................... 14 3.4.2 Water Preparation and Rotameter Checks ....................................................................... 16 3.4.3 Pre-Run Readings and Samples ....................................................................................... 18 3.4.4 Water Ingress ................................................................................................................... 18 3.4.5 Run Observations ............................................................................................................. 19 3.4.6 Data Logging ................................................................................................................... 19 3.4.7 Run Termination .............................................................................................................. 19 3.4.8 Post-Run Sampling Analysis ........................................................................................... 19 3.4.9 Post-Run Activities .......................................................................................................... 19
3.5 Monitoring ............................................................................................................................. 19 3.6 Operational Factors ................................................................................................................ 20
Chapter 4 Quality Assurance/Quality Control .............................................................................. 21 4.1 Data Collection Quality Control ............................................................................................ 21 4.2 Audits ..................................................................................................................................... 23
4.2.1 Performance Evaluation Audit ........................................................................................ 24 4.2.2 Technical Systems Audit ................................................................................................ 25 4.2.3 Data Quality Audit ......................................................................................................... 26
4.3 Quality Assurance/Quality Control Deviations ..................................................................... 26
Chapter 5 Statistical Methods ....................................................................................................... 28 5.1 Accuracy ................................................................................................................................ 28 5.2 Sensitivity .............................................................................................................................. 28
5.2.1 Tolerance Limit ............................................................................................................... 29 5.2.2 Minimum Detectable Level Change ............................................................................... 30
5.3 Precision ................................................................................................................................. 31
5.5 Operational Factors .................................................................................................................32
Chapter 6 Test Results ...................................................................................................................33 6.1 Accuracy .................................................................................................................................33 6.2 Sensitivity ...............................................................................................................................36
6.2.1 Tolerance Limit ................................................................................................................36 6.2.2 Minimum Detectable Level Change ................................................................................37
6.3 Precision ..................................................................................................................................38 6.4 Phase Separation, Mixing, and Float Response ......................................................................39
6.4.1 Mixing and Float Response with E0 Fuel .......................................................................39 6.4.2 Mixing and Float Response with E15 Fuel .....................................................................42 6.4.3 Mixing and Float Response with Flex Fuel ....................................................................45
6.5 Operational Factors .................................................................................................................49
Chapter 7 Performance Summary for the Franklin Fueling Systems TSP-IGF4 (First Generation) Water Float ................................................................................................................50 7.1 Performance Summary for the Franklin Fueling Systems First Generation Water Float .......50
Chapter 8 Performance Summary for Franklin Fueling Systems TSP-IGF4P (Second Generation) Float ...........................................................................................................................53 8.1 Performance Summary for Franklin Fueling Systems Second Generation Float ...................53
Chapter 9 References ....................................................................................................................56
Appendices
Appendix A Summary of Deviations from the QAPP Appendix B Tank Volume Chart Appendix C Barometric Pressure and Temperature Data Appendix D Franklin Fueling Systems Test Data
vi

vii
Tables
Table 1. Summary of Verification Tests and Performance Parameters ..........................................5 Table 2. Tests 1 and 2 Run Matrix ................................................................................................11 Table 3. Run Summary and Sequence for the Continuing Water Ingress and Dump Tests .........14 Table 4. Analytically Determined Ethanol Content of Fuels ........................................................16 Table 5. Continuous Water Ingress Test Flow Rates ....................................................................17 Table 6. Other Independent Variables Monitored During Testing ...............................................20 Table 7. Data Collection Quality Control Assessments for the ATG Verification Tests .............21 Table 8. Differences from Target Fuel Heights for Continuous and Dump Test Runs ................23 Table 9. PEA Results for ASTM Methods D4815 and D5501 for Ethanol Content Determination ................................................................................................................................24 Table 10. PEA Results for Karl-Fischer Titration Method for Water Content Determination .....25 Table 11. Accuracy Results for the Veeder-Root Standard Water Float ......................................34 Table 12. Accuracy Results for the Veeder-Root Phase-Two™ Water Detector .........................34 Table 13. Accuracy Results for the Veeder-Root Technologies at the start of the incremental run (Time 0) ...............................................................................................................35 Table 14. Accuracy Results for the Veeder-Root Technologies at Run End (Time 100) ............35 Table 15. Tolerance Limit for All Test 1 Runs .............................................................................36 Table 16. Tolerance Limit for Only the E0 Runs .........................................................................36 Table 17. Tolerance Limit for Only the E15 Runs .......................................................................36 Table 18. Minimum Detectable Level Change for All Test 1 Runs .............................................37 Table 19. Minimum Detectable Level Change for Only the E0 Runs ..........................................37 Table 20. Minimum Detectable Level Change for Only the E15 Runs ........................................37 Table 21. Precision Results for the Veeder-Root Standard Water Float ......................................38 Table 22. Precision Results for the Veeder-Root Phase-TwoTM Water Detector .........................38 Table 23. Water Content and Density of Dense Phase at Completion of E0 and E15 Test 1 Runs ...............................................................................................................................................39 Table 24. Water Content and Density of Fuel at Completion of E0 and E15 Test 1 Runs ..........40 Table 25. Summary of Veeder-Root Standard Water Float Dump Test Observations .................47 Table 26. Summary of Veeder-Root Phase Two™ Water Detector Dump Test Observations ....48 Table 27. Summary of Veeder-Root Standard Water Float Accuracy .........................................50 Table 28. Summary of Veeder-Root Standard Water Float Precision and Sensitivity .................52 Table 29. Summary of Veeder-Root Standard Water Float Dump Test Observations .................52 Table 30. Summary of Veeder-Root Phase-TwoTM Water Detector Accuracy ............................53 Table 31. Summary of Veeder-Root Phase-TwoTM Water Detector Precision and Sensitivity ....55 Table 32. Summary of Veeder-Root Phase Two™ Water Detector Dump Test Observations ....55
Figures
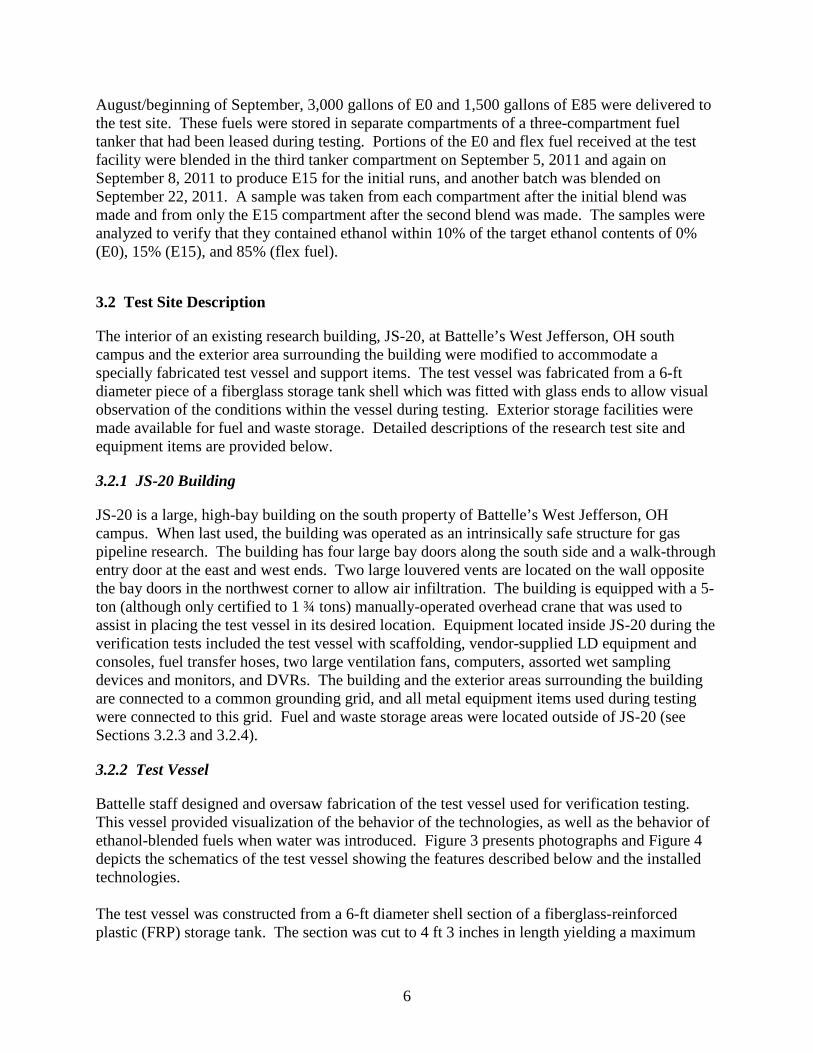
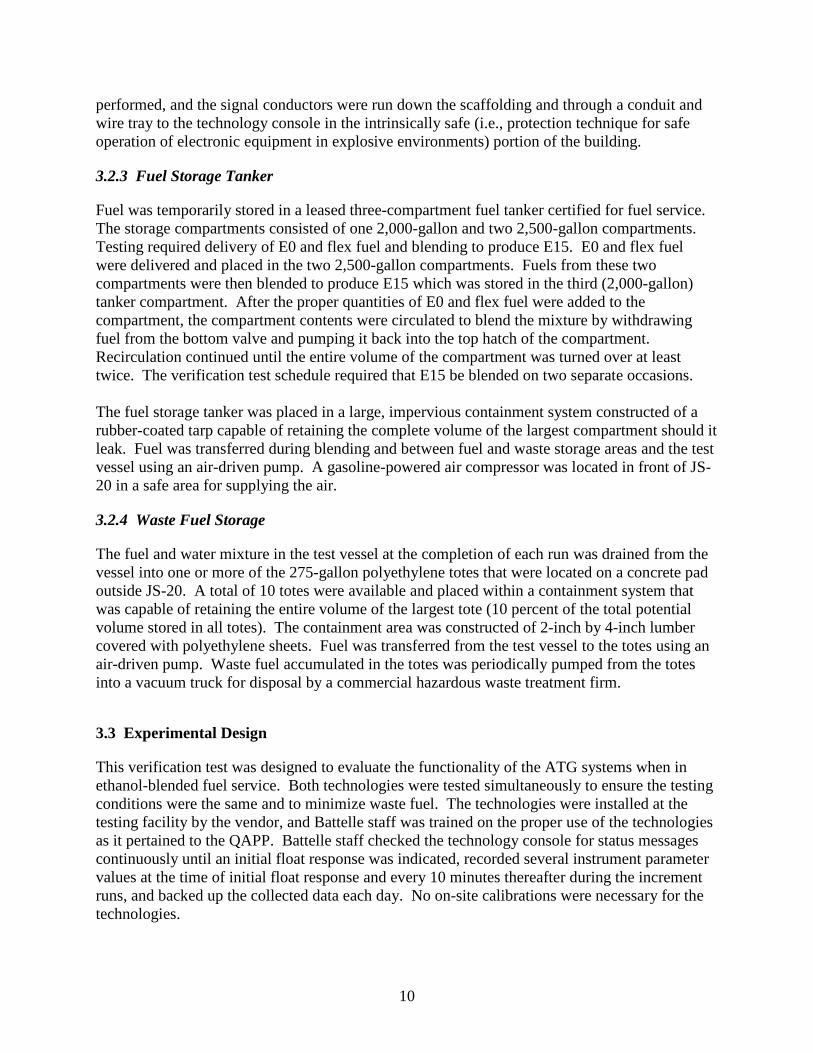
Figure 1. The Veeder-Root Standard Water Float. .........................................................................2 Figure 2. The Veeder-Root Phase-Two™ Water Detector. ..............................................................3 Figure 3. Photographs of the test vessel at the Battelle West Jefferson facility. Top photo is an exterior view test vessel with scaffolding platform. The vessel is holding E0 at 65% full. Bottom photo shows the technologies during an E15 continuous water ingress run.......................8 Figure 4. Test vessel schematic. .....................................................................................................9 Figure 5. E0-25% Full With Splash Duplicate - Graphical display of water detection technology response. ......................................................................................................................40

viii
Figure 6. E0 Dump Test - Graphical display of water detection technology response. ...............41 Figure 7. E15-65% Full-With Splash - Graphical display of water detection technology response..........................................................................................................................................42 Figure 8. E15 Dump Test - Graphical display of water detection technology response. .............43 Figure 9. E15 Dump Test – Before water dump (initial condition). .............................................44 Figure 10. E15 Dump Test – After fuel dump (final condition). ..................................................44 Figure 11. E85-25% Full-With Splash- Graphical display of water detection technology response..........................................................................................................................................45 Figure 12. E85 Dump Test - Graphical display of water detection technology response. ...........46 Figure 13. E85 Dump Test – After the water dump. ....................................................................46 Figure 14. E85 Dump Test – After fuel dump (final condition). ..................................................47
ix
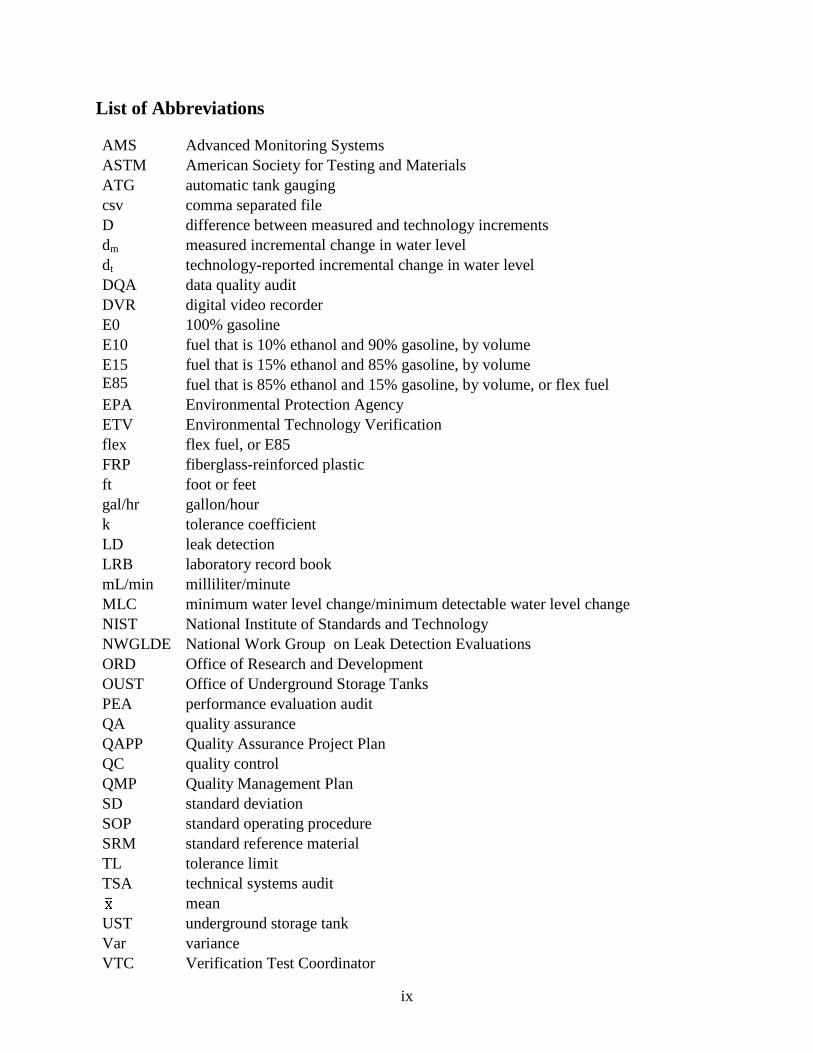
List of Abbreviations
AMS Advanced Monitoring Systems ASTM American Society for Testing and Materials ATG automatic tank gauging csv comma separated file D difference between measured and technology increments dm measured incremental change in water level dt technology-reported incremental change in water level DQA data quality audit DVR digital video recorder E0 100% gasoline E10 fuel that is 10% ethanol and 90% gasoline, by volume E15 fuel that is 15% ethanol and 85% gasoline, by volume E85 fuel that is 85% ethanol and 15% gasoline, by volume, or flex fuel EPA Environmental Protection Agency ETV Environmental Technology Verification flex flex fuel, or E85 FRP fiberglass-reinforced plastic ft foot or feet gal/hr gallon/hour k tolerance coefficient LD leak detection LRB laboratory record book mL/min milliliter/minute MLC minimum water level change/minimum detectable water level change NIST National Institute of Standards and Technology NWGLDE National Work Group on Leak Detection Evaluations ORD Office of Research and Development OUST Office of Underground Storage Tanks PEA performance evaluation audit QA quality assurance QAPP Quality Assurance Project Plan QC quality control QMP Quality Management Plan SD standard deviation SOP standard operating procedure SRM standard reference material TL tolerance limit TSA technical systems audit
mean UST underground storage tank Var variance VTC Verification Test Coordinator

1
Chapter 1 Background
The U.S. EPA supports the ETV Program to facilitate the deployment of innovative environmental technologies through performance verification and dissemination of information. The goal of the ETV Program is to further environmental protection by accelerating the acceptance and use of improved and cost-effective technologies. ETV seeks to achieve this goal by providing high-quality, peer-reviewed data on technology performance to those involved in the design, distribution, financing, permitting, purchase, and use of environmental technologies. ETV works in partnership with recognized testing organizations; with stakeholder groups consisting of buyers, vendor organizations, and permitters; and with the full participation of individual technology developers. The program evaluates the performance of innovative technologies by developing test plans that are responsive to the needs of stakeholders, conducting field or laboratory bench tests (as appropriate), collecting and analyzing data, and preparing peer-reviewed reports. All evaluations are conducted in accordance with rigorous QA protocols to ensure that data of known and adequate quality are generated and that the results are defensible. The definition of ETV verification is to establish or prove the truth of the performance of a technology under specific, pre-determined criteria or protocols and a strong quality management system. High-quality data are assured through implementation of the ETV Quality Management Plan (QMP). ETV does not endorse, certify, or approve technologies. The EPA’s National Risk Management Research Laboratory and its verification organization partner, Battelle, operate the Advanced Monitoring Systems (AMS) Center under ETV. The AMS Center recently evaluated the performances of two Veeder-Root technologies: a Standard Water Float and a Phase-Two™ Water Detector.
2
Chapter 2 Technology Description
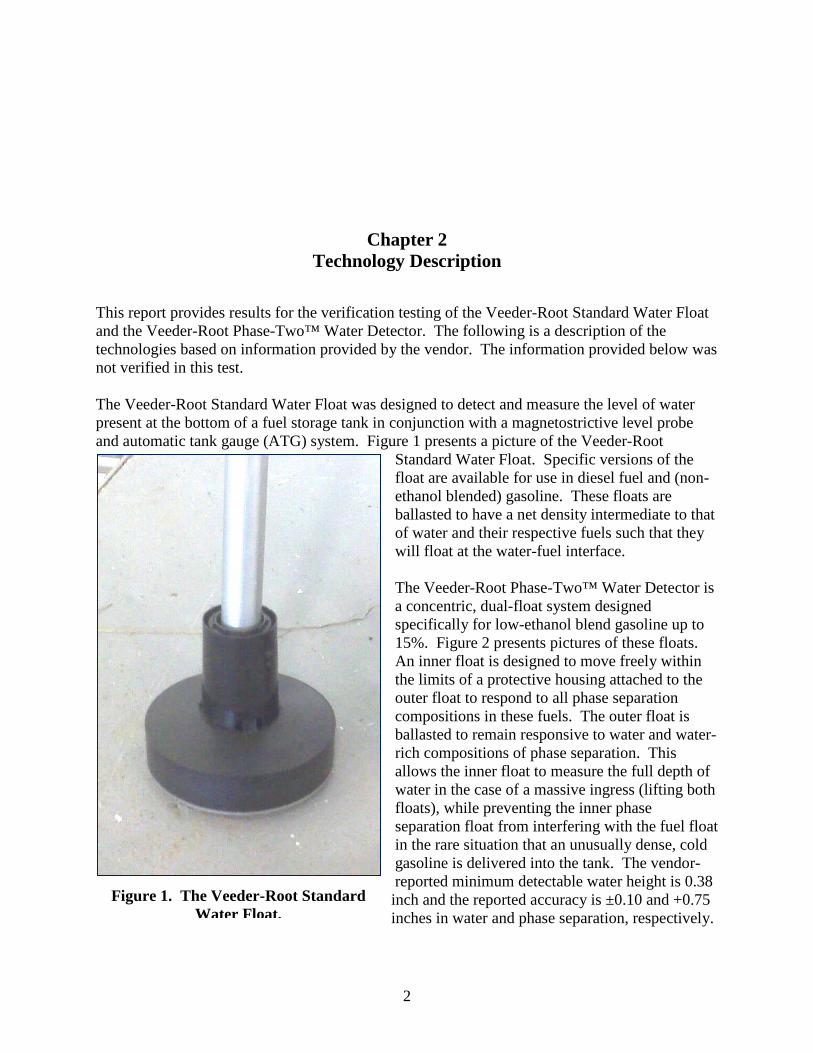
This report provides results for the verification testing of the Veeder-Root Standard Water Float and the Veeder-Root Phase-Two™ Water Detector. The following is a description of the technologies based on information provided by the vendor. The information provided below was not verified in this test. The Veeder-Root Standard Water Float was designed to detect and measure the level of water present at the bottom of a fuel storage tank in conjunction with a magnetostrictive level probe and automatic tank gauge (ATG) system. Figure 1 presents a picture of the Veeder-Root
Standard Water Float. Specific versions of the float are available for use in diesel fuel and (non-ethanol blended) gasoline. These floats are ballasted to have a net density intermediate to that of water and their respective fuels such that they will float at the water-fuel interface. The Veeder-Root Phase-Two™ Water Detector is a concentric, dual-float system designed specifically for low-ethanol blend gasoline up to 15%. Figure 2 presents pictures of these floats. An inner float is designed to move freely within the limits of a protective housing attached to the outer float to respond to all phase separation compositions in these fuels. The outer float is ballasted to remain responsive to water and water-rich compositions of phase separation. This allows the inner float to measure the full depth of water in the case of a massive ingress (lifting both floats), while preventing the inner phase separation float from interfering with the fuel float in the rare situation that an unusually dense, cold gasoline is delivered into the tank. The vendor-reported minimum detectable water height is 0.38 inch and the reported accuracy is ±0.10 and +0.75 inches in water and phase separation, respectively.
Figure 1. The Veeder-Root Standard Water Float.

3
From the National Work Group on Leak Detection Evaluations’ (NWGLDE) 2010 revised certification, a previous Veeder-Root water detection technology test of their Phase-Two™ Water Detector reported having the following water sensor results in diesel fuel (http://www.nwglde.org/evals/veeder_root_j.html):
• Minimum detectable water level in the tank is 0.38 inch when using the TLS 350 console with an 8463 magnetostrictive probe and 88610x-0x0 Phase-Two™ water float
• Minimum detectable change in water level is 0.005 inch for leak rate of 0.2 gal/hr. • Minimum detectable change in water level is 0.027 inch for leak rate of 0.1 gal/hr.
Information acquired during operation of these water detection technologies is transmitted from the floats via a two-conductor signal cable to a data recording and display console. A single console can compile data for several individual floats, and the Veeder-Root TLS-350 was used for this purpose during this verification test. The TLS-350 provides an electronic display and paper printout of fuel and water heights and volumes, as well as settings for warnings and alarms based on measured heights. The console also generates an electronic data file that can be continuously transferred to a computer for users wanting access to the data.
The total cost of the Veeder-Root technologies that were used for testing was $6,423. This setup included the TLS-350 console with printer (p/n 84290-022, $3,455), two probes used for inventory only, i.e., no other features incorporated into the probes (p/n 846391-3xx, $1,117 each), the Standard 4 inch water float kit for gasoline (p/n 330020-7xx, $420), and the Phase-Two™ Float Kit (p/n 886100-0xx, $314) (the float kits
also included the fuel height float).
The total cost for the Standard Water Float setup alone would be $4,992, which includes the console, probe and float kit ($1,537 not including the console), while the cost for the Phase-Two™ Water Detection setup would be $4,886, which includes the console, probe and float kit ($1,431 not including the console).
Figure 2. The Veeder-Root Phase-Two™ Water Detector.

4
Chapter 3 Test Design and Procedures
3.1 Test Overview
This verification test was conducted according to procedures specified in the QAPP,1 including deviations as described in Appendix A, and adhered to the quality system defined in the ETV AMS Center QMP2. A technical panel of stakeholders was assembled specifically for the preparation of the QAPP. A list of participants in the technical panel is presented in the QAPP. The panel included representatives from industry associations, state and federal governments, including representatives of the NWGLDE, and users. The responsibilities of verification test stakeholders and/or peer reviewers included:
• Participate in technical panel discussions (when available) to provide input to the test design;
• Review and provide input to the QAPP; and • Review and provide input to the verification report(s)/verification statement(s).
The QAPP and this verification report were reviewed by experts in the fields related to underground storage tank (UST) leak detection (LD) and statistics. The following experts provided peer review:
• Randy Jennings, Tennessee Department of Agriculture and • Samuel Gordji, University of Mississippi and SSG Associates.
Battelle conducted this verification test with funding support from the EPA’s Offices of Research and Development (ORD) and Underground Storage Tanks (OUST) and the technology vendors, with in-kind support from the Xerxes Corporation (a 6-foot [ft] diameter fiberglass UST shell), Tanknology (tank fittings), BP (provided 3,000 gallons of unleaded gasoline plus transportation) and analytical support from Marathon Corporation.
5
This verification test evaluated the performances of the Veeder-Root Standard Water Float and Phase-Two™ Water Detector. The goal of this verification test was to provide information on the operability of ATG systems when used with ethanol-blended fuel. To accomplish this goal, the experimental design included the following four options for testing:
1. Water ingress detection of continuous water ingress with a splash or without a splash (Continuous);
2. Water ingress detection of a quick water dump, then a fuel dump (Quick Dump); 3. Water ingress and fuel leak detection during water ingress and fuel egress (Water
Ingress + LD); and 4. Fuel leak detection (LD).
Veeder-Root chose to have its technologies tested using options 1 and 2 as described in the QAPP for water ingress detection. These tests were performed in a controlled test vessel that simulated the storage tank environment. The verification testing was conducted in a research building at Battelle’s West Jefferson, OH facility between September 13 and September 30, 2011. The technologies were challenged with fuel of differing ethanol compositions, fuel heights within the test vessel, and water ingress methods/rates. The resulting water detection data were used to calculate the accuracy, sensitivity, and precision, where appropriate. Operational factors such as maintenance needs, data output, ease of use, and repair requirements were also assessed based on technical staff observations. These performance parameters were evaluated quantitatively using the statistical methods in Chapter 5 and qualitatively through recorded observations. Temperature and density within the test vessel were monitored throughout testing, and the water content of the fuels and dense phases were analytically determined after testing using Karl Fisher titration. All testing was captured using one or more digital video recorders (DVRs). Table 1 presents a summary of the tests performed, and Section 3.3 presents the experimental design.
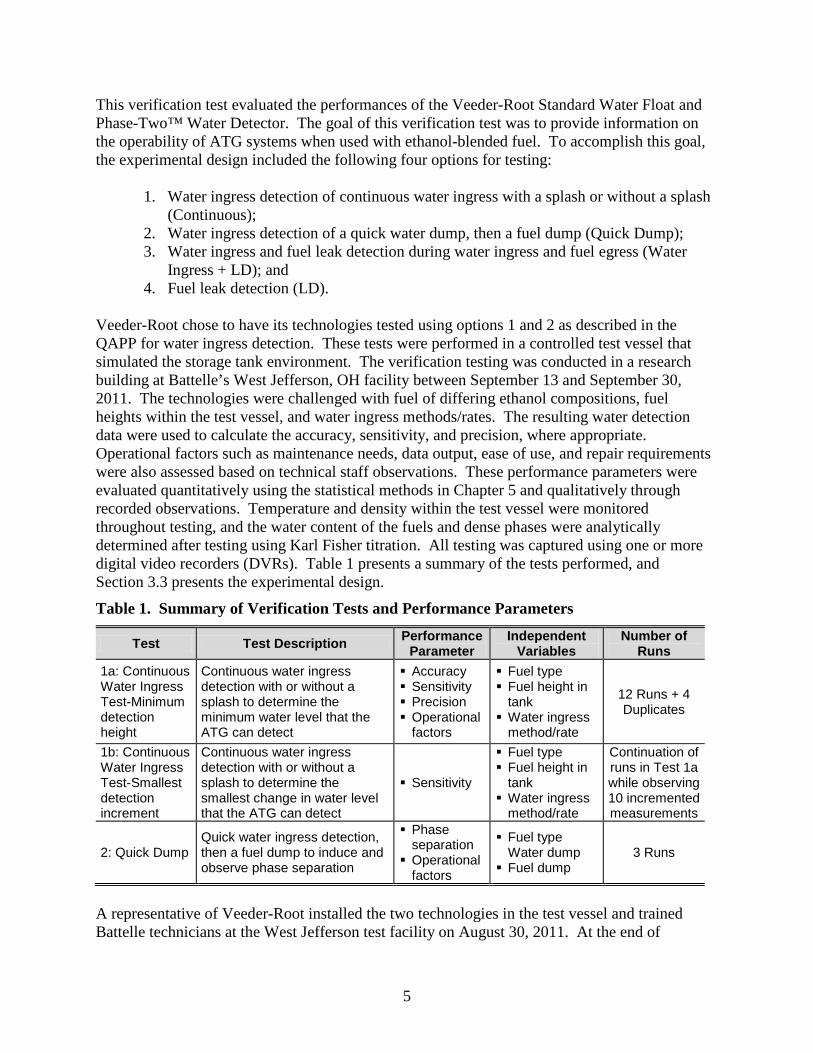
Table 1. Summary of Verification Tests and Performance Parameters
Test Test Description Performance Parameter
Independent Variables
Number of Runs
1a: Continuous Water Ingress Test-Minimum detection height
Continuous water ingress detection with or without a splash to determine the minimum water level that the ATG can detect
Accuracy Sensitivity Precision Operational
factors
Fuel type Fuel height in
tank Water ingress
method/rate
12 Runs + 4 Duplicates
1b: Continuous Water Ingress Test-Smallest detection increment
Continuous water ingress detection with or without a splash to determine the smallest change in water level that the ATG can detect
Sensitivity
Fuel type Fuel height in
tank Water ingress
method/rate
Continuation of runs in Test 1a while observing 10 incremented measurements
2: Quick Dump Quick water ingress detection, then a fuel dump to induce and observe phase separation
Phase separation
Operational factors
Fuel type Water dump
Fuel dump 3 Runs
A representative of Veeder-Root installed the two technologies in the test vessel and trained Battelle technicians at the West Jefferson test facility on August 30, 2011. At the end of
6
August/beginning of September, 3,000 gallons of E0 and 1,500 gallons of E85 were delivered to the test site. These fuels were stored in separate compartments of a three-compartment fuel tanker that had been leased during testing. Portions of the E0 and flex fuel received at the test facility were blended in the third tanker compartment on September 5, 2011 and again on September 8, 2011 to produce E15 for the initial runs, and another batch was blended on September 22, 2011. A sample was taken from each compartment after the initial blend was made and from only the E15 compartment after the second blend was made. The samples were analyzed to verify that they contained ethanol within 10% of the target ethanol contents of 0% (E0), 15% (E15), and 85% (flex fuel).
3.2 Test Site Description
The interior of an existing research building, JS-20, at Battelle’s West Jefferson, OH south campus and the exterior area surrounding the building were modified to accommodate a specially fabricated test vessel and support items. The test vessel was fabricated from a 6-ft diameter piece of a fiberglass storage tank shell which was fitted with glass ends to allow visual observation of the conditions within the vessel during testing. Exterior storage facilities were made available for fuel and waste storage. Detailed descriptions of the research test site and equipment items are provided below.
3.2.1 JS-20 Building
JS-20 is a large, high-bay building on the south property of Battelle’s West Jefferson, OH campus. When last used, the building was operated as an intrinsically safe structure for gas pipeline research. The building has four large bay doors along the south side and a walk-through entry door at the east and west ends. Two large louvered vents are located on the wall opposite the bay doors in the northwest corner to allow air infiltration. The building is equipped with a 5-ton (although only certified to 1 ¾ tons) manually-operated overhead crane that was used to assist in placing the test vessel in its desired location. Equipment located inside JS-20 during the verification tests included the test vessel with scaffolding, vendor-supplied LD equipment and consoles, fuel transfer hoses, two large ventilation fans, computers, assorted wet sampling devices and monitors, and DVRs. The building and the exterior areas surrounding the building are connected to a common grounding grid, and all metal equipment items used during testing were connected to this grid. Fuel and waste storage areas were located outside of JS-20 (see Sections 3.2.3 and 3.2.4).
3.2.2 Test Vessel
Battelle staff designed and oversaw fabrication of the test vessel used for verification testing. This vessel provided visualization of the behavior of the technologies, as well as the behavior of ethanol-blended fuels when water was introduced. Figure 3 presents photographs and Figure 4 depicts the schematics of the test vessel showing the features described below and the installed technologies. The test vessel was constructed from a 6-ft diameter shell section of a fiberglass-reinforced plastic (FRP) storage tank. The section was cut to 4 ft 3 inches in length yielding a maximum

7
volume of 880 gallons. Appendix B presents the tank chart for the fabricated test vessel and lists the volume at various fill heights. Glass bulkheads were installed at each end of the test vessel to allow observation of the interior during the runs. The vessel was checked for leaks at the fabrication shop and again after being placed in JS-20 by filling it with water to 94% of its capacity (approximately 830 gallons). At the fabrication shop the leak test lasted for 2 hours (hr), while at the field test site the leak test lasted overnight. The test vessel was equipped with four fiberglass ports to allow placement of the LD equipment to be tested. These ports were constructed of 4-inch FRP couplers with 12-inch risers installed along the top surface centerline of the test vessel. The top of the test vessel was also fitted with a 2-inch fuel filler cap and port. A fuel filler riser pipe extended down from this fuel filler port to a point approximately 14 inches from the bottom of the test vessel. A vent line was installed near the top of the test vessel to transport vapors displaced during filling and operation to the outside of the JS-20 structure. A 2-inch drain, two 4-inch sampling ports, and a 4-inch water ingress port were also fitted to the test vessel. Approximately 5 quarts of resin were added to the bottom of the test vessel to level the base and raise the interior shell to the height of the drain line, thus allowing complete draining of the test vessel between runs. Finally, four 2-inch thermometer wells were installed at approximately the 25% height and 50% height levels for holding thermometers. A containment system was constructed around the test vessel which was capable of retaining the complete volume of the test vessel should it leak. The containment was constructed of 2-inch by 4-inch lumber covered with several layers of polyethylene sheets. The QAPP originally specified that a grid pattern would be placed on the bottom of the tank to enhance visualization of the dense phase. However, the entire interior of the test vessel was coated with a white resin to provide a contrast with the liquid in the vessel such that the grid was not necessary. Rulers were also placed vertically into the resin at each end of the test vessel to measure the observed dense phase height to the nearest millimeter (mm). For further information see the documentation on Deviation Number 8 in Appendix A. As part of the verification, water was allowed to enter the test vessel in one of three ways: as an ingress that produced a splash, as an ingress that did not produce a splash, and as a large volume water dump. A system for water delivery into the test vessel was fabricated to accommodate controlled ingress of water to satisfy each of these ingress methods. The water delivery system consisted of a 5-gallon bucket that delivered water to either a rotameter with a range of 0 to 300 milliliters per min (mL/min) or a 2-inch valve. The rotameter led to a three-way valve that could be toggled between a splash-ingress tube and a no-splash ingress tube. The splash-ingress tube discharged straight into the test vessel, while the no-splash-ingress tube delivered water that trickled down the fuel filler pipe and into the test vessel without causing a splash. The 2-inch valve, when opened, allowed rapid introduction of water into the vessel. A constant pressure head was maintained in the supply bucket to ensure that the rotameter flow rate did not fluctuate during the verification run. The constant head was established by filling the bucket through a water float valve from a separate 18-gallon reservoir. Scaffolding was erected around the test vessel to provide access to the sampling ports and the water delivery system.

8
Figure 3. Photographs of the test vessel at the Battelle West Jefferson facility. Top photo is an exterior view test vessel with scaffolding platform. The vessel is holding E0 at 65% full. Bottom photo shows the technologies during an E15 continuous water ingress run.

9
Figure 4. Test vessel schematic. A representative of Veeder-Root installed the two technologies to be verified using two of the 4-inch ports provided on top of the test vessel. The Phase-Two™ Water Detector, designed for observing a separated phase, was installed in the port nearest the glass, and the Standard Water Float was installed in the port nearest the middle of the test vessel. A standard installation was
6 feet
Top View
Side View
Veeder -Root Technology Ports
Sampling Ports Fuel
Filling Port
Water Ingress Port
Vent
Drain
Glass Ends
4.25 feet
Veeder-Root Technology Ports
North End
6 feet
Fuel Filling Riser
Thermometer wells (4)
Front View
Thermometer Wells
Additional ATG Ports
4.25 feet
Additional ATG Ports
Sampling Ports
10
performed, and the signal conductors were run down the scaffolding and through a conduit and wire tray to the technology console in the intrinsically safe (i.e., protection technique for safe operation of electronic equipment in explosive environments) portion of the building.
3.2.3 Fuel Storage Tanker
Fuel was temporarily stored in a leased three-compartment fuel tanker certified for fuel service. The storage compartments consisted of one 2,000-gallon and two 2,500-gallon compartments. Testing required delivery of E0 and flex fuel and blending to produce E15. E0 and flex fuel were delivered and placed in the two 2,500-gallon compartments. Fuels from these two compartments were then blended to produce E15 which was stored in the third (2,000-gallon) tanker compartment. After the proper quantities of E0 and flex fuel were added to the compartment, the compartment contents were circulated to blend the mixture by withdrawing fuel from the bottom valve and pumping it back into the top hatch of the compartment. Recirculation continued until the entire volume of the compartment was turned over at least twice. The verification test schedule required that E15 be blended on two separate occasions. The fuel storage tanker was placed in a large, impervious containment system constructed of a rubber-coated tarp capable of retaining the complete volume of the largest compartment should it leak. Fuel was transferred during blending and between fuel and waste storage areas and the test vessel using an air-driven pump. A gasoline-powered air compressor was located in front of JS-20 in a safe area for supplying the air.
3.2.4 Waste Fuel Storage
The fuel and water mixture in the test vessel at the completion of each run was drained from the vessel into one or more of the 275-gallon polyethylene totes that were located on a concrete pad outside JS-20. A total of 10 totes were available and placed within a containment system that was capable of retaining the entire volume of the largest tote (10 percent of the total potential volume stored in all totes). The containment area was constructed of 2-inch by 4-inch lumber covered with polyethylene sheets. Fuel was transferred from the test vessel to the totes using an air-driven pump. Waste fuel accumulated in the totes was periodically pumped from the totes into a vacuum truck for disposal by a commercial hazardous waste treatment firm.
3.3 Experimental Design
This verification test was designed to evaluate the functionality of the ATG systems when in ethanol-blended fuel service. Both technologies were tested simultaneously to ensure the testing conditions were the same and to minimize waste fuel. The technologies were installed at the testing facility by the vendor, and Battelle staff was trained on the proper use of the technologies as it pertained to the QAPP. Battelle staff checked the technology console for status messages continuously until an initial float response was indicated, recorded several instrument parameter values at the time of initial float response and every 10 minutes thereafter during the increment runs, and backed up the collected data each day. No on-site calibrations were necessary for the technologies.
11
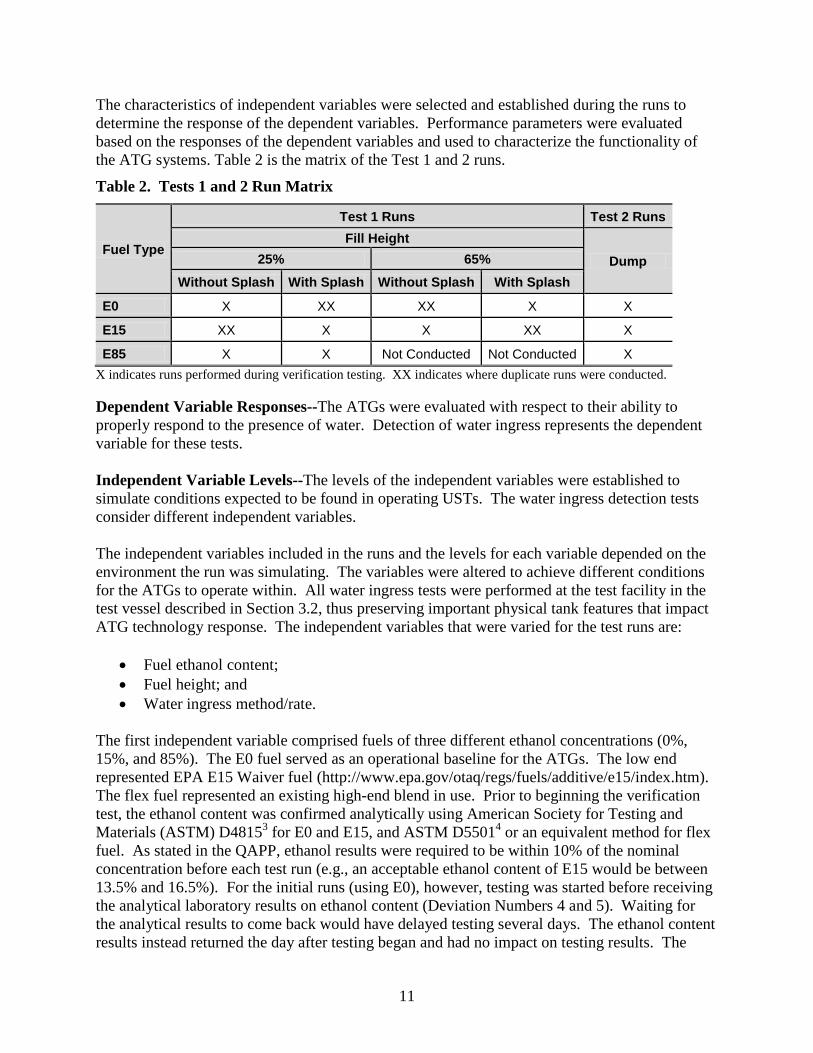
The characteristics of independent variables were selected and established during the runs to determine the response of the dependent variables. Performance parameters were evaluated based on the responses of the dependent variables and used to characterize the functionality of the ATG systems. Table 2 is the matrix of the Test 1 and 2 runs.
Table 2. Tests 1 and 2 Run Matrix
Fuel Type
Test 1 Runs Test 2 Runs Fill Height
Dump 25% 65%
Without Splash With Splash Without Splash With Splash
E0 X XX XX X X
E15 XX X X XX X
E85 X X Not Conducted Not Conducted X X indicates runs performed during verification testing. XX indicates where duplicate runs were conducted. Dependent Variable Responses--The ATGs were evaluated with respect to their ability to properly respond to the presence of water. Detection of water ingress represents the dependent variable for these tests. Independent Variable Levels--The levels of the independent variables were established to simulate conditions expected to be found in operating USTs. The water ingress detection tests consider different independent variables. The independent variables included in the runs and the levels for each variable depended on the environment the run was simulating. The variables were altered to achieve different conditions for the ATGs to operate within. All water ingress tests were performed at the test facility in the test vessel described in Section 3.2, thus preserving important physical tank features that impact ATG technology response. The independent variables that were varied for the test runs are:
• Fuel ethanol content; • Fuel height; and • Water ingress method/rate.
The first independent variable comprised fuels of three different ethanol concentrations (0%, 15%, and 85%). The E0 fuel served as an operational baseline for the ATGs. The low end represented EPA E15 Waiver fuel (http://www.epa.gov/otaq/regs/fuels/additive/e15/index.htm). The flex fuel represented an existing high-end blend in use. Prior to beginning the verification test, the ethanol content was confirmed analytically using American Society for Testing and Materials (ASTM) D48153 for E0 and E15, and ASTM D55014 or an equivalent method for flex fuel. As stated in the QAPP, ethanol results were required to be within 10% of the nominal concentration before each test run (e.g., an acceptable ethanol content of E15 would be between 13.5% and 16.5%). For the initial runs (using E0), however, testing was started before receiving the analytical laboratory results on ethanol content (Deviation Numbers 4 and 5). Waiting for the analytical results to come back would have delayed testing several days. The ethanol content results instead returned the day after testing began and had no impact on testing results. The

12
water content of the fuel and the ethanol-water mixture (dense phase) were determined using a Karl-Fischer titration method. The second independent variable was defined as fuel height and consisted of two heights (a 25% full tank and a 65% full tank) during verification testing. These two heights were chosen to represent reasonable fuel levels that could be expected in operating tanks. The lower fuel height yielded the greater splash mixing potential, but shorter diffusion columns through which the water could flow. Conversely, the higher fuel height yielded the lower splash mixing potential, but the higher diffusion column. The fill heights were established to ± 10% of the target height of either 25% or 65%. At 25% and 65% of the height of the test vessel, 170 and 610 gallons, respectively, of fuel were in the test vessel. The QAPP called for testing the technologies at 25% full and 90% full. Instead of a 90% full height, testing was performed at a 65% full height. The change of testing at 65% instead of 90% was made as a result of laboratory bench tests showing that flex fuel has the potential to hold a large amount of water. Testing at a 90% height would have potentially resulted in insufficient space in the test vessel to complete water ingress testing for flex fuel. The change in fuel fill height is the subject of Deviation Number 1. Additionally, this change resulted in less fuel waste and safer conduct of testing due to the smaller amounts of fuel needed for the respective tests while maintaining a substantially higher diffusion column than possible with the 25% height. The third independent variable was water ingress method/rate. Water ingress was either continuous or rapid. Continuous ingress was performed with or without a splash on the surface of the fuel. Water was fed into the test vessel at a constant rate which was controlled using a constant pressure-head reservoir metered through a rotameter. The location of the continuous water ingress was either straight onto the fuel surface or down the surface of the fuel filler riser. These two methods were selected to simulate the types of continuous water ingress that might occur in an operating UST. A rapid water ingress method was also devised, wherein a 2-gallon dump of water was rapidly dropped into the test vessel as might occur when water was present in the fuel delivery tanker or present in the spill bucket prior to opening.
3.3.1 Test 1a Continuous Water Ingress Test-Minimum Detection Height
The water ingress tests were focused on the mixing method of water addition into the test vessel. In the first test, a continuous stream of water was introduced into the test vessel to produce a splash on the surface of the fuel or to not produce a splash by trickling the water along the surface of the fuel filler riser pipe to slowly meet the surface of the fuel. These runs were performed using the three different ethanol blends at two different fill heights described above. The independent variables and levels for the continuous water ingress test were:
• Fuel ethanol content (three levels): E0, E15, and flex fuel; • Fuel height (two levels): 25% and 65% full; and • Water ingress method/rate (two levels): with splash and without splash.
The water ingress method/rate was selected to establish conditions that impact the degree of mixing that occurs in a tank using the three ethanol blends. In these runs, the true ingress rate ranged from a minimum of 152 mL/min to 188 mL/min for both the with- and without-splash

13
ingress rates. The rate was established to accumulate enough water to generate a technology response within 1 hour. In some cases the water addition continued beyond 1 hour to ensure observing a response in the water detection technology. If a response was not observed in 3 hours, the run was terminated. Run termination times were established to be the same for the two ingress methods because it was expected that this time interval encompasses the potential for the technologies to detect the water with both ingress methods. With these methods of water ingress, some mixing occurred due to splash mixing (depending on the height of fuel in the vessel) and some mixing occurred by diffusion (no splash). Introducing water with a splash was accomplished by positioning a water tube such that water droplets would free-fall to the fuel surface below. Introducing water without a splash was accomplished by positioning the water tube such that surface tension allowed the water to flow along the outside of the fuel filler riser pipe with minimal agitation to the surface of the fuel.
3.3.2 Test 1b Continuous Water Ingress Test-Smallest Detection Increment
To address the second requirement of water detection, once the water detection technologies reacted to the minimum water height, the smallest increment in water height that can be measured was determined. The ingress rate of 200 mL/min was calculated to produce a height increase at the bottom of the tank of approximately 1/16th of an inch in 10 minutes. Readings were taken from the technology, as well as visually, 10 minutes after the increment portion of the run started. Both the technology readings and the manually-measured water levels were recorded. Readings/measurements were taken after ten, 10-minute increments for each replicate of Test 1 (to produce a minimum of 100 measurements).
3.3.3 Test 2 Water Ingress Detection of a Quick Water Dump, Then a Fuel Dump (Quick Dump)
The second test focused on the potential to detect phase separation in an UST. The test was designed to simulate a quick water ingress rate followed by a high degree of mixing such as might occur if the spill bucket was dumped into the tank at a 25% fill height and then fuel was dumped to fill the tank to a 65% fill height. This test was mainly observational in that the test vessel was disturbed quickly with water and fuel, and the response of the technology was recorded throughout the test. Three runs of this type were conducted for Test 2, one for each of the fuel types being evaluated in this verification test. The E0 run was conducted first and used as the baseline for the technology responses to establish the minimum wait time of 30 minutes with E15 and flex fuel. The independent variables and levels for Quick Dump water ingress test were:
• Fuel ethanol content (three levels): E0, E15, and flex fuel; • Fuel height started at 25% and was filled after water detection to 65% full; and • Water ingress method/rate: 2 gallon water dumps until the technologies detected water
ingress Table 3 presents the run summary and sequence for Tests 1 and 2. The QAPP called for data to be gathered under every combination of levels between all variables. However, when performing the flex fuel runs at 25% of the tank height, the run termination time was reached before the technology responded to the water ingress or any clear presence of water or a

14
separated phase was produced. (After 3 hours at 200 mL/min, approximately 7.5 gallons of water would have been added, which should have produced a water level of approximately 2 inches.) The time to produce a response in a 65% full vessel would need to be even greater than this time. As a result, and per the QAPP, the two 65% full runs were removed from the test design since it was believed that no usable quantifiable data would be generated, and a large amount of contaminated fuel would have been produced.
Table 3. Run Summary and Sequence for the Continuing Water Ingress and Dump Tests
Test Day Date (2011) Fuel Type
Fill Height, percent Ingress Method Run ID
1 9/13 E0 25 Without Splash E0-25-wo 2 9/14 E0 25 With Splash E0-25-w 3 9/15 E0 25 then 65 Dump E0-dump 4 9/16 E0 65 Without Splash E0-65-wo 5 9/19 E0 65 With Splash E0-65-w 5 9/19 E0 65 Without Splash E0-65-wo-DUP 6 9/20 E15 25 Without Splash E15-25-wo 7 9/21 E15 25 With Splash E15-25-w 7 9/21 E15 25 Without Splash E15-25-wo-DUP 8 9/22 Flex 25 Without Splash Flex-25-wo 9 9/23 Flex 25 then 65 Dump Flex-dump
10 9/26 Flex 25 With Splash Flex-25-w 11 9/27 E15 65 With Splash E15-65-w 12 9/28 E15 25 then 65 Dump E15-dump 12 9/28 E0 25 With Splash E0-25-w-DUP 13 9/29 E15 65 Without Splash E15-65-wo 14 9/30 E15 65 With Splash E15-65-w-DUP Not conducted* Flex 65 Without Splash Flex-65-wo Not conducted* Flex 65 With Splash Flex-65-w
w - with wo – without DUP – duplicate/replicate run *Runs not conducted because the results from the flex fuel runs at 25% full were terminated after 3 hours without responses from the technologies.
3.4 Experimental Procedures
3.4.1 Pre-Run Preparations
A number of pre-run preparations were performed to ensure data quality and consistency. Pre-run preparations included fuel blending and transfer, preparation of the water distribution system, and introduction of water to the drain in the test vessel.

15
Table 3 presents the fuels and ingress methods that were used for the various runs during testing. Some run conditions listed in Table 3 differ from the conditions discussed in the QAPP. For instance, the flex fuel test with a fill height of 65% never occurred because testing at the 25% level generated inconclusive data. If the flex fuel tests had also been run, the results would have been just as inconclusive and would have wasted several hundred gallons of fuel. Also E0-25-wo-DUP was run as a duplicate of E0-25-wo instead of Flex-25-w as was stated in the QAPP, because the Flex-25-wo and Flex-25-w runs were terminated after 3 hours of inconclusive results. For further information refer to Deviation Number 12. Fuel deliveries included E0 and flex fuel. These fuels were used in the runs and they were also used to prepare two volumes of E15 (VE15). The amounts of E0 (VE0) and flex fuel (VFF), which was presumed to contain 85% ethanol, needed for the blend were calculated using the equations shown below:
𝑽E15 ∗ 𝟎.𝟏𝟓 = 𝑽Etoh Equation 1
𝑽Etoh
𝟎.𝟖𝟓= 𝑽FF Equation 2
𝑽E15 − 𝑽FF = 𝑽E0 Equation 3
Two batches of E15 blend were produced during the tests. For the initial batch, the calculated volumes of E0 and flex fuel were measured by the pump gauge on the delivery tanker and pumped into the fuel storage tanker or one of the 275-gallon totes. For the second batch, the calculated volumes of E0 and flex fuel were placed into one or more 275-gallon totes and measured using the graduation marks on the totes. After the corrected volumes were measured, both the E0 and flex fuel were added to one compartment in the fuel storage tanker. The pump was then set up to circulate the contents of the bottom of the compartment to the top of the compartment to mix the solution. The contents of the compartment were mixed for roughly an hour, or long enough for the pump to circulate the volume two times. After mixing, a 50 mL sample was collected to determine the actual ethanol content using the quick test described in the next paragraph. If the quick test results came back low, more flex fuel would have been mixed in, while if the quick test results came back high, more E0 would have been added (although neither of these ever occurred during testing). The quick test was then repeated and the process continued until the desired ethanol content was established. Prior to collecting a sample for laboratory analysis, the ethanol content of each bulk fuel was tested using a method published in Appendix E of the “Guidebook for Handling, Storing, & Dispensing Fuel Ethanol.”5 This quick test was performed by adding 50 mL of water and 50 mL of ethanol fuel to a 100 mL graduated cylinder, capping the cylinder, and shaking it until the contents were fully mixed. The volume of the dense phase and the volume of the light phase (Vlp) were both recorded after mixing. The ethanol content (Etoh) was calculated using the following equation:
𝑬toh = 𝟗𝟖.𝟔𝟗 − [𝟏.𝟗𝟕 ∗ (𝑽lp)] Equation 4

16
After the ethanol content was determined using the quick test and found to be in the requisite concentration range, roughly 100 mL of each fuel blend was collected and sent to an analytical laboratory for analysis. The QAPP indicated that these samples would be stored and shipped at 0° to 5°C (32° to 40°F), but after discussion with the analytical laboratory it was determined that shipping and handling at ambient temperature would be adequate (Deviation Number 6). Table 4 presents the amount of ethanol in the fuels used for this verification test.
Table 4. Analytically Determined Ethanol Content of Fuels Ethanol Blend
Sampled Date
Analysis Date Batch
Analytical Method
% Volume Ethanol
E0 8-Sep-11 9-Sep-11 1 D4815 0.11 E15 8-Sep-11 9-Sep-11 1 D4815 13.76 E15 Duplicate 8-Sep-11 9-Sep-11 1 D4815 13.79 E85 8-Sep-11 9-Sep-11 1 D5501 74.54* E85 8-Sep-11 9-Sep-11 1 D5501 74.65* E15 26-Sep-11 28-Sep-11 2 D4815 14.46 E85 29-Sep-11 4-Oct-11 1-rerun Modified D5501 79.66 E85 Duplicate 29-Sep-11 4-Oct-11 1-rerun Modified D5501 79.44
*Results not within acceptance criteria, rerun using a modified D5501 method by another laboratory. Deviation 3 stated that the original analytical laboratory determination of the flex fuel ethanol content was not within ±10% of 85 percent ethanol as was specified in the QAPP. This laboratory also used a calibrated range outside the acceptable target range of the sample but within the stated ASTM method. However, both the fuel terminal mix ticket from the fuel supplier and the quick test described in Section 3.4.1 determined the fuel ethanol content to be acceptable. Because of this information and due to time constraints, the verification testing continued as scheduled, and another flex fuel sample was sent to a different laboratory. This second laboratory performed a modified D5501 method that expanded the calibration range to encompass the targeted range of this technology evaluation. This laboratory determined the sample to contain 79.55% ethanol, which was within ±10% of the expected value. After the ethanol content of the fuel was determined, fuel was transferred from the storage area to the test vessel. An air driven pump and several sections of transfer hose were used to transfer fuel into the test vessel. The suction hose was first used to connect the correct tanker compartment to the pump inlet, and the discharge hose was used to connect the pump outlet into the test vessel. After the proper vent lines and valves were open, the air line that supplied compressed air to the pump was opened to allow fuel to flow from the tanker into the test vessel. The 25% and 65% fill levels were marked on the outside of the test vessel with a measuring tape, and when the fuel was at the desired level, the tanker discharge valve was closed. The discharge hoses were completely cleared of fuel between runs. The hoses were then disconnected, coupled to themselves (end-to-end) and stored until the next transfer.
3.4.2 Water Preparation and Rotameter Checks
Water used for the ingress tests was colored with food dye, placed in a two-reservoir distribution system with a constant head, and fed to the test vessel through a rotameter or dump valve. Tap water from the site was placed in an 18-gallon reserve bucket, and several drops of food dye
17
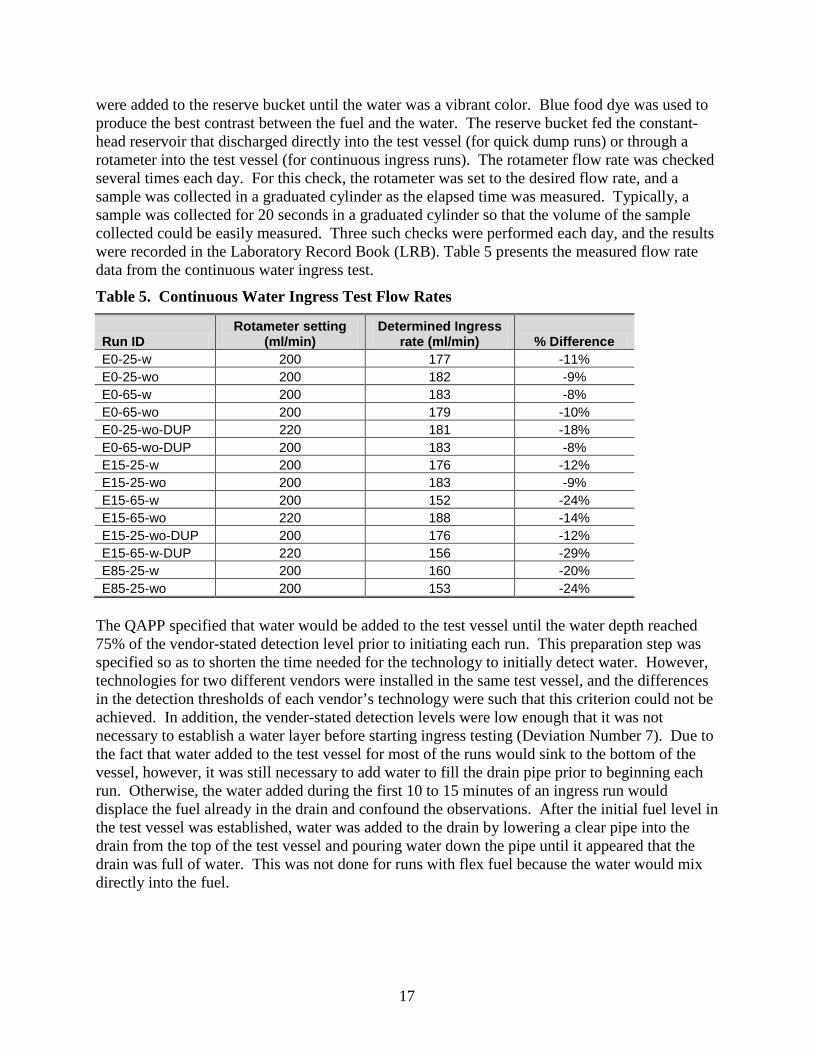
were added to the reserve bucket until the water was a vibrant color. Blue food dye was used to produce the best contrast between the fuel and the water. The reserve bucket fed the constant-head reservoir that discharged directly into the test vessel (for quick dump runs) or through a rotameter into the test vessel (for continuous ingress runs). The rotameter flow rate was checked several times each day. For this check, the rotameter was set to the desired flow rate, and a sample was collected in a graduated cylinder as the elapsed time was measured. Typically, a sample was collected for 20 seconds in a graduated cylinder so that the volume of the sample collected could be easily measured. Three such checks were performed each day, and the results were recorded in the Laboratory Record Book (LRB). Table 5 presents the measured flow rate data from the continuous water ingress test.
Table 5. Continuous Water Ingress Test Flow Rates
Run ID Rotameter setting
(ml/min) Determined Ingress
rate (ml/min) % Difference E0-25-w 200 177 -11% E0-25-wo 200 182 -9% E0-65-w 200 183 -8% E0-65-wo 200 179 -10% E0-25-wo-DUP 220 181 -18% E0-65-wo-DUP 200 183 -8% E15-25-w 200 176 -12% E15-25-wo 200 183 -9% E15-65-w 200 152 -24% E15-65-wo 220 188 -14% E15-25-wo-DUP 200 176 -12% E15-65-w-DUP 220 156 -29% E85-25-w 200 160 -20% E85-25-wo 200 153 -24%
The QAPP specified that water would be added to the test vessel until the water depth reached 75% of the vendor-stated detection level prior to initiating each run. This preparation step was specified so as to shorten the time needed for the technology to initially detect water. However, technologies for two different vendors were installed in the same test vessel, and the differences in the detection thresholds of each vendor’s technology were such that this criterion could not be achieved. In addition, the vender-stated detection levels were low enough that it was not necessary to establish a water layer before starting ingress testing (Deviation Number 7). Due to the fact that water added to the test vessel for most of the runs would sink to the bottom of the vessel, however, it was still necessary to add water to fill the drain pipe prior to beginning each run. Otherwise, the water added during the first 10 to 15 minutes of an ingress run would displace the fuel already in the drain and confound the observations. After the initial fuel level in the test vessel was established, water was added to the drain by lowering a clear pipe into the drain from the top of the test vessel and pouring water down the pipe until it appeared that the drain was full of water. This was not done for runs with flex fuel because the water would mix directly into the fuel.

18
3.4.3 Pre-Run Readings and Samples
Samples were collected throughout testing to determine the water content and the density of the material in the test vessel. A 50 mL or smaller sample was withdrawn from specific spots in the test vessel through the sampling ports provided on top of the vessel. Sample information and density results were recorded on the Sample Conditions and Chain-of-Custody log. Roughly 2 to 4 mL of each sample were separated into a vial and delivered to Battelle’s laboratory where the water content was determined using a Karl-Fischer titration method. The remainder of the sample was passed through a flow-through density meter that displayed the density and temperature of the sample. An 8-ft long “thief” sampler was used to collect samples from the test vessel. Between each sample, the sampler and the containers were decontaminated using methanol as a rinse agent. The sampler was allowed to air dry before collecting the next sample. Various readings were taken and data were recorded before and during every run. These readings included start times, end times, temperatures, heights, etc. These readings were recorded on Water Ingress and the Fuel Dump data sheets. In addition, at certain intervals, data sheets were printed from the technology console. Two QAPP deviations occurred related to these readings. The QAPP stated that the water height would be measured to the nearest 1/32nd of an inch using a standard ruler. However, the scale installed in the bottom of the test vessel was graduated in millimeters; thus, the water height was measured to the nearest millimeter (1/25.4 inch) or 0.5 millimeter (1/50.8 inch) instead (Deviation Number 9). Another deviation (Deviation Number 10) from the QAPP was that instead of continuously monitoring the density of fuel, grab samples were obtained from the tank and tested at certain intervals. The original plan to continuously withdraw a sample using a peristaltic pump would have generated static electricity, thus producing an explosion hazard. This deviation, therefore, was needed to eliminate safety concerns of having pumping and electrical equipment near the test vessel.
3.4.4 Water Ingress
Three types of water ingress methods were tested: continuous water ingress with splash, continuous water ingress without splash, and a quick dump. The two different continuous methods were introduced into the test vessel using a rotameter. One outlet led to a fill tube that allowed the water to run down the fuel filler riser pipe without creating a splash, while the other outlet led into the test vessel and allowed the water to fall several feet to create a splash. A three-way valve was used to connect the rotameter discharge to the proper outlet. The valve on the rotameter was adjusted until the desired flow rate was achieved. The rotameter was not used for the quick dump runs. The water reservoir bucket was marked at the 2-gallon level. After the water reservoir bucket was filled to this mark with water, a ball valve was quickly turned to allow the full contents of the reservoir to enter the test vessel at once.

19
3.4.5 Run Observations
Observations were taken throughout each run to record the characteristics and reactions in the test vessel. A notation was made on the run data sheets any time that an interaction, reaction, or mixing characteristic was witnessed in the test vessel.
3.4.6 Data Logging
A serial port was used to connect the Veeder-Root console with a laptop computer for the purpose of logging the data from the probes. Veeder-Root supplied a Serial Poller program to assist in receiving data and writing it to a log file. This log file was decoded using a program from Veeder-Root (at55parser.exe) that provided the data in tabular format. This program was also used to create comma separated files (.csv) that can be read by Microsoft® Excel.
3.4.7 Run Termination
The continuous water ingress runs were terminated after the 100-minute incremental ingress portion was completed, or when there were no changes indicated by the probes, or after 3 hours if no reaction. Three hours was chosen because at the flow rates used in the testing close to 6 gallons would have been introduced to the tank in that time period, assuming complete separation this would have created a dense phase of more than 2 inches. The quick dump runs were terminated no sooner than 30 minutes after fuel addition to the tank had stopped. Fuel addition occurred at between 50 and 70 gallons per minute. When no changes in reading from the probes were observed, the run was terminated.
3.4.8 Post-Run Sampling Analysis
The same types of readings were taken and samples were collected after the runs as for the pre-run readings and samples discussed in Section 3.4.3. A sample of the dense phase in the test vessel was also collected through the drain. Similarly, it was analyzed for density and water content.
3.4.9 Post-Run Activities
At completion of each run, fuel was transferred into the waste totes. The process for transferring fuel from the test vessel to the totes was similar to that used to transfer fuel, except for the suction and discharge locations.
3.5 Monitoring
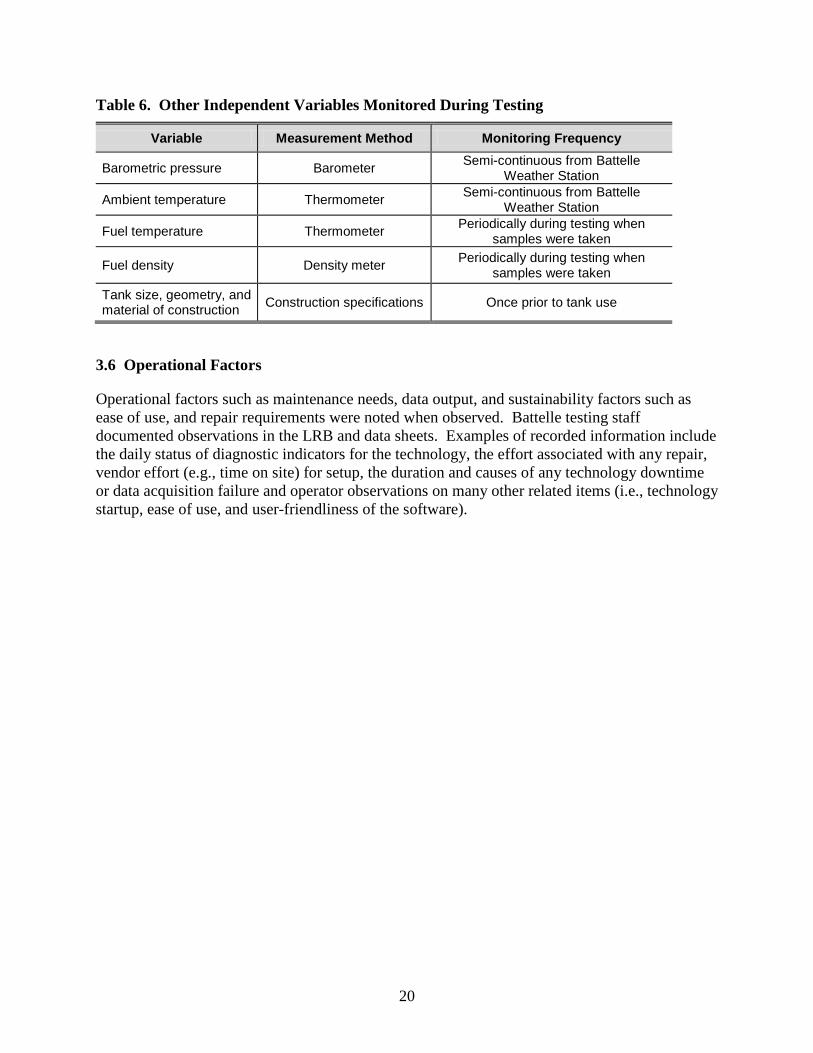
Other variables may influence the operability of ATGs during the evaluation; therefore, information on these other variables was collected during the testing but not controlled. Table 6 presents a list of these other variables, their measurement methods, and monitoring frequencies. Appendix C presents the barometric pressure and ambient temperature conditions during the test period.
20
Table 6. Other Independent Variables Monitored During Testing
Variable Measurement Method Monitoring Frequency
Barometric pressure Barometer Semi-continuous from Battelle Weather Station
Ambient temperature Thermometer Semi-continuous from Battelle Weather Station
Fuel temperature Thermometer Periodically during testing when samples were taken
Fuel density Density meter Periodically during testing when samples were taken
Tank size, geometry, and material of construction Construction specifications Once prior to tank use
3.6 Operational Factors
Operational factors such as maintenance needs, data output, and sustainability factors such as ease of use, and repair requirements were noted when observed. Battelle testing staff documented observations in the LRB and data sheets. Examples of recorded information include the daily status of diagnostic indicators for the technology, the effort associated with any repair, vendor effort (e.g., time on site) for setup, the duration and causes of any technology downtime or data acquisition failure and operator observations on many other related items (i.e., technology startup, ease of use, and user-friendliness of the software).

21
Chapter 4 Quality Assurance/Quality Control
Quality assurance/quality control (QA/QC) procedures were performed in accordance with the QMP for the AMS Center and the QAPP for this verification test. QA/QC procedures and results are described in the following subchapters.
4.1 Data Collection Quality Control
Table 7 presents a list of parameters that were proposed to be measured during the ETV tests and the QA criteria established for them in the QAPP. Some deviations to these specified procedures were observed during testing and noted during audits of the test. Further discussion of this aspect of the ETV test is provided below.
Table 7. Data Collection Quality Control Assessments for the ATG Verification Tests
Measured Parameters
Method of Assessment Frequency Acceptance
Criteria Corrective Action
Induced water ingress rate
Verify metered rates in
triplicate using stopwatch and
graduated cylinder
Performed at least once each day, prior to testing
As determined by assessment
method
Verified flow rate used to calculate an average
error, which was applied to the rotameter
setting used during a run
Ethanol content of fuel
ASTM D4815 or D5501 or equivalent
method
Once for each batch delivered or
prepared
± 10% of target ethanol content
Review data to troubleshoot results and
adjust as necessary
Water content of fuel and
dense phase
ASTM E203 or E1064: Karl-
Fischer Titration or equivalent
method
Once before and after each water
ingress run
As determined by assessment
method
Review data to troubleshoot results and
adjust as necessary
Fuel height
1/8-inch graduated scale on the exterior of the vessel
Once prior to and during each run,
as required
± 10% of either 25% or 65% height, run dependent
Adjust fuel level in vessel as necessary
Dense phase height
Standard ruler with 1-mm and
0.1-inch graduations
At the intervals specific to the run being performed
As determined by assessment
method
Review data and adjust as necessary

22
The initial approach for the water ingress method was to use a peristaltic pump as the means of controlling the water ingress. Due to safety concerns, a different system for water delivery into the test vessel was fabricated to accommodate controlled ingress of water (Deviation Number 13). Continuous water ingress was supplied using a gravity feed apparatus that maintained a constant pressure by providing a secondary reservoir and a float valve that controlled the water level in a primary reservoir. The primary (constant pressure) reservoir fed into a rotameter which was verified prior to testing at least once each day of testing. This water feed system was used to supply a constant-rate water supply in lieu of a peristaltic pump due to safety concerns associated with the static electricity build up and having an electricity source near the fuel-containing test vessel. To evaluate the flow rate prior to each day’s testing, water was collected in triplicate for a 20-second duration, measured with a stop watch, into a graduated cylinder at a given flow rate as read from the rotameter. The resulting flow rate (Flow) for each replicate was compared to the rotameter reading (Rota) to calculate a percent error (Err):
𝑬rr = 𝑭low−𝑹ota
𝑹ota Equation 5
These individual replicate errors were averaged and the average applied to the rotameter setting recorded for testing performed on a particular date. The resulting flow rate was used to calculate volumes of water added to the vessel for a given experiment. Experimental starting fuel heights were established at 25% or 65% of the test vessel height. These corresponded to 17 13/16 inches and 46 5/16 inches, respectively, as read from rulers (with 1/8-inch graduations) applied to the glass sides of the test vessel. The rulers were attached to the vessel prior to the beginning of testing and remained until all runs were completed. Readings between the 1/8-inch graduations were estimated to the nearest 1/16 inch. The total interior height of the vessel was 71 ¼ inches due to the ¾-inch of resin added to the bottom of the vessel to allow the probes to sit on a flat surface. As presented in Table 8, starting fuel heights were within 10% of the 25% or 65% height for all runs except the E15-25-wo-DUP run, which was 10.5% below the 25% fill height.

23
Table 8. Differences from Target Fuel Heights for Continuous and Dump Test Runs
Run ID % Difference from Target
Fuel Height E0-25-w 2.1% E0-25-wo 2.8% E0-65-w -3.2% E0-65-wo -3.9% E0-25-wo-DUP -6.3% E0-65-wo-DUP -3.4% E15-25-w -5.6% E15-25-wo 0% E15-65-w -2.7% E15-65-wo -1.8% E15-25-wo-DUP -11% E15-65-w-DUP -2.6% E85-25-wo -3.2% E85-25-w -6.0% E0 Dump -0.7% E15 Dump -3.2% E85 Dump -9.8%
For each test, once fuel was added to the test vessel, and prior to beginning water ingress, one sample from the center of the test vessel next to the fill riser pipe (for E0 tests) or one sample from between the ATG probes (for E15 and flex fuel tests) was taken to determine initial density and water content. An aliquot (approximately 2 to 4 mL) of each sample was placed in a 4-mL dram vial for water content analysis and an aliquot was analyzed on site for density as soon as practical after sampling. Dense phase height was measured using standard stainless steel rulers incorporated into the resin placed inside the test vessel to level the bottom of the vessel. The rulers, with 1 mm and 0.1 inch graduations, were placed inside the test vessel during construction (one at each end of the test vessel) with the zero graduation of the ruler flush with the resin bottom of the test vessel. During test vessel placement at the test site, the vessel containing several inches of water was leveled as closely as possible to within 2 mm as noted on the rulers. The north end of the test vessel was approximately 2 mm higher than the south end, which resulted in dense phase readings on the north end approximately 2 mm less than those from the south end of the vessel.
4.2 Audits
Three types of audits were performed during the verification test: a performance evaluation audit (PEA) of the analytical methods, a technical systems audit (TSA) of the verification test procedures, and a data quality audit (DQA). Audit procedures are described further below.

24
4.2.1 Performance Evaluation Audit
A PEA was conducted to assess the quality of the analytical measurements made in this verification test. National Institute of Standards and Technology (NIST) traceable standards were used to evaluate all of the analytical methods. These Standard Reference Materials (SRMs) were analyzed directly (i.e., without preparation); the SRMs fell in the middle of the calibration ranges of the analytical methods.
The two methods identified in the QAPP for ethanol analysis were D48153 for the lower percentages and D55014 for the high percentages. The acceptable criterion for the audit was for the result to be within 10% of the certified value. Table 9 presents the results of the PEA and concluded that these methods produced acceptable results.
Table 9. PEA Results for ASTM Methods D4815 and D5501 for Ethanol Content Determination
Method Analysis Date
Sample Description
Certified Ethanol
Concentration, percent
Analytical Ethanol
Concentration, percent
Recovery
D4815 8/12/11 SRM 2287 E10 10.1 9.58 95%
D5501 8/12/11 SRM 2900 Ethanol-Water 95.6 96.6 101%
The method used for the determination of water content is a Battelle Standard Operating Procedure (SOP)6 which follows ASTM Methods E203 and E1064. The same Ethanol-Water SRM 2900 used to perform the ethanol PEA was used to evaluate the water method. In addition to the SRM, two certified calibration check standards were analyzed. The criterion for this method was within 5% of the certified concentration. As shown in Table 10, the SRM result was not within these bounds; however, the other two check standards were within the criteria. The Battelle Verification Test Coordinator (VTC) and the laboratory representative discussed the results and determined the method acceptable (Deviation Number 11). The certified level for SRM 2900 is ± 1.9%. The PEA results of the SRM are acceptable if this variation is taken into consideration.

25
Table 10. PEA Results for Karl-Fischer Titration Method for Water Content Determination
Analysis Date Sample ID Sample
Description Certified
Water Content, %
Analytical Water Content,
% % Error
8/23/11 53358-25-6 SRM 2900 Ethanol-Water-Replicate 1
4.4 5.26 20%
4.4 5.31
4.4 5.25 Average 5.27
8/23/11 Water Standard 1 Water Standard 1
0.10 0.093 3.1%
0.10 0.115
Average 0.104
8/23/11 Water Standard 10 Water Standard 10
1.0 0.988 1.1%
1.0 0.997
Average 0.993
4.2.2 Technical Systems Audit
The Battelle AMS Center QA Officer for this verification test performed a TSA during the laboratory bench-test portion of this verification test to ensure that the verification test was performed in accordance with the QMP for the AMS Center and the QAPP. On September 14 and 15, 2011, this same person conducted a TSA to verify that field testing was being conducted according to the QAPP requirements. The September 14th TSA was conducted at the field test site to observe the run with E0 fuel at 25% full, and with a splash. Ms. Jennifer Redmon (RTI International) conducted a simultaneous TSA on behalf of EPA under contract to Neptune and Co. during the Battelle audit. The TSA included a review of documents available at the test site for reference and records being maintained by the testing staff; observations of the test vessel water delivery and measurement system; the initiation of several splash runs; and the real-time data recording practices during each run. A debriefing was conducted with the Battelle VTC, Battelle Verification Testing Leader, Battelle AMS Center Manager, EPA AMS Center Project Officer and QA Manager, and Ms. Redmon. On September 15, 2011, a TSA was conducted to review the water content analytical procedures at one of Battelle’s analytical laboratories. The results of the TSAs indicated that testing was conducted according to the QAPP with minor exceptions. Three observations were noted during the audit: 1) the laboratory analysis of the flex fuel was greater than 10% different than the nominal concentration because the laboratory calibration range did not include a standard at or below 85%; 2) the test vessel was not pre-filled with water up to 75% of the vendor-stated threshold level prior to test initiation; and 3) a peristaltic pump was not used to deliver water to the test vessel due to concerns about the use of electrical equipment around the test vessel. Battelle’s assessment was that the noted deviations did not negatively impact the quality of data being generated for the test, but it was agreed during the

26
debriefing that the VTC would attempt to identify another analytical laboratory to perform confirmation analysis. One finding for both the field test site and laboratory bench testing was related to data or sample identification and the need for clear and direct links to the technology data on site and the titrameter data in the laboratory. TSA observations included an observation on the need for more coordinated recording practices and an observation that supporting measurements were not being collected at the frequency defined in QAPP Table 9.
4.2.3 Data Quality Audit
Records generated in the verification test received a one-to-one review before these records were used to calculate, evaluate, or report verification results. Data were reviewed by a Battelle technical staff member involved in the verification test. The person performing the review added his/her initials and the date to a hard copy of the record being reviewed. One hundred percent of the verification test data were reviewed for quality by the VTC, and at least 25% of the data acquired during the verification test and 100% of the calibration and QC data were audited by Battelle’s QA Reviewer. The data were traced from the initial acquisition, through reduction and statistical analysis, to final reporting to ensure the integrity of the reported results. All calculations performed on the data undergoing the audit were checked. The DQA included a review of the raw data in comparison to the data calculation spreadsheets, through final reporting in the report tables. All imbedded calculations in the spreadsheets were verified for accuracy to the QAPP, and all QC results were reviewed. The report was reviewed against the QAPP, and all deviations to testing were reported. The text was reviewed against the data tables to ensure the discussion was consistent with the data. Minor transcription and calculation errors were noted and brought to the attention of the VTC for correction. A data audit report was prepared, and a copy was distributed to the EPA.
4.3 Quality Assurance/Quality Control Deviations
Appendix A presents a list of all deviations found during the QA/QC checks performed. Specific deviations are discussed throughout this verification report where appropriate. The remaining deviations are discussed below. Deviation Number 2, the first QA deviation, stated that the calibration procedures for ethanol blends and analysis of the PEA samples did not follow the methods defined in the QAPP. This deviation occurred because certified standards needed for the calibration were not available. However, the analytical laboratory routinely analyzes fuels according to the ASTM test method that was used. Deviation Number 12 discusses the changes made to the test run matrix to maximize data collection and minimize fuel waste. The two E85 runs at 65% full were not conducted because the parallel runs at 25% full were inconclusive. In addition, since the technologies did not respond to the E85 test runs, the incremental sensitivity tests were not conducted. Finally, the duplicate run of the E85 fuel was changed to a duplicate of E0 fuel.

27
Deviation Number 14 stated that many of the QC requirements listed in the QAPP were different than those actually implemented by the analysis laboratories. This deviation occurred due to using several different laboratories and defining several different test methods during the verification test design phase. These variations in implemented QA procedures are expected to have little or no impact on the verification test results, as the labs followed the ASTM requirements that are widely accepted. Deviation Number 15 was a consequence of the corrective action for Deviation Number 3. No PEA occurred when the second flex fuel sample was sent for ethanol determination at the second laboratory. The second analysis of the E85 fuel was performed in-kind from the only laboratory identified to use a modified D5501 method that fit the technology evaluation parameters. The PEA sample was actually sent to the selected laboratory, but the laboratory never analyzed the sample.

28
Chapter 5 Statistical Methods
The statistical methods used to evaluate the quantitative performance factors listed in Section 3.3 are presented in this chapter. Qualitative observations were also used to evaluate verification test data. The following subchapters describe each performance parameter evaluated.
5.1 Accuracy
Accuracy is the measure of the degree of agreement between the technology reading and the independently-measured reading. Accuracy, as evaluated in this verification test, is the degree to which the initial technology dense phase (i.e., water or phase separation) height measurement in the test vessel agrees with the height measurement taken using the ruler installed in the vessel. Bias was calculated to derive an estimate of accuracy by comparing the technology measurements with the observed ruler measurements at the time of the initial response for each run as shown in Equation 6.
𝐁𝐢𝐚𝐬 = � 𝐃𝐏𝐇𝐓−𝐢𝐧𝐢𝐭𝒊 𝐎−𝐢𝐧𝐢𝐭𝒊 Equation 6 −𝐃𝐏𝐇𝐧
𝐧
𝒊=𝟏
where: n = the number of runs, DPHT-init = the technology-measured water or separated dense phase height at the time of initial technology response, and DPHO-init = the independently-observed water or separated dense phase height at the time of initial technology response.
5.2 Sensitivity
Sensitivity is a measure of the extent to which the methods and instrumentation associated with a given technology are able to detect the event of interest when in fact the event has occurred. A technology is determined to have higher sensitivity as the event becomes more difficult to detect with a certain degree of confidence. Sensitivity differs according to the nature of the test and type of event. Two measures of sensitivity were evaluated in the continuous water ingress verification tests: 1) the minimum detectable height of water or separated dense phase in the test vessel, and 2) the smallest detectable change in the height of water or separated dense phase.

29
5.2.1 Tolerance Limit
For this verification test, the first part of sensitivity was quantified by the minimum value for water or separated dense phase height at which the probability is at least 0.95 (95%) that the technology detected the presence of either water or a separated dense phase in the bottom of the vessel. This estimate of sensitivity was based on the average of the technology measurements acquired at the time of initial response from each run, to which a one-sided tolerance interval was applied to derive the 95% probability. Tolerance limit (TL) was calculated to derive an estimate of the sensitivity of each technology to detect water or separated dense phase using Equations 7, 8, and 9 in the following steps:
1. The mean of the measured water or separated dense phase heights when the technology first responded to continuous water ingress was calculated using Equation 7.
= � 𝐃𝐏𝐇𝐓−𝐢𝐧𝐢𝐭𝒊 Equation 7 𝐧𝒊=𝟏
𝐧
where: n = the number of runs (12), and
DPHT-init = the technology-measured water or separated dense phase height at the time of initial technology response.
2. The standard deviation (SD) of the measured heights was calculated using
Equation 8.
𝐒𝐃 = �∑ �𝐃𝐏𝐇𝐓−𝐢𝐧𝐢𝐭𝒊− �
𝟐𝐧𝒊=𝟏
𝐧−𝟏� Equation 8
𝟏/𝟐
where: n = the number of runs (12),
DPHT-init = the technology-measured water or separated dense phase height at the time of initial technology response, and
= the mean of the initial technology responses.
3. The tolerance coefficient (k) for a one-sided normal tolerance interval with a 95% probability level and a 95% coverage for the number of runs (n=12) was obtained from a tolerance factors table.7
4. Finally, the TL was calculated using Equation 9.
𝐓𝐋 = + 𝒌 𝐒𝐃 Equation 9
where the terms are defined as above.

30
5.2.2 Minimum Detectable Level Change
Sensitivity also is quantified by the smallest detectable change in the water or dense separated phase level height once water or a dense phase is detected with at least a 95% probability of detecting the change. This aspect of sensitivity was based on comparing the paired measurement values (technology readings versus manual observations) for each of the 10 incremental differences established after the challenged technologies responded to the presence of the dense phase in the continuous water ingress runs. The minimum detectable level change (MLC) in water height was calculated to estimate the sensitivity for each technology to detect a change in water height using Equations 10 through 15 in the following steps:
1. For each technology, the incremental differences were calculated between the
technology-measured water or separated dense phase heights (difT r inc) for each of the 10 consecutive time increments (inc1 through inc10) for all E0 and E15 continuous water ingress runs (r).
2. The incremental differences were calculated between the independently-observed water or separated dense phase heights (difO r inc) for each of the 10 consecutive time increments (inc1 through inc10) for all E0 and E15 continuous water ingress runs (r).
3. For each technology and each run, the paired differences (Deltar inc) were calculated
for each pair of technology-measured and independently-observed incremental changes (hT r inc- hO r inc) as in Equation 10:
𝐃𝐞𝐥𝐭𝐚𝐫 𝐢𝐧𝐜 = 𝐝𝐢𝐟𝐓 𝐫 𝐢𝐧𝐜 − 𝐝𝐢𝐟𝐎 𝐫 𝐢𝐧𝐜 Equation 10
where: r = a specific E0 or E15 run, inc = a specific 10-minute time increment within run r, difT = the incremental difference in the technology-measured dense phase height, and difO = the incremental difference in the independently-measured dense phase height.
4. For each technology and each run, the average of all paired differences over the run (Deltar) was calculated as in Equation 11.
𝐃𝐞𝐥𝐭𝐚𝐫 = ∑ 𝐃𝐞𝐥𝐭𝐚𝐫 𝒊𝒏𝒄𝐧
𝐧𝒊𝒏𝒄=𝟏 Equation 11
where: inc = a specific 10-minute time increment within run r, and Deltar = the paired incremental difference.
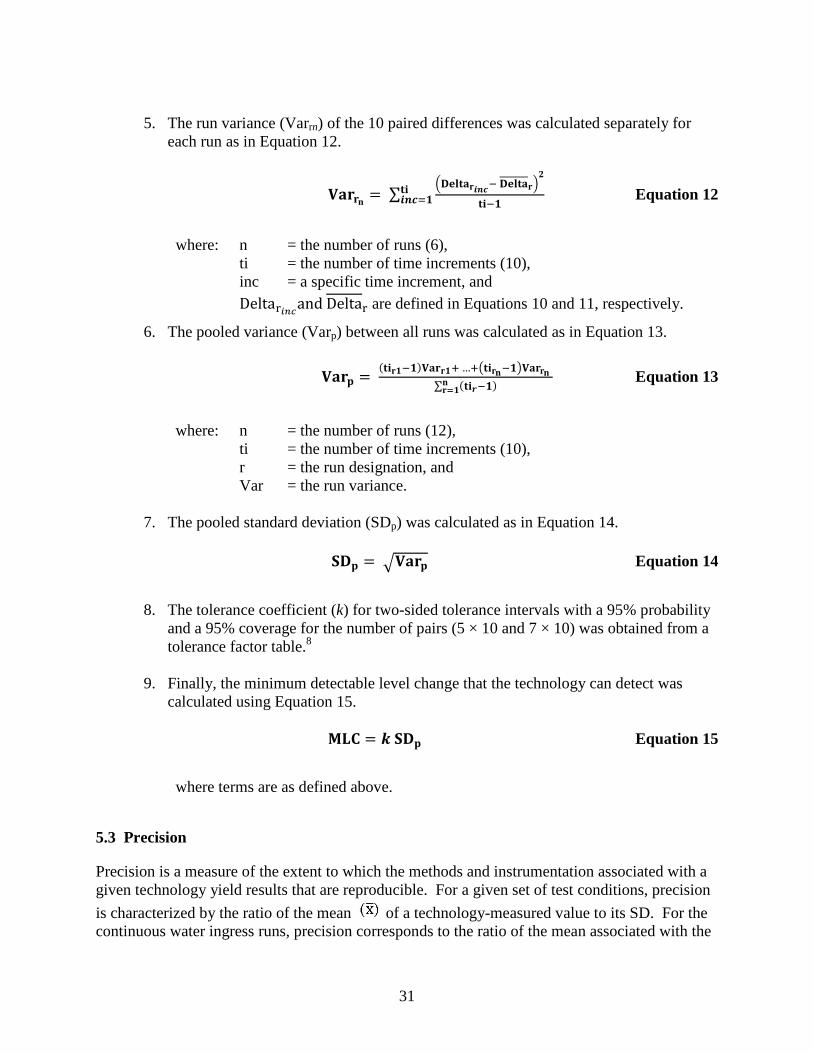
31
5. The run variance (Varrn) of the 10 paired differences was calculated separately for
each run as in Equation 12.
𝐕𝐚𝐫𝐫𝐧�𝐃𝐞𝐥𝐭𝐚𝐫𝒊𝒏𝒄− 𝐃𝐞𝐥𝐭𝐚𝐫�
𝟐
𝐭𝐢 Equation 12 = ∑𝐭𝐢−𝟏𝒊𝒏𝒄=𝟏
where: n = the number of runs (6), ti = the number of time increments (10), inc = a specific time increment, and Deltar𝑖𝑛𝑐and Deltar are defined in Equations 10 and 11, respectively.
6. The pooled variance (Varp) between all runs was calculated as in Equation 13.
𝐕𝐚𝐫𝐩𝐫𝟏 𝐫𝟏 𝐫𝐧 𝐫𝐧 Equation 13 𝐧
𝐭𝐢 −𝟏 𝐕𝐚𝐫 + …+�𝐭𝐢 −𝟏�𝐕𝐚𝐫 ∑ (𝐭𝐢𝒓−𝟏)𝐫=𝟏
= ( )
where: n = the number of runs (12), ti = the number of time increments (10), r = the run designation, and Var = the run variance.
7. The pooled standard deviation (SDp) was calculated as in Equation 14.
𝐒𝐃𝐩 𝐩 Equation 14
= �𝐕𝐚𝐫
8. The tolerance coefficient (k) for two-sided tolerance intervals with a 95% probability and a 95% coverage for the number of pairs (5 × 10 and 7 × 10) was obtained from a tolerance factor table.8
9. Finally, the minimum detectable level change that the technology can detect was calculated using Equation 15.
𝐌𝐋𝐂 = 𝒌 𝐒𝐃𝐩 Equation 15
where terms are as defined above.
5.3 Precision
Precision is a measure of the extent to which the methods and instrumentation associated with a given technology yield results that are reproducible. For a given set of test conditions, precision is characterized by the ratio of the mean of a technology-measured value to its SD. For the continuous water ingress runs, precision corresponds to the ratio of the mean associated with the
32
technology-measured water or separated dense phase height at the time of initial technology response (from Equation 7) to the SD of the technology-measured water or separated dense phase height at that same point in the time (from Equation 8). Precision could only be based on the initial response heights because these are the only technology readings that can be considered reproducible. Heights measured during the increment phase of the runs varied because the height for the first time increment was interdependent and recorded only after all technologies in the test vessel had responded to the water ingress.
5.4 Phase Separation
Phase separation during water ingress tests was defined as formation of a separate dense phase, other than water, that appeared in the lower portion of the liquid in the test vessel and was recognizable when a change in appearance of the vessel contents occurred. This change resulted in differentiation of a separate liquid layer that formed below the fuel during water ingress. This occurrence was observed visually and recorded using a DVR during testing. Test conditions leading to phase separation were documented to define the testing environment in which phase separation occurred (i.e., the phase separation layer height, fuel temperature and density, etc.). The water introduced to the test vessel during the ingress periods was dyed blue with food dye to aid in the visualization of the phase separation.
5.5 Operational Factors
Operational factors such as maintenance needs, calibration frequency, data output, ease of use, and repair requirements were evaluated and summarized based on technical staff observations for all runs.
33
Chapter 6 Test Results
This chapter provides results of the quantitative and qualitative evaluations of this verification test for the Veeder-Root Standard Water Float and the Veeder-Root Phase-Two™ Water Detector. Appendix D presents the run data that were collected and used to provide these results.
6.1 Accuracy
The accuracies of the Veeder-Root floats are shown by the differences that occurred between the observed dense phase height and the dense phase height reported by the technology. Bias represents the average accuracy over all of the runs. A difference of 0.0 inches indicates that the heights were the same for the two methods (most accurate). A bias of 0.0 inches indicates that the technology measurement is either very accurate or produces the same number of overestimates as underestimates. Tables 11 and 12 present both the differences and technology bias that were calculated based on the initial detections of water for the Standard Water Float and Phase Two Water Detector, respectively. Table 13 presents the bias results for the beginning of incremental test runs (Time 0). Time 100 measurements of the observed and technology measured dense phase heights and bias results are presented in Table 14. Results for the two E85-25 runs were not included in the bias estimate because no separated dense phase was produced when testing with flex fuel. Consequently, the E85-65 runs were not performed, and therefore no results from these runs could be included in the bias estimate. The technology results were compared to a human visual measurement and cannot be considered more accurate than the mm marks on the ruler (1/25.4 inch). In addition, the separation of the dense phase is more distinctly visible in the E0 runs than the E15 runs as observed by the verification staff. This inherently added more variability among the E15 observed results. Given this, the accuracy results were not compared by variable. The Standard Water Float was slightly positive for all E0 run results and slightly negative for all E15 run results. The Phase TwoTM Water Detector returned slightly negative bias results for all test runs. Both technologies were more accurate at the beginning and middle of the test runs than at the end.

34
Table 11. Accuracy Results for the Veeder-Root Standard Water Float
Run ID Independently-
Observed Dense Phase Height
(inches)
Technology-Measured Dense
Phase Height (inches)
Difference (inches)
E0-25-w 0.63 0.64 0.01 E0-25-wo 0.59 0.67 0.08 E0-65-w 0.63 0.64 0.01 E0-65-wo 0.63 0.63 0 E0-25-wo-DUP 0.59 0.65 0.06 E0-65-wo-DUP 0.63 0.65 0.02 E15-25-w 1.18 0.67 -0.51 E15-25-wo 0.79 0.63 -0.15 E15-65-w 1.22 0.66 -0.56 E15-65-wo 0.98 0.65 -0.33 E15-25-wo-DUP 0.75 0.65 -0.10 E15-65-w-DUP 1.18 0.65 -0.53 E85-25-w 0 0a 0a E85-25-wo 0 0a 0a E85-65-w Not Conductedb E85-65-wo Not Conductedb
Bias (inches) -0.17 a. Data points were not included in the bias calculation because a separated phase did not form. b. Flex-65 runs were not performed because a separated phase did not form in the Flex-25 runs.
Table 12. Accuracy Results for the Veeder-Root Phase-Two™ Water Detector
Run ID Independently-
Observed Dense Phase Height
(inches)
Technology-Measured Dense
Phase Height (inches)
Difference (inches)
E0-25-w 0.63 0.38 -0.25 E0-25-wo 0.59 0.40 -0.19 E0-65-w 0.63 0.39 -0.24 E0-65-wo 0.63 0.38 -0.25 E0-25-wo-DUP 0.51 0.40 -0.11 E0-65-wo-DUP 0.63 0.40 -0.23 E15-25-w 0.94 0.45 -0.49 E15-25-wo 0.67 0.50 -0.17 E15-65-w 0.87 0.44 -0.43 E15-65-wo 0.71 0.43 -0.28 E15-25-wo-DUP 0.55 0.39 -0.16 E15-65-w-DUP 0.83 0.41 -0.42 E85-25-w 0 0.55a 0.55a E85-25-wo 0 0.54a 0.54a E85-65-w Not Conductedb E85-65-wo Not Conductedb
Bias (inches) -0.27 a. Data points were not included in the bias calculation because a separated phase did not form. b. E85-65 runs were not performed because a separated phase did not form in the E85-25 runs.

35
Table 13. Accuracy Results for the Veeder-Root Technologies at the start of the incremental run (Time 0)
Standard Water Float Phase-TwoTM Water Detector
Run ID Observed Dense Phase Height (in)
Dense Phase Height (in) Difference (in)
Dense Phase Height (in)
Difference (in)
E0-25-w 0.83 0.86 0.03 0.60 -0.23 E0-25-wo 1.38 1.40 0.02 1.15 -0.23 E0-65-w 0.71 0.74 0.03 0.49 -0.22 E0-65-wo 0.79 0.84 0.05 0.58 -0.21 E0-25-wo-DUP 0.79 0.86 0.07 0.69 -0.10 E0-65-wo-DUP 0.75 0.76 0.01 0.52 -0.23 E15-25-w 1.38 0.84 -0.54 0.88 -0.50 E15-25-wo 0.79 0.74 -0.05 0.68 -0.11 E15-65-w 1.50 0.86 -0.64 0.95 -0.55 E15-65-wo 1.22 0.83 -0.39 0.88 -0.34 E15-25-wo-DUP 0.98 0.88 -0.10 0.89 -0.09 E15-65-w-DUP 1.42 0.83 -0.59 0.92 -0.50 E85-25-w 0 0 0a 0 0a E85-25-wo 0 0 0a 0 0a E85-65-w Not Conductedb E85-65-wo Not Conductedb
Bias -0.17 -0.27 a. Data points were not included in the bias calculation because a separated phase did not form. b. E85-65 runs were not performed because a separated phase did not form in the E85-25 runs.
Table 14. Accuracy Results for the Veeder-Root Technologies at Run End (Time 100)
Standard Water Float Phase-TwoTM Water Detector
Run ID Observed Dense Phase Height (in)
Dense Phase Height (in) Difference (in)
Dense Phase Height (in)
Difference (in)
E0-25-w 1.77 1.80 0.03 1.53 -0.24 E0-25-wo 2.20 2.23 0.03 1.95 -0.25 E0-65-w 1.69 1.69 0.00 1.42 -0.27 E0-65-wo 1.69 1.73 0.04 1.45 -0.24 E0-25-wo-DUP 1.73 1.77 0.04 1.59 -0.14 E0-65-wo-DUP 1.69 1.71 0.02 1.45 -0.24 E15-25-w 3.11 2.60 -0.51 2.65 -0.46 E15-25-wo 2.13 1.97 -0.16 1.90 -0.23 E15-65-w 3.62 2.73 -0.89 2.98 -0.64 E15-65-wo 3.03 2.57 -0.46 2.63 -0.40 E15-25-wo-DUP 2.20 2.09 -0.11 2.11 -0.09 E15-65-w-DUP 3.54 2.68 -0.86 2.92 -0.62 E85-25-w 0 0 0a 0 0a E85-25-wo 0 0 0a 0 0a E85-65-w Not Conductedb E85-65-wo Not Conductedb
Bias -0.24 -0.32 a. Data points were not included in the bias calculation because a separated phase did not form. b. E85-65 runs were not performed because a separated phase did not form in the E85-25 runs.
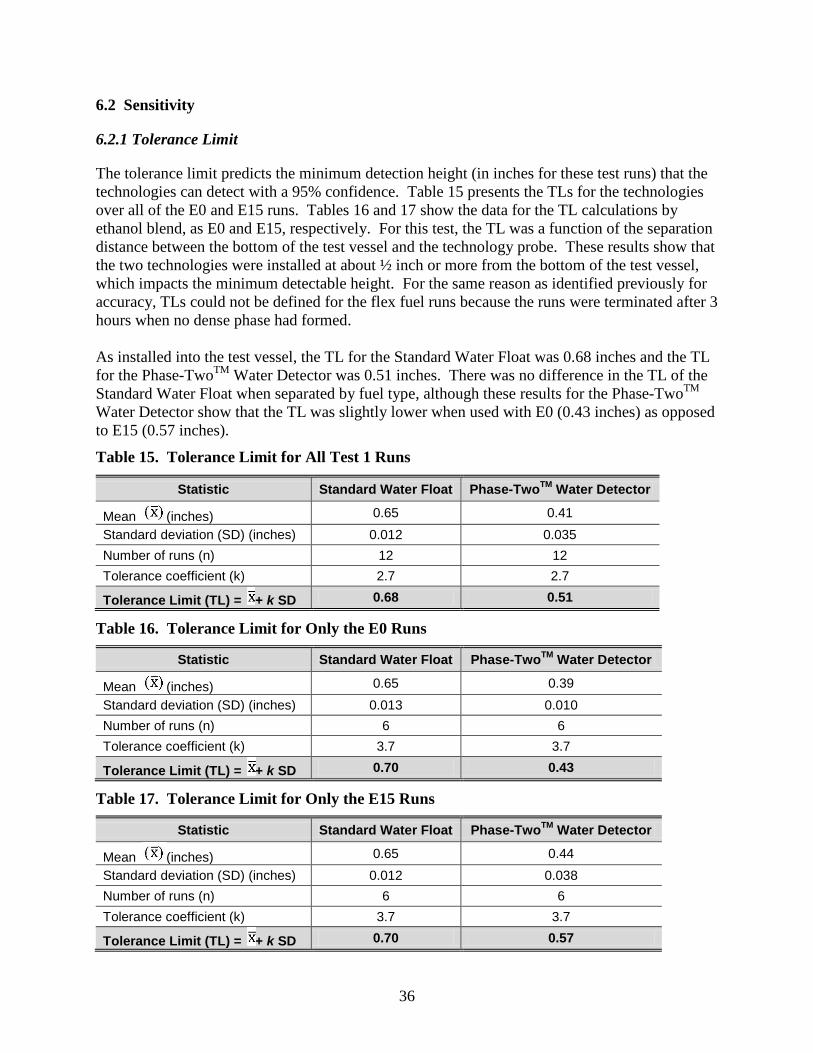
36
6.2 Sensitivity
6.2.1 Tolerance Limit
The tolerance limit predicts the minimum detection height (in inches for these test runs) that the technologies can detect with a 95% confidence. Table 15 presents the TLs for the technologies over all of the E0 and E15 runs. Tables 16 and 17 show the data for the TL calculations by ethanol blend, as E0 and E15, respectively. For this test, the TL was a function of the separation distance between the bottom of the test vessel and the technology probe. These results show that the two technologies were installed at about ½ inch or more from the bottom of the test vessel, which impacts the minimum detectable height. For the same reason as identified previously for accuracy, TLs could not be defined for the flex fuel runs because the runs were terminated after 3 hours when no dense phase had formed. As installed into the test vessel, the TL for the Standard Water Float was 0.68 inches and the TL for the Phase-TwoTM Water Detector was 0.51 inches. There was no difference in the TL of the Standard Water Float when separated by fuel type, although these results for the Phase-TwoTM Water Detector show that the TL was slightly lower when used with E0 (0.43 inches) as opposed to E15 (0.57 inches).
Table 15. Tolerance Limit for All Test 1 Runs
Statistic Standard Water Float Phase-TwoTM Water Detector
Mean (inches) 0.65 0.41 Standard deviation (SD) (inches) 0.012 0.035 Number of runs (n) 12 12 Tolerance coefficient (k) 2.7 2.7
Tolerance Limit (TL) = + k SD 0.68 0.51
Table 16. Tolerance Limit for Only the E0 Runs
Statistic Standard Water Float Phase-TwoTM Water Detector
Mean (inches) 0.65 0.39 Standard deviation (SD) (inches) 0.013 0.010 Number of runs (n) 6 6 Tolerance coefficient (k) 3.7 3.7
Tolerance Limit (TL) = + k SD 0.70 0.43
Table 17. Tolerance Limit for Only the E15 Runs
Statistic Standard Water Float Phase-TwoTM Water Detector
Mean (inches) 0.65 0.44 Standard deviation (SD) (inches) 0.012 0.038 Number of runs (n) 6 6 Tolerance coefficient (k) 3.7 3.7
Tolerance Limit (TL) = + k SD 0.70 0.57
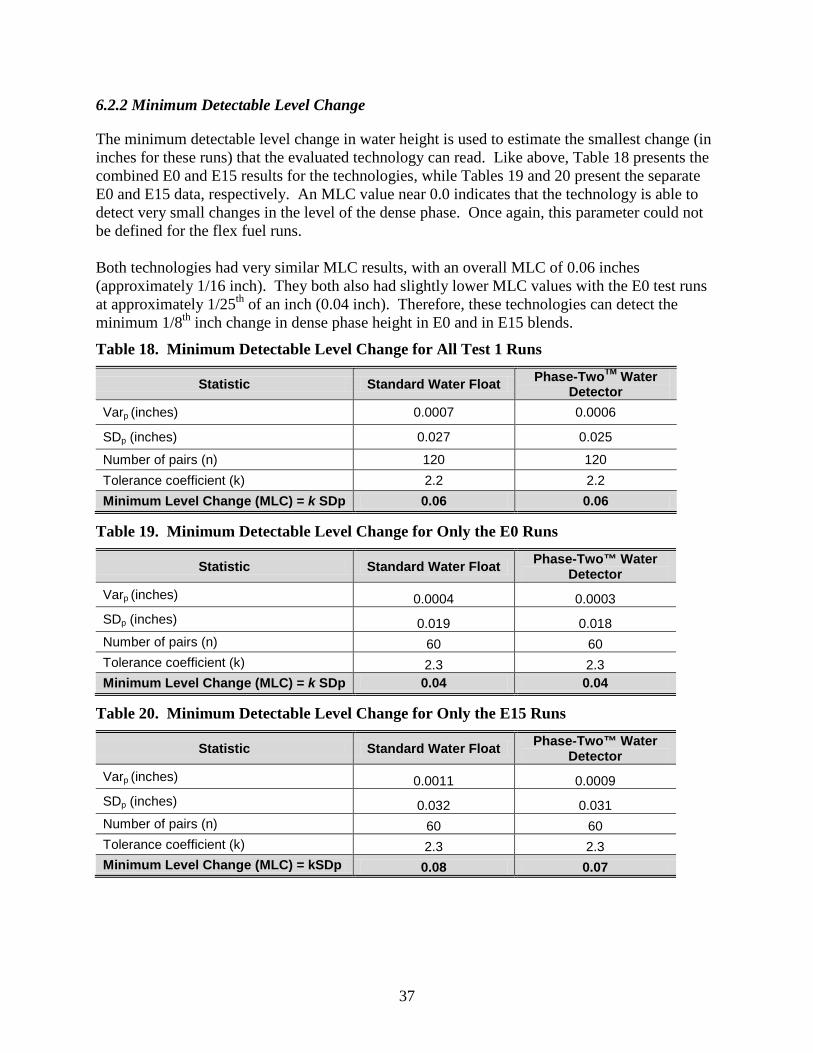
37
6.2.2 Minimum Detectable Level Change
The minimum detectable level change in water height is used to estimate the smallest change (in inches for these runs) that the evaluated technology can read. Like above, Table 18 presents the combined E0 and E15 results for the technologies, while Tables 19 and 20 present the separate E0 and E15 data, respectively. An MLC value near 0.0 indicates that the technology is able to detect very small changes in the level of the dense phase. Once again, this parameter could not be defined for the flex fuel runs. Both technologies had very similar MLC results, with an overall MLC of 0.06 inches (approximately 1/16 inch). They both also had slightly lower MLC values with the E0 test runs at approximately 1/25th of an inch (0.04 inch). Therefore, these technologies can detect the minimum 1/8th inch change in dense phase height in E0 and in E15 blends.
Table 18. Minimum Detectable Level Change for All Test 1 Runs
Statistic Standard Water Float Phase-TwoTM Water Detector
Varp (inches) 0.0007 0.0006
SDp (inches) 0.027 0.025
Number of pairs (n) 120 120 Tolerance coefficient (k) 2.2 2.2 Minimum Level Change (MLC) = k SDp 0.06 0.06
Table 19. Minimum Detectable Level Change for Only the E0 Runs
Statistic Standard Water Float Phase-Two™ Water Detector
Varp (inches) 0.0004 0.0003 SDp (inches) 0.019 0.018 Number of pairs (n) 60 60 Tolerance coefficient (k) 2.3 2.3 Minimum Level Change (MLC) = k SDp 0.04 0.04
Table 20. Minimum Detectable Level Change for Only the E15 Runs
Statistic Standard Water Float Phase-Two™ Water Detector
Varp (inches) 0.0011 0.0009 SDp (inches) 0.032 0.031 Number of pairs (n) 60 60 Tolerance coefficient (k) 2.3 2.3 Minimum Level Change (MLC) = kSDp 0.08 0.07

38
6.3 Precision
Tables 21 and 22 present a ratio of the mean to the SD that is used to help determine the precision of the collected data. These tables show the overall precision for each Veeder-Root technology and precision results for the individual variables. A high-precision value signifies a high degree of reproducibility, whereas a low precision value signifies the opposite. Overall these results indicate that the variables did not affect the precision of the technologies; however, there were slight differences. The Standard Water Float was more precise in E15 and the Phase-Two Water Detector was more precise in E0. Both technologies were more precise with 65% full over 25% full. The Standard Water Float was most precise when the test vessel was at the 65% fill height and the Phase-Two Water Detector was most precise during the E0 test runs.
Table 21. Precision Results for the Veeder-Root Standard Water Float
Test 1 Runs Overall E0 E15 25% Full 65% Full With Splash
Without Splash
Mean (inches) 0.65 0.65 0.65 0.65 0.65 0.65 0.65 Standard Deviation (SD) (inches) 0.012 0.013 0.012 0.015 0.009 0.013 0.012
Precision (/SD) 53 50 54 44 69 50 52
Table 22. Precision Results for the Veeder-Root Phase-TwoTM Water Detector
Test 1 Runs Overall E0 E15 25% Full 65% Full With Splash
Without Splash
Mean (inches) 0.41 0.39 0.44 0.42 0.41 0.41 0.41 Standard Deviation (SD) (inches) 0.035 0.010 0.038 0.045 0.023 0.030 0.038 Precision (/SD) 12 40 12 9 18 14 11
6.4 Phase Separation, Mixing, and Float Response
In the process of conducting Test 1 and Test 2 as described herein, the technologies were challenged to detect water that had been added to fuels with differing alcohol contents. The ability of the technology to detect water added to the test vessel was in part affected by the interaction of water and the fuel in the test vessel, and was markedly different for each type of fuel tested. This interaction was influenced by the amount of alcohol in the fuel as well as the mixing taking place between the water, alcohol, and gasoline. Test 1 introduced two types of mixing, and Test 2 introduced a third type. In general for all fuels, water splashing on the surface of the fuel resulted in tiny water droplets with increased surface area compared to ingress

39
without a splash for a respective fuel height. The ingress without splash resulted in larger water droplets in the fuel, with less surface area, which produced less mixing within the fuel layer. Observations on the degree of phase separation, mixing, and float responses were documented during each run using one or more DVRs. The phase separation and mixing effects are discussed below for each fuel along with general observations on technology response. In addition, Appendix D presents graphical displays of the data generated over the entire run time for each dump test run using the three fuels along with the other data from the runs.
6.4.1 Mixing and Float Response with E0 Fuel
When water was mixed with the E0 fuel, it immediately settled to the bottom of the test vessel. The tests with E0 showed no qualitative difference in mixing based on the water ingress method as all of the water added appeared to collect on the bottom of the test vessel in the dense layer. Table 23 shows the average water content of the dense phase was 98.4% and Table 24 shows that there was no water detected in the fuel above the detection limit of the method. These two tables also include a summary of the density measurements taken during verification testing. Water ingress with a splash produced a wide and turbulent mixing area just below the surface of the fuel that resulted in a large area (an approximately 12-inch circle) of splash-down near the bottom of the test vessel, whereas water ingress without a splash resulted in very little surface turbulence. No entrainment of water in the fuel was visible at any time, regardless of the type of water ingress employed. Both of the Veeder-Root technologies responded to the presence of water at the bottom of the test vessel during all E0 runs. Figure 5 is a graph of the E0-25% full-with splash duplicate run. It is clear in the initial ingress detection section of the graph that both of the technologies detected the water. Then the graph levels off horizontally in between the initial detection test and the contentious ingress test, because no water was bing added to the test vessel during that time. Finally, the upward similarly sloped lines in the incremental ingress test section of the graph show how the technologies tracked the ingress of water. The observed measurements and the technology recorded results have similar slopes during the incremental test. During the E0 dump test, mixing did not impact the ability of either technology to detect water that had entered the test vessel, and the floats returned to essentially the same height after the fuel dump as had been recorded prior to the fuel dump. These observations are depicted in Figure 6 and presented in more detail in Appendix D, Test Day 3, Run Number 2.
Table 23. Water Content and Density of Dense Phase at Completion of E0 and E15 Test 1 Runs
Test 1 Runs n Average % Water in Dense Phase
Standard Deviation of % Water
in Dense Phase Density,
g/ml Standard
Deviation of Density, g/mL
E0 6 98.4 1.46 0.994 0.002 E15 7* 68.4 13.2 0.946 0.020
*Includes a duplicate sample
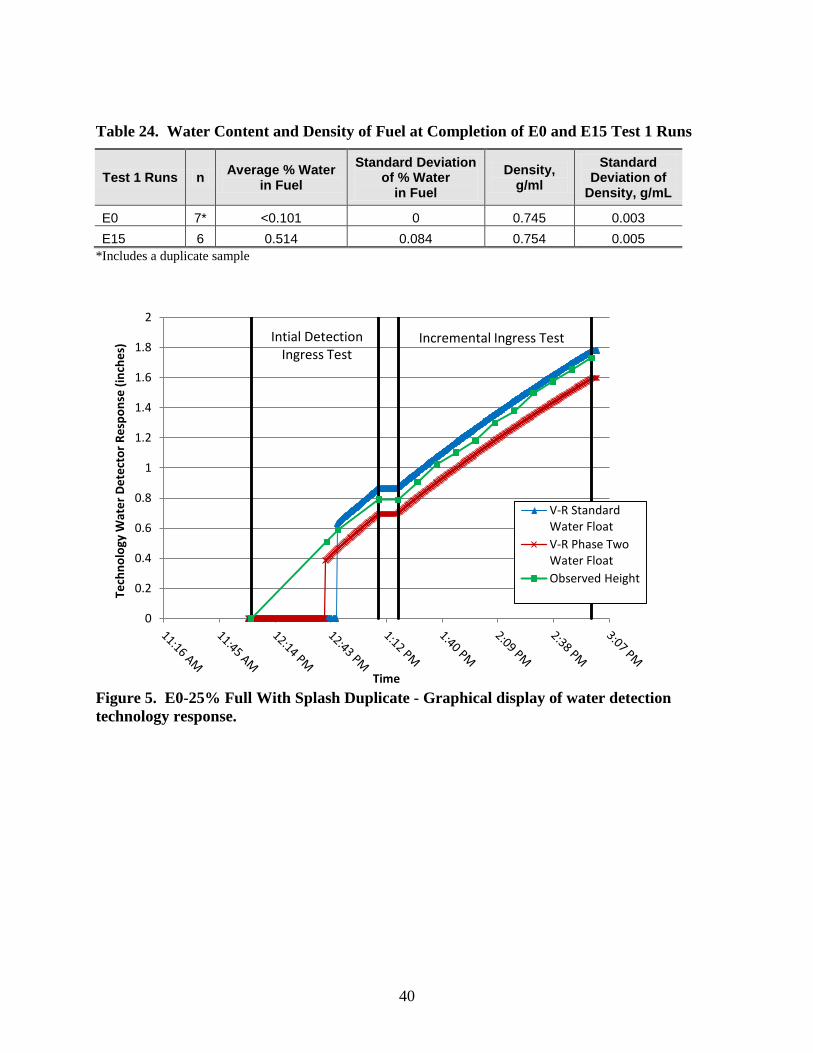
40
Table 24. Water Content and Density of Fuel at Completion of E0 and E15 Test 1 Runs
Test 1 Runs n Average % Water in Fuel
Standard Deviation of % Water
in Fuel Density,
g/ml Standard
Deviation of Density, g/mL
E0 7* <0.101 0 0.745 0.003 E15 6 0.514 0.084 0.754 0.005
*Includes a duplicate sample
Figure 5. E0-25% Full With Splash Duplicate - Graphical display of water detection technology response.
0
0.2
0.4
0.6
0.8
1
1.2
1.4
1.6
1.8
2
Tech
nolo
gy W
ater
Det
ecto
r Res
pons
e (in
ches
)
Time
V-R Standard Water Float V-R Phase Two Water Float Observed Height
Intial Detection Ingress Test
Incremental Ingress Test

Figure 6. E0 Dump Test - Graphical display of water detection technology response.
0
0.2
0.4
0.6
0.8
1
1.2
1.4
1.6
1.8
Tech
nolo
gy W
ater
Det
ecto
r Res
pons
e (in
ches
)
Time
V-R Standard Water Probe
V-R Phase-Two Probe
First Water Dump (2 gal) 12:10
Second Water Dump (2 gal) 12:28
Fuel Dump Start 13:09
Fuel Dump Finish 13:21
6.4.2 Mixing and Float Response with E15 Fuel
Similar fuel-water droplet formation interaction was noticed for the E15 tests as for the E0 runs, with the exception that diffusion was visible throughout the fuel layer for all E15 runs. Diffusion currents were observed in the fuel where the water entered as tiny water droplets appeared to drift away laterally from the water droplet column while others drifted upward. Many of these tiny water droplets were observed to dissolve into the fuel while the larger droplets continued to the bottom of the test vessel to collect with the dense layer. Laterally-drifting small water droplets were more apparent in the 65% fuel height runs than in the 25% runs. Between the two tests, mixing was greatest for the Test 1 runs (continuous ingress), and mixing was higher in the with-splash runs than in the without-splash runs. The fine bubbles that were produced in the with-splash runs increased the surface area available for mixing, and as the water fell through the fuel column, this high amount of surface area allowed the water to “pull” ethanol from the E15 fuel. For both the 25% and 65% full runs, enough alcohol had diffused into the water that the water/alcohol mixture, being denser than the gasoline, readily settled to the bottom of the test vessel. Tables 23 and 24 support these observations showing that the dense phase for the E15 runs contains less water than the measurements for the E0 runs plus the fuel had measureable amounts of water in it for the E15 runs where none was detected in the E0.
41
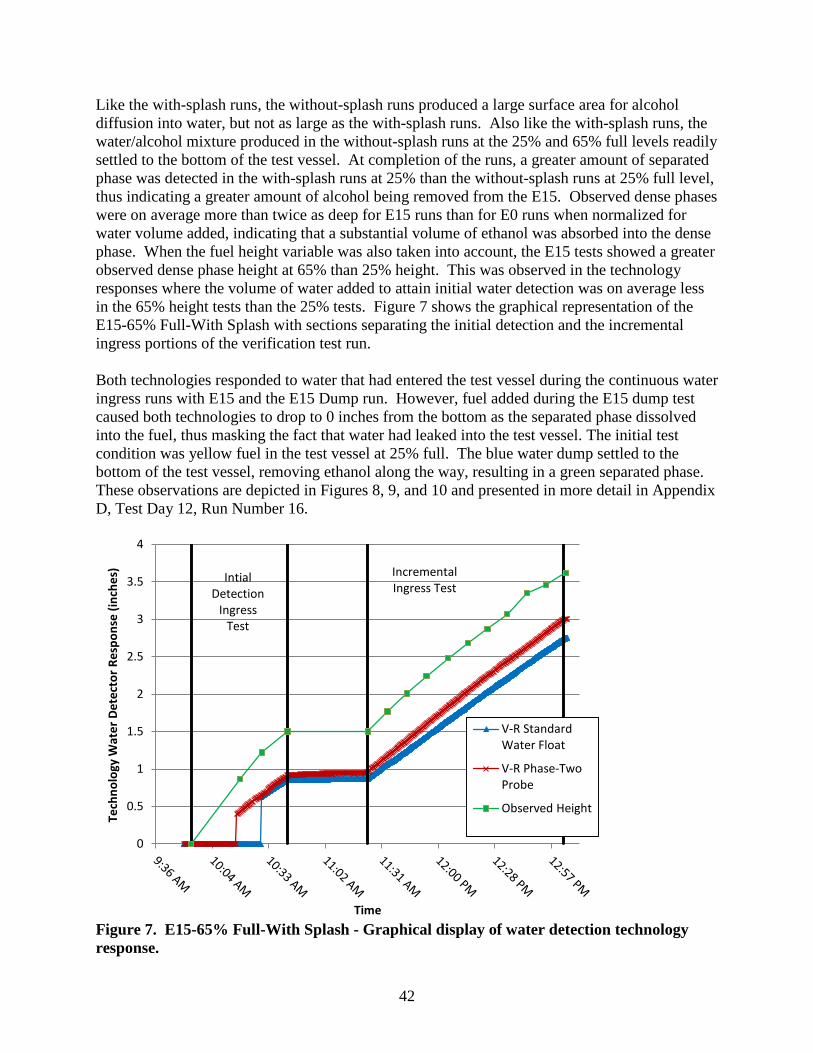
Like the with-splash runs, the without-splash runs produced a large surface area for alcohol diffusion into water, but not as large as the with-splash runs. Also like the with-splash runs, the water/alcohol mixture produced in the without-splash runs at the 25% and 65% full levels readily settled to the bottom of the test vessel. At completion of the runs, a greater amount of separated phase was detected in the with-splash runs at 25% than the without-splash runs at 25% full level, thus indicating a greater amount of alcohol being removed from the E15. Observed dense phases were on average more than twice as deep for E15 runs than for E0 runs when normalized for water volume added, indicating that a substantial volume of ethanol was absorbed into the dense phase. When the fuel height variable was also taken into account, the E15 tests showed a greater observed dense phase height at 65% than 25% height. This was observed in the technology responses where the volume of water added to attain initial water detection was on average less in the 65% height tests than the 25% tests. Figure 7 shows the graphical representation of the E15-65% Full-With Splash with sections separating the initial detection and the incremental ingress portions of the verification test run. Both technologies responded to water that had entered the test vessel during the continuous water ingress runs with E15 and the E15 Dump run. However, fuel added during the E15 dump test caused both technologies to drop to 0 inches from the bottom as the separated phase dissolved into the fuel, thus masking the fact that water had leaked into the test vessel. The initial test condition was yellow fuel in the test vessel at 25% full. The blue water dump settled to the bottom of the test vessel, removing ethanol along the way, resulting in a green separated phase. These observations are depicted in Figures 8, 9, and 10 and presented in more detail in Appendix D, Test Day 12, Run Number 16.
42
Figure 7. E15-65% Full-With Splash - Graphical display of water detection technology response.
0
0.5
1
1.5
2
2.5
3
3.5
4
Tech
nolo
gy W
ater
Det
ecto
r Res
pons
e (in
ches
)
Time
V-R Standard Water Float
V-R Phase-Two Probe
Observed Height
Incremental Ingress Test
Intial Detection
Ingress Test

43
Figure 8. E15 Dump Test - Graphical display of water detection technology response.
0
0.2
0.4
0.6
0.8
1
1.2
1.4 Te
chno
logy
Wat
er D
etec
tor R
espo
nse
(inch
es)
Time
V-R Standard Water Probe
V-R Phase-Two Probe
Water Dump 8:22
Fuel Dump Start 8:56
Fuel Dump Finish 9:12
Figure 9. E15 Dump Test – Before water dump (initial condition).

44
Figure 10. E15 Dump Test – After fuel dump (final condition).
6.4.3 Mixing and Float Response with Flex Fuel
Mixing was nearly instantaneous during all types of runs using flex fuel. The same fine and large bubble patterns as had been observed during the runs using E15 were also visible immediately below the surface at the water ingress location during the continuous ingress runs, but the water soon dissolved into the fuel (or the fuel dissolved into the water). With the splash ingress runs, the water dispersed in a cloudy fashion into many fine droplets and was visible until approximately 6 inches below the fuel surface before dissipating into the fuel. The without splash ingress runs caused the water to enter the fuel in a plume, then continued to approximately 10 inches below the fuel surface before dissipating. In both cases, the added water did not appear to reach the bottom of the test vessel with flex fuel. After the diffusion took place, subtle changes in fuel appearance were notable until the entire contents of the test vessel were changed to the same green color. No visible separated phase was observed, and the standard water float showed no response. At times, the Phase-Two™ Water Detector float responded to water ingress as if it was neutrally buoyant with the high alcohol content fuel. This would occur if the fuel density and the float density were very close to one another. During the without-splash runs, the inner float rose to the maximum height within the protective housing and stopped responding as additional water was added. A similar operating condition occurred during the with-splash runs as shown in Figure 11 presenting the E85-25% Full-With Splash run. Because the technologies did not respond at the 25% full level, the 65% level runs were omitted from the test.

45
During the quick dump runs, a separated phase was clearly visible after 4 gallons of water were dumped into 170 gallons of flex fuel. At that time, the vessel contents were multi-colored: the separated phase was deep blue (indigo blue), and the remaining contents were a graduation of green. The green was due to the dyed water mixing with the alcohol in the fuel. Mixing was best at the bottom, and gradually decreased as the fuel column increased. Both the standard water float and the Phase-TwoTM Water Detector float responded to the separated phase. Within 60 seconds of starting the fuel dump, however, the separated phase became completely engulfed in the flex fuel and disappeared, and the entire contents of the vessel became uniformly green in color. The dense phase was not observed after the fuel dump, and the water level previously reported by the Standard Water Float decreased to zero; however, the Phase TwoTM Water Detector registered approximately 0.5 inches of dense phase. These observations are depicted in Figures 12, 13, and 14, and are presented in more detail in Appendix D, Test Day 9, Run Number 19. Tables 25 and 26 summarize the observation of the Test 2 Dump runs for the Standard Water Float and the Phase TwoTM Water Detector, respectively.
Figure 11. E85-25% Full-With Splash- Graphical display of water detection technology response.
0
1
2
3
4
5
6
Tech
nolo
gy W
ater
Det
ectio
n (in
ches
)
Time
Standard Water Float
2-Phase Water Float

46
Figure 12. E85 Dump Test - Graphical display of water detection technology response.
0
1
2
3
4
5
6
7
8
9 Te
chno
logy
Wat
er D
etec
toRr
espo
nse
(inch
es)
Time
V-R Standard Water Probe
V-R Phase-Two Probe
First Water Dump (2 gal) 9:58
Second Water Dump (2 gal) 10:01
Fuel Dump Start 11:20
Fuel Dump Finish 11:34
Third Water Dump (2 gal) 10:22
Figure 13. E85 Dump Test – After the water dump.

47
Figure 14. E85 Dump Test – After fuel dump (final condition). Table 25. Summary of Veeder-Root Standard Water Float Dump Test Observations
Test 2 Dump Runs
After Water Dump After Fuel Dump
Was Phase Separation Observed?
Was Phase Separation Detected by
Standard Water Float?
Was Phase Separation Observed?
Was Phase Separation Detected by
Standard Water Float?
E0 Yes, it was blue Yes Yes, it was blue Yes
E15 Yes, it was dark
blue-green Yes
No clear separation, but stratification of yellow on top and
green below (Figure 10) No
E85
No clear separation, but stratification of
green in middle and dark blue on bottom
(Figure 13) Yes
No, fuel became uniform green color
(Figure 14) No Note: Initial color of the fuel blends were yellow, initial color of water was dyed blue.

48
Table 26. Summary of Veeder-Root Phase Two™ Water Detector Dump Test Observations
Test 2 Dump Runs
After Water Dump After Fuel Dump
Was Phase Separation Observed?
Was Phase Separation
Detected by Phase Two™ Water
Detector?
Was Phase Separation Observed?
Was Phase Separation
Detected by Phase Two™ Water
Detector? E0 Yes, it was blue Yes Yes, it was blue Yes
E15 Yes, it was dark
blue-green Yes
No clear separation, but stratification of yellow on top and
green below (Figure 10) No
E85
No clear separation, but stratification of
green in middle and blue on bottom
(Figure 13) Yes
No, fuel became uniform green color
(Figure 14)
Yes, inner float measured ~0.5
inches of a denser phase below the
green water-saturated fuel
Note: Initial color of the fuel blends were yellow, initial color of water was dyed blue.
6.5 Operational Factors
The Veeder-Root technologies were installed at the testing facility by the vendor, and Battelle staff were trained on the proper use of the technologies as it pertained to this testing design. Battelle staff checked the technology console for status messages continuously until an initial float response was indicated, recorded several instrument parameter values at the time of initial float response and every 10 minutes thereafter during the increment runs, and backed up the collected data each day. No on-site calibrations were performed. Signals from the two Veeder-Root probes equipped with water floats were transmitted to a Veeder-Root TLS-350 console that was used to display and record the water heights at various times during each run. During testing, the console was set to alarm when the water level in the test vessel registered (for a given probe) 1 inch or more for at least 3 minutes. The console is a basic box with a number keypad and several function buttons that allow the user to control the information presented on a two-line liquid crystal display. The console programming causes the liquid crystal display to revert to the date and time and an overall system status (i.e., “ALL FUNCTIONS NORMAL”) when there have been no user inputs for approximately 5 minutes. The tank gauge system was designed to acquire information using the thermal paper printer (small 2 inch wide strips), but it also has two serial ports that can be used to connect the console to a computer or other device for remote access. During the current tests, the printer was used to capture snapshots of information by periodically using the “print” button to obtain a hardcopy of measurements, while the serial port was used to record real-time data directly to a laptop computer. The console transferred information to the computer at 30-second intervals. The resulting data file was in an unreadable format, however, that required use of a DOS executable program that is not normally provided with the UST monitoring system. The console generated

49
a binary data file that was then converted into a .csv format using the DOS program. The delimited file was viewable in Microsoft® Excel. A date-time entry was recorded as seconds since midnight on January 1, 1970, and the date and time were decoded using a formula in the spreadsheet. In general, the system was easy to use as intended and required no maintenance or repair once testing began. The continuous data capturing process and using the electronic data were somewhat difficult; however, this aspect of the console operation is not typically used at retail sites.

50
Chapter 7 Performance Summary for the Veeder-Root Standard Water Float
7.1 Performance Summary for the Veeder-Root Standard Water Float
The performance of the Veeder-Root Standard Water Float was evaluated for its accuracy, sensitivity, precision, phase separation detection, and operational factors. The ethanol content, fill height of fuel, and water ingress method/rate were varied to challenge the water detection technologies under a variety of simulated UST conditions. The Standard Water Float responded to the continuous water ingress when the test fuel was E0 and E15, but showed no response when flex fuel was used as the test fuel. The reason for the no response was that no clear separated dense phase was formed in the flex fuel when water was added to the test vessel. As a result, the performance parameters defined in the QAPP, and summarized below, could not be determined for this technology when flex fuel was employed. Tables 27 and 28 present the performance parameters determined using the data from the E0 and E15 Test 1a and 1b water ingress runs. The accuracy of the Veeder-Root Standard Water Float is shown by the differences that occurred between the observed dense phase height and the dense phase height reported by the technology. Bias represents the average accuracy over all of the runs. A difference of 0.0 inches indicates that the heights were the same for the two methods (most accurate). A bias of 0.0 inches indicates that the technology measurement is either very accurate or produces the same number of overestimates as underestimates. The Standard Water Float was slightly positive for all E10 run results and slightly negative for all E15 run results. The resulting bias was slightly negative at -0.17 inch. Table 27. Summary of Veeder-Root Standard Water Float Accuracy
Parameter Initial Response (inches)
Initial Increment Reading (Time 0) (inches)
Final Increment Reading
(Time 100) (inches)
Accuracy (Bias) -0.17 -0.17 -0.24
This verification test evaluated sensitivity by calculating the TL and the MLC. The TL predicts the minimum detection height (in inches for these test runs) that the technologies can detect with a 95% confidence. Table 28 presents the sensitivity as expressed in the TL and MLC and the precision of the technology by each variable. These results show that the Standard Water Float was installed at about ½ inch or more from the bottom of the test vessel, which impacted the minimum detectable height. The TL for the Standard Water Float was 0.68 inches. There was no difference in the TL of the technology when separated by variable.

51
The MLC in water height was used to estimate the smallest change (in inches for those runs) that the evaluated technology can read. An MLC value near 0.0 indicates that the technology is able to detect very small changes in the level of the dense phase. The Standard Water Float had very similar MLC results, with an overall MLC of 0.06 inches (approximately 1/16 inch). It also had slightly lower MLC values with the E0 test runs at approximately 1/25th of an inch (0.04 inch). Therefore, this technology detected the minimum 1/8th inch change in dense phase height in E0 and in E15 blends. Table 28 also presents a ratio of the mean to the SD that is used to help determine the precision of the collected data. Again, this parameter is summarized by the overall precision for the Standard Water Float and by the individual variables. A high-precision value signifies a high degree of reproducibility, whereas a low precision value signifies the opposite. Overall these results indicate that the variables did not affect the precision of the technologies; however there were slight differences. The Standard Water Float is more precise with E15 over E0, 65% full over 25% full, and without a splash over with a splash. Finally, Table 29 summarizes the observations during the Test 2 Dump runs. The water dump was detected by the Standard Water Float in all three fuel blends; however, once the fuel was dumped in, the water was only detected in E0. In general, the system was easy to use as intended. Once an ATG water detection technology is installed, operation of the console involves following the prompts on the console screen. The Standard Water Float responded to the water ingress when the test fuel was E0 and E15, but showed no response when flex fuel was used as the test fuel. The reason for the no response was that no clear separated dense phase was formed in the flex fuel when water was added to the test vessel. As a result, the performance parameters defined in the QAPP could not be determined for this technology when flex fuel was employed. The following table provides a summary of verification test results for the Veeder-Root Standard Water Float; the calculated performance parameters were determined using the pooled data from the E0 and E15 water ingress runs. Currently 40 CFR, Section 280.43(a) states water detection technologies should detect “water at the bottom of the tank,” which does not address water entrained in the fuel due to increased miscibility with the presence of ethanol. The water sensor, tested according to "EPA's Standard Test Procedures for Evaluating Leak Detection Methods: Automatic Tank Gauging Systems," did not detect water in the test vessel containing either intermediate (E15) or high (E85) ethanol blends if the water was suspended in the product or the water did not reach the bottom of the tank. Because of this, there is not sufficient data to evaluate whether this technology, when used with UST systems containing intermediate or high ethanol blends, would indicate a potential release under every circumstance.
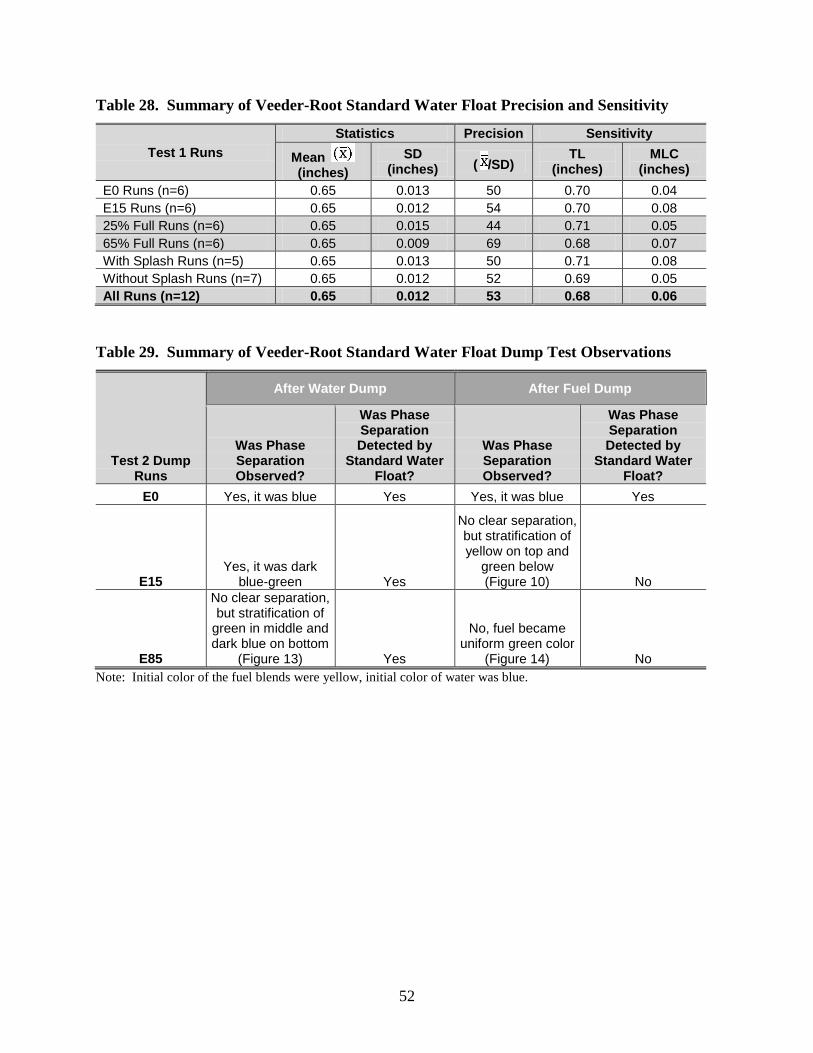
52
Table 28. Summary of Veeder-Root Standard Water Float Precision and Sensitivity
Test 1 Runs Statistics Precision Sensitivity
Mean (inches)
SD (inches) ( /SD)
TL (inches)
MLC (inches)
E0 Runs (n=6) 0.65 0.013 50 0.70 0.04 E15 Runs (n=6) 0.65 0.012 54 0.70 0.08 25% Full Runs (n=6) 0.65 0.015 44 0.71 0.05 65% Full Runs (n=6) 0.65 0.009 69 0.68 0.07 With Splash Runs (n=5) 0.65 0.013 50 0.71 0.08 Without Splash Runs (n=7) 0.65 0.012 52 0.69 0.05 All Runs (n=12) 0.65 0.012 53 0.68 0.06
Table 29. Summary of Veeder-Root Standard Water Float Dump Test Observations
Test 2 Dump Runs
After Water Dump After Fuel Dump
Was Phase Separation Observed?
Was Phase Separation Detected by
Standard Water Float?
Was Phase Separation Observed?
Was Phase Separation Detected by
Standard Water Float?
E0 Yes, it was blue Yes Yes, it was blue Yes
E15 Yes, it was dark
blue-green Yes
No clear separation, but stratification of yellow on top and
green below (Figure 10) No
E85
No clear separation, but stratification of
green in middle and dark blue on bottom
(Figure 13) Yes
No, fuel became uniform green color
(Figure 14) No Note: Initial color of the fuel blends were yellow, initial color of water was blue.

53
Chapter 8 Performance Summary for the Veeder-Root Phase-Two™ Water Detector
8.1 Performance Summary for the Veeder-Root Phase-Two™ Water Detector
The performance of the Veeder-Root Phase-TwoTM Water Detector was evaluated for its accuracy, sensitivity, precision, phase separation detection, and operational factors. The ethanol content, fill height of fuel, and water ingress method/rate were varied to challenge the water detection technologies under a variety of simulated UST conditions. The Phase-Two™ Water Detector responded to the continuous water ingress when the test fuel was E0 and E15, but showed no response when flex fuel was used as the test fuel. The reason for the no response was that no clear separated dense phase was formed in the flex fuel when water was added to the test vessel. As a result, the performance parameters defined in the QAPP, and summarized below, could not be determined for this technology when flex fuel was employed. Tables 30 and 31 present the performance parameters determined using the data from the E0 and E15 Test 1a and b water ingress runs. The accuracy of the Veeder-Root Phase-TwoTM Water Detector float is shown by the differences that occurred between the observed dense phase height and the dense phase height reported by the technology. Bias represents the average accuracy over all of the runs. A difference of 0.0 inches indicates that the heights were the same for the two methods (most accurate). A bias of 0.0 inches indicates that the technology measurement is either very accurate or produces the same number of overestimates as underestimates. The Phase TwoTM Water Detector returned slightly negative bias results for all test runs. The resulting bias was negative at -0.27 inch.
Table 30. Summary of Veeder-Root Phase-TwoTM Water Detector Accuracy
Parameter Initial Response (inches)
Initial Increment Reading (inches)
Final Increment Reading (inches)
Accuracy (Bias) -0.27 -0.27 -0.32
This verification test evaluates sensitivity by calculating the TL and the MLC. The TL predicts the minimum detection height (in inches for these test runs) that the technologies can detect with a 95% confidence. Table 31 presents the sensitivity as expressed in the TL and MLC and the precision of the technology by each variable. These results showed that the technology was installed at about ½ inch or more from the bottom of the test vessel, which impacted the minimum detectable height. The TL for the Phase TwoTM Water Detector was 0.51 inches.
54
There were slight differences in the TL of the Phase TwoTM Water Detector when separated by fuel type. The MLC in water height was used to estimate the smallest change (in inches for those runs) that the evaluated technology can read. An MLC value near 0.0 indicates that the technology is able to detect very small changes in the level of the dense phase. The Phase TwoTM Water Detector had very similar MLC results, with an overall MLC of 0.06 inches (approximately 1/16 inch). It also had slightly lower MLC values with the E0 test runs at approximately 1/25th of an inch (0.04 inch). Therefore, this technology detected the minimum 1/8th inch change in dense phase height in E0 and in E15 blends. Table 31 also presents a ratio of the mean to the SD that is used to help determine the precision of the collected data. Again, this parameter is summarized by the overall precision for the Phase TwoTM Water Detector and by the individual variables. A high-precision value signifies a high degree of reproducibility, whereas a low precision value signifies the opposite. Overall these results indicate that the variables did not affect the precision of the technologies; however there were slight differences. The Phase TwoTM Water Detector was more precise with E0 over E15, 65% full over 25% full, and with a splash over without a splash. Finally, Table 32 summarizes the observations during the Test 2 Dump runs. The water dump was detected by the Phase TwoTM Water Detector in all three fuel blends; however, once the fuel was dumped in, the water was only detected in E0 and Flex fuel. In general, the system was easy to use as intended. Once an ATG water detection technology is installed, operation of the console involves following the prompts on the console screen. The Phase-Two™ Water Detector responded to the water ingress when the test fuel was E0 and E15, but showed no response when flex fuel was used as the test fuel. The float appeared to be neutrally buoyant in the flex fuel/water mixture. The reason for the no response was that no clear separated dense phase was formed in the flex fuel when water was added to the test vessel. As a result, the performance parameters defined in the QAPP could not be determined for this technology when flex fuel was employed. The following table provides a summary of verification test results for the Veeder-Root Phase-Two™ Water Detector; the calculated performance parameters were determined using the pooled data from the E0 and E15 water ingress runs. Currently 40 CFR, Section 280.43(a) states water detection technologies should detect “water at the bottom of the tank,” which does not address water entrained in the fuel due to increased miscibility with the presence of ethanol. The water sensor, tested according to "EPA's Standard Test Procedures for Evaluating Leak Detection Methods: Automatic Tank Gauging Systems," did not detect water in the test vessel containing either intermediate (E15) or high (E85) ethanol blends if the water was suspended in the product or the water did not reach the bottom of the tank. Because of this, there is not sufficient data to evaluate whether this technology, when used with UST systems containing intermediate or high ethanol blends, would indicate a potential release under every circumstance.

55
TMTable 31. Summary of Veeder-Root Phase-Two Sensitivity
Water Detector Precision and
Test 1 Runs
Statistics Precision Sensitivity
Mean (inches)
SD (inches) ( /SD)
TL (inches)
MLC (inches)
E0 Runs (n=6) 0.39 0.010 40 0.43 0.04 E15 Runs (n=6) 0.44 0.038 12 0.57 0.07 25% Full Runs (n=6) 0.42 0.045 9 0.59 0.05 65% Full Runs (n=6) 0.41 0.023 18 0.49 0.07 With Splash Runs (n=5) 0.41 0.030 14 0.54 0.07 Without Splash Runs (n=7) 0.41 0.038 11 0.54 0.05 All Runs (n=12) 0.41 0.035 12 0.51 0.06
Table 32. Summary of Veeder-Root Phase Two™ Water Detector Dump Test Observations
After Water Dump After Fuel Dump
Was Phase Was Phase Test 2 Dump Was Phase Separation Was Phase Separation Runs Separation Detected by Phase Separation Detected by Phase Observed? Two™ Water Observed? Two™ Water
Detector? Detector? E0 Yes, it was blue Yes Yes, it was blue Yes
No clear separation, but stratification of yellow on top and
Yes, it was dark green below E15 blue-green Yes (Figure 10) No
Yes, inner float No clear separation, measured ~0.5 but stratification of inches of a denser
green in middle and No, fuel became phase below the blue on bottom uniform green color green
E85 (Figure 13) Yes (Figure 14) water-saturated fuel Note: Initial color of the fuel blends were yellow, initial color of water was blue.
56
Chapter 9 References
1. Quality Assurance Project Plan for Verification of Underground Storage Tank Automatic Tank Gauging Leak Detection Systems. U.S. Environmental Technology Verification Program, Battelle, 2011.
2. Quality Management Plan for the ETV Advanced Monitoring Systems Center, Version 8. U.S. Environmental Technology Verification Program, Battelle, April 2011.
3. ASTM, D4815-09: Standard Test Method for Determination of MTBE, ETBE, TAME, DIPE, tertiary-Amyl Alcohol and C1 to C4 Alcohols in Gasoline by Gas Chromatography. November 2009.
4. ASTM, D5501-09: Standard Test Method for Determination of Ethanol Content of Denatured Fuel Ethanol by Gas Chromatography. May 2009.
5. Guidebook for Handling, Storing, and Dispensing Fuel Ethanol. Center for Transportation Research Energy Systems Division Argonne National Laboratory, U.S. Department of Energy.
6. Battelle, Standard Operating Procedure (SOP) Operation and Maintenance of Karl-Fischer Water Analysis Instrumentation in SOP No. III-009-00. 1992, Organic and Polymer Chemistry Department.
7. Lieberman, G., Tables for One-Sided Statistical Tolerance Limits, ed. I.Q. Control. Vol. Vol. XIV, No 10. 1958.
8. CRC Handbook of Tables and Probability and Statistics, ed. W.H.B. (ed.). 1966: The Chemical Rubber Company.

A-1
Appendix A Summary of Deviations from the QAPP

A-2
Deviation (Date) Description Cause ETV Report
Location QAPP
Location
No. 1
(8/31/11)
Page 28 and following pages of the QAPP indicated that two fuel fill heights (25% and 90%) would be established during the water ingress and fuel leak tests. This was revised to indicate that the fuel fill height for water ingress tests would be 25% and 65%. The deviation happened because if the test vessel had been filled to 90%, a test run would require a condition in the test vessel that may not be achievable, because the vessel capacity would possibly been exceeded.
Bench test results showed that E85 had the potential of holding a large amount of water. The QAPP indicated that the 95% fill height for E85 would be reduced to a lesser level or the two 90% full runs would be removed from the tests. The 90% level is a remnant of the original EPA ATG protocol for testing the leak rate of fuel out of a storage tank. It was not intended to apply to water leaking into a tank. When the draft ETV QAPP was separated into four separate test types, the 90% level was not revised for the water ingress tests.
Section 3.3 Page 12
Section B1 Page 28
No. 2
(9/2/11)
Table 12 and Section C1.1: calibration procedures for ethanol blends and analysis of performance evaluation audit (PEA) samples do not follow the QAPP. The PEA samples for the two methods used to determine the fuel ethanol content, D4815 (for E15 and E0) and D5501 (for E85), were analyzed according to the calibration procedures specified in the ASTM methods instead of the procedures defined in the QAPP. This deviation also applies to the samples that were collected during testing, which were also analyzed following the same ASTM methods. D4815- Standard Test Method for Determination of MTBE, ETBE, TAME, DIPE, tertiary-Amyl Alcohol and C1 to C4 Alcohols in Gasoline by Gas Chromatography uses a calibration curve as specified in the QAPP Table 12; however, the curve was not analyzed once every 30 samples as specified. Once the calibration curve was established, it was to be verified every run or every 10 samples whichever was more frequent, with a continuing calibration standard. D5501- Standard Test Method for Determination of Ethanol Content of Denatured Fuel Ethanol by Gas Chromatography uses a one-point standard response factor for calibration instead of a calibration curve as stated in the QAPP Table 12. D5798-10 Standard Specification for Fuel Ethanol (Ed70-Ed85) for Automotive Spark-ignition Engines specifies that Method D5501 should be used for determination of ethanol content in E85. The analytical laboratory, Intertek, used a 96% ethanol certified standard for the one-point instrument calibration.
The QAPP contained errors related to calibration procedures. Certified standards for fuel ethanol contents between 70% and 85% that would expand the calibration range are not available.
Section 4.3 Page 26
Section C1.1 Page 55-56 Section B5 Table 12 Page 51

A-3
Deviation (Date) Description Cause ETV Report
Location QAPP
Location
No. 3
(9/21/11)
QAPP Table 11 in Section B5: The true value of the high ethanol blend may not meet the acceptance criteria of +/-10% of the target ethanol content of 85%. The analytical method results were lower than expected when compared to the metered mix ticket received from the blender and the Method to Determine the Total Hydrocarbon Content of Alcohol Fuel from the U.S. Department of Energy’s (DOE) Guidebook for Handling, Storing, and Dispensing Fuel Ethanol. The accuracy of the analytical method is questioned for the following reasons: • ASTM Method D5501-Standard Test
Method for Determination of Ethanol Content of Denatured Fuel Ethanol by Gas Chromatography uses a one-point calibration standard response factor based on a 96% ethanol standard. The defined range for the method is 93% to 97% ethanol content, and it is not proven to have a linear response lower than 93%.
• Although ASTM Method D5798-
Standard Specification for Fuel Ethanol (Ed70-Ed85) for Automotive Spark-ignition Engines specifies that Method D5501 should be used for determining ethanol content in E85, this method may not have the necessary accuracy.
Based on the recommendation of ASTM Method D5798-10, Battelle included use of ASTM Method D5501 in the QAPP as the verification method for E85 ethanol content. However, upon receipt of the analytical results, this method no longer appears reliable for test purposes. The analytical results returned a value of 75% ethanol for the E85 blend. This is outside of the acceptable criteria stated in Table 11. The mix ticket supplied with the fuel defined the mixture as 85% ethanol?. In addition, the method from the DOE Guidebook that is readily used by the industry resulted in an ethanol concentration of 86.87%, corroborating the mix ticket value.
Section 3.4.1 Page 16
Section B5 Table 11 Page 50
No. 4
(9/26/11)
QAPP Section B and B2.1 stated that the fuel ethanol content determination would be performed before testing to verify that the ethanol concentration is within +/- 10% of the target level. A sample from the second blended batch of E15 was analyzed as soon as possible by Method D4815; however, the testing was not delayed to awaiting the results.
Due to a change in the anticipated run order for various reasons (waste considerations, technology communications issues, etc.), the lag time allowed for the return of analytical results was removed from the schedule.
Section 3.3 Page 11
Section B Page 28 Section B2.1 Page 47
No. 5
(11/15/11)
The QAPP stated that the percent ethanol should be tested and confirmed to be ±10% of nominal concentration prior to each run. The E0 fuel was not analyzed prior to testing.
Due to a change in the anticipated run order for various reasons (waste considerations, technology communications issues, etc.), the lag time allowed for the return of analytical results was removed from the schedule.
Section 3.3 Page 11
Section B Page 28 Section B2.1 Page 47
No. 6
(11/15/11)
The QAPP stated that a 10 to 250 mL sample of fuel would be collected into a glass sampling jar with a Teflon-lined cap and sent to an analytical laboratory for analysis of ethanol content at 0° to 5°C (32° to 40°F). The samples for ethanol content analysis were stored and shipped at room temperature.
Battelle determined that cooling during storage and shipping was not necessary after discussing the issue with the analytical laboratory. This requirement was included in a previous version of the QAPP intending to use a different ASTM method for the fuel ethanol content determination.
Section 3.4.1 Page 16
Section B2.1 Page 47

A-4
Deviation (Date) Description Cause ETV Report
Location QAPP
Location
No. 7
(11/15/11)
The QAPP stated that the test vessel was to be pre-filled with water to approximately 75% of the vendor-stated amount needed to trigger a response prior to initiating the water ingress runs. The test vessel was not pre-filled with water because four different floats were installed in the same test vessel. Pre-filling the test vessel relative to one of the other floats would have caused the lowest float to respond to water before the run had begun.
This pre-filling was thought to be needed to shorten test times, but the requirement was specified before actual information was received from the participating vendors. After the technologies were installed by the vendors, the estimated time to detect water for the most sensitive technology was calculated using the tank volume chart, and the time was determined to be a manageable duration without pre-filling the tank. In addition, the conditions better mimicked the actual ingress scenario of a UST.
Section 3.4.2 Page 17
Section B1 Page 28
No. 8
(11/15/11)
The QAPP stated that a grid with incremental pattern spacing would be placed within the view area of the test vessel to clearly display the height(s) and width(s) of various liquid phases in the tank. A tape measure was mounted vertically on the end of the vessel, but no horizontal tape was installed
The horizontal lines were initially included in the test vessel design to enhance observation of the test run and not to collect measured data. Because the shell used to construct the test vessel was deep red in color, visualization of a water or dense phase separation was expected to be difficult. The proposal to add a white grid to the bottom of the test vessel to provide a strong contrast for viewing test conditions and dense phases was modified by fully coating the vessel interior with a white resin, thus providing a better contrast than would have been provided had just a portion of the vessel bottom been coated with a white resin and grid.
Section 3.2.2 Page 7
Section B2.2 Page 48
No. 9
(11/15/11)
The QAPP stated that water height would be measured by standard ruler to at least the nearest 1/32nd of an inch. Neither the external tape measure or internal ruler was incremented to 1/32nd; however the internal increment was to the nearest millimeter (1/25.4 inch).
When fabricating the test vessel, the internal metal rulers were installed for fuel compatibility and ease of readability.
Section 3.4.3 Page 18
Section B5 Table 11 Page 50
No. 10
(11/15/11)
The QAPP stated that fuel density/specific gravity would be monitored semi-continuously. However, density was monitored prior to each run, at the midpoint of each run, and at the end of the each run.
When the QAPP was written, Battelle anticipated using a continuous density monitor installed in the test vessel. During the job hazard analysis for the ETV test, however, the method proposed for continuously extracting a sample for density measurement was found to represent a safety/explosion hazard. Battelle also determined that continuous density monitoring was unnecessary.
Section 3.4.3 Page 18
Section B1 Table 9 Page 38

A-5
Deviation (Date) Description Cause ETV Report
Location QAPP
Location
No. 11
(11/15/11)
A Battelle laboratory ran the Karl-Fisher Titration Method for water content. The PEA results for NIST SRM 2900 (4.4% water by mass) did not meet the acceptance criteria of ±5% of the certified value. The actual recovery for the SRM was 120%. The PEA does not confirm that Battelle’s laboratory is able to accurately measure low concentrations of water in fuel. Water standards analyzed with the PEA indicated that the analytical method was not accurate at 0.1% water although it was accurate at 1% and 10%.
The QAPP specified that if the PEA results are not acceptable that the PEA would be repeated. However, the water PEA was not repeated as specified in the QAPP.
The PEA SRM sample was over recovered; however, the analyst included three other independent NIST-traceable standards to verify the method. Two of these standards were within the acceptable criteria.
Section 4.2.1 Page 24
Section C1.1 Page 56
No. 12
(11/15/11)
Table 4 of the QAPP listed the run to be performed during the field portion of the ETV test. Changes were made to the Runs conducted, including: • Runs 11 and 15 were not conducted. • Run 10 was conducted as a duplicate
of Run 3 rather than a duplicate of Run 6.
• The detailed 10-minute incremental sensitivity tests were not conducted for Runs 5 and 6.
Changes to the runs were made after data were collected from the initial test runs. These data indicated that following the design in some cases would result in inconclusive observational data and an accumulation of unnecessary fuel waste.
Section 3.4.1 Page 15 Section 4.3 Page 26
Section B1 Table 4 Page 30
No. 13
(11/15/11)
Water ingress was not controlled by peristaltic pump as described in the QAPP but rather by gravity feed with an in-line flow meter. Three flow measurements were taken with a graduated cylinder and stop watch prior to each run. The average flow rate was used as a correction factor for the nominal flow rate setting.
This change was due to the same issue as defined in Deviation Number 10. During the job hazard analysis for the ETV test, the peristaltic pump proposed for adding water to the test vessel was found to represent a safety/explosion hazard because the plastic tubing used in the pump could build a static charge when the steel rollers traversed the tubes during use. The gravity feed option was devised just before testing began.
Section 4.1 Page 20
B1.1.3 Page 40

A-6
Deviation (Date) Description Cause ETV Report
Location QAPP
Location
No. 14
(11/15/11)
Quality control requirements for the analytical data (Table 12) are different than the QC data collected by the analytical laboratories. Intertek (ASTM Method D4815) and the Marathon (ASTM Method Modified D5501) analytical laboratories followed the ASTM method requirements. Intertek QC data were received from the analytical lab during the PEA but not for subsequent samples. The QC data from the Karl-Fisher Titration method included three control standards every batch instead of a control standard every sample.
The analytical laboratories and the analytical methods changed multiple times during the design phase. ASTM QC requirements were not incorporated into the final version of the QAPP.
Section 4.3 Page 27
Section B5 Table 12 Page 51
No. 15
(11/15/11)
A PEA was not conducted for the E85 ethanol analysis performed by the Marathon laboratory.
Many laboratories and methods were investigated as an alternative to using ASTM D5501 for the ethanol determination at the high end. The second analysis of the E85 fuel was performed in kind from the only laboratory identified to use a modified D5501 method that fit our parameters (Marathon laboratory). The PEA sample was sent for analysis with the E85 mixture; however, the laboratory did not analyze it.
Section 4.3 Page 27
C1.1 Pages 55-56

B-1
Appendix B Tank Volume Chart

B-2
Area of Circle Segments for a 6-ft Diameter Tank Area/D2 values taken from: Concrete Pipe Design Manual, American Concrete Pipe Association, Arlington, VA, 1974, p 397 Diameter (D) = 71.25 inches Gallons = gal/linear foot x 4.25 feet - 1.25 gallon + 0.25 gallon Highlighted rows were the 25% and 65% fill heights that were used for verification testing.
Tape Height, inch
Depth (d), inch d/D Area/D2 Area, ft2 Gallons
-0.04 0.71 0.01 0.0013 0.046 0.46 0.68 1.43 0.02 0.0037 0.130 3.15 1.39 2.14 0.03 0.0069 0.243 6.73 2.10 2.85 0.04 0.0105 0.370 10.77 2.81 3.56 0.05 0.0147 0.518 15.47 3.53 4.28 0.06 0.0192 0.677 20.52 4.24 4.99 0.07 0.0242 0.853 26.12 4.95 5.70 0.08 0.0294 1.036 31.95 5.66 6.41 0.09 0.0350 1.234 38.23 6.38 7.13 0.1 0.0409 1.442 44.84 7.09 7.84 0.11 0.0470 1.657 51.67 7.80 8.55 0.12 0.0534 1.883 58.85 8.51 9.26 0.13 0.0600 2.115 66.24 9.23 9.98 0.14 0.0668 2.355 73.86 9.94 10.69 0.15 0.0739 2.605 81.82
10.65 11.40 0.16 0.0811 2.859 89.89 11.36 12.11 0.17 0.0885 3.120 98.18 12.08 12.83 0.18 0.0961 3.388 106.70 12.79 13.54 0.19 0.1039 3.663 115.44 13.50 14.25 0.2 0.1118 3.941 124.30 14.21 14.96 0.21 0.1199 4.227 133.37 14.93 15.68 0.22 0.1281 4.516 142.56 15.64 16.39 0.23 0.1365 4.812 151.98 16.35 17.10 0.24 0.1449 5.108 161.39 17.06 17.81 0.25 0.1535 5.411 171.03 17.78 18.53 0.26 0.1623 5.722 180.89 18.49 19.24 0.27 0.1711 6.032 190.76

B-3
Tape Height, inch
Depth (d), inch d/D Area/D2 Area, ft2 Gallons
19.20 19.95 0.28 0.1800 6.346 200.73 19.91 20.66 0.29 0.1890 6.663 210.82 20.63 21.38 0.3 0.1982 6.987 221.13
21.34 22.09 0.31 0.2074 7.312 231.44 22.05 22.80 0.32 0.2167 7.640 241.86 22.76 23.51 0.33 0.2260 7.967 252.28 23.48 24.23 0.34 0.2355 8.302 262.93 24.19 24.94 0.35 0.2450 8.637 273.58 24.90 25.65 0.36 0.2546 8.976 284.34 25.61 26.36 0.37 0.2642 9.314 295.09 26.33 27.08 0.38 0.2739 9.656 305.97 27.04 27.79 0.39 0.2836 9.998 316.84 27.75 28.50 0.4 0.2934 10.343 327.82 28.46 29.21 0.41 0.3032 10.689 338.80 29.18 29.93 0.42 0.3130 11.034 349.79 29.89 30.64 0.43 0.3229 11.383 360.88 30.60 31.35 0.44 0.3328 11.733 371.98 31.31 32.06 0.45 0.3428 12.085 383.18 32.03 32.78 0.46 0.3527 12.434 394.28 32.74 33.49 0.47 0.3627 12.787 405.49 33.45 34.20 0.48 0.3727 13.139 416.69 34.16 34.91 0.49 0.3827 13.492 427.90 34.88 35.63 0.5 0.3927 13.844 439.11 35.59 36.34 0.51 0.4027 14.197 450.31 36.30 37.05 0.52 0.4127 14.549 461.52 37.01 37.76 0.53 0.4227 14.902 472.73 37.73 38.48 0.54 0.4327 15.254 483.94 38.44 39.19 0.55 0.4426 15.603 495.03 39.15 39.90 0.56 0.4526 15.956 506.24 39.86 40.61 0.57 0.4625 16.305 517.33 40.58 41.33 0.58 0.4723 16.650 528.32 41.29 42.04 0.59 0.4822 16.999 539.41 42.00 42.75 0.6 0.492 17.345 550.40 42.71 43.46 0.61 0.5018 17.690 561.38 43.43 44.18 0.62 0.5115 18.032 572.25 44.14 44.89 0.63 0.5212 18.374 583.12 44.85 45.60 0.64 0.5308 18.713 593.88 45.56 46.31 0.65 0.5404 19.051 604.64
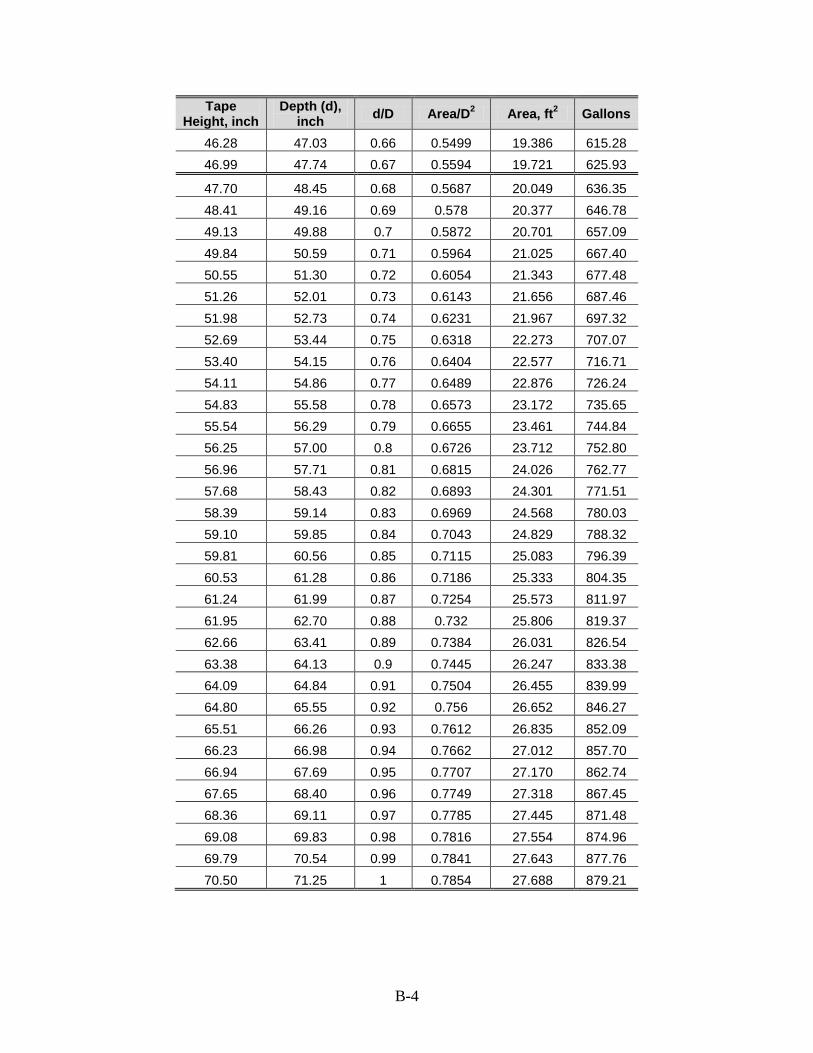
B-4
Tape Height, inch
Depth (d), inch d/D Area/D2 Area, ft2 Gallons
46.28 47.03 0.66 0.5499 19.386 615.28 46.99 47.74 0.67 0.5594 19.721 625.93
47.70 48.45 0.68 0.5687 20.049 636.35 48.41 49.16 0.69 0.578 20.377 646.78 49.13 49.88 0.7 0.5872 20.701 657.09 49.84 50.59 0.71 0.5964 21.025 667.40 50.55 51.30 0.72 0.6054 21.343 677.48 51.26 52.01 0.73 0.6143 21.656 687.46 51.98 52.73 0.74 0.6231 21.967 697.32 52.69 53.44 0.75 0.6318 22.273 707.07 53.40 54.15 0.76 0.6404 22.577 716.71 54.11 54.86 0.77 0.6489 22.876 726.24 54.83 55.58 0.78 0.6573 23.172 735.65 55.54 56.29 0.79 0.6655 23.461 744.84 56.25 57.00 0.8 0.6726 23.712 752.80 56.96 57.71 0.81 0.6815 24.026 762.77 57.68 58.43 0.82 0.6893 24.301 771.51 58.39 59.14 0.83 0.6969 24.568 780.03 59.10 59.85 0.84 0.7043 24.829 788.32 59.81 60.56 0.85 0.7115 25.083 796.39 60.53 61.28 0.86 0.7186 25.333 804.35 61.24 61.99 0.87 0.7254 25.573 811.97 61.95 62.70 0.88 0.732 25.806 819.37 62.66 63.41 0.89 0.7384 26.031 826.54 63.38 64.13 0.9 0.7445 26.247 833.38 64.09 64.84 0.91 0.7504 26.455 839.99 64.80 65.55 0.92 0.756 26.652 846.27 65.51 66.26 0.93 0.7612 26.835 852.09 66.23 66.98 0.94 0.7662 27.012 857.70 66.94 67.69 0.95 0.7707 27.170 862.74 67.65 68.40 0.96 0.7749 27.318 867.45 68.36 69.11 0.97 0.7785 27.445 871.48 69.08 69.83 0.98 0.7816 27.554 874.96 69.79 70.54 0.99 0.7841 27.643 877.76 70.50 71.25 1 0.7854 27.688 879.21

C-1
Appendix C Barometric Pressure and Temperature Data

C-2

C-3

C-4

D-1
Appendix D Veeder-Root Test Data
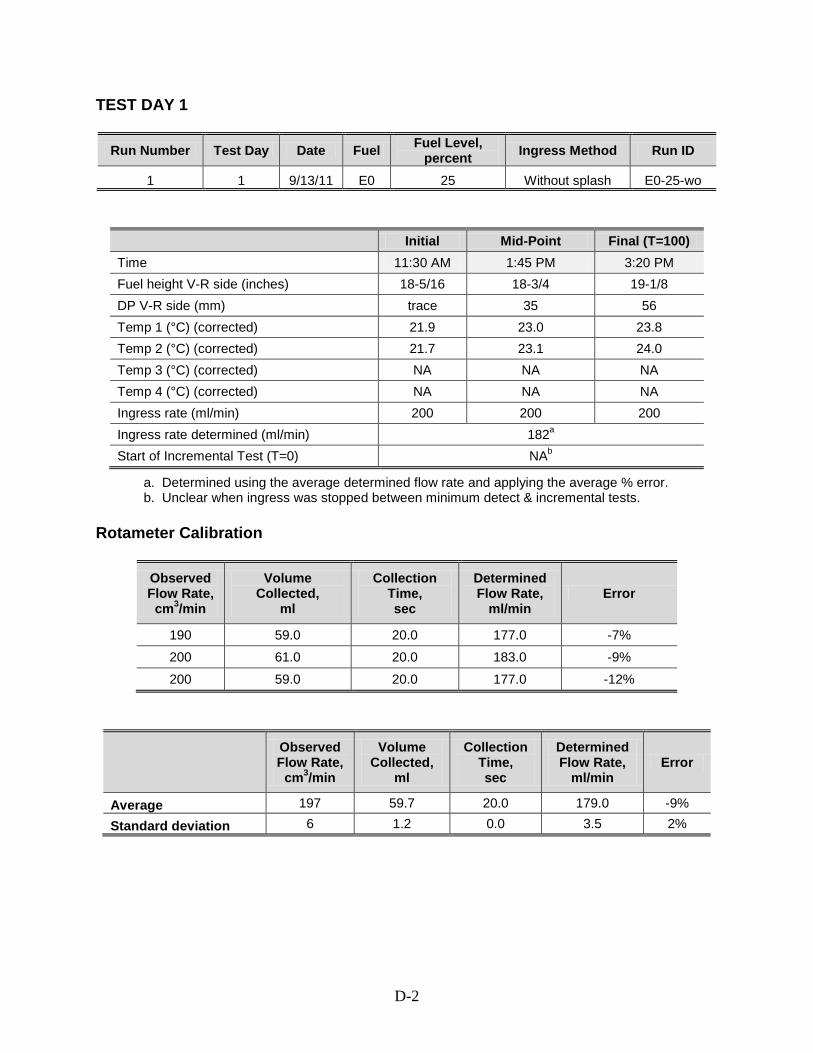
D-2
TEST DAY 1
Run Number Test Day Date Fuel Fuel Level, percent Ingress Method Run ID
1 1 9/13/11 E0 25 Without splash E0-25-wo
Initial Mid-Point Final (T=100) Time 11:30 AM 1:45 PM 3:20 PM Fuel height V-R side (inches) 18-5/16 18-3/4 19-1/8 DP V-R side (mm) trace 35 56 Temp 1 (°C) (corrected) 21.9 23.0 23.8 Temp 2 (°C) (corrected) 21.7 23.1 24.0 Temp 3 (°C) (corrected) NA NA NA Temp 4 (°C) (corrected) NA NA NA Ingress rate (ml/min) 200 200 200 Ingress rate determined (ml/min) 182a
Start of Incremental Test (T=0) NAb
a. Determined using the average determined flow rate and applying the average % error. b. Unclear when ingress was stopped between minimum detect & incremental tests. Rotameter Calibration
Observed Flow Rate,
cm3/min
Volume Collected,
ml
Collection Time, sec
Determined Flow Rate,
ml/min Error
190 59.0 20.0 177.0 -7% 200 61.0 20.0 183.0 -9%
200 59.0 20.0 177.0 -12%
Observed Flow Rate,
cm3/min
Volume Collected,
ml
Collection Time, sec
Determined Flow Rate,
ml/min Error
Average 197 59.7 20.0 179.0 -9%
Standard deviation 6 1.2 0.0 3.5 2%

D-3
Minimum Detection Height Test
Technology Time at Alarm
Observed Dense Phase
Height, mm
Observed Dense Phase
Height, inches
Technology Dense Phase
Height, inches
Elapsed Time to Alarm,
min
Water Volume to
Alarm, ml
Water Volume to Alarm,
gal
VR Phase 2 12:18 PMa 15 0.59 0.40a 48 8,741 2.31 VR STD Water 12:18 PM 15 0.59 0.67a 48 8,741 2.31
a. Readings are not exactly at initial times, however within several seconds and a couple hundredths of an inch. Smallest Detection Increment Test
Elapsed Time, min
Observed Dense Phase Height,
mm
Observed Dense Phase Height, inches
STD Water Technology,
inches
Phase-Two™
Technology, inches
Cumulative Water Added Since T = 0,
ml
Cumulative Water Added Since T = 0,
gal
Cumulative Total Water
Added to Test Vessel,
gal 0 35 1.38 1.40 1.15 0 0.00 6.49 10 37 1.46 1.50 1.23 1,821 0.48 6.98 20 39.5 1.56 1.59 1.31 3,642 0.96 7.46 30 41.2 1.62 1.67 1.40 5,463 1.44 7.94 40 43.5 1.71 1.76 1.49 7,284 1.92 8.42 50 46 1.81 1.84 1.57 9,105 2.41 8.90 60 48 1.89 1.92 1.65 10,926 2.89 9.38 70 50 1.97 2.00 1.73 12,747 3.37 9.86 80 52 2.05 2.08 1.81 14,568 3.85 10.34 90 53.5 2.11 2.15 1.88 16,389 4.33 10.82 100 56 2.20 2.23 1.95 18,211 4.81 11.31

D-4
Smallest Detection Increment Difference
Increment Number
Measured Depth, inches
Measured Incremental
Change, inches
Phase-Two™
Technology Depth, inches
Phase-Two™
Technology Incremental
Change, inches
Delta Incremental
Change, (Technology – Measured)
inches Time 0 1.38 1.15
1 1.46 0.079 1.23 0.080 0.001
2 1.56 0.098 1.31 0.080 -0.018
3 1.62 0.067 1.40 0.090 0.023
4 1.71 0.091 1.49 0.090 -0.001
5 1.81 0.098 1.57 0.080 -0.018
6 1.89 0.079 1.65 0.080 0.001
7 1.97 0.079 1.73 0.080 0.001
8 2.05 0.079 1.81 0.080 0.001
9 2.11 0.059 1.88 0.070 0.011
10 2.20 0.098 1.95 0.070 -0.028 Shading indicates that no measurement was taken.
Increment Number
Measured Depth, inches
Measured Incremental
Change, inches
STD Water Technology
Depth, inches
STD Water Technology Incremental
Change, inches
Delta Incremental
Change, (Technology – Measured)
inches Time 0 1.38 1.40
1 1.46 0.079 1.50 0.100 0.021
2 1.56 0.098 1.59 0.090 -0.008
3 1.62 0.067 1.67 0.080 0.013
4 1.71 0.091 1.76 0.090 -0.001
5 1.81 0.098 1.84 0.080 -0.018
6 1.89 0.079 1.92 0.080 0.001
7 1.97 0.079 2.00 0.080 0.001
8 2.05 0.079 2.08 0.080 0.001
9 2.11 0.059 2.15 0.070 0.011
10 2.20 0.098 2.23 0.080 -0.018 Shading indicates that no measurement was taken.

D-5
TEST DAY 2
Run Number Test Day Date Fuel Fuel Level, percent
Ingress Method Run ID
3 2 9/14/11 E0 25 With splash E0-25-w
Initial Mid-Point Final (T=100) Time 12:40 PM 1:44 PM 3:56 PM Fuel height V-R side (inches) 18-3/16 18-3/8 18-3/4 DP V-R side (mm) trace 20.5 45 Temp 1 (°C) (corrected) 20.7 20.8 21.0 Temp 2 (°C) (corrected) 20.3 20.5 20.7 Temp 3 (°C) (corrected) NA NA NA Temp 4 (°C) (corrected) NA NA NA Ingress rate (ml/min) 200 200 200 Ingress rate determined (ml/min) 177a
Start of incremental test (T=0) 2:16 PM
a. Determined using the average determined flow rate and applying the average % error. Rotameter Calibration
Observed Flow Rate,
cm3/min Volume Collected,
ml Collection
Time, sec
Determined Flow Rate,
ml/min Error
195 58.0 20.0 174.0 -11% 190 56.0 20.0 168.0 -12% 180 53.0 20.0 159.0 -12%
Observed Flow Rate,
cm3/min
Volume Collected,
ml
Collection Time, sec
Determined Flow Rate,
ml/min Error
Average 188 55.7 20.0 167.0 -11%
Standard deviation 8 2.5 0.0 7.5 0%

D-6
Minimum Detection Height Test
Technology Time at Alarm
Observed Dense Phase
Height, mm
Observed Dense Phase
Height, inches
Technology Dense Phase
Height, inches
Elapsed Time to Alarm,
min
Water Volume to
Alarm, ml
Water Volume to Alarm,
gal
VR Phase 2 1:28 PM 16 0.63 0.38 48 8,512 2.25 VR STD Water 1:27 PM 16 0.63 0.64a 47 8,334 2.20
a. Readings are not exactly at initial times, however within several seconds and a couple hundredths of an inch. Smallest Detection Increment Test
Elapsed Time, min
Observed Dense Phase Height,
mm
Observed Dense Phase Height, inches
STD Water Technology,
inches
Phase-Two™
Technology, inches
Cumulative Water Added Since T = 0,
ml
Cumulative Water Added Since T = 0,
gal
Cumulative Total Water
Added to Test Vessel,
gal 0 21 0.83 0.86 0.60 0 0.00 3.00 10 23.5 0.93 0.97 0.71 1,773 0.47 3.47 20 26.5 1.04 1.07 0.81 3,546 0.94 3.93 30 29 1.14 1.18 0.91 5,320 1.41 4.40 40 31.5 1.24 1.27 1.01 7,093 1.87 4.87 50 34 1.34 1.37 1.10 8,866 2.34 5.34 60 36 1.42 1.46 1.19 10,639 2.81 5.81 70 38.5 1.52 1.55 1.28a 12,413 3.28 6.28 80 41 1.61 1.64 1.37 14,186 3.75 6.75 90 43 1.69 1.72 1.45 15,959 4.22 7.21 100 45 1.77 1.80 1.53 17,732 4.68 7.68
a. Reading was changed from 1.29 to correspond with the raw data.

D-7
Smallest Detection Increment Difference
Increment Number
Measured Depth, inches
Measured Incremental
Change, inches
Phase-Two™
Technology Depth, inches
Phase-Two™
Technology Incremental
Change, inches
Delta Incremental
Change, (Technology – Measured)
inches Time 0 0.83 0.60
1 0.93 0.098 0.71 0.110 0.012
2 1.04 0.118 0.81 0.100 -0.018
3 1.14 0.098 0.91 0.100 0.002
4 1.24 0.098 1.01 0.100 0.002
5 1.34 0.098 1.10 0.090 -0.008
6 1.42 0.079 1.19 0.090 0.011
7 1.52 0.098 1.28 0.090 -0.008
8 1.61 0.098 1.37 0.090 -0.008
9 1.69 0.079 1.45 0.080 0.001
10 1.77 0.079 1.53 0.080 0.001
Shading indicates that no measurement was taken.
Increment Number
Measured Depth, inches
Measured Incremental
Change, inches
STD Water Technology
Depth, inches
STD Water Technology Incremental
Change, inches
Delta Incremental
Change, (Technology – Measured)
inches Time 0 0.83 0.86
1 0.93 0.098 0.97 0.110 0.012
2 1.04 0.118 1.07 0.100 -0.018
3 1.14 0.098 1.18 0.110 0.012
4 1.24 0.098 1.27 0.090 -0.008
5 1.34 0.098 1.37 0.100 0.002
6 1.42 0.079 1.46 0.090 0.011
7 1.52 0.098 1.55 0.090 -0.008
8 1.61 0.098 1.64 0.090 -0.008
9 1.69 0.079 1.72 0.080 0.001
10 1.77 0.079 1.80 0.080 0.001
Shading indicates that no measurement was taken.
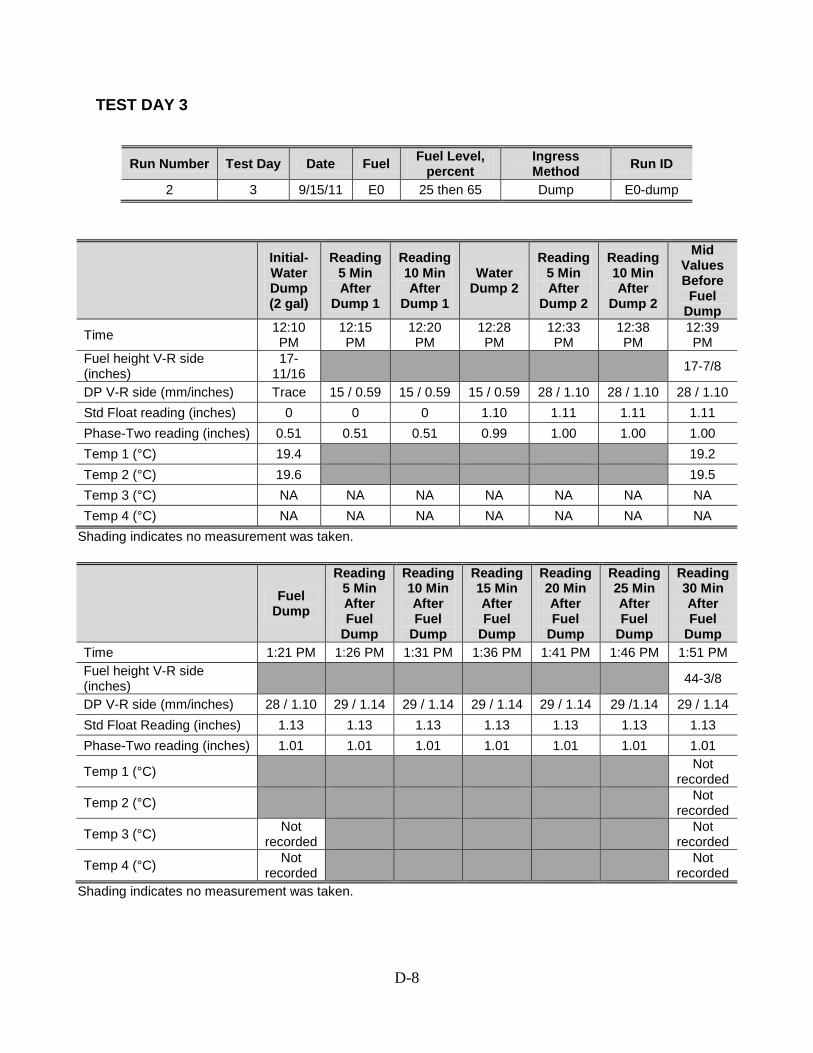
D-8
TEST DAY 3
Run Number Test Day Date Fuel Fuel Level, percent
Ingress Method Run ID
2 3 9/15/11 E0 25 then 65 Dump E0-dump
Initial-Water Dump (2 gal)
Reading 5 Min After
Dump 1
Reading 10 Min After
Dump 1
Water Dump 2
Reading 5 Min After
Dump 2
Reading 10 Min After
Dump 2
Mid Values Before Fuel
Dump
Time 12:10 PM
12:15 PM
12:20 PM
12:28 PM
12:33 PM
12:38 PM
12:39 PM
Fuel height V-R side (inches)
17-11/16 17-7/8
DP V-R side (mm/inches) Trace 15 / 0.59 15 / 0.59 15 / 0.59 28 / 1.10 28 / 1.10 28 / 1.10 Std Float reading (inches) 0 0 0 1.10 1.11 1.11 1.11 Phase-Two reading (inches) 0.51 0.51 0.51 0.99 1.00 1.00 1.00 Temp 1 (°C) 19.4 19.2 Temp 2 (°C) 19.6 19.5 Temp 3 (°C) NA NA NA NA NA NA NA Temp 4 (°C) NA NA NA NA NA NA NA
Shading indicates no measurement was taken.
Fuel
Dump
Reading 5 Min After Fuel
Dump
Reading 10 Min After Fuel
Dump
Reading 15 Min After Fuel
Dump
Reading 20 Min After Fuel
Dump
Reading 25 Min After Fuel
Dump
Reading 30 Min After Fuel
Dump Time 1:21 PM 1:26 PM 1:31 PM 1:36 PM 1:41 PM 1:46 PM 1:51 PM Fuel height V-R side (inches) 44-3/8
DP V-R side (mm/inches) 28 / 1.10 29 / 1.14 29 / 1.14 29 / 1.14 29 / 1.14 29 /1.14 29 / 1.14 Std Float Reading (inches) 1.13 1.13 1.13 1.13 1.13 1.13 1.13 Phase-Two reading (inches) 1.01 1.01 1.01 1.01 1.01 1.01 1.01 Temp 1 (°C)
Not recorded
Temp 2 (°C) Not
recorded
Temp 3 (°C) Not recorded
Not recorded
Temp 4 (°C) Not recorded
Not recorded
Shading indicates no measurement was taken.

D-9
TEST DAY 4
Run Number Test Day Date Fuel Fuel Level, percent Ingress Method Run ID
8 4 9/16/11 E0 65 Without splash E0-65-wo
Initial Mid-Point Final (T=100) Time 12:13 PM 1:17 PM 3:22 PM Fuel height V-R side (inches) 44-1/2 44-3/8 45 DP V-R side (mm) trace 20 43 Temp 1 (°C) (corrected) 18.5 18.3 18.2 Temp 2 (°C) (corrected) 17.9 17.9 17.8 Temp 3 (°C) (corrected) 19.2 18.8 18.5 Temp 4 (°C) (corrected) 18.8 18.3 18.0 Ingress rate (ml/min) 200 200 200 Ingress rate determined (ml/min) 179a
Start of incremental test (T=0) 1:42 PM
a. Determined using the average determined flow rate and applying the average % error. Rotameter Calibration
Observed Flow Rate,
cm3/min
Volume Collected,
ml
Collection Time, sec
Determined Flow Rate,
ml/min Error
200 55.5 20.3 164.0 -18% 200 63.0 20.3 186.2 -7% 200 62.0 19.9 186.9 -7%
Observed Flow Rate,
cm3/min
Volume Collected,
ml
Collection Time, sec
Determined Flow Rate,
ml/min Error
Average 200 60.2 20.2 179.1 -10% Standard deviation 0 4.1 0.2 13.0 7%

D-10
Minimum Detection Height Test
Technology Time at Alarm
Observed Dense Phase
Height, mm
Observed Dense Phase
Height, inches
Technology Dense Phase
Height, inches
Elapsed Time to Alarm,
min
Water Volume to
Alarm, ml
Water Volume to Alarm,
gal
VR Phase 2 1:00 PMa 16 0.63 0.38 47 8,416 2.22 VR STD Water 12:58 PM 16 0.63 0.633 45 8,058 2.13
a. Readings are not exactly at initial times, however within several seconds and a couple hundredths of an inch. Smallest Detection Increment Test
Elapsed Time, min
Observed Dense Phase Height,
mm
Observed Dense Phase Height, inches
STD Water Technology,
inches
Phase-Two™
Technology, inches
Cumulative Water Added Since T = 0,
ml
Cumulative Water Added Since T = 0,
gal
Cumulative Total Water
Added to Test Vessel,
gal 0 20 0.79 0.84 0.58 0 0.00 3.03
10 23 0.91 0.94 0.68 1,791 0.47 3.50 20 26 1.02 1.04 0.78 3,581 0.95 3.97 30 28 1.10 1.14 0.87a 5,372 1.42 4.45 40 31 1.22 1.23 0.96a 7,162 1.89 4.92 50 33 1.30 1.32a 1.05a 8,953 2.37 5.39 60 36 1.42 1.41 1.14 10,744 2.84 5.87 70 37 1.46 1.49a 1.22 12,534 3.31 6.34 80 39 1.54 1.57a 1.30 14,325 3.78 6.81 90 41 1.61 1.65a 1.38 16,115 4.26 7.28 100 43 1.69 1.73a 1.45a 17,906 4.73 7.76
a. Readings were changed to correspond with the raw data.

D-11
Smallest Detection Increment Difference
Increment Number
Measured Depth, inches
Measured Incremental
Change, inches
Phase-Two™
Technology Depth, inches
Phase-Two™
Technology Incremental
Change, inches
Delta Incremental
Change, (Technology – Measured)
inches Time 0 0.79 0.58
1 0.91 0.118 0.68 0.100 -0.018
2 1.02 0.118 0.78 0.100 -0.018
3 1.10 0.079 0.87 0.090 0.011
4 1.22 0.118 0.96 0.090 -0.028
5 1.30 0.079 1.05 0.090 0.011
6 1.42 0.118 1.14 0.090 -0.028
7 1.46 0.039 1.22 0.080 0.041
8 1.54 0.079 1.30 0.080 0.001
9 1.61 0.079 1.38 0.080 0.001
10 1.69 0.079 1.45 0.070 -0.009
Shading indicates that no measurement was taken.
Increment Number
Measured Depth, inches
Measured Incremental
Change, inches
STD Water Technology
Depth, inches
STD Water Technology Incremental
Change, inches
Delta Incremental
Change, (Technology – Measured)
inches Time 0 0.79 0.84
1 0.91 0.118 0.94 0.100 -0.018
2 1.02 0.118 1.04 0.100 -0.018
3 1.10 0.079 1.14 0.100 0.021
4 1.22 0.118 1.23 0.090 -0.028
5 1.30 0.079 1.32 0.090 0.011
6 1.42 0.118 1.41 0.090 -0.028
7 1.46 0.039 1.49 0.080 0.041
8 1.54 0.079 1.57 0.080 0.001
9 1.61 0.079 1.65 0.080 0.001
10 1.69 0.079 1.73 0.080 0.001
Shading indicates that no measurement was taken.

D-12
TEST DAY 5 AM
Run Number Test Day Date Fuel Fuel Level, percent
Ingress Method Run ID
9 5 9/19/11 E0 65 With splash E0-65-w
Initial Mid-Point Final (T=100) Time 10:14 AM 11:11 AM 1:03 PM Fuel height V-R side (inches) 44-13/16 45 45-5/16 DP V-R side (mm) trace 18 43 Temp 1 (°C) (corrected) 17.9 18.0 18.1 Temp 2 (°C) (corrected) 17.6 17.6 17.8 Temp 3 (°C) (corrected) 18.0 18.0 18.1 Temp 4 (°C) (corrected) 17.6 17.5 17.7 Ingress rate (ml/min) 200 200 200 Ingress rate determined (ml/min) 183a
Start of incremental test (T=0) 11:23 AM
a. Determined using the average determined flow rate and applying the average % error. Rotameter Calibration
Observed Flow Rate,
cm3/min
Volume Collected,
ml
Collection Time, sec
Determined Flow Rate,
ml/min Error
210 64.0 20.0 192.0 -9% 210 61.5 20.0 184.5 -12% 200 63.5 20.0 190.5 -5%
Observed Flow Rate,
cm3/min
Volume Collected,
ml
Collection Time, sec
Determined Flow Rate,
ml/min Error
Average 207 63.0 20.0 189.0 -8% Standard deviation 6 1.3 0.0 4.0 4%
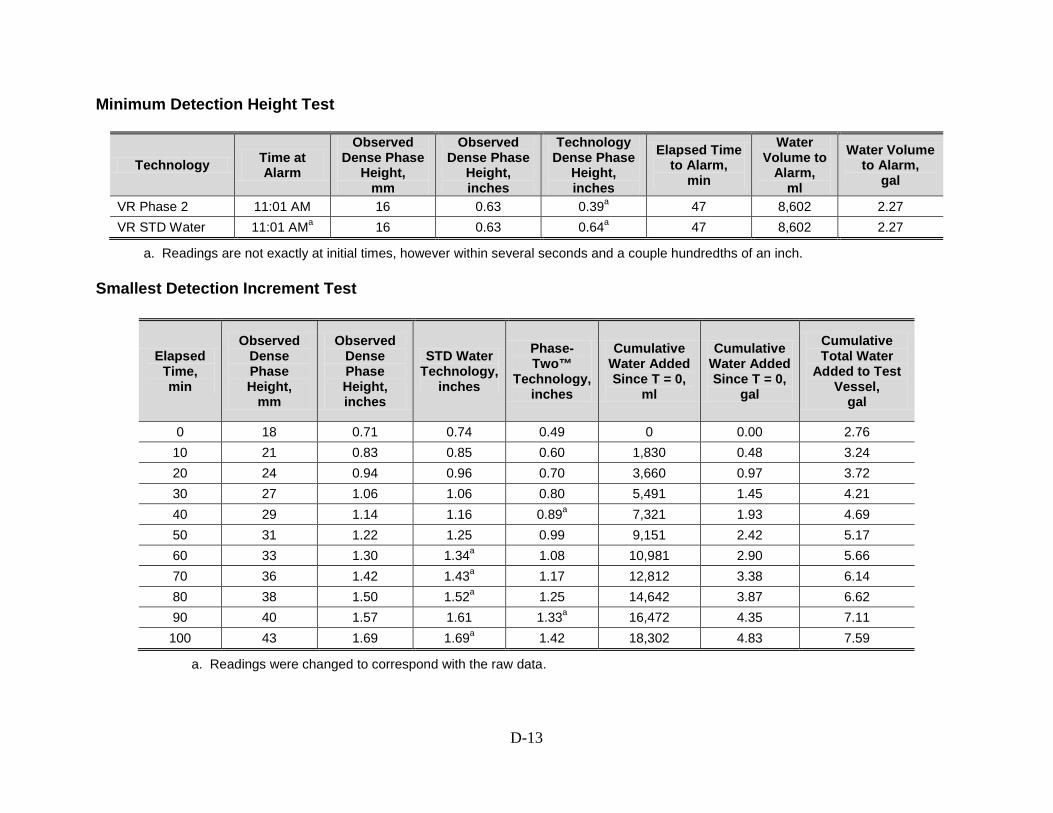
D-13
Minimum Detection Height Test
Technology Time at Alarm
Observed Dense Phase
Height, mm
Observed Dense Phase
Height, inches
Technology Dense Phase
Height, inches
Elapsed Time to Alarm,
min
Water Volume to
Alarm, ml
Water Volume to Alarm,
gal
VR Phase 2 11:01 AM 16 0.63 0.39a 47 8,602 2.27 VR STD Water 11:01 AMa 16 0.63 0.64a 47 8,602 2.27
a. Readings are not exactly at initial times, however within several seconds and a couple hundredths of an inch. Smallest Detection Increment Test
Elapsed Time, min
Observed Dense Phase Height,
mm
Observed Dense Phase Height, inches
STD Water Technology,
inches
Phase-Two™
Technology, inches
Cumulative Water Added Since T = 0,
ml
Cumulative Water Added Since T = 0,
gal
Cumulative Total Water
Added to Test Vessel,
gal
0 18 0.71 0.74 0.49 0 0.00 2.76 10 21 0.83 0.85 0.60 1,830 0.48 3.24 20 24 0.94 0.96 0.70 3,660 0.97 3.72 30 27 1.06 1.06 0.80 5,491 1.45 4.21 40 29 1.14 1.16 0.89a 7,321 1.93 4.69 50 31 1.22 1.25 0.99 9,151 2.42 5.17 60 33 1.30 1.34a 1.08 10,981 2.90 5.66 70 36 1.42 1.43a 1.17 12,812 3.38 6.14 80 38 1.50 1.52a 1.25 14,642 3.87 6.62 90 40 1.57 1.61 1.33a 16,472 4.35 7.11 100 43 1.69 1.69a 1.42 18,302 4.83 7.59
a. Readings were changed to correspond with the raw data.
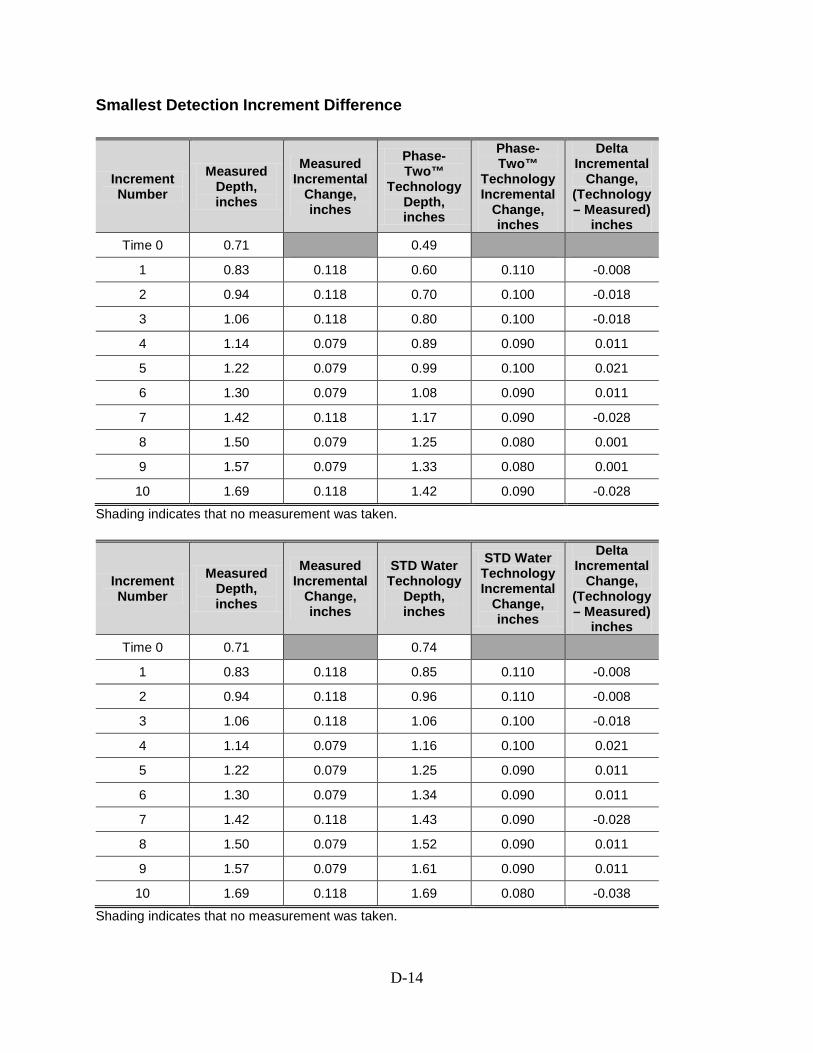
D-14
Smallest Detection Increment Difference
Increment Number
Measured Depth, inches
Measured Incremental
Change, inches
Phase-Two™
Technology Depth, inches
Phase-Two™
Technology Incremental
Change, inches
Delta Incremental
Change, (Technology – Measured)
inches Time 0 0.71 0.49
1 0.83 0.118 0.60 0.110 -0.008
2 0.94 0.118 0.70 0.100 -0.018
3 1.06 0.118 0.80 0.100 -0.018
4 1.14 0.079 0.89 0.090 0.011
5 1.22 0.079 0.99 0.100 0.021
6 1.30 0.079 1.08 0.090 0.011
7 1.42 0.118 1.17 0.090 -0.028
8 1.50 0.079 1.25 0.080 0.001
9 1.57 0.079 1.33 0.080 0.001
10 1.69 0.118 1.42 0.090 -0.028
Shading indicates that no measurement was taken.
Increment Number
Measured Depth, inches
Measured Incremental
Change, inches
STD Water Technology
Depth, inches
STD Water Technology Incremental
Change, inches
Delta Incremental
Change, (Technology – Measured)
inches Time 0 0.71 0.74
1 0.83 0.118 0.85 0.110 -0.008
2 0.94 0.118 0.96 0.110 -0.008
3 1.06 0.118 1.06 0.100 -0.018
4 1.14 0.079 1.16 0.100 0.021
5 1.22 0.079 1.25 0.090 0.011
6 1.30 0.079 1.34 0.090 0.011
7 1.42 0.118 1.43 0.090 -0.028
8 1.50 0.079 1.52 0.090 0.011
9 1.57 0.079 1.61 0.090 0.011
10 1.69 0.118 1.69 0.080 -0.038
Shading indicates that no measurement was taken.

D-15
TEST DAY 5 PM
Run Number Test Day Date Fuel Fuel Level, percent Ingress Method Run ID
12 5 9/19/2011 E0 65 Without splash E0-65-wo-DUP
Initial Mid-Point Final (T=100) Time 1:55 PM 2:49 PM 4:36 PM Fuel height V-R side (inches) 44-3/4 44-15/16 45-3/16 DP V-R side (mm) trace 19 43 Temp 1 (°C) (corrected) 18.2 18.2 18.4 Temp 2 (°C) (corrected) 17.9 17.9 18.1 Temp 3 (°C) (corrected) 18.2 18.2 18.3 Temp 4 (°C) (corrected) 17.7 17.8 17.8 Ingress rate (ml/min) 200 200 200 Ingress rate determined (ml/min) 183a
Start of incremental test (T=0) 2:56 PM
a. Determined using the average determined flow rate and applying the average % error. Rotameter Calibration
Observed Flow Rate,
cm3/min Volume Collected,
ml Collection
Time, sec
Determined Flow Rate,
ml/min Error
210 64.0 20.0 192.0 -9% 210 61.5 20.0 184.5 -12% 200 63.5 20.0 190.5 -5%
Observed Flow Rate,
cm3/min
Volume Collected,
ml
Collection Time, sec
Determined Flow Rate,
ml/min Error
Average 207 63.0 20.0 189.0 -8% Standard deviation 6 1.3 0.0 4.0 4%
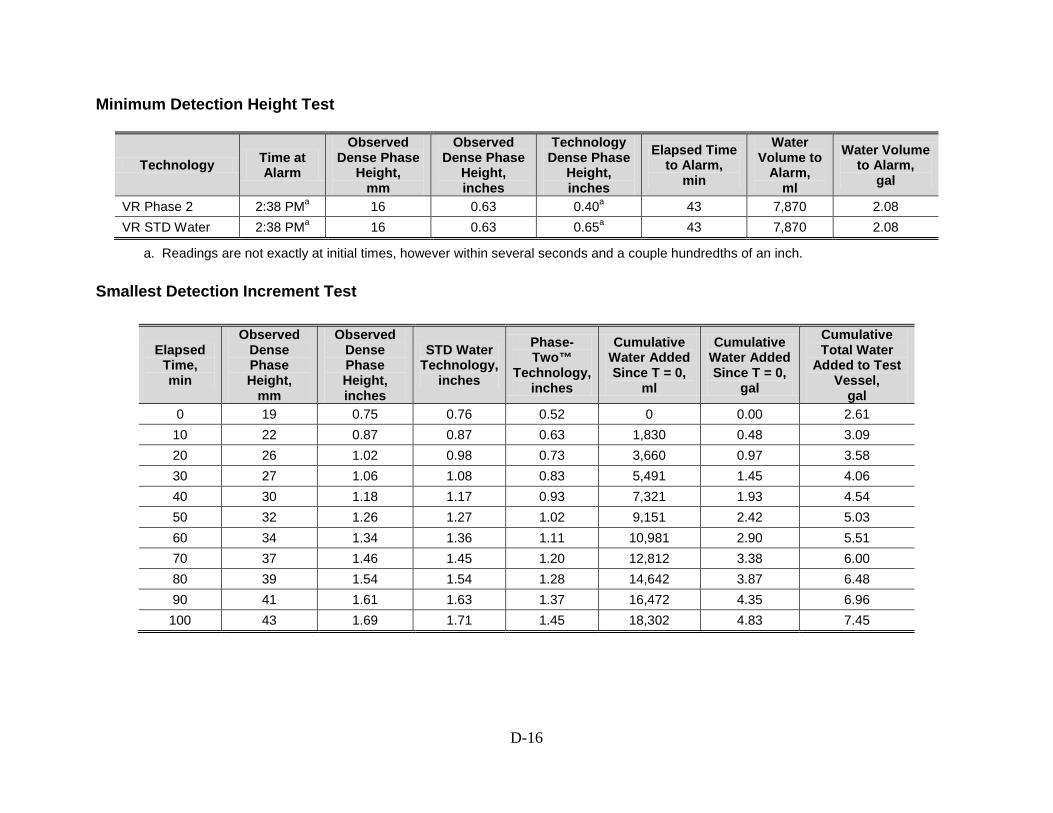
D-16
Minimum Detection Height Test
Technology Time at Alarm
Observed Dense Phase
Height, mm
Observed Dense Phase
Height, inches
Technology Dense Phase
Height, inches
Elapsed Time to Alarm,
min
Water Volume to
Alarm, ml
Water Volume to Alarm,
gal
VR Phase 2 2:38 PMa 16 0.63 0.40a 43 7,870 2.08 VR STD Water 2:38 PMa 16 0.63 0.65a 43 7,870 2.08
a. Readings are not exactly at initial times, however within several seconds and a couple hundredths of an inch. Smallest Detection Increment Test
Elapsed Time, min
Observed Dense Phase Height,
mm
Observed Dense Phase Height, inches
STD Water Technology,
inches
Phase-Two™
Technology, inches
Cumulative Water Added Since T = 0,
ml
Cumulative Water Added Since T = 0,
gal
Cumulative Total Water
Added to Test Vessel,
gal 0 19 0.75 0.76 0.52 0 0.00 2.61
10 22 0.87 0.87 0.63 1,830 0.48 3.09 20 26 1.02 0.98 0.73 3,660 0.97 3.58 30 27 1.06 1.08 0.83 5,491 1.45 4.06 40 30 1.18 1.17 0.93 7,321 1.93 4.54 50 32 1.26 1.27 1.02 9,151 2.42 5.03 60 34 1.34 1.36 1.11 10,981 2.90 5.51 70 37 1.46 1.45 1.20 12,812 3.38 6.00 80 39 1.54 1.54 1.28 14,642 3.87 6.48 90 41 1.61 1.63 1.37 16,472 4.35 6.96 100 43 1.69 1.71 1.45 18,302 4.83 7.45

D-17
Smallest Detection Increment Difference
Increment Number
Measured Depth, inches
Measured Incremental
Change, inches
Phase-Two™
Technology Depth, inches
Phase-Two™
Technology Incremental
Change, inches
Delta Incremental
Change, (Technology – Measured)
inches Time 0 0.75 0.52
1 0.87 0.118 0.63 0.110 -0.008
2 1.02 0.157 0.73 0.100 -0.057
3 1.06 0.039 0.83 0.100 0.061
4 1.18 0.118 0.93 0.100 -0.018
5 1.26 0.079 1.02 0.090 0.011
6 1.34 0.079 1.11 0.090 0.011
7 1.46 0.118 1.20 0.090 -0.028
8 1.54 0.079 1.28 0.080 0.001
9 1.61 0.079 1.37 0.090 0.011
10 1.69 0.079 1.45 0.080 0.001
Shading indicates that no measurement was taken.
Increment Number
Measured Depth, inches
Measured Incremental
Change, inches
STD Water Technology
Depth, inches
STD Water Technology Incremental
Change, inches
Delta Incremental
Change, (Technology – Measured)
inches Time 0 0.75 0.76
1 0.87 0.118 0.87 0.110 -0.008
2 1.02 0.157 0.98 0.110 -0.047
3 1.06 0.039 1.08 0.100 0.061
4 1.18 0.118 1.17 0.090 -0.028
5 1.26 0.079 1.27 0.100 0.021
6 1.34 0.079 1.36 0.090 0.011
7 1.46 0.118 1.45 0.090 -0.028
8 1.54 0.079 1.54 0.090 0.011
9 1.61 0.079 1.63 0.090 0.011
10 1.69 0.079 1.71 0.080 0.001
Shading indicates that no measurement was taken.
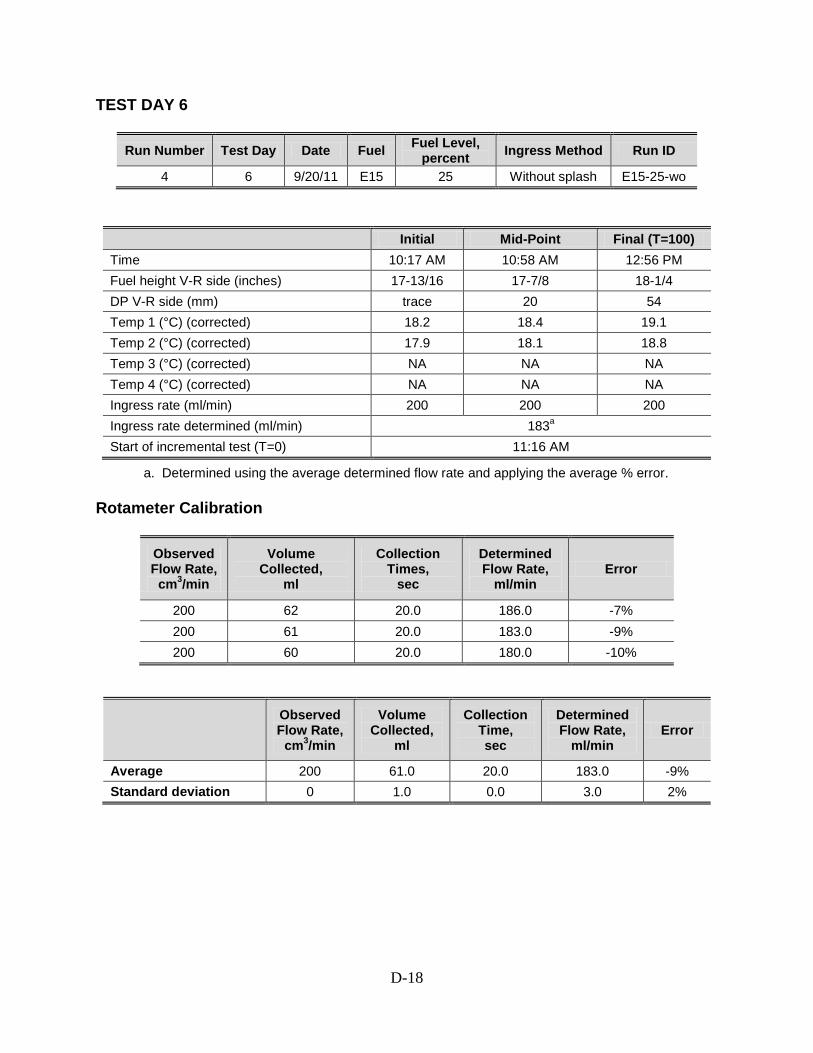
D-18
TEST DAY 6
Run Number Test Day Date Fuel Fuel Level, percent Ingress Method Run ID
4 6 9/20/11 E15 25 Without splash E15-25-wo
Initial Mid-Point Final (T=100) Time 10:17 AM 10:58 AM 12:56 PM Fuel height V-R side (inches) 17-13/16 17-7/8 18-1/4 DP V-R side (mm) trace 20 54 Temp 1 (°C) (corrected) 18.2 18.4 19.1 Temp 2 (°C) (corrected) 17.9 18.1 18.8 Temp 3 (°C) (corrected) NA NA NA Temp 4 (°C) (corrected) NA NA NA Ingress rate (ml/min) 200 200 200 Ingress rate determined (ml/min) 183a
Start of incremental test (T=0) 11:16 AM
a. Determined using the average determined flow rate and applying the average % error. Rotameter Calibration
Observed Flow Rate,
cm3/min
Volume Collected,
ml
Collection Times,
sec
Determined Flow Rate,
ml/min Error
200 62 20.0 186.0 -7% 200 61 20.0 183.0 -9% 200 60 20.0 180.0 -10%
Observed Flow Rate,
cm3/min
Volume Collected,
ml
Collection Time, sec
Determined Flow Rate,
ml/min Error
Average 200 61.0 20.0 183.0 -9% Standard deviation 0 1.0 0.0 3.0 2%
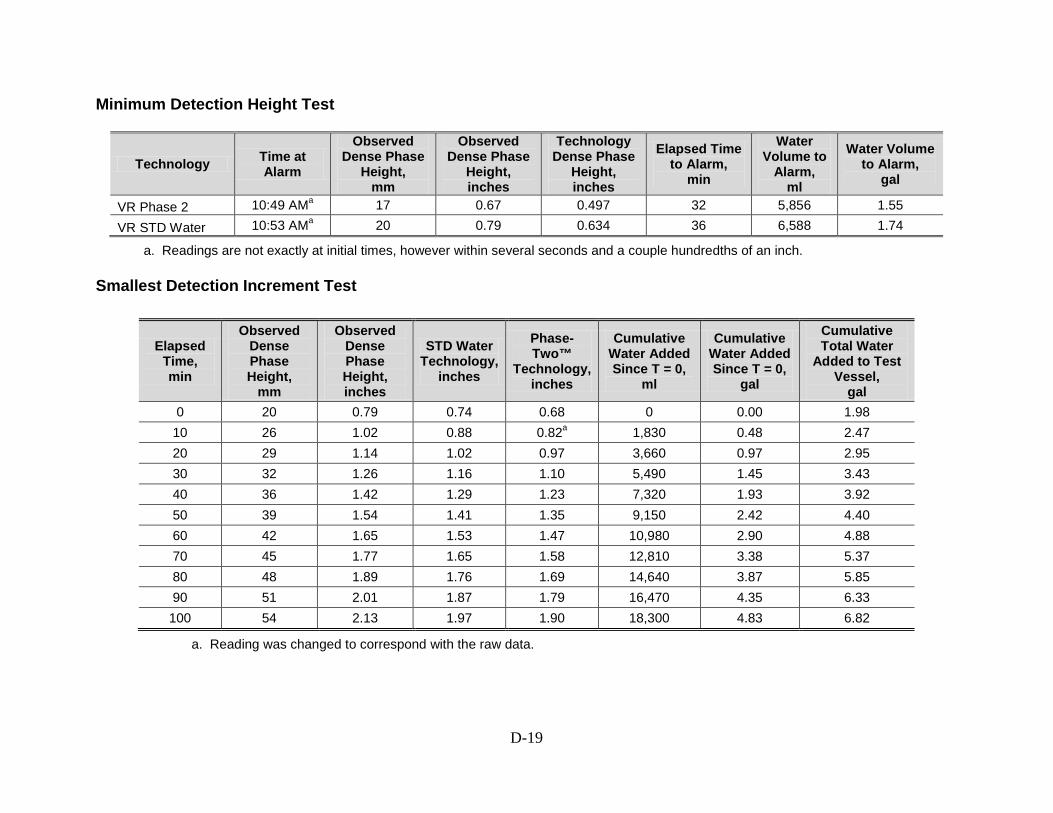
D-19
Minimum Detection Height Test
Technology Time at Alarm
Observed Dense Phase
Height, mm
Observed Dense Phase
Height, inches
Technology Dense Phase
Height, inches
Elapsed Time to Alarm,
min
Water Volume to
Alarm, ml
Water Volume to Alarm,
gal
VR Phase 2 10:49 AMa 17 0.67 0.497 32 5,856 1.55
VR STD Water 10:53 AMa 20 0.79 0.634 36 6,588 1.74 a. Readings are not exactly at initial times, however within several seconds and a couple hundredths of an inch. Smallest Detection Increment Test
Elapsed Time, min
Observed Dense Phase Height,
mm
Observed Dense Phase Height, inches
STD Water Technology,
inches
Phase-Two™
Technology, inches
Cumulative Water Added Since T = 0,
ml
Cumulative Water Added Since T = 0,
gal
Cumulative Total Water
Added to Test Vessel,
gal 0 20 0.79 0.74 0.68 0 0.00 1.98
10 26 1.02 0.88 0.82a 1,830 0.48 2.47 20 29 1.14 1.02 0.97 3,660 0.97 2.95 30 32 1.26 1.16 1.10 5,490 1.45 3.43 40 36 1.42 1.29 1.23 7,320 1.93 3.92 50 39 1.54 1.41 1.35 9,150 2.42 4.40 60 42 1.65 1.53 1.47 10,980 2.90 4.88 70 45 1.77 1.65 1.58 12,810 3.38 5.37 80 48 1.89 1.76 1.69 14,640 3.87 5.85 90 51 2.01 1.87 1.79 16,470 4.35 6.33 100 54 2.13 1.97 1.90 18,300 4.83 6.82
a. Reading was changed to correspond with the raw data.

D-20
Smallest Detection Increment Difference
Increment Number
Measured Depth, inches
Measured Incremental
Change, inches
Phase-Two™
Technology Depth, inches
Phase-Two™
Technology Incremental
Change, inches
Delta Incremental
Change, (Technology – Measured)
inches Time 0 0.79 0.68
1 1.02 0.236 0.82 0.140 -0.096
2 1.14 0.118 0.97 0.150 0.032
3 1.26 0.118 1.10 0.130 0.012
4 1.42 0.157 1.23 0.130 -0.027
5 1.54 0.118 1.35 0.120 0.002
6 1.65 0.118 1.47 0.120 0.002
7 1.77 0.118 1.58 0.110 -0.008
8 1.89 0.118 1.69 0.110 -0.008
9 2.01 0.118 1.79 0.100 -0.018
10 2.13 0.118 1.90 0.110 -0.008
Shading indicates that no measurement was taken.
Increment Number
Measured Depth, inches
Measured Incremental
Change, inches
STD Water Technology
Depth, inches
STD Water Technology Incremental
Change, inches
Delta Incremental
Change, (Technology – Measured)
inches Time 0 0.79 0.74
1 1.02 0.236 0.88 0.140 -0.096
2 1.14 0.118 1.02 0.140 0.022
3 1.26 0.118 1.16 0.140 0.022
4 1.42 0.157 1.29 0.130 -0.027
5 1.54 0.118 1.41 0.120 0.002
6 1.65 0.118 1.53 0.120 0.002
7 1.77 0.118 1.65 0.120 0.002
8 1.89 0.118 1.76 0.110 -0.008
9 2.01 0.118 1.87 0.110 -0.008
10 2.13 0.118 1.97 0.100 -0.018
Shading indicates that no measurement was taken.

D-21
TEST DAY 7 AM
Run Number Test Day Date Fuel Fuel Level, percent
Ingress Method Run ID
7 7 9/21/11 E15 25 With splash E15-25-w
Initial Mid-Point Final (T=100) Time 9:36 AM 10:11 AM 12:14 PM Fuel height V-R side (inches) 16-13/16 16-15/16 17-1/4 DP V-R side (mm) trace 35 79 Temp 1 (°C) (corrected) 18.9 19.2 20.7 Temp 2 (°C) (corrected) 18.6 18.9 20.1 Temp 3 (°C) (corrected) NA NA NA Temp 4 (°C) (corrected) NA NA NA Ingress rate (ml/min) 200 200 200 Ingress rate determined (ml/min) 176a
Start of incremental test (T=0) 10:34 AM
a. Determined using the average determined flow rate and applying the average % error. Rotameter Calibration
Observed Flow Rate,
cm3/min
Volume Collected,
ml
Collection Time, sec
Determined Flow Rate,
ml/min Error
200 59.0 20.0 177.0 -12% 200 58.0 20.0 174.0 -13% 200 59.0 20.0 177.1 -11%
Observed Flow Rate,
cm3/min
Volume Collected,
ml
Collection Time, sec
Determined Flow Rate,
ml/min Error
Average 200 58.7 20.0 176.0 -12% Standard deviation 0 0.6 0.0 1.8 1%

D-22
Minimum Detection Height Test
Technology Time at Alarm
Observed Dense Phase
Height, mm
Observed Dense Phase
Height, inches
Technology Dense Phase
Height, inches
Elapsed Time to Alarm,
min
Water Volume to
Alarm, ml
Water Volume to Alarm,
gal
VR Phase 2 9:56 AMa 24 0.94 0.45a 20 3,521 0.93 VR STD Water 10:05 AMa 30 1.18 0.67a 29 5,105 1.35
a. Readings are not exactly at initial times, however within several seconds and a couple hundredths of an inch. Smallest Detection Increment Test
Elapsed Time, min
Observed Dense Phase Height,
mm
Observed Dense Phase Height, inches
STD Water Technology,
inches
Phase-Two™
Technology, inches
Cumulative Water Added Since T = 0,
ml
Cumulative Water Added Since T = 0,
gal
Cumulative Total Water
Added to Test Vessel,
gal 0 35 1.38 0.84 0.88 0 0.00 1.63
10 41 1.61 1.06 1.11 1,760 0.47 2.09 20 47 1.85 1.27 1.33 3,521 0.93 2.56 30 53 2.09 1.47 1.54 5,281 1.40 3.02 40 58 2.28 1.66 1.72 7,041 1.86 3.49 50 62 2.44 1.83 1.90 8,802 2.33 3.95 60 65 2.56 2.00 2.07 10,562 2.79 4.42 70 69 2.72 2.15 2.22 12,322 3.26 4.88 80 73 2.87 2.30 2.36 14,082 3.72 5.35 90 76 2.99 2.46 2.51 15,843 4.19 5.81 100 79 3.11 2.60 2.65 17,603 4.65 6.28

D-23
Smallest Detection Increment Difference
Increment Number
Measured Depth, inches
Measured Incremental
Change, inches
Phase-Two™
Technology Depth, inches
Phase-Two™
Technology Incremental
Change, inches
Delta Incremental
Change, (Technology – Measured)
inches Time 0 1.38 0.88
1 1.61 0.236 1.11 0.230 -0.006
2 1.85 0.236 1.33 0.220 -0.016
3 2.09 0.236 1.54 0.210 -0.026
4 2.28 0.197 1.72 0.180 -0.017
5 2.44 0.157 1.90 0.180 0.023
6 2.56 0.118 2.07 0.170 0.052
7 2.72 0.157 2.22 0.150 -0.007
8 2.87 0.157 2.36 0.140 -0.017
9 2.99 0.118 2.51 0.150 0.032
10 3.11 0.118 2.65 0.140 0.022
Shading indicates that no measurement was taken.
Increment Number
Measured Depth, inches
Measured Incremental
Change, inches
STD Water Technology
Depth, inches
STD Water Technology Incremental
Change, inches
Delta Incremental
Change, (Technology – Measured)
inches Time 0 1.38 0.84
1 1.61 0.236 1.06 0.220 -0.016
2 1.85 0.236 1.27 0.210 -0.026
3 2.09 0.236 1.47 0.200 -0.036
4 2.28 0.197 1.66 0.190 -0.007
5 2.44 0.157 1.83 0.170 0.013
6 2.56 0.118 2.00 0.170 0.052
7 2.72 0.157 2.15 0.150 -0.007
8 2.87 0.157 2.30 0.150 -0.007
9 2.99 0.118 2.46 0.160 0.042
10 3.11 0.118 2.60 0.140 0.022
Shading indicates that no measurement was taken.

D-24
TEST DAY 7 PM Run Number Test Day Date Fuel Fuel Level,
percent Ingress Method Run ID
13 7 9/21/11 E15 25 Without splash E15-25-wo-DUP
Initial Mid-Point Final (T=100) Time 3:08 PM 4:02 PM 6:08 PM Fuel height V-R side (inches) 15-15/16 16-1/8 16-1/2 DP V-R side (mm) trace 25 56 Temp 1 (°C) (corrected) 20.7 20.7 21.5 Temp 2 (°C) (corrected) 19.4 20.4 21.1 Temp 3 (°C) (corrected) NA NA NA Temp 4 (°C) (corrected) NA NA NA Ingress rate (ml/min) 200 200 200 Ingress rate determined (ml/min) 176a
Start of incremental test (T=0) 4:28 PM
a. Determined using the average determined flow rate and applying the average % error. Rotameter Calibration
Observed Flow Rate,
cm3/min Volume Collected,
ml Collection
Time, sec
Determined Flow Rate,
ml/min Error
200 59.0 20.0 177.0 -12% 200 58.0 20.0 174.0 -13% 200 59.0 20.0 177.1 -11%
Observed Flow Rate,
cm3/min
Volume Collected,
ml
Collection Time, sec
Determined Flow Rate,
ml/min Error
Average 200 58.7 20.0 176.0 -12% Standard deviation 0 0.6 0.0 1.8 1%
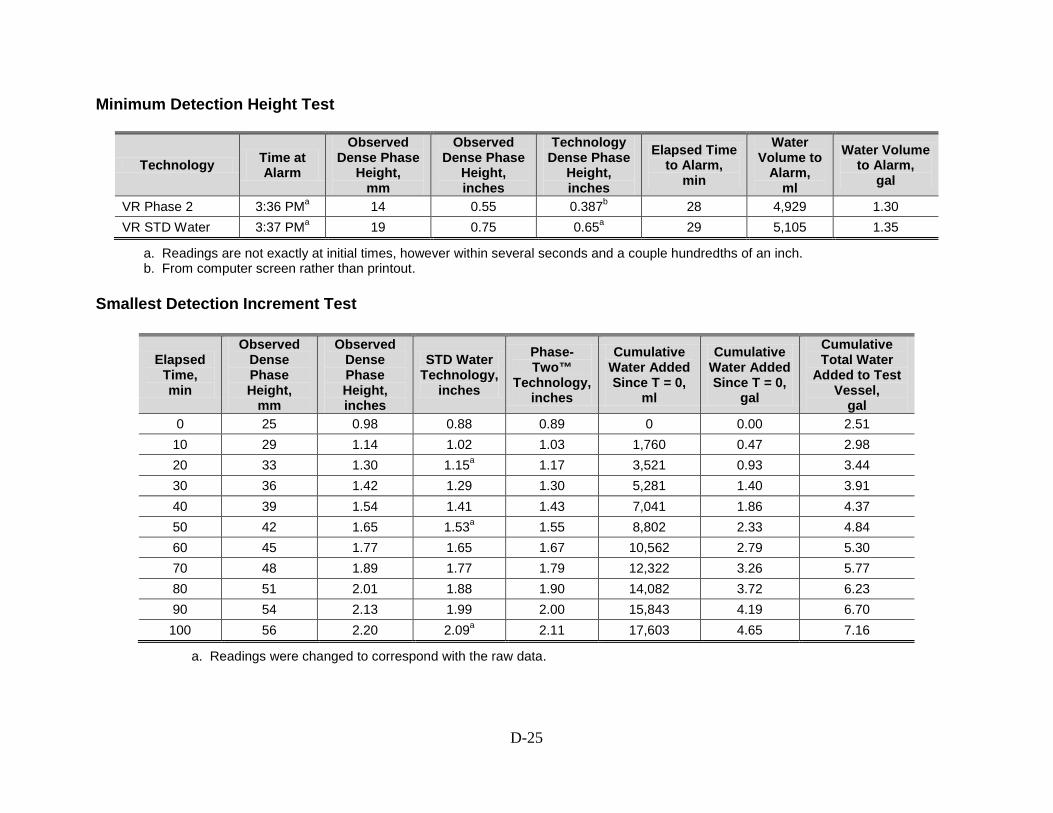
D-25
Minimum Detection Height Test
Technology Time at Alarm
Observed Dense Phase
Height, mm
Observed Dense Phase
Height, inches
Technology Dense Phase
Height, inches
Elapsed Time to Alarm,
min
Water Volume to
Alarm, ml
Water Volume to Alarm,
gal
VR Phase 2 3:36 PMa 14 0.55 0.387b 28 4,929 1.30 VR STD Water 3:37 PMa 19 0.75 0.65a 29 5,105 1.35
a. Readings are not exactly at initial times, however within several seconds and a couple hundredths of an inch. b. From computer screen rather than printout. Smallest Detection Increment Test
Elapsed Time, min
Observed Dense Phase Height,
mm
Observed Dense Phase Height, inches
STD Water Technology,
inches
Phase-Two™
Technology, inches
Cumulative Water Added Since T = 0,
ml
Cumulative Water Added Since T = 0,
gal
Cumulative Total Water
Added to Test Vessel,
gal 0 25 0.98 0.88 0.89 0 0.00 2.51
10 29 1.14 1.02 1.03 1,760 0.47 2.98 20 33 1.30 1.15a 1.17 3,521 0.93 3.44 30 36 1.42 1.29 1.30 5,281 1.40 3.91 40 39 1.54 1.41 1.43 7,041 1.86 4.37 50 42 1.65 1.53a 1.55 8,802 2.33 4.84 60 45 1.77 1.65 1.67 10,562 2.79 5.30 70 48 1.89 1.77 1.79 12,322 3.26 5.77 80 51 2.01 1.88 1.90 14,082 3.72 6.23 90 54 2.13 1.99 2.00 15,843 4.19 6.70 100 56 2.20 2.09a 2.11 17,603 4.65 7.16
a. Readings were changed to correspond with the raw data.
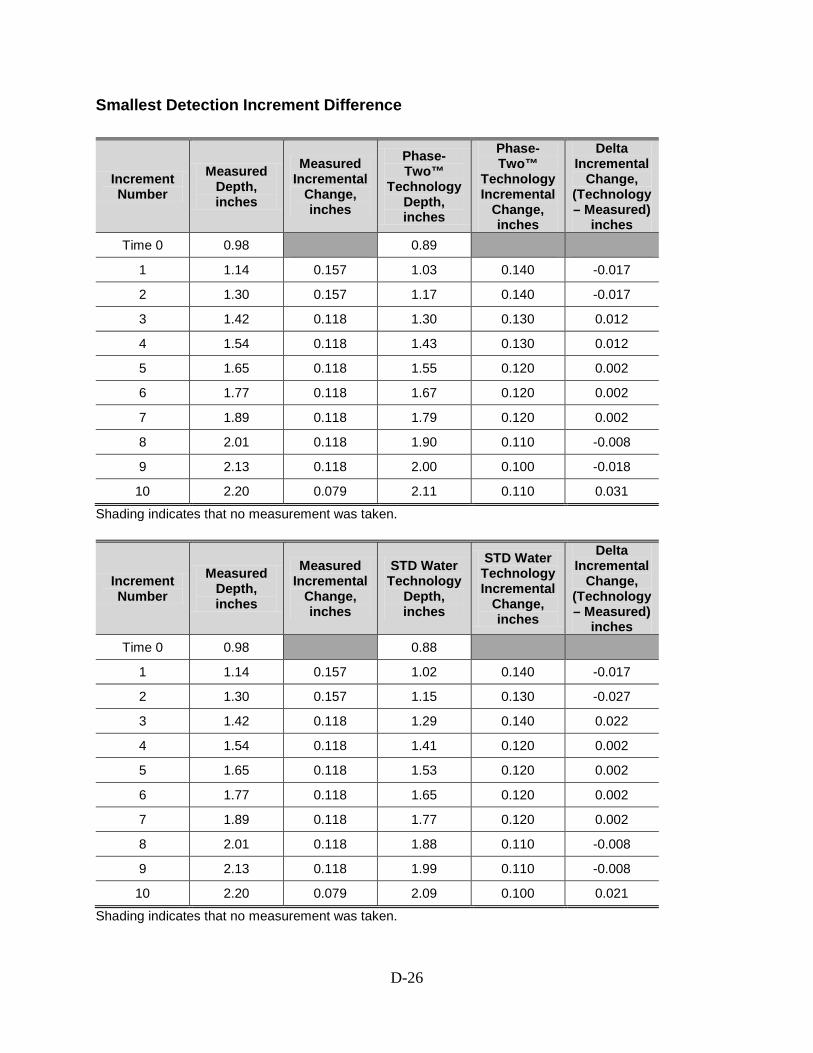
D-26
Smallest Detection Increment Difference
Increment Number
Measured Depth, inches
Measured Incremental
Change, inches
Phase-Two™
Technology Depth, inches
Phase-Two™
Technology Incremental
Change, inches
Delta Incremental
Change, (Technology – Measured)
inches Time 0 0.98 0.89
1 1.14 0.157 1.03 0.140 -0.017
2 1.30 0.157 1.17 0.140 -0.017
3 1.42 0.118 1.30 0.130 0.012
4 1.54 0.118 1.43 0.130 0.012
5 1.65 0.118 1.55 0.120 0.002
6 1.77 0.118 1.67 0.120 0.002
7 1.89 0.118 1.79 0.120 0.002
8 2.01 0.118 1.90 0.110 -0.008
9 2.13 0.118 2.00 0.100 -0.018
10 2.20 0.079 2.11 0.110 0.031
Shading indicates that no measurement was taken.
Increment Number
Measured Depth, inches
Measured Incremental
Change, inches
STD Water Technology
Depth, inches
STD Water Technology Incremental
Change, inches
Delta Incremental
Change, (Technology – Measured)
inches Time 0 0.98 0.88
1 1.14 0.157 1.02 0.140 -0.017
2 1.30 0.157 1.15 0.130 -0.027
3 1.42 0.118 1.29 0.140 0.022
4 1.54 0.118 1.41 0.120 0.002
5 1.65 0.118 1.53 0.120 0.002
6 1.77 0.118 1.65 0.120 0.002
7 1.89 0.118 1.77 0.120 0.002
8 2.01 0.118 1.88 0.110 -0.008
9 2.13 0.118 1.99 0.110 -0.008
10 2.20 0.079 2.09 0.100 0.021
Shading indicates that no measurement was taken.
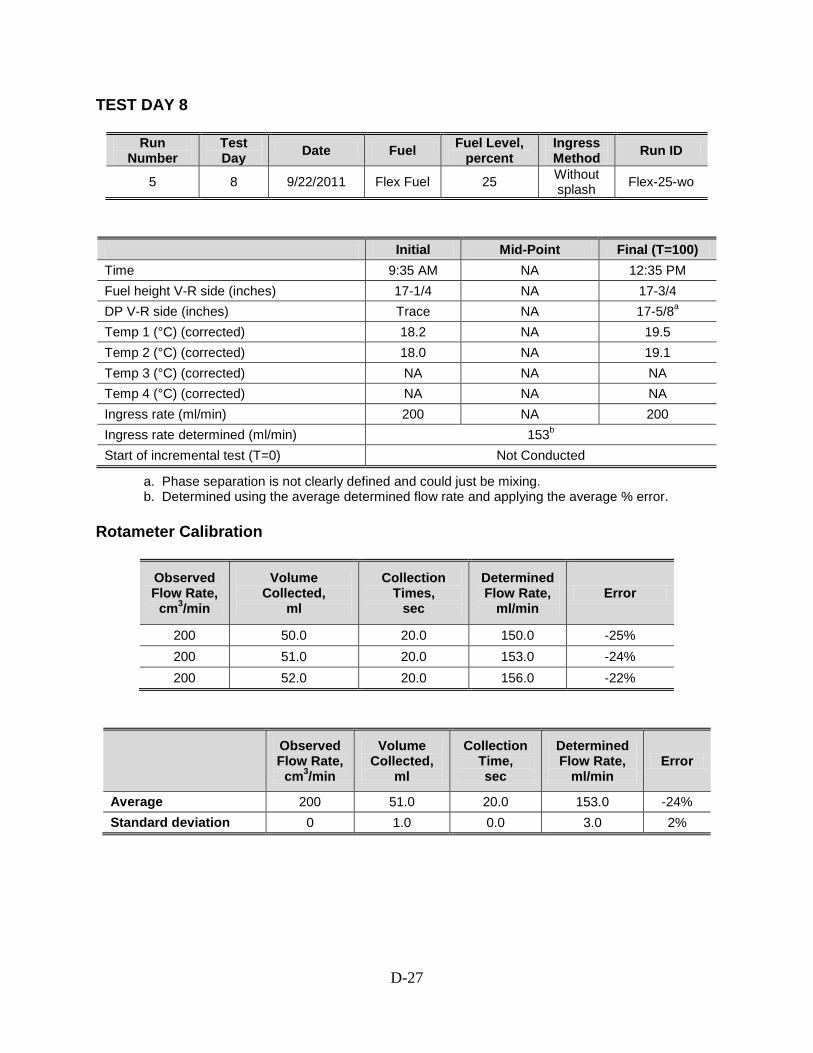
D-27
TEST DAY 8
Run Number
Test Day Date Fuel Fuel Level,
percent Ingress Method Run ID
5 8 9/22/2011 Flex Fuel 25 Without splash Flex-25-wo
Initial Mid-Point Final (T=100) Time 9:35 AM NA 12:35 PM Fuel height V-R side (inches) 17-1/4 NA 17-3/4 DP V-R side (inches) Trace NA 17-5/8a
Temp 1 (°C) (corrected) 18.2 NA 19.5 Temp 2 (°C) (corrected) 18.0 NA 19.1 Temp 3 (°C) (corrected) NA NA NA Temp 4 (°C) (corrected) NA NA NA Ingress rate (ml/min) 200 NA 200 Ingress rate determined (ml/min) 153b
Start of incremental test (T=0) Not Conducted
a. Phase separation is not clearly defined and could just be mixing. b. Determined using the average determined flow rate and applying the average % error. Rotameter Calibration
Observed Flow Rate,
cm3/min
Volume Collected,
ml
Collection Times,
sec
Determined Flow Rate,
ml/min Error
200 50.0 20.0 150.0 -25% 200 51.0 20.0 153.0 -24% 200 52.0 20.0 156.0 -22%
Observed Flow Rate,
cm3/min
Volume Collected,
ml
Collection Time, sec
Determined Flow Rate,
ml/min Error
Average 200 51.0 20.0 153.0 -24% Standard deviation 0 1.0 0.0 3.0 2%

D-28
Minimum Detection Height Test
Technology Time at Alarm
Observed Dense Phase
Height, mm
Observed Dense Phase Height, inches
Technology Dense Phase
Height, inches
Elapsed Time to Alarm,
min
Water Volume to
Alarm, ml
Water Volume to Alarm,
gal
Water Added at Test
Termination, gal
VR Phase 2 10:39 AM 0 0.54a,b 64 9,792 2.59 7.28 VR STD Water Did not respond
a. Readings are not exactly at initial times, however within several seconds and a couple hundredths of an inch. b. Phase separation is not clearly defined and could just be mixing. Smallest Detection Increment Test
TEST NOT CONDUCTED
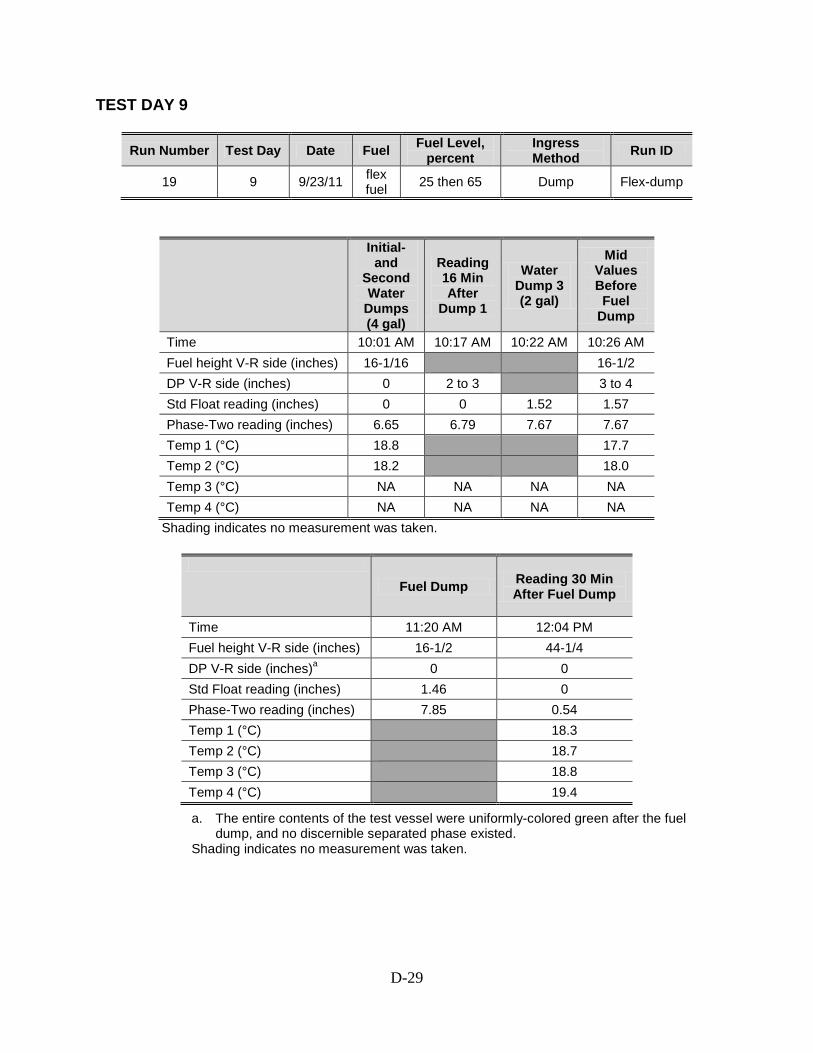
D-29
TEST DAY 9
Run Number Test Day Date Fuel Fuel Level, percent
Ingress Method Run ID
19 9 9/23/11 flex fuel 25 then 65 Dump Flex-dump
Initial-and
Second Water
Dumps (4 gal)
Reading 16 Min After
Dump 1
Water Dump 3 (2 gal)
Mid Values Before Fuel
Dump
Time 10:01 AM 10:17 AM 10:22 AM 10:26 AM Fuel height V-R side (inches) 16-1/16 16-1/2 DP V-R side (inches) 0 2 to 3 3 to 4 Std Float reading (inches) 0 0 1.52 1.57 Phase-Two reading (inches) 6.65 6.79 7.67 7.67 Temp 1 (°C) 18.8 17.7 Temp 2 (°C) 18.2 18.0 Temp 3 (°C) NA NA NA NA Temp 4 (°C) NA NA NA NA
Shading indicates no measurement was taken.
Fuel Dump Reading 30 Min
After Fuel Dump
Time 11:20 AM 12:04 PM Fuel height V-R side (inches) 16-1/2 44-1/4 DP V-R side (inches)a 0 0 Std Float reading (inches) 1.46 0 Phase-Two reading (inches) 7.85 0.54 Temp 1 (°C) 18.3 Temp 2 (°C) 18.7 Temp 3 (°C) 18.8 Temp 4 (°C) 19.4
a. The entire contents of the test vessel were uniformly-colored green after the fuel dump, and no discernible separated phase existed.
Shading indicates no measurement was taken.
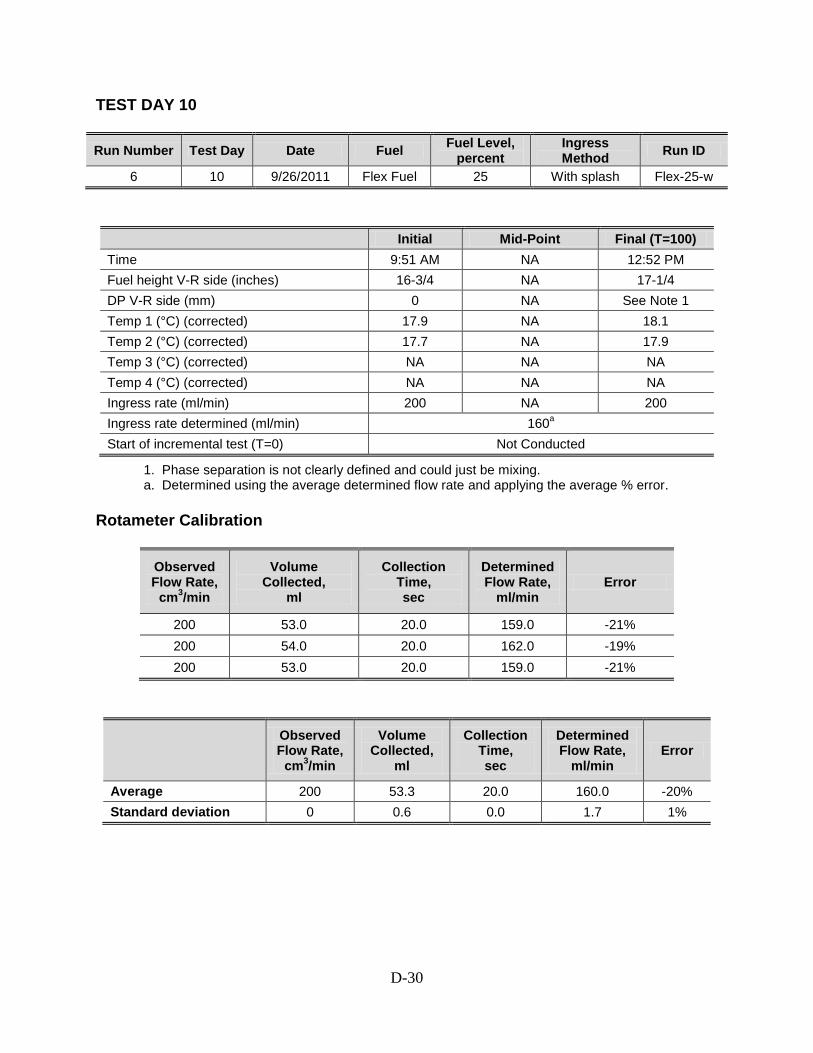
D-30
TEST DAY 10 Run Number Test Day Date Fuel Fuel Level,
percent Ingress Method Run ID
6 10 9/26/2011 Flex Fuel 25 With splash Flex-25-w
Initial Mid-Point Final (T=100) Time 9:51 AM NA 12:52 PM Fuel height V-R side (inches) 16-3/4 NA 17-1/4 DP V-R side (mm) 0 NA See Note 1 Temp 1 (°C) (corrected) 17.9 NA 18.1 Temp 2 (°C) (corrected) 17.7 NA 17.9 Temp 3 (°C) (corrected) NA NA NA Temp 4 (°C) (corrected) NA NA NA Ingress rate (ml/min) 200 NA 200 Ingress rate determined (ml/min) 160a
Start of incremental test (T=0) Not Conducted
1. Phase separation is not clearly defined and could just be mixing. a. Determined using the average determined flow rate and applying the average % error. Rotameter Calibration
Observed Flow Rate,
cm3/min
Volume Collected,
ml
Collection Time, sec
Determined Flow Rate,
ml/min Error
200 53.0 20.0 159.0 -21% 200 54.0 20.0 162.0 -19% 200 53.0 20.0 159.0 -21%
Observed Flow Rate,
cm3/min
Volume Collected,
ml
Collection Time, sec
Determined Flow Rate,
ml/min Error
Average 200 53.3 20.0 160.0 -20% Standard deviation 0 0.6 0.0 1.7 1%

D-31
Minimum Detection Height Test
Technology Time at Alarm
Observed Dense Phase Height,
mm
Observed Dense Phase Height, inches
Technology Dense Phase
Height, inches
Elapsed Time to Alarm,
min
Water Volume to
Alarm, ml
Water Volume to Alarm,
gal
Water Added at Test
Termination, gal
VR Phase 2 11:02 AMa
0 0.55a,b 71 11,360 3.00 7.65
VR STD Water Did not respond
a. Readings are not exactly at initial times, however within several seconds and a couple hundredths of an inch. b. Phase separation is not clearly defined and could just be mixing. Smallest Detection Increment Test
TEST NOT CONDUCTED

D-32
TEST DAY 11
Run Number Test Day Date Fuel Fuel Level, percent
Ingress Method Run ID
14 11 9/27/2011 E15 65 With splash E15-65-w
Initial Mid-Point Final (T=100) Time 9:54 AM 10:43 AM 1:03 PM Fuel height V-R side (inches) 45-1/16 45-1/8 45-3/8 DP V-R side (mm) trace 38 92 Temp 1 (°C) (corrected) 16.2 16.3 16.9 Temp 2 (°C) (corrected) 15.6 15.7 16.5 Temp 3 (°C) (corrected) 16.6 16.5 16.9 Temp 4 (°C) (corrected) 16.0 15.9 16.3 Ingress rate (ml/min) 200 200 200 Ingress rate determined (ml/min) 152a
Start of incremental test (T=0) 11:23 AM
a. Determined using the average determined flow rate and applying the average % error. Rotameter Calibration
Observed Flow Rate,
cm3/min Volume Collected,
ml Collection
Time, sec
Determined Flow Rate,
ml/min Error
200 50.5 20.0 151.5 -24% 200 50.5 20.0 151.5 -24% 200 50.5 20.0 151.5 -24%
Observed Flow Rate,
cm3/min
Volume Collected,
ml
Collection Time, sec
Determined Flow Rate,
ml/min Error
Average 200 50.5 20.0 151.5 -24% Standard deviation 0 0.0 0.0 0.0 0%
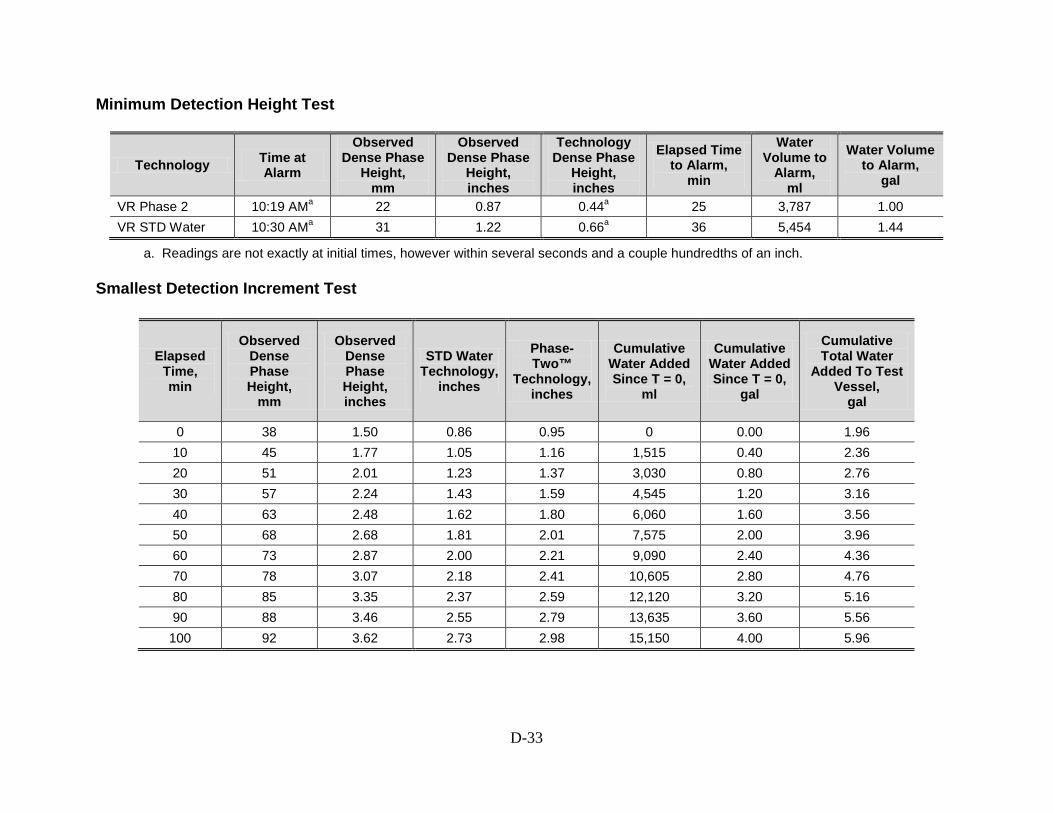
D-33
Minimum Detection Height Test
Technology Time at Alarm
Observed Dense Phase
Height, mm
Observed Dense Phase
Height, inches
Technology Dense Phase
Height, inches
Elapsed Time to Alarm,
min
Water Volume to
Alarm, ml
Water Volume to Alarm,
gal
VR Phase 2 10:19 AMa 22 0.87 0.44a 25 3,787 1.00 VR STD Water 10:30 AMa 31 1.22 0.66a 36 5,454 1.44
a. Readings are not exactly at initial times, however within several seconds and a couple hundredths of an inch. Smallest Detection Increment Test
Elapsed Time, min
Observed Dense Phase Height,
mm
Observed Dense Phase Height, inches
STD Water Technology,
inches
Phase-Two™
Technology, inches
Cumulative Water Added Since T = 0,
ml
Cumulative Water Added Since T = 0,
gal
Cumulative Total Water
Added To Test Vessel,
gal
0 38 1.50 0.86 0.95 0 0.00 1.96 10 45 1.77 1.05 1.16 1,515 0.40 2.36 20 51 2.01 1.23 1.37 3,030 0.80 2.76 30 57 2.24 1.43 1.59 4,545 1.20 3.16 40 63 2.48 1.62 1.80 6,060 1.60 3.56 50 68 2.68 1.81 2.01 7,575 2.00 3.96 60 73 2.87 2.00 2.21 9,090 2.40 4.36 70 78 3.07 2.18 2.41 10,605 2.80 4.76 80 85 3.35 2.37 2.59 12,120 3.20 5.16 90 88 3.46 2.55 2.79 13,635 3.60 5.56 100 92 3.62 2.73 2.98 15,150 4.00 5.96
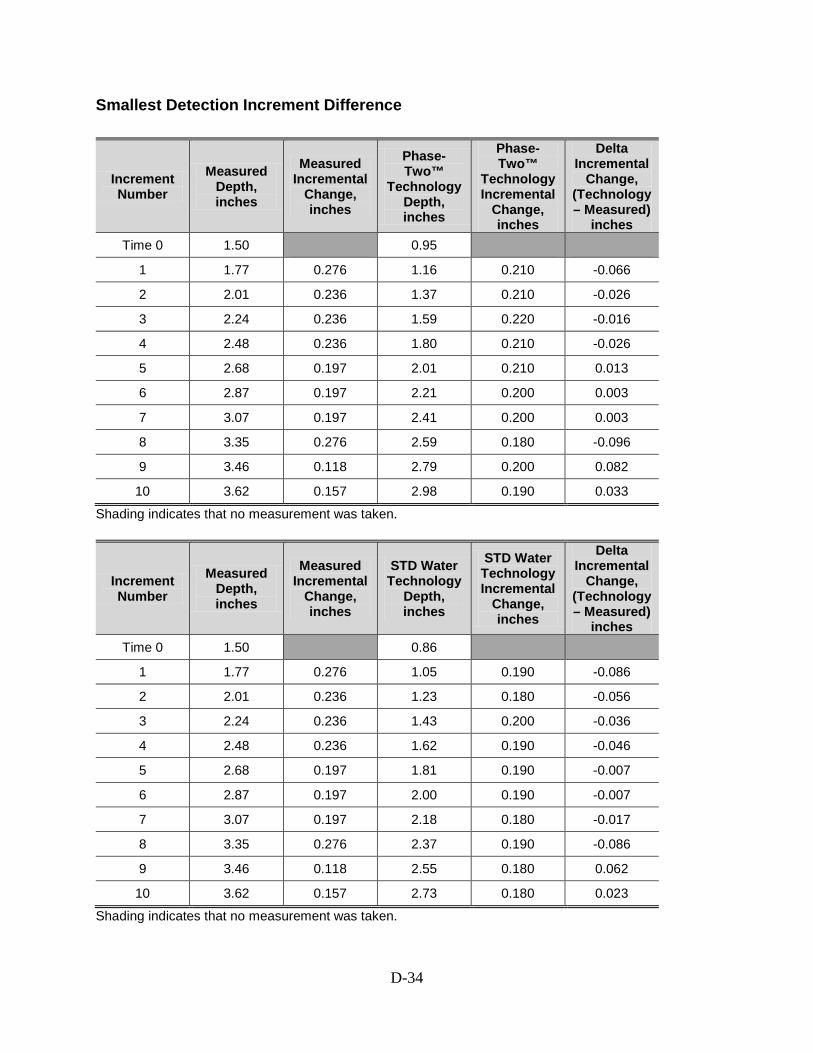
D-34
Smallest Detection Increment Difference
Increment Number
Measured Depth, inches
Measured Incremental
Change, inches
Phase-Two™
Technology Depth, inches
Phase-Two™
Technology Incremental
Change, inches
Delta Incremental
Change, (Technology – Measured)
inches Time 0 1.50 0.95
1 1.77 0.276 1.16 0.210 -0.066
2 2.01 0.236 1.37 0.210 -0.026
3 2.24 0.236 1.59 0.220 -0.016
4 2.48 0.236 1.80 0.210 -0.026
5 2.68 0.197 2.01 0.210 0.013
6 2.87 0.197 2.21 0.200 0.003
7 3.07 0.197 2.41 0.200 0.003
8 3.35 0.276 2.59 0.180 -0.096
9 3.46 0.118 2.79 0.200 0.082
10 3.62 0.157 2.98 0.190 0.033
Shading indicates that no measurement was taken.
Increment Number
Measured Depth, inches
Measured Incremental
Change, inches
STD Water Technology
Depth, inches
STD Water Technology Incremental
Change, inches
Delta Incremental
Change, (Technology – Measured)
inches Time 0 1.50 0.86
1 1.77 0.276 1.05 0.190 -0.086
2 2.01 0.236 1.23 0.180 -0.056
3 2.24 0.236 1.43 0.200 -0.036
4 2.48 0.236 1.62 0.190 -0.046
5 2.68 0.197 1.81 0.190 -0.007
6 2.87 0.197 2.00 0.190 -0.007
7 3.07 0.197 2.18 0.180 -0.017
8 3.35 0.276 2.37 0.190 -0.086
9 3.46 0.118 2.55 0.180 0.062
10 3.62 0.157 2.73 0.180 0.023
Shading indicates that no measurement was taken.
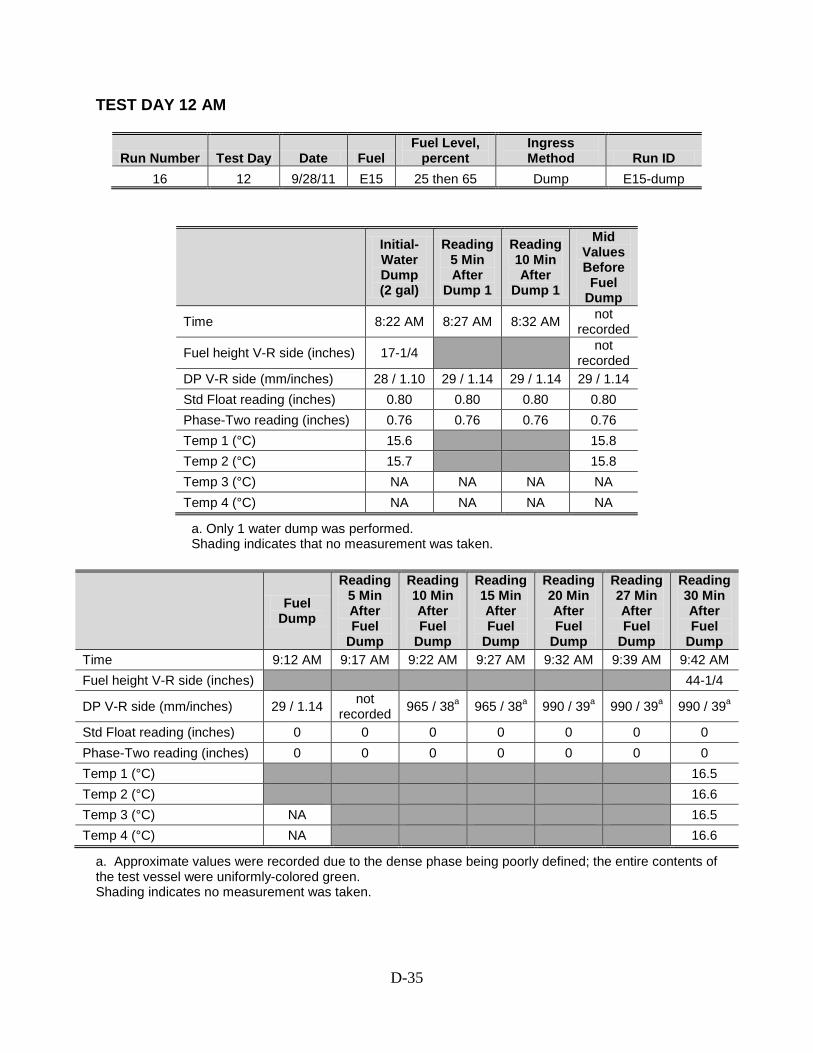
D-35
TEST DAY 12 AM
Run Number Test Day Date Fuel Fuel Level,
percent Ingress Method Run ID
16 12 9/28/11 E15 25 then 65 Dump E15-dump
Initial-Water Dump (2 gal)
Reading 5 Min After
Dump 1
Reading 10 Min After
Dump 1
Mid Values Before Fuel
Dump
Time 8:22 AM 8:27 AM 8:32 AM not recorded
Fuel height V-R side (inches) 17-1/4 not
recorded DP V-R side (mm/inches) 28 / 1.10 29 / 1.14 29 / 1.14 29 / 1.14 Std Float reading (inches) 0.80 0.80 0.80 0.80 Phase-Two reading (inches) 0.76 0.76 0.76 0.76 Temp 1 (°C) 15.6 15.8 Temp 2 (°C) 15.7 15.8 Temp 3 (°C) NA NA NA NA Temp 4 (°C) NA NA NA NA
a. Only 1 water dump was performed. Shading indicates that no measurement was taken.
Fuel Dump
Reading 5 Min After Fuel
Dump
Reading 10 Min After Fuel
Dump
Reading 15 Min After Fuel
Dump
Reading 20 Min After Fuel
Dump
Reading 27 Min After Fuel
Dump
Reading 30 Min After Fuel
Dump Time 9:12 AM 9:17 AM 9:22 AM 9:27 AM 9:32 AM 9:39 AM 9:42 AM Fuel height V-R side (inches) 44-1/4
DP V-R side (mm/inches) 29 / 1.14 not recorded 965 / 38a 965 / 38a 990 / 39a 990 / 39a 990 / 39a
Std Float reading (inches) 0 0 0 0 0 0 0 Phase-Two reading (inches) 0 0 0 0 0 0 0 Temp 1 (°C) 16.5 Temp 2 (°C) 16.6 Temp 3 (°C) NA 16.5 Temp 4 (°C) NA 16.6
a. Approximate values were recorded due to the dense phase being poorly defined; the entire contents of the test vessel were uniformly-colored green. Shading indicates no measurement was taken.
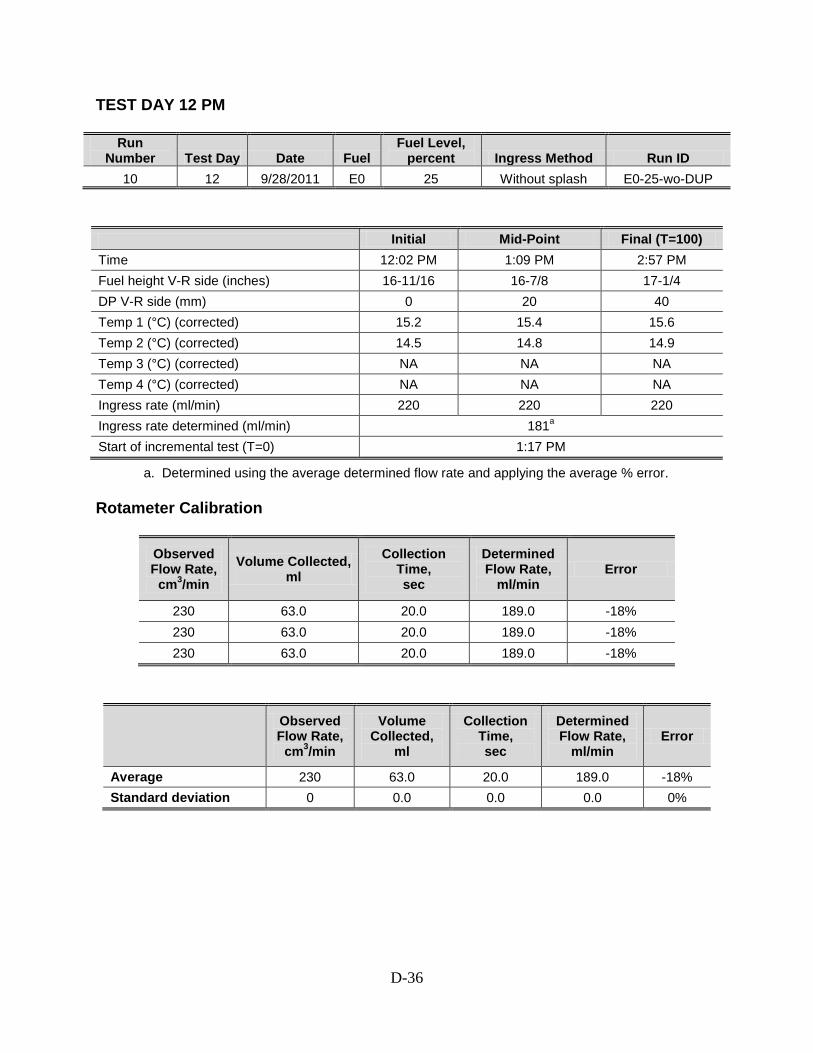
D-36
TEST DAY 12 PM
Run Number Test Day Date Fuel
Fuel Level, percent Ingress Method Run ID
10 12 9/28/2011 E0 25 Without splash E0-25-wo-DUP Initial Mid-Point Final (T=100) Time 12:02 PM 1:09 PM 2:57 PM Fuel height V-R side (inches) 16-11/16 16-7/8 17-1/4 DP V-R side (mm) 0 20 40 Temp 1 (°C) (corrected) 15.2 15.4 15.6 Temp 2 (°C) (corrected) 14.5 14.8 14.9 Temp 3 (°C) (corrected) NA NA NA Temp 4 (°C) (corrected) NA NA NA Ingress rate (ml/min) 220 220 220 Ingress rate determined (ml/min) 181a
Start of incremental test (T=0) 1:17 PM
a. Determined using the average determined flow rate and applying the average % error. Rotameter Calibration
Observed Flow Rate,
cm3/min Volume Collected,
ml Collection
Time, sec
Determined Flow Rate,
ml/min Error
230 63.0 20.0 189.0 -18% 230 63.0 20.0 189.0 -18% 230 63.0 20.0 189.0 -18%
Observed Flow Rate,
cm3/min
Volume Collected,
ml
Collection Time, sec
Determined Flow Rate,
ml/min Error
Average 230 63.0 20.0 189.0 -18% Standard deviation 0 0.0 0.0 0.0 0%

D-37
Minimum Detection Height Test
Technology Time at Alarm
Observed Dense Phase
Height, mm
Observed Dense Phase
Height, inches
Technology Dense Phase
Height, inches
Elapsed Time to Alarm,
min
Water Volume to
Alarm, ml
Water Volume to Alarm,
gal
VR Phase 2 12:41 PMa 13 0.51 0.40a 39 7,051 1.86 VR STD Water 12:47 PMa 15 0.59 0.65a 45 8,135 2.15
a. Readings are not exactly at initial times, however within several seconds and a couple hundredths of an inch. Smallest Detection Increment Test
Elapsed Time, min
Observed Dense Phase Height,
mm
Observed Dense Phase Height, inches
STD Water Technology,
inches
Phase-Two™
Technology, inches
Cumulative Water Added Since T = 0,
ml
Cumulative Water Added Since T = 0,
gal
Cumulative Total Water
Added to Test Vessel,
gal 0 20 0.79 0.86 0.69 0 0.00 3.20
10 23 0.91 0.97 0.80 1,808 0.48 3.68 20 26 1.02 1.07 0.90 3,616 0.96 4.15 30 28 1.10 1.17 0.99 5,423 1.43 4.63 40 30 1.18 1.26 1.09 7,231 1.91 5.11 50 33 1.30 1.35 1.18 9,039 2.39 5.59 60 35 1.38 1.44 1.26 10,847 2.87 6.07 70 38 1.50 1.53 1.35 12,655 3.34 6.54 80 40 1.57 1.61 1.43 14,463 3.82 7.02 90 42 1.65 1.69 1.51 16,270 4.30 7.50 100 44 1.73 1.77 1.59 18,078 4.78 7.98
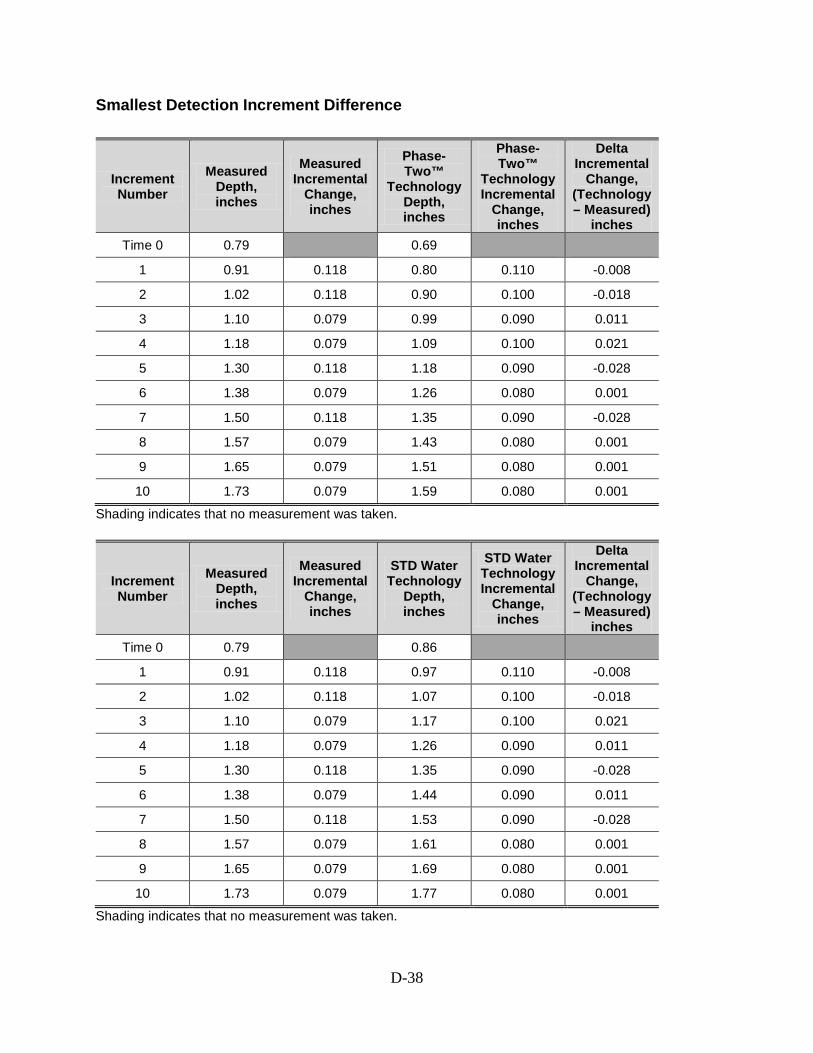
D-38
Smallest Detection Increment Difference
Increment Number
Measured Depth, inches
Measured Incremental
Change, inches
Phase-Two™
Technology Depth, inches
Phase-Two™
Technology Incremental
Change, inches
Delta Incremental
Change, (Technology – Measured)
inches Time 0 0.79 0.69
1 0.91 0.118 0.80 0.110 -0.008
2 1.02 0.118 0.90 0.100 -0.018
3 1.10 0.079 0.99 0.090 0.011
4 1.18 0.079 1.09 0.100 0.021
5 1.30 0.118 1.18 0.090 -0.028
6 1.38 0.079 1.26 0.080 0.001
7 1.50 0.118 1.35 0.090 -0.028
8 1.57 0.079 1.43 0.080 0.001
9 1.65 0.079 1.51 0.080 0.001
10 1.73 0.079 1.59 0.080 0.001
Shading indicates that no measurement was taken.
Increment Number
Measured Depth, inches
Measured Incremental
Change, inches
STD Water Technology
Depth, inches
STD Water Technology Incremental
Change, inches
Delta Incremental
Change, (Technology – Measured)
inches Time 0 0.79 0.86
1 0.91 0.118 0.97 0.110 -0.008
2 1.02 0.118 1.07 0.100 -0.018
3 1.10 0.079 1.17 0.100 0.021
4 1.18 0.079 1.26 0.090 0.011
5 1.30 0.118 1.35 0.090 -0.028
6 1.38 0.079 1.44 0.090 0.011
7 1.50 0.118 1.53 0.090 -0.028
8 1.57 0.079 1.61 0.080 0.001
9 1.65 0.079 1.69 0.080 0.001
10 1.73 0.079 1.77 0.080 0.001
Shading indicates that no measurement was taken.

D-39
TEST DAY 13
Run Number Test Day Date Fuel Fuel Level, percent Ingress Method Run ID
17 13 9/29/2011 E15 65 Without splash E15-65-wo
Initial Mid-Point Final (T=100) Time 9:48 AM 10:25 AM 12:28 PM Fuel height V-R side (inches) 45-1/2 45-5/16 45-9/16 DP V-R side (mm) 0 31 77 Temp 1 (°C) (corrected) 15.6 15.7 16.4 Temp 2 (°C) (corrected) 14.9 15.1 15.8 Temp 3 (°C) (corrected) 15.9 15.9 16.4 Temp 4 (°C) (corrected) 15.4 15.2 15.7 Ingress rate (ml/min) 220 220 220 Ingress rate determined (ml/min) 188a
Start of incremental test (T=0) 10:48 AM
a. Determined using the average determined flow rate and applying the average % error. Rotameter Calibration
Observed Flow Rate,
cm3/min Volume Collected,
ml Collection
Time, sec
Determined Flow Rate,
ml/min Error
250 71.0 20.0 213.0 -15% 250 71.0 20.0 213.0 -15% 250 72.0 20.0 216.0 -14%
Observed Flow Rate,
cm3/min
Volume Collected,
ml
Collection Time, sec
Determined Flow Rate,
ml/min Error
Average 250 71.3 20.0 214.0 -14% Standard deviation 0 0.6 0.0 1.7 1%

D-40
Minimum Detection Height Test
Technology Time At Alarm
Observed Dense Phase
Height, mm
Observed Dense Phase
Height, inches
Technology Dense Phase
Height, inches
Elapsed Time to Alarm,
min
Water Volume to
Alarm, ml
Water Volume to Alarm,
gal
VR Phase 2 10:07 AMa 18 0.71 0.43a 19 3,578 0.95 VR STD Water 10:16 AMa 25 0.98 0.65a 28 5,273 1.39
a. Readings are not exactly at initial times, however within several seconds and a couple hundredths of an inch. Smallest Detection Increment Test
Elapsed Time, min
Observed Dense Phase Height,
mm
Observed Dense Phase Height, inches
STD Water Technology,
inches
Phase-Two™
Technology, inches
Cumulative Water Added Since T = 0,
ml
Cumulative Water Added Since T = 0,
gal
Cumulative Total Water
Added To Test Vessel,
gal
0 31 1.22 0.83 0.88 0 0.00 1.84 10 37 1.46 1.05 1.09 1,883 0.50 2.34 20 42 1.65 1.25 1.30 3,766 0.99 2.84 30 47 1.85 1.45 1.49 5,650 1.49 3.33 40 52 2.05 1.63 1.68 7,533 1.99 3.83 50 57 2.24 1.81 1.86 9,416 2.49 4.33 60 61 2.40 1.98 2.03 11,299 2.98 4.83 70 66 2.60 2.14 2.20 13,182 3.48 5.32 80 70 2.76 2.29 2.34 15,066 3.98 5.82 90 73 2.87 2.43 2.49 16,949 4.48 6.32 100 77 3.03 2.57 2.63 18,832 4.97 6.82

D-41
Smallest Detection Increment Difference
Increment Number
Measured Depth, inches
Measured Incremental
Change, inches
Phase-Two™
Technology Depth, inches
Phase-Two™
Technology Incremental
Change, inches
Delta Incremental
Change, (Technology – Measured)
inches Time 0 1.22 0.88
1 1.46 0.236 1.09 0.210 -0.026
2 1.65 0.197 1.30 0.210 0.013
3 1.85 0.197 1.49 0.190 -0.007
4 2.05 0.197 1.68 0.190 -0.007
5 2.24 0.197 1.86 0.180 -0.017
6 2.40 0.157 2.03 0.170 0.013
7 2.60 0.197 2.20 0.170 -0.027
8 2.76 0.157 2.34 0.140 -0.017
9 2.87 0.118 2.49 0.150 0.032
10 3.03 0.157 2.63 0.140 -0.017
Shading indicates that no measurement was taken.
Increment Number
Measured Depth, inches
Measured Incremental
Change, inches
STD Water Technology
Depth, inches
STD Water Technology Incremental
Change, inches
Delta Incremental
Change, (Technology – Measured)
inches Time 0 1.22 0.83
1 1.46 0.236 1.05 0.220 -0.016
2 1.65 0.197 1.25 0.200 0.003
3 1.85 0.197 1.45 0.200 0.003
4 2.05 0.197 1.63 0.180 -0.017
5 2.24 0.197 1.81 0.180 -0.017
6 2.40 0.157 1.98 0.170 0.013
7 2.60 0.197 2.14 0.160 -0.037
8 2.76 0.157 2.29 0.150 -0.007
9 2.87 0.118 2.43 0.140 0.022
10 3.03 0.157 2.57 0.140 -0.017
Shading indicates that no measurement was taken.

D-42
TEST DAY 14
Run Number Test Day Date Fuel Fuel Level,
percent Ingress Method Run ID
18 14 9/30/2011 E15 65 With splash E15-65-w-DUP
Initial Mid-Point Final (T=100) Time 9:50 AM 10:31 AM 12:46 PM Fuel height V-R side (inches) 45-1/8 45-1/4 45-1/2 DP V-R side (mm) 0 36 90 Temp 1 (°C) (corrected) 15.2 15.2 15.3 Temp 2 (°C) (corrected) 14.5 14.4 14.6 Temp 3 (°C) (corrected) 15.6 15.5 15.5 Temp 4 (°C) (corrected) 14.8 14.7 14.6 Ingress rate (ml/min) 220 220 220 Ingress rate determined (ml/min) 156a
Start of incremental test (T=0) 11:06 AM
a. Determined using the average determined flow rate and applying the average % error. Rotameter Calibration
Observed Flow Rate,
cm3/min Volume Collected,
ml Collection
Time, sec
Determined Flow Rate,
ml/min Error
220 52.0 20.0 156.0 -29% 220 52.0 20.0 156.0 -29% 220 52.0 20.0 156.0 -29%
Observed Flow Rate,
cm3/min
Volume Collected,
ml
Collection Times,
sec
Determined Flow Rate,
ml/min Error
Average 220 52.0 20.0 156.0 -29% Standard deviation 0 0.0 0.0 0.0 0%

D-43
Minimum Detection Height Test
Technology Time at Alarm
Observed Dense Phase
Height, mm
Observed Dense Phase
Height, inches
Technology Dense Phase
Height, inches
Elapsed Time to Alarm,
min
Water Volume to
Alarm, ml
Water Volume to Alarm,
gal
VR Phase 2 10:10 AM 21 0.83 0.41a 20 3,120 0.82 VR STD Water 10:21 AM 30 1.18 0.65a 31 4,836 1.28
a. Readings are not exactly at initial times, however within several seconds and a couple hundredths of an inch. Smallest Detection Increment Test
Elapsed Time, min
Observed Dense Phase Height,
mm
Observed Dense Phase Height, inches
STD Water Technology,
inches
Phase-Two™
Technology, inches
Cumulative Water Added Since T = 0,
ml
Cumulative Water Added Since T = 0,
gal
Cumulative Total Water
Added to Test Vessel,
gal 0 36 1.42 0.83 0.92 0 0.00 1.69
10 43 1.69 1.02 1.12 1,560 0.41 2.10 20 48 1.89 1.21 1.32 3,120 0.82 2.51 30 53 2.09 1.40 1.53 4,680 1.24 2.93 40 60 2.36 1.58 1.75 6,240 1.65 3.34 50 65 2.56 1.77 1.94 7,800 2.06 3.75 60 70 2.76 1.95 2.15 9,360 2.47 4.16 70 75 2.95 2.14 2.35 10,920 2.88 4.57 80 80 3.15 2.32 2.54 12,480 3.30 4.99 90 84 3.31 2.50 2.72 14,040 3.71 5.40 100 90 3.54 2.68 2.92 15,600 4.12 5.81

D-44
Smallest Detection Increment Difference
Increment Number
Measured Depth, inches
Measured Incremental
Change, inches
Phase-Two™
Technology Depth, inches
Phase-Two™
Technology Incremental
Change, inches
Delta Incremental
Change, (Technology – Measured)
inches Time 0 1.42 0.92
1 1.69 0.276 1.12 0.200 -0.076
2 1.89 0.197 1.32 0.200 0.003
3 2.09 0.197 1.53 0.210 0.013
4 2.36 0.276 1.75 0.220 -0.056
5 2.56 0.197 1.94 0.190 -0.007
6 2.76 0.197 2.15 0.210 0.013
7 2.95 0.197 2.35 0.200 0.003
8 3.15 0.197 2.54 0.190 -0.007
9 3.31 0.157 2.72 0.180 0.023
10 3.54 0.236 2.92 0.200 -0.036
Shading indicates that no measurement was taken.
Increment Number
Measured Depth, inches
Measured Incremental
Change, inches
STD Water Technology
Depth, inches
STD Water Technology Incremental
Change, inches
Delta Incremental
Change, (Technology – Measured)
inches Time 0 1.42 0.83
1 1.69 0.276 1.02 0.190 -0.086
2 1.89 0.197 1.21 0.190 -0.007
3 2.09 0.197 1.40 0.190 -0.007
4 2.36 0.276 1.58 0.180 -0.096
5 2.56 0.197 1.77 0.190 -0.007
6 2.76 0.197 1.95 0.180 -0.017
7 2.95 0.197 2.14 0.190 -0.007
8 3.15 0.197 2.32 0.180 -0.017
9 3.31 0.157 2.50 0.180 0.023
10 3.54 0.236 2.68 0.180 -0.056
Shading indicates that no measurement was taken.