Embed Size (px)
Citation preview

Page | 1
ENVIRONMENTALLY-BENIGN CONVERSION OF BIOMASS
RESIDUES TO ELECTRICITY
A Thesis presented
by
Andrew Davies
to
The Department of Mechanical and Industrial Engineering
In partial fulfillment of graduation requirements for
Master of Science
in
Mechanical Engineering
Northeastern University
Boston, Massachusetts
May 2013
Copyright (©) 2013 by Andrew Davies
All rights reserved. Reproduction in whole or in part in any form requires the prior written
permission of Andrew Davies or designated representative.

Page | 2
Abstract
As petroleum resources are finite, it is imperative to use them wisely in energy conversion
applications and, at the same time, develop alternative energy sources. Biomass is one of the
renewable energy sources that can be used to partially replace fossil fuels. Biomass-based fuels
can be produced domestically and can reduce dependency on fuel imports. Due to their abundant
supply, and given that to an appreciable extent they can be considered carbon-neutral, their use
for power generation is of technological interest. However, whereas biomasses can be directly
burned in furnaces, such a conventional direct combustion technique is ill-controlled and
typically produces considerable amounts of health-hazardous airborne compounds [1, 2]. Thus,
an alternative technology for biomass utilization is described herein to address increasing energy
needs in an environmentally-benign manner. More specifically, a multi-step process/device is
presented to accept granulated or pelletized biomass, and generate an easily-identifiable form of
energy as a final product. To achieve low emissions of products of incomplete combustion, the
biomass is gasified pyrolyticaly, mixed with air, ignited and, finally, burned in nominally pre-
mixed low-emission flames. Combustion is thus indirect, since the biomass is not directly
burned, instead its gaseous pyrolyzates are burned upon mixing with air. Thereby, combustion is
well-controlled and can be complete. A demonstration device has been constructed to convert the
internal energy of plastics into “clean” thermal energy and, eventually to electricity.

Page | 3
Acknowledgments
I would like to thank my academic advisor, Dr. Yiannis A. Levendis, and the combustion lab
manager, Chuanwei Zhuo (Ph.D. candidate) for their help and assistance in developing the topic
for my thesis and collaboration with designing the overall pyrolysis system. Rasam Soheilian and
Saber Talebi Anaraki for their support on this project with both prototype construction and
engineering analysis, and Northeastern University machinist Jonathan Doughty for his expertise
and helpful advice on manufacturing parts and component-level system design. In addition, I
would like to acknowledge my employer GE Aviation, which made my education possible by
sponsoring time off from work to pursue my degree.

Page | 4
Table of Contents Abstract ........................................................................................................................................... 2
Acknowledgments........................................................................................................................... 3
TABLE OF FIGURES .................................................................................................................... 6
CHAPTER 1 ................................................................................................................................... 8
Introduction ................................................................................................................................. 8
CHAPTER 2 ................................................................................................................................. 11
DDGS Background ................................................................................................................... 11
King Grass Background ............................................................................................................ 13
CHAPTER 3 ................................................................................................................................. 14
Experimental Apparatus............................................................................................................ 14
Experimental Procedure ............................................................................................................ 21
CHAPTER 4 ................................................................................................................................. 23
Results and Discussion ............................................................................................................. 23
Elimination of Tars and Waxes from the Effluent Gas............................................................. 29
Proof of Concept: Use of Biomass Pyrolyzate Gasses to Generate Electricity ........................ 32
CHAPTER 5 ................................................................................................................................. 33
Conclusions ............................................................................................................................... 33
Acknowledgments......................................................................................................................... 35
Works Cited .................................................................................................................................. 36

Page | 5
SUPPLEMENTAL CALCULATIONS ........................................................................................ 39
APPENDIX 1: Required amount of biomass feedstock to operate the pyrolytic gasifier in a
self-sustaining mode, i.e., without external heating.................................................................. 39
APPENDIX 2: Calculation of Self-Sustaining Pyrolysis System Efficiency ............................ 45
APPENDIX 3: Thermocouple temperature measurement correction for radiation effects. ..... 47
APPENDIX 4: Economic Considerations for Large-Scale Operation ..................................... 49
APPENDIX 5: CAD Models and Drawings Generated for Assembly and Fabrication of
Components .............................................................................................................................. 54

Page | 6
TABLE OF FIGURES
Figure 1: One gram samples of crushed corn-residue-based DDGS (left), and King Grass-base
biomass (right). ............................................................................................................................. 12
Figure 2: Proximate Analysis of King Grass and DDGS. ............................................................ 12
Figure 3: Laboratory-scale pyrolytic gasification apparatus, specifically designed and constructed
for the needs of this study. ............................................................................................................ 17
Figure 4: (a) a schematic of the feeding system; (b) a CAD model of the pyrolysis system; (c)
photograph of pyrolysis chamber with metal plates shown; (d) cross section of gasification
chamber; (e) Gas temperature gradient of gasification chamber. ................................................. 18
Figure 5: Perforated steel plates covered with stainless steel mesh (left) and without mesh (right).
....................................................................................................................................................... 19
Figure 6: Gage pressure holding capability of the furnace tube with time at a furnace set-point
temperature of 850°C. ................................................................................................................... 19
Figure 7: Results of feeding system calibration run for granulated DDGS and King Grass. ....... 22
Figure 8: Percentages of detected hydrocarbon species in King Grass pyrolyzate gases. ............ 23
Figure 9: Comparison of Pyrolyzate Gas Composition. ............................................................... 24
Figure 10: Photographs of nominally premixed flames burning gaseous pyrolyzates of (a) corn-
based DDGS biomass, and (b) King Grass biomass. ................................................................... 25
Figure 11: CO2/CO vs. Equivalence ratio for corn-based DDGS and King Grass biomasses. .... 27
Figure 12: Velocity profile of the volatiles inside the chamber.................................................... 28
Figure 13: Steam engine apparatus set up in close proximity to pyrolysis chamber outlet. ......... 30

Page | 7
Figure 14: Flame generated by the steam engine burner (left) and still photograph of the steam
engine in operation (right). The coupled electricity generator powers the light bulb. .................. 32
Table of Figures Included in the Appendices
Figure A.1: Schematic Picture of Insulation Thickness and Length (units in inches). ................. 43
Figure A.2: Relation Between the Self-Sustaining Efficiency (ηs) and the Feeding Rate (g/min).
....................................................................................................................................................... 46
Figure A.3: Economic analysis of biomass pyrolysis as used for energy production. ................. 50
Figure A.4: Biomass electrical generation profitability as a function of feed rate. ...................... 51
Figure A.5: Percent share of total running cost for N2 carrier gas. ............................................... 52
Figure A.6: Complete 3-D model of the assembled system (also shown: the frame support
structure). ...................................................................................................................................... 54
Figure A.7: Exploded view (left) and cutaway (right) of pyrolysis chamber. .............................. 55
Figure A.8: 3-D mockup of the frame system constructed to support the pyrolysis chamber. .... 55
Figure A.9: 3-D model (above) and engineering drawing generated (below) for custom
fabrication of the feed hopper. ...................................................................................................... 55
Figure A.10: 3-D model (above) and engineering drawing generated (below) for custom
fabrication of the pyrolysis chamber............................................................................................. 55
Figure A.11: 3-D model and cutaway (above) and engineering drawing generated (below) for the
machining and assembly of the feeding box and bearing support. ............................................... 55
Figure A.12: 3-D model (above) and cutaway view (below) showing construction and assembly
of the feeding system. ................................................................................................................... 55

Page | 8
CHAPTER 1
Introduction
The fact that fossil fuel resources are finite, led governments and industries worldwide to pursue
alternatives to these types of non-renewable resources. One of these alternative sources of energy
is biomass. There is a significant amount of energy stored in biomass; for instance, Danje [3]
determined the energy content of corn stover and corn cob to be 18.06 and 19.14 MJ/kg (high
heating value, HHV), respectively. US production of energy from biomass sources was
4.76×10¹²
MJ (4.411×10¹⁵
BTU), which amounts to approximately 5.8% of total US energy
production [4,5]. It has been projected that worldwide energy demand will rise by 53% by the
year 2035 with renewable energy sources being one of the fastest growing energy types at 2.8%
year-over-year growth rate [6]. With such rising energy demand, biofuels will play a more
important role and make up a greater percentage of worldwide energy production. Therefore, an
efficient method of converting biomass to usable energy in an environmentally benign manner is
essential to providing energy in the future to fuel the high growth rate of developing countries
and the proliferation of power-hungry electronic devices therein. Efforts have been made on
advanced technology converting the energy stored in biomass into gaseous fuels. Oxidative or
steam gasification (with oxygen present in the carrier gas) and pyrolytic gasification (with
oxygen absent in the carrier gas) are popular methods; highlights are given below.
Gasification of biomass prior to combustion offers several advantages [7], including: ease of
distribution in pipelines, continuous operation, better control of combustion, efficient

Page | 9
combustion since the correct amount of air can be mixed for optimum combustion, clean
combustion since impurities are removed in the gasifier, high temperature combustion for
making glass or cement, increased heat transfer, and facilitation of chemical synthesis. There has
been a large amount of work on biomass gasification, and includes investigations on tar
elimination and product distribution by using fluidized-beds, implementing different gasifying
agents, changing equivalence ratios, etc. [8-15]. This investigation is focused on pyrolytic
gasification of biomass. There has been prior research on biomass pyrolysis. Zanzi et al. [16]
studied rapid high temperature pyrolysis (1073 K or 800 oC) of two types of biomass (wood and
agricultural residues) in a free-fall reactor that was heated by eight independent electric heaters.
Their experiments were done at heating rates that were also used for fluidized bed reactors.
They observed that rapid heating enhances devolatilization and forms less char than slow
heating. They reported that compared with coal, biomass produces more volatile fractions and
less char. They also reported that biomass pyrolyzes at lower temperatures than coal. Zanzi et al.
[16,17] also worked on rapid pyrolysis of agricultural residues at higher temperatures (800-1000
oC or 1073-1273). Residence time for particles of size 0.5 to 1 mm was reported to vary from 1.4
up to 1.7 seconds. They mentioned that in rapid pyrolysis this residence time was not sufficient
to volatilize all the fractions. They also reported that at these high temperatures the concentration
of CO2 decreased and the concentration of CO in the products increased with temperature in the
aforesaid range. Demirbas [18] mentioned that cracking gaseous hydrocarbons, by increasing
temperature, enhances the production of H2. Demirbas [19] also worked on slow pyrolysis
(having 10 K/s heating rate) of agricultural residues in the temperature range of 677-977oC. They
observed that the yield of char increased by increasing particle size; besides, higher lignin
content in the biomass lead to higher char yield. Chen et al. [20] studied the effects of different

Page | 10
parameters on pyrolysis/gasification of biomass for gas production and reported that the gas
yield increased significantly by increasing the pyrolysis reaction temperature and/or the
residence time of the volatiles. One of the major observations in pyrolyzing biomass is that by
increasing the pyrolysis temperature, liquid and char yields decrease while gaseous products
increase [17,18].
There are differences between oxidative (or steam) gasification and pyrolytic gasification of
biomass, which consists of three principal components – cellulose, hemicellulose and lignin
[reference]- along with minor amounts of extractives. In the case of lignin, it has been reported
that its pyrolytic gasification yielded slightly lower amounts of char than in its oxidative
gasification, when lignin was gasified in a laminar entertained flow reactor at temperatures of
800 and 1000 oC with residence time of 1 second[21]. It was also reported that mass loss of
lignin during oxidative (or steam) gasification and pyrolytic gasification of lignin in TGA
(Thermogravimetric Analysis) is comparable; however, depending on the type of lignin, this
mass loss can be higher during pyrolytic gasification [21]. Thus, pyrolytic gasification may be
used to maximize the yield of gaseous products.
The purpose of this experimental study is to demonstrate that pyrolytic gasification of biomass
feedstocks can produce a high-energy-content gaseous fuel mix, which can be burned in an
environmentally-benign manner, similar to natural gas, for power generation, process heat and
other energy-related applications. A laboratory-scale system was designed and constructed to
pyrolytically gasify waste solid fuels, such as residual biomass, generate a combustible gaseous
fuel and demonstrate its conversion to heat and, eventually to electricity.

Page | 11
CHAPTER 2
DDGS Background
DDGS is produced as a byproduct of the ethanol manufacturing process and is created when the
dry grind method of ethanol production is used. Dry grind involves crushing the corn to reduce
the dry particle size via high speed hammer mill. The dried corn is fermented and distilled into
ethanol, whereas the leftover byproducts (stillage) is converted into its constituents, DDGS, wet
distillers, dried grains, etc [22]. DDGS has a long shelf life, due to its low moisture content
(~10-13 wt%). The processing of corn yields 378 L of ethanol and 309 kg of DDGS, per metric
ton [23], and is primarily used as a low-cost high-protein feed for cattle along with other forms
of ethanol production byproducts [24]. Being generated in large volumes as a byproduct of
ethanol production and given its high specific internal energy or heating value (19.8 MJ/kg),
DDGS is an attractive option for biomass-based waste-to-energy generation. The biomass pellets
were crushed and sized on a #8 mesh (2.36 mm) sieve to collect the smaller particles that the
feeding system is optimized to process. A one gram sample is shown below in the left entry of
Figure 1. A breakdown of the composition of DDGS is shown in Figure 2.

Page | 12
Figure 1: One gram samples of crushed corn-residue-based DDGS (left), and King Grass-base biomass (right).
Proximate Analysis Giant King Grass (% Dry basis) [26] DDGS (% Dry basis) [28]
Volatile Matter 76.3% 78.2%
Ash 4.2% 7.1%
Fixed Carbon 19.4% 14.7%
Total Sulfur 0.13% 0.4%
HHV 18.4 MJ/kg 19.8 MJ/kg
Figure 2: Proximate Analysis of King Grass and DDGS.

Page | 13
King Grass Background
Giant King Grass is a rapidly growing biomass crop that has similar characteristics to sugar cane.
The King Grass is a proprietary crop produced by Viaspace Inc. that has been grown in
Southeast Asia and has recently been approved for planting and harvesting in the US [25, 26].
Giant King Grass grows extremely fast; it can reach a height of 13 feet in 190 days, which is the
optimum for biomass pellet production. In addition, the King Grass can be continually harvested
every 120 days to ensure a steady production rate. Yields of raw King Grass are 375 metric tons
per hectare with 70% moisture content when grown in tropical climates, which equates to 100
metric tons per hectare of dried king grass [25, 26]. The specific energy content of dry King
Grass is 18.4 MJ/kg, resulting in 1.84 x 10⁶ MJ per hectare, enough energy to power 44
American homes for one year (1.84 x 10⁶ MJ = 511.1 GWh per year) [4]. The composition of
King Grass as compared to DDGS is shown in Figure 2.

Page | 14
CHAPTER 3
Experimental Apparatus
A laboratory-scale pyrolytic gasifier system has been designed and constructed to accept
granulated or pelletized feedstocks, and to thermally decompose (devolatilize) them via
pyrolysis. The generated gaseous pyrolyzates are then mixed with air and burned in a nominally
premixed burner. For demonstration purposes, the burner is also coupled with a miniature steam
generator and steam engine setup (Wilesco, Model D18) to generate electricity. The pyrolytic
gasifier is shown in Figure 3 and details are shown in Figure 4 Its major components are a
feeding system and a furnace or heating chamber. The feeding system incorporates a reservoir
with a hopper where pelletized feedstocks are stored, an electric motor and an auger-driven
feeding box. Pellets are gravity-fed from the reservoir through the hopper. The variable-speed
electric motor (Leeson Corp. model 985.613F, 8.7 N-m peak torque, 0 – 94 RPM, continuous
duty) drives the horizontally-oriented auger, which carries the pellets from the feeding box to the
vertical purge chamber leading to the furnace. The rotating auger uses a sealed bearing to
minimize leakage from the system and, thus maintain the pressure of the inert carrier gas.
The furnace is defined by a stainless steel tube, whose dimensions are designed to provide
sufficient room for the expansion of the biomass pyrolyzate gases. The furnace is heated by
electrical resistance elements (ATS, Series 3110), rated at 1.43 kW. The furnace is connected to
a proportional integral derivative (PID) loop temperature controller (ATS, Series XT16). This is
a feedback controller that computes an error value based on the difference between the measured

Page | 15
variable and a desired set point and it tries to minimize such error by varying the inputs. This
allows for precise and reliable regulation of system temperature at any desired set point. The
speed of the electric motor that drives the feeding system is adjusted to obtain the desired feeding
rate of material. The direct-drive motor and screw-type auger system provide a linear
relationship between feeding rate and motor speed (RPM), thus allowing for precise control of
feeding rate. As experiment runs, the motor speed (and thusly the feedstock feeding rate) and the
carrier gas flow are adjusted as necessary to obtain a stable flame operation.
At several vertical locations in the tubular furnace, asymmetrically-perforated disks have been
inserted to intercept the falling biomass pellets and facilitate their gasification (Figure 5). Since
the biomass pellets were crushed to smaller entities (granules), an additional stainless steel mesh
was attached to each perforated plate. In this manner, the biomass granules devolatilize in the
radiation cavity of the furnace, instead of settling at its bottom. In addition to this feature, the gas
exit tube in the chamber is elevated from the bottom, to avoid being plugged by settling chars
and tars, and it is protected by a small conical roof to prevent impingement of remaining
material. The system is fitted with two relief valves, to avoid over-pressuring.
The most leak-prone connection in the system is that between flanges inserted between the
gasification and purging chambers. High-temperature gaskets (THERMA-PUR style 4122
corrugated metal gasket, manufactured by Garlock Sealing Technologies) have been used for
sealing the flanges. The gradient of pressure drop with time is shown in Figure 6. The flange

Page | 16
bolts were tightened to 45.2 N-m (400 in-lb) and the set pressure was 68.9 kPa (10 psi). The
relief valves (rated at 234.4 kPa/34 psi) were tested at both STP and operating conditions 850 °C.

Page | 17
Figure 3: Laboratory-scale pyrolytic gasification apparatus, specifically designed and constructed for the needs of this
study.

Page | 18
Figure 4: (a) a schematic of the feeding system; (b) a CAD model of the pyrolysis system; (c) photograph of pyrolysis
chamber with metal plates shown; (d) cross section of gasification chamber; (e) Gas temperature gradient of gasification
chamber.

Page | 19
Figure 5: Perforated steel plates covered with stainless steel mesh (left) and without mesh (right).
Figure 6: Gage pressure holding capability of the furnace tube with time at a furnace set-point temperature of 850°C.

Page | 20
A typical axial gas temperature distribution in the furnace, as measured by a type-K
thermocouple (Omega) is shown in Figure 4e. In this case, the controller was set to maintain a
constant furnace wall temperature of 950 °C. Temperature measurements were taken at each of
the perforated disks in the chamber in order to gauge the uniformity of the heating. The
temperature gradient plateaued with distance in the bottom-half of the chamber, were the
maximum temperatures prevailed.

Page | 21
Experimental Procedure
In each experiment, granulated biomass was loaded into the hopper, and the feeding system was
sealed. The carrier gas was nitrogen at a flow rate of 1 lpm. Nitrogen was used to purge the air
out of the system and ensure oxygen-free pyrolysis. Thereafter, the biomass granules were
introduced to the system at the desired feeding rate. A typical plot of the feeding mass of
granules with time is shown in Figure 7. The feeding system was detached from the pyrolysis
apparatus and was setup on a bench top where a calibration experiment was carried out using an
electronic mass balance, positioned to catch and measure the output. The hopper was loaded with
granulated biomass feedstocks and the drive motor was run at constant speed, with data readings
taken manually every 5 seconds. Results of three different runs are shown in Figure 7,
demonstrating good repeatability. A rather linear feed rate of approximately 1 g/min is apparent,
at this particular setting of the motor.
During the course of the experiment, the pyrolyzate gasses were then channeled to either the
miniature steam engine burner, a Bunsen burner, or captured via syringe to be analyzed in the
gas chromatograph. The steam engine was operated with its separate set of manual controls to
maintain sufficient speed to illuminate the light bulb, whilst (if used) the Bunsen burner air inlet
was adjusted to vary the air/fuel mixture to capture and record data.

Page | 22
Figure 7: Results of feeding system calibration run for granulated DDGS and King Grass.

Page | 23
CHAPTER 4
Results and Discussion
The effluent gases from pyrolytic gasification of the King Grass and the corn-based DDGS
biomass were analyzed for composition and results are tabulated in Figure 8 and graphically in
Figure 9; both N2 and CO2 is used as the inert gas carrier, at a flow rate of 1 lpm. The mass flow
rate of granulated biomass in all experiments was set at 1 g/min. To obtain the chemical
decomposition of the gases, gas chromatography was conducted with a Hewlett Packard gas
chromatograph (model 6890), coupled to flame ionization and conductivity detectors (GC-
FID/CD).
Figure 8: Percentages of detected hydrocarbon species in King Grass pyrolyzate gases.

Page | 24
Figure 9: Comparison of Pyrolyzate Gas Composition.

Page | 25
During the combustion experiments, corn-based DDGS and King Grass biomasses were fed to
the pyrolytic gasifier at steady-state steady-flow conditions, and the ensuing pyrolyzates were
channeled to a Bunsen burner. Upon mixing with air therein, the charge was ignited and
nominally-premixed flames were obtained. The resulting flames from both biomasses were blue
in the center with pale orange surrounds, see Figure 10. It is worth mentioning here that
variations in the flow rate of nitrogen did not have any significant effect on the stability or
characteristics of the flames.
Figure 10: Photographs of nominally premixed flames burning gaseous pyrolyzates of (a) corn-based DDGS biomass, and
(b) King Grass biomass.
(a) (b)

Page | 26
The equilibrium code Stanjan [31] was run under the constant enthalpy and constant pressure
conditions, and the inputs were the mole fractions of the experimentally-detected gaseous
pyrolyzates, listed in Figure 8. Different amounts of air inputs to the Bunsen Burner result in
different equivalence ratios in the nominally-premixed flame and, consequently, result in
different amounts of CO and CO2 in the products. These theoretical predictions of the CO2/CO
ratios in the flame are plotted in Figure 11, against the input equivalence ratios. The effluents of
the flame were also experimentally assessed for CO and CO2 concentrations by direct sampling
using an aspirated probe and channeling the sampled gas to an on-line California Instruments,
model 200 infrared gas analyzer. These experimental measurements of the effluent CO2/CO
ratios were superimposed to the predicted CO/CO2 ratios shown in Figure 11. Results suggest
that both biomass flames burned under mildly-rich conditions at an equivalence ratio (defined as
φ = (mfuel/mair)actual / (mfuel/mair)stoichiometric) in a range of 1.05 < φ < 1.1. It should be mentioned
that this range is approximate, as numerical predictions cannot be compared directly with the
experimental results since the effects of heat loss and chemical kinetics are not considered in the
chemical equilibrium Stanjan code.

Page | 27
Figure 11: CO2/CO vs. Equivalence ratio for corn-based DDGS and King Grass biomasses.
0
10
20
30
40
50
60
70
80
90
100
1.05 1.1 1.15 1.2 1.25 1.3
CO
2/C
O
Equivalence Ratio
DDGS Biomass
950 C
King Grass Biomass
950 C

Page | 28
Figure 12: Velocity profile of the volatiles inside the chamber.
As mentioned before, Chen et al. [20] showed that by increasing the residence time of the
volatiles in a furnace, from 1.3 to 10 s, the gas production from biomass increases. In this work
the residence time in the heated zone of the furnace assessed based on modeling results using the
Fluent-Ansys computational code. Based on computed velocity profiles in the furnace, illustrated
in Figure 12, the residence times of biomass volatiles therein were estimated to be in the range of
10-20 s, which according to the aforementioned reporting should have promoted effective
gasification.

Page | 29
Elimination of Tars and Waxes from the Effluent Gas
Initial experiments revealed that the King Grass biomass generated a lot of tars in the lines and
burner, which were troublesome as they often resulted in plugging the flow of gas. The initial
operational setup of the experimental apparatus featured approximately 2 m length of 6.35 mm
ID tubing, connected between the exit of the pyrolytic gasifier chamber and the inlet of the
Bunsen burner. During the experimental runs it was noticed that an excess amount of tars and
waxes were building up on the inlet of the Bunsen burner, thus restricting the flow of the
pyrolyzate gas to be combusted. Since the opening on the Bunsen burner is very small (1 mm),
only a minor amount of blockage is necessary to completely restrict the flow of gas and thusly
stop the experiment. Due to the long length of un-insulated tube that carries the furnace effluent,
the pyrolyzates were cooled and some tars and waxes that were present in the gas-phase at the
exit of the hot furnace would condense in the tube and form a solid buildup. This was confirmed
by a disassembly of the system and an inspection of the tubes for blockage.

Page | 30
Figure 13: Steam engine apparatus set up in close proximity to pyrolysis chamber outlet.
To alleviate this problem, a literature search was performed to identify the temperature at which
tars and waxes condense out of the biomass pyrolyzates. Mansur et al. [29] noted that amount of
tars present in the effluent gas (by mass) started to decrease above 200 °C and dramatically
decreased above 250 °C during a study on the effects of hydrothermal temperature DDGS
product yield. Meng et al. [30] observed that during the pyrolysis of DDGS, olive residue, and
other forms of biomass it was necessary to heat the gas temperature to 150 °C to avoid the
condensation of gas in the line when attempting to sample the products in a spectrometer. Based
on these results, new experiments were conducted where the tubing connecting the pyrolytic
gasifier and the burner was shortened to only 20 cm and it was wrapped the in an thermal tape
Model Steam
Engine
Electronic Thermal
Insulation
Pyrolysis
Chamber

Page | 31
(Thermolyne, BW0 series) to heat the pyrolyzate gas, which was then covered by a few mm-
thick ceramic fiber insulation. The thermal tape was electrically powered and connected to a
Variac controller, set to maintain 200 °C. A photograph of the apparatus as set up in this
condition is shown in Figure 13.
The pyrolysis system was operated normally while feeding King Grass and a thermocouple was
inserted in the insulation to obtain the approximate gas temperature. King Grass was chosen for
this run due to its high buildup of tars and waxes that clogged up the system and only enabled a
sustained flame for a brief time (ca. 5 seconds). With the thermal tape maintaining a constant
200 °C gas temperature, the flame as produced by the burner was consistent and reliable.
The King Grass fueled flame was sufficiently steady to operate the steam engine continuously
and generate a small amount of power. Upon inspection after shutdown, the burner and gas
supply tube was completely free of any buildup of tars and/or waxes. Maintaining the pyrolyzate
gas above 200 °C showed a drastic improvement in the length of time a flame could be
sustained, which is driven by the reduced blockages as a result of less tar and wax buildup.

Page | 32
Proof of Concept: Use of Biomass Pyrolyzate Gasses to Generate
Electricity
A technical goal of this project has been to produce a flame with sufficient energy to run the
miniature steam engine and produce DC electricity sufficient to run a light bulb, shown in Figure
14. The operation of the miniature engine should be akin to that obtained burning natural gas.
As mentioned before, a biomass mass feeding rate of 1 g/min generated a flame that was more
than sufficient to produce steam and run the miniature steam engine at a high speed. The steam
engine system was able to sustain a boiler pressure of 1 bar and operate consistently at 1800
RPM for duration of an experiment, typically 20 minutes. This operational speed was sufficient
to use the on board generator to produce a small electric current to illuminate the miniature light
bulb. This demonstrated that the current design of the pyrolytic gasifier can be used to produce
gaseous fuels with high energy content and, in turn, can reliably generate useful work in the form
of electricity. Supplemental calculations for this section are found in Appendix 1.
Figure 14: Flame generated by the steam engine burner (left) and still photograph of the steam
engine in operation (right). The coupled electricity generator powers the light bulb.

Page | 33
CHAPTER 5
Conclusions
Based on conceptual ideas and a literature review of similar concepts, a multi-step process has
been developed to pyrolyze biomass-based feedstocks and use the pyrolyzate gasses to generate
a clean-burning energy source. A laboratory scale system was designed, fabricated, constructed,
and successfully produced flammable pyrolyzate gas. The laboratory-scale system was then
integrated with a model steam engine and dynamometer and the pyrolyzates were combusted to
heat the boiler, which in turn produces steam to run the steam engine and generate electricity to
illuminate a light bulb. Throughout the course of development, some modifications to the overall
design were made to reduce the amount of oils and waxes in the effluent gas, increase system
tolerance to ash/carbon buildup in the pyrolysis chamber, and feed the biomass more effectively.
The overall result of the experimentation revealed that biomass-based feedstocks can be easily
turned into a clean burning, light hydrocarbon-based fuel via fast pyrolysis. This pyrolysis
process results in the creation of a flammable gas that can be combusted in a pre-mixed manner,
which can be very well controlled and adjusted to obtain the desired equivalence ratio and
minimize the production of soot. Gas chromatography analysis revealed the composition of the
pyrolyzate mixture to be mostly ethylene and methane which results in an extremely clean-
burning flame.
Future work will expand on maintaining pyrolyzate gas temperature above 200 °C to minimize
tar/oil production, improvements in pyrolysis chamber design to enable collection of ash build-

Page | 34
up, and feeding system improvements to reduce jams/clogs and increase tolerance to biomass
feedstock size variation. Design and construction of a pilot-scale biomass pyrolysis system
(~100 kg/hr) with a self-sustaining pyrolyzer is the next logical step in this course of research.
To facilitate the modeling and baseline engineering analyses on the scaling and capacity of a
large-scale system, a simple economic analysis has been conducted to ascertain the profitability
given some basic assumptions of inputs and running costs. Based on the initial predictions, a
feed rate in excess of 2700 kg/hr will be necessary to generate enough electricity to turn a profit,
based on electricity rates at the time. Utilizing a scheme to recirculate the CO2 gas that is
generated in the products of combustion from this electric power generation will greatly reduce
running costs and increase profitability (details found in Appendix 4). Maintaining an accurate
economic model is essential, as construction and operation of a pilot-scale facility requires
considerable investment which traditionally comes from small investor-sourced venture capital
funds. Obtaining the necessary venture capital investment must show the system can be operated
to turn a profit and the technology is mature enough to perform this task reliably; thus the need to
continue to refine the engineering design of the system and process, as well as the economic and
financial model are important undertakings to pursue as future work.

Page | 35
Acknowledgments
The authors would like to thank Massachusetts Clean Energy Center (MassCEC) for financial
support through the MassCEC Catalyst Award program, the Garlock Sealing Technologies for
providing gaskets, the Viaspace Company for providing biomass samples, John Doughty and the
Northeastern Student Machine Shop for their help and advice on fabrication, and Mr. Saber
Talebi Anaraki for his technical assistance in the design and construction of the apparatus.

Page | 36
Works Cited
1- Combustion of Coal, Bagasse and Blends thereof. Part I: Emissions from Batch Combustion
of Fixed Beds of Fuels.” Marcia Bragato, Kulbhushan Joshi, Joel B. Carlson, Jorge A.S. Tenorio
and Yiannis A. Levendis, Fuel, 2012, 96, 43-50.
2- Combustion of Coal, Bagasse and Blends thereof. Part II: Speciation of PAH Emissions.”
Marcia Bragato, Kulbhushan Joshi, Joel B. Carlson, Jorge A.S. Tenorio and Yiannis A.
Levendis, Fuel, 2012, 96, 51-58.
3-Stephen Danje. Fast Pyrolysis of Corn Residues for Energy Production, M.Sc Thesis,
Department of Chemical Engineering, Stellenbosch University, South Africa, 2011.
4-Energy Information Administration. (n.d.). EIA FAQ Webpage. Retrieved from
http://www.eia.gov/tools/faqs/faq.cfm?id=97&t=3
5-Energy Information Administration. Annual Energy Review; Energy Information
Administration: Washington, DC, 2012. (n.d.).
6-Led by Demand in China, Energy Use Is Projected to Rise 53% by 2035. (2011). (The New
York Times) Retrieved from http://www.nytimes.com/2011/09/20/business/energy-
environment/energy-demand-is-expected-
to-rise-53-by-2035.html?_r=0
7- Reed, T.B. and Gaur S., Survey of Biomass Gasification 2001, 2nd edition, National
Renewable Energy Laboratory, 2001, BEF Press.
8- Michael Jerry Antal, Jr., Stephen Glen Allen, Deborah Schulman, Robert J. Divilio and
Xiaodong Xu, Biomass Gasification in Supercritical Water, Ind. Eng. Chem. Res., 2000, 39,
4040-4053.
9- Lopamudra Devi, Krzysztof J. Ptasinski, Frans J.J.G. Janssen, A review of the primary
measures for tar elimination in biomass gasification processes, Biomass and Bioenergy, 2003, 24
125 – 140.
10- Javier Gil, Jose Corella, MarõÂa P. Aznar, Miguel A. Caballero, Biomass gasification in
atmospheric and bubbling fluidized bed: Effect of the type of gasifying agent on the product
distribution, Biomass and Bioenergy, 1999, 17, 389-403.
11- X.T. Li, J.R. Grace, C.J. Lim, A.P. Watkinson, H.P. Chen, J.R. Kim, Biomass gasification in
a circulating fluidized bed, Biomass and Bioenergy, 2004, 26, 171 – 193.

Page | 37
12- P.M. Lv, Z.H. Xiong, J. Chang, C.Z. Wu, Y. Chen, J.X. Zhu, An experimental study on
biomass air–steam gasification in a fluidized bed, Bioresource Technology, 2004, 95, 95–101.
13- Yukihiko Matsumura, Tomoaki Minowa, Biljana Potic, Sascha R.A. Kersten, Wolter Prins,
Willibrordus P.M. van Swaaij, Bert van de Beld, Douglas C. Elliott, Gary G. Neuenschwander,
Andrea Kruse, Michael Jerry Antal Jr., Biomass gasification in near- and super-critical water:
Status and prospects, Biomass and Bioenergy, 2005, 29, 269–292.
14- Ian Narvaez, Alberto Orio, Maria P. Aznar, and Jose Corella, Biomass Gasification with Air
in an Atmospheric Bubbling Fluidized Bed. Effect of Six Operational Variables on the Quality of
the Produced Raw Gas, Ind. Eng. Chem. Res., 1996, 35, 2110-2120.
15- S. Rapagna, N. Jand, A. Kiennemann, P.U. Foscolo, Steam-gasification of biomass in a
uidised-bed of olivine particles, Biomass and Bioenergy 19 (2000) 187-197
16- Zanzi R, Sjöström K, et al. Rapid high-temperature pyrolysis of biomass in a free-fall
reactor. Fuel, 1996 ;75(5):545–50.
17- Zanzi R, Sjöström K, et al. Rapid pyrolysis of agricultural residues at high temperature.
Biomass Bioenergy, 2002 ;23:357–66.
18- Demirbas A. Gaseous products from biomass by pyrolysis and gasification: effects of
catalyst on hydrogen yield. Energy Convers Manage 2002;43:897–909.
19- Demirbas A. Effects of temperature and particle size on bio-char yield from pyrolysis of
agricultural residues, J. Anal. Appl. Pyrolysis, 2004, 72, 243–248.
20- G. Chen, J. Andries, Z. Luo, H. Spliethoff, Biomass pyrolysis/gasification for product gas
production: the overall investigation of parametric effects, Energy Conversion and Management,
2003, 44, 1875–1884.
21- Kumar V. Pyrolysis and gasification of lignin and effect of alkali addition, P.h.D Thesis,
School of Chemical & Biomolecular Engineering, Georgia Institute of Technology, Atlanta, GA,
2009.
22-US Grains Council. (n.d.). A Guide to DDGS. Retrieved from
http://www.ddgs.umn.edu/prod/groups/cfans/@pub/@cfans/@ansci/documents/asset/cfans_asset
_417244.pdf
23-Government of Western Australia. (n.d.). Potential Uses for Distillers Grains. Retrieved from
http://www.agric.wa.gov.au/objtwr/imported_assets/content/sust/biofuel/potentialusesgrains0420
07.pdf
24-The Kansas Corn Growers Association . (n.d.). Kansas Grains. Retrieved from
http://www.ksgrains.com/ethanol/DDGSFacts.pdf

Page | 38
25-Viasapce Inc. (n.d.). Biomass Magazine. Retrieved from
http://biomassmagazine.com/articles/8175/usda-
approves-viaspaces-giant-king-grass-in-u-s
26-Viaspace Inc. (n.d.). Viaspace Green Energy. Retrieved from
http://www.viaspacegreenenergy.com/giant-
king-grass.php
27- Jinno et al. Thermal Decomposition Characteristics of Critical Components in Solid Wastes,
Environmental Engineering Science, 2004, Volume 21, Number 1.
28- J. Giuntoli, W. de Jong, S. Arvelakis, H. Spliethoff, A.H.M. Verkooijen, Quantitative and
kinetic TG-FTIR study of biomass residue pyrolysis: Dry distiller’s grains with solubles (DDGS)
and chicken manure, J. Anal. Appl. Pyrolysis, 2009, 85, 301–312.
29 - Dieni Mansura, Mana Shimokawaa, Kiyoshi Obab, Yuta Nakasakaa, Teruoki Tagoa, Takao
Masudaa. Conversion of ethanol fermentation stillage into aliphatic ketones by two-step process
of hydrothermal treatment and catalytic reaction. Fuel Processing Technology Volume 108,
April 2013, Pages 139–145 (Special Issue of APCRE11).
30 - Xiangmei Meng, Patricia Benito, Wiebren de Jong, Francesco Basile, Adrian H. M.
Verkooijen, Giuseppe Fornasari, Angelo Vaccari. Steam−O2 Blown Circulating Fluidized-Bed
(CFB) Biomass Gasification: Characterization of Different Residual Chars and Comparison of
Their Gasification Behavior to Thermogravimetric (TG)-Derived Pyrolysis Chars. Energy Fuels
2012, 26, Pages 722−739.
31- Chemical Equilibrium Calculator, http://navier.engr.colostate.edu/~dandy/code/code-
4/index.html

Page | 39
SUPPLEMENTAL CALCULATIONS
APPENDIX 1: Required amount of biomass feedstock to operate the
pyrolytic gasifier in a self-sustaining mode, i.e., without external
heating
Applying the energy balance for the system determines the amount of biomass required. For
example, the input of DDGS pellets required, so that they can provide sufficient energy to heat
the system from room temperature to 800˚C. In the derivation below, feed energy (EFeed)
corresponds to the mass of gaseous fuel blend required to heat the pyrolysis chamber to 800˚C
multiplied by its energy content. Pyrolysis energy (EPyrolysis) is the amount of energy required to
gasify the pellets. Heat Loss energy (ELoss) is the heat loss from the system to the ambient and all
other unforeseen losses. EOut is the output energy required for the system to be self-sustaining,
i.e. to produce an equivalent amount of energy as input to the system as the electric heater does
in the current setup (1430 W). The energy balance equation is shown in equation (1).
Equation (1)
Calculation of
The energy required for pyrolysis of DDGS is not a known quantity; due to DDGS being plant
based, the pyrolysis energy of cellulose is used as a surrogate, which is 584 kJ/kg at 355˚C [27].

Page | 40
Our laboratory system runs at a higher temperature to minimize production of tar and wax. At
the higher temperature of 800˚C the corresponding energy requirement per unit mass of
feedstock is calculated using Equation (2) by taking the sum of pyrolysis energy at 355˚C and the
energy to raise the biomass pyrolyzate temperature from 355˚C to a higher temperature, say
800˚C.
Equation (2)
The cp in this calculation is used for ethylene gas; due to the nature of the pyrolyzate
composition, ethylene is used as a surrogate for these purposes due to its dominance in the
pyrolyzate gasses. Performing the interpolation to calculate specific heat of ethylene at T=800 ˚C
is shown in equations (3 – 5).
Equation (3)
Equation (4)
Using the calculated CP from equation (4) and substituting into equation (1) yields the following
pyrolysis energy and the corresponding rate equation:
( )
Equation (5)
Equation (6)

Page | 41
Calculation of
Two primary sources of losses in the system is heat transfer from the pyrolysis chamber to
ambient through the insulation, and energy required to raise the temperature of the Nitrogen
carrier gas.
Equation (7)
The conductive heat loss is calculated using the relationship in equation (7).
Equation (8)
The geometry of the heater and insulation is evaluated via Figure A.1 and equations (9 – 10),
where A is the outer surface area of the furnace and Thk represents the thickness of the
insulation.
- ( ) Equation (9)
( ) ( ) Equation (10)
Equation (11)
Substituting equations (9 – 11) into equation (8) yields the following result, with k = 0.05 W/mK
for calcium silicate for the insulation around the furnace.

Page | 42
(
) ( )( )( )
( ) (
) Equation (12)
The relationship to solve for energy required to heat up the Nitrogen carrier gas in the pyrolyzer
is calculated in equation (13).
Equation (13)
Substituting in known values for specific heat, gas density, flow rate, and temperature yields the
following (equation 14):
(
) ( ) (
)
( )( )
(
)
Equivalently, (
) Equation (14)
The value of is several orders of magnitude less than and thusly is determined to be
negligible. The following relationship is then assumed for (from equation 7):
Equation (15)

Page | 43
Figure A.1: Schematic Picture of Insulation Thickness and Length (units in inches).
Multiplying the total heat loss by a factor of 2 to consider all unpredicted and other unknown
losses yields the following value:
Equation (16)
Calculation of
EIn is the total energy input to the system from biomass feedstocks and is calculated with the
relationship below.
Equation (17)
Equation (18)
Setting up the expression for to solve for
Page | 44
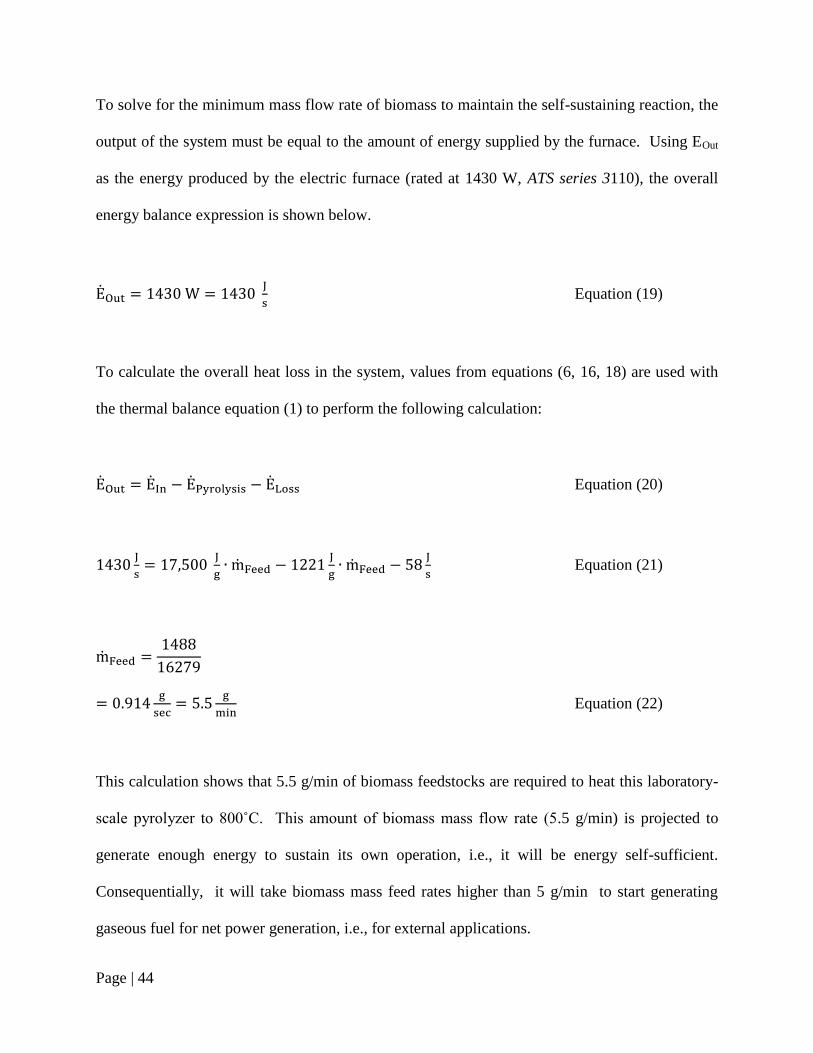
To solve for the minimum mass flow rate of biomass to maintain the self-sustaining reaction, the
output of the system must be equal to the amount of energy supplied by the furnace. Using EOut
as the energy produced by the electric furnace (rated at 1430 W, ATS series 3110), the overall
energy balance expression is shown below.
Equation (19)
To calculate the overall heat loss in the system, values from equations (6, 16, 18) are used with
the thermal balance equation (1) to perform the following calculation:
Equation (20)
Equation (21)
Equation (22)
This calculation shows that 5.5 g/min of biomass feedstocks are required to heat this laboratory-
scale pyrolyzer to 800˚C. This amount of biomass mass flow rate (5.5 g/min) is projected to
generate enough energy to sustain its own operation, i.e., it will be energy self-sufficient.
Consequentially, it will take biomass mass feed rates higher than 5 g/min to start generating
gaseous fuel for net power generation, i.e., for external applications.

Page | 45
APPENDIX 2: Calculation of Self-Sustaining Pyrolysis System
Efficiency
The system efficiency is defined as the ratio between the net energy output and the overall
energy input.
Equation (23)
Wherein Eout is the energy output of the proposed self-sustaining waste-to-energy process,
EFurnace is the energy input to the system from the electric furnace to heat and pyrolyze the
feedstocks, and EIn is the total energy input to the system via the biomass feedstocks.
Equation (24)
Equation (25)
Taking the known values of equations (24 – 25) that were calculated previously (equations 18,
21) and substituting into the efficiency equation (23):
(
)
Equation (26)
Collecting terms and solving for ηS:
Equation (27)

Page | 46
As shown in Equation (27), for the apparatus used in this study, there is a relation between the
self-sustaining efficiency, ηs, and the mass feeding rate, , as shown in Figure A.2. Due to the
high energy content of the feedstocks, the low thermal losses, and extremely low pyrolysis
energy, the total energy output of the system scales up quickly and the ideal efficiency can be as
high as 92%, at high feed rates for an industrial scale (10 g/min or higher).
Figure A.2: Relation Between the Self-Sustaining Efficiency (ηs) and the Feeding Rate (g/min).

Page | 47
APPENDIX 3: Thermocouple temperature measurement correction
for radiation effects.
The temperature at different elevations of the pyrolysis chamber was measured with a bare
thermocouple. These readings need to be corrected to exclude the furnace wall radiation effects.
This correction is based on an unsteady state energy balance on the thermocouple bead.
Equation (29)
It is assumed that the bead of the thermocouple is in thermal equilibrium with its surroundings
(steady state). A k-type OMEGA thermocouple was used for these measurements and the
diameter of the bead was measured to be 500 µm. By considering steady state conditions,
equation (29) equation changes to below:
Equation (30)
Defining the convection and radiation terms:
( ) Equation (31)
(
) Equation (32)

Page | 48
Where hconv is the convection heat transfer coefficient, Ab is the area of the bead and Tgas and Tb
are temperatures of the gas and bead respectively. Heat transfer coefficient h can be determined
from following equations (33 – 35) by considering the bead to be a spherical object.
(
)
Equation (33)
( )
Equation (34)
The Nusselt number calculated is valid for RaD < 1011
and Pr > 0.7.
Finally, equation (31) becomes:
( ) (
) Equation (35)
It needs to be mentioned that for obtaining convection coefficient we need to have the thermal
conductivity of the gas. For calculating thermal conductivity there are relations that can be used
and since these relations are based on gas temperature, it is needed to first assume a number for
gas temperature and then by trial and error zero the equation (35).

Page | 49
APPENDIX 4: Economic Considerations for Large-Scale Operation
As an exploratory exercise, a number of calculations have been conducted to approximate the
losses and determine the potential net energy and financial gains/losses associated with scaling
up the aforementioned pyrolysis process to an industrial scale. Making some general
assumptions on running costs, system uptime, and incorporating data from this research, a basic
economic model is constructed to ascertain the profitability of pyrolyzing giant king grass and
using the resulting pyrolyzate gasses to generate electricity. Figure A.3 is an overall spreadsheet
used to perform these basic calculations.

Page | 50
Figure A.3: Economic analysis of biomass pyrolysis as used for energy production.
Biomass Fed kg/hour 5000
Carrier gas required L per kg of biomass 250
Carrier Gas Feed [Nitrogen] L/hour 1250000
Hours/Shift Hours 8
Shifts/Day Quantity 2
Uptime 75% 0.75
Hours/Day Hours 12
Maintenance Rate $/hour 50
Daily Maintenance Cost $/day 600
Labor Rate $/hour 50
Daily Labor Cost $/day 600
Daily Biomass Feed kg/day 60000
Daily Carrier Gas Use L/day 15000000
Energy Content King Grass kJ/kg 18400
Pyrolysis Energy King Grass kJ/kg (Per appendix 2 calculations) 1221
Energy Input kJ/day 1104000000
Energy used to Pyrolyze kJ/day (10% of total input) 73260000
Energy Available for Recovery kJ/day 1030740000
Wholesale Energy Price New England, (http://www.eia.gov/electricity/wholesale/), $/kWh 0.056
Recovered Energy Efficiency Factor 40%, typical rankine cycle power plant 0.4
Recovered Energy kJ/day 412296000
Recovered Energy kWh/day 114526.6667
Recovered Energy Value Per Day $/day 6413.493333
Cost of Carrier Gas $/L 0.00028
Daily Cost of Carrier Gas $/day 4200

Page | 51
Varying the feed rate of this economic model yields the following relationship between feeding
rate and profitability (Figure A.4).
Figure A.4: Biomass electrical generation profitability as a function of feed rate.
The income per kg of biomass is constant, due to the fact that each kg of biomass contains the
same amount of energy and thus generates the same amount of electricity. Whereas, the
expenditures roll up items that are remain the same per kg of feedstock (carrier gas) and constant
regardless of feed rate (labor and maintenance costs). Thus, the expenditures experience
economies of scale effect as feed rate increases and eventually become less then the income,
which would indicate the generation plant is making a profit. For the current setup and
assumptions, at feed rates of approximately 2700 kg/hr and higher, the energy conversion will be
a profitable endeavor.

Page | 52
One of the main assumptions used herein for this economic model is use of bottled N2 as a
carrier gas to facilitate the pyrolysis process due to its inertness and ready availability in a
laboratory setting. Bottled gas becomes prohibitively expensive when used on an industrial
scale, given the proposed biomass feed rates and the ratio of N2 needed to maintain pyrolysis as
experimentally determined in the laboratory. A plot of the fraction of total running cost that is
used to procure the carrier gas is shown in Figure A.5.
Figure A.5: Percent share of total running cost for N2 carrier gas.
The cost share of carrier gas used increase rapidly as feed rates increase, as measured against the
total expenditures, due to the fact that manpower and maintenance costs remain the same while
usage of carrier gas increases. One of the ideas put forth in Chapter 4 is the feedback of
combustion product gasses (CO2) to replace the N2 carrier gas. When biomass pyrolyzates are

Page | 53
used in combustion to generate electricity, regardless of its use in an internal combustion engine
or boiler to generate steam, the product of combustion will be mostly CO2. As tested in the lab,
the use of CO2 as a replacement for N2 had no discernible effect on overall pyrolyzate gas
composition. The use of these products of combustion gasses eliminate the need to purchase and
store costly bottled N2 gas on-site, which will greatly improve the overall profitability and
decrease running costs. It should be noted that the products of combustion gasses will need to be
treated and filtered for items such as any particulate matters present in the gas stream and utilize
a condenser to eliminate water vapor from entering the pyrolysis system.

Page | 54
APPENDIX 5: CAD Models and Drawings Generated for Assembly
and Fabrication of Components
Figure A.6: Complete 3-D model of the assembled system (also shown: the frame support structure).

Page | 55
;
Figure A.7: Exploded view (left) and cutaway (right) of pyrolysis chamber.

Page | 56
Figure A.8: 3-D mockup of the frame system constructed to support the pyrolysis chamber.

Page | 57
Figure A.9: 3-D model (above) and engineering drawing generated (below) for custom fabrication of the feed hopper.

Page | 58
Figure A.10: 3-D model (above) and engineering drawing generated (below) for custom fabrication of the pyrolysis chamber.

Page | 59
Figure A.11: 3-D model and cutaway (above) and engineering drawing generated (below) for the machining and assembly of
the feeding box and bearing support.

Page | 60
Figure A.12: 3-D model (above) and cutaway view (below) showing construction and assembly of the
feeding system.