Embed Size (px)
Citation preview
– 1 –
Enzyme-Based Logic:
OR Gate with Double-Sigmoid Filter Response
Oleksandr Zavalov,a Vera Bocharova,b,c Vladimir Privman,a Evgeny Katzb
a Department of Physics, Clarkson University, Potsdam, NY 13699, USA b Department of Chemistry and Biomolecular Science, Potsdam, NY 13699, USA c Oak Ridge National Laboratory, Oak Ridge, Tennessee 37831-6197, USA
J. Phys. Chem. B 116, 9683-9689 (2012) DOI 10.1021/jp305183d
Abstract
The first realization of a biomolecular OR gate function with double-sigmoid response
(sigmoid in both inputs) is reported. Two chemical inputs activate the enzymatic gate processes
resulting in the output signal: chromogen oxidation, which occurs when either one of the inputs
or both are present (corresponding to the OR binary function), and can be optically detected.
High-quality gate functioning in handling of sources of noise is enabled by "filtering" involving
pH control with an added buffer. The resulting gate response is sigmoid in both inputs when
proper system parameters are chosen, and the gate properties are theoretically analyzed within a
model devised to evaluate its noise-handling properties.
Keywords: Biomolecular computing,
Biomolecular information processing,
Enzyme logic, Noise, Binary response.

– 2 –
INTRODUCTION
One of the promising approaches to novel biosensing and computing1,2 for biotechnology
has been the use of molecular3,4 and biomolecular5,6 systems for information processing.
Biochemical7-11 and chemical12-16 processes have been utilized for various implementations as
logic elements and networks for signal processing and novel computation designs. Biomolecular
systems used in these applications have included those based on proteins/enzymes,9,17 DNA,7,18
RNA19 and whole cells.20,21 Applications could include the design of biosensors capable of
processing and multiplexing several biochemical signals in the binary format, 0 and 1.
Biomolecular computing systems in biochemical and biotechnological environments22 promise
design of a new class of such sensors, with the information processing carried out by
(bio)chemical processes rather than electronics.23,24 Logic-mimicking processes based on
biomolecular systems are being studied and developed25-35 for potential applications in
diagnostic and biomedical devices, including those responding to biomarkers characteristic of
various pathophysiological conditions of diseases or injuries.
Since biological environments and enzymatic process kinetics are noisy, in practical
situations it is challenging to discriminate between the signals or signal ranges designated as
“binary” 0 or 1 for the YES/NO type diagnostics. The conceptual approach involving “digital
processing” of biochemical signals aims at producing the output signal as well-defined YES/NO
(0 or 1) values, allowing direct coupling of the signal processing with chemical actuators
ultimately resulting in integrated biosensor-bioactuator “Sense/Act/Treat” systems.23,24 Such
digital biocomputing integrates biological and electronic/computing concepts, and requires a
careful optimization as part of the gate and network designs.25-29
Optimization of biochemical reaction based gates for digital functioning can be
accomplished by several approaches.25-29,36-39 Recently, we have shown28,36-39 that adding a
(bio)chemical “filter” process allows changing a convex shape of the response function — which
is typical for most of (bio)catalytic reactions — to a sigmoid shape. This approach solves the
problem of discrimination of and noise control in the output signal, at least at the single-gate
level, more efficiently than earlier-tried parameter tuning. Several (bio)chemical systems with

– 3 –
added “filtering” have recently been designed36-39 and optimized as standalone elements for
inclusion in biochemical logic networks.
Most gate functions devised5,6,9 for “biocomputing,” mimic those of the two-input/one-
output binary Boolean logic. This approach has been motivated by compatibility with electronic
circuit/network designs and requires two-input gates. However, except for a single very recent
result25,29,40 for an AND gate, all the other reported “filtering” approaches29,36-39 have thus far
been realized for a single-input processing corresponding to transduction or “identity” gate.
Furthermore, for shorter-term applications of biomolecular signal processing for diagnostics of
certain types of injuries,41,42 typically at least two markers provide the necessary level of the
output signal — such as that of the AND29,39 function — for a confident YES/NO determination
of the specific medical condition, for instance, liver injury.43,44 In the latter example, the added
filtering has allowed not only to improve the process, but for the relevant measurement “gate
times” actually enabled an accurate AND binary logic implementation.39,45
Therefore, it is important to incorporate and test various filtering approaches with a
“toolbox” of binary gates, including AND, OR, etc. This paper presents the first realization of an
OR gate with incorporated filtering. We utilize a biocatalytic reaction producing pH changes46-50
with the pH-buffering mechanism37 accomplished by adding the appropriately selected amount
of a buffer. We carry out an experimental mapping of the response function of the realized OR
gate. A numerical kinetic model is then utilized to quantify the behavior of the system and its
noise-handling when it functions as an OR binary gate. We demonstrate that the added
appropriately designed filtering step makes the gate’s response sigmoid.
EXPERIMENTAL
Chemicals and Materials
Esterase from Sus scrofa (porcine liver) (E.C. 3.1.1.1), laccase from Trametes versicolor (E.C.
1.10.3.2), tris(hydroxymethyl)aminomethane (Tris buffer), potassium hexacyanoferrate (II)

– 4 –
trihydrate and methyl butyrate 99% were purchased from Sigma-Aldrich. Ethyl butyrate 99%
was purchased from Fluka. All commercial chemicals were used as supplied without further
purification. Ultrapure water (18.2 MΩ·cm) from a NANOpure Diamond (Barnstead) source was
used in all of the experiments.
Composition and mapping of the OR gate with double sigmoid filter response
The main process of the OR gate was based on the reaction biocatalyzed by esterase (0.5 U·mL-1
equal to 4.85×10⁻⁵ mM based on 67 kDa molecular weight51) converting Input 1, ethyl butyrate,
or Input 2, methyl butyrate, or both of them to butyric acid and respective alcohols. The
experiments were performed in a non-buffered solution of 50 mM sodium sulfate or in Tris
buffer (4 mM or 8 mM) with the initial pH adjusted to 9.0. Because butyric acid produced by the
hydrolytic activity of esterase partially dissociates in aqueous solution the initial pH of the
solution decreases. It is known52,53 that overall rate of reactions biocatalyzed by laccase (the
second enzyme in the system) strongly depends on pH, being very slow at pH values above 8.1.
Therefore, change in pH, caused by the hydrolytic reaction biocatalyzed by esterase, activates the
reaction of laccase (0.5 U·mL-1 equal to 3.78×10⁻⁴ mM based on the average molecular weight of
66 kDa for fungal laccases54-57) which catalyzes the oxidation of 1 mM ferrocyanide in the
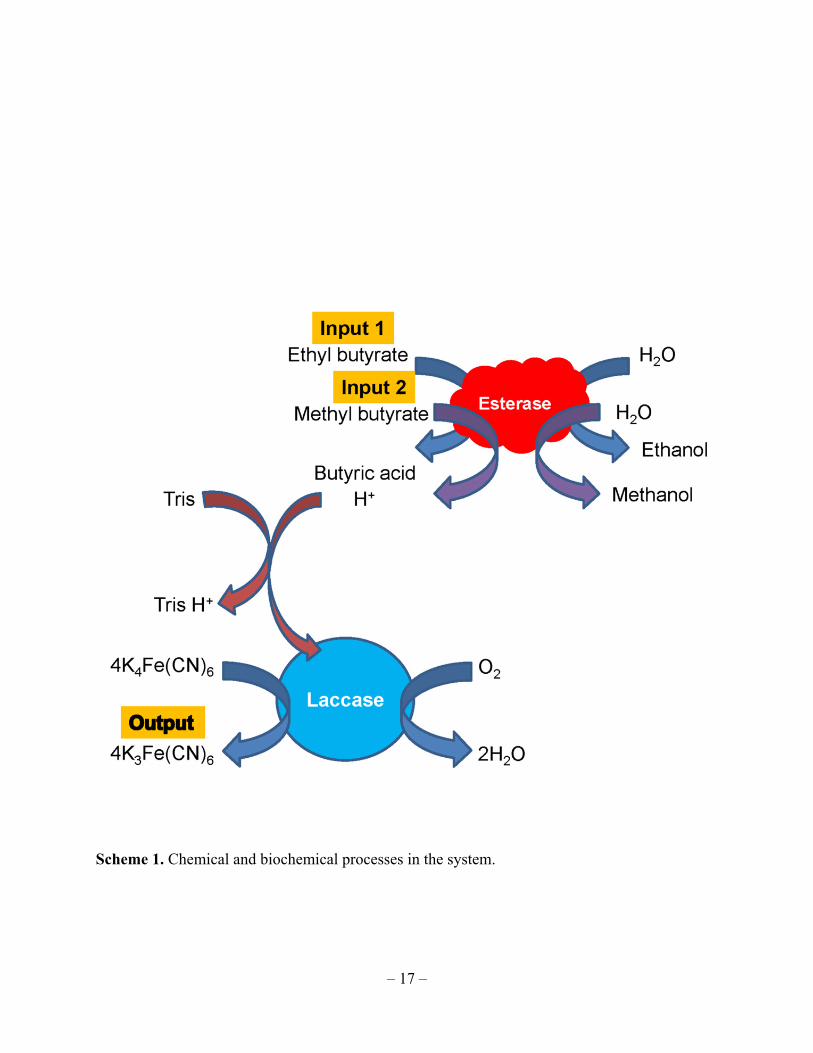
presence of oxygen. The schematic illustration of the composition of the OR gate is represented
in Scheme 1 (see page 17). In the gate-response-mapping experiments the input signals were
applied at (separately) variable concentrations, ethyl butyrate: 0, 0.5, 1, 3, 5, 7 and 10 mM, and
methyl butyrate: 0, 0.5, 1, 3, 5, 7 and 10 mM. There were thus 49 experimental data sets.
Constant oxygen concentration during the experiment was maintained by bubbling air in the top
part of the solution.
Optical and pH Measurements
Absorbance measurements were performed using a UV-2401PC/2501PC UV-visible
spectrophotometer with a TCC-240A temperature-controlled holder (Shimadzu, Tokyo, Japan) at
(37.0 ± 0.2) °C. The reaction was carried out in a 1 mL poly(methyl methacrylate), PMMA,
cuvette for all the different input combinations. The increase of absorbance was monitored as a
– 5 –
function of time, at = 420 nm, resulting from the formation of ferricyanide due to oxidation
biocatalyzed by laccase. The gate time, 800 sec, was selected to obtain a well-defined OR
function with filtering property. Absorbance was recalculated to the concentration of ferricyanide
by using the Lambert-Beer law, where the molar extinction coefficient of ferricyanide58 at =
420 nm is ε420 = 1 mM–1·cm–1 (thus resulting in numerically the same values for the absorbance
and concentration of ferricyanide). The change of the pH in the system was simultaneously
measured using a Mettler Toledo pH meter.
REALIZATION OF THE OR GATE AND ITS KINETIC MODELING
The present OR gate realization is described in Scheme 1. It involves two enzymatic
processes and the buffering part. The first enzyme is esterase, of concentration to be denoted as
, where is the time. Here esterase reacts with ethyl butyrate (concentration , Input 1)
or methyl butyrate (concentration , Input 2), or both, biocatalyzing production of ethanol
and methanol, respectively. Butyric acid (concentration ) is a byproduct of the process, and
its production lowers the pH of the system from its initial value of pH 0 9.0. The pH of the
system varies from 9.0 to as low as 4.2, depending on the input concentrations and whether the
buffer is present and its initial quantity.
Tris buffer (initially added as moles per unit volume) was introduced for “filtering” as
explained shortly. The experiments were carried out with no buffering: 0 mM, with
buffering yielding high-quality OR gate: 4 mM, and with excessive buffering which
impairs the OR gate realization: 8 mM. The added buffer instantaneously equilibrates to
produce a protonated form . This hinders the reduction of the pH. However, this mild
alkaline buffering effect persists only in the range of pH from 9 to slightly under 7.2, or until Tris
is fully in the protonated form. Thus, changing the initial buffer supply, , we can selectively
delay the onset of the drop in pH. However, ultimately the pH will decrease due to the
continuing production of butyric acid; (p 4.82.59

– 6 –
As the pH in the system decreases, the biocatalytic action of laccase results in the
conversion of K Fe CN into K Fe CN , of concentrations to be denoted and ,
respectively. The product of the process, , is measured at the gate time 800 sec by
absorbance (denoted Abs) at 420 nm. For the present system, Abs and P are numerically the
same (but have different units), as noted earlier.
For our model biochemical-logic gate system, we took the physical zeros, 0 0
0 0 0, of the signals as binary 0s, and experimentally convenient input values 1 0
10 mM and 1 0 10 mM as logic 1s. Logic 1 of the output, 1 , is set by the gate
function itself (see below). For the OR gate realization, we require the appropriate output values:
0, 1, 1, 1, at the four logic-input combinations, 00, 01, 10, 11, respectively. For study of the noise
handling, however, behavior of the system response to the inputs should also be explored4,5,60
near and between the logic input values. The latter study is carried out in terms of the scaled,
binary-range (zero to one) variables,
0 / 1 0 , 0 / 1 0 , / 1 , (1)
and the function , . This is done in the next section. Here we focus on the (bio)chemical
kinetics in terms of the original variables. Note that in practical applications the logic 1 values of
the inputs will be determined60 by the environment in which the gate is used, whereas the logic
zero values of the inputs (and output) need not be at the physical zeros.25,29,60
Figure 1 (the figures are appended starting on page 18) shows the OR gate realization
without filtering. As expected, the output values are at zero at the logic 00, and are close to each
other for logic 01, 10, 11 inputs, setting the binary 1 for the output. In the figure, the
experimental data are shown as compared to a model calculation. The latter was based on kinetic
process parameters taken from the literature, as detailed later, rather than of direct fitting of our
data. Superficially, the system response shown in Figure 1 is suggestive of a realized OR logic.
However, its noise-handling properties are not satisfactory as quantified in the next section.
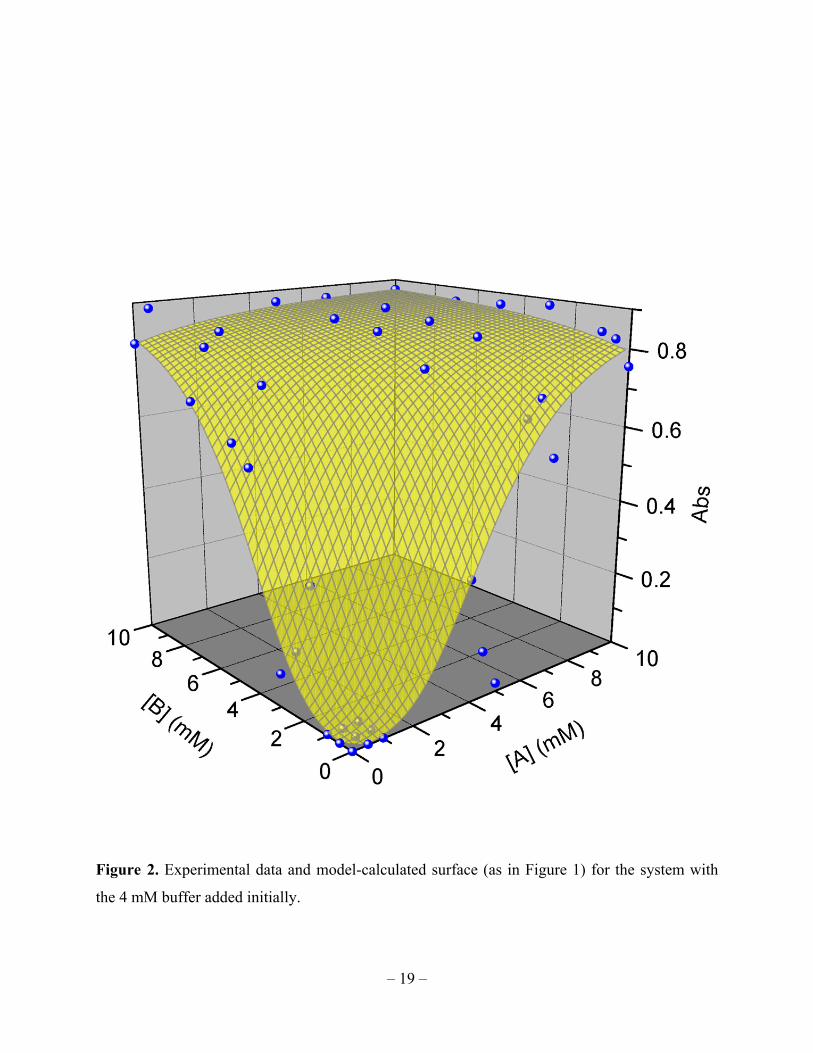
Figure 2 shows data and model results for a realization with the filtering processes added, for
buffering at 4 mM. Here not only is the visual OR logic realization convincing, but

– 7 –
furthermore the response surface is sigmoid (flat in the vicinity all the logic points) offering a
high-quality binary gate for noise handling. This is also quantified later. Finally, Figure 3 shows
results for 8 mM. In this case the “filtering” is excessive, which actually impairs the OR
gate realization.
As described in earlier works,25,36,37,40,60 evaluation of noise-handling properties and
generally quality of the realized systems as “logic gates” for biochemical information processing
requires a description of the system response in terms of the logic variable ranges, namely, as the
function , . Enzymatic kinetics, especially for coupled enzymatic cascades, is complicated
and difficult to quantify experimentally and model theoretically. However, for the “logic
function” analysis we only need an approximate, schematic description in terms of the key
reaction steps to map out the shape of , near the four logic points, as well as to understand
the control of the main features of this response-surface function by varying the “gate
machinery” quantities. The latter refer to physical conditions of the experiments if these can be
adjusted, and also to the initial concentrations of those chemicals which can be adjusted but do
not constitute the inputs or output, for example, the two enzymes, or the filter process
chemical(s), here, the buffer.
In the rest of this section we will summarize such a description for processes involved in
the present system functioning. Interestingly, unlike all the other earlier studied enzymatic gate
realizations, the present system parameters were all well-studied in the literature and therefore no
actual data fitting was required. The response surfaces shown in Figures 1, 2, 3 are based on
published reaction rates as detailed shortly. Note that Figures 1, 2, 3 show the actual
concentrations (for the inputs) and measured optical signal (for the output) not scaled to logic-
variable ranges in terms of x, y, z.
The biocatalytic function of esterase (concentration E ) can be described via the
standard schemes

– 8 –
→
⋯ , (2)
→
⋯ , (3)
where and are (time-dependent) concentrations of complexes, and the notation for the
other chemicals was defined earlier. Here we take E(0) = 0.5 U = 4.85×10⁻⁵ mM, and of course
U(0) = 0. Furthermore, the present system is in the regime of fast forward reaction in the first
step, and therefore we can set , 0. As the pH of the system varies over a wide range,
the effective rate constants in Equations (2) and (3) will also vary, because of the acidification of
the enzyme and complexes. As in the earlier work,37 we described this pH dependence by
assuming fast acidification equilibria, for example, / H , with
1.018 mM–1sec–1.61 We also use61 1.603 sec–1, 0.639 mM–1sec–1, 3.990 sec–1.
The acidification equilibrium constants,
= [E][H+]/[EH+] = 0.0068 mM, (4)
and similarly for = 0.026 mM and = 0.039 mM, were taken from the literature as
well.37,51,61 The effective rate constants thus become time-dependent via pH(t). Next, we set up
rate equations for the chemicals involved in the “esterase” part of the cascade. Here we only
show one of these equations for illustration,
. (5)
Note that the kinetics of the “esterase” part is thus coupled to the other processes via the
variation of pH with time. The buffer part of the kinetics is actually practically instantaneous.
Standard charge balance equilibria equations were set up for the present system. We only outline
pertinent points here. The conventional approximations for buffer functioning cannot be used
because of the large range of pH variation, from basic pH(0) = 9.0, via neutral, to acidic down to
about pH(tg) = 4.2, in the present experiments. Instead, the actual charge bookkeeping was done

– 9 –
for all the ions in the system, and the charge-balance equation, as well as dissociation
equilibrium equations for each of the relevant chemicals were included in the overall set of
equations solved numerically. Specifically, for Tris buffer62 we have p 8.06.
Consider now the processes biocatalyzed by laccase, the function of which can be
schematically described as follows,53
4 4 → 4 2 . (6)
The notation for the concentration of various chemicals has been defined earlier, and the initial
values are L(0) = 0.5 U = 3.78×10⁻⁴ mM, F(0) = 1 mM, P(0) = 0 mM. The actual mechanism of
action of laccase is much more complicated than that schematically shown in Equation (6). It
involves several steps and formation of more than one type of a complex (rather than our ).
The full description of these processes (such as for instance consecutive capture/oxidation of
ferrocyanide molecules) would require numerous rate constants. However, in the present regime
it has been established in the literature53 that an effective description is possible in terms of the
lumped-step processes shown with their specific rates in Equation (6). In our regime of very low
initial enzyme concentration, we can set 0. For the other two effective rates we took the
literature values, which are actually pH dependent and known phenomenologically from direct
measurements. The pH dependence is bell-shaped and was phenomenologically fitted directly to
the data. For reference, the maximal values are close to 1.6 10 mM sec for
pH 8, and close to 0.14sec forpH 7.5. Here the rate constants are for the
effective processes: pH
, with the fact that four steps of capturing ferrocyanide are
involved already absorbed in the effective rate constant, and similarly pH
.
We can now write the remaining set of rate equations for the concentrations of chemicals
involved, for example,

– 10 –
pH pH . (7)
With careful bookkeeping to account for instantaneous equilibration processes, e.g., Equation
(4), we can then program the numerical calculation yielding the theoretical surfaces shown in
Figures 1, 2, 3. Comparison of these results with the data, as well as the analysis of the quality of
the realized OR gates are reported in the next section.
QUALITY OF THE OR GATE REALIZATION AND DISCUSSION OF THE RESULTS
To discuss the quality of the realized OR gate we consider signal processing by it in the
context of noise handling. There could be several sources of inaccuracy in gate functioning
affecting its usability as part of information and signal processing networks. The most obvious
source of noise is the inaccuracy in the actual gate realization. This is apparent in Figure 3,
where the realized response values for logic inputs that should yield output 1 are obviously not
equal. The actual definition of the expected value or range of acceptable outputs corresponding
to logic 1 may vary according to the application/networking of the gate. For definiteness, for our
model system we choose the theoretically calculated value 1 ; 1 0 , 1 0 ,
namely the output theoretically predicted within our specific model at inputs 11. The average
deviation of the actual model-predicted logic-1 values at the three inputs 01, 10, 11, from the
selected reference 1 is given in Table 1 (see page 16) as percentage of the logic 0 to 1 value
range.
Leaving aside the noise in the actual experimental data (which is another source of noise,
discussed shortly), one can then ask why is filtering needed at all. According to the above
criterion, the original no-filter gate has the least “inaccuracy” error. However, another source of
noise has to be considered and is actually more important for network realizations,28,60 for which
analog and also (for larger networks) digital error correction has to be utilized, the latter via
network design. The former, analog noise buildup can occur via amplification of the noise in the
two input signals. Typically, biochemical signals are noisy, with few-percent noise levels at
least. Input noise will be amplified or suppressed by the gate function when transmitted to the

– 11 –
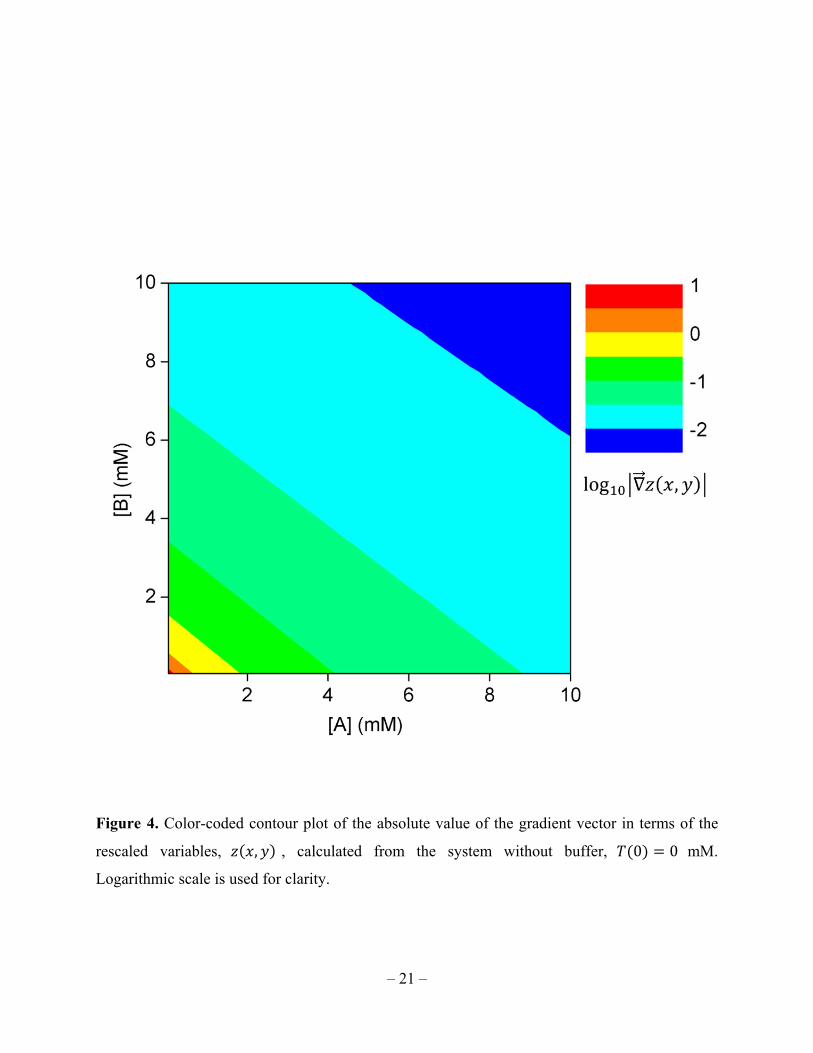
output. This transmission factor can be estimated for smooth gate-response surfaces (which is the
case here) by calculating the absolute value of the gradient (the slope) in terms of the logic
variables introduced earlier: | , |. Figure 4 gives a contour plot of the slope values for the
non-filter gate. The calculated gradient near the logic 00 inputs is rather large: close to 690%
amplification (see Table 1). Therefore, while visually it might look as a reasonable OR gate
realization (Figure 1), the unfiltered system is not good for any networking in applications.
The properly filtered system (Figure 2) does not have this problem. Indeed, the added
filtering process has made the noise transmission at all the four logic points into actual noise
suppression, with the largest transmission factor, shown in Table 1, safely below 100%. It is
approximately 14% for the 4 mM buffer concentration. Actually, the third system (Figure 3) has
a mild noise amplification, about 113%. Indeed, the present mechanism for “filtering” only
applies near zero output values. The oversupply of the buffer (8 mM) made the response too
steep near the logic 11 inputs. Anyhow, we already noted that the 8 mM system is simply not an
accurate OR gate function. The absolute values of the gradients (slopes) are mapped out in
Figures 5 and 6. These values allow us to estimate the ranges of noise in the input signals off the
fixed reference 0 and 1 values that the gate can “tolerate” because the deviations fall within the
region of , 1. These “noise tolerance” measures as percentages of the 0 to 1 logic-
range span are also given in Table 1. The result is of course non-zero only for the 4 mM system.
Thus, filtering can improve the quality of the OR gate realization for networking
applications. However, care must be exercised not to overdo it, in order to retain an accurate OR
function. Furthermore, in most cases added filtering also causes signal intensity loss. This is
clearly seen by comparing the maximal outputs (those near logic 11 inputs) in Figures 1, 2, 3. If
we take the original (non-filtered) value as reference 100%, then with respect to it the percentage
loss of intensity is as given in Table 1. One of the advantages of moderate filtering (4 mM) is
that only 11% of the overall signal intensity is lost. Loss of signal intensity makes all sources of
error and noise more significant on the relative scale of the signal strength.
Finally, the actual gate-function realization in each specific experimental setting can
result not only in systematic deviations from the desired logic-point output values but also in
– 12 –
random noise in the values of the output ; 0 , 0 or its logic-range equivalent
, . To estimate the noise level in the actual data measured as compared to the model
predictions, we calculated the normalized mean-linear and root-mean-square (RMS) data-vs.-
model deviations as averages over all the points taken for varying inputs, for each of the three
gate realizations studied. These averages are given in Table 1 as percentages of the 0 to 1 logic-
value output ranges. While the large values of the quadratic moments indicate that the present
output data are rather noisy, the fact that the linear deviation moment is noticeably smaller than
the quadratic moment confirms that the theoretical model works reasonably well.
In summary, we reported the first realization and study of a simple biocatalytic system
with a double-sigmoid filter (sigmoid in both inputs) response offering the OR binary gate logic
function. We also considered various gate-functioning quality criteria which can be used to select
optimal realizations for future applications.
Acknowledgements
Research funding by the NSF, via awards CCF-1015983 and CBET-1066397, is
gratefully acknowledged. Technical assistance of graduate students, M. A. Arugula, S.
Chinnapareddy, S. Korkmaz in collecting the experimental data, and helpful discussions with
Dr. Jan Halámek are acknowledged.

– 13 –
REFERENCES
(1) Unconventional Computation. Lecture Notes in Computer Science, Calude, C. S.; Costa,
J. F.; Dershowitz, N.; Freire, E.; Rozenberg, G. (Eds.), Vol. 5715, Springer, Berlin, 2009.
(2) Unconventional Computing, Adamatzky, A.; De Lacy Costello, B.; Bull, L.; Stepney, S.;
Teuscher, C. (Eds.), Luniver Press, UK, 2007.
(3) Molecular Computation Models: Unconventional Approaches, Gheorghe, M. Idea Group
Publishing, UK, 2005.
(4) Molecular and Supramolecular Information Processing – From Molecular Switches to
Unconventional Computing. Katz, E. (Ed.), Willey-VCH, Weinheim, 2012, (ISBN-10: 3-
527-33195-6).
(5) Biomolecular Information Processing – From Logic Systems to Smart Sensors and
Actuators. Katz, E. (Ed.), Willey-VCH, Weinheim, 2012, (ISBN-10: 3-527-33228-6).
(6) Biomolecular Computing: Chapter in Bionanoelectronics, Dragoman, D; Dragoman, M.
Springer Berlin Heidelberg, 2012, Chapter 7, pp. 189–206.
(7) Stojanovic, M. N.; Stefanovic, D.; LaBean, T.; Yan, H. In: Bioelectronics: From Theory
to Applications, Willner, I.; Katz, E. (Eds.) Wiley-VCH, Weinheim, 2005, pp. 427–455.
(8) Benenson, Y. Mol. Biosyst. 2009, 5, 675–685.
(9) Katz, E.; Privman, V. Chem. Soc. Rev. 2010, 39, 1835–1857.
(10) Shapiro, E.; Gil, B. Nat. Nanotechnol. 2007, 2, 84–85.
(11) Ashkenasy, G.; Ghadiri, M. R. J. Am. Chem. Soc. 2004, 126, 11140–11141.
(12) Pischel, U. Angew. Chem. Int. Ed. 2007, 46, 4026–4040.
(13) Credi, A. Angew. Chem. Int. Ed. 2007, 46, 5472–5475.
(14) Andreasson, J.; Pischel, U. Chem. Soc. Rev. 2010, 39, 174–188.
(15) Szacilowski, K. Chem. Rev. 2008, 108, 3481–3548.
(16) De Silva, A. P.; Uchiyama, S.; Vance, T. P.; Wannalerse, B. Coord. Chem. Rev. 2007,
251, 1623–1632.
(17) Unger, R.; Moult, J. Proteins 2006, 63, 53–64.
(18) Ezziane, Z. Nanotechnology 2006, 17, R27–R39.
(19) Rinaudo, K.; Bleris, L.; Maddamsetti, R.; Subramanian, S.; Weiss, R.; Benenson, Y. Nat.
Biotechnol. 2007, 25, 795–801.
– 14 –
(20) Li, Z.; Rosenbaum, M. A.; Venkataraman, A.; Tam, T. K.; Katz, E.; Angenent, L. T.
Chem. Commun. 2011, 47, 3060–3062.
(21) Tamsir, A.; Tabor, J. J.; Voigt, C. A. Nature 2011, 469, 212–215.
(22) Kahan, M.; Gil, B.; Adar, R.; Shapiro, E. Physica D 2008, 237, 1165–1172.
(23) Wang, J.; Katz, E. Anal. Bioanal. Chem. 2010, 398, 1591–1603.
(24) Wang, J.; Katz, E. Isr. J. Chem. 2011, 51, 141–150.
(25) Melnikov, D.; Strack, G.; Zhou, J.; Windmiller, J. R.; Halámek, J.; Bocharova, V.;
Chuang, M.-C.; Santhosh, P.; Privman, V.; Wang, J.; Katz, E. J. Phys. Chem. B 2010,
114, 12166–12174.
(26) Zhou, J.; Halámek, J.; Bocharova, V.; Wang, J.; Katz, E. Talanta 2011, 83, 955–959.
(27) Halámek, J.; Windmiller, J. R.; Zhou, J.; Chuang, M.-C.; Santhosh, P.; Strack, G.;
Arugula, M. A.; Chinnapareddy, S.; Bocharova, V.; Wang, J.; Katz, E. Analyst 2010, 135,
2249–2259.
(28) Privman, V. Isr. J. Chem. 2011, 51, 118–131.
(29) Halámek, J.; Zavalov, O.; Halámková, L.; Korkmaz, S.; Privman, V.; Katz, E. J. Phys.
Chem. B 2012, 116 (15), 4457-4464.
(30) Manesh, K. M.; Halámek, J.; Pita, M.; Zhou, J.; Tam, T. K.; Santhosh, P.; Chuang, M.-C.;
Windmiller, J. R.; Abidin, D.; Katz, E.; Wang, J. Biosens. Bioelectron. 2009, 24, 3569–
3574.
(31) Halámek, J.; Bocharova, V.; Chinnapareddy, S.; Windmiller, J. R.; Strack, G.; Chuang,
M.-C.; Zhou, J.; Santhosh, P.; Ramirez, G. V.; Arugula, M. A.; Wang, J.; Katz, E. Mol.
Biosyst. 2010, 6, 2554–2560.
(32) Windmiller, J. R.; Strack, G.; Chuang, M.-C.; Halámek, J.; Santhosh, P.; Bocharova, V.;
Zhou, J.; Katz, E.; Wang, J. Sens. Actuat. B 2010, 150, 285–290.
(33) Adar, R.; Benenson, Y.; Linshiz, G.; Rosner, A.; Tishby, N.; Shapiro, E. Proc. Natl.
Acad. USA 2004, 101, 9960–9965.
(34) von Maltzahn, G.; Harris, T. J.; Park, J.-H.; Min, D.-H.; Schmidt, A. J.; Sailor, M. J.;
Bhatia, S. N. J. Am. Chem. Soc. 2007, 129, 6064–6065.
(35) May, E. E.; Dolan, P. L.; Crozier, P. S.; Brozik, S.; Manginell, M. IEEE Sensors J. 2008,
8, 1011–1019.

– 15 –
(36) Privman, V.; Halámek, J.; Arugula, M. A.; Melnikov, D.; Bocharova, V.; Katz, E. J.
Phys. Chem. B 2010, 114, 14103–14109.
(37) Pita, M.; Privman, V.; Arugula, M. A.; Melnikov, D.; Bocharova, V.; Katz, E. Phys.
Chem. Chem. Phys. 2011, 13, 4507–4513.
(38) Rafael, S. P.; Vallée-Bélisle, A.; Fabregas, E.; Plaxco, K.; Palleschi, G.; Ricci, F. Anal.
Chem. 2012, 84, 1076–1082.
(39) Halámek, J.; Zhou, J.; Halámková, L.; Bocharova, V.; Privman, V.; Wang, J.; Katz, E.
Anal. Chem. 2011, 83, 8383–8386.
(40) Privman, V.; Pedrosa, V.; Melnikov, D.; Pita, M.; Simonian, A.; Katz, E. Biosens.
Bioelectron. 2009, 25, 695–701.
(41) Kato, G. J.; McGowan, V.; Machado, R. F.; Little, J. A.; Taylor, VI, J.; Morris, C. R.;
Nichols, J. S.; Wang, X.; Poljakovic, M.; Morris, Jr., S. M.; Gladwin, M. T. Blood 2006,
107, 2279–2285.
(42) Moser, I.; Jobst, G.; Svasek, P.; Varahram, M.; Urban, G. Sens. Actuators B 1997, 44,
377–380.
(43) Kotoh, K.; Enjoji, M.; Kato, M.; Kohjima, M.; Nakamuta, M.; Takayanagi, R. Compar.
Hepatol., 2008, 7, 6–14.
(44) Khalili, H.; Dayyeh, B. A.; Friedman, L. S. In: Clinical Gastroenterology: Chronic Liver
Failure, Ginès, P.; Kamath, P. S.; Arroyo, V. (Eds.) Humana Press, New York, 2010, pp.
47–76.
(45) Privman, M.; Tam, T. K.; Bocharova, V.; Halámek, J.;Wang, J.; Katz, E. ACS Appl.
Mater. Interfaces 2011, 3, 1620–1623.
(46) Tokarev, I.; Gopishetty, V.; Zhou, J.; Pita, M.; Motornov, M.; Katz, E.; Minko, S. ACS
Appl. Mater. Interfaces 2009, 1, 532–536.
(47) Motornov, M.; Zhou, J.; Pita, M.; Tokarev, I.; Gopishetty, V.; Katz, E.; Minko, S. Small
2009, 5, 817–820.
(48) Motornov, M.; Zhou, J.; Pita, M.; Gopishetty, V.; Tokarev, I.; Katz, E.; Minko, S. Nano
Lett. 2008, 8, 2993–2997.
(49) Bychkova, V.; Shvarev, A.; Zhou, J.; Pita, M.; Katz, E. Chem. Commun. 2010, 46, 94-96.
(50) Bocharova, V.; Tam, T. K.; Halámek, J.; Pita, M.; Katz, E. Chem. Commun. 2010, 46,
2088–2090.

– 16 –
(51) Kyger, E. M.; Riley, D. J.; Spilburg, C. A.; Lange, L. G. Biochemistry 1990, 29, 3853–
3858.
(52) Holwerda, R. A.; Gray, H. B. J. Am. Chem. Soc. 1975, 97, 6036–6041.
(53) Koudelka G. B.; Hansen F. B.; Ettinger M. J. J. Biol. Chem. 1985, 260, 15561–15565.
(54) Saloheimo, M.; Niku-Paavola, M. L.; Knowles, J. K. J. Gen. Microbiol. 1991, 137, 1537–
1544.
(55) Coll, P. M.; Tabernero, C.; Santamaria, R.; Perez, P. Appl. Environ. Microbiol. 1993, 59,
4129–4135.
(56) Eggert, C., Temp, U, Eriksson, K. E. Appl. Environ. Microbiol. 1996, 62, 1151–1158.
(57) Périé, F. H.; Reddy, G. V.; Blackburn, N. J.; Gold, M. H. Arch. Biochem. Biophys. 1998,
353, 349–355.
(58) Morpurgo, L.; Hartmann, H. J.; Desideri, A.; Weser, U.; Rotilio, G. Biochem. J. 1983,
211, 515–517.
(59) A. J. Adler and G. B. Kristiakowsky, J. Am. Chem. Soc. 1962, 84, 695–703.
(60) Privman, V.; Strack, G.; Solenov, D.; Pita, M.; Katz, E. J. Phys. Chem. B 2008, 112,
11777–11784.
(61) Craig, N. C.; Kistiakowsky G. B. J. Am. Chem. Soc. 1958, 80, 1574–1579.
(62) Millero, F. J. J. Chem. Eng. Data. 2009, 54, 342–344.
Table 1: Quality Measures of Gate-Function Realization
Т0 (mM)
Spread of
logic 1
outputs
Maximum noise
transmission factor
at the logic points
Input
noise
tolerance
Signal
intensity
loss
Average linear
data-vs.-model
deviation
RMS
data-vs.-model
deviation
0 0.9% 6.94 (at 00) 0% 0% 7.6% 22%
4 6.9% 0.14 (at 10) 10.3% 11% 9.7% 16%
8 67.3% 1.13 (at 11) 0% 52% 4.8% 18%
– 17 –
Scheme 1. Chemical and biochemical processes in the system.

– 18 –
Figure 1. Spherical symbols show the 49 (7×7 grid of) experimental data points for the system
without the buffer. These were measured at the gate time 800 sec, for various values of the two
input concentrations (ethyl butyrate and methyl butyrate). The surface was calculated from the
model described in the text.
– 19 –
Figure 2. Experimental data and model-calculated surface (as in Figure 1) for the system with
the 4 mM buffer added initially.

– 20 –
Figure 3. Experimental data and model-calculated surface (as in Figures 1 and 2) for the system
with the 8 mM buffer added initially.
– 21 –
Figure 4. Color-coded contour plot of the absolute value of the gradient vector in terms of the
rescaled variables, , , calculated from the system without buffer, 0 0 mM.
Logarithmic scale is used for clarity.

– 22 –
Figure 5. Color-coded contour plot of the absolute value of the gradient vector (as in Figure 4)
for the system with the 4 mM buffer added initially.

– 23 –
Figure 6. Color-coded contour plot of the absolute value of the gradient vector (as in Figures 4
and 5) for the system with the 8 mM buffer added initially.