Embed Size (px)
Citation preview

Group 3: Gabriel, Glory, Laddaran and Martinez
Introduction to Data Gathering and Analysis Using Enzyme Kinetics Data
as Experimental Models
Introduction
Foundations of a scientific study is the careful collection, organization and analysis of data from which conclusions are formed.
Scientific laws and theories are established through such experimentation, data gathering and correct analysis of generated data
Data gathering and analysis are important skills we should develop

What is Data Gathering?
Gathering data is a frequent part of solving problems and satisfying curiosity. When we look up information to answer a question or to formulate new questions, we are gathering and analyzing data. When we conduct surveys and draw conclusions from them, we are gathering and analyzing data.
What is Analysis?
The analysis includes graphs as well as numerous complex mathematical tools.
Why Statistical Analysis?
We use statistics to provide meaning to what otherwise would be a collection of numbers and/or values
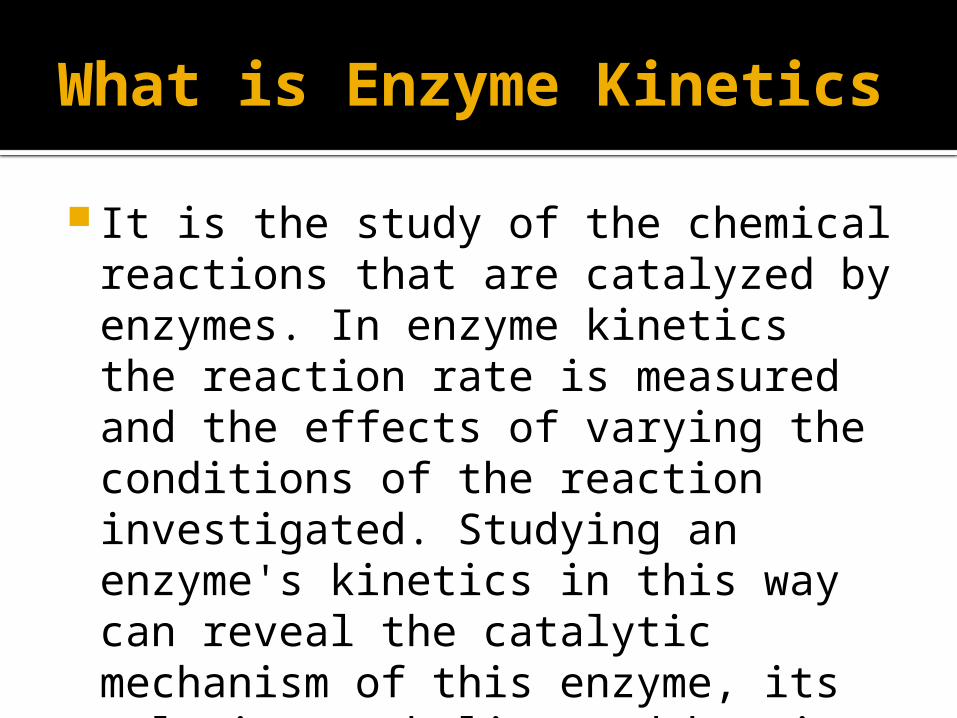
What is Enzyme Kinetics
It is the study of the chemical reactions that are catalyzed by enzymes. In enzyme kinetics the reaction rate is measured and the effects of varying the conditions of the reaction investigated. Studying an enzyme's kinetics in this way can reveal the catalytic mechanism of this enzyme, its role in metabolism and how its activity is controlled.
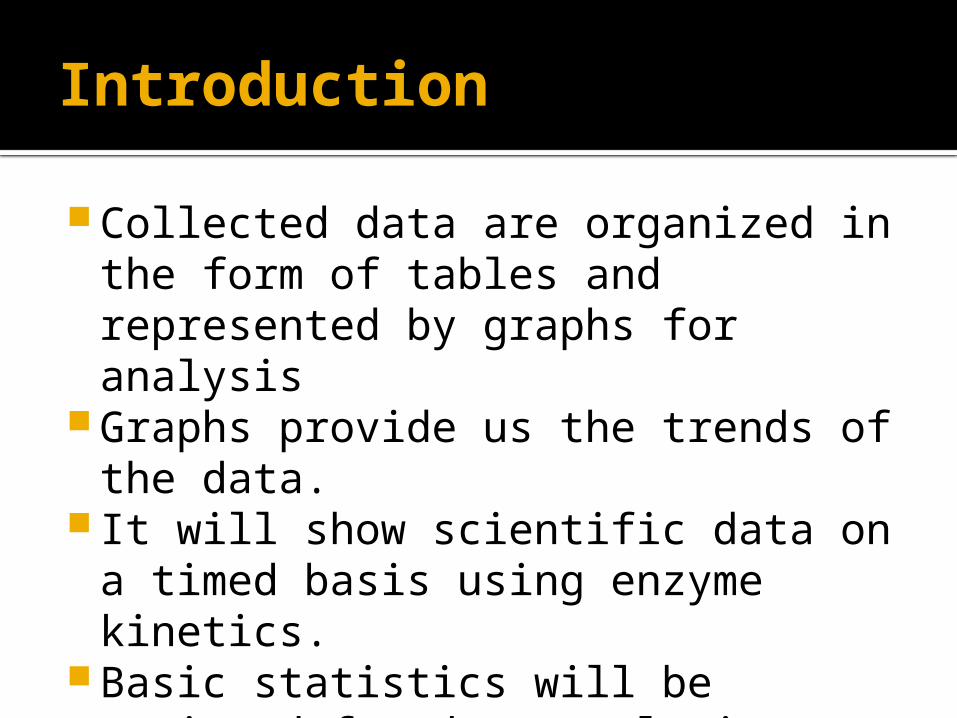
Introduction
Collected data are organized in the form of tables and represented by graphs for analysis
Graphs provide us the trends of the data.
It will show scientific data on a timed basis using enzyme kinetics.
Basic statistics will be reviewed for data analysis
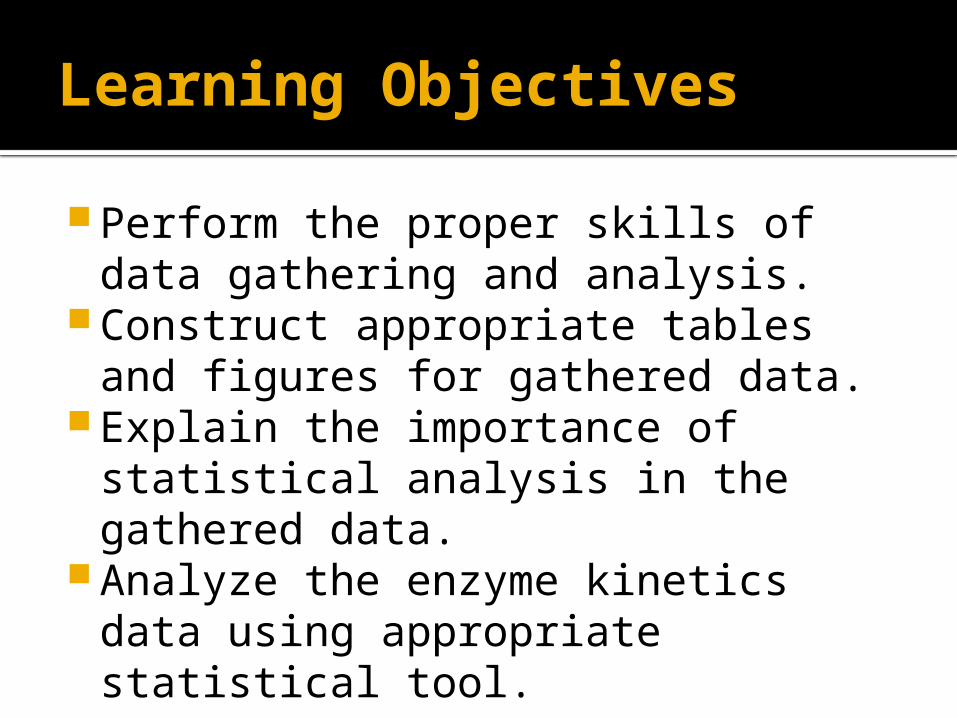
Learning Objectives
Perform the proper skills of data gathering and analysis.
Construct appropriate tables and figures for gathered data.
Explain the importance of statistical analysis in the gathered data.
Analyze the enzyme kinetics data using appropriate statistical tool.
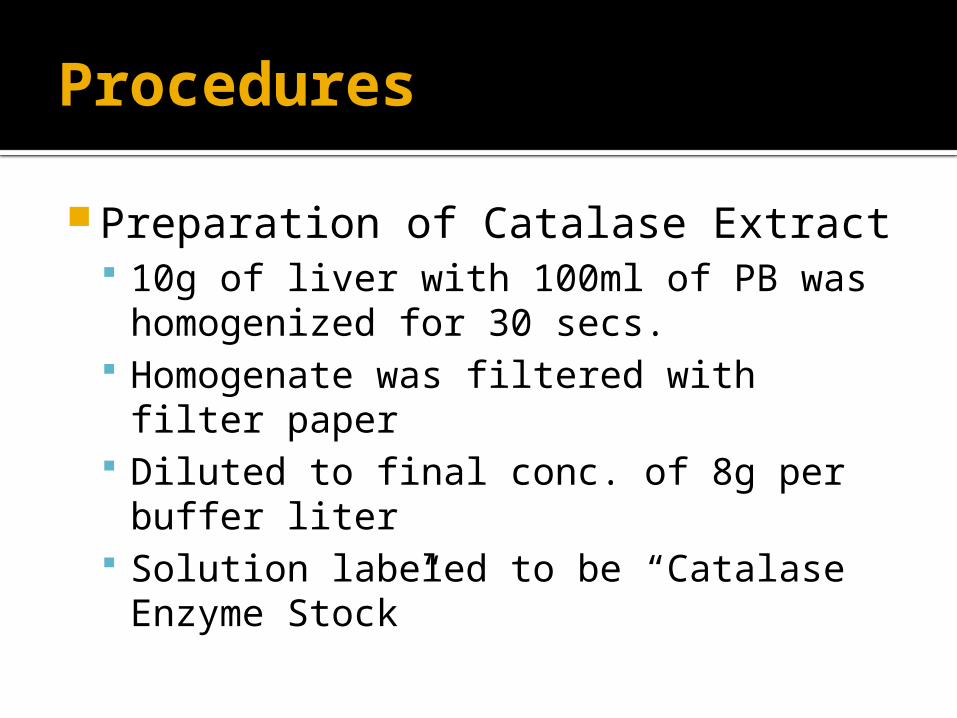
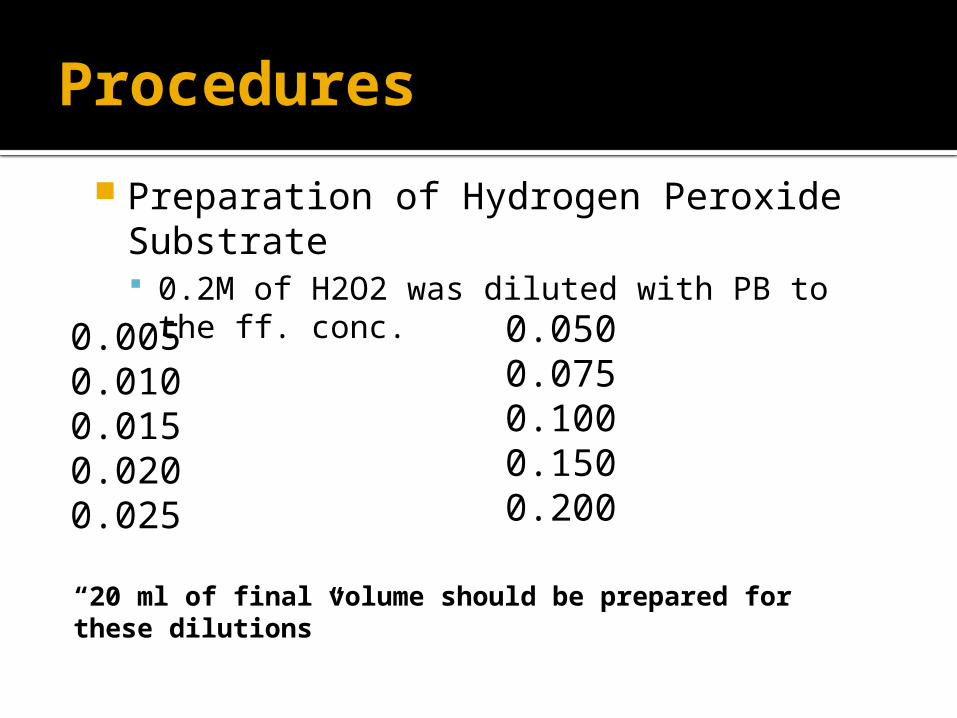
Procedures
Preparation of Catalase Extract 10g of liver with 100ml of PB was
homogenized for 30 secs. Homogenate was filtered with filter
paper Diluted to final conc. of 8g per buffer
liter Solution labeled to be “Catalase Enzyme
Stock”
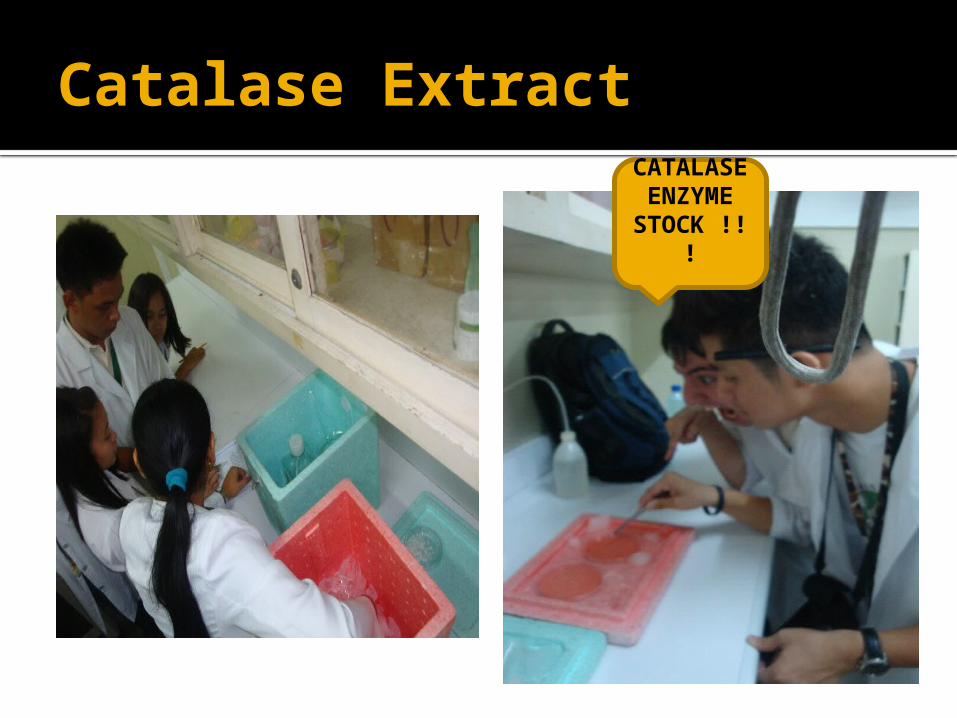
Catalase ExtractCATALAS
E ENZYME STOCK !!
!
Procedures
0.0050.0100.0150.0200.025
0.0500.0750.1000.1500.200
Preparation of Hydrogen Peroxide Substrate 0.2M of H2O2 was diluted with PB to the ff.
conc.
“20 ml of final volume should be prepared for these dilutions”
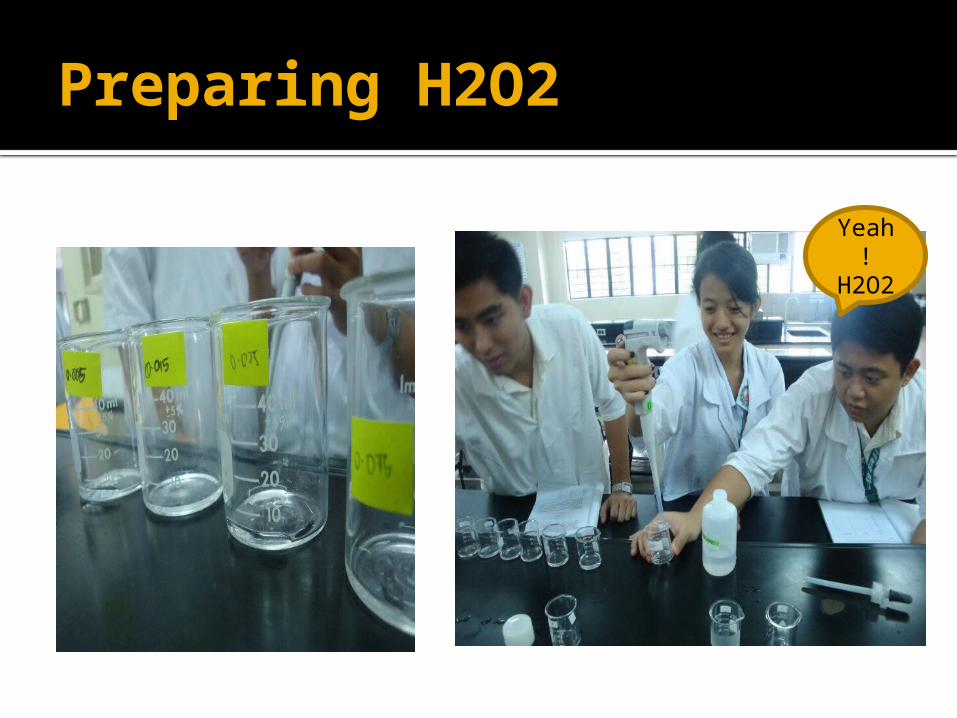
Preparing H2O2
Yeah! H2O
2
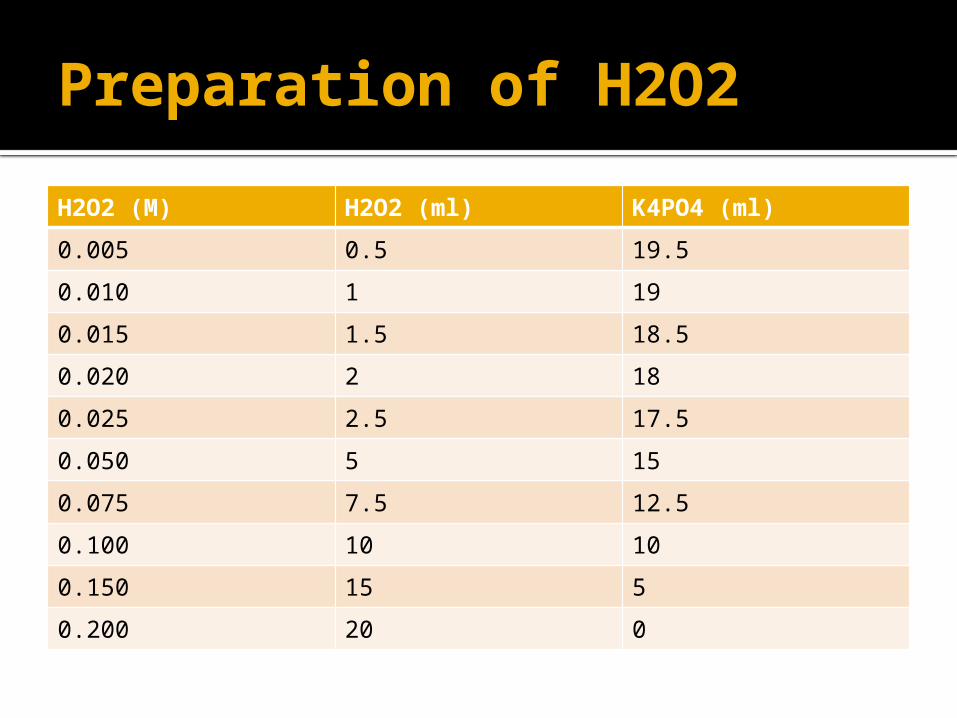
Preparation of H2O2
H2O2 (M) H2O2 (ml) K4PO4 (ml)
0.005 0.5 19.5
0.010 1 19
0.015 1.5 18.5
0.020 2 18
0.025 2.5 17.5
0.050 5 15
0.075 7.5 12.5
0.100 10 10
0.150 15 5
0.200 20 0
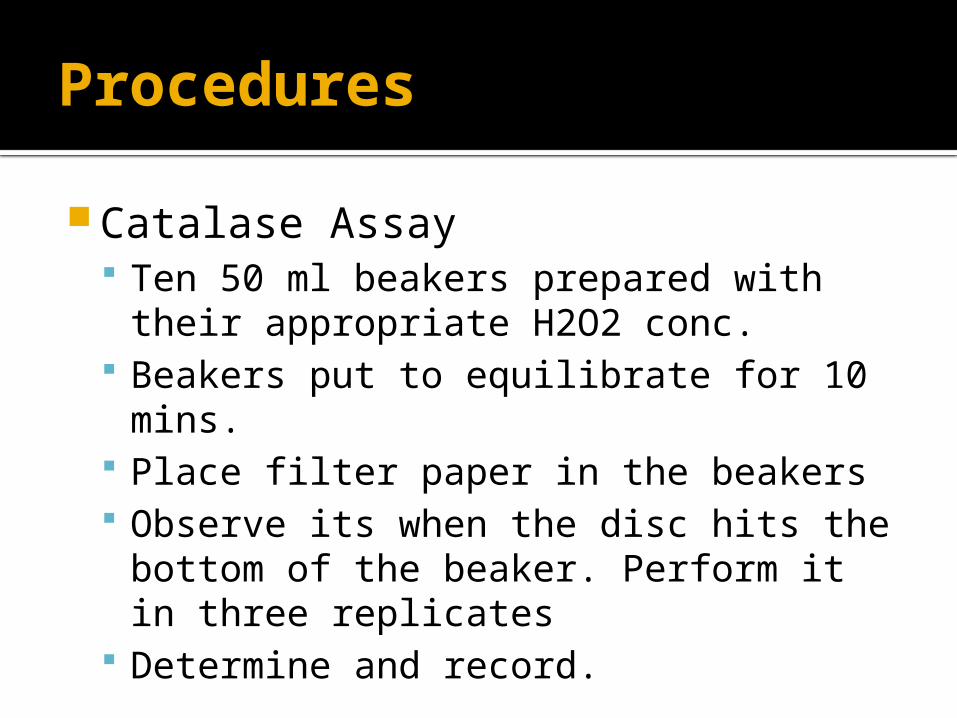
Procedures
Catalase Assay Ten 50 ml beakers prepared with their
appropriate H2O2 conc. Beakers put to equilibrate for 10 mins. Place filter paper in the beakers Observe its when the disc hits the
bottom of the beaker. Perform it in three replicates
Determine and record.

Results: Group 3 & 4
Substrate Concentration (M)
Time (s) Velocity (cm/s)
0.0005 1296 0.00046
0.010 127.67 0.01
0.015 123.33 0.012
0.020 30.90 0.05
0.025 33.18 0.05
0.050 12.97 0.12
0.075 6.35 0.24
0.100 10.24 0.15
0.150 5.43 0.30
0.200 4.09 0.37
Table 3.1 Catalase Reaction on Different Substrate Concentration in Relation to Time and Velocity
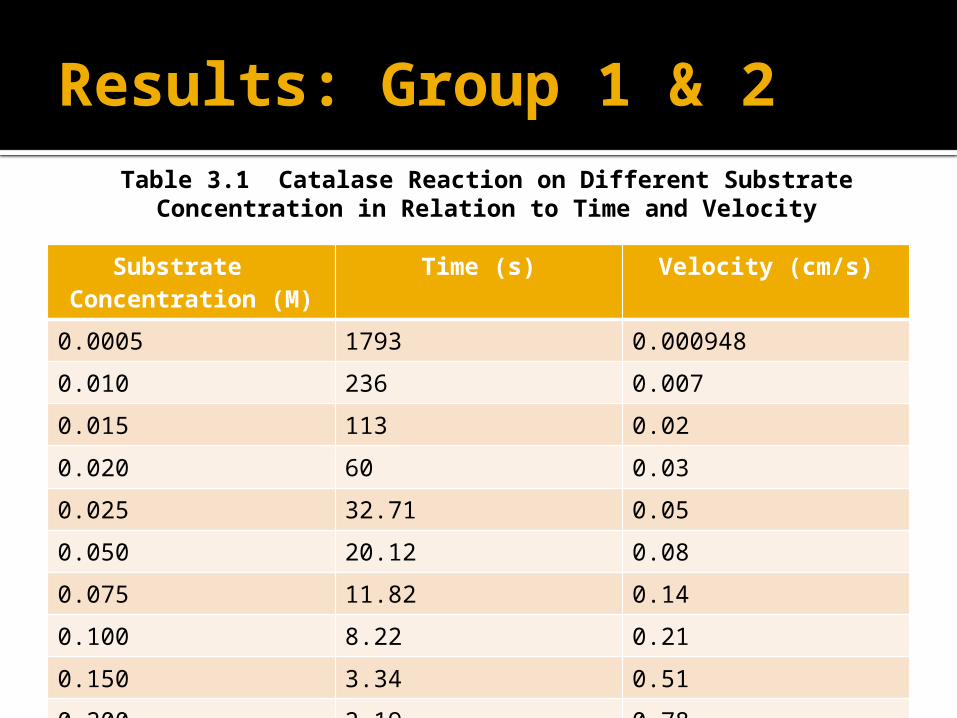
Results: Group 1 & 2
Substrate Concentration (M)
Time (s) Velocity (cm/s)
0.0005 1793 0.000948
0.010 236 0.007
0.015 113 0.02
0.020 60 0.03
0.025 32.71 0.05
0.050 20.12 0.08
0.075 11.82 0.14
0.100 8.22 0.21
0.150 3.34 0.51
0.200 2.19 0.78
Table 3.1 Catalase Reaction on Different Substrate Concentration in Relation to Time and Velocity
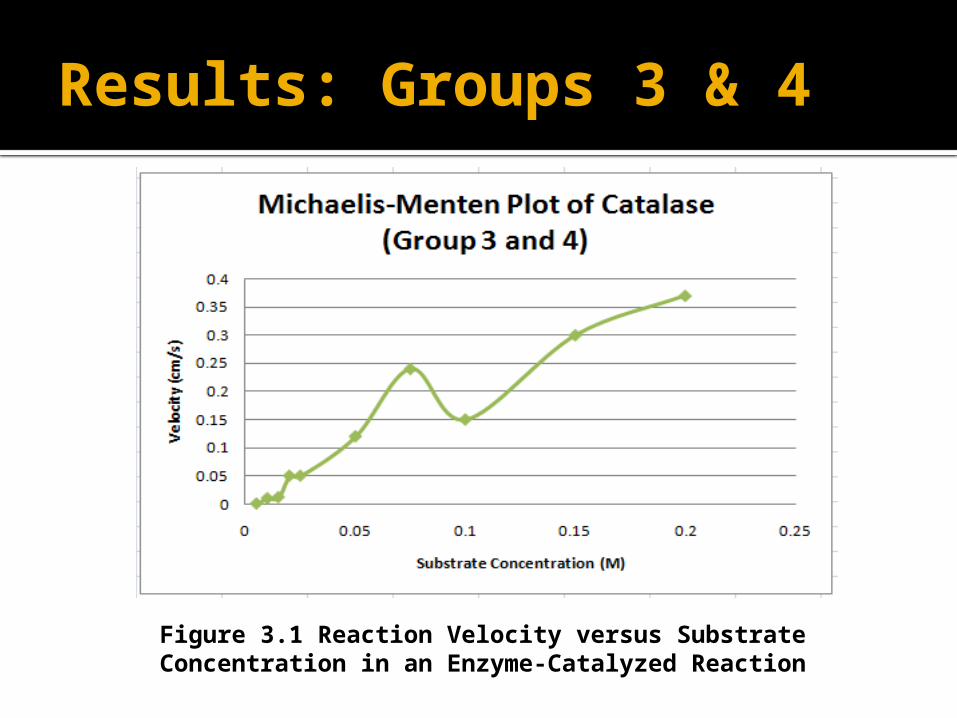
Results: Groups 3 & 4
Figure 3.1 Reaction Velocity versus Substrate Concentration in an Enzyme-Catalyzed Reaction
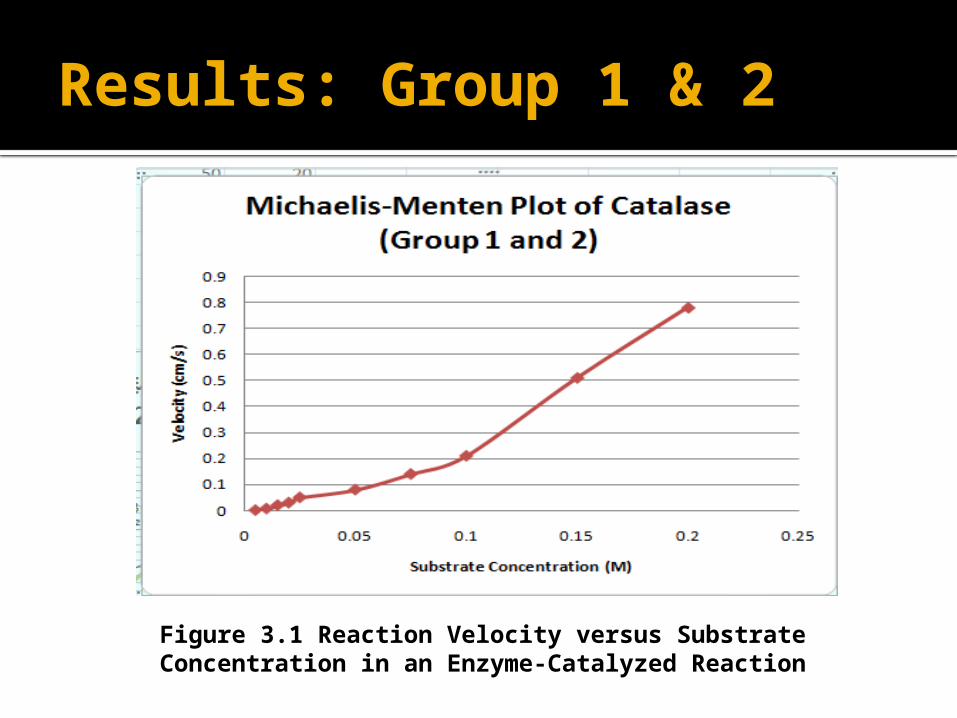
Results: Group 1 & 2
Figure 3.1 Reaction Velocity versus Substrate Concentration in an Enzyme-Catalyzed Reaction
Results: Interpretation
The reaction rate also increases in proportion to substrate concentration, but only to a certain point, where it reaches a maximum velocity as shown in the Figures above.
The maximum velocity is proportional to the amount of enzyme present.
Results: Interpretation
The hyperbola depicts 3 observations that caused the curve. At low (1), velocity is directly proportional to substrate.
At intermediate (2), velocity is depended on substrate.
And at high (3), velocity is independent of substrate.
Results: Interpretation
At high, saturation has been achieved. This is the property of Enzyme-Catalyzed reactions, wherein it cannot increase the reaction velocity beyond a finite upper value even with the increasing of substrate concentrations.
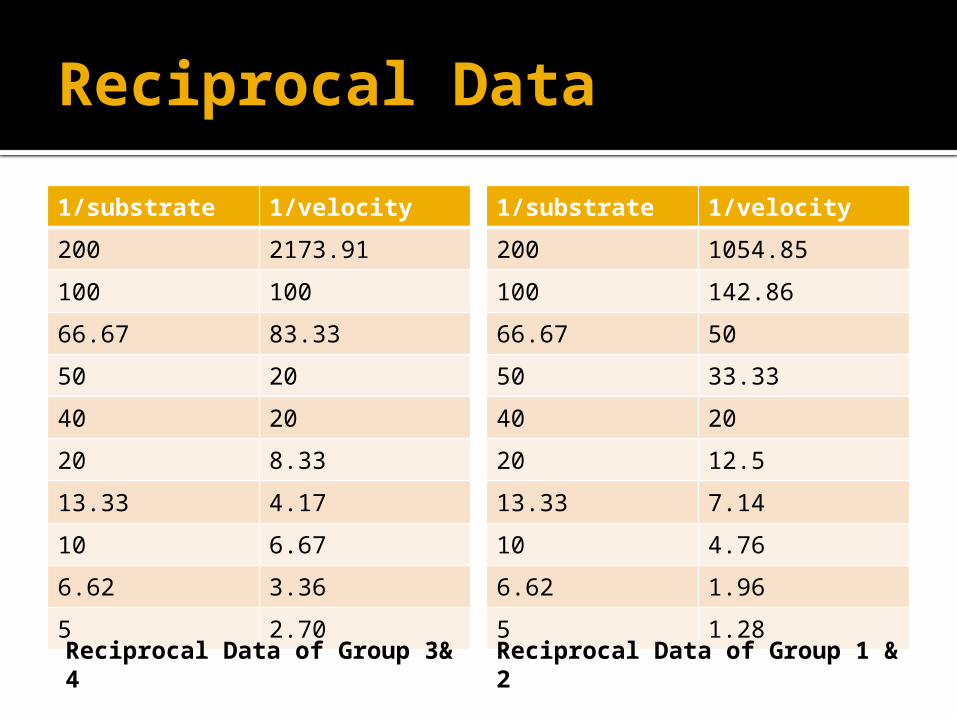
Reciprocal Data
1/substrate 1/velocity
200 2173.91
100 100
66.67 83.33
50 20
40 20
20 8.33
13.33 4.17
10 6.67
6.62 3.36
5 2.70
1/substrate 1/velocity
200 1054.85
100 142.86
66.67 50
50 33.33
40 20
20 12.5
13.33 7.14
10 4.76
6.62 1.96
5 1.28
Reciprocal Data of Group 3& 4
Reciprocal Data of Group 1 & 2
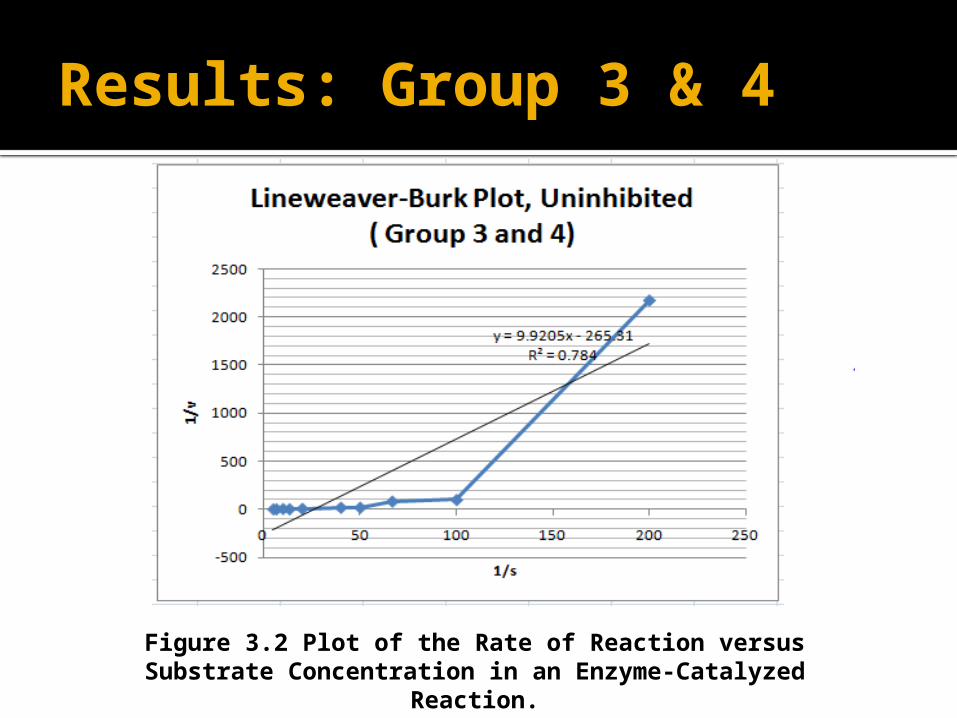
Results: Group 3 & 4
Figure 3.2 Plot of the Rate of Reaction versus Substrate Concentration in an Enzyme-Catalyzed
Reaction.
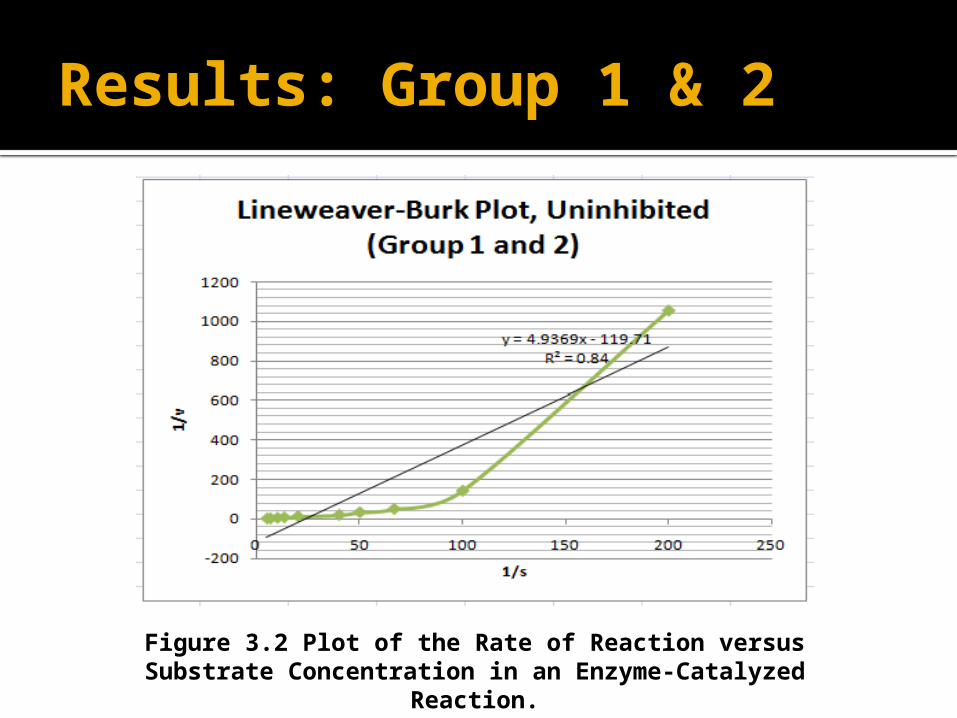
Results: Group 1 & 2
Figure 3.2 Plot of the Rate of Reaction versus Substrate Concentration in an Enzyme-Catalyzed
Reaction.
Results: Interpretation
The figures above, indicates the R² value to be almost 98% of the variation in 1/v (y) is due to the variation in 1/s (x).
In addition, if we take the square root of R² we can determine that the correlation ,r, is almost 1.
The r being almost 1 indicates an excellent fit between the data points and the regression line.
This then summarizes as 1/s increases, 1/v increases.
Statistical tool
Regression analysis is applied as our statistical tool since we have an independent and a dependent variable.
Our independent variable is the molarity of H2O2 and dependent to be the mean time.
This shows that time varied due to the fixed concentrations of our H2O2.
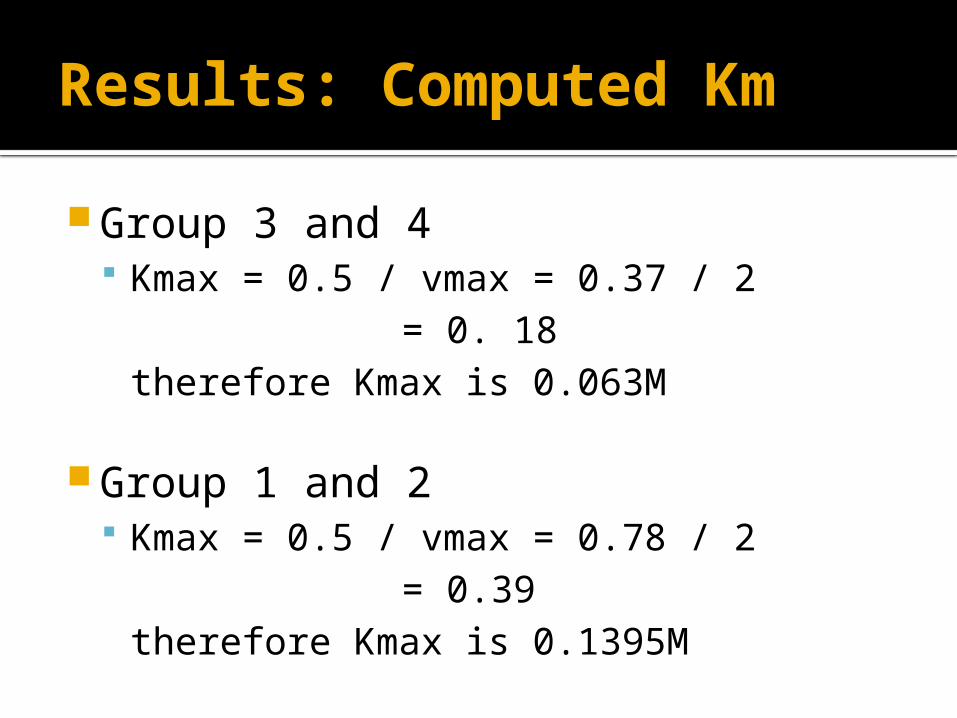
Results: Computed Km
Group 3 and 4 Kmax = 0.5 / vmax = 0.37 / 2
= 0. 18therefore Kmax is 0.063M
Group 1 and 2 Kmax = 0.5 / vmax = 0.78 / 2
= 0.39therefore Kmax is 0.1395M
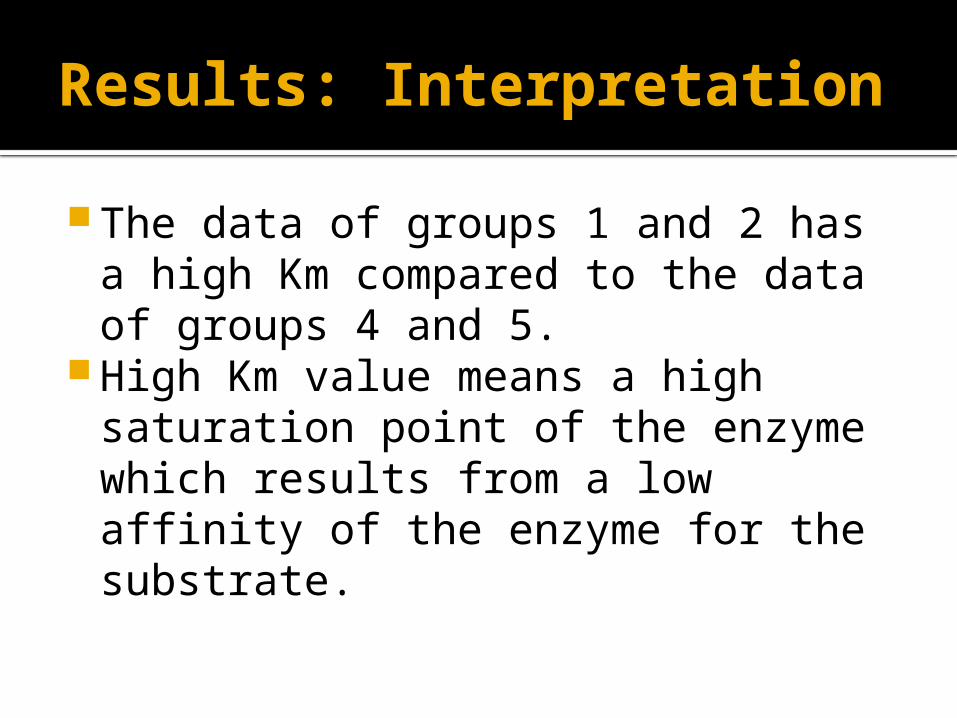
Results: Interpretation
The data of groups 1 and 2 has a high Km compared to the data of groups 4 and 5.
High Km value means a high saturation point of the enzyme which results from a low affinity of the enzyme for the substrate.