Embed Size (px)
Citation preview
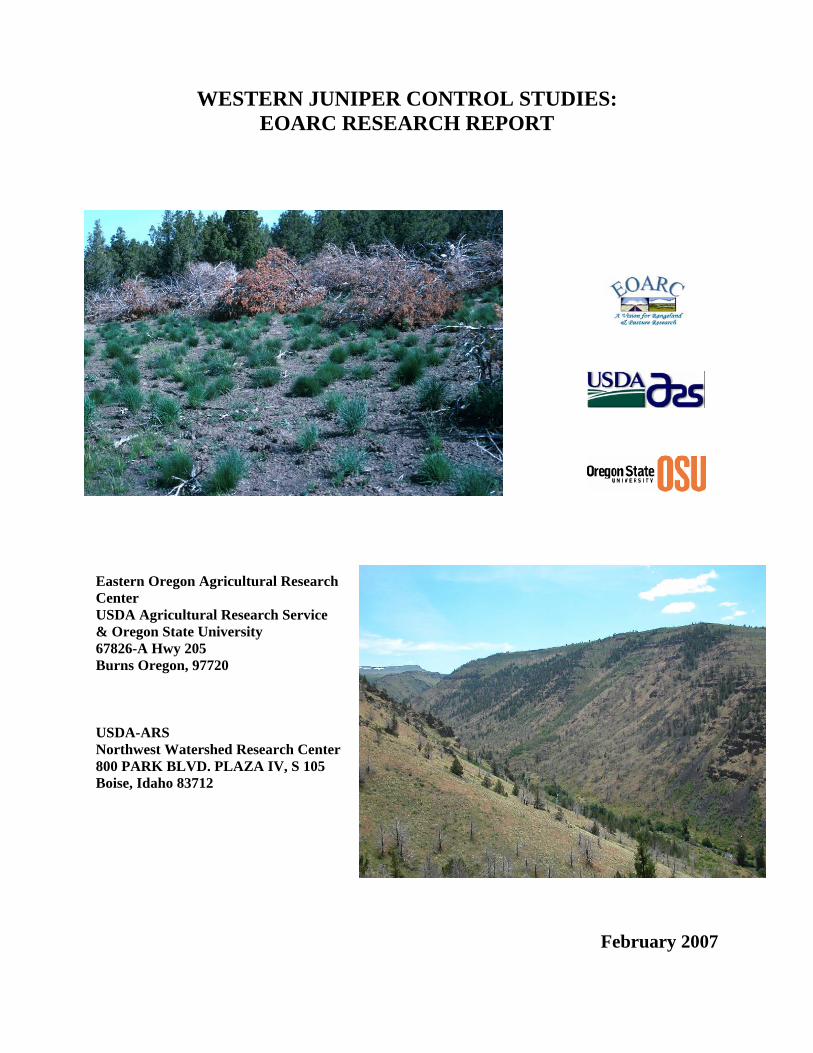
WESTERN JUNIPER CONTROL STUDIES: EOARC RESEARCH REPORT
Eastern Oregon Agricultural Research Center USDA Agricultural Research Service & Oregon State University 67826-A Hwy 205 Burns Oregon, 97720 USDA-ARS Northwest Watershed Research Center 800 PARK BLVD. PLAZA IV, S 105 Boise, Idaho 83712
February 2007
2
Investigators:
Tony Svejcar, Research Leader and Range Scientist, USDA-Agricultural Research Service, Burns. Rick Miller, Professor, Range Ecology and Management, Oregon State University, Corvallis, Oregon.
Kirk Davies, Range Scientist, USDA-Agricultural Research Service, Burns, Oregon. Fred Pierson, Research Hydrologist, USDA-ARS, Northwest Watershed Research Center, Boise, ID
Stuart Hardegree, Research Leader, USDA-ARS, Northwest Watershed Research Center, Boise, ID. Jon Bates, Range Scientist, USDA-Agricultural Research Service, Burns, Oregon.
Compiler: Jon Bates, Range Scientist, [email protected] Eastern Oregon Agricultural Research Center USDA-Agricultural Research Service 67826-A Hwy 205 Burns OR, 97720 541-573-8932
EOARC is jointly funded by Oregon State University’s Agricultural Experiment Station (AES) and the U.S. Department of Agriculture’s Agricultural Research Service (ARS).

3
Acknowledgments There were many partners associated with the conduction of these studies. A huge amount of thanks and recognition are extended to Fred Otley (Diamond, Oregon), Tim Lowry (Jordan Valley, Oregon), Mike Stanford (Cliffs, Idaho), Bureau of Land Management (Burns Field Office), and Idaho Department of State Lands for providing land and/or facilities/logistical support. Their support of the juniper control projects played a major part in the successful implementation and conduction of the research studies. The success of the projects owes much to staff at EOARC (Rob Sharp, Clare Poulsen, Dustin Johnson) and many student summer range technicians who assisted in the collection and entry of juniper field data. Summer range technicians were: Kirk Davies (OR), Rob Sharp (OR), Jesse Svejcar (OR), Erica Ersch (OR), Ed Rhodes (TX), Jacob & Morgan Young (OR), Maria (“Felix”) Villagrana (OR), Jamie Pyrse (OR), Kim Adams (CA), Jeff Anderson (AZ), Genie Ash (WA), Adam Atchley (OR), Lori Bourne (ID), Jeff (“The Crusher”) Duchene (MN), Zola Gibson (OR), Erica Hagerman (ID), Kimberly Haile (TX), George Hitz (OR), Jim Hobbs (ID), Emily Hugie (OR), Jay Kerby (OR), Roxanne Kessler (CA), Kelly (“Spike”) Mumm (WI), Maria Peila (OR), Ben Smith (SD), Lauren Svejcar (OR), Carmen Williams (NE).
4
Table of Contents
I. Overview ……………………………………………………………………………………… 5 II. Plant Community Response to Preparatory Juniper Cutting and Prescribed Fire……………. 6 III. Restoration of Quaking Aspen Woodlands Invaded by Western Juniper……………….…. 13 IV. Juniper Cutting and Prescribed Fire Combinations, South Mountain, Idaho…………….... 20 V. Long-term Plant Succession Following Western Juniper Cutting………………………….. 28 VI. Long-term Spatial Dynamics in Cut Western Juniper Woodlands………………………... 34 VII. Herbaceous Response to Winter Burning of Western Juniper Debris……………………. 39 VIII. Runoff and Erosion after Cutting Western Juniper……………………………………… 45 IX. Effects of Juniper Cutting on Soil Nitrogen Dynamics and Litter Decomposition……….. 50 X. Grazing after Juniper Cutting………………………………………………………………. 53 XI. Summary………………………………………………………………………………..…. 55 XII. Ongoing Juniper Control Research ..................................................................................... 56
5
I. Overview of Juniper Control Studies Western juniper encroachment into sagebrush steppe and other plant communities throughout the northern Great Basin is of serious ecological concern. Juniper now dominates millions of acres of rangeland in eastern Oregon, southwest Idaho, and along the northern border region of Nevada and California. Current estimates put juniper woodlands, in all phases of woodland invasion, at between 8-9 million acres. Other plant communities that juniper expansion currently threatens are aspen woodlands, riparian corridors, bitterbrush, and mountain mahogany stands. The purpose of this report is to provide condensed results of 10 EOARC research studies evaluating; A) the effectiveness of juniper control methods; and B) the effects of control to plant succession, nutrient cycling, and surface hydrology. Each study consists of two pages of text highlighting the main results and observations followed by accompanying photos and figures. A total of 3 studies on prescribed fire in woodlands and 7 studies involving juniper cutting are reported. Fire Studies: Two of the fire studies involve prescribed burning across multiple sites in mountain big sagebrush plant communities (7 different plant community types). The third fire study evaluates fall or late spring burning to remove juniper and restore aspen woodland. All the fire studies involved some level of preparatory cutting of western juniper (25-75% of juniper cut) to increase dry-surface fuels so that fire will carry through woodlands and remove remaining live trees. Fire applications were conducted in both Phase II and III woodlands, though Phase III woodlands pre-dominated the studies1. Cutting Studies: The cutting studies consist of a series of long-term projects begun in the 1990’s. These studies all occurred on a single site dominated by a 90-year old juniper woodland. The site is a Basin big sagebrush/Thurber’s needlegrass-bluebunch wheatgrass association. Studies have included long-term plant succession after cutting, surface hydrology in cut and uncut woodlands, juniper debris burning trials, grazing after juniper cutting, and nutrient and litter dynamics. Results and Units: Unless noted results mainly report the response of the major plant functional groups (juniper, aspen, shrubs, perennial grasses, perennial forbs, annual forbs, cheatgrass, non-native forbs). Specific species response can be obtained by contacting the research center. Units are mainly in metric unless noted. To convert from kg per hectare to lbs. per acre multiply by 0.9. Densities of perennial grasses are often in meter-2 which is close to a yd-2. Research to Management: The research results reported here cannot account for every management contingency and woodland situation observed in the field. Western juniper is present in several ecological provinces and though many of the problems faced by juniper expansion are similar, each province has unique issues to address when managing their woodlands. For example, weedy annuals are of major concern in large portions of the John Day province while the High Desert and Humboldt provinces have tended to avoid significant weed problems when treating their woodlands. Despite the limitations of research several guiding principles emerge from the results which are conveyed in the study sections and the summary. These guiding principles are applicable in the field though implementation of juniper control projects at larger scales should remain flexible and adaptive and take into account site and woodland characteristics. Research papers: If interested most of the research reported here is available in article form through our website (or will be shortly) at http://oregonstate.edu/dept/EOARC/.
1 Phase I woodlands are where trees are present but shrubs and herbs are the dominant vegetation. In Phase II, trees are co-dominant with shrubs and herbs and all three vegetation layers influence ecological processes. Phase III woodlands are when juniper is the dominant vegetation and the primary plant layer influencing ecological processes. From Miller, R.F., J.D. Bates, T.J. Svejcar, F. B. Pierson, and L.E. Eddleman. 2005. Biology, Ecology, and Management of Western Juniper. Oregon State University Agricultural Experiment Station, Technical Bulletin 152, June 2005. Corvallis. 77 p.
6
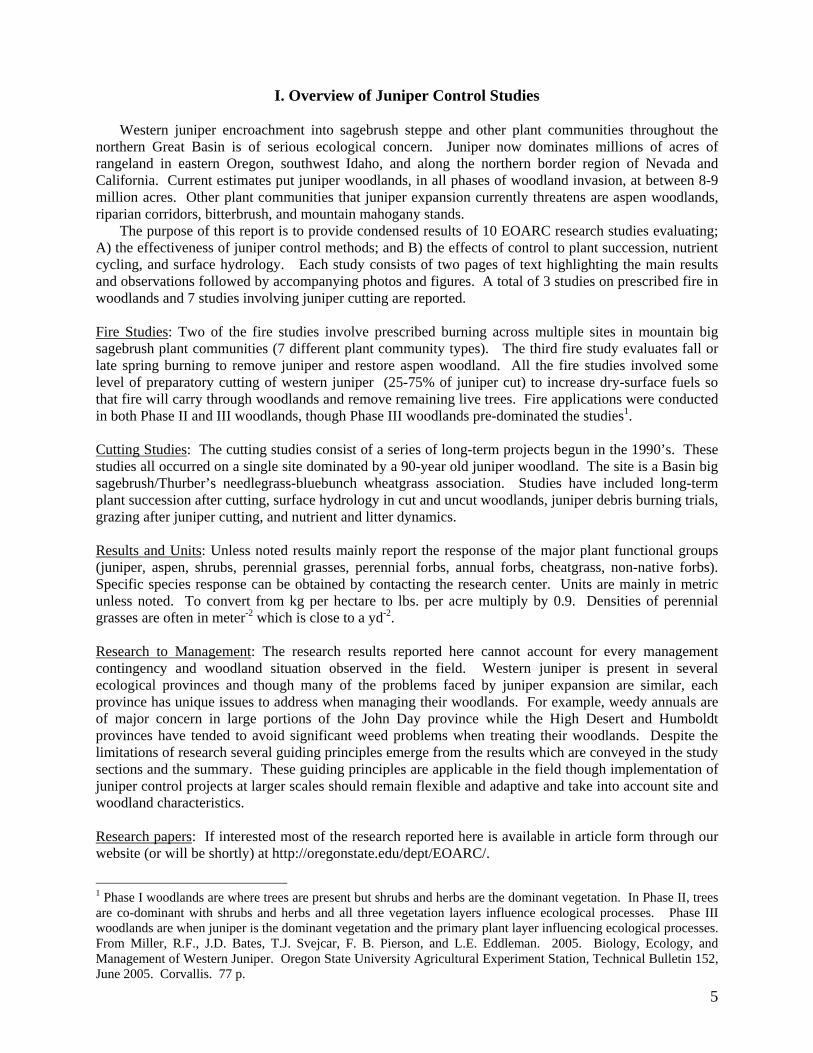
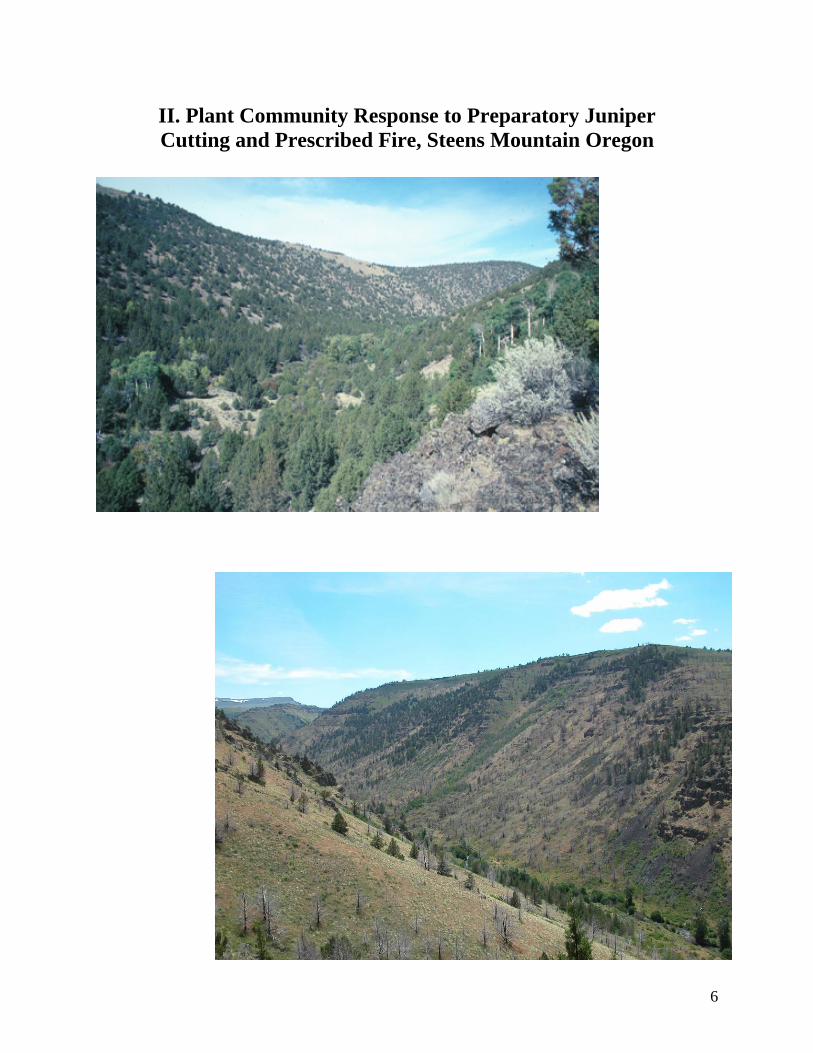
II. Plant Community Response to Preparatory Juniper Cutting and Prescribed Fire, Steens Mountain Oregon
7
II. Plant Community Response to Preparatory Juniper Cutting and Prescribed Fire
Jon D. Bates and Kirk W. Davies Overview: A main objective of western juniper control treatments is to restore northern Great Basin shrub-steppe plant communities. To reestablish shrub-grasslands and deciduous plant communities’ western juniper has been effectively removed by prescribed burning or cutting. Cutting has normally been applied to invasive woodlands that are fully stocked and no longer possess enough understory fuels to carry a fire. Woodlands that lack adequate understory fuels are those in mid to late invasive stages (Phase III). Recent juniper control projects have demonstrated that Phase III woodlands can be burned after selective levels of tree cutting are applied to increase surface fuels. Preparatory cutting of between 25-33% of the trees followed by prescribed fire in the fall has been successful at removing remaining live juniper in quaking aspen and mountain big sagebrush communities. Purpose: The purpose of this study was to evaluate the impacts of preparatory western juniper cutting (33% of mature trees cut) followed by fall prescribed fire to mountain big sagebrush and aspen plant communities. Specifically evaluated were: 1) the effectiveness of the treatment at removing juniper from seedlings to mature trees, 2) initial impacts to ground cover and species composition, and 3) succession of shrub and herbaceous understories. Site Description: The study was located in Kiger Canyon on Steens Mountain, southeastern Oregon. Elevation of the study sites ranged from 1675-1990 m (5500 to 6530 ft). The five community types and woodland phases were:
- East Fescue; Mountain big sagebrush/Idaho fescue (east aspect), (Phase II and III). - North Fescue; Mountain big sagebrush/ Idaho fescue (north aspect), (Phase II and III). - Columbiana; Mountain big sagebrush-western snowberry/ Columbia needlegrass, (Phase II and III). - Needlegrass; mountain big sagebrush/western needlegrass-blue-bunch wheatgrass, (Phase III). - Aspen; quaking aspen, (Phase III).
Treatment: Five to six plots of each community type were measured for pre-treatment vegetation characteristics in Spring 2003. Cutting involved felling 1/3 of the dominant and subcanopy (mature) juniper trees, evenly distributed through stands. Junipers were cut in spring 2003 and were allowed to dry during the summer. Fall burning was applied in October 2003. The prescribed fire technique used was a spot head fire using a heli-torch. Recovery depended on natural succession and no seeding was done. Measurements: Sampling included measurement of cover, density, and richness of tree (juniper, aspen, chokecherry), shrub, and herbaceous species. Time Scale: One year pre-treatment data and three years of post-treatment response (2003-2006). Results, Observations, and Conclusions: 1. Selective, preparatory cutting of juniper is an effective method to increase surface fuels and allow fire, applied in the fall, to carry and remove remaining live trees. 2. The removal of 1/3 of overstory juniper was more than adequate to eliminate remaining live junipers with fall fire in all plant community types. Preparatory cutting was necessary in all the Phase III woodlands. 3. However, cutting levels could be reduced in Phase III woodlands with juniper cover exceeding 40%. Cutting 20-25% of the trees in areas with 40-60% juniper cover is more than adequate (see section III). Areas with greater than 60% juniper cover, cutting 10-20% of the trees or strip cutting should be considered. This would lower cutting costs and reducing severity of the fire to understory species. 4. Cutting in Phase II Columbiana and North Fescue communities was unnecessary as sufficient shrub/understory fuels were present to carry fire. The Phase II East Fescue communities lacked adequate understory cover to achieve management objectives of juniper removal, thus, preparatory cutting in these sites appears to have been necessary. 5. Preparatory cutting in the Aspen community was necessary. However, because of high juniper cover and density it is our opinion that fewer trees could have been cut (perhaps 10-20%) without reducing the ability of the fire application to remove remaining live trees.
8
6. Canopy fires were maintained for several hundred yards in some uncut woodlands with little understory. These areas were located upslope of designated treatment areas. 7. Old-growth juniper located on outcrops and other places within the treatment area were frequently killed by the fire. These trees had survived historic (pre-settlement) fire events. Cut trees when burned are obviously providing the necessary heat and flame lengths to kill the older trees. Options to increase survival of the older trees would be to physically remove cut juniper fuels adjacent to old trees or not cutting post-settlement trees growing nearby old trees until after fall fire is applied to surrounding areas. The invasive trees could then be cut and winter burned. 8. While it is common to permit cut trees to dry for one year prior to burning, trees cut in this study were felled in the spring (April-June) of 2003. One growing season (April-October) was sufficient to dry trees to carry the fire and consume all but the trunks of the cut juniper. 9. In all communities understory cover was double that of pre-treatment conditions the third growing season after fire. The reduction of litter, however, has resulted in increased bareground and on steeper slopes runoff and erosion has occurred. Most sites will stabilize hydrologically in the next few years. However, areas that remain dominated by cheatgrass are likely not to stabilize without additional inputs (e.g. seeding of perennials) (Figs 1-4). 10. The composition of understory response has been highly variable among and within plant communities types;
East Fescue; Composition of the understory has largely been dominated by perennial grasses and forbs, and annual forbs (especially 2005). Cheatgrass has shown the potential to dominate early succession when perennials were eliminated. In the future, follow up reconnaissance after fire application should identify these areas and reseeding should be considered. Areas that appear to require reseeding are the Phase III woodlands. Phase II woodlands are recovering acceptably with native perennials. North Fescue; Composition of the understory has largely been dominated by perennial grasses and forbs, and annual forbs (especially 2005). These sites have recovered the fastest in terms of maintaining native composition. There is little threat of weeds competing in this type. Columbiana; Composition of the current suite of species has varied; sites are dominated by either a) cheatgrass and perennial and annual forbs or b) perennial grasses, perennial forbs, and annual forbs. Cheatgrass is not expected to maintain itself as rhizomatous grasses are spreading and perennial bunchgrass and forb seedlings are establishing in these areas. Areas that could have been reseeded were the Phase III woodlands. Needlegrass; This community had a poor understory component prior to treatment. The fire eliminated many of the remaining bunchgrasses whose pretreatment densities were adequate for recovery if sites had been just cut and not burned. These sites, primarily south aspects, are dominated by cheatgrass (50-80% of herbaceous composition) and annual forbs. These were all Phase III woodlands. Reseeding these areas should be considered in the future. Cutting combined with winter burning may also be a better option for areas. Aspen; Aspen sprouting has varied from 2000 to 4500 stems acre-1 in treated stands (Fig 5). Sprouting is expected to continue as open areas fill in with new recruits. Browsing by ungulates has been minimal and will likely not impede aspen regeneration. The understory response varied from stands dominated by non-natives (mullein and/or cheatgrass) or perennial grasses and forbs. Given potentials for the community it seems unlikely that the presence of mullein or cheatgrass will be maintained (see sections III and VII on winter burning).
11. On sites with depleted understories, Phase III woodlands, and those with weeds threats (such as the Needlegrass community and some Phase III East Fescue) winter burning is recommended. Cutting could be increased to 50% and combined with winter or early spring (March for sagebrush types) burning (soil and ground litters at field capacity and frozen) should remove most remaining juniper while minimizing understory mortality. 12. To reemphasize an earlier point, cheatgrass is becoming an increasing threat at higher elevations (5,000 to 6,500 ft) in the northern Great Basin, especially on south/west aspects and after fires of high severity; particularly partial cut Phase III woodlands where fire reduces perennial grass densities below recovery thresholds (<1-3 plants yd-2).
9
II. Kiger Hillslope: Pretreatment values are 2003 data. Post-treatment data are 2004-2006.
A. Total Herbaceous
2003 2004 2005 2006
Cov
er %
0
20
40
60 Aspen East Fescue North Fescue Columbiana Needlegrass
B. Perennial Bunchgrass
2003 2004 2005 2006
Cov
er %
0
5
10
15
C. Carex spp.
2003 2004 2005 2006
Cov
er %
0
1
2
D. Poa secunda
Year
2003 2004 2005 2006
Cov
er %
0
1
2
3
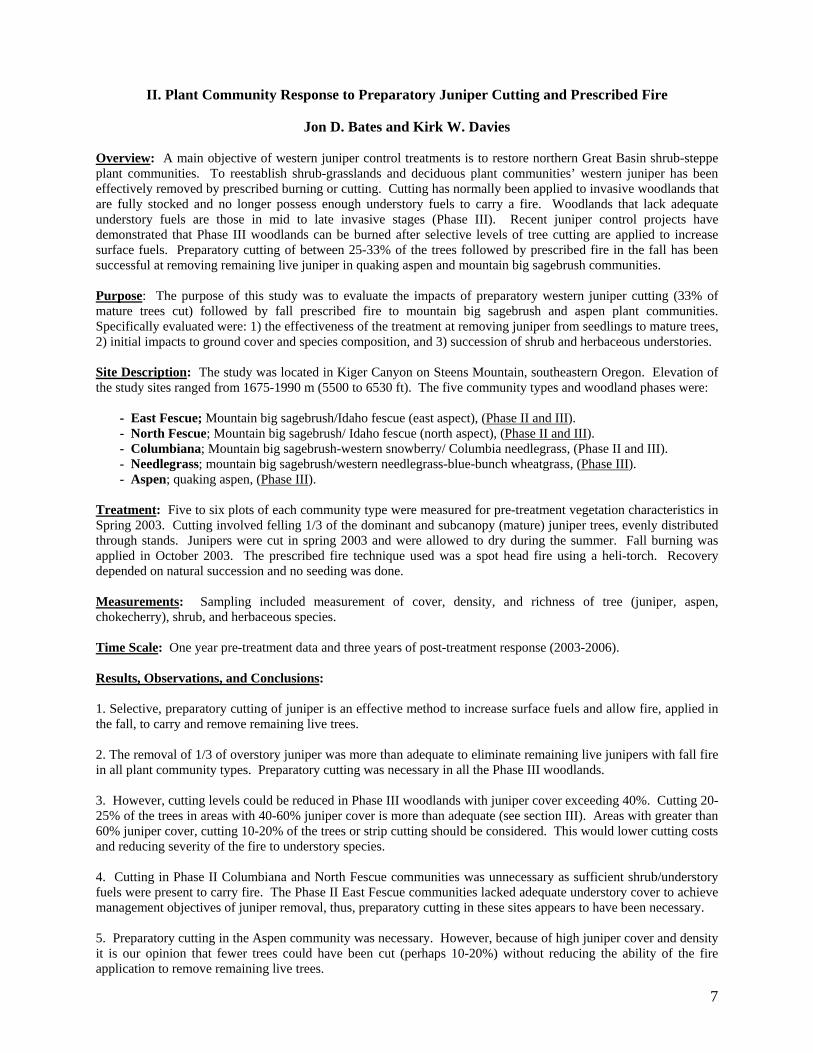
Fig 1. Hillslope Plant Communities: Total Herbaceous (A) and grass type functional group cover, 2003 (pretreatment)-2006. for: (B) Perennial Bunchgrasses; (C) Carex spp. ; (D) Poa secunda (Sandberg’s bluegrass). Data are in means + one standard error. All sites have increased herbaceous cover though composition of response has differed. North and East Fescue sites are making the more rapid recovery in terms of perennial grass groups.
A. Rhizomatus Perennial Grass
% C
over
0
2
4
6
8
D. Cheatgrass
Year
2003 2004 2005 2006
% C
over
0
10
20
Columbiana Aspen North Fescue East Fescue Needlegrass
B. Perennial Forbs
% C
over
0
10
20
30
40
C. Annual Forbs
% C
over
0
5
10
15
20
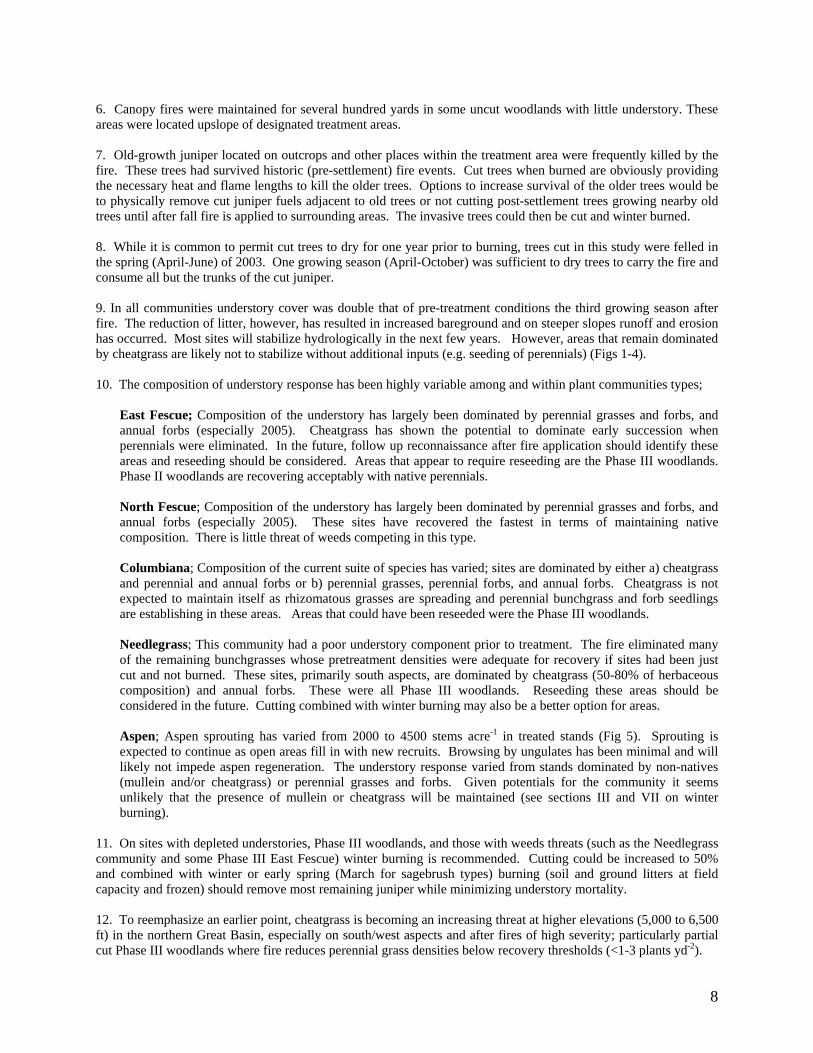
Pre-fire Fig 2. Hillslope Plant Communities: Functional group cover (%) for the treatments in 2003-2006 for: (A) Rhizomatous perennial grasses; (B) Perennial Forbs; (C) Annual Forbs; and (D) Cheatgrass. Data are in means + one standard error. Rhizomatous grasses are recovering rapidly in Aspen and Columbiana communities. On all sites perennial forb cover exceeded pre-burn conditions though on the Aspen sites most of the forbs component was either mullein (non-native) or streambank globemallow (Iliamna). Cheatgrass potentially will dominate the Needlegrass communities and parts of the East Fescue type. Annual forbs increased on all communities, though response varied by year as a result of growing conditions (e.g. soil water availability and spring temperatures).
10
A. Bare Ground
X Data
2003 2004 2005 2006
% C
over
0
20
40
60
80
B. Rock
Year
2003 2004 2005 2006
% C
over
0
10
20
C. Litter
Year
2003 2004 2005 2006
% C
over
0
20
40
60
D. Moss
Year
2003 2004 2005 2006
% C
over
0
2
4
E. Crust
Year2003 2004 2005 2006
% C
over
0.0
0.5
1.0Columbiana Aspen North Fescue East Fescue Needlegrass
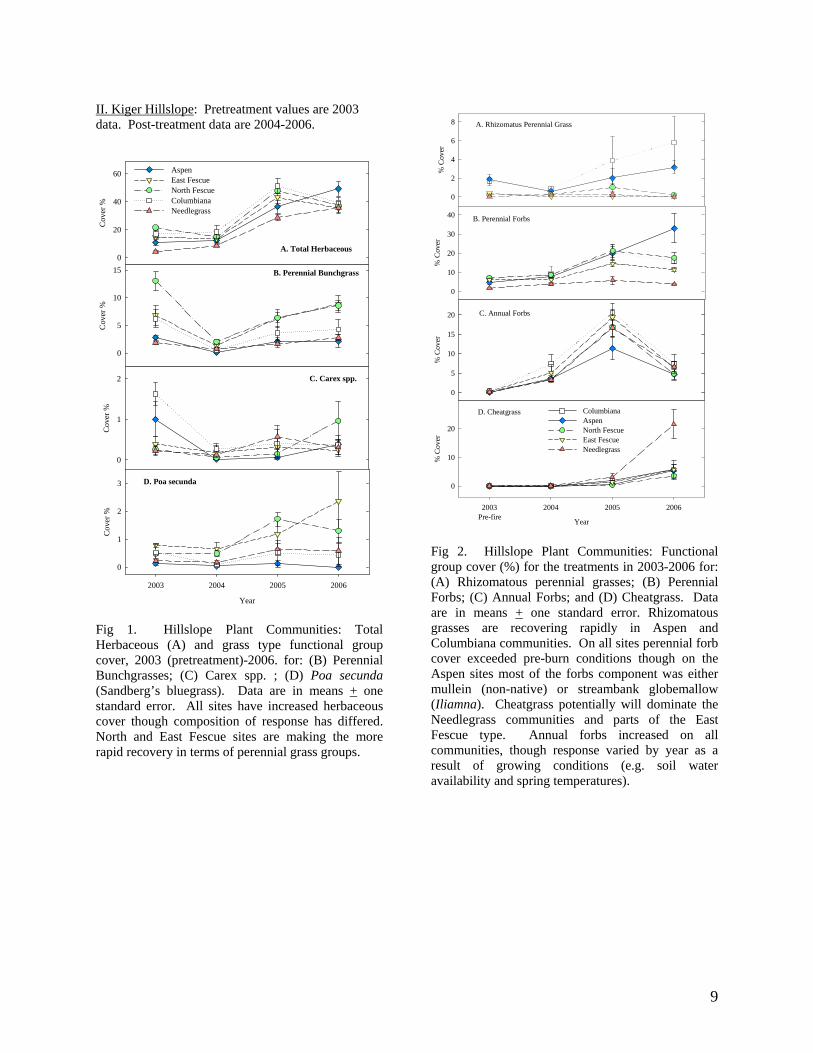
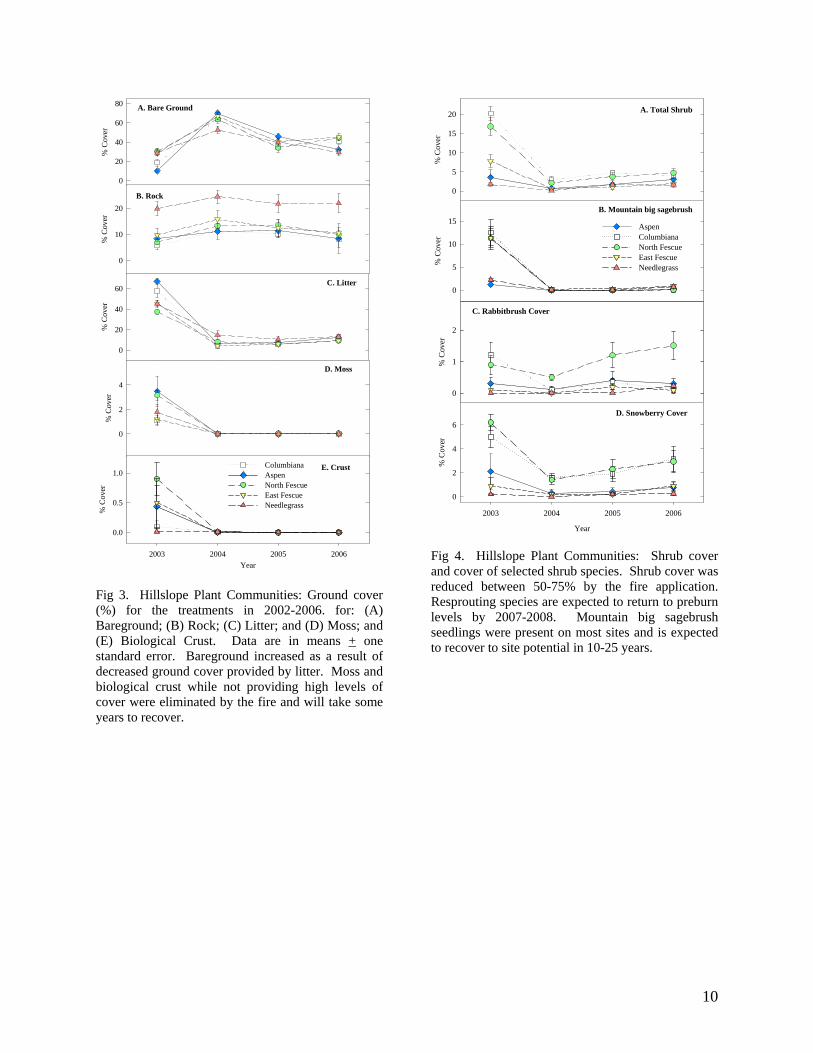
Fig 3. Hillslope Plant Communities: Ground cover (%) for the treatments in 2002-2006. for: (A) Bareground; (B) Rock; (C) Litter; and (D) Moss; and (E) Biological Crust. Data are in means + one standard error. Bareground increased as a result of decreased ground cover provided by litter. Moss and biological crust while not providing high levels of cover were eliminated by the fire and will take some years to recover.
A. Total Shrub
% C
over
0
5
10
15
20
B. Mountain big sagebrush
Year
% C
over
0
5
10
15Aspen ColumbianaNorth FescueEast Fescue Needlegrass
C. Rabbitbrush Cover
% C
over
0
1
2
D. Snowberry Cover
Year
2003 2004 2005 2006
% C
over
0
2
4
6
Fig 4. Hillslope Plant Communities: Shrub cover and cover of selected shrub species. Shrub cover was reduced between 50-75% by the fire application. Resprouting species are expected to return to preburn levels by 2007-2008. Mountain big sagebrush seedlings were present on most sites and is expected to recover to site potential in 10-25 years.
11
A. Aspen DensitySt
ems h
a-1
0100200300400500
2000
4000
6000
Suckers Subcanopy Dominant
B. Aspen Cover
Year
2003 2004 2005 2006
Cov
er (%
)
0
5
10
15 Total AspenSuckers Subcanopy Dominant
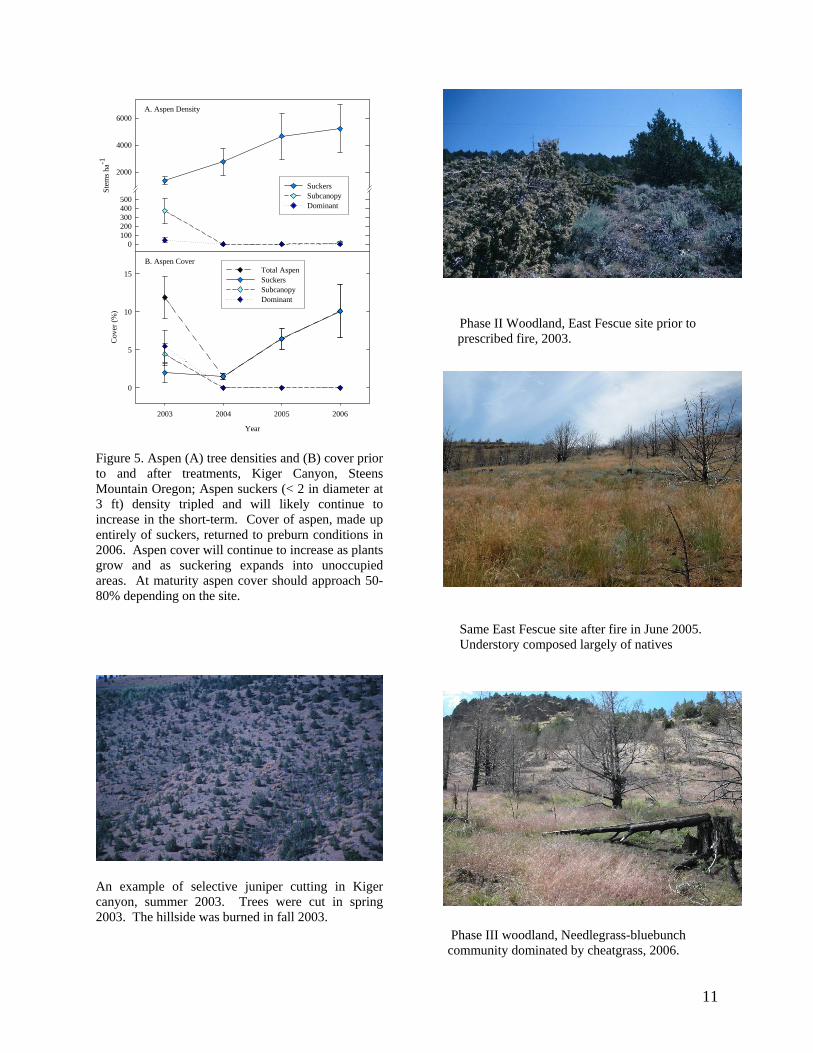
Figure 5. Aspen (A) tree densities and (B) cover prior to and after treatments, Kiger Canyon, Steens Mountain Oregon; Aspen suckers (< 2 in diameter at 3 ft) density tripled and will likely continue to increase in the short-term. Cover of aspen, made up entirely of suckers, returned to preburn conditions in 2006. Aspen cover will continue to increase as plants grow and as suckering expands into unoccupied areas. At maturity aspen cover should approach 50-80% depending on the site.
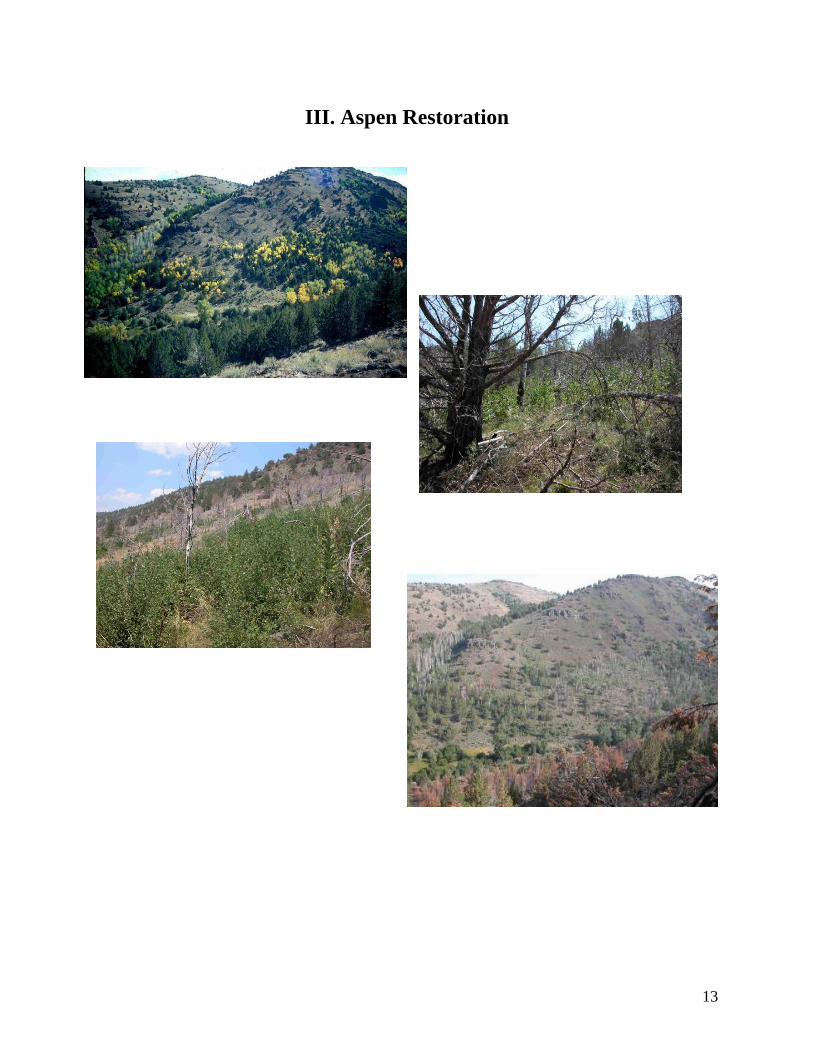
An example of selective juniper cutting in Kiger canyon, summer 2003. Trees were cut in spring 2003. The hillside was burned in fall 2003.
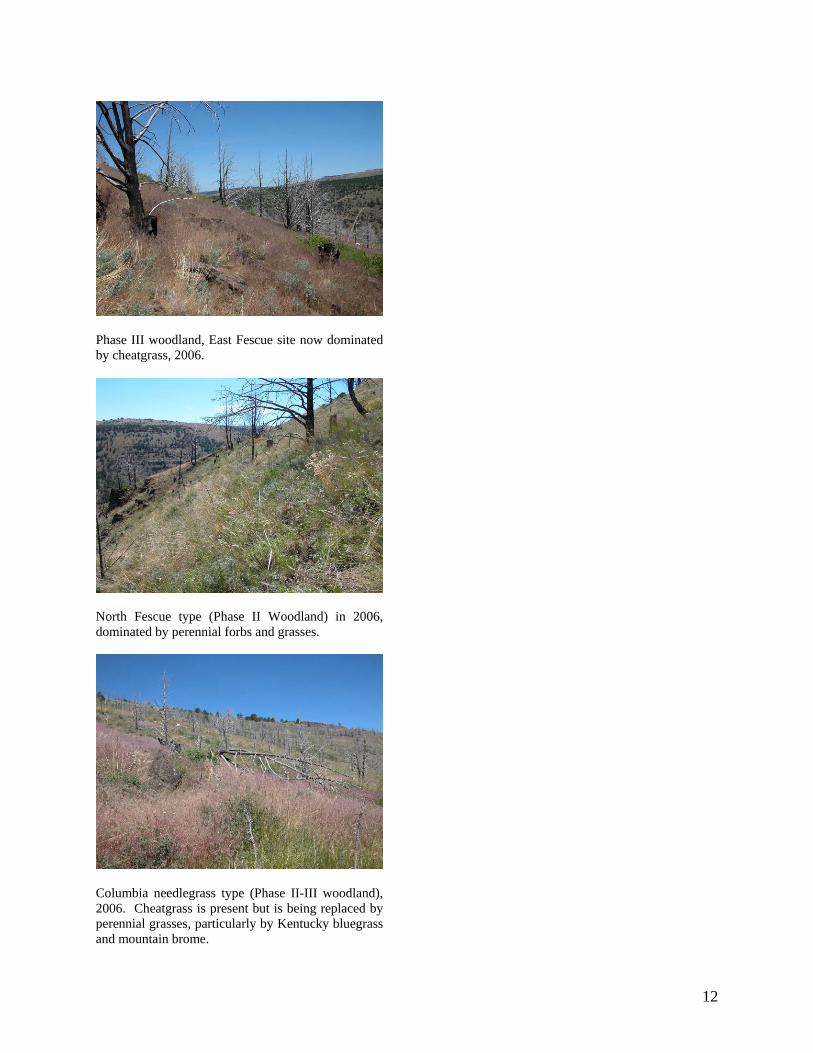
Phase II Woodland, East Fescue site prior to prescribed fire, 2003.
Same East Fescue site after fire in June 2005. Understory composed largely of natives
Phase III woodland, Needlegrass-bluebunch community dominated by cheatgrass, 2006.
12
Phase III woodland, East Fescue site now dominated by cheatgrass, 2006.
North Fescue type (Phase II Woodland) in 2006, dominated by perennial forbs and grasses.
Columbia needlegrass type (Phase II-III woodland), 2006. Cheatgrass is present but is being replaced by perennial grasses, particularly by Kentucky bluegrass and mountain brome.
13
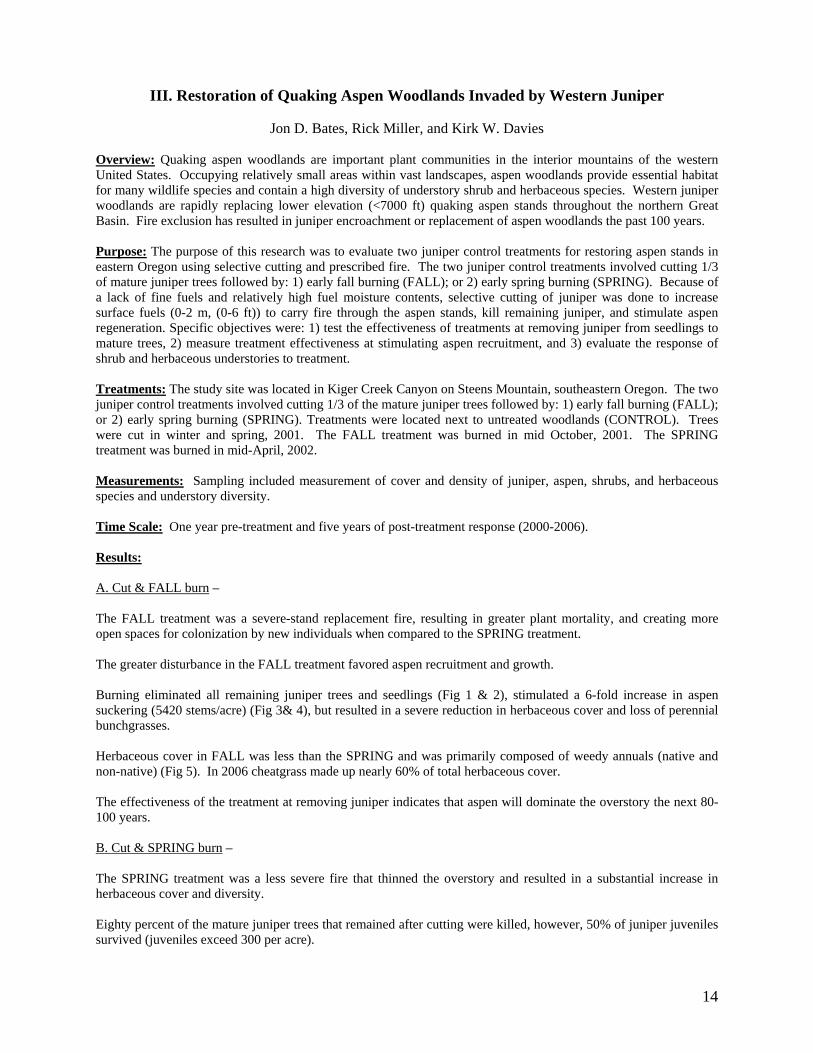
III. Aspen Restoration
14
III. Restoration of Quaking Aspen Woodlands Invaded by Western Juniper
Jon D. Bates, Rick Miller, and Kirk W. Davies Overview: Quaking aspen woodlands are important plant communities in the interior mountains of the western United States. Occupying relatively small areas within vast landscapes, aspen woodlands provide essential habitat for many wildlife species and contain a high diversity of understory shrub and herbaceous species. Western juniper woodlands are rapidly replacing lower elevation (<7000 ft) quaking aspen stands throughout the northern Great Basin. Fire exclusion has resulted in juniper encroachment or replacement of aspen woodlands the past 100 years. Purpose: The purpose of this research was to evaluate two juniper control treatments for restoring aspen stands in eastern Oregon using selective cutting and prescribed fire. The two juniper control treatments involved cutting 1/3 of mature juniper trees followed by: 1) early fall burning (FALL); or 2) early spring burning (SPRING). Because of a lack of fine fuels and relatively high fuel moisture contents, selective cutting of juniper was done to increase surface fuels (0-2 m, (0-6 ft)) to carry fire through the aspen stands, kill remaining juniper, and stimulate aspen regeneration. Specific objectives were: 1) test the effectiveness of treatments at removing juniper from seedlings to mature trees, 2) measure treatment effectiveness at stimulating aspen recruitment, and 3) evaluate the response of shrub and herbaceous understories to treatment. Treatments: The study site was located in Kiger Creek Canyon on Steens Mountain, southeastern Oregon. The two juniper control treatments involved cutting 1/3 of the mature juniper trees followed by: 1) early fall burning (FALL); or 2) early spring burning (SPRING). Treatments were located next to untreated woodlands (CONTROL). Trees were cut in winter and spring, 2001. The FALL treatment was burned in mid October, 2001. The SPRING treatment was burned in mid-April, 2002. Measurements: Sampling included measurement of cover and density of juniper, aspen, shrubs, and herbaceous species and understory diversity. Time Scale: One year pre-treatment and five years of post-treatment response (2000-2006). Results: A. Cut & FALL burn – The FALL treatment was a severe-stand replacement fire, resulting in greater plant mortality, and creating more open spaces for colonization by new individuals when compared to the SPRING treatment. The greater disturbance in the FALL treatment favored aspen recruitment and growth. Burning eliminated all remaining juniper trees and seedlings (Fig 1 & 2), stimulated a 6-fold increase in aspen suckering (5420 stems/acre) (Fig 3& 4), but resulted in a severe reduction in herbaceous cover and loss of perennial bunchgrasses. Herbaceous cover in FALL was less than the SPRING and was primarily composed of weedy annuals (native and non-native) (Fig 5). In 2006 cheatgrass made up nearly 60% of total herbaceous cover. The effectiveness of the treatment at removing juniper indicates that aspen will dominate the overstory the next 80-100 years. B. Cut & SPRING burn – The SPRING treatment was a less severe fire that thinned the overstory and resulted in a substantial increase in herbaceous cover and diversity. Eighty percent of the mature juniper trees that remained after cutting were killed, however, 50% of juniper juveniles survived (juveniles exceed 300 per acre).
15
This treatment can be considered only a temporary interruption of development to juniper woodland. The gaps created by the cutting and fire disturbance will provide juniper saplings and seedlings with the opportunity to reoccupy the SPRING sites. Aspen suckering in the SPRING increased 3.5-fold (2985 stems/acre) by the fifth year post-fire (2006) (Fig 3& 4). The SPRING treatment has prolonged aspen site occupancy but the presence of juniper will result in co-dominance of the overstory by aspen and juniper within 30 years. Herbaceous cover increased 330%, no mortality of bunchgrasses occurred, and the number of species observed increased by 50% by the fifth year after fire (Fig 5). It is estimated that livestock forage increased about 10-fold. Herbaceous composition was primarily composed of native grasses and forbs. Perennial forb diversity was highest in the SPRING treatment. Conclusions: Cut & FALL Burn
1. Cutting combined with fall fire was the most effective method at removing remaining juniper and stimulating greater aspen suckering. 2. Fall fire severely impacted the understory and reseeding of herbaceous perennials should be considered. Cut trees increase heat fluxes into soils and elevate mortality of perennial species. Native perennial forbs and grasses were largely eliminated with the fall fire. In these lower elevation aspen stands non-native weeds appear to be of concern in early succession as they rapidly increase before native perennials can reestablish. 3. What has been surprising is a steady increase of cheatgrass in the FALL treatment. Cheatgrass is unlikely to persist as Kentucky bluegrass that survived the fire has slowly increased and will likely reoccupy treated sites. 4. The cutting of 1/3 of overstory juniper was more than adequate to eliminate remaining live junipers with FALL fire treatment. This suggests that cutting levels could potentially be reduced when combined with fall fire (see section II).
Cut & SPRING Burn
5. If the management objective is to rapidly increase the herbaceous component and moderately increase aspen suckering, spring burning is recommended. Spring burning may also be useful in aspen communities where the understory is depleted and managers desire a more rapid recovery of this vegetation group. 6. With spring burning, follow-up management will be necessary to remove juniper that are missed in initial treatments to prevent early return and domination by juniper. Given growth rates of juniper, these stands could be re-dominated by juniper in about 60-80 years. 7. When sites are burned in spring (or winter) preparatory cutting levels should probably be increased above 50% to increase chances of remove a higher percentage of junipers, both mature and juvenile trees, by fire. This level of cutting would likely not impact the understory negatively when the site is burned as long as soils and surface litters are frozen and or at field capacity (litter in contact with the ground); and herbaceous vegetation is largely dormant. 8. An advantage of spring burning is that the fire can be confined to the treatment area without much risk of escape. This treatment would be useful in other forested systems (e.g Ponderosa Pine, other encroaching conifer species) and in stands adjacent to areas of management concern (e.g. Mountain big sagebrush habitat, riparian zones, structures, residential areas etc.). For example, it may be desirable to protect areas, particularly sagebrush grassland, to avoid negative impacts to wildlife dependent on these communities.
__________________________________________________________________________ Results from 2000-2005 were published in; Bates J.D., R. Miller, and K. Davies. 2006. Restoration of Aspen Invaded by Western Juniper. Range Ecology and Management, 59:88-97.
16
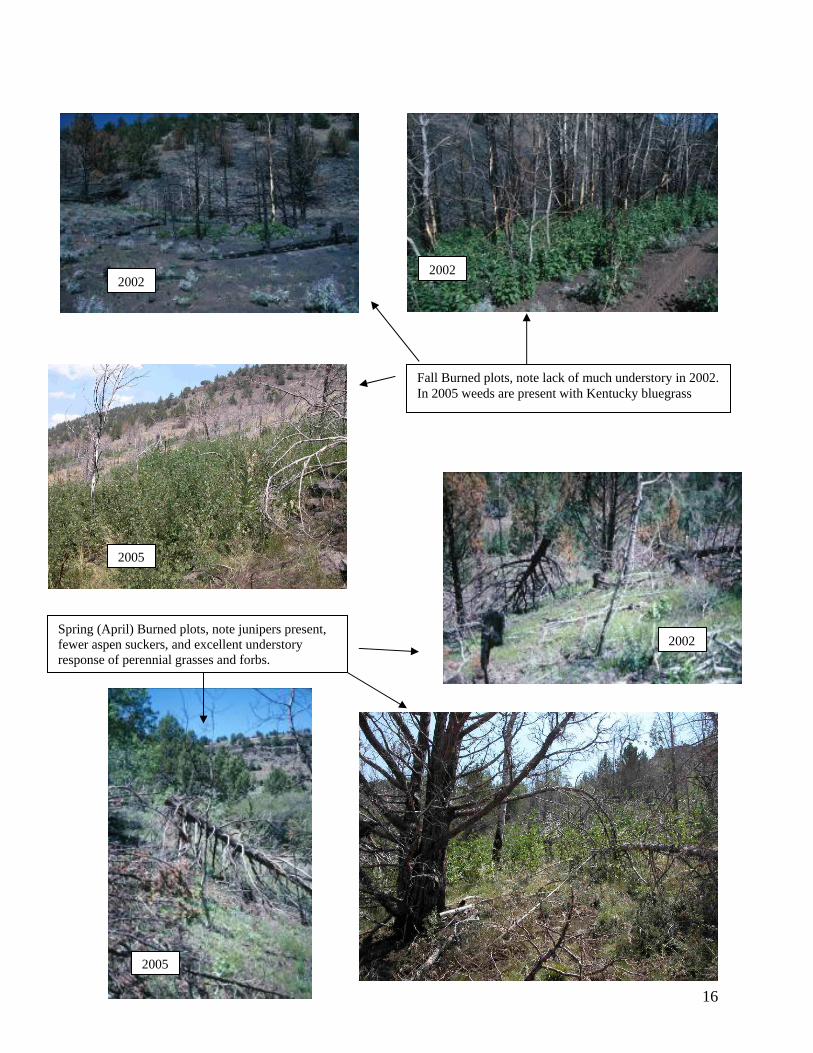
Fall Burned plots, note lack of much understory in 2002. In 2005 weeds are present with Kentucky bluegrass
2002 2002
2005
Spring (April) Burned plots, note junipers present, fewer aspen suckers, and excellent understory response of perennial grasses and forbs.
2002
2005
17
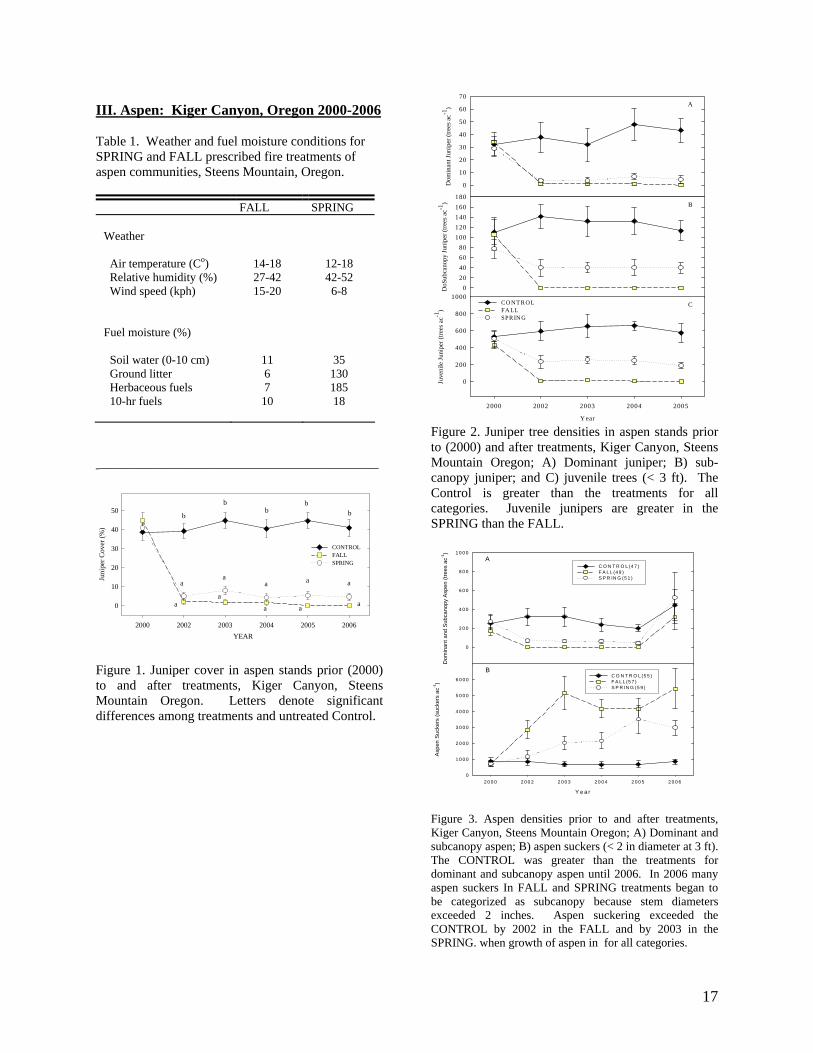
III. Aspen: Kiger Canyon, Oregon 2000-2006 Table 1. Weather and fuel moisture conditions for SPRING and FALL prescribed fire treatments of aspen communities, Steens Mountain, Oregon.
FALL SPRING Weather Air temperature (Co) Relative humidity (%) Wind speed (kph) Fuel moisture (%) Soil water (0-10 cm) Ground litter Herbaceous fuels 10-hr fuels
14-18 27-42 15-20
11 6 7 10
12-18 42-52 6-8
35 130 185 18
__________________________________________
2000 2002 2003 2004 2005 2006
Juni
per C
over
(%)
0
10
20
30
40
50
CONTROL FALLSPRING
aa
aa
b
b
YEAR
b
a
a
b
a
a
b
a
a
Figure 1. Juniper cover in aspen stands prior (2000) to and after treatments, Kiger Canyon, Steens Mountain Oregon. Letters denote significant differences among treatments and untreated Control.
A
Dom
inan
t Jun
iper
(tre
es a
c-1)
0
10
20
30
40
50
60
70
B
DoS
ubca
nopy
Juni
per (
trees
ac-1
)
020406080
100120140160180
C
Y ear
2000 2002 2003 2004 2005
Juve
nile
Juni
per (
trees
ac-1
)
0
200
400
600
800
1000CO NT R OL FA LL SPR IN G
Figure 2. Juniper tree densities in aspen stands prior to (2000) and after treatments, Kiger Canyon, Steens Mountain Oregon; A) Dominant juniper; B) sub-canopy juniper; and C) juvenile trees (< 3 ft). The Control is greater than the treatments for all categories. Juvenile junipers are greater in the SPRING than the FALL.
A
Dom
inan
t and
Sub
cano
py A
spen
(tre
es a
c-1)
0
2 0 0
4 0 0
6 0 0
8 0 0
1 0 0 0
C O N T R O L (4 7 ) F A L L (4 9 ) S P R IN G (5 1 )
B
Y e a r
2 0 0 0 2 0 0 2 2 0 0 3 2 0 0 4 2 0 0 5 2 0 0 6
Asp
en S
ucke
rs (s
ucke
rs a
c-1)
0
1 0 0 0
2 0 0 0
3 0 0 0
4 0 0 0
5 0 0 0
6 0 0 0C O N T R O L (5 5 ) F A L L (5 7 ) S P R IN G (5 9 )
Figure 3. Aspen densities prior to and after treatments, Kiger Canyon, Steens Mountain Oregon; A) Dominant and subcanopy aspen; B) aspen suckers (< 2 in diameter at 3 ft). The CONTROL was greater than the treatments for dominant and subcanopy aspen until 2006. In 2006 many aspen suckers In FALL and SPRING treatments began to be categorized as subcanopy because stem diameters exceeded 2 inches. Aspen suckering exceeded the CONTROL by 2002 in the FALL and by 2003 in the SPRING. when growth of aspen in for all categories.
18
III. Aspen: Kiger Canyon, Oregon 2000-2006 To
tal A
spen
Cov
er (%
)
10
20
30
40
50
a, a
a
b b
ab
Asp
en S
ucke
r Cov
er (%
)
0
10
20
30
40
50
CONTROL FALL SPRING
b b
a
a
a
a
B
A
Year
2000 2002 2003 2004 2005 2006
Asp
en S
ubca
nopy
/Dom
inan
t Cov
er (%
)
0
5
10
15
20
25
30 Cb
bb
aab
ab
aaa
b
aa
b
a
a
b
a
a
b
a
a
a a
b
b
a
a
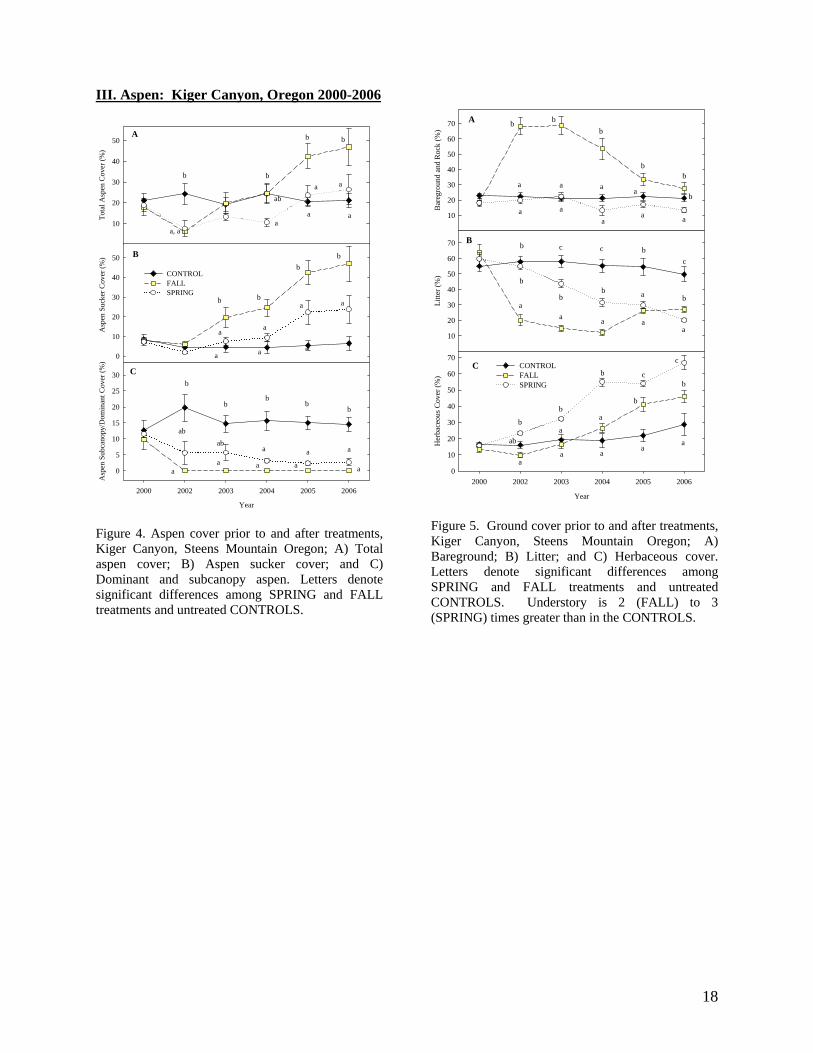
Figure 4. Aspen cover prior to and after treatments, Kiger Canyon, Steens Mountain Oregon; A) Total aspen cover; B) Aspen sucker cover; and C) Dominant and subcanopy aspen. Letters denote significant differences among SPRING and FALL treatments and untreated CONTROLS.
Bar
egro
und
and
Roc
k (%
)
10
20
30
40
50
60
70 A
Litte
r (%
)
10
20
30
40
50
60
70
Year
2000 2002 2003 2004 2005 2006
Her
bace
ous C
over
(%)
0
10
20
30
40
50
60
70CONTROL FALL SPRING
B
C
a a
a
a
aa
b
a
bb
a a
a
b
b
a
b
b
b
c c
aa
ab
ba
b
a
b
c
b
a
a
a
a
b
c
b
b
a
a
c
a
b
b
Figure 5. Ground cover prior to and after treatments, Kiger Canyon, Steens Mountain Oregon; A) Bareground; B) Litter; and C) Herbaceous cover. Letters denote significant differences among SPRING and FALL treatments and untreated CONTROLS. Understory is 2 (FALL) to 3 (SPRING) times greater than in the CONTROLS.
19
III. Aspen: Kiger Canyon, Oregon 2000-2006 Pe
renn
ial G
rass
Cov
er (%
)
10
20
30
40 CONTROL FALL SPRING
Pere
nnia
l For
b C
over
(%)
5
10
15
20
25
Ann
ual F
orb
Cov
er (%
)
0
2
4
6
8
10
YEAR
2000 2002 2003 2004 2005 2006
Num
ber o
f Spe
cies
2025303540455055
a
b
a
aa
a
b
b
b
b
b
ab
aa
a
aaa
a
b
b
a
bb
b
a
a a
a
a
A
B
D
E
bb
ab
a
a
a
a
a
b
a
b
c
a
b
c
a
a
b
b
a
a
b
a
c
Ann
ual G
rass
Cov
er (%
)
0
5
10
15CONTROL FALL SPRING
a, a, a a, a, aa, a, aa, a
a, a a, ab
bb
C
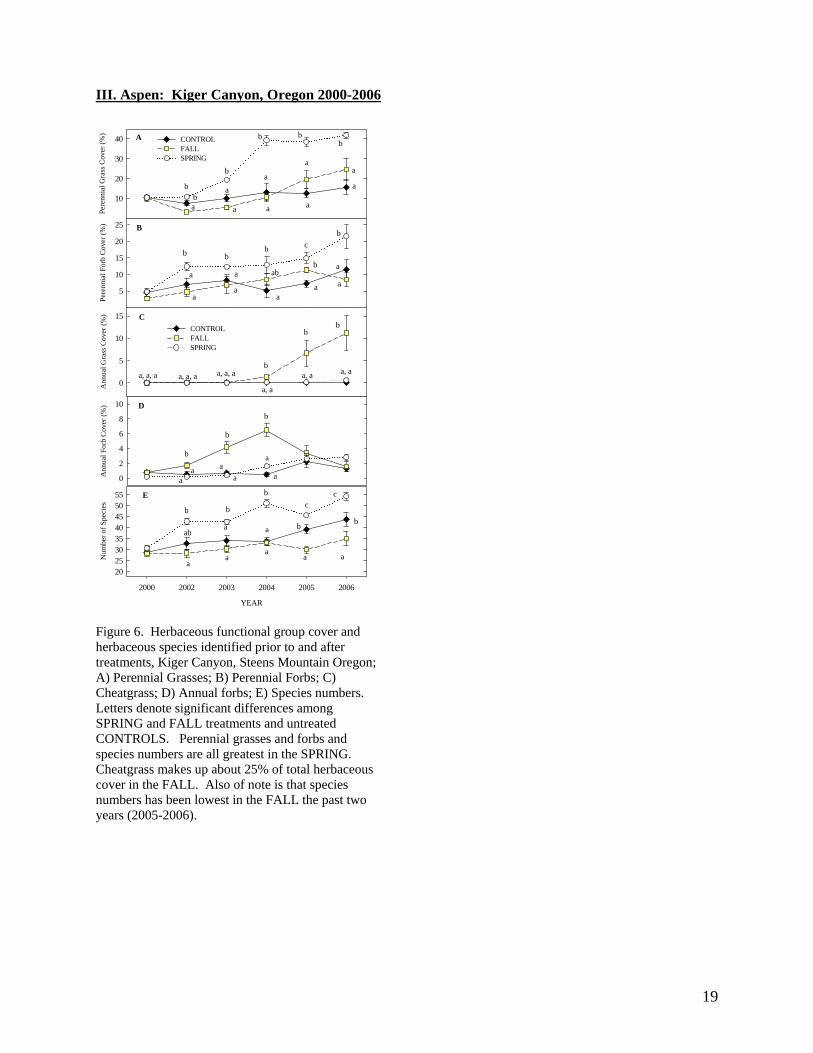
Figure 6. Herbaceous functional group cover and herbaceous species identified prior to and after treatments, Kiger Canyon, Steens Mountain Oregon; A) Perennial Grasses; B) Perennial Forbs; C) Cheatgrass; D) Annual forbs; E) Species numbers. Letters denote significant differences among SPRING and FALL treatments and untreated CONTROLS. Perennial grasses and forbs and species numbers are all greatest in the SPRING. Cheatgrass makes up about 25% of total herbaceous cover in the FALL. Also of note is that species numbers has been lowest in the FALL the past two years (2005-2006).
IV. Juniper Cutting/ Prescribed Fire, South Mountain Idaho
21
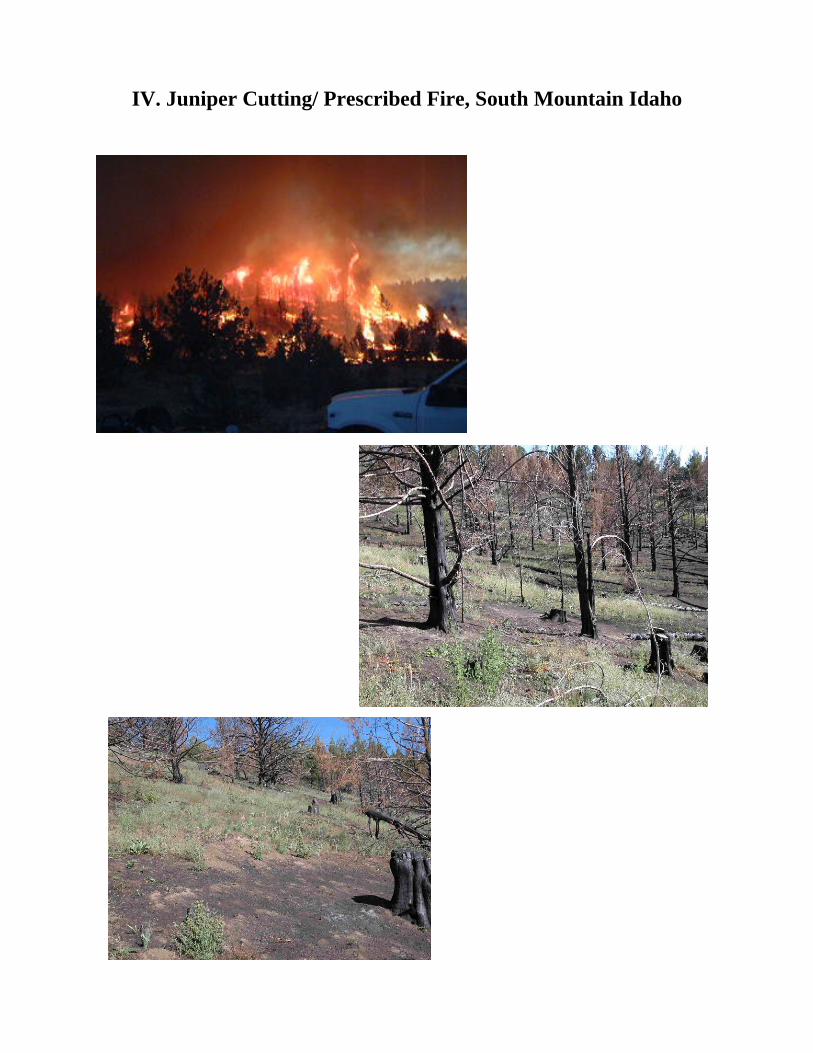
IV. Juniper Cutting and Prescribed Fire Combinations, South Mountain, Idaho
Jon Bates, Kirk Davies, Rob Sharp
Overview: Control of western juniper by burning or cutting has been successfully used to reestablish shrub/understory plant communities in the northern Great Basin. Tree cutting, using chainsaws, has generally been applied to areas that have fully developed woodlands (Phase III) and no longer possess the understory fuels to successfully carry a fire. Woodlands that lack adequate fuels are those in mid to late successional stages where juniper competition has eliminated the shrubs and reduced understory production. In many juniper control projects only a portion of the trees need to be cut to increase surface fuels (0-3 m) so that prescribed fire can remove remaining live trees. Reducing the number of trees cut could lower costs and permit larger acreages to be treated. Purpose: An objective of the research was to assess what level of cutting is required to eliminate remaining juniper trees by prescribed fire in the fall. This project evaluated several levels of cutting followed by prescribed fire. Cutting treatments involved felling 25%, 50%, and 75% of the trees per acre. The study also evaluated the effect of the treatments to post-fire vegetation succession. Treatments: Study sites were set up within the Juniper and Cabin Creek drainages on South Mountain, Idaho (about 6000 ft. elevation). Two plant community types were selected for treatment; western snowberry-mountain sagebrush/Idaho fescue-western needlegrass (SNOWBERRY) and mountain big sagebrush/letterman’s needlegrass (SAGE). Sites were dominated by post-settlement western juniper woodlands (all Phase III woodlands). Juniper cover ranged between 40-70% and tree densities ranged from 100-300 trees per acre. Preparatory tree manipulations were chainsaw cutting 25%, 50%, and 75% of the post-settlement trees in October 2002 (Treatments were: SAGE 25, SAGE 50, SAGE 75; SNOWBERRY 25, SNOWBERRY 50, SNOWBERRY 75). Each treatment plot was 1.5 acres in size and was replicated 5 times (40 plots total). Total area used per community type was 30 ac. (60 acres total). Cut trees were allowed to dry for one year prior to fire application. Prescribed fires (strip head fire) were applied October 21-22, 2003. Uncut/unburned woodlands (CONTROL) were located adjacent to treated areas. Measurements: Sampling included measurement of cover and density of juniper, shrubs, and herbaceous species. Herbaceous species were also measured for biomass (2006) and diversity. Time Scale: One year of pre-treatment data (2002) and three years of post-treatment response (2004-2006). Results: Juniper Removal: The partial cut and burn treatments were all successful at removing remaining live western juniper trees. On the SNOWBERRY the fire killed 95-99% of remaining live trees and juniper cover was reduced by 99%. On the SAGE the fires killed 85-100% of the remaining live trees and juniper cover was reduced by 90-94%. Understory: Understory response did not differ among the various cutting levels and prescribed fire applications within each plant community type. In the SAGE community type, cover and density of perennial forbs, annual forbs, and total herbaceous were greater in the burned treatments than CONTROL. In 2006, biomass of perennial grasses, perennial forbs, annual forbs and total herbaceous were greater in the burned treatments compared to the CONTROL. Forb diversity increased by 30%. In the SNOWBERRY community type, cover and density of annual forbs and total herbaceous were greater in the burned treatments than CONTROLS. Biomass, density, and cover of perennial grasses and forbs did not differ among the treatments. Forb diversity increased by 10-22%. In both communities, perennial bunchgrass densities were moderately to severely reduced the first year after burning. However, by the third growing season (2006) after fire perennial grass densities were greater in the treated sites than the CONTROL as a result of large numbers of grass seedlings.

22
Weeds have slowly increased but are not expected to dominate either plant community type. Cheatgrass increased on the SAGE type; however, because of increased establishment of perennial grass seedlings cheatgrass is not expected to become dominant. Shrub cover and density has not differed among treatments for either community type. Sagebrush and bitterbrush remained present in the SAGE type but densities were reduced by burning. Conclusions: 1. The results indicated that cutting 25% of mature trees in communities dominated by western juniper (Phase III, juniper cover 40-70%) was sufficient to remove the majority of remaining live trees in stands with fall prescribed fire. Cutting more than 25% would be excessive when broadcast burning is applied with weather conditions typically encountered with fall prescribed fire. 2. For treating juniper on a large scale, cutting-prescribed fire combinations are a method of juniper control that should reduce treatment costs. 3. Burning was equally effective on slopes (SNOWBERRY and SAGE type 10-50% slopes) and on flat ground (SNOWBERRY type). 4. Hot spots such as around tree boles and under cut trees are expected to permit cheatgrass to remain locally dominant for several years on the SAGE type. However, the potential for plant community recovery is high because of the sites elevation and precipitation zone; and present herbaceous composition. Native perennial vegetation will dominate these burns in the future. 5. These treatments can be initially expected to stimulate perennial and/or annual forbs; perennial bunchgrasses will be moderately to severely reduced. 6. Current trajectories indicate that density, cover, and biomass of perennial grasses in the burn treatments are expected to surpass controls by the 4th/5th year of succession. Complete reestablishment will take longer. 7. Because of high mortality of perennial bunchgrasses in response to fire, grazing rest or deferrals will likely be necessary. Grazing management of burned areas should be flexible; with the overall objective of increasing perennial grass cover/densities to site potential. With or with out seeding, burned areas should probably be rested the first and second (possibly third growing season) year after fire to maximize bunchgrass seed crop and establishment. Deferring grazing until after seed shatter the 2nd-4th growing season could be considered. Based on the results here and in our other studies it will take longer than two years, possibly as many as 8 years, for bunch grasses to fully recover. Early season grazing (prior to grass boot stage) or deferring grazing until after seed shatter should probably be considered in later years after fire (years 3-8). 8. For management purposes it is most important to increase perennial grass cover/densities as this functional group has the most value at reducing erosion and minimizing weed invasion in Great Basin plant communities. 9. Until ground cover is reestablished (5-8 years) burned areas can experience significant runoff with moderate to heavy rain showers (equivalent to 2-5 year rainfall event). 10. To speed bunchgrass recovery after fire seeding should be considered and livestock grazing should be carefully managed. On both community types seeding trials were highly successful at speeding perennial bunchgrass response and reducing erosion (observation). 11. Crowning or canopy fires were maintained in some adjacent uncut woodlands with little understory. Cutting levels should be reduced in Snowberry woodlands (Phase III). Cutting 10-20% of the trees or strip cutting should be considered when fall burned. 12. Winter burning of cut trees should be considered to limit mortality of herbaceous perennials and speed recovery. Cutting would have to be at higher levels (60-80%) to kill enough trees to illicit an herbaceous/shrub response. Burning should be done when soil and ground litters are at field capacity and frozen (Nov.-March).
23
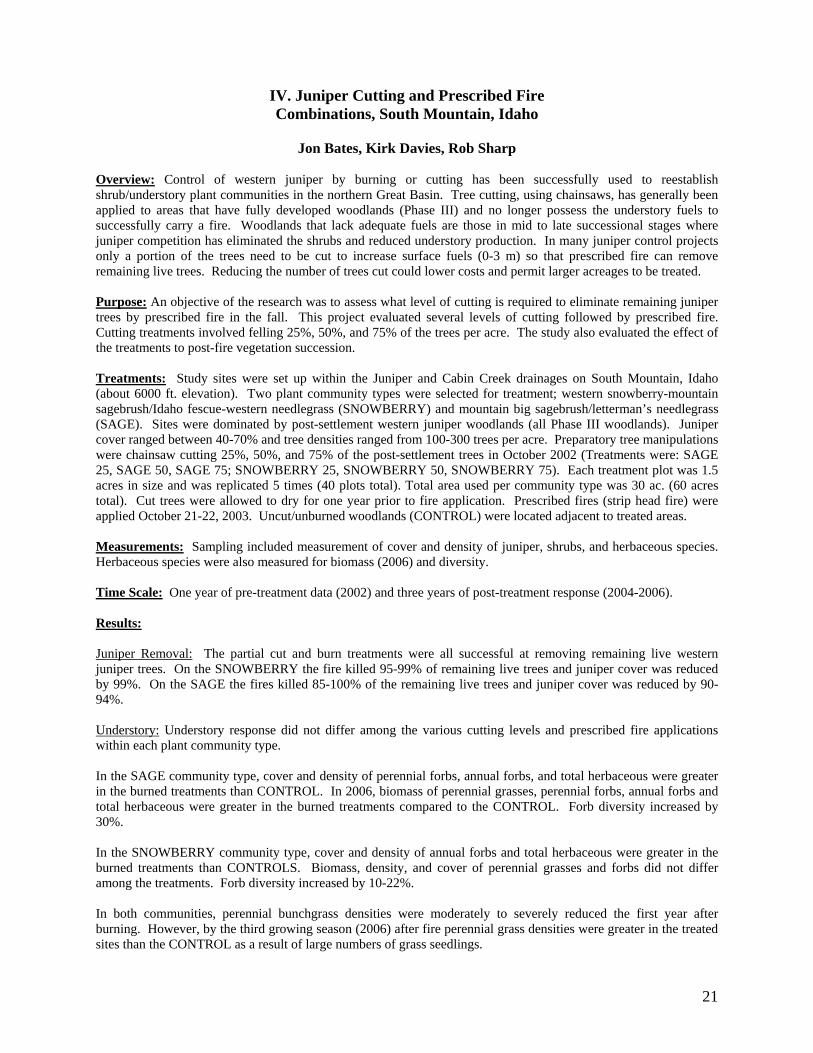
Photo set 1; Snowberry Type plant community. (A) Pre-burn plant community; (B) Post-burn community with high grass mortality and good forb response; (C) Post-burn community with good needlegrass and forb response (note hot spots where there was high accumulations of juniper litter or debris; and (D) Post-burn community with high grass mortality and forb response limited to mainly tailcup lupine.
Photo set 2. (A) Pre-burn plant community for Sagebrush Type; (B &C) Post-burn Dry Soil community with good columbia needlegrass, bluebunch wheatgrass, and perennial forb response (note hot spots where there were high accumulations of juniper litter or debris; and (D) Post-burn Dry Soil community with good perennial grass and native annual forb response.
B
D
A
C
A B
C D
24
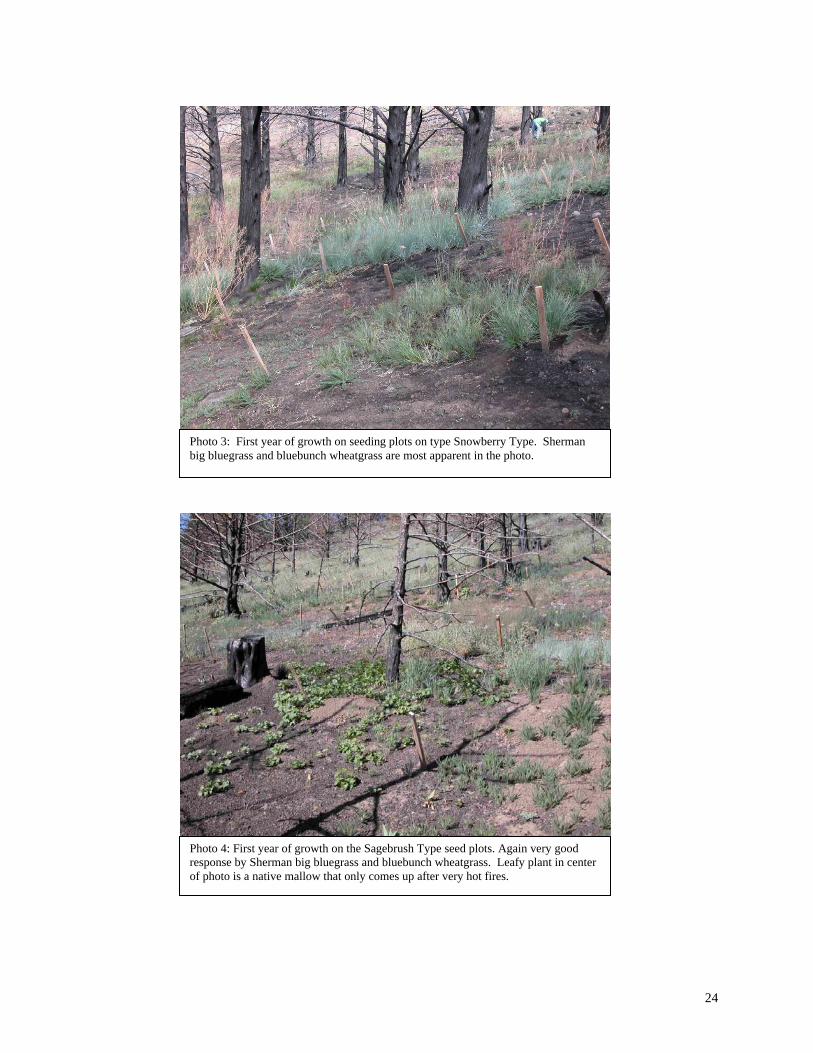
Photo 4: First year of growth on the Sagebrush Type seed plots. Again very good response by Sherman big bluegrass and bluebunch wheatgrass. Leafy plant in center of photo is a native mallow that only comes up after very hot fires.
Photo 3: First year of growth on seeding plots on type Snowberry Type. Sherman big bluegrass and bluebunch wheatgrass are most apparent in the photo.
25
IV South Mountain Juniper Control: 2002-2006.
A. Snowberry Sites
Stan
ding
cro
p (k
g ha
-1)
0
200
400
600
800
1000
1200
Snowberry Control Snowberry 25 Snowberry 50 Snowberry 75
a
b
bb
a
b bb
B. Mountain Sagebrush Sites
Fuctional GroupPG RPG Pobu Carex AG PF NPF AF Total
Sta
ndin
g cr
op (k
g ha
-1)
0
100
200
300
600
800
Sage Control Sagebrush 25 Sagebrush 50 Sagebrush 75
aa
a
ab
bbbbb
bb
b
b
bab
a a
ab b
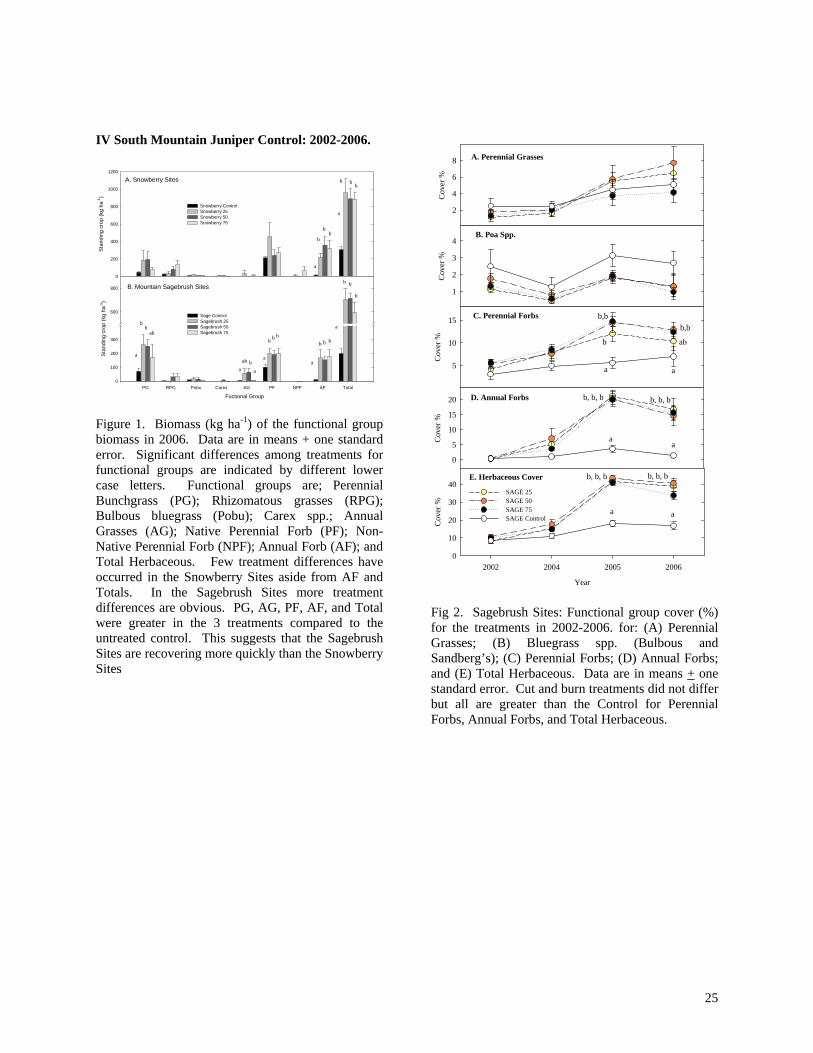
Figure 1. Biomass (kg ha-1) of the functional group biomass in 2006. Data are in means + one standard error. Significant differences among treatments for functional groups are indicated by different lower case letters. Functional groups are; Perennial Bunchgrass (PG); Rhizomatous grasses (RPG); Bulbous bluegrass (Pobu); Carex spp.; Annual Grasses (AG); Native Perennial Forb (PF); Non-Native Perennial Forb (NPF); Annual Forb (AF); and Total Herbaceous. Few treatment differences have occurred in the Snowberry Sites aside from AF and Totals. In the Sagebrush Sites more treatment differences are obvious. PG, AG, PF, AF, and Total were greater in the 3 treatments compared to the untreated control. This suggests that the Sagebrush Sites are recovering more quickly than the Snowberry Sites
A. Perennial Grasses
Cov
er %
2
4
6
8
B. Poa Spp.
Cov
er %
1
2
3
4
C. Perennial Forbs
Cov
er %
5
10
15
D. Annual Forbs
Cov
er %
0
5
10
15
20
E. Herbaceous Cover
Year
2002 2004 2005 2006
Cov
er %
0
10
20
30
40SAGE 25 SAGE 50 SAGE 75 SAGE Control
aa
b
a
b, b, b
b,bb,b
ab
b, b, b
a
b, b, b
a a
b, b, b
Fig 2. Sagebrush Sites: Functional group cover (%) for the treatments in 2002-2006. for: (A) Perennial Grasses; (B) Bluegrass spp. (Bulbous and Sandberg’s); (C) Perennial Forbs; (D) Annual Forbs; and (E) Total Herbaceous. Data are in means + one standard error. Cut and burn treatments did not differ but all are greater than the Control for Perennial Forbs, Annual Forbs, and Total Herbaceous.
26
Cont. IV. South Mountain Idaho, 2002-2006.
Sagebrush Sites
Cov
er (%
)
10
20
30
40
50
60
70
Cov
er (%
)
10
20
30
40
SAGE ControlSAGE 25 SAGE 50SAGE 75
YEAR
2002 2004 2005 2006
Cov
er (%
)
0
2
4
6
8
10
12
A. Bareground
B. Juniper Litter
C. Herbaceous Litter
a
b
a, a, a
b
a
a
aa
a, b
b
a, a, a
b
a
a, b
b
b
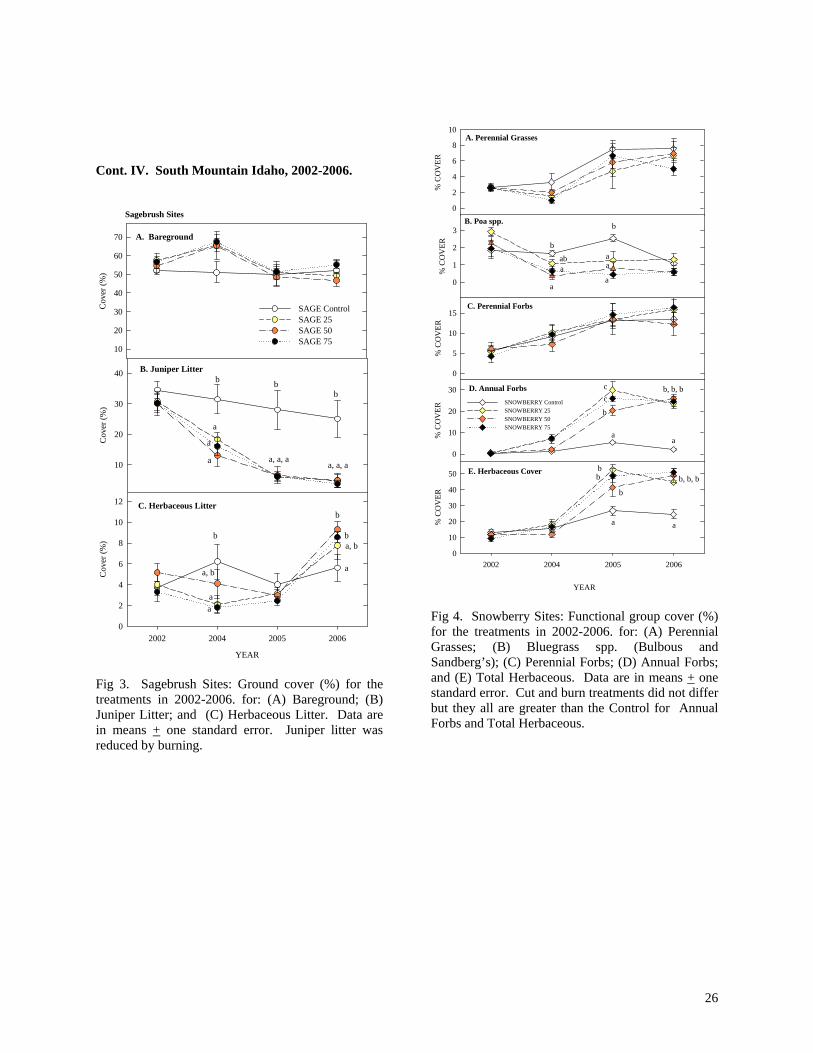
Fig 3. Sagebrush Sites: Ground cover (%) for the treatments in 2002-2006. for: (A) Bareground; (B) Juniper Litter; and (C) Herbaceous Litter. Data are in means + one standard error. Juniper litter was reduced by burning.
% C
OV
ER
0
5
10
15C. Perennial Forbs
% C
OV
ER
0
10
20
30SNOWBERRY ControlSNOWBERRY 25 SNOWBERRY 50SNOWBERRY 75
D. Annual Forbs
YEAR
2002 2004 2005 2006
% C
OV
ER
0
10
20
30
40
50 E. Herbaceous Cover
% C
OV
ER
0
2
4
6
8
10A. Perennial Grasses
% C
OV
ER
0
1
2
3B. Poa spp.
cc
b
a
b
b
b
a
b
a
aa
a
baba
a
a
b, b, b
b, b, b
Fig 4. Snowberry Sites: Functional group cover (%) for the treatments in 2002-2006. for: (A) Perennial Grasses; (B) Bluegrass spp. (Bulbous and Sandberg’s); (C) Perennial Forbs; (D) Annual Forbs; and (E) Total Herbaceous. Data are in means + one standard error. Cut and burn treatments did not differ but they all are greater than the Control for Annual Forbs and Total Herbaceous.
27
Snowberry Sites
Cov
er (%
)
15
30
45
60
75
Cov
er (%
)
15
30
45
60
75B. Juniper Litter
A. Bare ground & Rock
Cov
er (%
)
2
4
6
8
10
12
14
SNOWBERRY 25 SNOWBERRY 50 SNOWBERRY 75 SNOWBERRY Control
C. Herbaceous Litter
2002 2004 2005
a b
c
a
c
bc
bc
b
b
a, a, aa, a
a
b
b
a, aa
b
a, a, a
a
b
bb
a
b, b, b
2006 Year
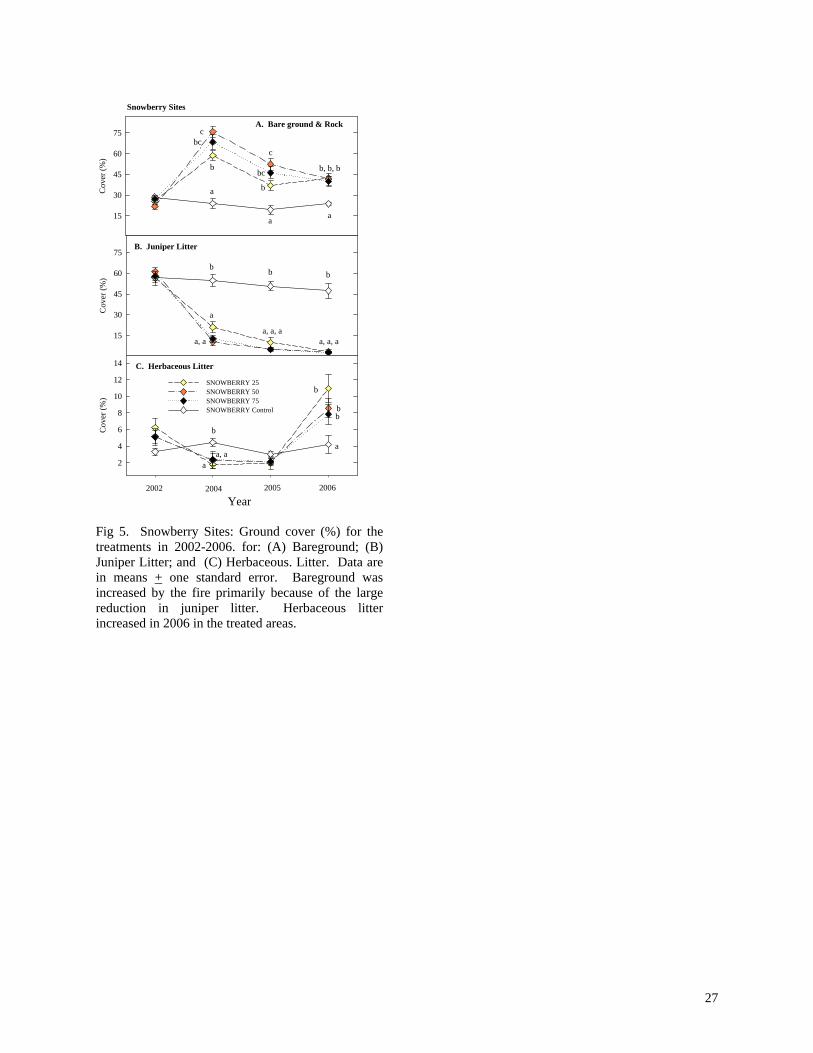
Fig 5. Snowberry Sites: Ground cover (%) for the treatments in 2002-2006. for: (A) Bareground; (B) Juniper Litter; and (C) Herbaceous. Litter. Data are in means + one standard error. Bareground was increased by the fire primarily because of the large reduction in juniper litter. Herbaceous litter increased in 2006 in the treated areas.
28
V. Long-term Plant Succession Following Western Juniper
29
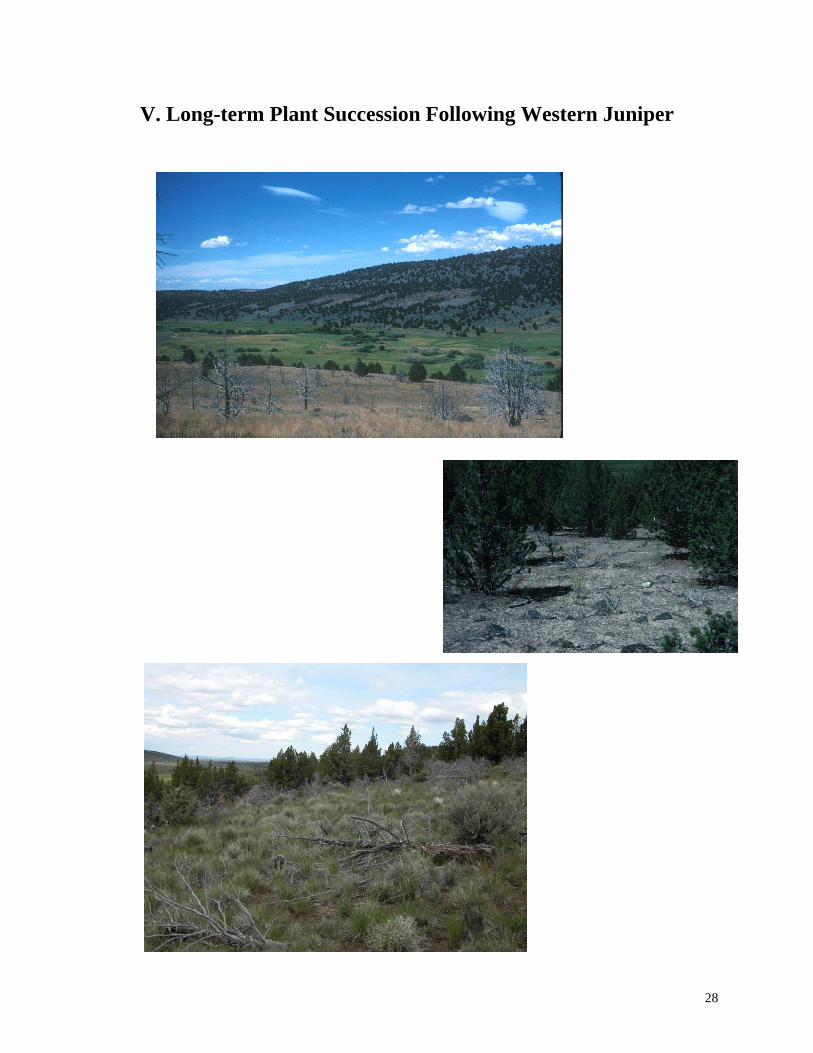
V. Long-term Plant Succession Following Western Juniper Cutting
Jon Bates, Rick Miller, and Tony Svejcar Purpose: The purpose of the research was to evaluate long-term vegetation succession after cutting juniper woodland. Treatments: The study site was located on Steens Mountain (1500 m (5000ft)) on a basin big sagebrush/ Thurber’s needlegrass-bluebunch wheatgrass association. Prior to cutting, juniper cover averaged 26% and mature juniper density averaged 250 trees ha-1 (about 110 trees ac-1). Understory cover was less than 5%, most of the sagebrush was dead, and because of high levels of bareground between trees sheet erosion and rill formation was evident. All mature juniper trees and saplings > 20 cm in height were cut down using chainsaws in August 1991. Felled trees were left in place were cut and left on eight, one-acre sized plots. Eight uncut woodland plots were located adjacent to each cut plot. Plots were not grazed during the study. Measurements: Measurement included canopy cover and density of juniper, shrubs, and herbaceous species; and biomass of herbaceous species. Shrub/understory response on the cut (CUT) treatment was compared to uncut woodland (WOODLAND). Time Scale: The study spans 15 years. One year pre-treatment and 10 years post-treatment measurements (1991-1997, 2003-2005). Results: Herbaceous Dynamics Cover was maximized after 3 years. Since 1994 total cover has been stable. Cover in the CUT was 4 to 5 times greater than the WOODLAND. Production/standing crop was maximized 6 years (1997) after cutting. Since 1994 total standing crop has been stable at about 1100 kg ha-1 (1000 lb ac-1). Standing crop in the CUT was 9-10 fold greater than the WOODLAND. The number of acres required per AUM was reduced from 33 to 4. Density of perennial grass reached maximum potential 6 years after cutting, from 2 plants to 9-12 plants m-2 (m-2 is about yd-2). Diversity was maximized the 2nd and 3rd year after cutting. Diversity has declined (fewer native forbs) since 1994 as perennial grasses became dominant. Phases of herbaceous succession Though total standing crop and cover in the CUT did not change after 1996, standing crop composition shifted through 3 phases; Phase 1; 1992-1995, in the early successional stages, perennial bunchgrasses and Sandberg’s bluegrass were dominant. Phase 2: 1996-2002, by the 5th year after treatment, cheatgrass had supplanted Sandberg’s bluegrass and co-dominated with perennial bunchgrasses. Phase 3: 2003-2005, perennial bunchgrasses dominated herbaceous cover and productivity in the CUT, representing nearly 90% of total herbaceous standing crop. Shrub and Juniper Dynamics: Sagebrush has slowly reestablished. Cover is less than 2% with potential for this site of 15-20%.

30
Presently, the density of young (1-20 years old) junipers is >240 tree ha-1 (100 trees acre-1). Conclusions: 1. Cutting of juniper woodlands is effective at increasing herbaceous standing crop, densities, and ground cover. 2. Pre-treatment densities of 2-3 m-2 (yd-2) perennial bunchgrasses were sufficient to permit natural recovery of the herbaceous component after juniper control without reseeding. 3. The decline of cheatgrass by 2003 resulted from a) less favorable seedbed/nutrient conditions as juniper litter was incorporated into the soil; and b) exposure increased and increased competition from established perennials. 4. Cheatgrass on this site and others we have monitored frequently take several years to increase significantly. Annual grasses are present in most woodlands below 6000 ft so it should not be unexpected to observe their increase following juniper control. 5. In areas without a significant perennial grass component (less than 1-2 plants yd-2), sites should be seeded prior to or immediately following juniper cutting. 6. Maximizing perennial bunchgrass cover will practically eliminate runoff and minimize soil erosion when normal to extreme precipitation events occur. 7. After cutting follow-up juniper control will be necessary to maintain herbaceous composition and permit continued reestablishment of shrubs. In this study, the present density of juniper is sufficient to dominate the site in about 50-60 years. 8. The results suggest that within the first 5 years following juniper control livestock grazing should be managed in order to promote recruitment and establishment of perennial grasses. 9. Because of low pre-treatment densities shrubs have been slow to respond and at present juniper cover is equivalent to shrub cover. The continued development of sagebrush will require the re-treatment of juniper. Juniper re-treatment options include prescribed fire, herbicides, and mechanical control. The method of re-treatment will determine how quickly a shrub-steppe community returns. While fire would effectively remove juniper, this method would also delay sagebrush establishment. If a management goal is to restore sagebrush, mechanical control or herbicide application to remove re-invading juniper would be recommended. 10. If maintaining grasslands for longer periods is desired, then fire is probably the appropriate management option for controlling the re-establishing of juniper. If the goal is to more quickly restore sagebrush, mechanical control or herbicide application to remove re-invading juniper would be recommended. 11. The results indicate that patience is required to permit development of desired changes in plant composition. Vegetation changes in aridland systems develop relatively slowly. To properly assess the affects of vegetation manipulations and disturbance in plant communities it require longer-term outlooks as evidenced by the stages of succession that occurred in this study. References: Bates J., T. Svejcar, and R. Miller. 2005. Long-term succession following western juniper cutting. Range Ecology and Management 58:533-541. Bates J., R.F. Miller, and T.S. Svejcar. 2000. Understory dynamics in cut and uncut western juniper woodlands. Journal of Range Management 53:119-126.
31
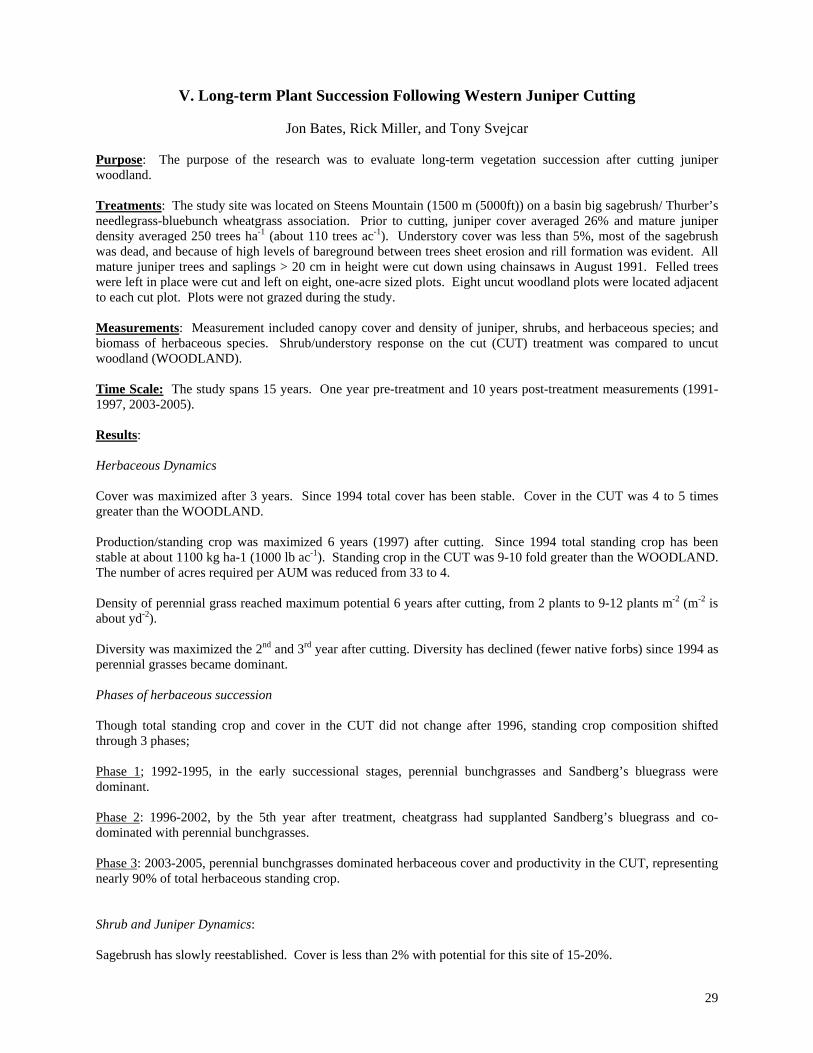
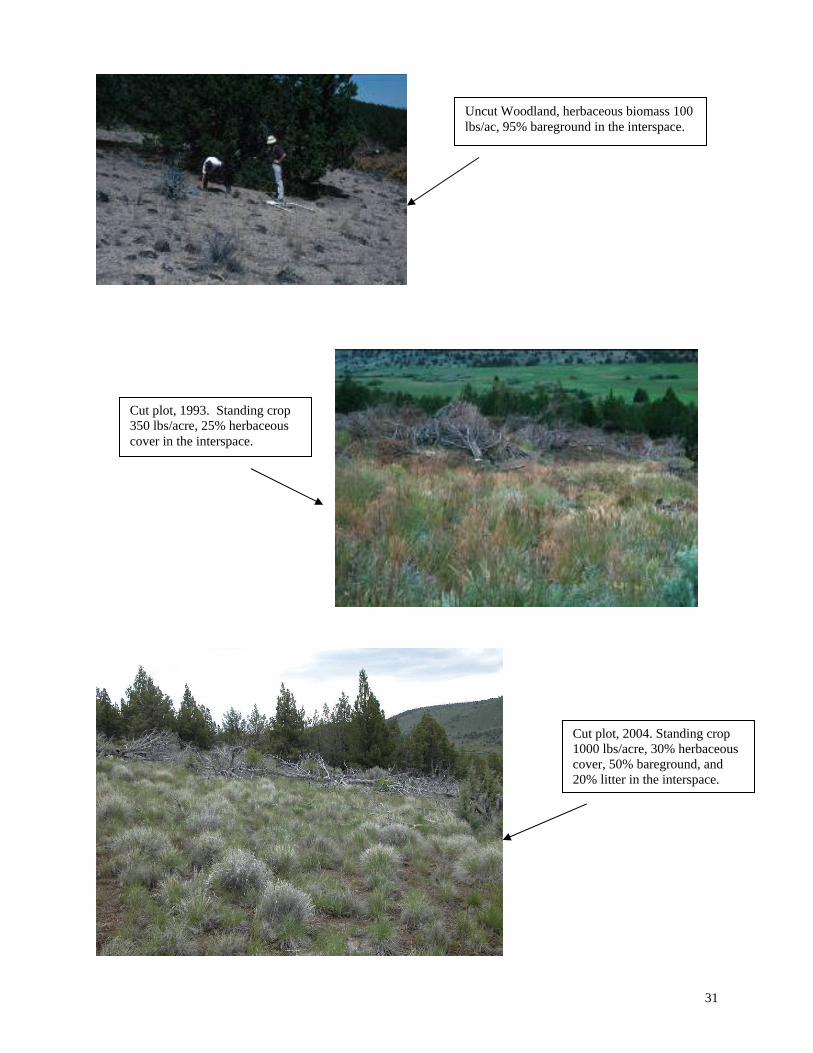
Uncut Woodland, herbaceous biomass 100 lbs/ac, 95% bareground in the interspace.
Cut plot, 1993. Standing crop 350 lbs/acre, 25% herbaceous cover in the interspace.
Cut plot, 2004. Standing crop 1000 lbs/acre, 30% herbaceous cover, 50% bareground, and 20% litter in the interspace.
32
V. Long-term Response to Juniper Cutting: Otley Ranch, Steens Mountain, Oregon, 1991-2004.
1992 1993 1996 1997 2003 2004
Stan
ding
Cro
p (k
g ha
-1)
0
100
200
300
400
600
800
1000
1200CUTWOODLAND
a
d
b
c
abb
b b b
d d d
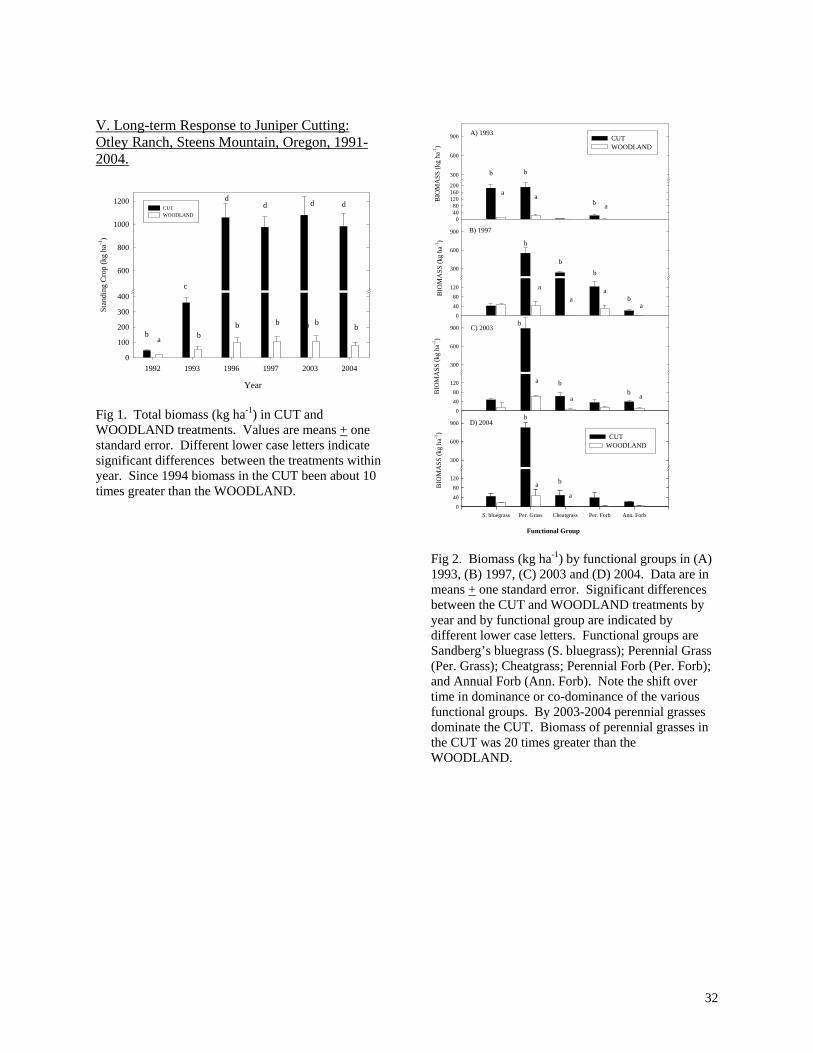
Year Fig 1. Total biomass (kg ha-1) in CUT and WOODLAND treatments. Values are means + one standard error. Different lower case letters indicate significant differences between the treatments within year. Since 1994 biomass in the CUT been about 10 times greater than the WOODLAND.
04080
120160200
300
600
900 CUT WOODLAND
BIO
MA
SS (k
g ha
-1)
0
4080
120
300
600
900 B) 1997
A) 1993
B) 2003
04080
120
300
600
900 C) 2003b
a
bb
a a
a
a
aa
bb
b
b
bb
b
a
aa
S. bluegrass Per. Grass Cheatgrass Per. Forb Ann. Forb0
40
80
120
300
600
900b
a b
a
D) 2004
BIO
MA
SS (k
g ha
-1)
BIO
MA
SS (k
g ha
-1)
BIO
MA
SS (k
g ha
-1) CUT
WOODLAND
Functional Group Fig 2. Biomass (kg ha-1) by functional groups in (A) 1993, (B) 1997, (C) 2003 and (D) 2004. Data are in means + one standard error. Significant differences between the CUT and WOODLAND treatments by year and by functional group are indicated by different lower case letters. Functional groups are Sandberg’s bluegrass (S. bluegrass); Perennial Grass (Per. Grass); Cheatgrass; Perennial Forb (Per. Forb); and Annual Forb (Ann. Forb). Note the shift over time in dominance or co-dominance of the various functional groups. By 2003-2004 perennial grasses dominate the CUT. Biomass of perennial grasses in the CUT was 20 times greater than the WOODLAND.
33
Plan
ts m
-2
2
4
6
8
10
12
14
YEAR
1991 1992 1993 1994 1995 1996 1997 2003 2004
Plan
ts m
-2
1
2
3
4
5 CUTWOODLAND
D) Perennial Forbs
a
b
Plan
ts m
-2
4
6
8
10
12 C) Sandberg's bluegrass
A) Perennial Grasses
b
b b bbbb
aa
a
a
a aa
Plan
ts m
-2
0255075
100
400
600
bb b b
B) Cheatgrass
b
a
a
a
a a
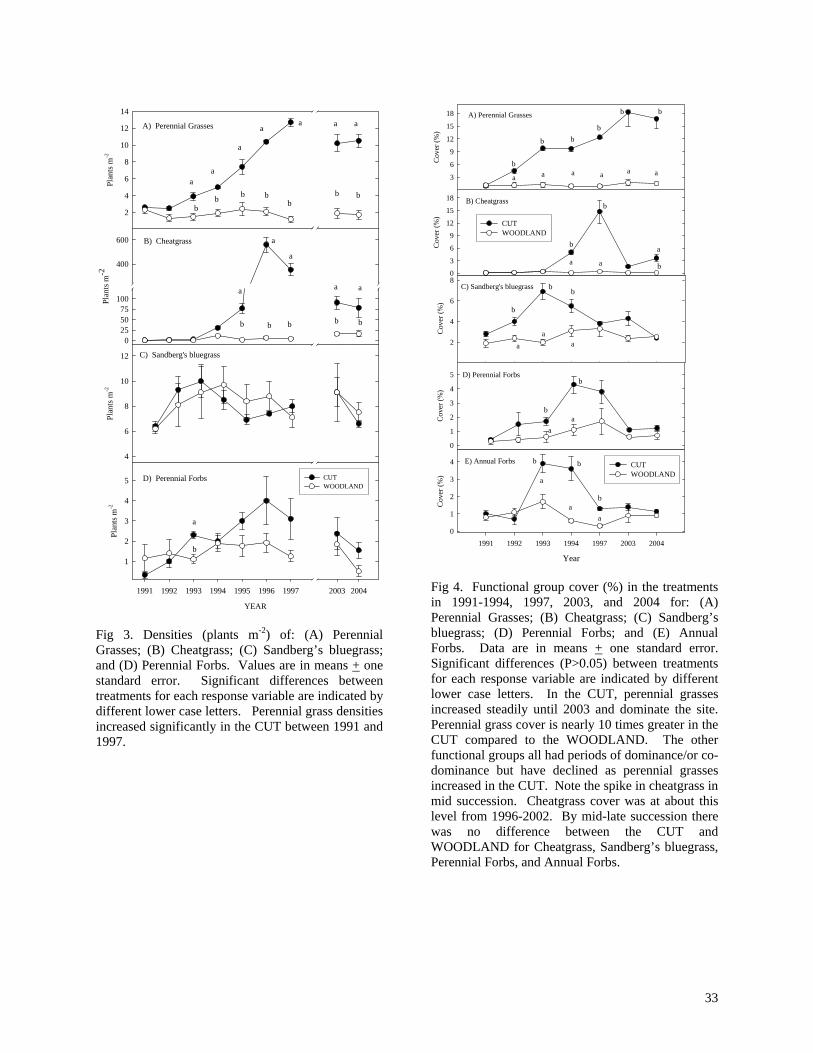
Fig 3. Densities (plants m-2) of: (A) Perennial Grasses; (B) Cheatgrass; (C) Sandberg’s bluegrass; and (D) Perennial Forbs. Values are in means + one standard error. Significant differences between treatments for each response variable are indicated by different lower case letters. Perennial grass densities increased significantly in the CUT between 1991 and 1997.
Cov
er (%
)
2
4
6
8
Cov
er (%
)
3
6
9
12
15
18
Cov
er (%
)
0
3
6
9
12
15
18
a a a a a ab
b
b bb
b
b
b
ba a
a
Cov
er (%
)0
1
2
3
4
5 D) Perennial Forbs
B) Cheatgrass
A) Perennial Grasses
C) Sandberg's bluegrass
b
aa
b
b
b
b
aa
a
Year
1991 1992 1993 1994 1997 2003 2004
Cov
er (%
)
0
1
2
3
4 CUTWOODLAND
b
a
a
bE) Annual Forbs
a
b
CUTWOODLAND
Fig 4. Functional group cover (%) in the treatments in 1991-1994, 1997, 2003, and 2004 for: (A) Perennial Grasses; (B) Cheatgrass; (C) Sandberg’s bluegrass; (D) Perennial Forbs; and (E) Annual Forbs. Data are in means + one standard error. Significant differences (P>0.05) between treatments for each response variable are indicated by different lower case letters. In the CUT, perennial grasses increased steadily until 2003 and dominate the site. Perennial grass cover is nearly 10 times greater in the CUT compared to the WOODLAND. The other functional groups all had periods of dominance/or co-dominance but have declined as perennial grasses increased in the CUT. Note the spike in cheatgrass in mid succession. Cheatgrass cover was at about this level from 1996-2002. By mid-late succession there was no difference between the CUT and WOODLAND for Cheatgrass, Sandberg’s bluegrass, Perennial Forbs, and Annual Forbs.
34
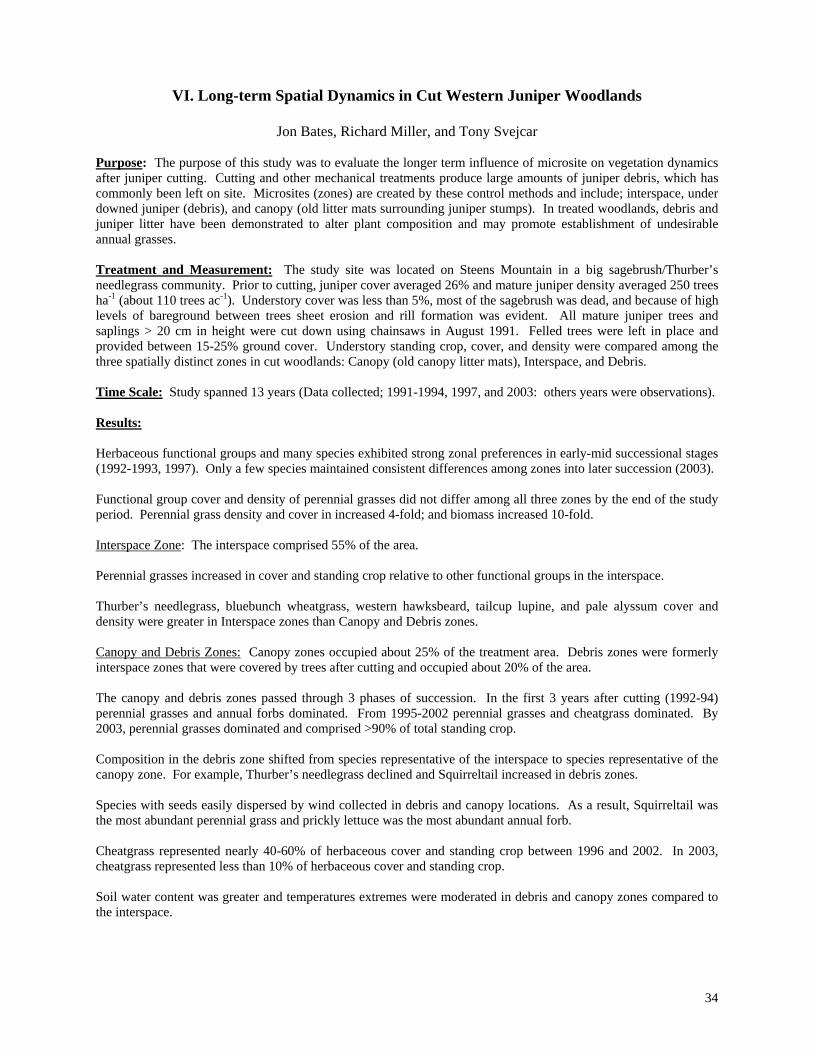
VI. Long-term Spatial Dynamics in Cut Western Juniper Woodlands
Jon Bates, Richard Miller, and Tony Svejcar Purpose: The purpose of this study was to evaluate the longer term influence of microsite on vegetation dynamics after juniper cutting. Cutting and other mechanical treatments produce large amounts of juniper debris, which has commonly been left on site. Microsites (zones) are created by these control methods and include; interspace, under downed juniper (debris), and canopy (old litter mats surrounding juniper stumps). In treated woodlands, debris and juniper litter have been demonstrated to alter plant composition and may promote establishment of undesirable annual grasses. Treatment and Measurement: The study site was located on Steens Mountain in a big sagebrush/Thurber’s needlegrass community. Prior to cutting, juniper cover averaged 26% and mature juniper density averaged 250 trees ha-1 (about 110 trees ac-1). Understory cover was less than 5%, most of the sagebrush was dead, and because of high levels of bareground between trees sheet erosion and rill formation was evident. All mature juniper trees and saplings > 20 cm in height were cut down using chainsaws in August 1991. Felled trees were left in place and provided between 15-25% ground cover. Understory standing crop, cover, and density were compared among the three spatially distinct zones in cut woodlands: Canopy (old canopy litter mats), Interspace, and Debris. Time Scale: Study spanned 13 years (Data collected; 1991-1994, 1997, and 2003: others years were observations). Results: Herbaceous functional groups and many species exhibited strong zonal preferences in early-mid successional stages (1992-1993, 1997). Only a few species maintained consistent differences among zones into later succession (2003). Functional group cover and density of perennial grasses did not differ among all three zones by the end of the study period. Perennial grass density and cover in increased 4-fold; and biomass increased 10-fold. Interspace Zone: The interspace comprised 55% of the area. Perennial grasses increased in cover and standing crop relative to other functional groups in the interspace. Thurber’s needlegrass, bluebunch wheatgrass, western hawksbeard, tailcup lupine, and pale alyssum cover and density were greater in Interspace zones than Canopy and Debris zones. Canopy and Debris Zones: Canopy zones occupied about 25% of the treatment area. Debris zones were formerly interspace zones that were covered by trees after cutting and occupied about 20% of the area. The canopy and debris zones passed through 3 phases of succession. In the first 3 years after cutting (1992-94) perennial grasses and annual forbs dominated. From 1995-2002 perennial grasses and cheatgrass dominated. By 2003, perennial grasses dominated and comprised >90% of total standing crop. Composition in the debris zone shifted from species representative of the interspace to species representative of the canopy zone. For example, Thurber’s needlegrass declined and Squirreltail increased in debris zones. Species with seeds easily dispersed by wind collected in debris and canopy locations. As a result, Squirreltail was the most abundant perennial grass and prickly lettuce was the most abundant annual forb. Cheatgrass represented nearly 40-60% of herbaceous cover and standing crop between 1996 and 2002. In 2003, cheatgrass represented less than 10% of herbaceous cover and standing crop. Soil water content was greater and temperatures extremes were moderated in debris and canopy zones compared to the interspace.

35
Conclusions: 1. Except for Squirreltail we found that retaining juniper debris on site did not benefit establishment and growth of perennial grasses when compared to interspace and canopy zones. 2. Debris and litter were favorable to establishment and growth of Squirreltail and appear to be detrimental to other perennial grasses. Squirreltail increased while Thurber’s needlegrass and Junegrass decreased under debris and in canopy zones. Squirreltail comprised greater than 80% of perennial grass cover in the canopy and debris zones. 3. The interspace (55% of the area), in terms of native plant composition, recovered nearly three times more rapidly than debris and canopy zones (45% of the area). The interspace was dominated by Thurber’s needlegrass and bluebunch wheatgrass. 4. Cheatgrass preferred areas of litter accumulation. Establishment was likely enhanced by more moderate microclimate conditions, higher nutrient availability, and/or greater soils water content. 5. Cheatgrass presence remains a concern in many western juniper woodlands as it has shown the potential to increase rapidly and dominate following juniper control, particularly in areas with mesic soil temperature regimes. 6. The results suggest that managers need to recognize that cutting of western juniper woodlands, while substantially increasing cover and production of herbaceous species has the potential to create zones that are favorable to establishment and growth of weedy species. 7. Eliminating cheatgrass from these communities is not practical. Our results suggest that designing treatments that alter or take away preferred establishment sites could reduce cheatgrass influence. To reduce the likelihood of cheatgrass development into some woodland communities, areas of litter deposition might be the focus of additional management, as these areas can represent sizable portions of treated areas. By targeting establishment sites for weeds it may be possible to direct successional trajectories so that desired outcomes are achieved. 8. However, the results also indicate that patience is required to permit development of desired changes in plant composition. Vegetation changes in aridland systems develop slowly. To properly assess the affects of vegetation manipulations and disturbance in plant communities may require longer-term outlooks. For example, it was not until the 13 years of the study that cheatgrass was largely replaced by Squirreltail in debris and canopy zones. 9. A pre-treatment density of 2-3 perennial bunchgrasses m-2 (about 1 yd-2) was sufficient to permit natural recovery of sites after juniper control. Perennial bunchgrass density peaked in the 6th year after treatment and the results suggested that 10-12 plants m-2 were sufficient to fully occupy the site and dominate herbaceous composition in late succession.
__________________________________________________ References; Early succession period: Bates J.D., R. Miller, and T Svejcar. 1998. Understory patterns in cut western juniper woodlands. Great Basin Naturalist 58(4):363-374. Late succession period: Bates J.D., R. Miller, and T. Svejcar. Long-term zonal vegetation dynamics in a cut western juniper woodland. Currently in review with Western North American Naturalist.
36
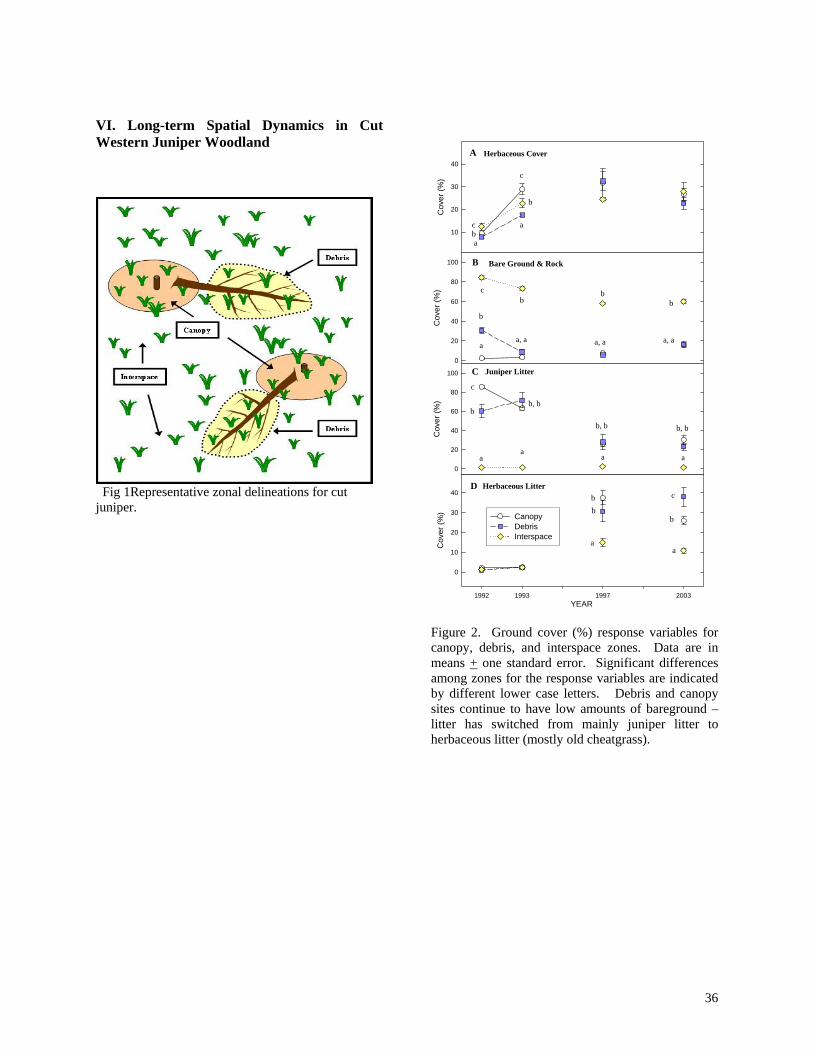
VI. Long-term Spatial Dynamics in Cut Western Juniper Woodland
Fig 1Representative zonal delineations for cut juniper.
Cov
er (%
)
10
20
30
40
Cov
er (%
)
0
20
40
60
80
100
A Herbaceous Cover
B Bare Ground & Rock
Cov
er (%
)
0
20
40
60
80
100
YEAR1992 1993 1997 2003
Cov
er (%
)
0
10
20
30
40
Canopy Debris Interspace
C
D
Juniper Litter
Herbaceous Litter
aa
aa
a
b
c
b
b
b
c
a
c
c
c
a
b, b b, b
b, b
a
a
a, a a, a a, a
b
bb
b
b
b
Figure 2. Ground cover (%) response variables for canopy, debris, and interspace zones. Data are in means + one standard error. Significant differences among zones for the response variables are indicated by different lower case letters. Debris and canopy sites continue to have low amounts of bareground – litter has switched from mainly juniper litter to herbaceous litter (mostly old cheatgrass).
37
Biom
ass (
kg h
a-1)
0
100
200
600
900
1200
1500
1800
2100 Canopy Debris Interspace
aa
b
aaa
c
a
b
b
b
b
A) 1997
Functional Group
Posa PG AG PF AF Total
Bio
mas
s (kg
ha-1
)
0
100
200
600
900
1200
1500
1800
2100 B) 2003
b
aab
a ab
b ba
bab
a
Cov
er (%
)
02468
1012 A Sandberg's bluegrass
Cov
er (%
)
0
2
4Perennial Forbs
1992 1993 1997 2003
Cov
er (%
)
0
3
6 Canopy Debris Interspace
Cov
er (%
)
048
12162024
YEAR
Cov
er (%
)
0
4
8
12
16
20
D
Perennial Grass
Cheatgrass
B
C
Annual ForbsE
aa
b
b
b
a, a a, a
a, a
b, b
bb
b, b
b
a, a
a, a
bb
a, a
b, b
a
a
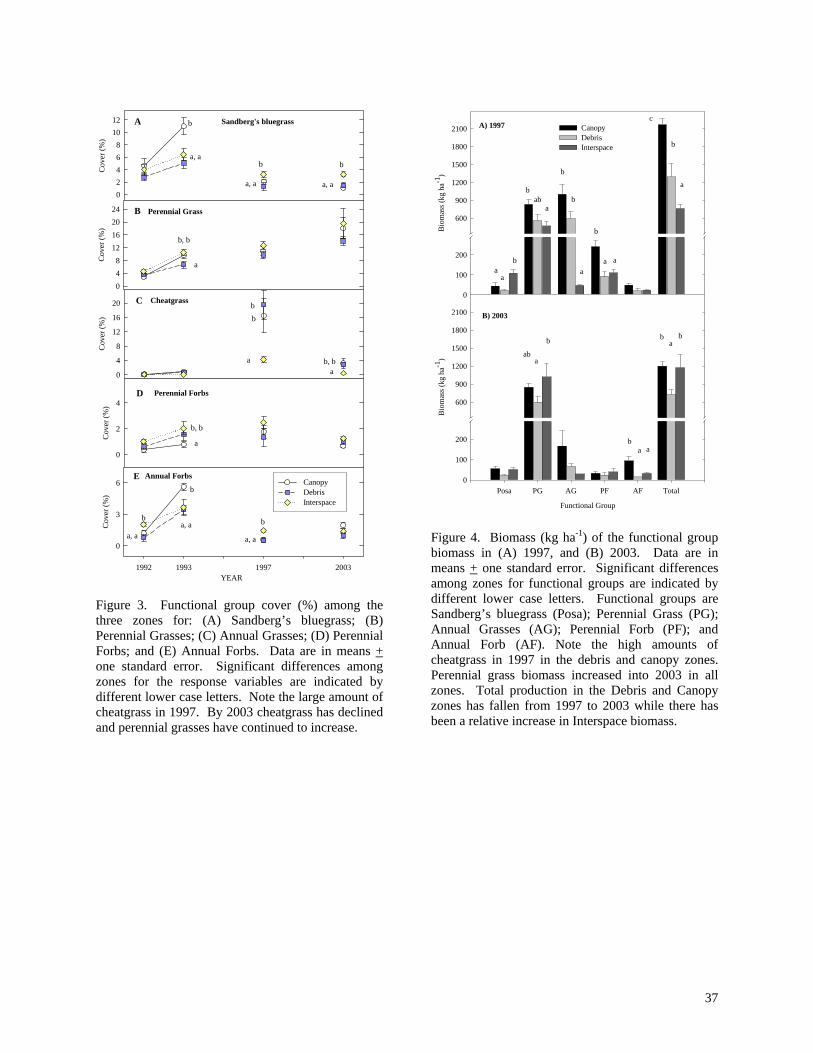
Figure 3. Functional group cover (%) among the three zones for: (A) Sandberg’s bluegrass; (B) Perennial Grasses; (C) Annual Grasses; (D) Perennial Forbs; and (E) Annual Forbs. Data are in means + one standard error. Significant differences among zones for the response variables are indicated by different lower case letters. Note the large amount of cheatgrass in 1997. By 2003 cheatgrass has declined and perennial grasses have continued to increase.
Figure 4. Biomass (kg ha-1) of the functional group biomass in (A) 1997, and (B) 2003. Data are in means + one standard error. Significant differences among zones for functional groups are indicated by different lower case letters. Functional groups are Sandberg’s bluegrass (Posa); Perennial Grass (PG); Annual Grasses (AG); Perennial Forb (PF); and Annual Forb (AF). Note the high amounts of cheatgrass in 1997 in the debris and canopy zones. Perennial grass biomass increased into 2003 in all zones. Total production in the Debris and Canopy zones has fallen from 1997 to 2003 while there has been a relative increase in Interspace biomass.
38
YEAR
1992 1993 1997 2003
Plan
ts m
-2
0
2
4
6
8
Canopy Debris Interspace
B. Cover
YEAR
1992 1993 1997 2003
Cov
er (%
)
0
2
4
6
8
10
Thurber's needlegrass
A. Density
YEAR
1992 1993 1997 2003
Plan
ts m
-2
0
2
4
6
8
10
12
14
Canopy Debris Interspace
D. Cover
YEAR
1992 1993 1997 2003
Cov
er (%
)
0
5
10
15
Squirreltail
C. Density
a
b
a
aa aa
bb b
ab
cc
a
ab
aba
aaa
a
b
b
b
c
c
abab
aa
a
a
bb
b
c
c
abb
a
b
a
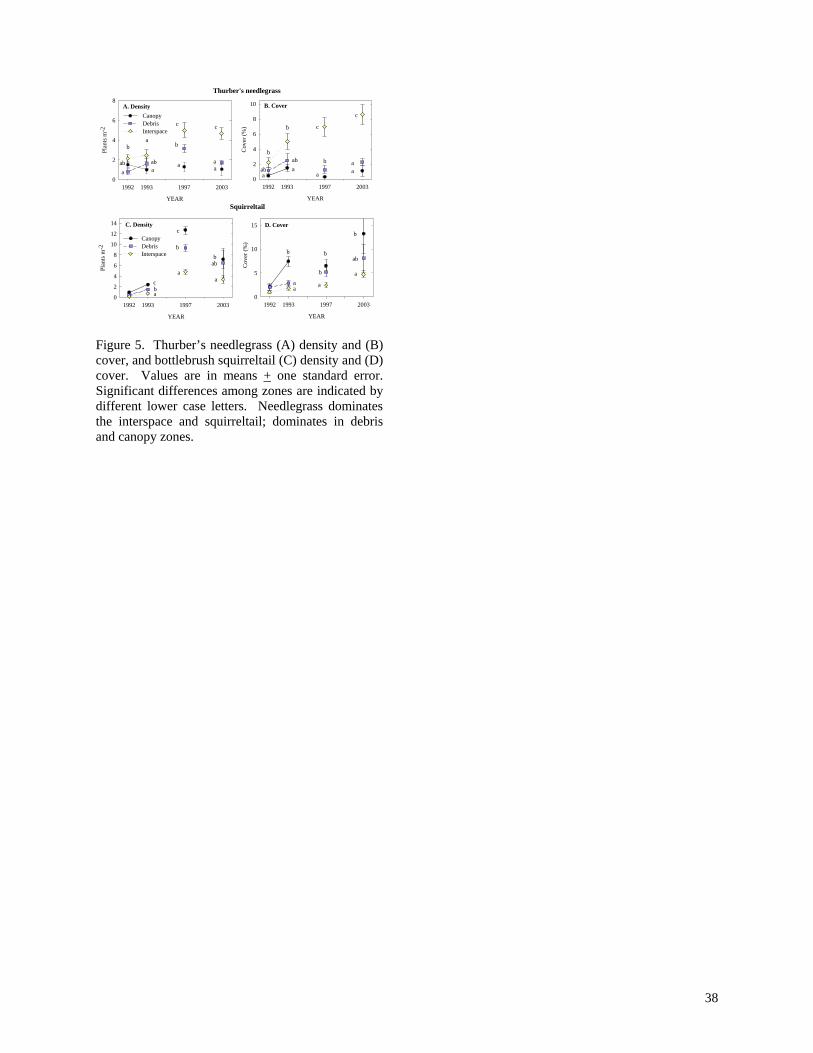
Figure 5. Thurber’s needlegrass (A) density and (B) cover, and bottlebrush squirreltail (C) density and (D) cover. Values are in means + one standard error. Significant differences among zones are indicated by different lower case letters. Needlegrass dominates the interspace and squirreltail; dominates in debris and canopy zones.
39
VII. Debris Burning
40
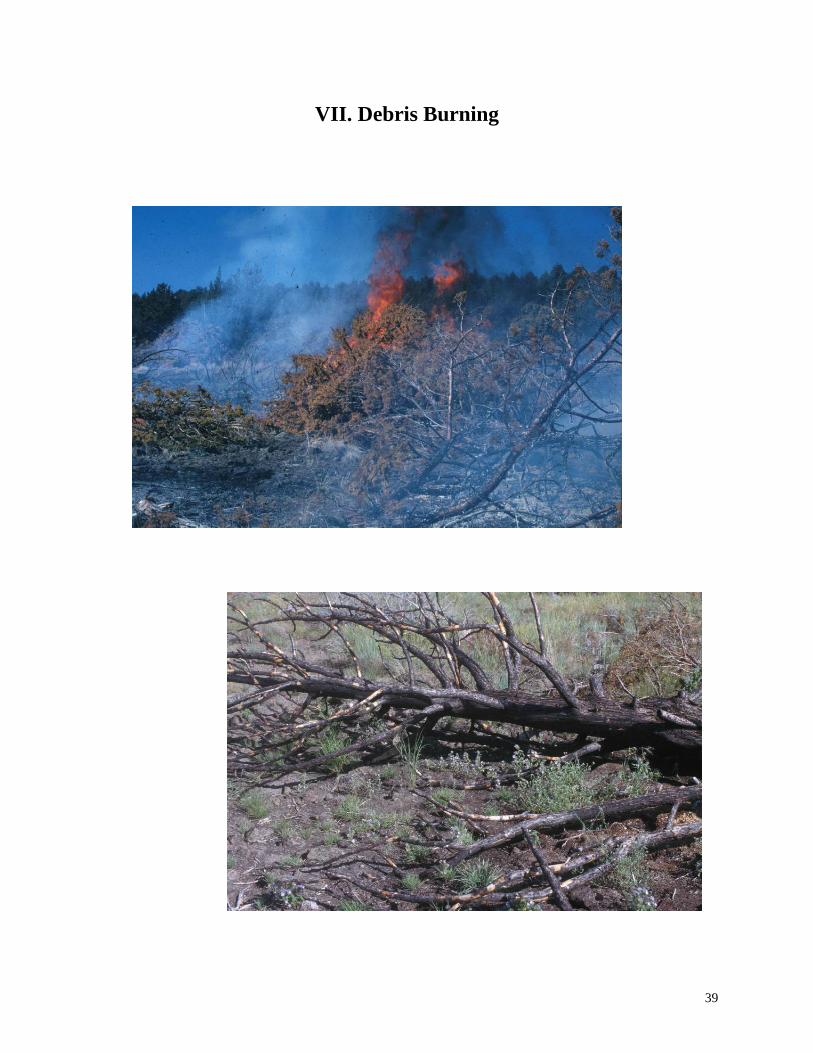
VII. Herbaceous Response to Burning of Western Juniper Debris
Jon D. Bates and Tony J. Svejcar Overview: Mechanical cutting has one of the main methods used to remove western juniper. Cutting treatments have commonly prescribed leaving cut juniper on the ground. A major disadvantage to leaving cut trees is the increased fuel hazard, particularly in the first 2-3 year post treatment when needles remain suspended on downed trees. Juniper debris may also create ideal microsites for invasion by undesirable non-native annual grasses and slow recovery of desired perennial species. Recently, efforts have now shifted to remove juniper debris by burning in the late fall and winter to reduce the potential fire hazards. Purpose: The purpose of this study was to evaluate long term recovery of herbaceous vegetation after juniper debris burning. Vegetation response was compared among two winter debris burning treatments, a cut and unburned juniper treatment, and the interspace. Juniper debris was burned in the winter or early spring when soils and ground litter were frozen and/or at field capacity to minimize the impacts of fire to perennial herbaceous vegetation. We hypothesized that burning under the described winter conditions would cause little measurable mortality to existing herbaceous perennials and would reduce the potential for annual grasses to establish. Treatments & Measurements: Vegetation response was compared among two winter burning treatments; burning the first winter after cutting (First-year) and burning the second winter after cutting (Second-year), cut and unburned juniper (Unburned), and interspace. Understory standing crop, cover, and density were compared among treatments. Location: The study site was on Steens Mountain in southeast Oregon. Elevation at the site is 1575 m and aspect is west facing with a 10% slope. The site was dominated by post-settlement western juniper woodland. Juniper canopy cover averaged 30.5% and tree density averaged 283 trees/ha. Shrubs were eliminated from the site. Herbaceous cover averaged 5.5 %. Bare ground and rock in the interspace was about 95%. Common species were Sandberg’s bluegrass, bottlebrush squirreltail, bluebunch wheatgrass, Thurber's needlegrass, basalt milkvetch, and pale alyssum. Cheatgrass was present across the site (<1% cover) but has demonstrated the potential to increase exponentially 3-5 years after juniper cutting. Time Scale: Study spanned 10 years (1997-2001, 2006). Burn Criteria: The criteria for burning were that: 1) soils and juniper needle litter contacting the ground surface were wet (saturated) and ideally frozen, and 2) that suspended juniper litter be relatively dry. Results: Burn Severity: Consumption of ground litter was light in both burn treatments. Above ground consumption of juniper debris removed all material up to a 10-hr fuels category. We rated the fire as having no impact to the understory as there was no obvious increase in mortality when compared to unburned debris. Vegetation: Smothering by unburned juniper debris had about the same effect as debris burning to perennial grasses the first year after cutting. Large perennial bunchgrasses and Sandberg bluegrass were reduced equally in density in the burned and unburned treatments. By 2006, perennial bunchgrasses had recovered more quickly in both debris burning treatments compared to the Unburned Debris. Perennial grass cover was 2.5 times greater in the First-Year and Second-Year Burns (and Interspace) than the Unburned Debris. Perennial grass density was 1.5 times greater in the First-Year and Second-Year Burns than the Unburned Debris. Perennial grass density did not differ between Debris and Interspace zones. Debris burning stimulated increases in bluebunch wheatgrass compared to the Unburned treatment. Thurber’s needlegrass increased in the First-year burn treatment and the Interspace. Squirreltail increased in the Second-year burn and Unburned debris treatments.

41
Cheatgrass increased similarly among treatments the first 4 growing seasons. By 2006, cheatgrass cover and density were 2-3 times greater in the Unburned treatment than both debris burning treatments and the Interspace. Perennial and annual forb responses were generally more favorable in the interspace and burned debris treatments compared to the unburned treatment. These effects were transient occurring within the first year our two after cutting and fire applications. Conclusions: 1. Debris burning in winter using our criteria was effective at removing above ground light fuels (juniper needles and 1 hr fuels) but left heavier fuels and much of the light litter contacting the ground. This treatment will reduce but not eliminate juniper fuels. 2. The burn prescriptions had no negative impacts to herbaceous species when compared to unburned juniper debris. 3. There were several positive outcomes as a result of the winter debris burning;
A. A more rapid recovery of perennial grass cover and density compared to no burning. Unburned debris did not enhance establishment of perennial grasses (density and cover were lower than burned debris treatments).
B. Burning debris decreased non-native forbs and increased native forbs the first 2-3 years after treatment. C. Burning debris resulted in reduced cheatgrass presence after 10 years. Without burning, cheatgrass continues to dominate the debris zone which makes up about 20% of the area.
4. Delaying debris burning through one growing season appears to alter successional trajectories. In this study, perennial grass composition in the First-year burn was similar to the Interspace and was dominated by Thurber’s needlegrass. In the second-year burn, perennial grass composition was similar to the Unburned debris, being primarily composed of bottlebrush squirreltail. This may have resulted from the longer smothering period in the Second-year burn and/or increased dispersal and establishment of squirreltail prior to debris burning. 5. We expect that cheatgrass in the unburned areas will decline overtime as was the case in an earlier section of this report (see section V). Perennial grass densities (8-10 yd-2) beneath unburned debris are presently sufficient to out-compete cheatgrass once these plants grow larger. 6. To minimize negative impacts of fire to herbaceous plants under juniper debris, soils and juniper needle litter contacting ground should be wet (field capacity) and preferably frozen. Juniper needle litter contacting the ground was above 100% water content when burned in this study. Surface soil temperatures rarely exceed 200 C. 7. Our other work has shown that burning when soils are dry and ground litter water content is minimal will result in a near 100% loss of herbaceous perennials, especially bunchgrasses. Surface soil temperatures in these burns exceeded 870 C. 8. If faster perennial recovery is desired then it appears that winter burning of juniper debris under the described conditions will accomplish this objective.
_____________________________________________________ References: Paper in preparation, some preliminary results are mentioned in; Miller, R.F., J.D. Bates, T.J. Svejcar, F. B. Pierson, and L.E. Eddleman. 2005. Biology, Ecology, and Management of Western Juniper. Oregon State University Agricultural Experiment Station, Technical Bulletin 152, June 2005. Corvallis. 77 p.
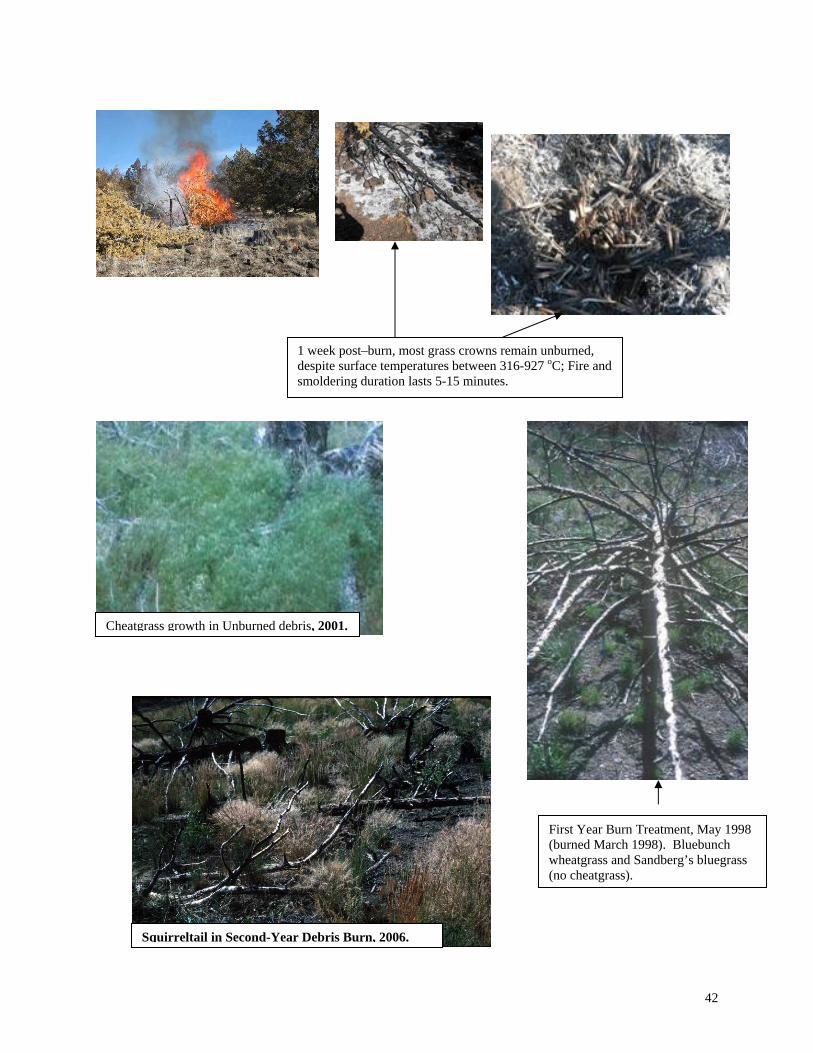
42
1 week post–burn, most grass crowns remain unburned, despite surface temperatures between 316-927 oC; Fire and smoldering duration lasts 5-15 minutes.
Squirreltail in Second-Year Debris Burn, 2006.
Cheatgrass growth in Unburned debris, 2001.
First Year Burn Treatment, May 1998 (burned March 1998). Bluebunch wheatgrass and Sandberg’s bluegrass (no cheatgrass).
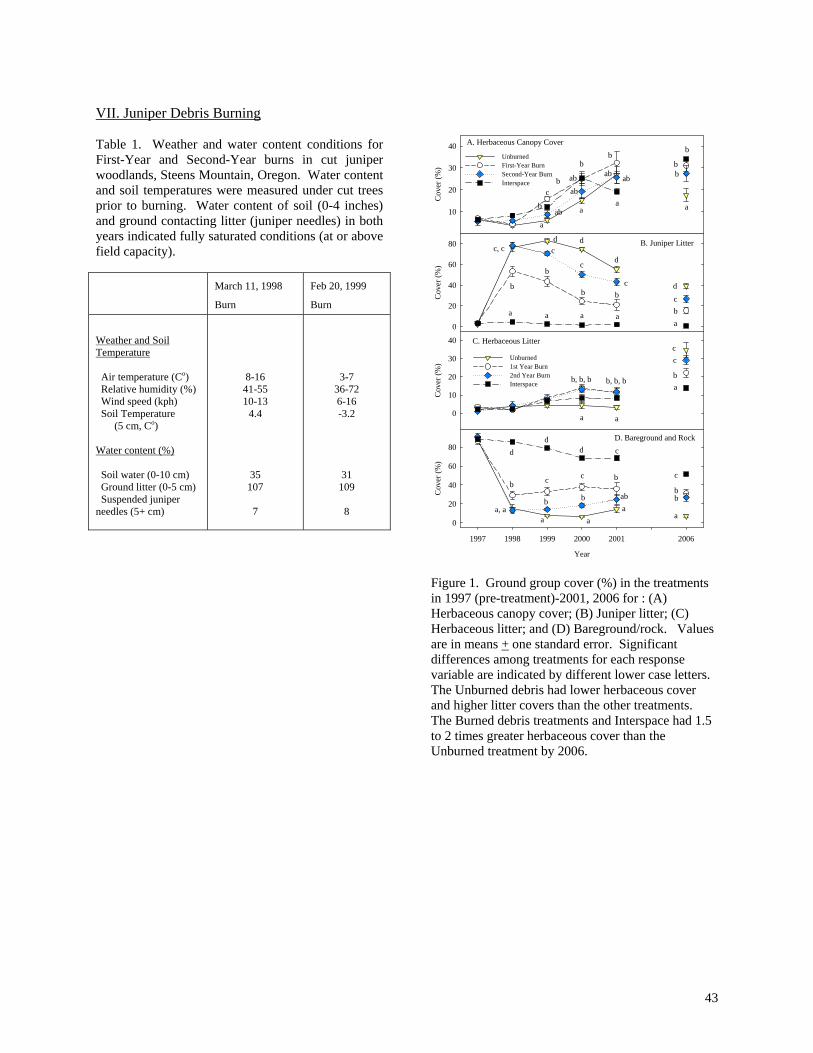
43
VII. Juniper Debris Burning Table 1. Weather and water content conditions for First-Year and Second-Year burns in cut juniper woodlands, Steens Mountain, Oregon. Water content and soil temperatures were measured under cut trees prior to burning. Water content of soil (0-4 inches) and ground contacting litter (juniper needles) in both years indicated fully saturated conditions (at or above field capacity).
March 11, 1998
Burn
Feb 20, 1999
Burn
Weather and Soil Temperature Air temperature (Co) Relative humidity (%) Wind speed (kph) Soil Temperature (5 cm, Co) Water content (%) Soil water (0-10 cm) Ground litter (0-5 cm) Suspended juniper needles (5+ cm)
8-16 41-55 10-13
4.4
35 107
7
3-7 36-72 6-16 -3.2
31 109
8
A. Herbaceous Canopy Cover
Cov
er (%
)
10
20
30
40Unburned First-Year Burn Second-Year Burn Interspace
C. Herbaceous Litter
Cov
er (%
)
0
10
20
30
40
Unburned 1st Year Burn 2nd Year Burn Interspace
B. Juniper Litter
Cov
er (%
)
0
20
40
60
80
D. Bareground and Rock
Year
1997 1998 1999 2000 2001 2006
Cov
er (%
)
0
20
40
60
80
a a
b, b, b
a a a a
b, b, b
b
b
b b
c
c
c
c, cd d
d
aaaa, a
b
bb
b
ab
c
c c
dd
d
a
abab
c
b
abab
b
ab
a
ab
b
cc
a
bb
b
ba
cd
a
bb
c
ab
Figure 1. Ground group cover (%) in the treatments in 1997 (pre-treatment)-2001, 2006 for : (A) Herbaceous canopy cover; (B) Juniper litter; (C) Herbaceous litter; and (D) Bareground/rock. Values are in means + one standard error. Significant differences among treatments for each response variable are indicated by different lower case letters. The Unburned debris had lower herbaceous cover and higher litter covers than the other treatments. The Burned debris treatments and Interspace had 1.5 to 2 times greater herbaceous cover than the Unburned treatment by 2006.
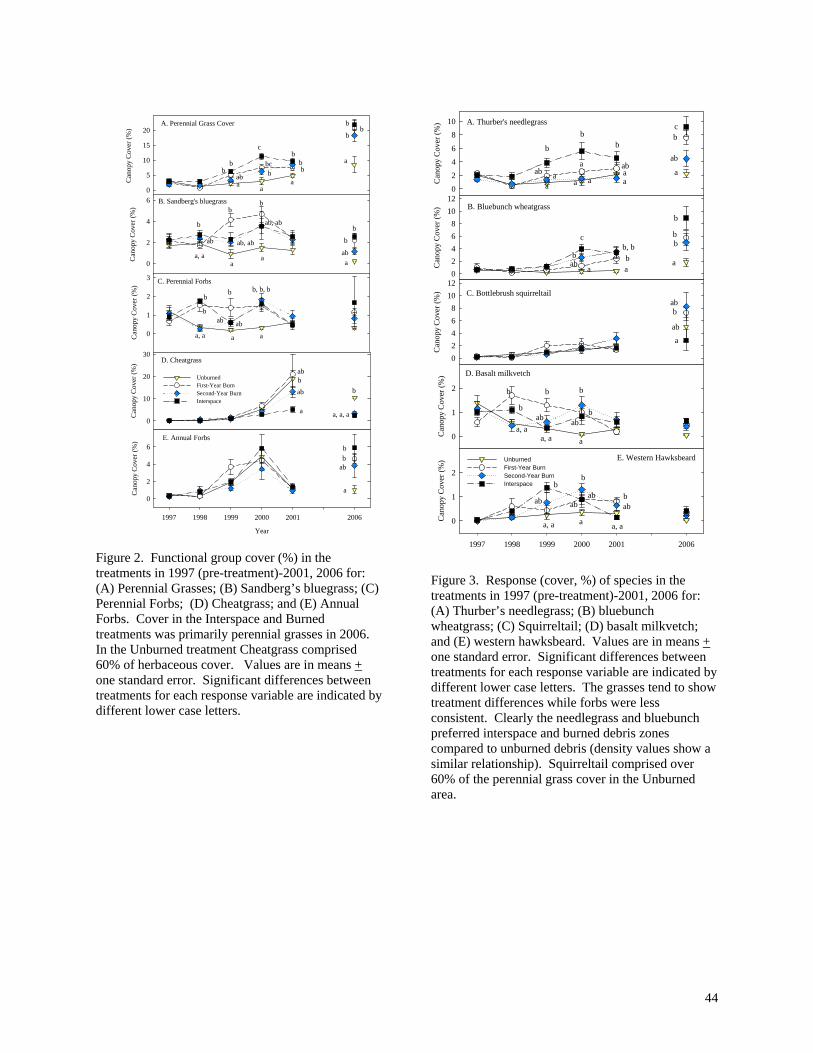
44
A. Perennial Grass CoverC
anop
y C
over
(%)
0
5
10
15
20
bb
b
a
b
B. Sandberg's bluegrass
Can
opy
Cov
er (%
)
0
2
4
6
C. Perennial Forbs
Can
opy
Cov
er (%
)
0
1
2
3
D. Cheatgrass
Can
opy
Cov
er (%
)
0
10
20
30
Unburned First-Year Burn Second-Year Burn Interspace
a, a
ab
a, a
b
b
ab, ab
b
bbc
a
c
a
b, b, b
b
ab, ab
a
ab
abb
baba
b
a
ab ab
a
b
E. Annual Forbs
Year
1997 1998 1999 2000 2001 2006
Can
opy
Cov
er (%
)
0
2
4
6
a
b
bb
a
aab
b
b
a, a, a
b
bb
ab
a
Figure 2. Functional group cover (%) in the treatments in 1997 (pre-treatment)-2001, 2006 for: (A) Perennial Grasses; (B) Sandberg’s bluegrass; (C) Perennial Forbs; (D) Cheatgrass; and (E) Annual Forbs. Cover in the Interspace and Burned treatments was primarily perennial grasses in 2006. In the Unburned treatment Cheatgrass comprised 60% of herbaceous cover. Values are in means + one standard error. Significant differences between treatments for each response variable are indicated by different lower case letters.
Can
opy
Cov
er (%
)
0
2
4
6
8
10 A. Thurber's needlegrass
a
b
aab
bb
a
Can
opy
Cov
er (%
)0
1
2
D. Basalt milkvetch
b
a
a
b
b
aba, a
b
b
ab
Can
opy
Cov
er (%
)
02468
1012
aa
aa
ab
B. Bluebunch wheatgrass
1997 1998 1999 2000 2001 2006
Can
opy
Cov
er (%
)
0
1
2
Unburned First-Year Burn Second-Year Burn Interspace
E. Western Hawksbeard
b
a, a
b
ab
a
abab
b
bab
a, aa, a
bb, b
aaabb
c
a
ab
bc
ab
b
b
Can
opy
Cov
er (%
)
02468
1012
C. Bottlebrush squirreltail
a
b
ab
ab
Figure 3. Response (cover, %) of species in the treatments in 1997 (pre-treatment)-2001, 2006 for: (A) Thurber’s needlegrass; (B) bluebunch wheatgrass; (C) Squirreltail; (D) basalt milkvetch; and (E) western hawksbeard. Values are in means + one standard error. Significant differences between treatments for each response variable are indicated by different lower case letters. The grasses tend to show treatment differences while forbs were less consistent. Clearly the needlegrass and bluebunch preferred interspace and burned debris zones compared to unburned debris (density values show a similar relationship). Squirreltail comprised over 60% of the perennial grass cover in the Unburned area.

45
VIII. Runoff and Erosion after Cutting Western Juniper
Frederick B. Pierson, Jon Bates, Tony Svejcar, and Stuart Hardegree Purpose: We used rainfall and rill simulation techniques to evaluate infiltration, runoff, and erosion on cut and uncut western juniper treatments. Research from pinyon-juniper watersheds in the southwest demonstrates a strong relationship between vegetation cover and soil erosion by wind and water. The purpose of this study was to quantify hydrologic changes associated with vegetation recovery 10 years after western juniper control in eastern Oregon. Specific objectives were to measure changes in surface runoff and rill erosion as a function of rainfall intensity and to assess surface soil and vegetation factors that are influencing hillslope hydrology and erosion. Location and Treatments: The study site was on Steens Mountain in southeast Oregon. Elevation at the site is 1575 m and aspect is west facing with a 10% slope. The site was dominated by post-settlement western juniper woodland (Phase III) Juniper canopy cover averaged 26.5% and tree density averaged 283 trees/ha. Shrubs were eliminated from the site. Herbaceous cover averaged 5.5 %. Bare ground and rock in the interspace was about 95%. Treatments consisted of removing juniper by cutting and allowing the understory vegetation to recover for 10 growing seasons and an uncut juniper woodland control. Eight 2-ac sized blocks were established. All trees on half of each block were cut in 1991. Simulations were applied to 8 cut plots and 8 woodland plots. Measurements: Surface hydrology and understory vegetation response variables were compared between cut and uncut juniper woodlands. Measurements were conducted in the interspace and not in canopy zones or under cut trees. Observation indicated that the majority of runoff moved through interspace areas, therefore, study plots were placed in interspaces between cut or uncut trees. Simulated rainfall was applied at a target rate of 2 inches. hr-1, for 1 hour, to 39 yd-2 plots using eight stationary sprinklers in June 2001. Runoff and sediment were collected during the simulation period. One hour following the rainfall simulation, a flow regulator was used to apply overland flow and measure runoff volume, sediment concentration, and flow velocity in rills. Time Scale: Conducted for two weeks in June, 2001. Results: Vegetation: Cutting junipers increased total vegetation cover (canopy and basal) and litter cover. Cover was about four times greater in the cut versus woodland treatment. Bareground in woodland intercanopy zones was 2-3 times higher than the cut treatment. Roots: Rooting characteristics differed slightly between treatments. In the juniper woodlands, roots originated primarily from juniper and in the cut treatment roots were primarily composed of perennial grasses. Root mass was greater in the woodland, though, root length and root length density were greater in the cut treatment. Root length and root-length density data indicate that the cut treatment had more fine roots than the juniper woodland. This resulted in increases in roughness and aggregate stability found in the cut treatment compared to the uncut woodland. Runoff: Woodlands rapidly produced large amounts of runoff while cut plots produced almost no runoff. All woodland plots began to runoff within 16 min following the start of rainfall. Four plots began to runoff after only 2- 4 min. Only two cut plots generated any runoff during the 1-h rainfall simulation. One cut plot began to runoff at 31 min. and the other at 43 min. The woodland plots were on average 82% ponded (surface saturated) while the cut plots were only 30% ponded. The application of a 2-yr return period thunderstorm on four juniper plots (50% of the woodland area) produced runoff while no cut plots produced any runoff. With the application of a 4-yr return period storm, seven juniper woodland plots (88% of the area) produced runoff; no cut treatment plots produced any runoff. A 50-yr return period storm had to be applied before two cut plots (25% of the cut area) began to produce runoff while all eight of the juniper plots produced an average of 4 mm of runoff. Sediment Yield: Sediment yield was orders of magnitude higher for the juniper woodland (1052 lb/ac) compared to the cut treatment (12.6 lb/ac). The sediment to runoff ratio, a measure closely associated with soil erodibility, was

46
two times greater in the uncut woodland than the cut treatment. This indicates that soil particles were more easily detached on woodland sites compared to areas in the cut treatment. Rill Dynamics: Rill discharge was 3 to 7 times higher for the juniper woodland compared to the cut treatment for all inflow rates tested. Sediment to runoff ratios were significantly higher for the juniper plots indicating higher rill erosion compared to the cut plots. Rills in the cut areas remained in more of a transport-limited state due to low rill discharge rates. The number of rills was nearly 50% greater and the width of flow within each flow-path was higher in the juniper woodland compared to the cut areas. Water velocity was twice as high in the untreated juniper plots. Conclusions: 1. This study highlights the importance of maintaining understory vegetation and litter cover when managing western juniper encroachment. Management practices that maintain adequate ground cover reduces soil loss and maintains site productivity. 2. The hydrologic impacts of western juniper in this study are consistent with previous studies that have linked changes in infiltration, runoff and erosion to declines in understory vegetation and surface litter that results in larger more interconnected areas of bare ground. Large patches of inter-connected bare ground provide better opportunity for runoff to concentrate into rills with high flow velocity, high erosive force, and sediment transport capacity. 3. The high rill erosion rates found in untreated juniper plots in this study were a result of the increase in velocity of water moving along a greater number of flow paths. Lower ground cover and increased bare ground in the juniper woodland provided less resistance to water moving over the soil surface. Overland flow could then pick up more speed and thus, energy for detachment and transport of soil particles in the flow paths. This coupled with significantly lower infiltration capacity and aggregate stability in the juniper woodland resulted in greater rill and interrill discharge rates and sediment concentrations. 4. Infiltration capacity can decrease to the point were a site begins to generate runoff from small thunderstorms that frequently occur. During rare intense thunderstorms large amounts of runoff can be generated very quickly. Loss of soil cover and a decrease in soil aggregate stability can leave the soil vulnerable to splash erosion from raindrop impact. 5. Cutting the juniper and allowing the site to recover for a ten year period was very successful at restoring the site to a hydrologically stable condition. Surface soil cover was restored and infiltration capacity increased sufficiently to protect the site from even large thunderstorms. 6. When runoff was generated in the cut, the improved surface cover conditions reduced the amount and velocity of overland flow thereby dramatically reducing rill erosion rates.
_____________________________________________________
References: Pierson, F.B., J.D. Bates, and T.J. Svejcar. 2007. Long-term erosion changes in runoff and erosion after cutting western juniper In Press, Range Ecology and Management. Miller, R.F., J.D. Bates, T.J. Svejcar, F. B. Pierson, and L.E. Eddleman. 2005. Biology, Ecology, and Management of Western Juniper. Oregon State University Agricultural Experiment Station, Technical Bulletin 152, June 2005. Corvallis. 77 p
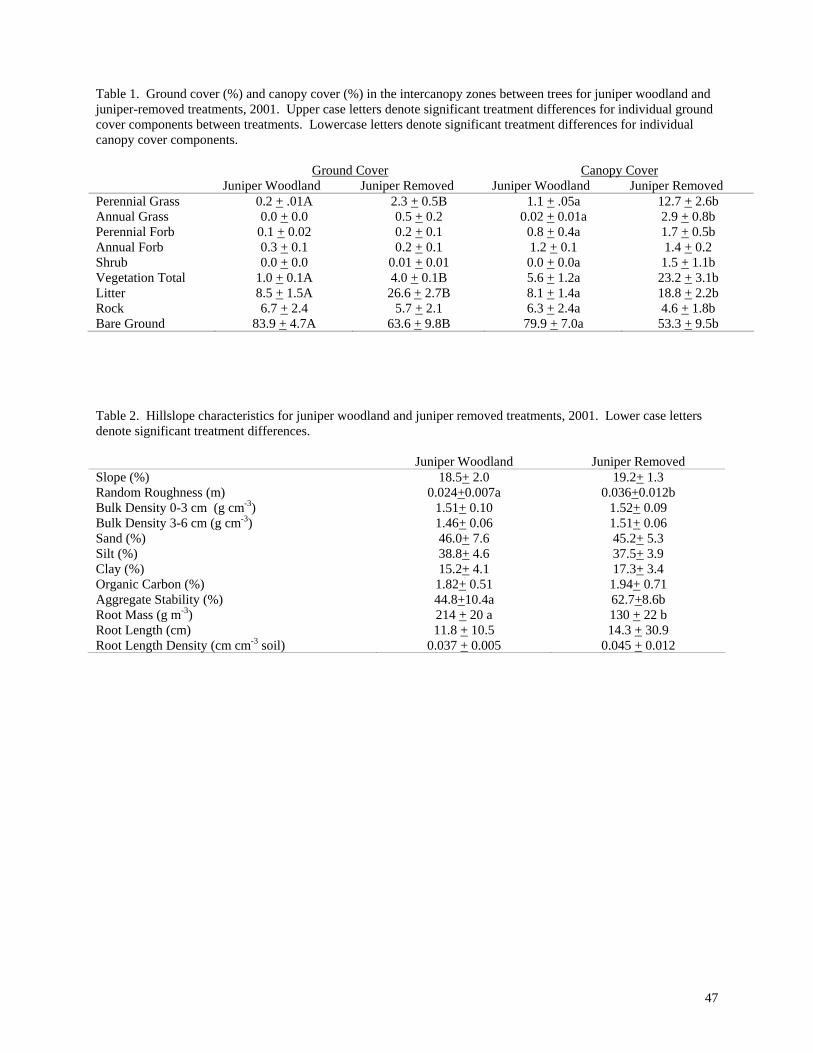
47
Table 1. Ground cover (%) and canopy cover (%) in the intercanopy zones between trees for juniper woodland and juniper-removed treatments, 2001. Upper case letters denote significant treatment differences for individual ground cover components between treatments. Lowercase letters denote significant treatment differences for individual canopy cover components. Ground Cover Canopy Cover Juniper Woodland Juniper Removed Juniper Woodland Juniper Removed Perennial Grass 0.2 + .01A 2.3 + 0.5B 1.1 + .05a 12.7 + 2.6b Annual Grass 0.0 + 0.0 0.5 + 0.2 0.02 + 0.01a 2.9 + 0.8b Perennial Forb 0.1 + 0.02 0.2 + 0.1 0.8 + 0.4a 1.7 + 0.5b Annual Forb 0.3 + 0.1 0.2 + 0.1 1.2 + 0.1 1.4 + 0.2 Shrub 0.0 + 0.0 0.01 + 0.01 0.0 + 0.0a 1.5 + 1.1b Vegetation Total 1.0 + 0.1A 4.0 + 0.1B 5.6 + 1.2a 23.2 + 3.1b Litter 8.5 + 1.5A 26.6 + 2.7B 8.1 + 1.4a 18.8 + 2.2b Rock 6.7 + 2.4 5.7 + 2.1 6.3 + 2.4a 4.6 + 1.8b Bare Ground 83.9 + 4.7A 63.6 + 9.8B 79.9 + 7.0a 53.3 + 9.5b Table 2. Hillslope characteristics for juniper woodland and juniper removed treatments, 2001. Lower case letters denote significant treatment differences. Juniper Woodland Juniper Removed Slope (%) 18.5+ 2.0 19.2+ 1.3 Random Roughness (m) 0.024+0.007a 0.036+0.012b Bulk Density 0-3 cm (g cm-3) 1.51+ 0.10 1.52+ 0.09 Bulk Density 3-6 cm (g cm-3) 1.46+ 0.06 1.51+ 0.06 Sand (%) 46.0+ 7.6 45.2+ 5.3 Silt (%) 38.8+ 4.6 37.5+ 3.9 Clay (%) 15.2+ 4.1 17.3+ 3.4 Organic Carbon (%) 1.82+ 0.51 1.94+ 0.71 Aggregate Stability (%) 44.8+10.4a 62.7+8.6b Root Mass (g m-3) 214 + 20 a 130 + 22 b Root Length (cm) 11.8 + 10.5 14.3 + 30.9 Root Length Density (cm cm-3 soil) 0.037 + 0.005 0.045 + 0.012
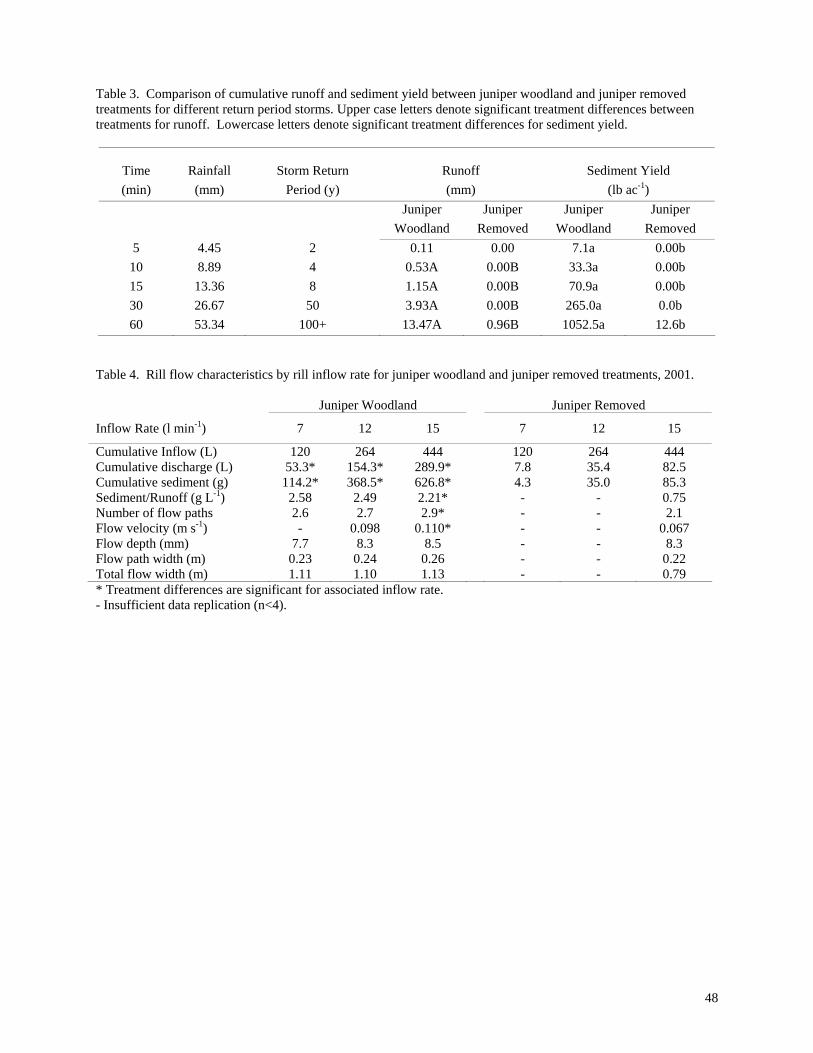
48
Table 3. Comparison of cumulative runoff and sediment yield between juniper woodland and juniper removed treatments for different return period storms. Upper case letters denote significant treatment differences between treatments for runoff. Lowercase letters denote significant treatment differences for sediment yield.
Time (min)
Rainfall
(mm)
Storm Return
Period (y)
Runoff (mm)
Sediment Yield
(lb ac-1) Juniper
Woodland Juniper
Removed Juniper
Woodland Juniper
Removed 5 4.45 2 0.11 0.00 7.1a 0.00b
10 8.89 4 0.53A 0.00B 33.3a 0.00b 15 13.36 8 1.15A 0.00B 70.9a 0.00b 30 26.67 50 3.93A 0.00B 265.0a 0.0b 60 53.34 100+ 13.47A 0.96B 1052.5a 12.6b
Table 4. Rill flow characteristics by rill inflow rate for juniper woodland and juniper removed treatments, 2001. Juniper Woodland Juniper Removed
Inflow Rate (l min-1) 7 12 15 7 12 15
Cumulative Inflow (L) 120 264 444 120 264 444 Cumulative discharge (L) 53.3* 154.3* 289.9* 7.8 35.4 82.5 Cumulative sediment (g) 114.2* 368.5* 626.8* 4.3 35.0 85.3 Sediment/Runoff (g L-1) 2.58 2.49 2.21* - - 0.75 Number of flow paths 2.6 2.7 2.9* - - 2.1 Flow velocity (m s-1) - 0.098 0.110* - - 0.067 Flow depth (mm) 7.7 8.3 8.5 - - 8.3 Flow path width (m) 0.23 0.24 0.26 - - 0.22 Total flow width (m) 1.11 1.10 1.13 - - 0.79 * Treatment differences are significant for associated inflow rate. - Insufficient data replication (n<4).
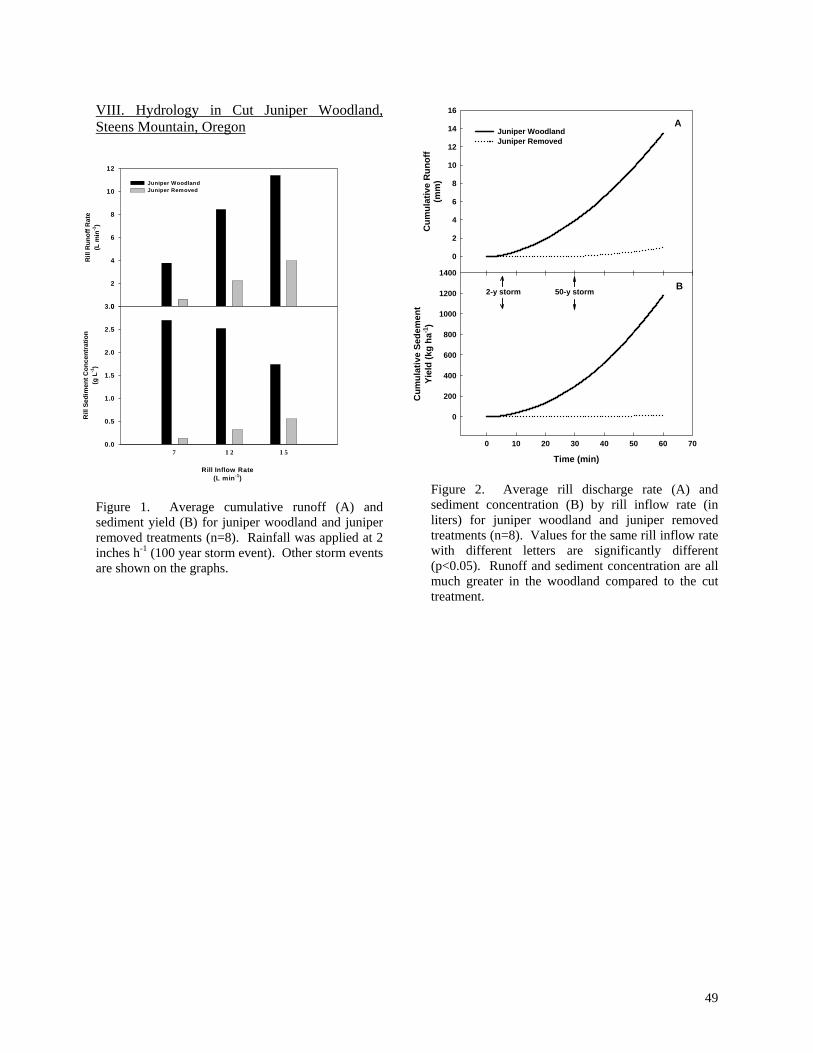
49
VIII. Hydrology in Cut Juniper Woodland, Steens Mountain, Oregon
Figure 1. Average cumulative runoff (A) and sediment yield (B) for juniper woodland and juniper removed treatments (n=8). Rainfall was applied at 2 inches h-1 (100 year storm event). Other storm events are shown on the graphs.
Figure 2. Average rill discharge rate (A) and sediment concentration (B) by rill inflow rate (in liters) for juniper woodland and juniper removed treatments (n=8). Values for the same rill inflow rate with different letters are significantly different (p<0.05). Runoff and sediment concentration are all much greater in the woodland compared to the cut treatment.
A
Cum
ulat
ive
Run
off
(mm
)
0
2
4
6
8
10
12
14
16
B
Time (min)
0 10 20 30 40 50 60 70
Cum
ulat
ive
Sede
men
tYi
eld
(kg
ha-1
)0
200
400
600
800
1000
1200
1400
Juniper WoodlandJuniper Removed
2-y storm 50-y storm
Rill
Run
off R
ate
(L m
in-1
)
0
2
4
6
8
10
12
Rill Inflow Rate(L min-1)
Rill
Sed
imen
t Con
cent
ratio
n(g
L-1
)
0.0
0.5
1.0
1.5
2.0
2.5
3.0
Juniper WoodlandJuniper Removed
7 1 2 1 5
50
IX. Effects of Juniper Cutting on Soil Nitrogen Dynamics and Litter Decomposition
Jon Bates, Tony Svejcar, and Rick Miller Overview: There has been little research describing many ecological processes in western juniper woodlands, particularly nitrogen (N) and nutrient dynamics. It is important to understand the effects of juniper and its removal to these processes because of impacts to site productivity and recovery potentials. Woodland expansion as well woodland control measures are both likely to increase in the near future. Purpose: The purpose of the study was to evaluate patterns of N mineralization and litter decomposition in cut and uncut juniper woodlands. Our objectives were to assess the effects of the sudden removal of overstory juniper on soil N availability for understory plants, soil and litter N dynamics, and litter decomposition. Treatment and Measurement: The study was located on Steens Mountain in a big sagebrush/Thurber’s needlegrass community. Prior to cutting, juniper cover averaged 26% and mature juniper density averaged 250 trees ha-1 (about 110 trees ac-1). Understory cover was less than 5% and because of high levels of bareground between trees sheet erosion and rill formation were evident. All mature juniper trees and saplings > 20 cm were cut down using chainsaws in August 1991. Nitrogen dynamics and litter decomposition were evaluated using in-field measurement techniques. Time Scale: Study spanned 2 years (Nov.,1991 – Oct. 1993). Results: The first sample year was a dry year (1992) and the second sample year (1993) was a very wet year. Soil Nitrogen: In the dry year, soil moisture, plant available N, and N mineralization was greater in the cut than the uncut woodland. In the wet year, plant available N and N mineralization did not differ between cut and uncut treatments. In both treatments available N and N mineralization were greater in the dry year (1992) versus the wet year (1993). The effect of year, dry versus wet, overwhelmed the effect of juniper removal. In both treatments, in the dry year, there was a higher potential for N loss from soils as a result of the buildup of plant available N (plants didn’t grow much because of lack of water, thus, less N taken up). In cut treatments, soils beneath downed trees (debris) had lower amounts of available N and N mineralization rates compared to the intercanopy. Soil organic carbon (C) increased in soils beneath cut trees but did not change in canopy or intercanopy soils. After cutting understory plants in the cut treatment took up more N in total and as percentage of biomass than the uncut woodland. Litter Dynamics: Litter mass loss was 37% greater in the cut treatment compared to the uncut treatment after 2 years. Greater litter inputs, higher litter-fall quality, and micro-environmental differences were the main causes for the higher litter decomposition rate in the cut treatment. Most juniper leaves detach and fall to the ground within 3 years after cutting. Leaf litter deposition from cut trees is about twice as great as that measured in uncut woodlands. Indications are that juniper in the uncut woodland were completely turning over their leaves about every 7 years.
51
In both treatments, litter N was released by the second year of decomposition, though N release was greater in the uncut treatment. Conclusions: 1. Nitrogen dynamics in soils of treated and untreated juniper woodlands are highly dynamic and difficult to quantify. The study demonstrated that yearly weather events have the greatest impact on N dynamics of this system rather than treatment, whose effects appear transitory. 2. Removal of juniper reduces competition for soil N (and presumably other nutrients) and water which permits the understory to increase after juniper removal whether by cutting or fire. 3. The data indicate a redistribution of N from intercanopy to canopy soils by juniper. These results agree with other studies showing accumulations of C and N in soils under juniper canopies during woodland invasion. This potentially could reduce fertility of intercanopy soils especially when combined with increased erosion (see section VII). 4. A management concern after juniper cutting is the potential for increasing outflows of soil N, primarily in the form of nitrate. The methods used to assess soil N indicate that most of the available N was taken up by soil microorganisms and was not lost via leaching or denitrification. 5. Surface litter shifts from a composition of herbaceous and shrub detritus to primarily juniper leaf litter. The buildup of litter is characteristic of juniper and other semi-arid woodland expansions indicating increased litter residence times and potentially slower release of plant available nutrients compared to sagebrush steppe grassland 6. Decomposition rates of western juniper needle litter are 5 times slower than big sagebrush; most sagebrush litter decomposes in 2 years. This suggests that litter and nutrient cycling becomes less dynamic as trees invade and replace sagebrush-grassland. 7. The retention of juniper debris on site permits storage and release of C and other nutrients through decomposition processes and may be important in maintaining long-term site productivity. However, juniper litter influences herbaceous successional composition (see sections V and VI), therefore.... 8. ..... it is important to evaluate litter and nutrient dynamics in relation to other ecosystem processes such as plant succession. Large increases of invasive annual grasses have been documented in areas of juniper litter deposition about 5 years following woodland cutting. Litter areas provide ideal micro-sites for invasive annuals to establish because of greater soil water availability and higher soil fertility that enhance plant growth. Thus, management of juniper litter in recently controlled woodlands may be important in reducing the threat of invasive weeds when restoring shrub-steppe grasslands.
________________________________________________
References: Bates J., T.S. Svejcar, and R.F. Miller. 2002. Effects of Juniper Cutting on Nitrogen Mineralization. Journal of Aridland Environments 51:221-234 Bates J.D., T. Svejcar, and R. Miller. 2007. Litter decomposition in juniper woodlands. Journal of Arid Environments. In Press
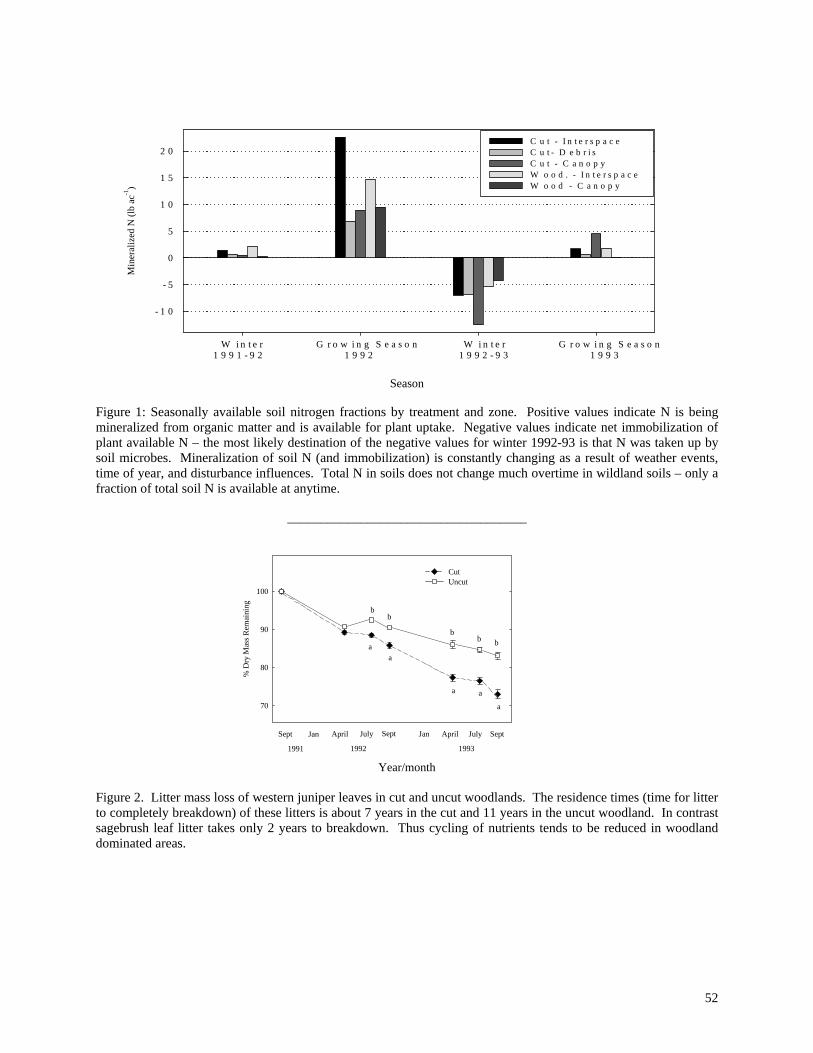
52
Min
eral
ized
N (l
b ac
-1)
- 1 0
- 5
0
5
1 0
1 5
2 0C u t - I n t e r s p a c e C u t - D e b r i s C u t - C a n o p y W o o d . - I n t e r s p a c e W o o d - C a n o p y
W i n t e r G r o w i n g S e a s o n W i n t e r G r o w i n g S e a s o n 1 9 9 1 - 9 2 1 9 9 2 1 9 9 2 - 9 3 1 9 9 3
Season Figure 1: Seasonally available soil nitrogen fractions by treatment and zone. Positive values indicate N is being mineralized from organic matter and is available for plant uptake. Negative values indicate net immobilization of plant available N – the most likely destination of the negative values for winter 1992-93 is that N was taken up by soil microbes. Mineralization of soil N (and immobilization) is constantly changing as a result of weather events, time of year, and disturbance influences. Total N in soils does not change much overtime in wildland soils – only a fraction of total soil N is available at anytime.
____________________________________
Year/month
Figure 2. Litter mass loss of western juniper leaves in cut and uncut woodlands. The residence times (time for litter to completely breakdown) of these litters is about 7 years in the cut and 11 years in the uncut woodland. In contrast sagebrush leaf litter takes only 2 years to breakdown. Thus cycling of nutrients tends to be reduced in woodland dominated areas.
% D
ry M
ass R
emai
ning
70
80
90
100
Cut Uncut
Sept April July April July Sept
1991 1992 1993
Jan
b
SeptJan
b
bb b
a a
a
aa
53
X. Grazing following western juniper cutting
Jon Bates Purpose: There is limited research on how grazing influences herbaceous recovery after cutting or burning of western juniper. Cut juniper sites often account for only a small proportion of a field. Resting fields for longer than two or more years may not be feasible, especially if longer term rest or deferment interfere with other land management goals and objectives. This study evaluated high intensity-short duration grazing on herbaceous recovery the first two growing seasons after cutting. Treatments & Measurements: Vegetation response (cover, density, biomass, seed production) was compared among grazed and ungrazed juniper woodlands that were cut and left uncut. Cattle grazed plots only the first two years after treatment. Plots were not grazed the 3rd and 4th year post-treatment to evaluate short-term impacts to herbaceous biomass and seed production. The prescription was to graze the field for a short duration in the early May when perennial grasses were in vegetative to early boot growth stages. Location: The study site was on Steens Mountain in southeast Oregon. The site was dominated by post-settlement western juniper woodland. Juniper canopy cover averaged 22.5% and tree density averaged 242 trees/ha. Shrubs were eliminated from the site. Herbaceous cover averaged 4.2 %. Bare ground and rock in the interspace was about 97%. Common species were Sandberg’s bluegrass, bottlebrush squirreltail, bluebunch wheatgrass, Thurber's needlegrass, basalt milkvetch, and pale alyssum. Time Scale: Study spanned 4 years (1998-2002). Results:
Grazing: Stocking rates were 0.3 cow-calf pairs per acre for 5 days in early May 1999 and 0.38 cow-calf pairs per acre for 4 days in early May 2000. Utilization in cut-grazed plots averaged 73% in 1999 and 71% in 2000. Utilization above 70% is considered heavy in sagebrush plant communities. Utilization in uncut grazed plots averaged 64% in 1999 and 15% in 2000. Juniper cutting resulted in increased herbaceous cover, biomass, and seed production when compared to woodland controls. By the 3rd year post cutting, cover of perennial bunchgrass and annual grass in both cut-grazed and cut-ungrazed treatments were significantly greater than the uncut treatments. Grazing had no measurable short-term impacts to understory recovery as measured by plant cover, density, and biomass. Increases in herbaceous variables were similar in grazed and ungrazed cut treatments. In the cut treatment, biomass of the large perennial grass group was greater in the ungrazed prescription. This difference was attributed to the accumulation of dead leaf and reproductive material within grass bunches between 1999 and 2002 in the ungrazed treatment. The spring grazing prescription did reduce seed production after cutting substantially. Thurber’s needlegrass seed production was the most negatively impacted by the grazing prescription. Seed production of other perennial grass species were less affected by the grazing treatment and made a relatively quick recovery the 4th season after cutting. Cheatgrass increased but there were no differences between the grazed and ungrazed cutting treatments. Conclusions: 1. The trials were conducted in relatively dry years, with little spring precipitation. Soils on this site are shallow and dry relatively quickly. Regrowth on the cut grazed plots was adequate following May grazing in 1999 and 2000 but this growth was primarily vegetative with little seed produced. The dry conditions were a major factor in the lack of perennial grass recruitment for the grazed and ungrazed cut treatments.

54
2. Sites with a limited understory (1-4 perennial bunchgrasses per yd-2), such as used in this study, should probably be rested or deferred until after seed shatter the first few growing seasons after juniper removal. This should provide plants the opportunity to maximize seed crops and enhance opportunities for seedling establishment when environmental conditions are favorable. Reintroducing livestock too quickly after treatment may inhibit herbaceous recovery, particularly on sites with a diminished perennial component, and promote dominance of the site by undesirable exotic grasses and forbs. 3. Sites with adequate understory (5-10+ perennial bunchgrasses per yd-2) may not require any immediate grazing rest, though deferment should remain a management option. 4. The results indicated that juniper interference has greater impacts on herbaceous dynamics than does grazing. Juniper suppressed the understory in all aspects (cover, density, seed and biomass production) but grazing did not aside from seed production. 5. A primary goal when grazing treated juniper areas is to permit recovery of ecological functions (hydrology, and energy and resource capture) of a site. In Great Basin plant communities this is best achieved by restoring the system to one dominated by perennial grasses, forbs, and shrubs. Thus, grazing management following juniper control should be adaptive to changing environmental and resource conditions, and will require constant reassessment to achieve short and long-term restoration goals.
____________________________________________ Reference: Bates J. 2005. Herbaceous response to cattle grazing following juniper removal in eastern Oregon. Range Ecology and Management. 58:225-233.
55
XI. Summary This summary highlights the main points/guidelines derived from western juniper control research conducted by EOARC. Additional points may be found in earlier text of the report or in Miller et al. (2005)2. Preparatory Cutting and Fire Treatments: 1. The speed and trajectory of response in our studies and others elsewhere were governed by pre-treatment composition, site potential (soils and plant community), seed bank viability, and woodland invasive phase. 2. The predictability of the plant community response after fire increases with site condition, site potential, and when the community is still in the early stages of juniper woodland development. The degree of predictability is lowest when a site is approaching or is at a threshold such as in fully developed woodlands (Phase III). Post fire vegetation succession will have multiple entrance points with sites tending to be dominated by perennial and annual forbs the first five years following fire. However, treated Phase I and II woodlands with a good understory composition tend to recover adequately and more speedily than Phase III (see section I). Phase III woodlands are more susceptible to non-native weed dominance (see sections I and II) or slower recovery because of high mortality of understory perennials (see section III).
A. Phase I and II woodlands that contain good understory composition and cover have acceptable recovery trajectories after burning under typical fall/late summer fire conditions.
B. Phase III woodlands with or without good pre-treatment understory compositions have slower recoveries and/or a high risk of weed expansion. These woodlands should probably be burned in the winter to reduce severity of fire effects. All our winter burning treatments have shown low mortality to the understory and faster recovery than fall burned Phase III woodlands (see sections III and VII). If burned in the fall these sites should probably be reseeded or may require long rest/deferral periods (4-8 year) from grazing (section IV).
3. The risk of weed invasion and treatment failure after fire increases with site aridity, low perennial composition (<1 perennial grass plant yd-2), and/or pre-treatment weed presence. 4. Dry warm sites are prone to increases in cheatgrass cover and shrub recovery takes longer. On wetter cooler sites recovery of shrubs and perennial herbaceous plants occurs more rapidly and annual grasses do not compete well. 5. The results indicated that cutting 25% of mature trees in communities dominated by western juniper (Phase III, juniper cover 40-80%) was sufficient to remove the majority of remaining live trees in stands with fall prescribed fire. Cutting more than 25% would be excessive when broadcast burning is applied with weather conditions typically encountered with fall prescribed fire. Crowning or canopy fires were maintained in some adjacent uncut woodlands with little understory. 6. Cutting levels can probably be reduced in Phase III woodlands exceeding 50% canopy cover. Cutting 10-20% of the trees or strip cutting should be considered when burning in the fall.
2 Miller, R.F., J.D. Bates, T.J. Svejcar, F. B. Pierson, and L.E. Eddleman. 2005. Biology, Ecology, and Management of Western Juniper. Oregon State University Agricultural Experiment Station, Technical Bulletin 152, June 2005. Corvallis. 77 p.

56
7. Winter burning of cut trees in Phase III woodlands should be considered to limit mortality of herbaceous perennials and speed recovery. Cutting would have to be at higher levels (60-80%) to kill enough trees to illicit an herbaceous/shrub response. Burning should be done when soil and ground litters are at field capacity and frozen (Nov.-March). Cutting and Debris Management: 1. The advantages of cutting are that there is a high degree of control in the treatment application. Cutters can select specific types of trees to cut and not to cut (e.g. old growth trees should probably be left on site). Unlike prescribed fire, cutting operations will stay within the boundaries of the treatment site and liability is thus reduced. Cutting can be conducted almost year round as long as access is not constrained by weather or road conditions. Cutting is generally not limited by terrain roughness as is heavy machinery applications. The only area of concern is that leaving cut trees on site can present a fuel load problem for several years following treatment. This is of particular concern in woodlands that abut forested plant communities such as Ponderosa pine forest. 2. Recovery of sites requires patience. It takes anywhere from 1 to several years before the understory fully responds to removal of tree interference especially when growing conditions are not favorable. It takes time for existing plants to grow larger and new plants to become established. (see section V & VI) 3. Juniper treatment (cutting or fire) on drier sites with adequate perennial understory to recover will result is stabilizing the site hydrologically (reduce erosion VIII).
XII. Ongoing Western Juniper Control Research Effects of juniper on rangeland watersheds (Pierson, Svejcar, Hardegree, Bates): This is a large scale project evaluating the effects of juniper to ephemeral watersheds (100-200 acres in size) in southwestern Idaho. Four of the watersheds have been instrumented with weirs, automated runoff samplers, and weather stations. The watersheds will be monitored for 4 to 6 years to establish the relationship between precipitation received and water yield. Once that relationship has been established, juniper will be removed from one watershed (selected at random) per year. Changes in flow, relative to the predicted baseline will provide an indication of juniper impacts on the water budget. Ancillary measurements will include vegetation composition and streambed morphology. This research will provide land managers with an indication of whether or not juniper expansion has influenced stream flows in the Great Basin. If that has been the case, land managers and policymakers will likely target juniper removal projects to sites with the potential to increase water yield. Joint Fire Science Project (Miller); This is a large scale project with multiple sites located in sagebrush communities threatened by woodland encroachment. Study will evaluate the effects of no management action (control), prescribed fire, and mechanical removal of trees (chainsaw cutting). The objective is to address the question of what amount of the native sagebrush/bunchgrass community there needs to be in order for managers to improve land health without having to conduct expensive restoration. Because of the study scale, predicting response after juniper treatments should be much improved. Pretreatment data (vegetation, fuel loads, surface hydrology, wildlife) has been collected and treatments applied to the juniper on 2 of 4 sites. Post treatment measurements will begin in 2007 and 2008. (BLM Districts in Lakeview, Burns, and Prineville, Oregon; and Alturas, California). Long-term evaluation of juniper control projects (Bates, Miller, Svejcar); Continue monitoring of cutting and fire treatments presented in this report. Sites will be revisited and measured every 2-5 years in the future. (Cooperators – Fred Otley, Diamond Oregon; Burns BLM; Tim Lowry, Jordan Valley Oregon; and Idaho State Dept of Lands).
57
Timing of Juniper Debris burning (Bates); Treatments to reduce juniper fuel loads in forested and non-forested rangelands will differ in the ability to restore native or non-native perennial vegetation and prevent weed infestations. In this experiment three sites (Mountain sagebrush/Idaho fescue (2 sites), Basin big sagebrush/bluebunch wheatgrass) with 4 broadcast burning treatments are being applied (fall, winter, late winter, early spring) to evaluate understory succession, potential for invasive weed expansion, and effects to soil nutrient pools. Study sites are on Steens Mountain and the Northern Great Basin Experimental Range (NGBER) at Paiute (Squaw) Butte. Pretreatment data has been collected and cutting treatments applied to the juniper. Post treatment measurements will begin in 2007. (Cooperators – Fred Otley, Diamond Oregon) Recovery Thresholds (Bates, Mangold); There are still too few studies that permit us to accurately predict plant succession after treating juniper. A clear indication of when a threshold has been crossed and when the response of desired species is not achieved after juniper control has not been firmly developed. The minimum (threshold) density of perennial grasses required for herbaceous recovery after juniper control will be evaluated for two sites typically invaded by juniper (Mountain sagebrush/Idaho fescue, Mountain sagebrush/Thurber’s needlegrass). Treatments consist of starting with perennial grass densities of 0, 0.5, 1, 2, 3, and 5, perennial grasses per m-2. Our earlier work indicates that 2-3 m-2 perennial grasses are required for full recovery and to reduce threat for annual grass/weed encroachment. Study sites are at the Northern Great Basin Experimental Range (NGBER). Pretreatment data has been collected and cutting treatments applied to the juniper. Post treatment measurements will begin in 2007. Seeding after juniper control (Mangold, Sheley, Bates); This work consist of a series of studies evaluating seeding following juniper control by cutting or fire across multiple sites and overtime (multiple years). Study sites are on Steens Mountain, NGBER, and South Mountain (Idaho). Native and introduced grass and forb species have/will be seeded at different seeding rates in monocultures and in a mix. The study will be repeated at multiple sites over several years in order to link results with precipitation data (derive seeding success probabilities) from each site and arrive at recommended species based on soils, elevation, and precipitation range. Studies are on going. (Cooperators – Fred Otley, Diamond Oregon; Tim Lowry, Jordan Valley Oregon; and Idaho State Dept of Lands) Comparison of fuel reduction treatments (O’Conner, Miller, Bates); this study is comparing two fuel reduction treatments after juniper cutting at the interface of mountain big sagebrush and ponderosa pine ecosystems. Fuel reduction treatments are juniper cutting followed by pile-and-burning and broadcast burning. Pretreatment data has been collected and treatments applied. Post treatment monitoring of vegetation recovery and soil nutrient pools will begin in 2007. (Cooperators – Burns BLM)