Embed Size (px)
Citation preview

E.ON Roadshow
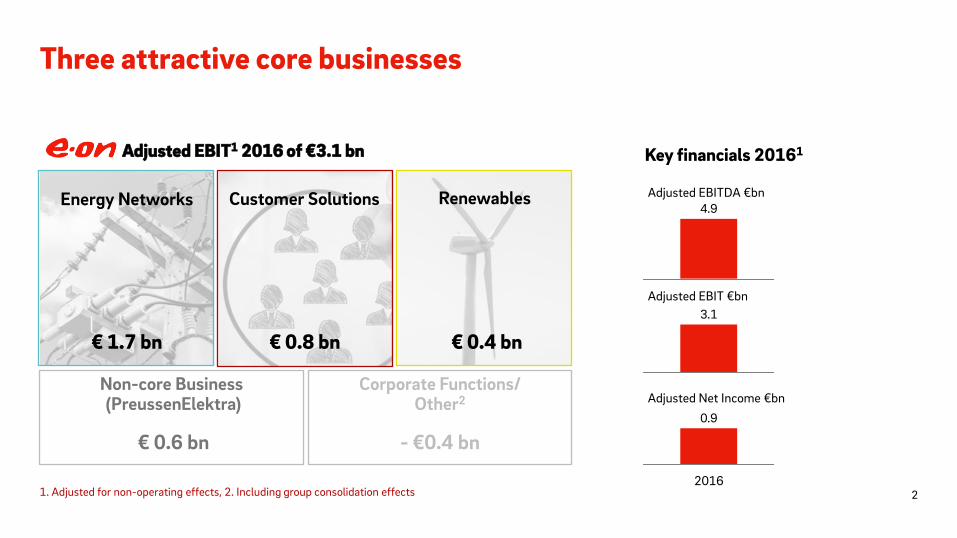
Three attractive core businesses
2
Adjusted EBITDA €bn
Adjusted EBIT €bn
Adjusted Net Income €bn
Adjusted EBIT1 2016 of €3.1 bn
4.9
3.1
0.9
2016
Corporate Functions/ Other2
- €0.4 bn
Non-core Business (PreussenElektra)
€ 0.6 bn
€ 1.7 bn € 0.4 bn € 0.8 bn
Key financials 20161
1. Adjusted for non-operating effects, 2. Including group consolidation effects
Energy Networks Customer Solutions Renewables
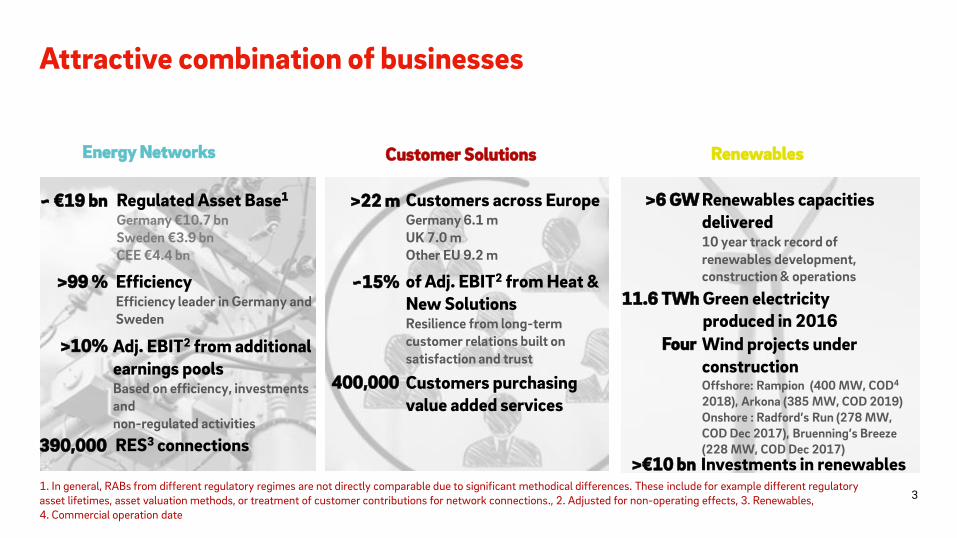
Attractive combination of businesses
1. In general, RABs from different regulatory regimes are not directly comparable due to significant methodical differences. These include for example different regulatory asset lifetimes, asset valuation methods, or treatment of customer contributions for network connections., 2. Adjusted for non-operating effects, 3. Renewables, 4. Commercial operation date
Energy Networks Renewables Customer Solutions
~ €19 bn Regulated Asset Base1 Germany €10.7 bn Sweden €3.9 bn CEE €4.4 bn
Efficiency Efficiency leader in Germany and Sweden
>99 %
Adj. EBIT2 from additional earnings pools Based on efficiency, investments and non-regulated activities
>10%
>22 m Customers across Europe Germany 6.1 m UK 7.0 m Other EU 9.2 m
Customers purchasing value added services
400,000
of Adj. EBIT2 from Heat & New Solutions Resilience from long-term customer relations built on satisfaction and trust
~15%
>6 GW Renewables capacities delivered 10 year track record of renewables development, construction & operations
Wind projects under construction Offshore: Rampion (400 MW, COD4 2018), Arkona (385 MW, COD 2019) Onshore : Radford’s Run (278 MW, COD Dec 2017), Bruenning’s Breeze (228 MW, COD Dec 2017)
Four
Green electricity produced in 2016
11.6 TWh
RES3 connections 390,000 Investments in renewables
>€10 bn
3
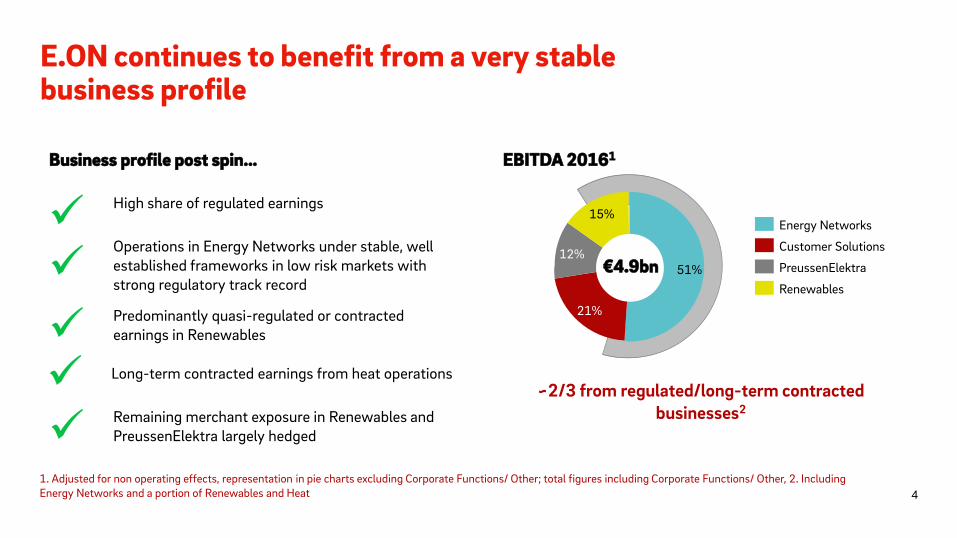
E.ON continues to benefit from a very stable business profile
Business profile post spin…
High share of regulated earnings
Predominantly quasi-regulated or contracted earnings in Renewables
Remaining merchant exposure in Renewables and PreussenElektra largely hedged
Operations in Energy Networks under stable, well established frameworks in low risk markets with strong regulatory track record
Long-term contracted earnings from heat operations
EBITDA 20161
~2/3 from regulated/long-term contracted businesses2
1. Adjusted for non operating effects, representation in pie charts excluding Corporate Functions/ Other; total figures including Corporate Functions/ Other, 2. Including Energy Networks and a portion of Renewables and Heat
51%
15%
12%
21%
Energy Networks
Customer Solutions
PreussenElektra
Renewables
€4.9bn
4

Outlook 2017
EBIT1
Adj. Net Income1
Outlook 2017
1. Adjusted for non operating effects
€2.8-3.1 bn
€1.2-1.45 bn
+ Regulatory effects (e.g. NeMoG, pensions), lower maintenance costs
+ Tariff increase in Sweden
+ Positive development in CZ, HU/ normalization in Turkey
Effects for remainder of 2017
+ Omission of nuclear fuel tax payments
+ Operational improvements
– Lower hedging prices
– Asset retirement cost (ARC) effect
Energy Networks
Customer Solutions
+ Price increases in Germany & UK
+ Focus on sales and customer retention in UK
+ UK efficiency program
Renewables + Normalizing wind yields
– Arkona book gain in Q2 2016
5
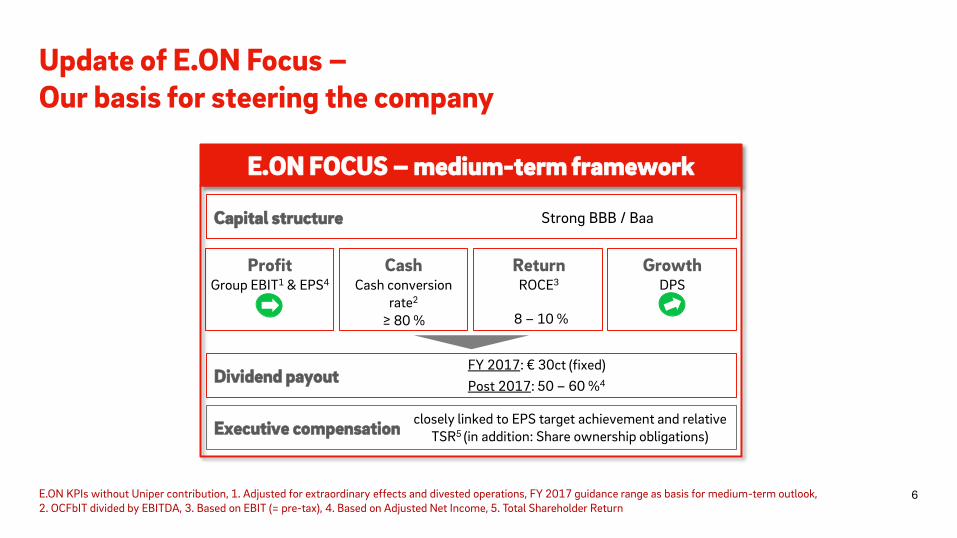
Executive compensation
Profit Group EBIT1 & EPS4
Cash Cash conversion
rate2 ≥ 80 %
Return ROCE3
8 – 10 %
Growth DPS
Capital structure Strong BBB / Baa
Dividend payout FY 2017: € 30ct (fixed)
Post 2017: 50 – 60 %4
E.ON FOCUS – medium-term framework
closely linked to EPS target achievement and relative TSR5 (in addition: Share ownership obligations)
Update of E.ON Focus – Our basis for steering the company
E.ON KPIs without Uniper contribution, 1. Adjusted for extraordinary effects and divested operations, FY 2017 guidance range as basis for medium-term outlook, 2. OCFbIT divided by EBITDA, 3. Based on EBIT (= pre-tax), 4. Based on Adjusted Net Income, 5. Total Shareholder Return
6
KFK implementation in final stages
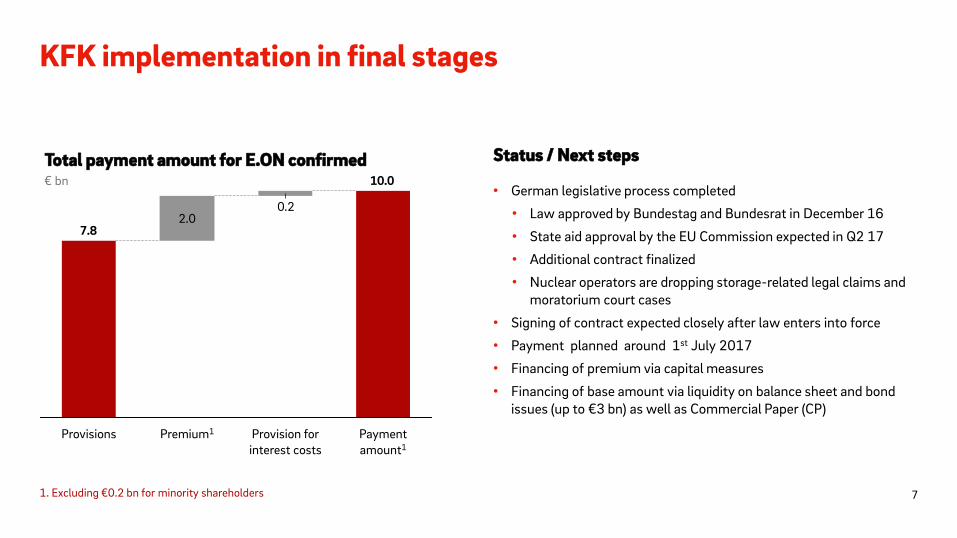
Status / Next steps Total payment amount for E.ON confirmed
2.00.2
10.0
7.8
Premium1 Provisions Payment amount1
Provision for interest costs
€ bn
• German legislative process completed
• Law approved by Bundestag and Bundesrat in December 16
• State aid approval by the EU Commission expected in Q2 17
• Additional contract finalized
• Nuclear operators are dropping storage-related legal claims and moratorium court cases
• Signing of contract expected closely after law enters into force
• Payment planned around 1st July 2017
• Financing of premium via capital measures
• Financing of base amount via liquidity on balance sheet and bond issues (up to €3 bn) as well as Commercial Paper (CP)
1. Excluding €0.2 bn for minority shareholders 7
KFK solution with positive impact on adjusted net income
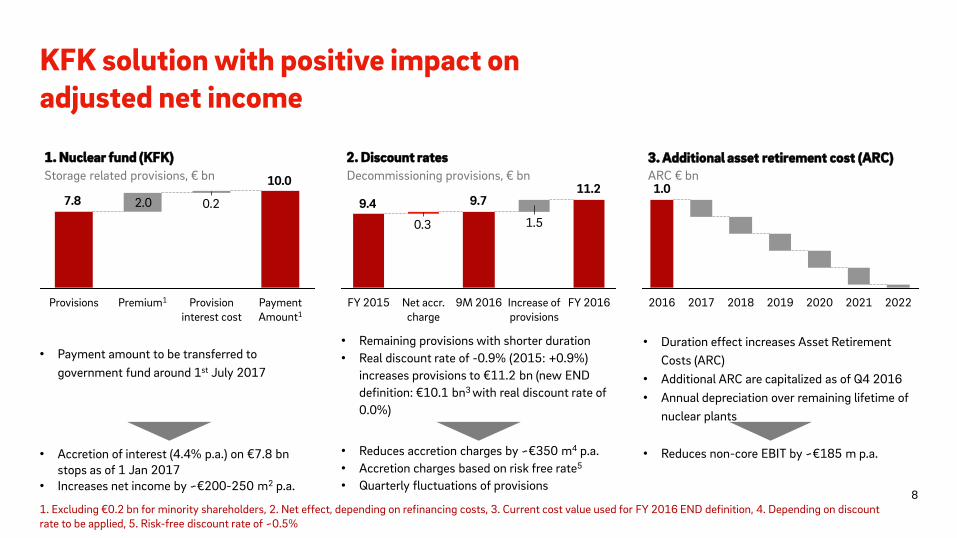
• Payment amount to be transferred to
government fund around 1st July 2017
• Accretion of interest (4.4% p.a.) on €7.8 bn stops as of 1 Jan 2017
• Increases net income by ~€200-250 m2 p.a.
1. Nuclear fund (KFK) 2. Discount rates 3. Additional asset retirement cost (ARC)
2.0 0.2
10.0
7.8
Payment Amount1
Provision interest cost
Premium1 Provisions
1. Excluding €0.2 bn for minority shareholders, 2. Net effect, depending on refinancing costs, 3. Current cost value used for FY 2016 END definition, 4. Depending on discount rate to be applied, 5. Risk-free discount rate of ~0.5%
11.29.79.4
1.50.3
FY 2016 Increase of provisions
9M 2016 Net accr. charge
FY 2015
Storage related provisions, € bn
• Remaining provisions with shorter duration
• Real discount rate of -0.9% (2015: +0.9%)
increases provisions to €11.2 bn (new END
definition: €10.1 bn3 with real discount rate of
0.0%)
• Reduces accretion charges by ~€350 m4 p.a.
• Accretion charges based on risk free rate5
• Quarterly fluctuations of provisions
1.0
2022 2021 2020 2019 2018 2017 2016
ARC € bn
• Duration effect increases Asset Retirement
Costs (ARC)
• Additional ARC are capitalized as of Q4 2016
• Annual depreciation over remaining lifetime of
nuclear plants
• Reduces non-core EBIT by ~€185 m p.a.
Decommissioning provisions, € bn
8
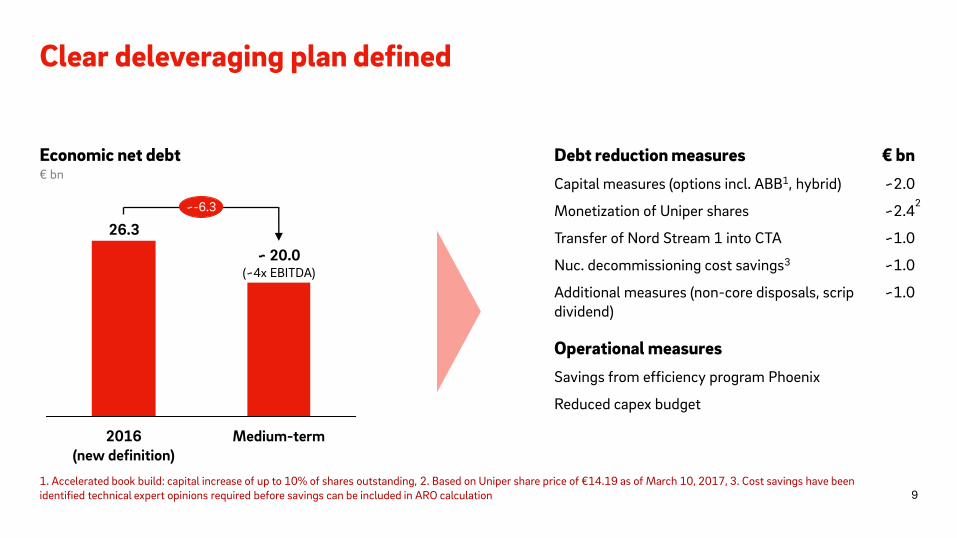
Clear deleveraging plan defined
Economic net debt Debt reduction measures
Capital measures (options incl. ABB1, hybrid)
Monetization of Uniper shares
Transfer of Nord Stream 1 into CTA
Nuc. decommissioning cost savings3
Additional measures (non-core disposals, scrip dividend)
Operational measures
Savings from efficiency program Phoenix
Reduced capex budget
€ bn
26.3
~ 20.0 (~4x EBITDA)
2016 (new definition)
~-6.3
Medium-term
€ bn
~2.0
~2.4
~1.0
~1.0
~1.0
1. Accelerated book build: capital increase of up to 10% of shares outstanding, 2. Based on Uniper share price of €14.19 as of March 10, 2017, 3. Cost savings have been identified technical expert opinions required before savings can be included in ARO calculation
2
9
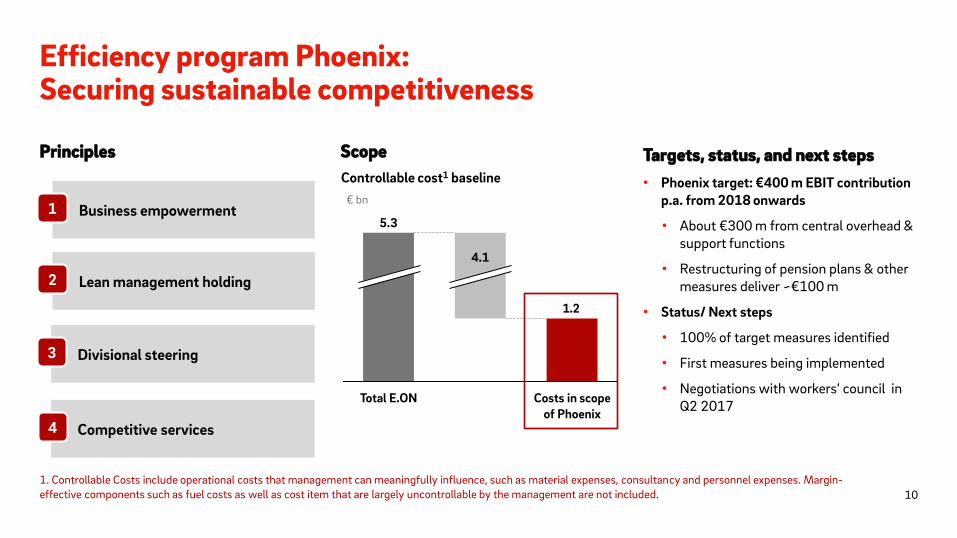
Efficiency program Phoenix: Securing sustainable competitiveness
Principles Scope Targets, status, and next steps
Competitive services 4
Business empowerment 1
Lean management holding 2
Divisional steering 3
1.2
Costs in scope of Phoenix
4.1
Total E.ON
5.3
Controllable cost1 baseline
€ bn
• Phoenix target: €400 m EBIT contribution p.a. from 2018 onwards
• About €300 m from central overhead & support functions
• Restructuring of pension plans & other measures deliver ~€100 m
• Status/ Next steps
• 100% of target measures identified
• First measures being implemented
• Negotiations with workers’ council in Q2 2017
10
1. Controllable Costs include operational costs that management can meaningfully influence, such as material expenses, consultancy and personnel expenses. Margin-effective components such as fuel costs as well as cost item that are largely uncontrollable by the management are not included.
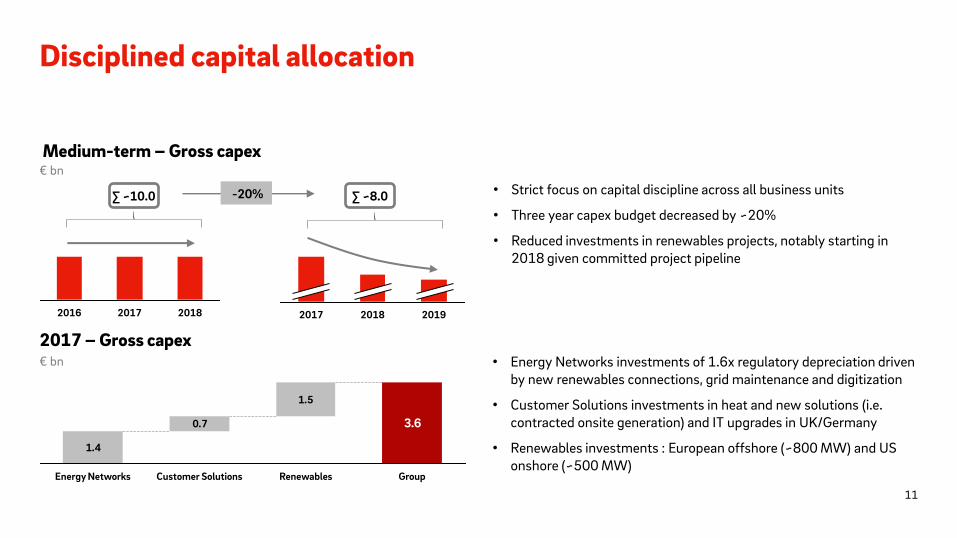
Disciplined capital allocation
Medium-term – Gross capex
• Strict focus on capital discipline across all business units
• Three year capex budget decreased by ~20%
• Reduced investments in renewables projects, notably starting in 2018 given committed project pipeline
2017 – Gross capex
2018 2017 2016
-20%
2019 2018 2017
1.4
0.7
1.5
3.6
Group Renewables Customer Solutions Energy Networks
€ bn
€ bn • Energy Networks investments of 1.6x regulatory depreciation driven by new renewables connections, grid maintenance and digitization
• Customer Solutions investments in heat and new solutions (i.e. contracted onsite generation) and IT upgrades in UK/Germany
• Renewables investments : European offshore (~800 MW) and US onshore (~500 MW)
∑ ~10.0 ∑ ~8.0
11
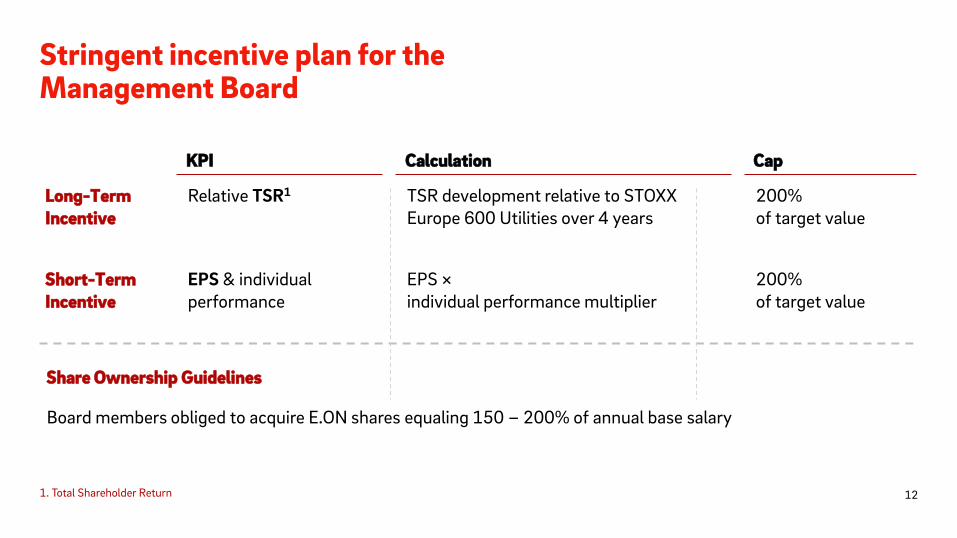
Stringent incentive plan for the Management Board
KPI
Relative TSR1
EPS & individual performance
Cap
200% of target value
200% of target value
Calculation
TSR development relative to STOXX Europe 600 Utilities over 4 years
EPS × individual performance multiplier
Long-Term Incentive
Short-Term Incentive
Share Ownership Guidelines
Board members obliged to acquire E.ON shares equaling 150 – 200% of annual base salary
1. Total Shareholder Return 12
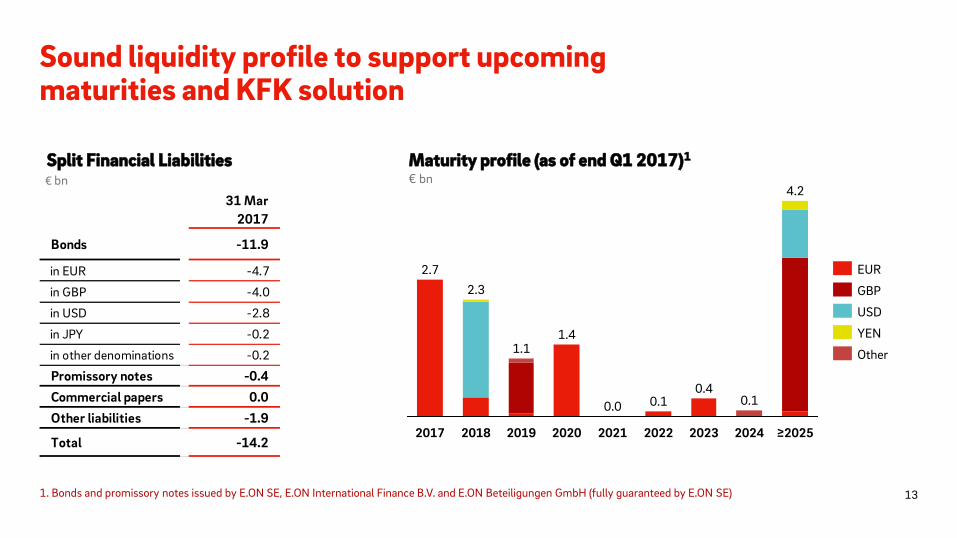
≥2025
4.2
2024
0.1
2023
0.4
2022
0.1
2021
0.0
2019
1.1
2018
2.3
2017
2.7
1.4
2020
Other
YEN
USD
GBP
EUR
Sound liquidity profile to support upcoming maturities and KFK solution
Split Financial Liabilities Maturity profile (as of end Q1 2017)1
€ bn € bn
1. Bonds and promissory notes issued by E.ON SE, E.ON International Finance B.V. and E.ON Beteiligungen GmbH (fully guaranteed by E.ON SE)
31 Mar
2017
Bonds -11.9
in EUR -4.7
in GBP -4.0
in USD -2.8
in JPY -0.2
in other denominations -0.2
Promissory notes -0.4
Commercial papers 0.0
Other liabilities -1.9
Total -14.2
13

Q1 2017 Results
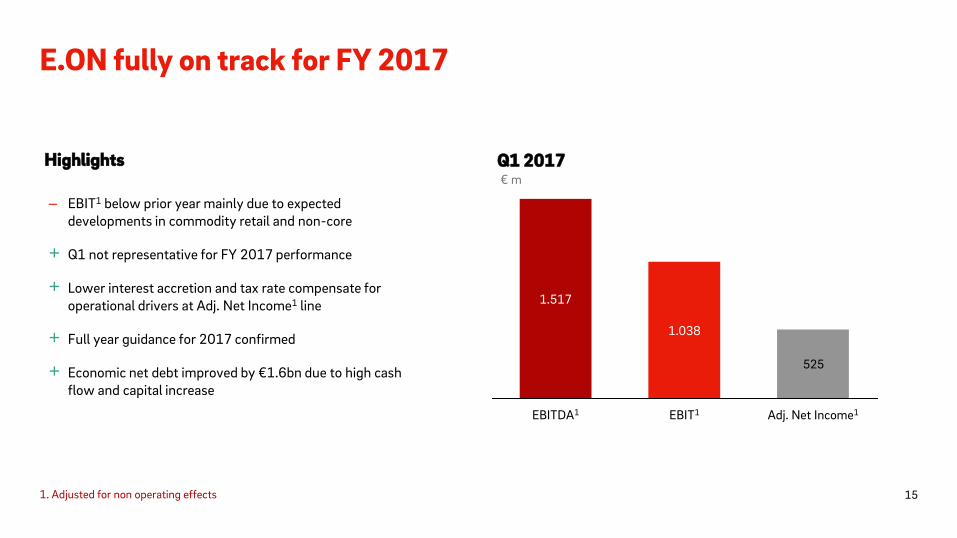
E.ON fully on track for FY 2017
– EBIT1 below prior year mainly due to expected developments in commodity retail and non-core
+ Q1 not representative for FY 2017 performance
+ Lower interest accretion and tax rate compensate for operational drivers at Adj. Net Income1 line
+ Full year guidance for 2017 confirmed
+ Economic net debt improved by €1.6bn due to high cash flow and capital increase
Highlights
525
Adj. Net Income1
1.038
EBITDA1 EBIT1
1.517
Q1 2017
1. Adjusted for non operating effects
€ m
15
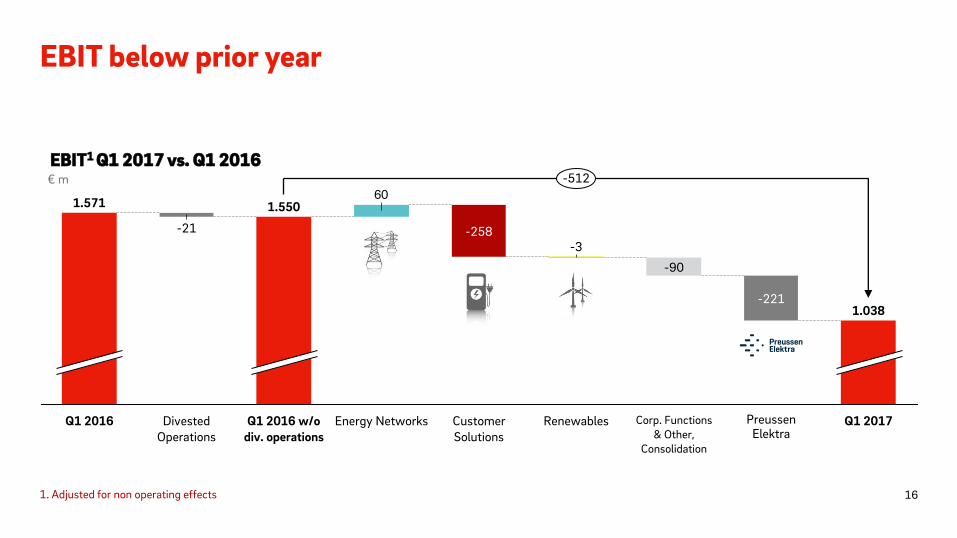
EBIT below prior year
60
-221
Corp. Functions & Other,
Consolidation
-90
Renewables
-3
Customer Solutions
-258
-512
Q1 2016 w/o div. operations
1.550
Divested Operations
-21
Energy Networks
1.571
Q1 2017
1.038
Preussen Elektra
Q1 2016
EBIT1 Q1 2017 vs. Q1 2016 € m
1. Adjusted for non operating effects 16
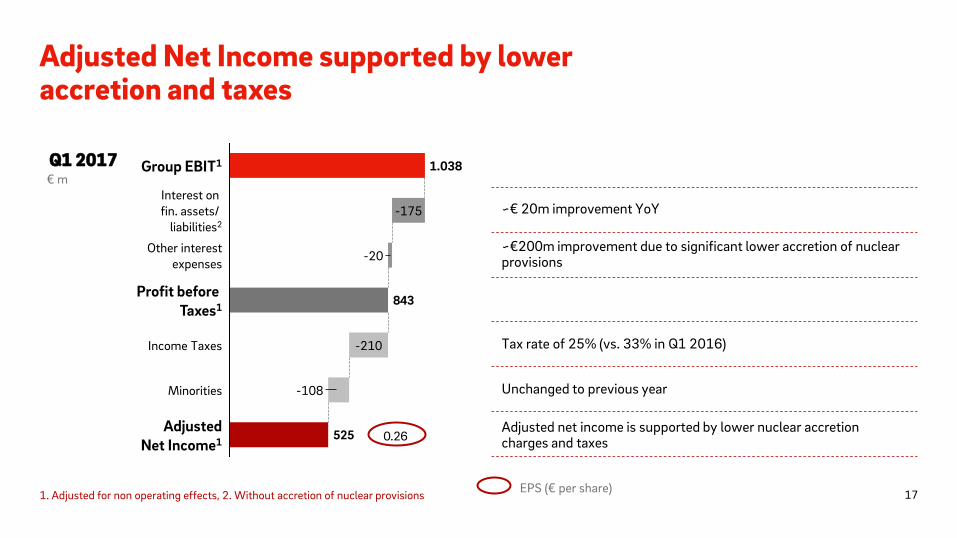
Adjusted Net Income supported by lower accretion and taxes
EPS (€ per share)
Q1 2017 € m
0.26 525
843
Adjusted Net Income1
Minorities -108
Income Taxes -210
Profit before Taxes1
Other interest expenses
-20
Interest on fin. assets/
liabilities2
-175
Group EBIT1 1.038
~€ 20m improvement YoY
~€200m improvement due to significant lower accretion of nuclear provisions
Tax rate of 25% (vs. 33% in Q1 2016)
Unchanged to previous year
Adjusted net income is supported by lower nuclear accretion charges and taxes
1. Adjusted for non operating effects, 2. Without accretion of nuclear provisions 17
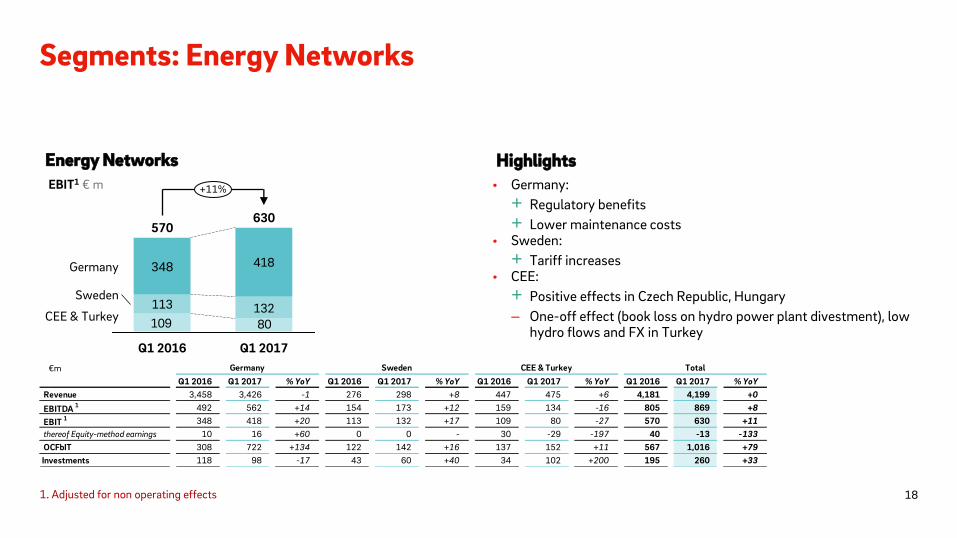
Segments: Energy Networks
• Germany:
+ Regulatory benefits
+ Lower maintenance costs • Sweden:
+ Tariff increases • CEE:
+ Positive effects in Czech Republic, Hungary
– One-off effect (book loss on hydro power plant divestment), low hydro flows and FX in Turkey
Energy Networks Highlights
113 13280109
418
+11%
CEE & Turkey
Sweden
Germany
Q1 2017
630
Q1 2016
570
348
1. Adjusted for non operating effects
EBIT1 € m
€m
Q1 2016 Q1 2017 % YoY Q1 2016 Q1 2017 % YoY Q1 2016 Q1 2017 % YoY Q1 2016 Q1 2017 % YoY
Revenue 3,458 3,426 -1 276 298 +8 447 475 +6 4,181 4,199 +0
EBITDA 1 492 562 +14 154 173 +12 159 134 -16 805 869 +8
EBIT 1 348 418 +20 113 132 +17 109 80 -27 570 630 +11
thereof Equity-method earnings 10 16 +60 0 0 - 30 -29 -197 40 -13 -133
OCFbIT 308 722 +134 122 142 +16 137 152 +11 567 1,016 +79
Investments 118 98 -17 43 60 +40 34 102 +200 195 260 +33
TotalGermany Sweden CEE & Turkey
18
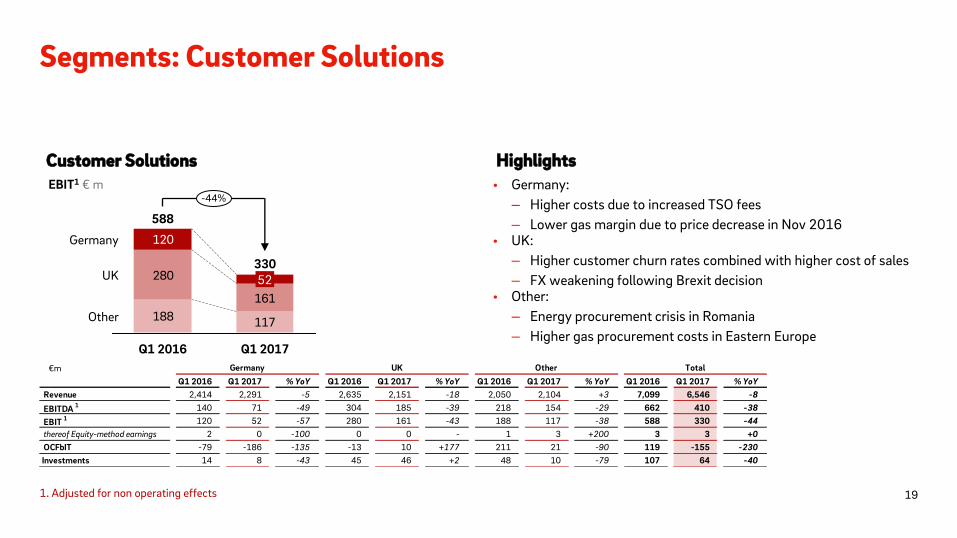
Segments: Customer Solutions
Customer Solutions Highlights
• Germany:
– Higher costs due to increased TSO fees
– Lower gas margin due to price decrease in Nov 2016 • UK:
– Higher customer churn rates combined with higher cost of sales
– FX weakening following Brexit decision • Other:
– Energy procurement crisis in Romania
– Higher gas procurement costs in Eastern Europe
188 117
280
161
120
-44%
Other
UK
Germany
Q1 2017
330 52
Q1 2016
588
EBIT1 € m
1. Adjusted for non operating effects
€m
Q1 2016 Q1 2017 % YoY Q1 2016 Q1 2017 % YoY Q1 2016 Q1 2017 % YoY Q1 2016 Q1 2017 % YoY
Revenue 2,414 2,291 -5 2,635 2,151 -18 2,050 2,104 +3 7,099 6,546 -8
EBITDA 1 140 71 -49 304 185 -39 218 154 -29 662 410 -38
EBIT 1 120 52 -57 280 161 -43 188 117 -38 588 330 -44
thereof Equity-method earnings 2 0 -100 0 0 - 1 3 +200 3 3 +0
OCFbIT -79 -186 -135 -13 10 +177 211 21 -90 119 -155 -230
Investments 14 8 -43 45 46 +2 48 10 -79 107 64 -40
TotalUKGermany Other
19
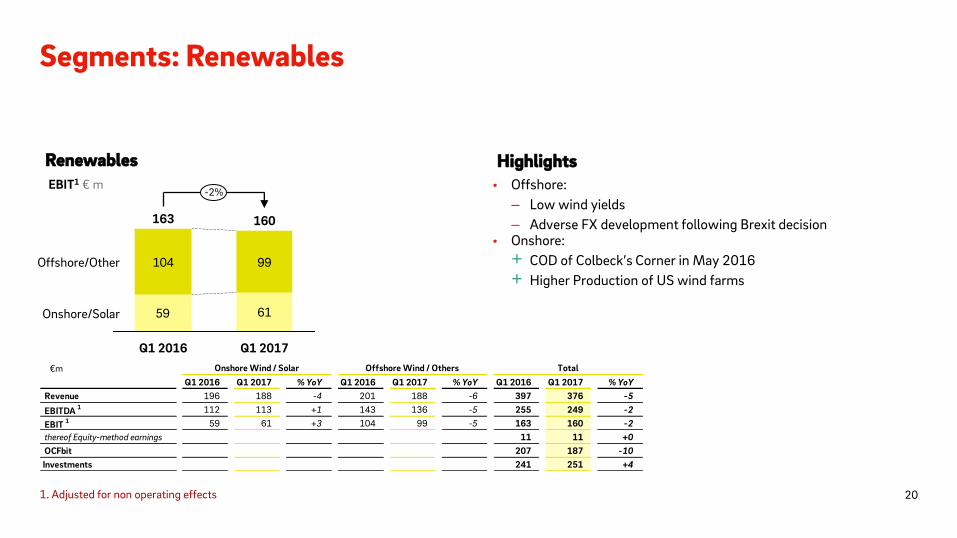
• Offshore:
– Low wind yields
– Adverse FX development following Brexit decision • Onshore:
+ COD of Colbeck’s Corner in May 2016
+ Higher Production of US wind farms
Segments: Renewables
Renewables Highlights
59 61
104 99
-2%
Offshore/Other
Onshore/Solar
Q1 2017
163 160
Q1 2016
EBIT1 € m
1. Adjusted for non operating effects
€m
Q1 2016 Q1 2017 % YoY Q1 2016 Q1 2017 % YoY Q1 2016 Q1 2017 % YoY
Revenue 196 188 -4 201 188 -6 397 376 -5
EBITDA 1 112 113 +1 143 136 -5 255 249 -2
EBIT 1 59 61 +3 104 99 -5 163 160 -2
thereof Equity-method earnings 11 11 +0
OCFbit 207 187 -10
Investments 241 251 +4
Onshore Wind / Solar Offshore Wind / Others Total
20
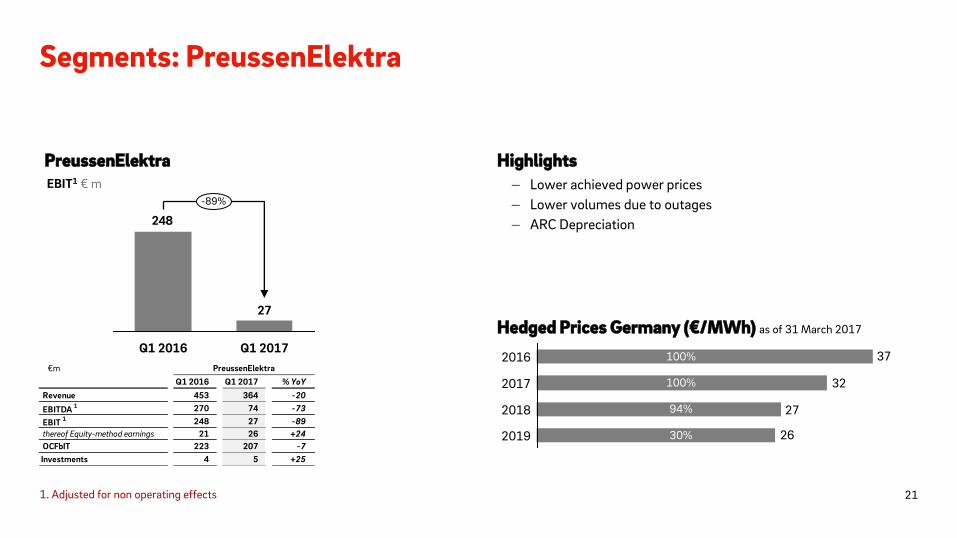
Segments: PreussenElektra
PreussenElektra Highlights
27
248
-89%
Q1 2017 Q1 2016
– Lower achieved power prices
– Lower volumes due to outages
– ARC Depreciation
Hedged Prices Germany (€/MWh) as of 31 March 2017
EBIT1 € m
1. Adjusted for non operating effects
€m
Q1 2016 Q1 2017 % YoY
Revenue 453 364 -20
EBITDA 1 270 74 -73
EBIT 1 248 27 -89
thereof Equity-method earnings 21 26 +24
OCFbIT 223 207 -7
Investments 4 5 +25
PreussenElektra
27
26
32
37
2017
2016
2019
2018
100%
94%
30%
100%
21
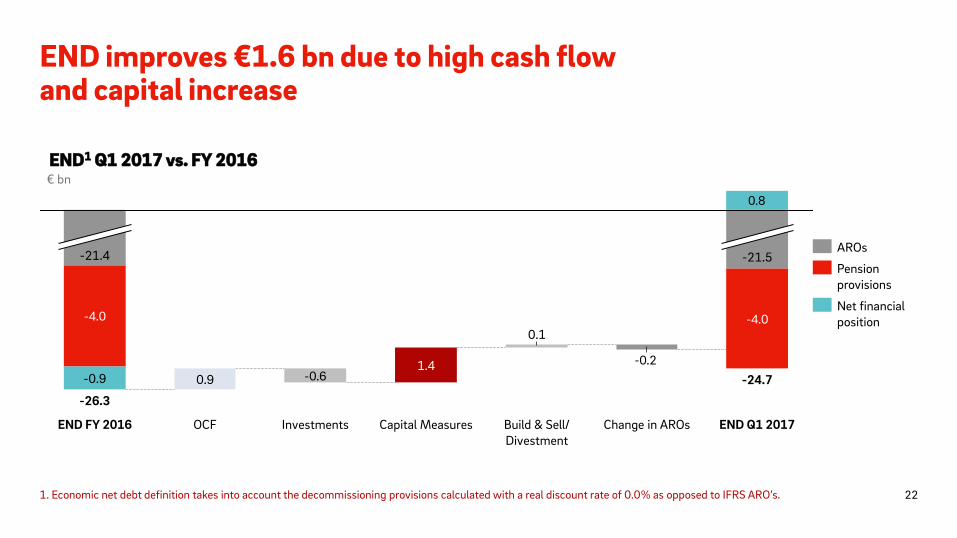
END improves €1.6 bn due to high cash flow and capital increase
-0.2-0.6
-4.0-4.0
0.8
END Q1 2017
-21.4
END FY 2016
-0.9
-26.3
-24.7
Change in AROs
-21.5
Build & Sell/ Divestment
0.1
Capital Measures
1.4
Investments
0.9
OCF
€ bn
END1 Q1 2017 vs. FY 2016
1. Economic net debt definition takes into account the decommissioning provisions calculated with a real discount rate of 0.0% as opposed to IFRS ARO’s.
AROs
Net financial position
Pension provisions
22
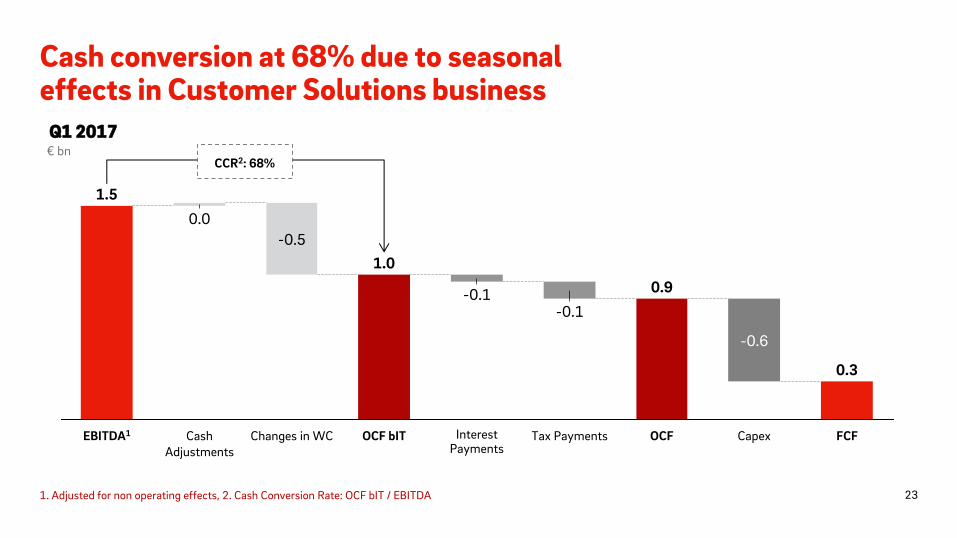
Cash conversion at 68% due to seasonal effects in Customer Solutions business
Q1 2017 € bn
Cash Adjustments
0.0
0.9
Interest Payments
Tax Payments
-0.1 -0.1
OCF bIT
1.0
Changes in WC
-0.5
OCF
-0.6
Capex
0.3
FCF EBITDA1
1.5
CCR2: 68%
1. Adjusted for non operating effects, 2. Cash Conversion Rate: OCF bIT / EBITDA 23

Segments
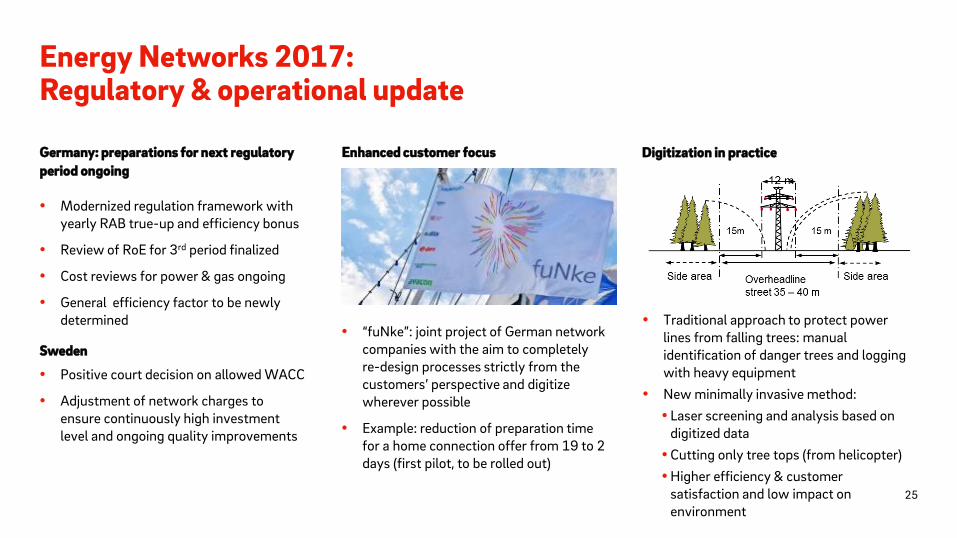
Digitization in practice
Energy Networks 2017: Regulatory & operational update
Germany: preparations for next regulatory
period ongoing
Enhanced customer focus
Modernized regulation framework with yearly RAB true-up and efficiency bonus
Review of RoE for 3rd period finalized
Cost reviews for power & gas ongoing
General efficiency factor to be newly determined
“fuNke”: joint project of German network companies with the aim to completely re-design processes strictly from the customers’ perspective and digitize wherever possible
Example: reduction of preparation time for a home connection offer from 19 to 2 days (first pilot, to be rolled out)
Traditional approach to protect power lines from falling trees: manual identification of danger trees and logging with heavy equipment
New minimally invasive method:
Laser screening and analysis based on digitized data
Cutting only tree tops (from helicopter)
Higher efficiency & customer satisfaction and low impact on environment
25
Sweden
Positive court decision on allowed WACC
Adjustment of network charges to ensure continuously high investment level and ongoing quality improvements
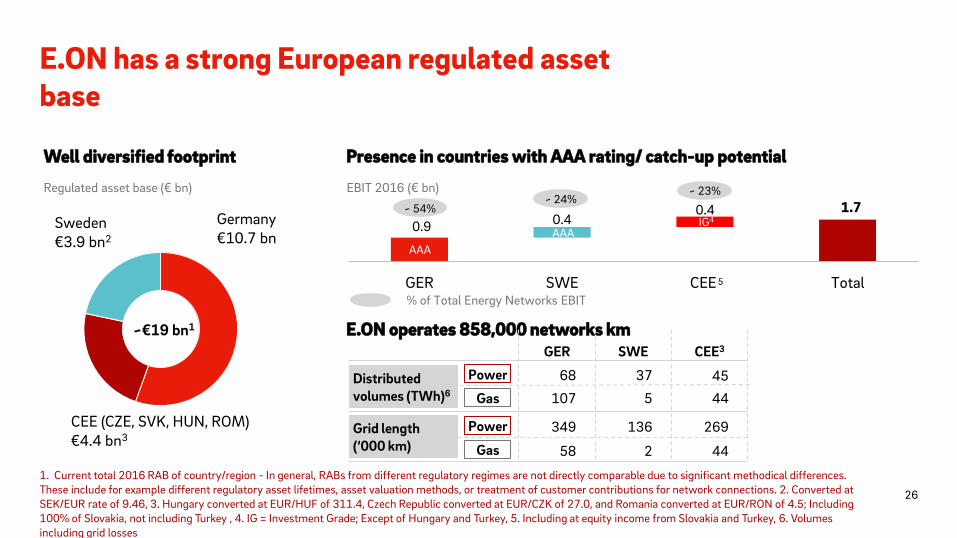
E.ON has a strong European regulated asset base
0.9 0.4 0.4
GER SWE CEE Total
IG4
E.ON operates 858,000 networks km
Presence in countries with AAA rating/ catch-up potential
CEE (CZE, SVK, HUN, ROM)
€4.4 bn3
Sweden €3.9 bn2
Germany €10.7 bn
~€19 bn1
EBIT 2016 (€ bn)
1.7 ~ 54% ~ 24%
~ 23%
% of Total Energy Networks EBIT
AAA
Well diversified footprint
5
Regulated asset base (€ bn)
68
107
349
58
Power
Gas
Power
Gas
37
5
136
2
269
44
45
44
GER SWE
Distributed volumes (TWh)6
Grid length (‘000 km)
CEE3
1. Current total 2016 RAB of country/region - In general, RABs from different regulatory regimes are not directly comparable due to significant methodical differences. These include for example different regulatory asset lifetimes, asset valuation methods, or treatment of customer contributions for network connections. 2. Converted at SEK/EUR rate of 9.46, 3. Hungary converted at EUR/HUF of 311.4, Czech Republic converted at EUR/CZK of 27.0, and Romania converted at EUR/RON of 4.5; Including 100% of Slovakia, not including Turkey , 4. IG = Investment Grade; Except of Hungary and Turkey, 5. Including at equity income from Slovakia and Turkey, 6. Volumes including grid losses
26
AAA
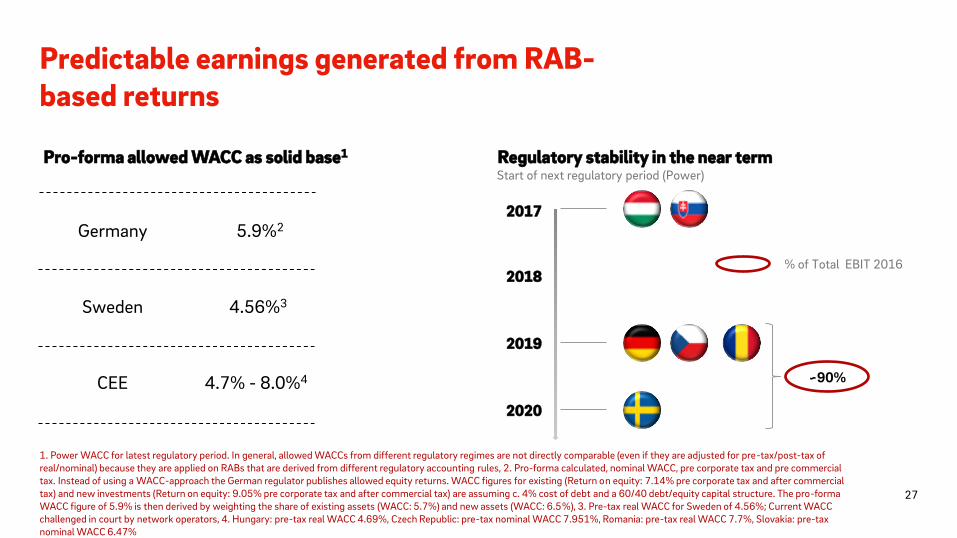
Predictable earnings generated from RAB-based returns
Start of next regulatory period (Power)
2017
2019
2018
2020
Germany 5.9%2
Sweden 4.56%3
CEE 4.7% - 8.0%4
% of Total EBIT 2016
Pro-forma allowed WACC as solid base1 Regulatory stability in the near term
~90%
1. Power WACC for latest regulatory period. In general, allowed WACCs from different regulatory regimes are not directly comparable (even if they are adjusted for pre-tax/post-tax of real/nominal) because they are applied on RABs that are derived from different regulatory accounting rules, 2. Pro-forma calculated, nominal WACC, pre corporate tax and pre commercial tax. Instead of using a WACC-approach the German regulator publishes allowed equity returns. WACC figures for existing (Return on equity: 7.14% pre corporate tax and after commercial tax) and new investments (Return on equity: 9.05% pre corporate tax and after commercial tax) are assuming c. 4% cost of debt and a 60/40 debt/equity capital structure. The pro-forma WACC figure of 5.9% is then derived by weighting the share of existing assets (WACC: 5.7%) and new assets (WACC: 6.5%), 3. Pre-tax real WACC for Sweden of 4.56%; Current WACC challenged in court by network operators, 4. Hungary: pre-tax real WACC 4.69%, Czech Republic: pre-tax nominal WACC 7.951%, Romania: pre-tax real WACC 7.7%, Slovakia: pre-tax nominal WACC 6.47%
27
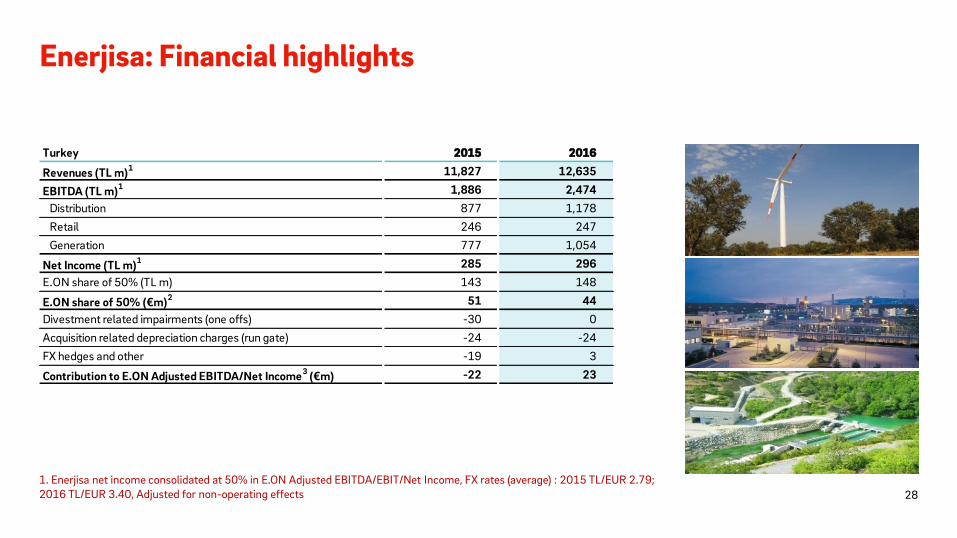
Enerjisa: Financial highlights
1. Enerjisa net income consolidated at 50% in E.ON Adjusted EBITDA/EBIT/Net Income, FX rates (average) : 2015 TL/EUR 2.79; 2016 TL/EUR 3.40, Adjusted for non-operating effects
Turkey 2015 2016
Revenues (TL m)1 11,827 12,635
EBITDA (TL m)1 1,886 2,474
Distribution 877 1,178
Retail 246 247
Generation 777 1,054
Net Income (TL m)1 285 296
E.ON share of 50% (TL m) 143 148
E.ON share of 50% (€m)2 51 44
Divestment related impairments (one offs) -30 0
Acquisition related depreciation charges (run gate) -24 -24
FX hedges and other -19 3
Contribution to E.ON Adjusted EBITDA/Net Income3 (€m) -22 23
28
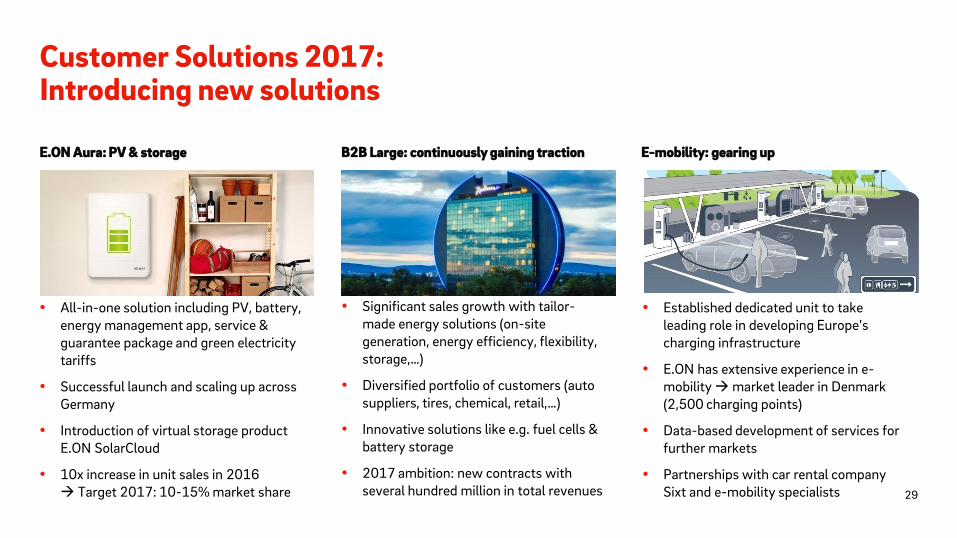
Customer Solutions 2017: Introducing new solutions
E.ON Aura: PV & storage B2B Large: continuously gaining traction
All-in-one solution including PV, battery, energy management app, service & guarantee package and green electricity tariffs
Successful launch and scaling up across Germany
Introduction of virtual storage product E.ON SolarCloud
10x increase in unit sales in 2016 Target 2017: 10-15% market share
E-mobility: gearing up
Significant sales growth with tailor-made energy solutions (on-site generation, energy efficiency, flexibility, storage,…)
Diversified portfolio of customers (auto suppliers, tires, chemical, retail,…)
Innovative solutions like e.g. fuel cells & battery storage
2017 ambition: new contracts with several hundred million in total revenues
Established dedicated unit to take leading role in developing Europe’s charging infrastructure
E.ON has extensive experience in e-mobility market leader in Denmark (2,500 charging points)
Data-based development of services for further markets
Partnerships with car rental company Sixt and e-mobility specialists 29
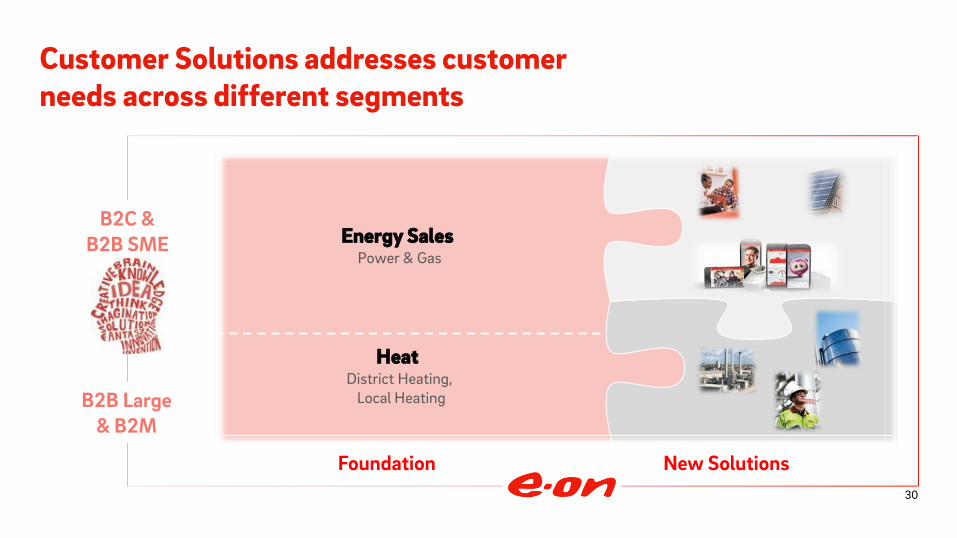
Customer Solutions addresses customer needs across different segments
Energy Sales Power & Gas
Heat District Heating,
Local Heating
Foundation New Solutions
B2B Large & B2M
B2C & B2B SME
30
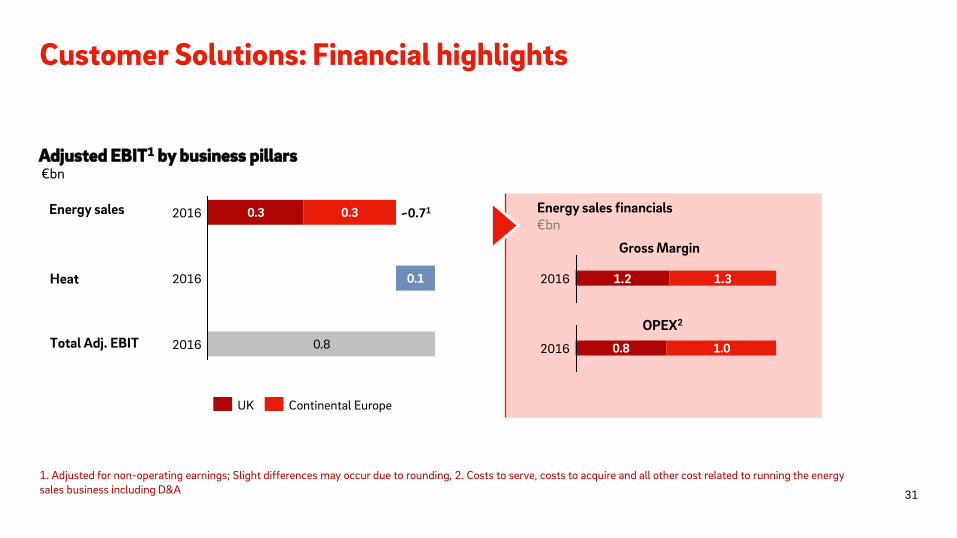
Customer Solutions: Financial highlights
Energy sales
Adjusted EBIT1 by business pillars
Heat
0.3
0.8
0.3
0.1
2016
2016
2016 ~0.71
Total Adj. EBIT
Energy sales financials
1.2 1.3 2016
Gross Margin
0.8 1.02016
OPEX2
Continental Europe UK
€bn
€bn
1. Adjusted for non-operating earnings; Slight differences may occur due to rounding, 2. Costs to serve, costs to acquire and all other cost related to running the energy sales business including D&A 31
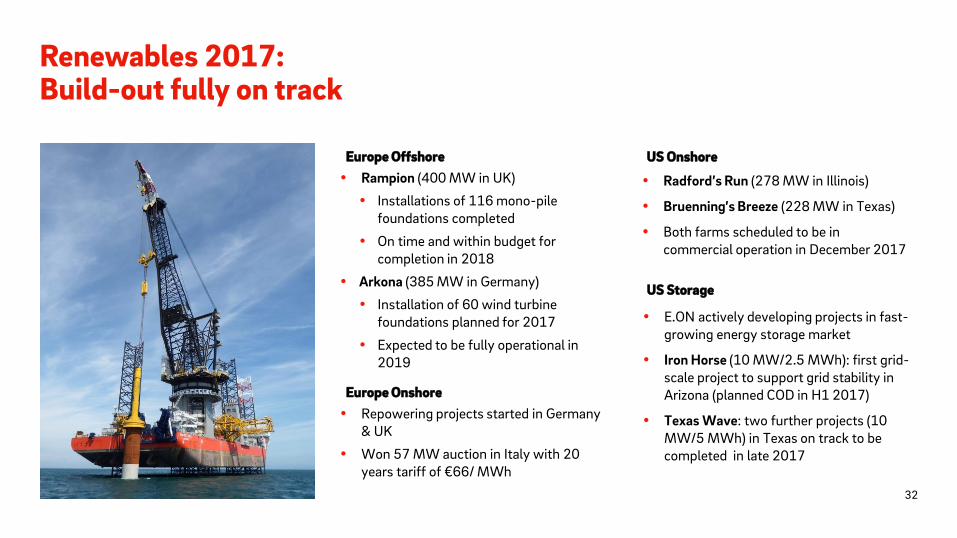
Renewables 2017: Build-out fully on track
Rampion (400 MW in UK)
Installations of 116 mono-pile foundations completed
On time and within budget for completion in 2018
Arkona (385 MW in Germany)
Installation of 60 wind turbine foundations planned for 2017
Expected to be fully operational in 2019
US Onshore
US Storage
Radford’s Run (278 MW in Illinois)
Bruenning’s Breeze (228 MW in Texas)
Both farms scheduled to be in commercial operation in December 2017
E.ON actively developing projects in fast-growing energy storage market
Iron Horse (10 MW/2.5 MWh): first grid-scale project to support grid stability in Arizona (planned COD in H1 2017)
Texas Wave: two further projects (10 MW/5 MWh) in Texas on track to be completed in late 2017
Europe Offshore
Repowering projects started in Germany & UK
Won 57 MW auction in Italy with 20 years tariff of €66/ MWh
Europe Onshore
32
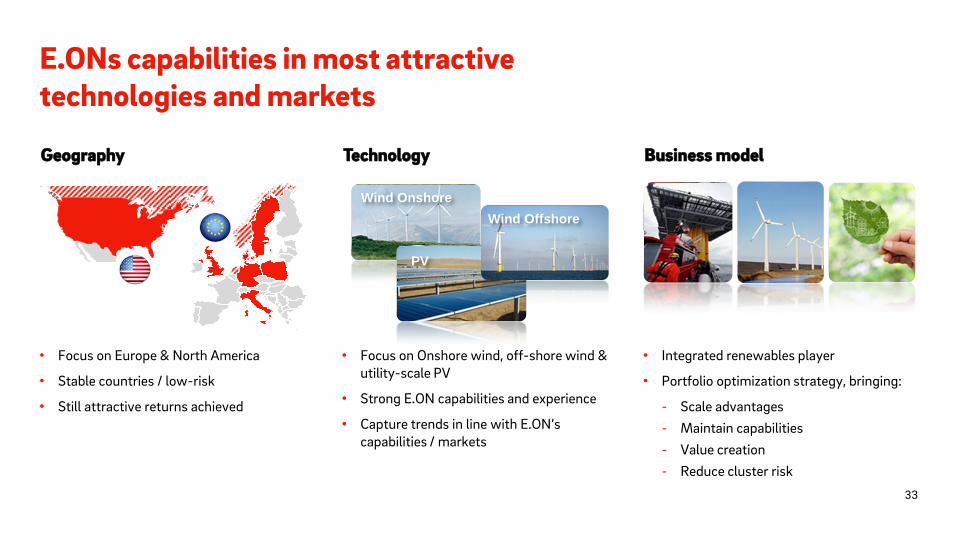
E.ONs capabilities in most attractive technologies and markets
Technology Geography Business model
• Focus on Onshore wind, off-shore wind & utility-scale PV
• Strong E.ON capabilities and experience
• Capture trends in line with E.ON’s capabilities / markets
Wind Onshore
PV
Wind Offshore
• Focus on Europe & North America
• Stable countries / low-risk
• Still attractive returns achieved
• Integrated renewables player
• Portfolio optimization strategy, bringing:
- Scale advantages
- Maintain capabilities
- Value creation
- Reduce cluster risk
1
33
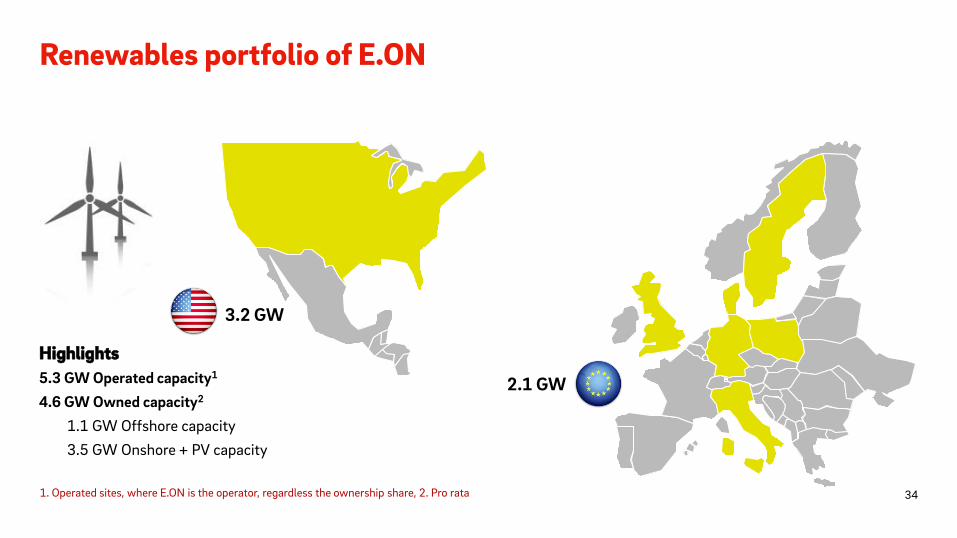
Highlights
5.3 GW Operated capacity1
4.6 GW Owned capacity2
1.1 GW Offshore capacity
3.5 GW Onshore + PV capacity
Renewables portfolio of E.ON
1. Operated sites, where E.ON is the operator, regardless the ownership share, 2. Pro rata
2.1 GW
3.2 GW
34

PreussenElektra: Asset overview
Decommissioning Shut down
Active and operated by PreussenElektra
Active and minority share PreussenElektra
Brunsbüttel Brokdorf
Stade
Unterweser Krümmel
Hannover Emsland
Grohnde
Würgassen
Grafenrheinfeld
Isar 1/2
Gundremmingen A/B/C
Geographic presence in Germany Overview nuclear plants
1. Atomgesetz, 2. Start-up year 1971, transfer to Preußische Elektrizitäts-Aktiengesellschaft in 1975 35
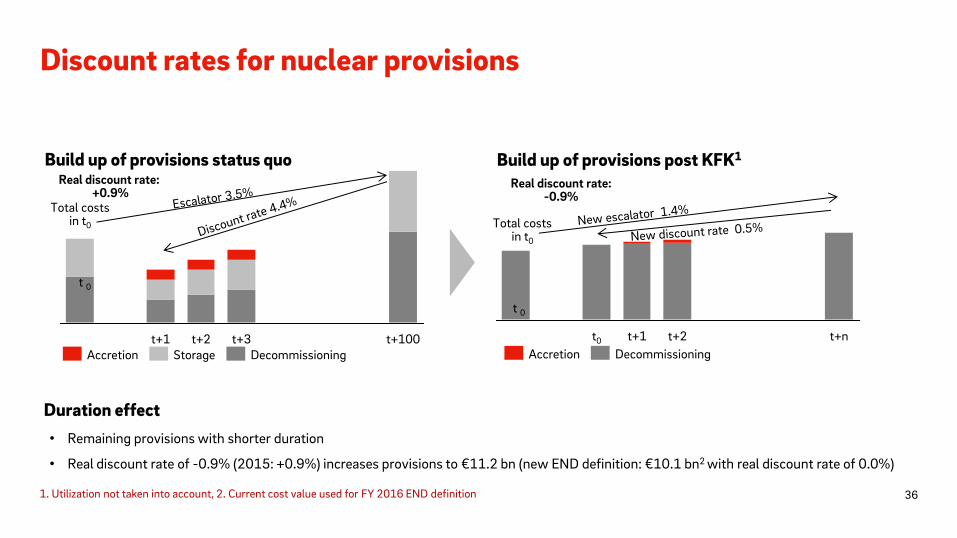
Discount rates for nuclear provisions
Build up of provisions status quo
t+3 t+100 t+2 t+1 Storage Accretion Decommissioning
Real discount rate: +0.9%
Build up of provisions post KFK1
t+2 t+1 t+n t0
Accretion Decommissioning
Real discount rate: -0.9%
• Remaining provisions with shorter duration
• Real discount rate of -0.9% (2015: +0.9%) increases provisions to €11.2 bn (new END definition: €10.1 bn2 with real discount rate of 0.0%)
Duration effect
Total costs in t0 Total costs
in t0
t 0
t 0
1. Utilization not taken into account, 2. Current cost value used for FY 2016 END definition 36

E.ON Investor Relations contacts
T +49 (201) 184 2806 [email protected]
Alexander Karnick T+49 (201) 184 28 38
Head of Investor Relations [email protected]
Dr. Stephan Schönefuß T +49 (201) 184 28 22
Manager Investor Relations [email protected]
Martina Burger T +49 (201) 184 28 07
Manager Investor Relations [email protected]
Conny Ripphahn T +49 (201) 184 28 34
Manager Investor Relations [email protected]
37
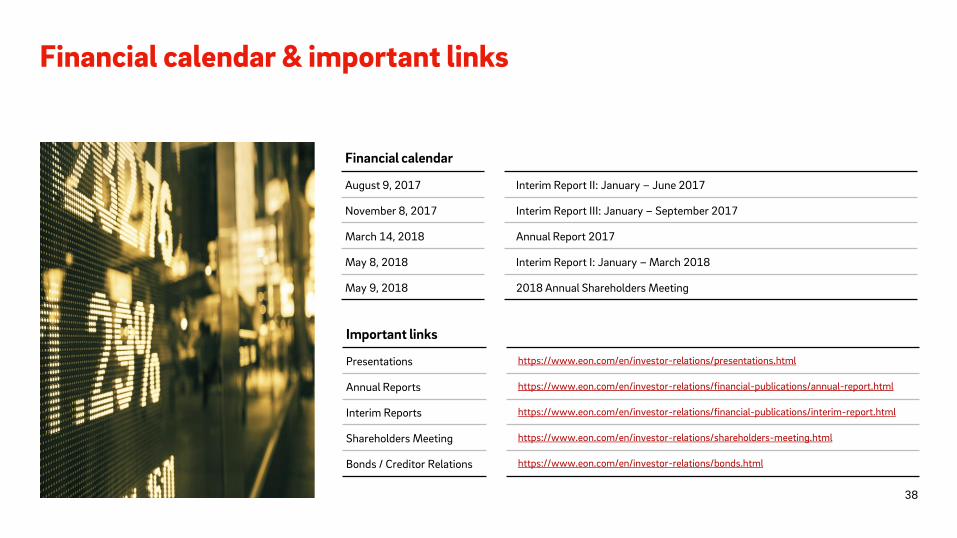
Financial calendar & important links
Financial calendar
August 9, 2017 Interim Report II: January – June 2017
November 8, 2017 Interim Report III: January – September 2017
March 14, 2018 Annual Report 2017
May 8, 2018 Interim Report I: January – March 2018
May 9, 2018 2018 Annual Shareholders Meeting
Important links
Presentations https://www.eon.com/en/investor-relations/presentations.html
Annual Reports https://www.eon.com/en/investor-relations/financial-publications/annual-report.html
Interim Reports https://www.eon.com/en/investor-relations/financial-publications/interim-report.html
Shareholders Meeting https://www.eon.com/en/investor-relations/shareholders-meeting.html
Bonds / Creditor Relations https://www.eon.com/en/investor-relations/bonds.html
38
This presentation contains information relating to E.ON Group ("E.ON") that must not be relied upon for any purpose and may not be redistributed, reproduced, published, or passed on to any other person or used in whole or in part for any other purpose. By accessing this document you agree to abide by the limitations set out in this document as well as any limitations set out on the webpage of E.ON SE on which this presentation has been made available.
This document is being presented solely for informational purposes. It should not be treated as giving investment advice, nor is it intended to provide the basis for any evaluation or any securities and should not be considered as a recommendation that any person should purchase any shares or other securities.
This presentation may contain forward-looking statements based on current assumptions and forecasts made by E.ON management and other information currently available to E.ON. Various known and unknown risks, uncertainties and other factors could lead to material differences between the actual future results, financial situation, development or performance of the company and the estimates given here. E.ON does not intend, and does not assume any liability whatsoever, to update these forward-looking statements or to conform them to future events or developments.
Neither E.ON nor any respective agents of E.ON undertake any obligation to provide the recipient with access to any additional information or to update this presentation or any information or to correct any inaccuracies in any such information.
Certain numerical data, financial information and market data (including percentages) in this presentation have been rounded according to established commercial standards. As a result, the aggregate amounts (sum totals or interim totals or differences or if numbers are put in relation) in this presentation may not correspond in all cases to the amounts contained in the underlying (unrounded) figures appearing in the consolidated financial statements. Furthermore, in tables and charts, these rounded figures may not add up exactly to the totals contained in the respective tables and charts.
Disclaimer
39


![Series GW control valves - SMS TORK...Valve Travel [%] 10 20 30 40 50 60 70 80 90 100 FL 0.9 0.9 0.9 0.9 0.9 0.9 0.9 0.9 0.9 0.9 Valve Size Orifice Dia. Travel Rated Cv Inch mm Sign](https://img.pdfslide.net/doc/110x75/5f4fb482064cf52aed0d638f/series-gw-control-valves-sms-tork-valve-travel-10-20-30-40-50-60-70-80.jpg)