Embed Size (px)
Citation preview
537-1
EPA Document #: EPA/600/R-08/092 METHOD 537. DETERMINATION OF SELECTED PERFLUORINAT ED ALKYL
ACIDS IN DRINKING WATER BY SOLID PHASE EXTRACTION AND LIQUID CHROMATOGRAPHY/TANDEM MASS SPECTROMETRY (LC/MS/MS)
Version 1.1 September 2009
J.A. Shoemaker US EPA, Office of Research and Development, National Exposure
Research Laboratory P.E. Grimmett US EPA, Office of Research and Development, National Exposure
Research Laboratory B.K. Boutin The National Council on Aging, Senior Environmental Employment
Program
NATIONAL EXPOSURE RESEARCH LABORATORY OFFICE OF RESEARCH AND DEVELOPMENT
U. S. ENVIRONMENTAL PROTECTION AGENCY CINCINNATI, OHIO 45268
537-2
METHOD 537
DETERMINATION OF SELECTED PERFLUORINATED ALKYL ACID S IN DRINKING WATER BY SOLID PHASE EXTRACTION AND LIQUID
CHROMATOGRAPHY/TANDEM MASS SPECTROMETRY (LC/MS/MS) 1. SCOPE AND APPLICATION
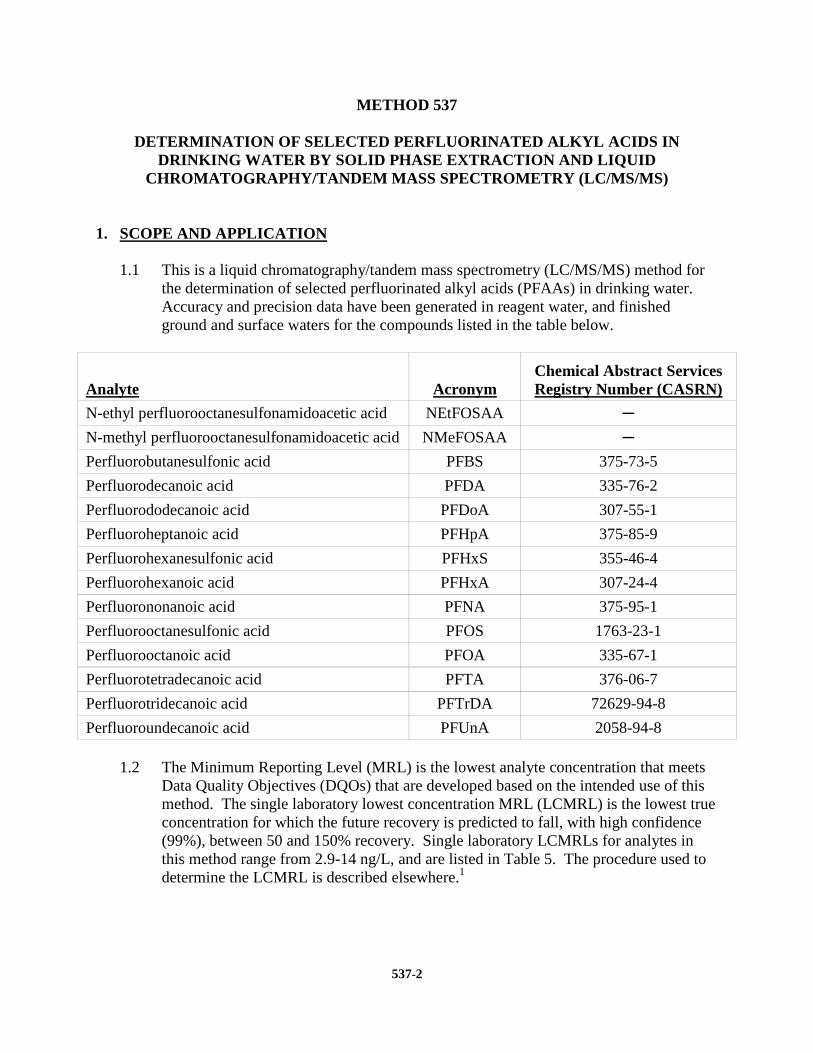
1.1 This is a liquid chromatography/tandem mass spectrometry (LC/MS/MS) method for the determination of selected perfluorinated alkyl acids (PFAAs) in drinking water. Accuracy and precision data have been generated in reagent water, and finished ground and surface waters for the compounds listed in the table below.
Analyte
Acronym Chemical Abstract Services Registry Number (CASRN)
N-ethyl perfluorooctanesulfonamidoacetic acid NEtFOSAA ─
N-methyl perfluorooctanesulfonamidoacetic acid NMeFOSAA ─
Perfluorobutanesulfonic acid PFBS 375-73-5
Perfluorodecanoic acid PFDA 335-76-2
Perfluorododecanoic acid PFDoA 307-55-1
Perfluoroheptanoic acid PFHpA 375-85-9
Perfluorohexanesulfonic acid PFHxS 355-46-4
Perfluorohexanoic acid PFHxA 307-24-4
Perfluorononanoic acid PFNA 375-95-1
Perfluorooctanesulfonic acid PFOS 1763-23-1
Perfluorooctanoic acid PFOA 335-67-1
Perfluorotetradecanoic acid PFTA 376-06-7
Perfluorotridecanoic acid PFTrDA 72629-94-8
Perfluoroundecanoic acid PFUnA 2058-94-8 1.2 The Minimum Reporting Level (MRL) is the lowest analyte concentration that meets
Data Quality Objectives (DQOs) that are developed based on the intended use of this method. The single laboratory lowest concentration MRL (LCMRL) is the lowest true concentration for which the future recovery is predicted to fall, with high confidence (99%), between 50 and 150% recovery. Single laboratory LCMRLs for analytes in this method range from 2.9-14 ng/L, and are listed in Table 5. The procedure used to determine the LCMRL is described elsewhere.1
537-3
1.3 Laboratories using this method will not be required to determine the LCMRL for this method, but will need to demonstrate that their laboratory MRL for this method meets the requirements described in Section 9.2.5.
1.4 Determining the Detection Limit (DL) for analytes in this method is optional (Sect.
9.2.7). Detection limit is defined as the statistically calculated minimum concentration that can be measured with 99% confidence that the reported value is greater than zero.2 The DL is compound dependent and is dependent on extraction efficiency, sample matrix, fortification concentration, and instrument performance.
1.5 This method is intended for use by analysts skilled in solid phase extractions, the
operation of LC/MS/MS instruments, and the interpretation of the associated data.
1.6 METHOD FLEXIBILITY – In recognition of technological advances in analytical systems and techniques, the laboratory is permitted to modify the evaporation technique, separation technique, LC column, mobile phase composition, LC conditions and MS and MS/MS conditions (Sect. 6.12, 9.1.1, 10.2, and 12.1). Changes may not be made to sample collection and preservation (Sect. 8), the sample extraction steps (Sect. 11), or to the quality control requirements (Sect. 9). Method modifications should be considered only to improve method performance. Modifications that are introduced in the interest of reducing cost or sample processing time, but result in poorer method performance, should not be used. Analytes must be adequately resolved chromatographically in order to permit the mass spectrometer to dwell on a minimum number of compounds eluting within a retention time window. Instrumental sensitivity (or signal-to-noise) will decrease if too many compounds are permitted to elute within a retention time window. In all cases where method modifications are proposed, the analyst must perform the procedures outlined in the initial demonstration of capability (IDC, Sect. 9.2), verify that all Quality Control (QC) acceptance criteria in this method (Sect. 9) are met, and that acceptable method performance can be verified in a real sample matrix (Sect. 9.3.6).
NOTE: The above method flexibility section is intended as an abbreviated summation
of method flexibility. Sections 4-12 provide detailed information of specific portions of the method that may be modified. If there is any perceived conflict between the general method flexibility statement in Section 1.6 and specific information in Sections 4-12, Sections 4-12 supersede Section 1.6.
2. SUMMARY OF METHOD
2.1 A 250-mL water sample is fortified with surrogates and passed through a solid phase extraction (SPE) cartridge containing polystyrenedivinylbenzene (SDVB) to extract the method analytes and surrogates. The compounds are eluted from the solid phase with a small amount of methanol. The extract is concentrated to dryness with nitrogen in a heated water bath, and then adjusted to a 1-mL volume with 96:4% (vol/vol) methanol:water after adding the IS(s). A 10-µL injection is made into an LC equipped with a C18 column that is interfaced to an MS/MS. The analytes are separated and
537-4
identified by comparing the acquired mass spectra and retention times to reference spectra and retention times for calibration standards acquired under identical LC/MS/MS conditions. The concentration of each analyte is determined by using the internal standard technique. Surrogate analytes are added to all Field and QC Samples to monitor the extraction efficiency of the method analytes.
3. DEFINITIONS
3.1 ANALYSIS BATCH – A set of samples that is analyzed on the same instrument during a 24-hour period, including no more than 20 Field Samples, that begins and ends with the analysis of the appropriate Continuing Calibration Check (CCC) standards. Additional CCCs may be required depending on the length of the analysis batch and/or the number of Field Samples.
3.2 CALIBRATION STANDARD (CAL) – A solution prepared from the primary dilution
standard solution and/or stock standard solution, internal standard(s), and the surrogate(s). The CAL solutions are used to calibrate the instrument response with respect to analyte concentration.
3.3 COLLISIONALLY ACTIVATED DISSOCIATION (CAD) – The process of
converting the precursor ion’s translational energy into internal energy by collisions with neutral gas molecules to bring about dissociation into product ions.
3.4 CONTINUING CALIBRATION CHECK (CCC) – A calibration standard containing
the method analytes, internal standard(s) and surrogate(s). The CCC is analyzed periodically to verify the accuracy of the existing calibration for those analytes.
3.5 DETECTION LIMIT (DL) – The minimum concentration of an analyte that can be
identified, measured, and reported with 99% confidence that the analyte concentration is greater than zero. This is a statistical determination of precision (Sect. 9.2.7), and accurate quantitation is not expected at this level.2
3.6 EXTRACTION BATCH – A set of up to 20 Field Samples (not including QC
samples) extracted together by the same person(s) during a work day using the same lot of SPE devices, solvents, surrogate, internal standard and fortifying solutions. Required QC samples include Laboratory Reagent Blank, Laboratory Fortified Blank, Laboratory Fortified Sample Matrix, and either a Field Duplicate or Laboratory Fortified Sample Matrix Duplicate.
3.7 FIELD DUPLICATES (FD1 and FD2) – Two separate samples collected at the same
time and place under identical circumstances, and treated exactly the same throughout field and laboratory procedures. Analyses of FD1 and FD2 give a measure of the precision associated with sample collection, preservation, and storage, as well as laboratory procedures.
537-5
3.8 FIELD REAGENT BLANK (FRB) – An aliquot of reagent water that is placed in a sample container in the laboratory and treated as a sample in all respects, including shipment to the sampling site, exposure to sampling site conditions, storage, preservation, and all analytical procedures. The purpose of the FRB is to determine if method analytes or other interferences are present in the field environment.
3.9 INTERNAL STANDARD (IS) – A pure chemical added to an extract or standard
solution in a known amount(s) and used to measure the relative response of other method analytes and surrogates that are components of the same solution. The internal standard must be a chemical that is structurally similar to the method analytes, has no potential to be present in water samples, and is not a method analyte.
3.10 LABORATORY FORTIFIED BLANK (LFB) – A volume of reagent water or other
blank matrix to which known quantities of the method analytes and all the preservation compounds are added in the laboratory. The LFB is analyzed exactly like a sample, and its purpose is to determine whether the methodology is in control, and whether the laboratory is capable of making accurate and precise measurements.
3.11 LABORATORY FORTIFIED SAMPLE MATRIX (LFSM) – A preserved field
sample to which known quantities of the method analytes are added in the laboratory. The LFSM is processed and analyzed exactly like a sample, and its purpose is to determine whether the sample matrix contributes bias to the analytical results. The background concentrations of the analytes in the sample matrix must be determined in a separate sample extraction and the measured values in the LFSM corrected for background concentrations.
3.12 LABORATORY FORTIFIED SAMPLE MATRIX DUPLICATE (LFSMD) – A
duplicate of the Field Sample used to prepare the LFSM. The LFSMD is fortified, extracted, and analyzed identically to the LFSM. The LFSMD is used instead of the Field Duplicate to assess method precision when the occurrence of method analytes is low.
3.13 LABORATORY REAGENT BLANK (LRB) – An aliquot of reagent water or other
blank matrix that is treated exactly as a sample including exposure to all glassware, equipment, solvents and reagents, sample preservatives, internal standard, and surrogates that are used in the analysis batch. The LRB is used to determine if method analytes or other interferences are present in the laboratory environment, the reagents, or the apparatus.
3.14 LOWEST CONCENTRATION MINIMUM REPORTING LEVEL (LCMRL) – The
single laboratory LCMRL is the lowest true concentration for which a future recovery is expected, with 99% confidence, to be between 50 and 150% recovery.1
3.15 MATERIAL SAFETY DATA SHEET (MSDS) – Written information provided by
vendors concerning a chemical’s toxicity, health hazards, physical properties, fire, and reactivity data including storage, spill, and handling precautions.
537-6
3.16 MINIMUM REPORTING LEVEL (MRL) – The minimum concentration that can be
reported as a quantitated value for a method analyte in a sample following analysis. This defined concentration can be no lower than the concentration of the lowest calibration standard for that analyte and can only be used if acceptable QC criteria for this standard are met. A procedure for verifying a laboratory’s MRL is provided in Section 9.2.5.
3.17 PRECURSOR ION – For the purpose of this method, the precursor ion is the
deprotonated molecule ([M-H]-) of the method analyte. In MS/MS, the precursor ion is mass selected and fragmented by collisionally activated dissociation to produce distinctive product ions of smaller m/z.
3.18 PRIMARY DILUTION STANDARD (PDS) SOLUTION – A solution containing the
analytes prepared in the laboratory from stock standard solutions and diluted as needed to prepare calibration solutions and other needed analyte solutions.
3.19 PRODUCT ION – For the purpose of this method, a product ion is one of the fragment
ions produced in MS/MS by collisionally activated dissociation of the precursor ion. 3.20 QUALITY CONTROL SAMPLE (QCS) – A solution of method analytes of known
concentrations that is obtained from a source external to the laboratory and different from the source of calibration standards. The second source SSS is used to fortify the QCS at a known concentration. The QCS is used to check calibration standard integrity.
3.21 STOCK STANDARD SOLUTION (SSS) – A concentrated solution containing one or
more method analytes prepared in the laboratory using assayed reference materials or purchased from a reputable commercial source.
3.22 SURROGATE ANALYTE (SUR) – A pure chemical which chemically resembles
method analytes and is extremely unlikely to be found in any sample. This chemical is added to a sample aliquot in known amount(s) before processing and is measured with the same procedures used to measure other method analytes. The purpose of the SUR is to monitor method performance with each sample.
4. INTERFERENCES
4.1 All glassware must be meticulously cleaned. Wash glassware with detergent and tap
water, rinse with tap water, followed by a reagent water rinse. Non-volumetric glassware can be heated in a muffle furnace at 400 °C for 2 h or solvent rinsed. Volumetric glassware should be solvent rinsed and not be heated in an oven above 120 °C. Store clean glassware inverted or capped. Do not cover with aluminum foil because PFAAs can be potentially transferred from the aluminum foil to the glassware.
537-7
NOTE: PFAA standards, extracts and samples should not come in contact with any glass containers or pipettes as these analytes can potentially adsorb to glass surfaces. PFAA analyte, IS and SUR standards commercially purchased in glass ampoules are acceptable; however, all subsequent transfers or dilutions performed by the analyst must be prepared and stored in polypropylene containers.
4.2 Method interferences may be caused by contaminants in solvents, reagents (including
reagent water), sample bottles and caps, and other sample processing hardware that lead to discrete artifacts and/or elevated baselines in the chromatograms. The method analytes in this method can also be found in many common laboratory supplies and equipment, such as PTFE (polytetrafluoroethylene) products, LC solvent lines, methanol, aluminum foil, SPE sample transfer lines, etc.3 All items such as these must be routinely demonstrated to be free from interferences (less than 1/3 the MRL for each method analyte) under the conditions of the analysis by analyzing laboratory reagent blanks as described in Section 9.3.1. Subtracting blank values from sample results is not permitted.
4.3 Matrix interferences may be caused by contaminants that are co-extracted from the
sample. The extent of matrix interferences will vary considerably from source to source, depending upon the nature of the water. Humic and/or fulvic material can be co-extracted during SPE and high levels can cause enhancement and/or suppression in the electrospray ionization source or low recoveries on the SPE sorbent.4-5 Total organic carbon (TOC) is a good indicator of humic content of the sample. Under the LC conditions used during method development, matrix effects due to total organic carbon (TOC) were not observed.
4.4 Relatively large quantities of the preservative (Sect. 8.1.2) are added to sample bottles.
The potential exists for trace-level organic contaminants in these reagents. Interfer-ences from these sources should be monitored by analysis of laboratory reagent blanks (Sect. 9.3.1), particularly when new lots of reagents are acquired.
4.5 SPE cartridges can be a source of interferences. The analysis of field and laboratory
reagent blanks can provide important information regarding the presence or absence of such interferences. Brands and lots of SPE devices should be tested to ensure that contamination does not preclude analyte identification and quantitation.
5. SAFETY
5.1 The toxicity or carcinogenicity of each reagent used in this method has not been
precisely defined. Each chemical should be treated as a potential health hazard, and exposure to these chemicals should be minimized. Each laboratory is responsible for maintaining an awareness of OSHA regulations regarding safe handling of chemicals used in this method. A reference file of MSDSs should be made available to all personnel involved in the chemical analysis. Additional references to laboratory safety are available.6-8
537-8
5.2 PFOA has been described as “likely to be carcinogenic to humans.”9 Pure standard
materials and stock standard solutions of these method analytes should be handled with suitable protection to skin and eyes, and care should be taken not to breathe the vapors or ingest the materials.
6. EQUIPMENT AND SUPPLIES (Brand names and/or catalog numbers are included for
illustration only, and do not imply endorsement of the product.) Due to potential adsorption of analytes onto glass, polypropylene containers were used for all standard, sample and extraction preparations. Other plastic materials (e.g., polyethylene) which meet the QC requirements of Section 9 may be substituted.
6.1 SAMPLE CONTAINERS – 250-mL polypropylene bottles fitted with polypropylene
screw caps. Sample bottles must be discarded after use. 6.2 POLYPROPYLENE BOTTLES – 4-mL narrow-mouth polypropylene bottles (VWR
Cat. No.: 16066-960 or equivalent). 6.3 CENTRIFUGE TUBES – 15-mL conical polypropylene tubes with polypropylene
screw caps for storing standard solutions and for collection of the extracts (Thomas Scientific Cat. No.: 2602A10 or equivalent).
6.4 AUTOSAMPLER VIALS – Polypropylene 0.3-mL autosampler vials (SUN SRi Cat.
No.: 501-354) with polypropylene caps (SUN SRi Cat. No.: 501-357 or equivalent).
NOTE: Polypropylene vials and caps are necessary to prevent contamination of the sample from PTFE coated septa. However, polypropylene caps do not reseal, so evaporation occurs after injection. Thus, multiple injections from the same vial are not possible.
6.5 POLYPROPYLENE GRADUATED CYLINDERS – Suggested sizes include 25, 50,
100 and 1000-mL cylinders. 6.6 MICRO SYRINGES – Suggested sizes include 5, 10, 25, 50, 100, 250, 500 and
1000-µL syringes. 6.7 PLASTIC PIPETS – Polypropylene or polyethylene disposable pipets (Fisher Cat.
No.: 13-711-7 or equivalent). 6.8 ANALYTICAL BALANCE – Capable of weighing to the nearest 0.0001 g.
6.9 SOLID PHASE EXTRACTION (SPE) APPARATUS FOR USING CARTRIDGES
6.9.1 SPE CARTRIDGES – 0.5 g, 6-mL SPE cartridges containing styrenedivinyl-
benzene (SDVB) sorbent phase (Varian Cat. No.: 1225-5021 or equivalent).
537-9
6.9.2 VACUUM EXTRACTION MANIFOLD – A manual vacuum manifold with Visiprep large volume sampler (Supelco Cat. No. 57030 and 57275 or equivalent) for cartridge extractions, or an automatic/robotic sample preparation system designed for use with SPE cartridges, may be used if all QC requirements discussed in Section 9 are met. Extraction and/or elution steps may not be changed or omitted to accommodate the use of an automated system. Care must be taken with automated SPE systems to ensure the PTFE commonly used in these systems does not contribute to unacceptable analyte concentrations in the LRB (Sect. 9.3.1).
6.9.3 SAMPLE DELIVERY SYSTEM – Use of a polypropylene transfer tube system,
which transfers the sample directly from the sample container to the SPE cartridge, is recommended, but not mandatory. Standard extraction manifolds come equipped with PTFE transfer tube systems. These can be replaced with 1/8” O.D. x 1/16” I.D. polypropylene or polyethylene tubing (Hudson Extrusions LLDPE or equivalent) cut to an appropriate length to ensure no sample contamination from the sample transfer lines. Other types of non-PTFE tubing may be used provided it meets the LRB (Sect. 9.3.1) and LFB (Sect. 9.3.3) QC requirements. The PTFE transfer tubes may be used, but an LRB must be run on each PFTE transfer tube and the QC requirements in Section 9.2.1 must be met. In the case of automated SPE, the removal of PTFE lines may not be feasible; therefore, LRBs will need to be rotated among the ports and must meet the QC requirements of Sections 9.2.1 and 9.3.1.
6.10 EXTRACT CONCENTRATION SYSTEM – Extracts are concentrated by
evaporation with nitrogen using a water bath set no higher than 65 °C (Meyer N-Evap, Model 111, Organomation Associates, Inc. or equivalent).
6.11 LABORATORY OR ASPIRATOR VACUUM SYSTEM – Sufficient capacity to
maintain a vacuum of approximately 10 to 15 inches of mercury for extraction cartridges.
6.12 LIQUID CHROMATOGRAPHY (LC)/TANDEM MASS SPECTROMETER
(MS/MS) WITH DATA SYSTEM
6.12.1 LC SYSTEM – Instrument capable of reproducibly injecting up to 10-µL aliquots, and performing binary linear gradients at a constant flow rate near the flow rate used for development of this method (0.3 mL/min). The LC must be capable of pumping the water/methanol mobile phase without the use of a degasser which pulls vacuum on the mobile phase bottle (other types of degassers are acceptable). Degassers which pull vacuum on the mobile phase bottle will volatilize the ammonium acetate mobile phase causing the analyte peaks to shift to earlier retention times over the course of the analysis batch. The usage of a column heater is optional.
537-10
NOTE: During the course of method development, it was discovered that while idle for more than one day, PFAAs built up in the PTFE solvent transfer lines. To prevent long delays in purging high levels of PFAAs from the LC solvent lines, they were replaced with PEEK tubing and the PTFE solvent frits were replaced with stainless steel frits. It is not possible to remove all PFAA background contamination, but these measures help to minimize their background levels.
6.12.2 LC/TANDEM MASS SPECTROMETER – The LC/MS/MS must be capable of
negative ion electrospray ionization (ESI) near the suggested LC flow rate of 0.3 mL/min. The system must be capable of performing MS/MS to produce unique product ions (Sect. 3.19) for the method analytes within specified retention time segments. A minimum of 10 scans across the chromatographic peak is required to ensure adequate precision. Data are demonstrated in Tables 5-9 using a triple quadrupole mass spectrometer (Waters Micromass Quattro Premier).
6.12.3 DATA SYSTEM – An interfaced data system is required to acquire, store, reduce,
and output mass spectral data. The computer software should have the capability of processing stored LC/MS/MS data by recognizing an LC peak within any given retention time window. The software must allow integration of the ion abundance of any specific ion within specified time or scan number limits. The software must be able to calculate relative response factors, construct linear regressions or quadratic calibration curves, and calculate analyte concentrations.
6.12.4 ANALYTICAL COLUMN – An LC C18 column (2.1 x 150 mm) packed with
5 µm dp C18 solid phase particles (Waters #: 186001301 or equivalent) was used. Any column that provides adequate resolution, peak shape, capacity, accuracy, and precision (Sect. 9) may be used.
7. REAGENTS AND STANDARDS
7.1 GASES, REAGENTS, AND SOLVENTS – Reagent grade or better chemicals should be used. Unless otherwise indicated, it is intended that all reagents shall conform to the specifications of the Committee on Analytical Reagents of the American Chemical Society, where such specifications are available. Other grades may be used, provided it is first determined that the reagent is of sufficiently high purity to permit its use without lessening the quality of the determination.
7.1.1 REAGENT WATER – Purified water which does not contain any measurable
quantities of any method analytes or interfering compounds greater than 1/3 the MRL for each method analyte of interest. Prior to daily use, at least 3 L of reagent water should be flushed from the purification system to rinse out any build-up of analytes in the system’s tubing.
537-11
7.1.2 METHANOL (CH3OH, CAS#: 67-56-1) – High purity, demonstrated to be free of analytes and interferences (Tedia Absolv grade or equivalent).
7.1.3 AMMONIUM ACETATE (NH4C2H3O2, CAS#: 631-61-8) – High purity,
demonstrated to be free of analytes and interferences (Sigma-Aldrich ACS grade or equivalent).
7.1.4 20 mM AMMONIUM ACETATE/REAGENT WATER – To prepare 1 L, add 1.54 g ammonium acetate to 1 L of reagent water. This solution is prone to volatility losses and should be replaced at least every 48 hours.
7.1.5 TRIZMA PRESET CRYSTALS, pH 7.0 (Sigma cat# T-7193 or equivalent) –
Reagent grade. A premixed blend of Tris [Tris(hydroxymethyl)aminomethane] and Tris HCL [Tris(hydroxymethyl)aminomethane hydrochloride]. Alternatively, a mix of the two components with a weight ratio of 15.5/1 Tris HCL/Tris may be used. These blends are targeted to produce a pH near 7.0 at 25 °C in reagent water. Trizma functions as a buffer, and removes free chlorine in chlorinated finished waters (Sect. 8.1.2).
7.1.6 NITROGEN – Used for the following purposes:
7.1.6.1 Nitrogen aids in aerosol generation of the ESI liquid spray and is used as collision gas in some MS/MS instruments. The nitrogen used should meet or exceed instrument manufacturer’s specifications.
7.1.6.2 Nitrogen is used to concentrate sample extracts (Ultra High Purity or
equivalent).
7.1.7 ARGON – Used as collision gas in MS/MS instruments. Argon should meet or exceed instrument manufacturer’s specifications. Nitrogen gas may be used as the collision gas provided sufficient sensitivity (product ion formation) is achieved.
7.2 STANDARD SOLUTIONS – When a compound purity is assayed to be 96% or
greater, the weight can be used without correction to calculate the concentration of the stock standard. PFAA analyte, IS and SUR standards commercially purchased in glass ampoules are acceptable; however, all subsequent transfers or dilutions performed by the analyst must be prepared and stored in polypropylene containers. Solution concentrations listed in this section were used to develop this method and are included as an example. Alternate concentrations may be used as necessary depending on instrument sensitivity and the calibration range used. Standards for sample fortification generally should be prepared in the smallest volume that can be accurately measured to minimize the addition of excess organic solvent to aqueous samples. Even though stability times for standard solutions are suggested in the following sections, laboratories should use standard QC practices to determine when their standards need to be replaced.
537-12
NOTE: Stock standards (Sect. 7.2.1.1, 7.2.2.1 and 7.2.3.1) were stored at ≤4 °C.
Primary dilution standards (Sect. 7.2.1.2, 7.2.2.2 and 7.2.3.2) were stored at room temperature to prevent adsorption of the method analytes onto the container surfaces that may occur when refrigerated. Storing the standards at room temperature will also minimize daily imprecision due to the potential of inadequate room temperature stabilization.
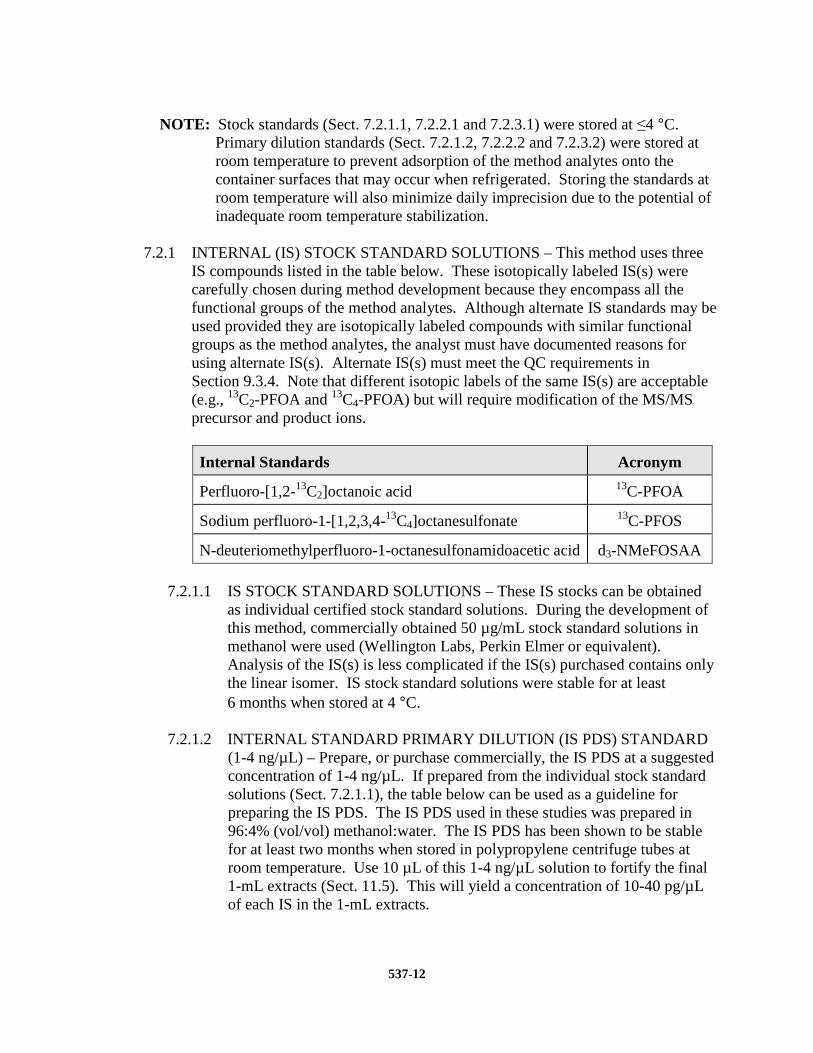
7.2.1 INTERNAL (IS) STOCK STANDARD SOLUTIONS – This method uses three
IS compounds listed in the table below. These isotopically labeled IS(s) were carefully chosen during method development because they encompass all the functional groups of the method analytes. Although alternate IS standards may be used provided they are isotopically labeled compounds with similar functional groups as the method analytes, the analyst must have documented reasons for using alternate IS(s). Alternate IS(s) must meet the QC requirements in Section 9.3.4. Note that different isotopic labels of the same IS(s) are acceptable (e.g., 13C2-PFOA and 13C4-PFOA) but will require modification of the MS/MS precursor and product ions.
Internal Standards Acronym
Perfluoro-[1,2-13C2]octanoic acid 13C-PFOA
Sodium perfluoro-1-[1,2,3,4-13C4]octanesulfonate 13C-PFOS
N-deuteriomethylperfluoro-1-octanesulfonamidoacetic acid d3-NMeFOSAA
7.2.1.1 IS STOCK STANDARD SOLUTIONS – These IS stocks can be obtained
as individual certified stock standard solutions. During the development of this method, commercially obtained 50 µg/mL stock standard solutions in methanol were used (Wellington Labs, Perkin Elmer or equivalent). Analysis of the IS(s) is less complicated if the IS(s) purchased contains only the linear isomer. IS stock standard solutions were stable for at least 6 months when stored at 4 °C.
7.2.1.2 INTERNAL STANDARD PRIMARY DILUTION (IS PDS) STANDARD
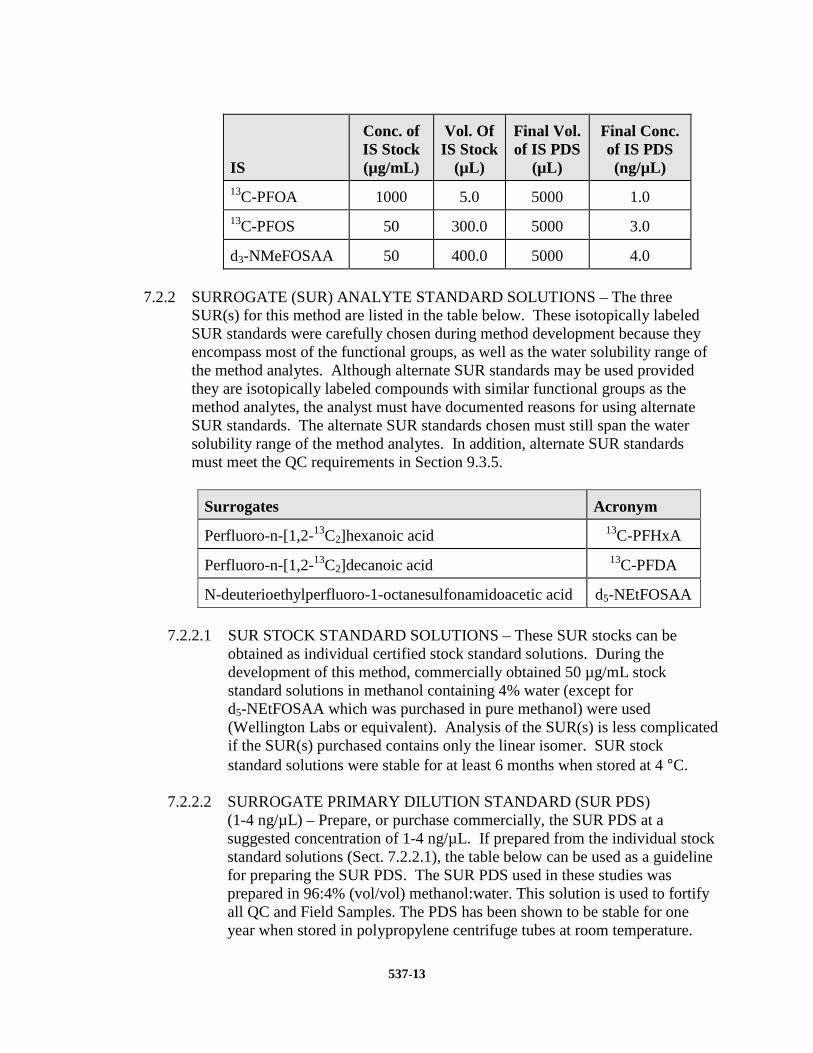
(1-4 ng/µL) – Prepare, or purchase commercially, the IS PDS at a suggested concentration of 1-4 ng/µL. If prepared from the individual stock standard solutions (Sect. 7.2.1.1), the table below can be used as a guideline for preparing the IS PDS. The IS PDS used in these studies was prepared in 96:4% (vol/vol) methanol:water. The IS PDS has been shown to be stable for at least two months when stored in polypropylene centrifuge tubes at room temperature. Use 10 µL of this 1-4 ng/µL solution to fortify the final 1-mL extracts (Sect. 11.5). This will yield a concentration of 10-40 pg/µL of each IS in the 1-mL extracts.
537-13
IS
Conc. of IS Stock (µg/mL)
Vol. Of IS Stock
(µL)
Final Vol. of IS PDS
(µL)
Final Conc. of IS PDS (ng/µL)
13C-PFOA 1000 5.0 5000 1.0 13C-PFOS 50 300.0 5000 3.0
d3-NMeFOSAA 50 400.0 5000 4.0
7.2.2 SURROGATE (SUR) ANALYTE STANDARD SOLUTIONS – The three
SUR(s) for this method are listed in the table below. These isotopically labeled SUR standards were carefully chosen during method development because they encompass most of the functional groups, as well as the water solubility range of the method analytes. Although alternate SUR standards may be used provided they are isotopically labeled compounds with similar functional groups as the method analytes, the analyst must have documented reasons for using alternate SUR standards. The alternate SUR standards chosen must still span the water solubility range of the method analytes. In addition, alternate SUR standards must meet the QC requirements in Section 9.3.5.
Surrogates Acronym
Perfluoro-n-[1,2-13C2]hexanoic acid 13C-PFHxA
Perfluoro-n-[1,2-13C2]decanoic acid 13C-PFDA
N-deuterioethylperfluoro-1-octanesulfonamidoacetic acid d5-NEtFOSAA
7.2.2.1 SUR STOCK STANDARD SOLUTIONS – These SUR stocks can be
obtained as individual certified stock standard solutions. During the development of this method, commercially obtained 50 µg/mL stock standard solutions in methanol containing 4% water (except for d5-NEtFOSAA which was purchased in pure methanol) were used (Wellington Labs or equivalent). Analysis of the SUR(s) is less complicated if the SUR(s) purchased contains only the linear isomer. SUR stock standard solutions were stable for at least 6 months when stored at 4 °C.
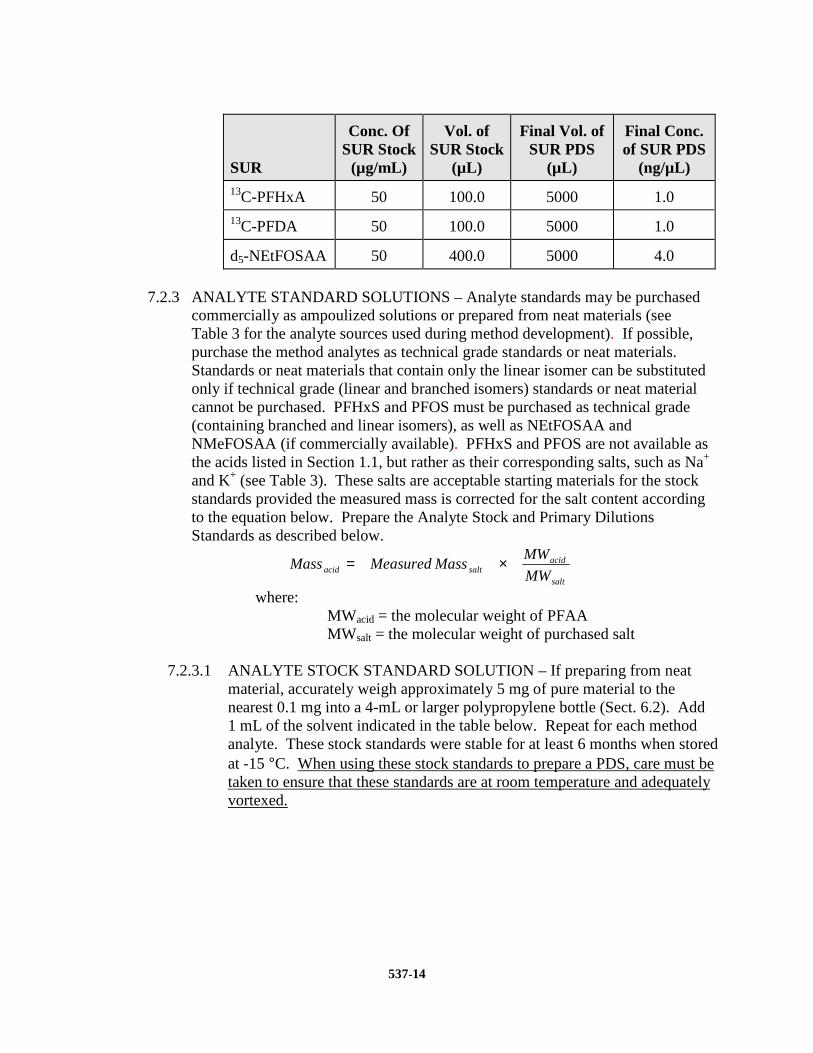
7.2.2.2 SURROGATE PRIMARY DILUTION STANDARD (SUR PDS)
(1-4 ng/µL) – Prepare, or purchase commercially, the SUR PDS at a suggested concentration of 1-4 ng/µL. If prepared from the individual stock standard solutions (Sect. 7.2.2.1), the table below can be used as a guideline for preparing the SUR PDS. The SUR PDS used in these studies was prepared in 96:4% (vol/vol) methanol:water. This solution is used to fortify all QC and Field Samples. The PDS has been shown to be stable for one year when stored in polypropylene centrifuge tubes at room temperature.
537-14
SUR
Conc. Of SUR Stock
(µg/mL)
Vol. of SUR Stock
(µL)
Final Vol. of SUR PDS
(µL)
Final Conc. of SUR PDS
(ng/µL) 13C-PFHxA 50 100.0 5000 1.0 13C-PFDA 50 100.0 5000 1.0
d5-NEtFOSAA 50 400.0 5000 4.0
7.2.3 ANALYTE STANDARD SOLUTIONS – Analyte standards may be purchased
commercially as ampoulized solutions or prepared from neat materials (see Table 3 for the analyte sources used during method development). If possible, purchase the method analytes as technical grade standards or neat materials. Standards or neat materials that contain only the linear isomer can be substituted only if technical grade (linear and branched isomers) standards or neat material cannot be purchased. PFHxS and PFOS must be purchased as technical grade (containing branched and linear isomers), as well as NEtFOSAA and NMeFOSAA (if commercially available). PFHxS and PFOS are not available as the acids listed in Section 1.1, but rather as their corresponding salts, such as Na+ and K+ (see Table 3). These salts are acceptable starting materials for the stock standards provided the measured mass is corrected for the salt content according to the equation below. Prepare the Analyte Stock and Primary Dilutions Standards as described below.
salt
acidsaltacid MW
MWMassMeasuredMass ×=
where: MWacid = the molecular weight of PFAA MWsalt = the molecular weight of purchased salt
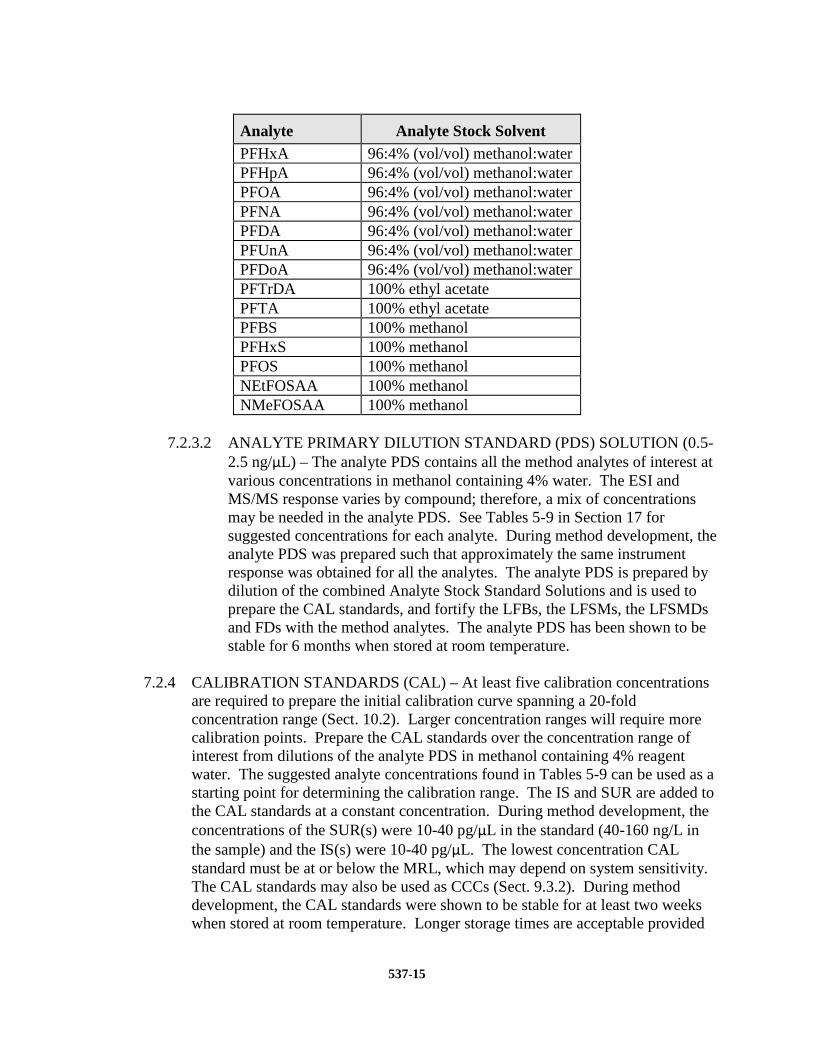
7.2.3.1 ANALYTE STOCK STANDARD SOLUTION – If preparing from neat
material, accurately weigh approximately 5 mg of pure material to the nearest 0.1 mg into a 4-mL or larger polypropylene bottle (Sect. 6.2). Add 1 mL of the solvent indicated in the table below. Repeat for each method analyte. These stock standards were stable for at least 6 months when stored at -15 °C. When using these stock standards to prepare a PDS, care must be taken to ensure that these standards are at room temperature and adequately vortexed.
537-15
Analyte Analyte Stock Solvent PFHxA 96:4% (vol/vol) methanol:water PFHpA 96:4% (vol/vol) methanol:water PFOA 96:4% (vol/vol) methanol:water PFNA 96:4% (vol/vol) methanol:water PFDA 96:4% (vol/vol) methanol:water PFUnA 96:4% (vol/vol) methanol:water PFDoA 96:4% (vol/vol) methanol:water PFTrDA 100% ethyl acetate PFTA 100% ethyl acetate PFBS 100% methanol PFHxS 100% methanol PFOS 100% methanol NEtFOSAA 100% methanol NMeFOSAA 100% methanol
7.2.3.2 ANALYTE PRIMARY DILUTION STANDARD (PDS) SOLUTION (0.5-
2.5 ng/µL) – The analyte PDS contains all the method analytes of interest at various concentrations in methanol containing 4% water. The ESI and MS/MS response varies by compound; therefore, a mix of concentrations may be needed in the analyte PDS. See Tables 5-9 in Section 17 for suggested concentrations for each analyte. During method development, the analyte PDS was prepared such that approximately the same instrument response was obtained for all the analytes. The analyte PDS is prepared by dilution of the combined Analyte Stock Standard Solutions and is used to prepare the CAL standards, and fortify the LFBs, the LFSMs, the LFSMDs and FDs with the method analytes. The analyte PDS has been shown to be stable for 6 months when stored at room temperature.
7.2.4 CALIBRATION STANDARDS (CAL) – At least five calibration concentrations
are required to prepare the initial calibration curve spanning a 20-fold concentration range (Sect. 10.2). Larger concentration ranges will require more calibration points. Prepare the CAL standards over the concentration range of interest from dilutions of the analyte PDS in methanol containing 4% reagent water. The suggested analyte concentrations found in Tables 5-9 can be used as a starting point for determining the calibration range. The IS and SUR are added to the CAL standards at a constant concentration. During method development, the concentrations of the SUR(s) were 10-40 pg/µL in the standard (40-160 ng/L in the sample) and the IS(s) were 10-40 pg/µL. The lowest concentration CAL standard must be at or below the MRL, which may depend on system sensitivity. The CAL standards may also be used as CCCs (Sect. 9.3.2). During method development, the CAL standards were shown to be stable for at least two weeks when stored at room temperature. Longer storage times are acceptable provided
537-16
appropriate QC measures are documented demonstrating the CAL standard stability.
8. SAMPLE COLLECTION, PRESERVATION, AND STORAGE
8.1 SAMPLE BOTTLE PREPARATION
8.1.1 Samples must be collected in a 250-mL polypropylene bottle fitted with a polypropylene screw-cap.
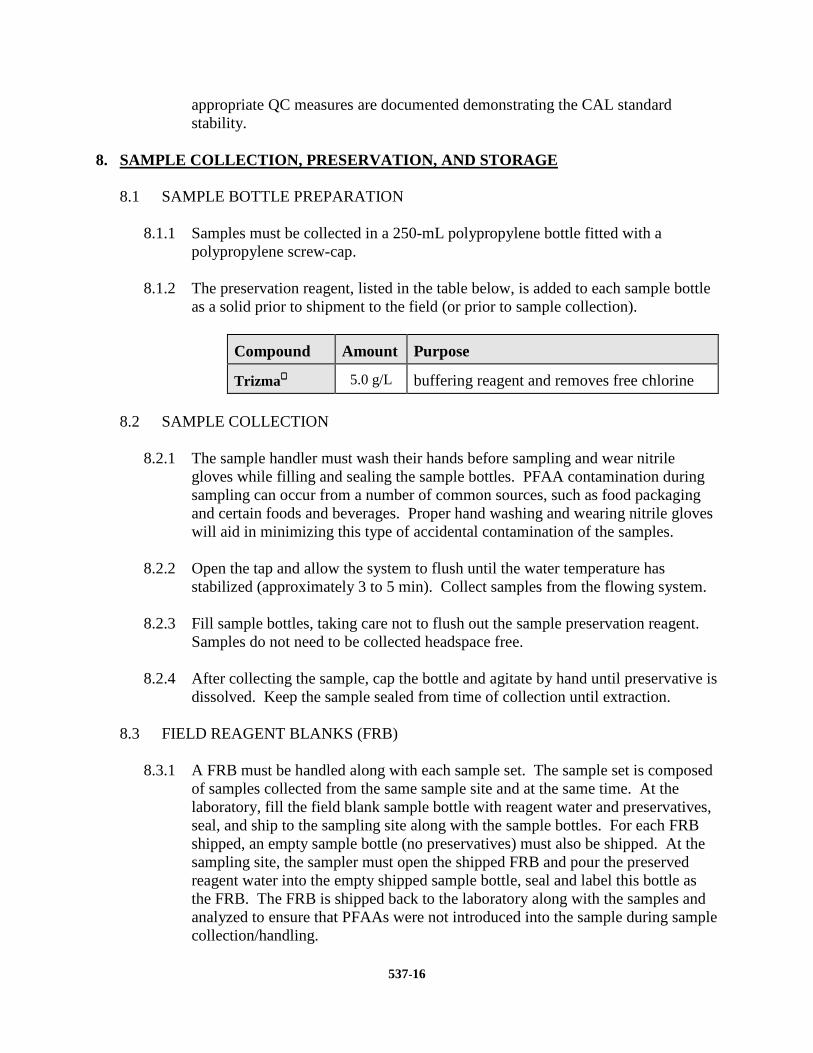
8.1.2 The preservation reagent, listed in the table below, is added to each sample bottle
as a solid prior to shipment to the field (or prior to sample collection).
Compound Amount Purpose
Trizma 5.0 g/L buffering reagent and removes free chlorine
8.2 SAMPLE COLLECTION
8.2.1 The sample handler must wash their hands before sampling and wear nitrile gloves while filling and sealing the sample bottles. PFAA contamination during sampling can occur from a number of common sources, such as food packaging and certain foods and beverages. Proper hand washing and wearing nitrile gloves will aid in minimizing this type of accidental contamination of the samples.
8.2.2 Open the tap and allow the system to flush until the water temperature has
stabilized (approximately 3 to 5 min). Collect samples from the flowing system.
8.2.3 Fill sample bottles, taking care not to flush out the sample preservation reagent. Samples do not need to be collected headspace free.
8.2.4 After collecting the sample, cap the bottle and agitate by hand until preservative is
dissolved. Keep the sample sealed from time of collection until extraction.
8.3 FIELD REAGENT BLANKS (FRB)
8.3.1 A FRB must be handled along with each sample set. The sample set is composed of samples collected from the same sample site and at the same time. At the laboratory, fill the field blank sample bottle with reagent water and preservatives, seal, and ship to the sampling site along with the sample bottles. For each FRB shipped, an empty sample bottle (no preservatives) must also be shipped. At the sampling site, the sampler must open the shipped FRB and pour the preserved reagent water into the empty shipped sample bottle, seal and label this bottle as the FRB. The FRB is shipped back to the laboratory along with the samples and analyzed to ensure that PFAAs were not introduced into the sample during sample collection/handling.
537-17
8.3.2 The same batch of preservative must be used for the FRBs as for the field
samples.
8.3.3 The reagent water used for the FRBs must be initially analyzed for method analytes as a LRB and must meet the LRB criteria in Section 9.3.1 prior to use. This requirement will ensure samples are not being discarded due to contaminated reagent water rather than contamination during sampling.
8.4 SAMPLE SHIPMENT AND STORAGE – Samples must be chilled during shipment
and must not exceed 10 °C during the first 48 hours after collection. Sample temperature must be confirmed to be at or below 10 °C when the samples are received at the laboratory. Samples stored in the lab must be held at or below 6 °C until extraction, but should not be frozen. NOTE: Samples that are significantly above 10° C, at the time of collection, may need
to be iced or refrigerated for a period of time, in order to chill them prior to shipping. This will allow them to be shipped with sufficient ice to meet the above requirements.
8.5 SAMPLE AND EXTRACT HOLDING TIMES – Results of the sample storage
stability study (Table 10) indicated that all compounds listed in this method have adequate stability for 14 days when collected, preserved, shipped and stored as described in Sections 8.1, 8.2, and 8.4. Therefore, water samples should be extracted as soon as possible but must be extracted within 14 days. Extracts must be stored at room temperature and analyzed within 28 days after extraction. The extract storage stability study data are presented in Table 11.
9. QUALITY CONTROL
9.1 QC requirements include the Initial Demonstration of Capability (IDC) and ongoing QC requirements that must be met when preparing and analyzing Field Samples. This section describes the QC parameters, their required frequencies, and the performance criteria that must be met in order to meet EPA quality objectives. The QC criteria discussed in the following sections are summarized in Tables 12 and 13. These QC requirements are considered the minimum acceptable QC criteria. Laboratories are encouraged to institute additional QC practices to meet their specific needs.
9.1.1 METHOD MODIFICATIONS – The analyst is permitted to modify LC columns,
LC conditions, evaporation techniques, internal standards or surrogate standards, and MS and MS/MS conditions. Each time such method modifications are made, the analyst must repeat the procedures of the IDC. Modifications to LC conditions should still produce conditions such that co-elution of the method analytes is minimized to reduce the probability of suppression/enhancement effects.
537-18
9.2 INITIAL DEMONSTRATION OF CAPABILITY – The IDC must be successfully performed prior to analyzing any Field Samples. Prior to conducting the IDC, the analyst must first generate an acceptable Initial Calibration following the procedure outlined in Section 10.2.
9.2.1 INITIAL DEMONSTRATION OF LOW SYSTEM BACKGROUND – Any time
a new lot of SPE cartridges, solvents, centrifuge tubes, disposable pipets, and autosampler vials are used, it must be demonstrated that an LRB is reasonably free of contamination and that the criteria in Section 9.3.1 are met. If an automated extraction system is used, an LRB should be extracted on each port to ensure that all the valves and tubing are free from potential PFAA contamination.
9.2.2 INITIAL DEMONSTRATION OF PRECISION (IDP) – Prepare, extract, and
analyze four to seven replicate LFBs fortified near the midrange of the initial calibration curve according to the procedure described in Section 11. Sample preservatives as described in Section 8.1.2 must be added to these samples. The relative standard deviation (RSD) of the results of the replicate analyses must be less than 20%.
9.2.3 INITIAL DEMONSTRATION OF ACCURACY (IDA) – Using the same set of
replicate data generated for Section 9.2.2, calculate average recovery. The average recovery of the replicate values must be within ± 30% of the true value.
9.2.4 INITIAL DEMONSTRATION OF PEAK ASYMMETRY FACTOR – Peak
asymmetry factors must be calculated using the equation in Section 9.3.9 for the first two eluting peaks (if only two analytes are being analyzed, both must be evaluated) in a mid-level CAL standard. The peak asymmetry factors must fall in the range of 0.8 to 1.5. See guidance in Section 10.2.4.1 if the calculated peak asymmetry factors do not meet the criteria.
9.2.5 MINIMUM REPORTING LEVEL (MRL) CONFIRMATION – Establish a target
concentration for the MRL based on the intended use of the method. The MRL may be established by a laboratory for their specific purpose or may be set by a regulatory agency. Establish an Initial Calibration following the procedure outlined in Section 10.2. The lowest CAL standard used to establish the Initial Calibration (as well as the low-level CCC, Section 10.3) must be at or below the concentration of the MRL. Establishing the MRL concentration too low may cause repeated failure of ongoing QC requirements. Confirm the MRL following the procedure outlined below.
9.2.5.1 Fortify, extract, and analyze seven replicate LFBs at the proposed MRL
concentration. These LFBs must contain all method preservatives described in Section 8.1.2. Calculate the mean measured concentration (Mean) and standard deviation for these replicates. Determine the Half Range for the prediction interval of results (HRPIR) using the equation below
537-19
HR sPIR = 3963.
where s = the standard deviation 3.963 = a constant value for seven replicates.1
9.2.5.2 Confirm that the upper and lower limits for the Prediction Interval of Result (PIR = Mean + HRPIR) meet the upper and lower recovery limits as shown below
The Upper PIR Limit must be ≤150% recovery.
150% %100 ≤×+
ononcentratiFortifiedC
HRMean PIR
The Lower PIR Limit must be ≥ 50% recovery.
50% %100 ≥×−ononcentratiFortifiedC
HRMean PIR
9.2.5.3 The MRL is validated if both the Upper and Lower PIR Limits meet the
criteria described above (Sect. 9.2.5.2). If these criteria are not met, the MRL has been set too low and must be determined again at a higher concentration.
9.2.6 CALIBRATION CONFIRMATION – Analyze a QCS as described in Section
9.3.10 to confirm the accuracy of the standards/calibration curve. 9.2.7 DETECTION LIMIT DETERMINATION (optional) – While DL determination
is not a specific requirement of this method, it may be required by various regulatory bodies associated with compliance monitoring. It is the responsibility of the laboratory to determine if DL determination is required based upon the intended use of the data.
9.2.7.1 Replicate analyses for this procedure should be done over at least three days
(i.e., both the sample extraction and the LC/MS/MS analyses should be done over at least three days). Prepare at least seven replicate LFBs at a concentration estimated to be near the DL. This concentration may be estimated by selecting a concentration at 2-5 times the noise level. The DLs in Table 5 were calculated from LFBs fortified at various concentrations as indicated in the table. The appropriate fortification concentrations will be dependent upon the sensitivity of the LC/MS/MS system used. All preservation reagents listed in Section 8.1.2 must also be added to these samples. Analyze the seven replicates through all steps of Section 11.
537-20
NOTE: If an MRL confirmation data set meets these requirements, a DL may be calculated from the MRL confirmation data, and no additional analyses are necessary.
Calculate the DL using the following equation
)99.01 ,1( =−−×= αntsDL
where
s = standard deviation of replicate analyses t (n-1, 1-α=0.99) = Student's t value for the 99% confidence
level with n-1 degrees of freedom n = number of replicates.
NOTE: Do not subtract blank values when performing DL calculations. The DL
is a statistical determination of precision only.2 If the DL replicates are fortified at a low enough concentration, it is likely that they will not meet the precision and accuracy criteria for CCCs. Therefore, no precision and accuracy criteria are specified.
9.2.7.2 If a laboratory is establishing their own MRL, the calculated DLs should not
be used as the MRL for analytes that commonly occur as background contaminants. Method analytes that are seen in the background should be reported as present in Field Samples, only after careful evaluation of the background levels. It is recommended that a MRL be established at the mean LRB concentrations + 3σ or 3 times the mean LRB concentration, whichever is greater. This value should be calculated over a period of time, to reflect variability in the blank measurements. It is recommended that this value be used as an MRL in order to avoid reporting false positive results.
9.3 ONGOING QC REQUIREMENTS – This section summarizes the ongoing QC
criteria that must be followed when processing and analyzing Field Samples.
9.3.1 LABORATORY REAGENT BLANK (LRB) – An LRB is required with each extraction batch (Sect. 3.6) to confirm that potential background contaminants are not interfering with the identification or quantitation of method analytes. If more than 20 Field Samples are included in a batch, analyze an LRB for every 20 samples. If the LRB produces a peak within the retention time window of any analyte that would prevent the determination of that analyte, determine the source of contamination and eliminate the interference before processing samples. Background contamination must be reduced to an acceptable level before proceeding. Background from method analytes or other contaminants that inter-fere with the measurement of method analytes must be below 1/3 of the MRL. Blank contamination is estimated by extrapolation, if the concentration is below the lowest CAL standard. This extrapolation procedure is not allowed for sample results as it may not meet data quality objectives. If the method analytes are
537-21
detected in the LRB at concentrations equal to or greater than this level, then all data for the problem analyte(s) must be considered invalid for all samples in the extraction batch. Because background contamination is a significant problem for several method analytes, it is highly recommended that the analyst maintain a historical record of LRB data.
9.3.2 CONTINUING CALIBRATION CHECK (CCC) – CCC Standards are analyzed
at the beginning of each analysis batch, after every 10 Field Samples, and at the end of the analysis batch. See Section 10.3 for concentration requirements and acceptance criteria.
9.3.3 LABORATORY FORTIFIED BLANK (LFB) – An LFB is required with each
extraction batch (Sect. 3.6). The fortified concentration of the LFB must be rotated between low, medium, and high concentrations from batch to batch. The low concentration LFB must be as near as practical to, but no more than two times, the MRL. Similarly, the high concentration LFB should be near the high end of the calibration range established during the initial calibration (Sect. 10.2). Results of the low-level LFB analyses must be 50-150% of the true value. Results of the medium and high-level LFB analyses must be 70-130% of the true value. If the LFB results do not meet these criteria for method analytes, then all data for the problem analyte(s) must be considered invalid for all samples in the extraction batch.
9.3.4 INTERNAL STANDARDS (IS) – The analyst must monitor the peak areas of the
IS(s) in all injections during each analysis day. The IS responses (peak areas) in any chromatographic run must be within 70-140% of the response in the most recent CCC and must not deviate by more than 50% from the average area measured during initial analyte calibration. If the IS areas in a chromatographic run do not meet these criteria, inject a second aliquot of that extract aliquotted into a new capped autosampler vial. Random evaporation losses have been observed with the polypropylene caps causing high IS(s) areas.
9.3.4.1 If the reinjected aliquot produces an acceptable IS response, report results
for that aliquot. 9.3.4.2 If the reinjected extract fails again, the analyst should check the calibration
by reanalyzing the most recently acceptable CAL standard. If the CAL standard fails the criteria of Section 10.3, recalibration is in order per Section 10.2. If the CAL standard is acceptable, extraction of the sample may need to be repeated provided the sample is still within the holding time. Otherwise, report results obtained from the reinjected extract, but annotate as suspect. Alternatively, collect a new sample and re-analyze.
9.3.5 SURROGATE RECOVERY – The SUR standard is fortified into all samples,
CCCs, LRBs, LFBs, LFSMs, LFSMDs, FD, and FRB prior to extraction. It is also added to the CAL standards. The SUR is a means of assessing method
537-22
performance from extraction to final chromatographic measurement. Calculate the recovery (%R) for the SUR using the following equation
100% ×
=B
AR
where A = calculated SUR concentration for the QC or Field Sample B = fortified concentration of the SUR.
9.3.5.1 SUR recovery must be in the range of 70-130%. When SUR recovery from
a sample, blank, or CCC is less than 70% or greater than 130%, check 1) calculations to locate possible errors, 2) standard solutions for degradation, 3) contamination, and 4) instrument performance. Correct the problem and reanalyze the extract.
9.3.5.2 If the extract reanalysis meets the SUR recovery criterion, report only data
for the reanalyzed extract. 9.3.5.3 If the extract reanalysis fails the 70-130% recovery criterion, the analyst
should check the calibration by injecting the last CAL standard that passed. If the CAL standard fails the criteria of Section 10.3, recalibration is in order per Section 10.2. If the CAL standard is acceptable, extraction of the sample should be repeated provided the sample is still within the holding time. If the re-extracted sample also fails the recovery criterion, report all data for that sample as suspect/SUR recovery to inform the data user that the results are suspect due to SUR recovery. Alternatively, collect a new sample and re-analyze.
9.3.6 LABORATORY FORTIFIED SAMPLE MATRIX (LFSM) – Analysis of an
LFSM is required in each extraction batch and is used to determine that the sample matrix does not adversely affect method accuracy. Assessment of method precision is accomplished by analysis of a Field Duplicate (FD) (Sect. 9.3.7); however, infrequent occurrence of method analytes would hinder this assessment. If the occurrence of method analytes in the samples is infrequent, or if historical trends are unavailable, a second LFSM, or LFSMD, must be prepared, extracted, and analyzed from a duplicate of the Field Sample. Extraction batches that contain LFSMDs will not require the extraction of a FD. If a variety of different sample matrices are analyzed regularly, for example, drinking water from groundwater and surface water sources, method performance should be established for each. Over time, LFSM data should be documented by the laboratory for all routine sample sources.
9.3.6.1 Within each extraction batch (Sect. 3.6), a minimum of one Field Sample is
fortified as an LFSM for every 20 Field Samples analyzed. The LFSM is prepared by spiking a sample with an appropriate amount of the Analyte
537-23
PDS (Sect. 7.2.3.2). Select a spiking concentration that is greater than or equal to the matrix background concentration, if known. Use historical data and rotate through the low, mid and high concentrations when selecting a fortifying concentration.
9.3.6.2 Calculate the percent recovery (%R) for each analyte using the equation
( )100% ×−=
C
BAR
where A = measured concentration in the fortified sample B = measured concentration in the unfortified sample C = fortification concentration.
9.3.6.3 Analyte recoveries may exhibit matrix bias. For samples fortified at or
above their native concentration, recoveries should range between 70-130%, except for low-level fortification near or at the MRL (within a factor of 2-times the MRL concentration) where 50-150% recoveries are acceptable. If the accuracy of any analyte falls outside the designated range, and the laboratory performance for that analyte is shown to be in control in the CCCs, the recovery is judged to be matrix biased. The result for that analyte in the unfortified sample is labeled suspect/matrix to inform the data user that the results are suspect due to matrix effects.
9.3.7 FIELD DUPLICATE OR LABORATORY FORTIFIED SAMPLE MATRIX
DUPLICATE (FD or LFSMD) – Within each extraction batch (not to exceed 20 Field Samples, Sect. 3.6), a minimum of one FD or LFSMD must be analyzed. Duplicates check the precision associated with sample collection, preservation, storage, and laboratory procedures. If method analytes are not routinely observed in Field Samples, an LFSMD should be analyzed rather than an FD.
9.3.7.1 Calculate the relative percent difference (RPD) for duplicate measurements
(FD1 and FD2) using the equation
( ) 1002/21
21×
+−
=FDFD
FDFDRPD
9.3.7.2 RPDs for FDs should be ≤30%. Greater variability may be observed when
FDs have analyte concentrations that are within a factor of 2 of the MRL. At these concentrations, FDs should have RPDs that are ≤50%. If the RPD of any analyte falls outside the designated range, and the laboratory performance for that analyte is shown to be in control in the CCC, the recovery is judged to be matrix biased. The result for that analyte in the unfortified sample is labeled suspect/matrix to inform the data user that the results are suspect due to matrix effects.
537-24
9.3.7.3 If an LFSMD is analyzed instead of a FD, calculate the relative percent difference (RPD) for duplicate LFSMs (LFSM and LFSMD) using the equation
( ) 1002/
×+
−=
LFSMDLFSM
LFSMDLFSMRPD
9.3.7.4 RPDs for duplicate LFSMs should be ≤30% for samples fortified at or
above their native concentration. Greater variability may be observed when LFSMs are fortified at analyte concentrations that are within a factor of 2 of the MRL. LFSMs fortified at these concentrations should have RPDs that are ≤50% for samples fortified at or above their native concentration. If the RPD of any analyte falls outside the designated range, and the laboratory performance for that analyte is shown to be in control in the CCC, the recovery is judged to be matrix biased. The result for that analyte in the unfortified sample is labeled suspect/matrix to inform the data user that the results are suspect due to matrix effects.
9.3.8 FIELD REAGENT BLANK (FRB) – The purpose of the FRB is to ensure that
PFAAs measured in the Field Samples were not inadvertently introduced into the sample during sample collection/handling. Analysis of the FRB is required only if a Field Sample contains a method analyte or analytes at or above the MRL. The FRB is processed, extracted and analyzed in exactly the same manner as a Field Sample. If the method analyte(s) found in the Field Sample is present in the FRB at a concentration greater than 1/3 the MRL, then all samples collected with that FRB are invalid and must be recollected and reanalyzed.
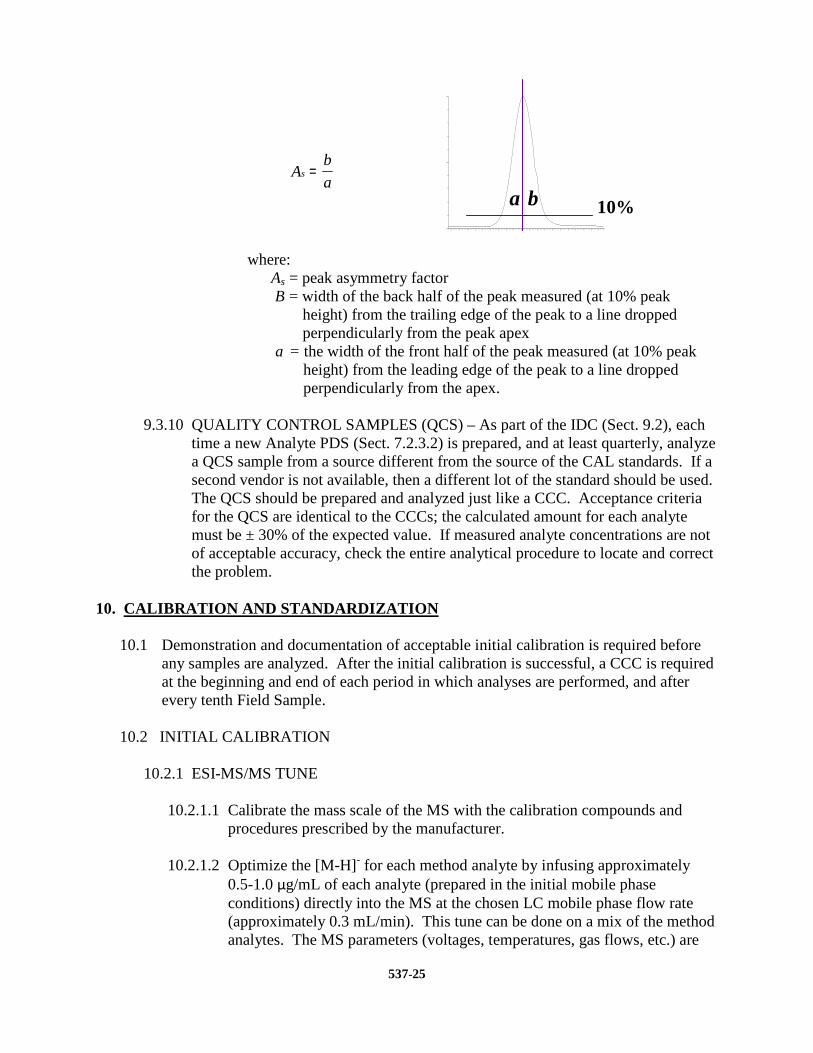
9.3.9 PEAK ASYMMETRY FACTOR – A peak asymmetry factor must be calculated
using the equation below during the IDL and every time a calibration curve is generated. The peak asymmetry factor for the first two eluting peaks in a mid-level CAL standard (if only two analytes are being analyzed, both must be evaluated) must fall in the range of 0.8 to 1.5. Modifying the standard or extract composition to more aqueous content to prevent poor shape is not permitted. See guidance in Section 10.2.4.1 if the calculated peak asymmetry factors do not meet the criteria.
537-25
10% a b
Ab
as =
where:
As = peak asymmetry factor B = width of the back half of the peak measured (at 10% peak
height) from the trailing edge of the peak to a line dropped perpendicularly from the peak apex
a = the width of the front half of the peak measured (at 10% peak height) from the leading edge of the peak to a line dropped perpendicularly from the apex.
9.3.10 QUALITY CONTROL SAMPLES (QCS) – As part of the IDC (Sect. 9.2), each
time a new Analyte PDS (Sect. 7.2.3.2) is prepared, and at least quarterly, analyze a QCS sample from a source different from the source of the CAL standards. If a second vendor is not available, then a different lot of the standard should be used. The QCS should be prepared and analyzed just like a CCC. Acceptance criteria for the QCS are identical to the CCCs; the calculated amount for each analyte must be ± 30% of the expected value. If measured analyte concentrations are not of acceptable accuracy, check the entire analytical procedure to locate and correct the problem.
10. CALIBRATION AND STANDARDIZATION
10.1 Demonstration and documentation of acceptable initial calibration is required before any samples are analyzed. After the initial calibration is successful, a CCC is required at the beginning and end of each period in which analyses are performed, and after every tenth Field Sample.
10.2 INITIAL CALIBRATION
10.2.1 ESI-MS/MS TUNE
10.2.1.1 Calibrate the mass scale of the MS with the calibration compounds and
procedures prescribed by the manufacturer.
10.2.1.2 Optimize the [M-H]- for each method analyte by infusing approximately 0.5-1.0 µg/mL of each analyte (prepared in the initial mobile phase conditions) directly into the MS at the chosen LC mobile phase flow rate (approximately 0.3 mL/min). This tune can be done on a mix of the method analytes. The MS parameters (voltages, temperatures, gas flows, etc.) are
537-26
varied until optimal analyte responses are determined. The method analytes may have different optima requiring some compromise between the optima. See Table 2 for ESI-MS conditions used in method development.
10.2.1.3 Optimize the product ion (Sect. 3.19) for each analyte by infusing
approximately 0.5-1.0 µg/mL of each analyte (prepared in the initial mobile phase conditions) directly into the MS at the chosen LC mobile phase flow rate (approximately 0.3 mL/min). This tune can be done on a mix of the method analytes. The MS/MS parameters (collision gas pressure, collision energy, etc.) are varied until optimal analyte responses are determined. Typically, the carboxylic acids have very similar MS/MS conditions and the sulfonic acids have similar MS/MS conditions. See Table 4 for MS/MS conditions used in method development.
10.2.2 Establish LC operating parameters that optimize resolution and peak shape.
Suggested LC suggested conditions can be found in Table 1. The LC conditions listed in Table 1 may not be optimum for all LC systems and may need to be optimized by the analyst (See Sect. 10.2.4.1). Modifying the standard or extract composition to more aqueous content to prevent poor shape is not permitted.
Cautions: LC system components, as well as the mobile phase constituents,
contain many of the method analytes in this method. Thus, these PFAAs will build up on the head of the LC column during mobile phase equilibration. To minimize the background PFAA peaks and to keep background levels constant, the time the LC column sits at initial conditions must be kept constant and as short as possible (while ensuring reproducible retention times). In addition, prior to daily use, flush the column with 100% methanol for at least 20 min before initiating a sequence. It may be necessary on some systems to flush other LC components such as wash syringes, sample needles or any other system components before daily use.
Mobile phase modifiers other than 20 mM ammonium acetate may
be used at the discretion of the analyst, provided that the retention time stability criteria in Sect. 11.7.2 can be met over a period of two weeks. During method development, retention times shifted to shorter and shorter times as days progressed when mobile phases with less then 20 mM ammonium acetate were used.
10.2.3 Inject a mid-level CAL standard under LC/MS conditions to obtain the retention times of each method analyte. If analyzing for PFTA, ensure that the LC conditions are adequate to prevent co-elution of PFTA and the mobile phase interferants shown in Figure 1. These interferants have the same precursor and products ions as PFTA, and under faster LC conditions may co-elute with PFTA. Divide the chromatogram into retention time windows each of which contains one
537-27
or more chromatographic peaks. During MS/MS analysis, fragment a small number of selected precursor ions ([M-H]-; Sect. 3.17) for the analytes in each window and choose the most abundant product ion. The product ions (also the quantitation ions) chosen during method development are in Table 4, although these will be instrument dependent. For maximum sensitivity, small mass windows of ±0.5 daltons around the product ion mass were used for quantitation. If sufficient sensitivity exists to meet the MRL, wider mass ranges may be used to obtain more confirmation ions.
NOTE: As the NOTE in Section 10.2.4.1 indicates, PFOS has linear and
branched isomers. There have been reports10 that not all the products ions in the linear PFOS are produced in all the branched PFOS isomers. (This phenomenon probably exists for PFHxS and PFBS also, although it has not been studied to date.) Thus, in an attempt to reduce PFOS bias, it is required that the m/z 499 →→→→ m/z 80 transition be used as the quantitation transition. Some MS/MS instruments, such as conventional ion traps, may not be able to scan a product ion with such a wide mass difference from the precursor ion; therefore, they may not be used for this method if PFOS, PFBS, or PFHxS analysis is to be conducted. Literature reports10 indicate for the most abundant PFOS isomer, which is the linear isomer, that all the products ions obtained on an ion trap have less than 10% relative abundance. In addition, there is not a single ion trap MS/MS transition that encompasses the linear isomer and the majority of the branch isomers; thus, the bias would be unacceptably high.
10.2.4 Inject a mid-level CAL standard under optimized LC/MS/MS conditions to ensure
that each method analyte is observed in its MS/MS window and that there are at least 10 scans across the peak for optimum precision.
10.2.4.1 If broad, split or fronting peaks are observed for the first two eluting
chromatographic peaks (if only two analytes are being analyzed, both must be evaluated), change the initial mobile phase conditions to higher aqueous content until the peak asymmetry ratio for each peak is 0.8 – 1.5. The peak asymmetry factor is calculated as described in Section 9.3.9 on a mid-level CAL standard. The peak asymmetry factor must meet the above criteria for the first two eluting peaks during the IDL and every time a new calibration curve is generated. Modifying the standard or extract composition to more aqueous content to prevent poor shape is not permitted.
NOTE: PFHxS, PFOS, NMeFOSAA, and NEtFOSAA have multiple
chromatographic peaks using the LC conditions in Table 1 due to chromatographic resolution of the linear and branched isomers of these compounds. Most PFAAs are produced by two different processes. One process gives rise to linear
537-28
PFAAs only while the other process produces both linear and branched isomers. Thus, both branched and linear PFAAs can potentially be found in the environment. For the aforementioned compounds that give rise to more than one peak, all the chromatographic peaks observed in the standard must be integrated and the areas totaled. Chromatographic peaks in a sample must be integrated in the same way as the CAL standard.
10.2.5 Prepare a set of at least five CAL standards as described in Section 7.2.4. The
lowest concentration CAL standard must be at or below the MRL, which may depend on system sensitivity. It is recommended that at least four of the CAL standards are at a concentration greater than or equal to the MRL.
10.2.6 The LC/MS/MS system is calibrated using the IS technique. Use the LC/MS/MS
data system software to generate a linear regression or quadratic calibration curve for each of the analytes. This curve must always be forced through zero and may be concentration weighted, if necessary. Forcing zero allows for a better estimate of the background levels of method analytes.
10.2.6.1 The isotopically labeled IS(s) in this method may undergo suppression in
the ESI source if the concentration of the co-eluting unlabeled method analyte(s) is too high. The analyte concentration at which suppression may occur can vary depending on the instrument, LC conditions, ESI conditions, IS concentration, etc. To evaluate whether suppression is occurring during calibration, calculate the relative percent difference (RPD) between the high (H) and low (L) areas for each IS using the equation
( )
( ) 1002/
×+
−=LH
LHRPD
10.2.6.2 The RPD calculated above must be <20% for each IS during calibration. If
the calculated RPD is >20% for any IS, the analyst must recalibrate at lower analyte concentrations until the IS RPDs are <20%.
10.2.7 CALIBRATION ACCEPTANCE CRITERIA – When quantitated using the initial
calibration curve, each calibration point, except the lowest point, for each analyte should calculate to be within 70-130% of its true value. The lowest CAL point should calculate to be within 50-150% of its true value. If these criteria cannot be met, the analyst will have difficulty meeting ongoing QC criteria. It is recommended that corrective action is taken to reanalyze the CAL standards, restrict the range of calibration, or select an alternate method of calibration (forcing the curve through zero is still required).
CAUTION: When acquiring MS/MS data, LC operating conditions must be
carefully reproduced for each analysis to provide reproducible
537-29
retention times. If this is not done, the correct ions will not be monitored at the appropriate times. As a precautionary measure, the chromatographic peaks in each window must not elute too close to the edge of the segment time window.
10.3 CONTINUING CALIBRATION CHECK (CCC) – Minimum daily calibration
verification is as follows. Verify the initial calibration at the beginning and end of each group of analyses, and after every tenth sample during analyses. In this context, a “sample” is considered to be a Field Sample. LRBs, CCCs, LFBs, LFSMs, FDs FRBs and LFSMDs are not counted as samples. The beginning CCC of each analysis batch must be at or below the MRL in order to verify instrument sensitivity prior to any analyses. If standards have been prepared such that all low CAL points are not in the same CAL solution, it may be necessary to analyze two CAL standards to meet this requirement. Alternatively, the analyte concentrations in the analyte PDS may be customized to meet this criteria. Subsequent CCCs should alternate between a medium and high concentration CAL standard.
10.3.1 Inject an aliquot of the appropriate concentration CAL standard and analyze with
the same conditions used during the initial calibration. 10.3.2 Determine that the absolute areas of the quantitation ions of the IS(s) are within
70-140% of the areas measured in the most recent continuing calibration check, and within 50-150% from the average areas measured during initial calibration. If any of the IS areas has changed by more than these amounts, adjustments must be made to restore system sensitivity. These adjustments may include cleaning of the MS ion source, or other maintenance as indicated in Section 10.3.4. Major instrument maintenance requires recalibration (Sect 10.2) and verification of sensitivity by analyzing a CCC at or below the MRL (Sect 10.3). Control charts are useful aids in documenting system sensitivity changes.
10.3.3 Calculate the concentration of each analyte and SUR in the CCC. The calculated
amount for each analyte and SUR for medium and high level CCCs must be within ± 30% of the true value. The calculated amount for the lowest calibration point for each analyte must be within ± 50% and the SUR must be within ± 30% of the true value. If these conditions do not exist, then all data for the problem analyte must be considered invalid, and remedial action should be taken (Sect. 10.3.4) which may require recalibration. Any Field or QC Samples that have been analyzed since the last acceptable calibration verification should be reanalyzed after adequate calibration has been restored, with the following exception. If the CCC fails because the calculated concentration is greater than 130% (150% for the low-level CCC) for a particular method analyte, and Field Sample extracts show no detection for that method analyte, non-detects may be reported without re-analysis.
10.3.4 REMEDIAL ACTION – Failure to meet CCC QC performance criteria may
require remedial action. Major maintenance, such as cleaning the electrospray
537-30
probe, atmospheric pressure ionization source, cleaning the mass analyzer, replacing the LC column, etc., requires recalibration (Sect 10.2) and verification of sensitivity by analyzing a CCC at or below the MRL (Sect 10.3).
11. PROCEDURE
11.1 This procedure may be performed manually or in an automated mode using a robotic or automatic sample preparation device. The data presented in Tables 5-11 demonstrate data collected by manual extraction. If an automated system is used to prepare samples, follow the manufacturer's operating instructions, but all extraction and elution steps must be the same as in the manual procedure. Extraction and/or elution steps may not be changed or omitted to accommodate the use of an automated system. If an automated system is used, the LRBs should be rotated among the ports to ensure that all the valves and tubing meet the LRB requirements (Sect. 9.3.1).
11.2 Some of the PFAAs adsorb to surfaces, including polypropylene. Therefore, the
aqueous sample bottles must be rinsed with the elution solvent (Sect 11.4.4) whether extractions are performed manually or by automation. The bottle rinse is passed through the cartridge to elute the method analytes and is then collected (Sect. 11.4.4).
NOTE: The SPE cartridges and sample bottles described in this section are designed
as single use items and should be discarded after use. They may not be refurbished for reuse in subsequent analyses.
11.3 SAMPLE PREPARATION
11.3.1 Samples are preserved, collected and stored as presented in Section 8. All Field
and QC Samples, including the LRB, LFB and FRB, must contain the dechlorinating agent listed in Section 8.1.2. Determine sample volume. An indirect measurement may be done in one of two ways: by marking the level of the sample on the bottle or by weighing the sample and bottle to the nearest 10 g. After extraction, proceed to Section 11.6 for final volume determination. Some of the PFAAs adsorb to surfaces, thus the sample volume may NOT be transferred to a graduated cylinder for volume measurement. The LRB, LFB and FRB may be prepared by measuring 250 mL of reagent water with a polypropylene graduated cylinder or filling a 250-mL sample bottle to near the top.
11.3.2 Add an aliquot of the SUR PDS (Sect. 7.2.2.2) to each sample, cap and invert to
mix. During method development, a 10-µL aliquot of the 1-4 ng/µL SUR PDS (Sect. 7.2.2.2) was added to 250 mL of sample for a final concentration of 40 ng/L for 13C-PFHxA and 13C-PFDA and 160 ng/L for d5-NEtFOSAA.
11.3.3 In addition to the SUR(s) and dechlorination agent, if the sample is an LFB, FD,
LFSM, or LFSMD, add the necessary amount of analyte PDS (Sect. 7.2.3.2). Cap and invert each sample to mix.
537-31
11.4 CARTRIDGE SPE PROCEDURE
11.4.1 CARTRIDGE CLEAN-UP AND CONDITIONING – DO NOT allow cartridge packing material to go dry during any of the conditioning steps. Rinse each cartridge with 15 mL of methanol. Next, rinse each cartridge with 18 mL of reagent water, without allowing the water to drop below the top edge of the packing. If the cartridge goes dry during the conditioning phase, the conditioning must be started over. Add 4-5 mL of reagent water to each cartridge, attach the sample transfer tubes (Sect. 6.9.3), turn on the vacuum, and begin adding sample to the cartridge.
11.4.2 SAMPLE EXTRACTON – Adjust the vacuum so that the approximate flow rate
is 10-15 mL/min. Do not allow the cartridge to go dry before all the sample has passed through.
11.4.3 SAMPLE BOTTLE AND CARTRIDGE RINSE – After the entire sample has
passed through the cartridge, rinse the sample bottles with two 7.5-mL aliquots of reagent water and draw each aliquot through the sample transfer tubes and the cartridges. Draw air or nitrogen through the cartridge for 5 min at high vacuum (10-15 in. Hg).
NOTE: If empty plastic reservoirs are used in place of the sample transfer
tubes to pass the samples through the cartridges, these reservoirs must be treated like the transfer tubes. After the entire sample has passed through the cartridge, the reservoirs must be rinsed to waste with reagent water.
11.4.4 SAMPLE BOTTLE AND CARTRIDGE ELUTION – Turn off and release the
vacuum. Lift the extraction manifold top and insert a rack with collection tubes into the extraction tank to collect the extracts as they are eluted from the cartridges. Rinse the sample bottles with 4 mL of methanol and elute the analytes from the cartridges by pulling the 4 mL of methanol through the sample transfer tubes and the cartridges. Use a low vacuum such that the solvent exits the cartridge in a dropwise fashion. Repeat sample bottle rinse and cartridge elution with a second 4-mL aliquot of methanol.
NOTE: If empty plastic reservoirs are used in place of the sample transfer
tubes to pass the samples through the cartridges, these reservoirs must be treated like the transfer tubes. After the reservoirs have been rinsed in Section 11.4.3, the elution solvent used to rinse the sample bottles must be swirled down the sides of the reservoirs while eluting the cartridge to ensure that any method analytes on the surface of the reservoirs are transferred to the extract.
11.5 EXTRACT CONCENTRATION – Concentrate the extract to dryness under a gentle
stream of nitrogen in a heated water bath (60-65 °C) to remove all the water/methanol
537-32
mix. Add the appropriate amount of 96:4% (vol/vol) methanol:water solution and the IS PDS (Sect. 7.2.1.2) to the collection vial to bring the volume to 1 mL and vortex. (10 µL of the 1-4 ng/µL IS PDS for extract concentrations of 10-40 pg/µL were used for method development). Transfer a small aliquot with a plastic pipet (Sect. 6.7) to a polypropylene autosampler vial.
NOTE: It is recommend that the entire 1-mL aliquot not be transferred to the
autosampler vial because the polypropylene autosampler caps do not reseal after injection. Therefore, do not store the extracts in the autosampler vials as evaporation losses can occur occasionally in these autosampler vials. Extracts can be stored in 15-mL centrifuge tubes (Sect. 6.3).
11.6 SAMPLE VOLUME DETERMINATION – If the level of the sample was marked on
the sample bottle, use a graduated cylinder to measure the volume of water required to fill the original sample bottle to the mark made prior to extraction. Determine to the nearest 10 mL. If using weight to determine volume, weigh the empty bottle to the nearest 10 g and determine the sample weight by subtraction of the empty bottle weight from the original sample weight (Sect. 11.3.1). Assume a sample density of 1.0 g/mL. In either case, the sample volume will be used in the final calculations of the analyte concentration (Sect. 12.2).
11.7 EXTRACT ANALYSIS
11.7.1 Establish operating conditions equivalent to those summarized in Tables 1-4 of
Section 17. Instrument conditions and columns should be optimized prior to the initiation of the IDC.
11.7.2 Establish an appropriate retention time window for each analyte. This should be
based on measurements of actual retention time variation for each method analyte in CAL standard solutions analyzed on the LC over the course of time. A value of plus or minus three times the standard deviation of the retention time obtained for each method analyte while establishing the initial calibration and completing the IDC can be used to calculate a suggested window size. However, the experience of the analyst should weigh heavily on the determination of the appropriate retention window size.
11.7.3 Calibrate the system by either the analysis of a calibration curve (Sect. 10.2) or by
confirming the initial calibration is still valid by analyzing a CCC as described in Section 10.3. If establishing an initial calibration, complete the IDC as described in Section 9.2.
11.7.4 Begin analyzing Field Samples, including QC samples, at their appropriate
frequency by injecting the same size aliquots (10 µL was used in method development), under the same conditions used to analyze the CAL standards.
537-33
11.7.5 At the conclusion of data acquisition, use the same software that was used in the calibration procedure to identify peaks of interest in predetermined retention time windows. Use the data system software to examine the ion abundances of the peaks in the chromatogram. Identify an analyte by comparison of its retention time with that of the corresponding method analyte peak in a reference standard. Comparison of the MS/MS mass spectra is not particularly useful given the limited ±0.5 dalton mass range around a single product ion for each method analyte.
11.7.6 The analyst must not extrapolate beyond the established calibration range. If an
analyte peak area exceeds the range of the initial calibration curve, the extract may be diluted with 96%:4% (vol/vol) methanol:water solution and the appropriate amount of IS added to match the original concentration. Re-inject the diluted extract. Incorporate the dilution factor into the final concentration calculations. Acceptable SUR performance (Sect. 9.3.5.1) should be determined from the undiluted sample extract. The resulting data should be documented as a dilution, with an increased MRL.
12. DATA ANALYSIS AND CALCULATION
12.1. Complete chromatographic resolution is not necessary for accurate and precise measurements of analyte concentrations using MS/MS. In validating this method, concentrations were calculated by measuring the product ions listed in Table 4. Other ions may be selected at the discretion of the analyst.
12.2. Calculate analyte and SUR concentrations using the multipoint calibration established
in Section 10.2. Do not use daily calibration verification data to quantitate analytes in samples. Adjust final analyte concentrations to reflect the actual sample volume determined in Section 11.6.
12.3 Prior to reporting the data, the chromatogram should be reviewed for any incorrect
peak identification or poor integration. 12.4 PFHxS, PFOS, NMeFOSAA, and NEtFOSAA have multiple chromatographic peaks
using the LC conditions in Table 1 due to the linear and branch isomers of these compounds (Sect. 10.2.4.1). The areas of all the linear and branched isomer peaks observed in the CAL standards for each of these analytes must be summed and the concentrations reported as a total for each of these analytes.
12.5 Calculations must utilize all available digits of precision, but final reported
concentrations should be rounded to an appropriate number of significant figures (one digit of uncertainty), typically two, and not more than three significant figures.
NOTE: Some data in Section 17 of this method are reported with more than two
significant figures. This is done to better illustrate the method performance.
537-34
13. METHOD PERFORMANCE
13.1 PRECISION, ACCURACY, AND MINIMUM REPORTING LEVELS – Tables for these data are presented in Section 17. LCMRLs and DLs for each method analyte are presented in Table 5. Precision and accuracy are presented for four water matrices: reagent water (Tables 6 and 7); chlorinated (finished) ground water (Table 8); high TOC chlorinated surface water (Table 9); and day zero of the aqueous holding time in chlorinated surface water (Table 10).
13.2 EVALUATION OF ADDITIONAL PERFLUORINATED ALKYL COMPOUNDS – Nine additional compounds were evaluated for inclusion in this method, but were not included for the following reasons. Due to volatility, low recoveries following evaporation were obtained for PFOSA (perfluorooctane sulfonylamide), NEtFOSE (2-N-ethylperfluorooctane sulfonamide ethanol), NMeFOSE (2-N-methylperfluorooctane sulfonamide ethanol), and NEtFOSA (N-ethylperfluorooctanesulfonamide). Poor chromatographic peak shape, which degraded with repeated injections, was obtained for PFOSAA (perfluorooctanesulfonamidoacetic acid). PFOSfn (perfluorosulfinate) degraded in aqueous samples in under 24 hours. PFOSF (perfluorooctane-1-sulfonylfluoride) had the same LC retention time as PFOS and appeared to undergo conversion in the ESI source to PFOS under method conditions. Finally, acceptable SPE recoveries were not obtained for PFBA (perfluorobutanoic acid) and PFPA (perfluoropentanoic acid).
13.3 SAMPLE STORAGE STABILITY STUDIES – An analyte storage stability study was conducted by fortifying the analytes into chlorinated surface water samples that were collected, preserved, and stored as described in Section 8. The precision and mean recovery (n=5) of analyses, conducted on Days 0, 7, and 14 are presented in Table 10.
13.4 EXTRACT STORAGE STABILITY STUDIES – Extract storage stability studies
were conducted on extracts obtained from a chlorinated surface water fortified with the method analytes. The precision and mean recovery (n=5) of injections conducted on Days 0, 7, 14, 22, and 28 are reported in Table 11.
13.5 SECOND LABORATORY DEMONSTRATION – The performance of this method
was demonstrated by multiple laboratories, with results similar to those reported in Section 17. The authors wish to acknowledge the work of the Suffolk County Water Authority Laboratory Hauppauge, NY and Lancaster Labs, a wholly owned subsidiary of Thermo Fisher Scientific, for their participation in the second laboratory demonstration.
14. POLLUTION PREVENTION
14.1 This method utilizes SPE to extract analytes from water. It requires the use of very
small volumes of organic solvent and very small quantities of pure analytes, thereby minimizing the potential hazards to both the analyst and the environment as compared
537-35
to the use of large volumes of organic solvents in conventional liquid-liquid extractions.
14.2 For information about pollution prevention that may be applicable to laboratory
operations, consult “Less is Better: Laboratory Chemical Management for Waste Reduction” available from the American Chemical Society’s Department of Government Relations and Science Policy, 1155 16th Street N.W., Washington, D.C., 20036 or on-line at http://membership.acs.org/c/ccs/pub_9.htm (accessed August 2008).
15. WASTE MANAGEMENT
15.1 The analytical procedures described in this method generate relatively small amounts of waste since only small amounts of reagents and solvents are used. The matrices of concern are finished drinking water or source water. However, laboratory waste management practices must be conducted consistent with all applicable rules and regulations, and that laboratories protect the air, water, and land by minimizing and controlling all releases from fume hoods and bench operations. Also, compliance is required with any sewage discharge permits and regulations, particularly the hazardous waste identification rules and land disposal restrictions.
16. REFERENCES 1. Winslow, S.D., Pepich, B.V., Martin, J.J., Hallberg, G.R., Munch, D.J., Frebis, C.P.,
Hedrick, E.J., Krop, R.A. “Statistical Procedures for Determination and Verification of Minimum Reporting Levels for Drinking water Methods.” Environ. Sci. & Technol. 2004, 40, 281-288.
2. Glaser, J.A., D.L. Foerst, G.D. McKee, S.A. Quave, W.L. Budde, "Trace Analyses for
Wastewaters.” Environ. Sci. Technol. 1981, 15, 1426-1435. 3. Martin, J.W., Kannan, K., Berger, U., De Voogt, P., Field, J., Franklin, J, Giesy, J.P., Harner,
T., Muir, D.C., Scott, B., Kaiser, M., Järnberg, U., Jones, K.C., Mabury, S.A., Schroeder, H., Simcik, M., Sottani, C., van Bavel, B., Kärrman, A., Lindström, G., van Leeuwen, S. “Analytical Challenges Hamper Perfluoroalkyl Research.” Environ Sci Technol. 2004, 38, 248A-255A.
4. Leenheer, J.A., Rostad, C.E., Gates, P.M., Furlong, E.T., Ferrer, I. “Molecular Resolution
and Fragmentation of Fulvic Acid by Electrospray Ionization/Multistage Tandem Mass Spectrometry.” Anal. Chem. 2001, 73, 1461-1471.
5. Cahill, J.D., Furlong E.T., Burkhardt, M.R., Kolpin, D., Anderson, L.G. “Determination of
Pharmaceutical Compounds in Surface- and Ground-Water Samples by Solid-Phase Extraction and High-Performance Liquid Chromatography Electrospray Ionization Mass Spectrometry.” J. Chromatogr. A 2004, 1041, 171-180.
537-36
6. “OSHA Safety and Health Standards, General Industry," (29CRF1910). Occupational Safety and Health Administration, OSHA 2206, (Revised, July 1, 2001).
7. “Carcinogens-Working with Carcinogens,” Publication No. 77-206, Department of Health,
Education, and Welfare, Public Health Service, Center for Disease Control, National Institute of Occupational Safety and Health, Atlanta, Georgia, August 1977.
8. "Safety in Academic Chemistry Laboratories,” American Chemical Society Publication,
Committee on Chemical Safety, 7th Edition. Information on obtaining a copy is available at http://membership.acs.org/C/CCS/pub_3.htm (accessed August, 2008). Also available by request at [email protected].
9. “SAB Review of EPA’s Draft Risk Assessment of Potential Human Health Effects
Associated with PFOA and Its Salts.” Document available at http://yosemite.epa.gov/sab/SABPRODUCT.NSF/A3C83648E77252828525717F004B9099/$File/sab_06_006.pdf (accessed August, 2008).
10. Langlois, I. and Oehme, M. “Structural Identification of Isomers Present In Technical
Perfluorooctane Sulfonate By Tandem Mass Spectrometry.” Rapid Commun. Mass Spectrom. 2006, 20, 844-850.
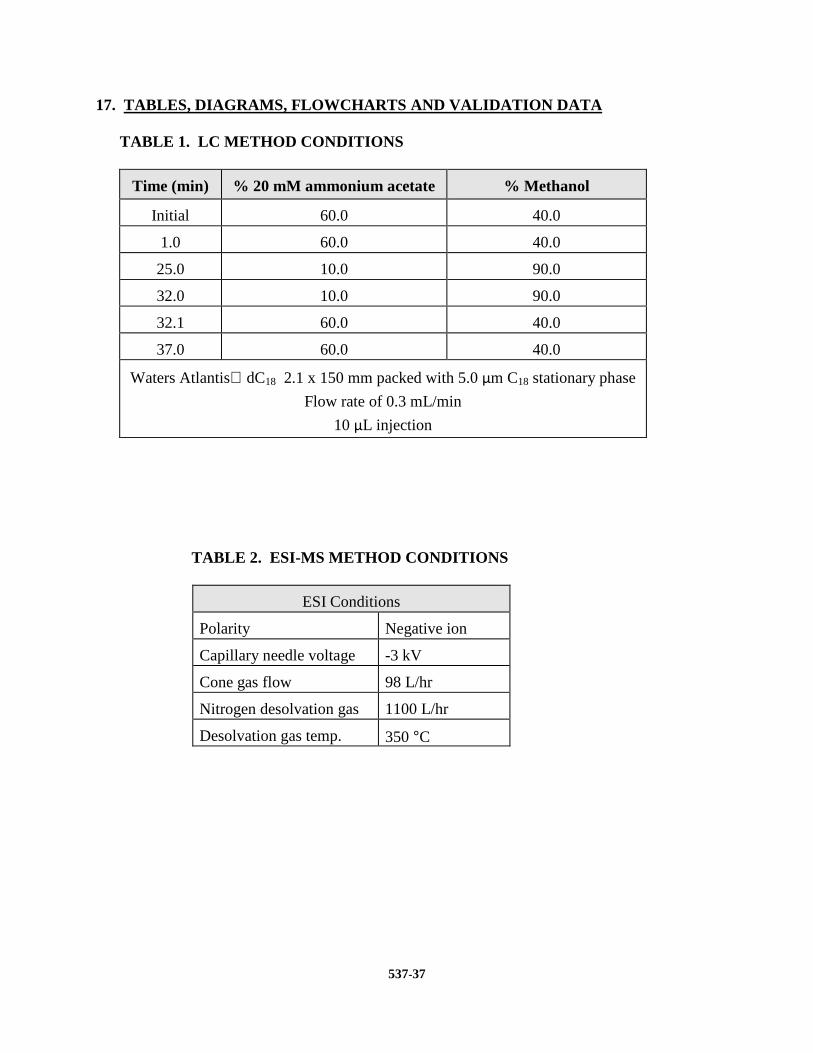
537-37
17. TABLES, DIAGRAMS, FLOWCHARTS AND VALIDATION DA TA
TABLE 1. LC METHOD CONDITIONS
Time (min) % 20 mM ammonium acetate % Methanol
Initial 60.0 40.0
1.0 60.0 40.0
25.0 10.0 90.0
32.0 10.0 90.0
32.1 60.0 40.0
37.0 60.0 40.0
Waters Atlantis dC18 2.1 x 150 mm packed with 5.0 µm C18 stationary phase
Flow rate of 0.3 mL/min
10 µL injection
TABLE 2. ESI-MS METHOD CONDITIONS
ESI Conditions
Polarity Negative ion
Capillary needle voltage -3 kV
Cone gas flow 98 L/hr
Nitrogen desolvation gas 1100 L/hr
Desolvation gas temp. 350 °C
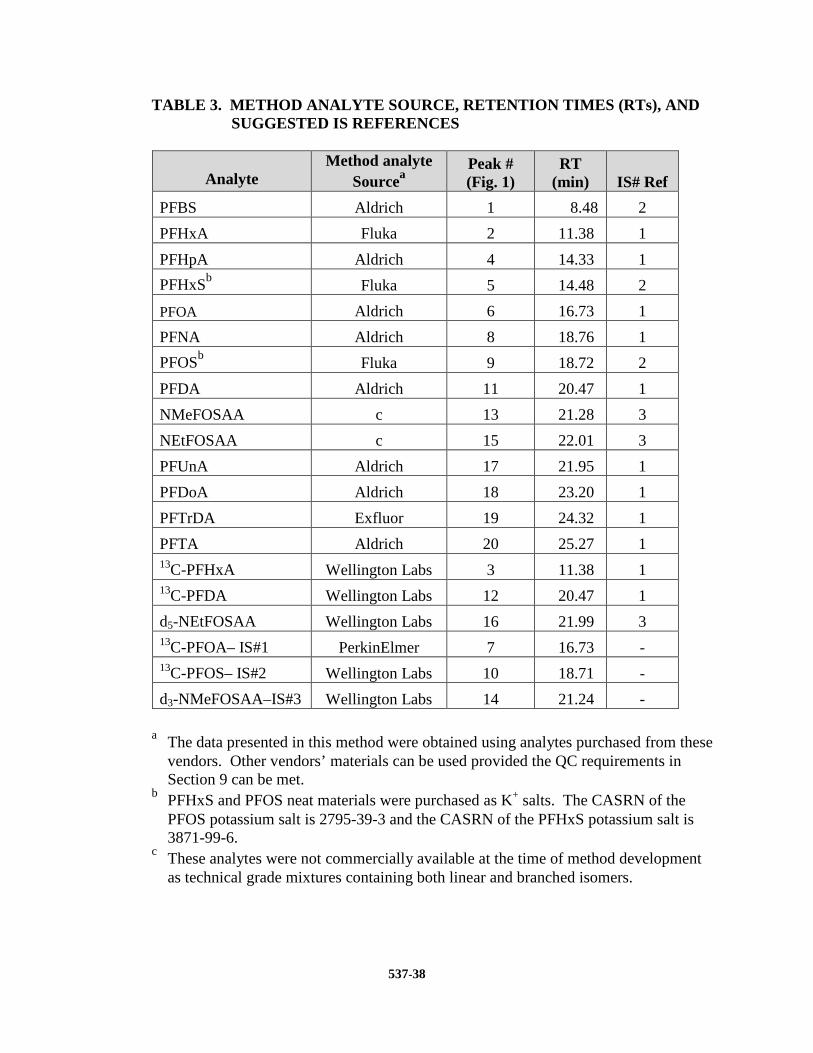
537-38
TABLE 3. METHOD ANALYTE SOURCE, RETENTION TIMES (RTs), AND SUGGESTED IS REFERENCES
Analyte Method analyte
Sourcea Peak # (Fig. 1)
RT (min)
IS# Ref
PFBS Aldrich 1 8.48 2
PFHxA Fluka 2 11.38 1
PFHpA Aldrich 4 14.33 1
PFHxSb Fluka 5 14.48 2
PFOA Aldrich 6 16.73 1
PFNA Aldrich 8 18.76 1
PFOSb Fluka 9 18.72 2
PFDA Aldrich 11 20.47 1
NMeFOSAA c 13 21.28 3
NEtFOSAA c 15 22.01 3
PFUnA Aldrich 17 21.95 1
PFDoA Aldrich 18 23.20 1
PFTrDA Exfluor 19 24.32 1
PFTA Aldrich 20 25.27 1 13C-PFHxA Wellington Labs 3 11.38 1 13C-PFDA Wellington Labs 12 20.47 1
d5-NEtFOSAA Wellington Labs 16 21.99 3 13C-PFOA– IS#1 PerkinElmer 7 16.73 - 13C-PFOS– IS#2 Wellington Labs 10 18.71 -
d3-NMeFOSAA–IS#3 Wellington Labs 14 21.24 -
a The data presented in this method were obtained using analytes purchased from these vendors. Other vendors’ materials can be used provided the QC requirements in Section 9 can be met.
b PFHxS and PFOS neat materials were purchased as K+ salts. The CASRN of the PFOS potassium salt is 2795-39-3 and the CASRN of the PFHxS potassium salt is 3871-99-6.
c These analytes were not commercially available at the time of method development as technical grade mixtures containing both linear and branched isomers.
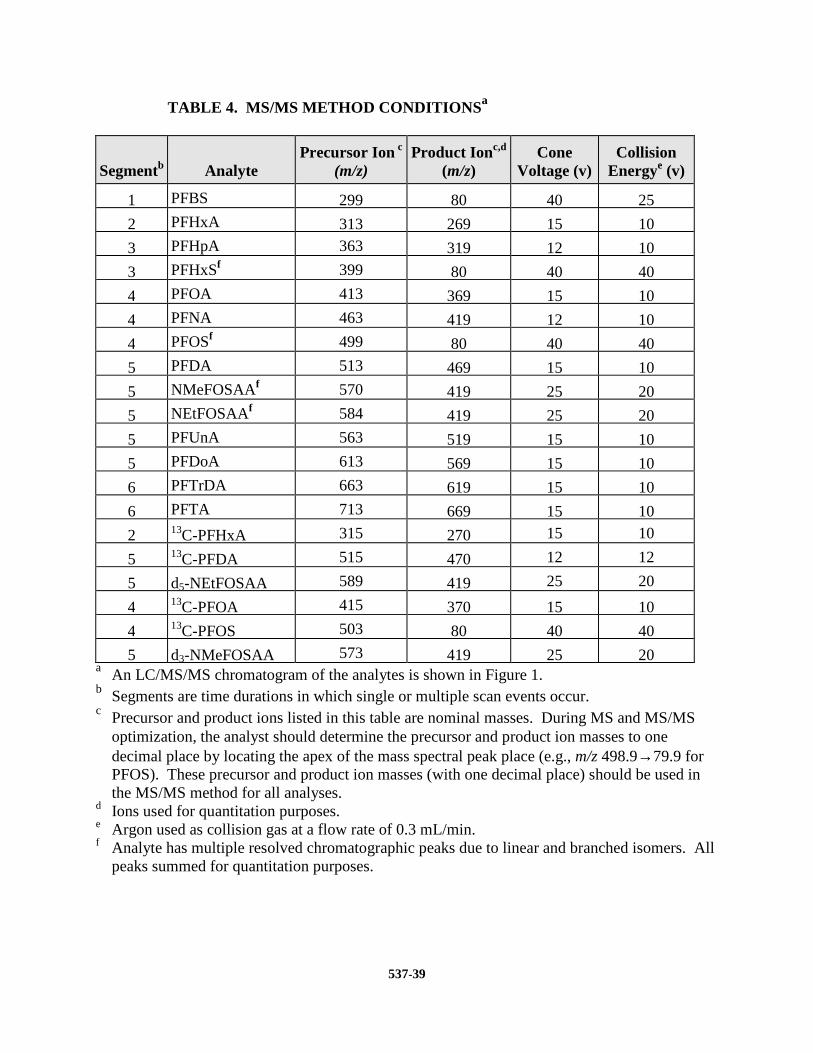
537-39
TABLE 4. MS/MS METHOD CONDITIONS a
Segmentb Analyte Precursor Ion c
(m/z) Product Ionc,d
(m/z) Cone
Voltage (v) Collision
Energye (v)
1 PFBS 299 80 40 25
2 PFHxA 313 269 15 10
3 PFHpA 363 319 12 10
3 PFHxSf 399 80 40 40
4 PFOA 413 369 15 10
4 PFNA 463 419 12 10
4 PFOSf 499 80 40 40
5 PFDA 513 469 15 10
5 NMeFOSAAf 570 419 25 20
5 NEtFOSAAf 584 419 25 20
5 PFUnA 563 519 15 10
5 PFDoA 613 569 15 10
6 PFTrDA 663 619 15 10
6 PFTA 713 669 15 10
2 13C-PFHxA 315 270 15 10
5 13C-PFDA 515 470 12 12
5 d5-NEtFOSAA 589 419 25 20
4 13C-PFOA 415 370 15 10
4 13C-PFOS 503 80 40 40
5 d3-NMeFOSAA 573 419 25 20 a An LC/MS/MS chromatogram of the analytes is shown in Figure 1. b Segments are time durations in which single or multiple scan events occur. c Precursor and product ions listed in this table are nominal masses. During MS and MS/MS
optimization, the analyst should determine the precursor and product ion masses to one decimal place by locating the apex of the mass spectral peak place (e.g., m/z 498.9→79.9 for PFOS). These precursor and product ion masses (with one decimal place) should be used in the MS/MS method for all analyses.
d Ions used for quantitation purposes. e Argon used as collision gas at a flow rate of 0.3 mL/min. f Analyte has multiple resolved chromatographic peaks due to linear and branched isomers. All
peaks summed for quantitation purposes.
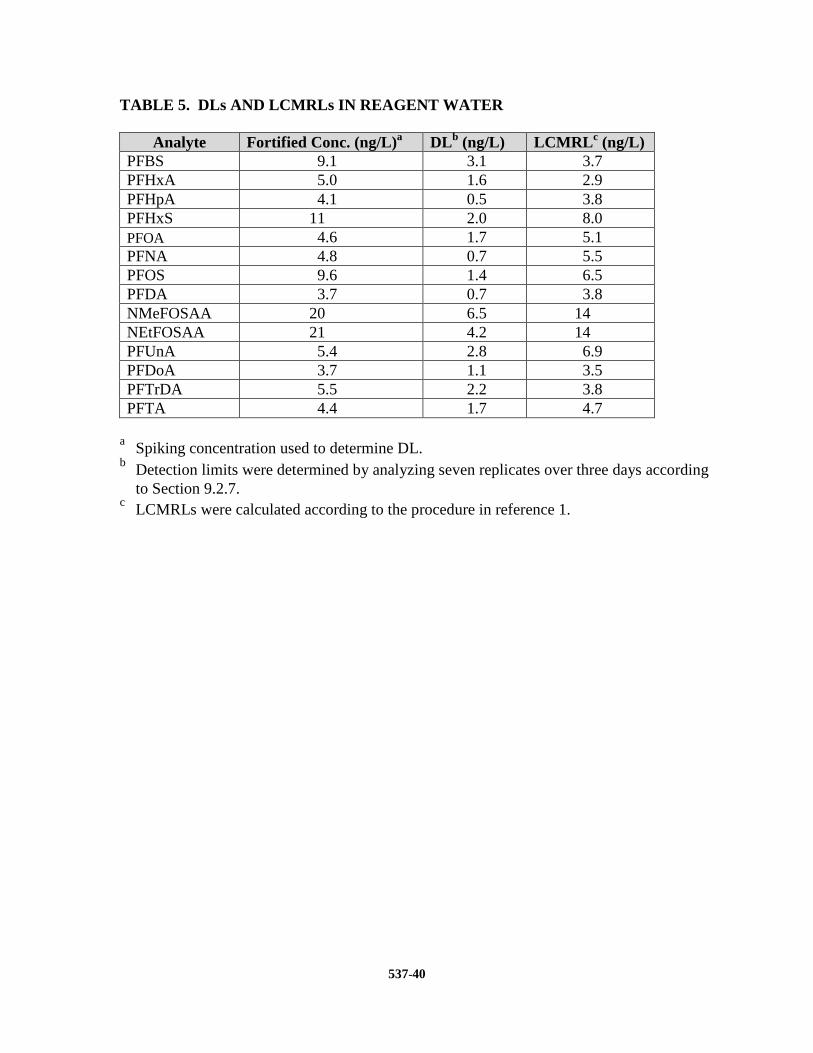
537-40
TABLE 5. DLs AND LCMRLs IN REAGENT WATER
Analyte Fortified Conc. (ng/L)a DL b (ng/L) LCMRL c (ng/L) PFBS 9.1 3.1 3.7 PFHxA 5.0 1.6 2.9 PFHpA 4.1 0.5 3.8 PFHxS 11 2.0 8.0 PFOA 4.6 1.7 5.1 PFNA 4.8 0.7 5.5 PFOS 9.6 1.4 6.5 PFDA 3.7 0.7 3.8 NMeFOSAA 20 6.5 14 NEtFOSAA 21 4.2 14 PFUnA 5.4 2.8 6.9 PFDoA 3.7 1.1 3.5 PFTrDA 5.5 2.2 3.8 PFTA 4.4 1.7 4.7
a Spiking concentration used to determine DL. b Detection limits were determined by analyzing seven replicates over three days according
to Section 9.2.7. c LCMRLs were calculated according to the procedure in reference 1.

537-41
TABLE 6. PRECISION AND ACCURACY OF LOW LEVEL FORTIFIED REAGE NT WATER (n=7)
Analyte Fortified Conc. (ng/L) Mean % Recovery % RSD
PFBS 9.1 93 12
PFHxA 5.0 108 9.3
PFHpA 8.3 111 6.2
PFHxS 11 116 4.9
PFOA 9.1 110 6.5
PFNA 9.6 121 7.5
PFOS 9.6 116 4.1
PFDA 7.3 114 4.1
NMeFOSAA 20 109 9.3
NEtFOSAA 21 113 5.5
PFUnA 11 120 5.4
PFDoA 7.3 116 4.6
PFTrDA 5.5 118 11
PFTA 8.7 117 2.4 13C-PFHxA 40 89 6.1 13C-PFDA 40 102 7.3
d5-NEtFOSAA 160 100 4.9
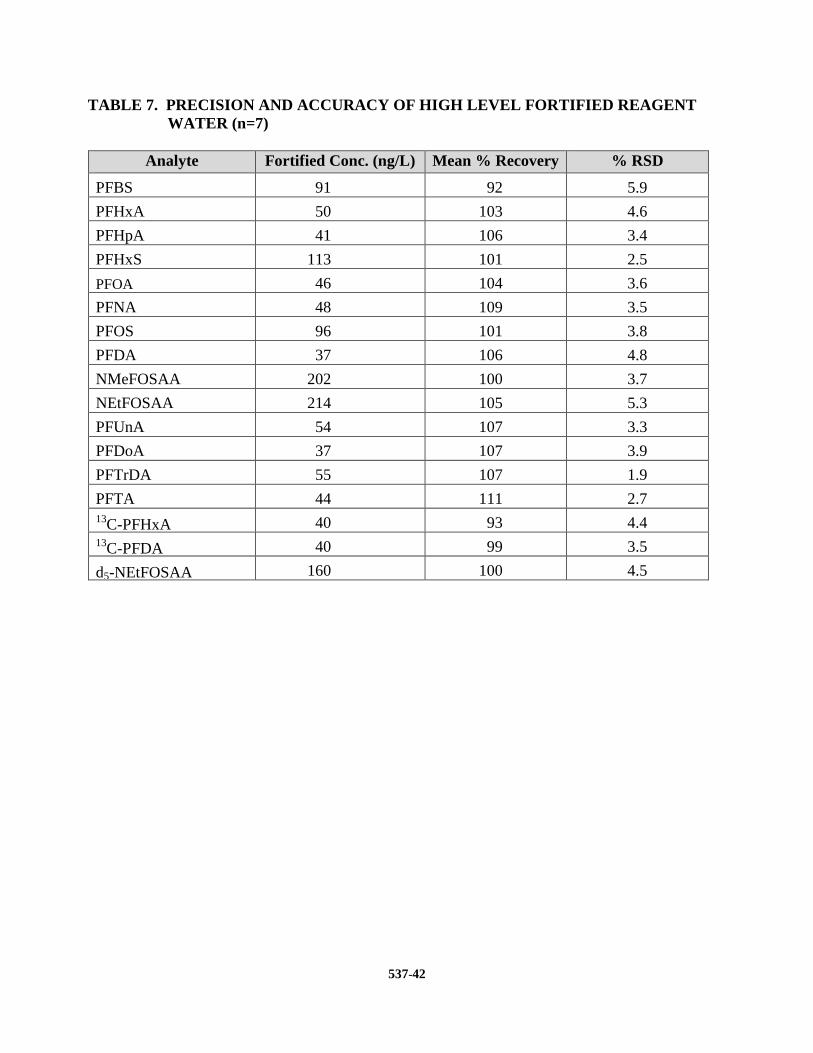
537-42
TABLE 7. PRECISION AND ACCURACY OF HIGH LEVEL FORTIFIED REAG ENT WATER (n=7)
Analyte Fortified Conc. (ng/L) Mean % Recovery % RSD
PFBS 91 92 5.9
PFHxA 50 103 4.6
PFHpA 41 106 3.4
PFHxS 113 101 2.5
PFOA 46 104 3.6
PFNA 48 109 3.5
PFOS 96 101 3.8
PFDA 37 106 4.8
NMeFOSAA 202 100 3.7
NEtFOSAA 214 105 5.3
PFUnA 54 107 3.3
PFDoA 37 107 3.9
PFTrDA 55 107 1.9
PFTA 44 111 2.7 13C-PFHxA 40 93 4.4 13C-PFDA 40 99 3.5
d5-NEtFOSAA 160 100 4.5
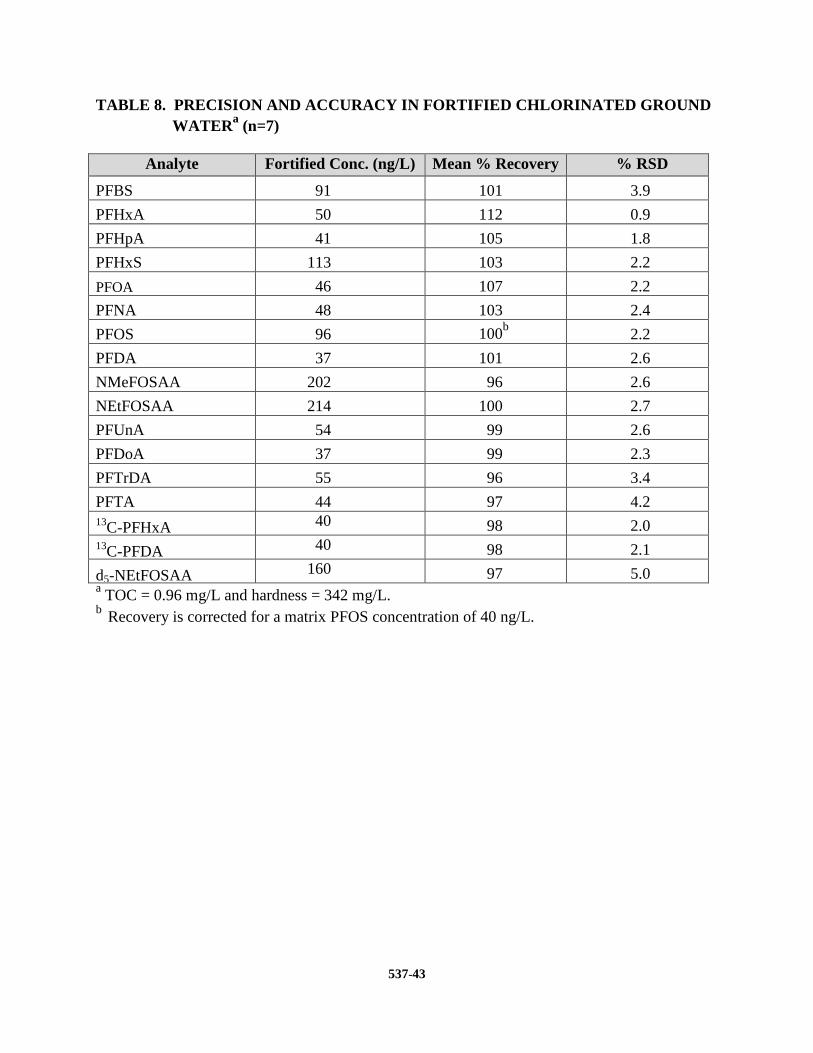
537-43
TABLE 8. PRECISION AND ACCURACY IN FORTIFIED CHLORINATED GRO UND WATER a (n=7)
Analyte Fortified Conc. (ng/L) Mean % Recovery % RSD
PFBS 91 101 3.9
PFHxA 50 112 0.9
PFHpA 41 105 1.8
PFHxS 113 103 2.2
PFOA 46 107 2.2
PFNA 48 103 2.4
PFOS 96 100b 2.2
PFDA 37 101 2.6
NMeFOSAA 202 96 2.6
NEtFOSAA 214 100 2.7
PFUnA 54 99 2.6
PFDoA 37 99 2.3
PFTrDA 55 96 3.4
PFTA 44 97 4.2 13C-PFHxA 40 98 2.0 13C-PFDA 40 98 2.1
d5-NEtFOSAA 160 97 5.0 a TOC = 0.96 mg/L and hardness = 342 mg/L. b Recovery is corrected for a matrix PFOS concentration of 40 ng/L.
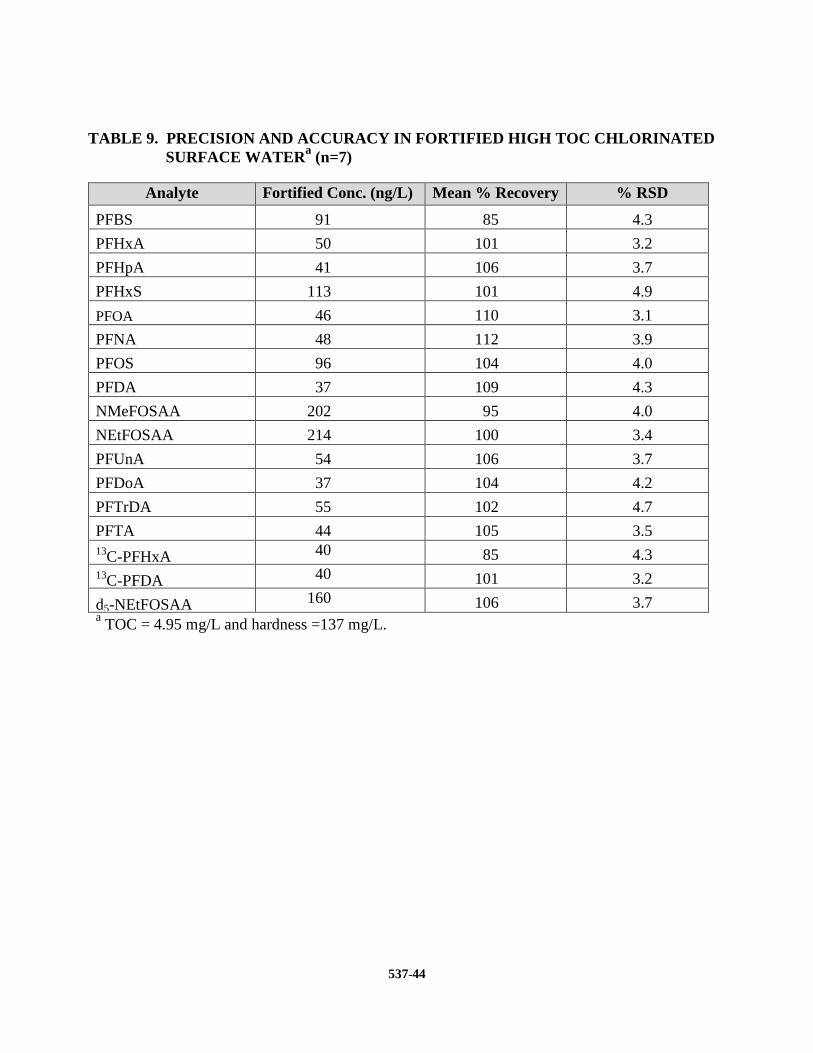
537-44
TABLE 9. PRECISION AND ACCURACY IN FORTIFIED HIGH TOC CHLORINATED SURFACE WATERa (n=7)
Analyte Fortified Conc. (ng/L) Mean % Recovery % RSD
PFBS 91 85 4.3
PFHxA 50 101 3.2
PFHpA 41 106 3.7
PFHxS 113 101 4.9
PFOA 46 110 3.1
PFNA 48 112 3.9
PFOS 96 104 4.0
PFDA 37 109 4.3
NMeFOSAA 202 95 4.0
NEtFOSAA 214 100 3.4
PFUnA 54 106 3.7
PFDoA 37 104 4.2
PFTrDA 55 102 4.7
PFTA 44 105 3.5 13C-PFHxA 40 85 4.3 13C-PFDA 40 101 3.2
d5-NEtFOSAA 160 106 3.7 a TOC = 4.95 mg/L and hardness =137 mg/L.
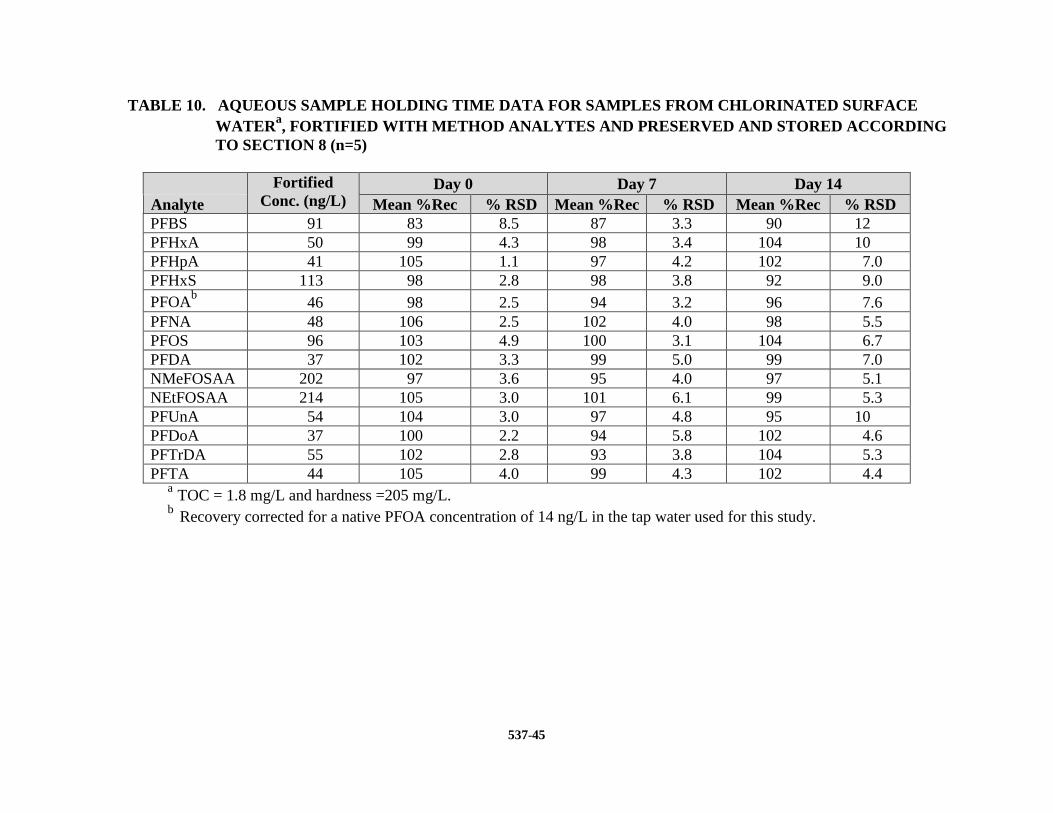
537-45
TABLE 10. AQUEOUS SAMPLE HOLDING TIME DATA FOR SA MPLES FROM CHLORINATED SURFACE WATER a, FORTIFIED WITH METHOD ANALYTES AND PRESERVED AND STORED ACCORDING TO SECTION 8 (n=5)
Fortified
Conc. (ng/L) Day 0 Day 7 Day 14
Analyte Mean %Rec % RSD Mean %Rec % RSD Mean %Rec % RSD PFBS 91 83 8.5 87 3.3 90 12 PFHxA 50 99 4.3 98 3.4 104 10 PFHpA 41 105 1.1 97 4.2 102 7.0 PFHxS 113 98 2.8 98 3.8 92 9.0 PFOAb 46 98 2.5 94 3.2 96 7.6 PFNA 48 106 2.5 102 4.0 98 5.5 PFOS 96 103 4.9 100 3.1 104 6.7 PFDA 37 102 3.3 99 5.0 99 7.0 NMeFOSAA 202 97 3.6 95 4.0 97 5.1 NEtFOSAA 214 105 3.0 101 6.1 99 5.3 PFUnA 54 104 3.0 97 4.8 95 10 PFDoA 37 100 2.2 94 5.8 102 4.6 PFTrDA 55 102 2.8 93 3.8 104 5.3 PFTA 44 105 4.0 99 4.3 102 4.4
a TOC = 1.8 mg/L and hardness =205 mg/L. b Recovery corrected for a native PFOA concentration of 14 ng/L in the tap water used for this study.
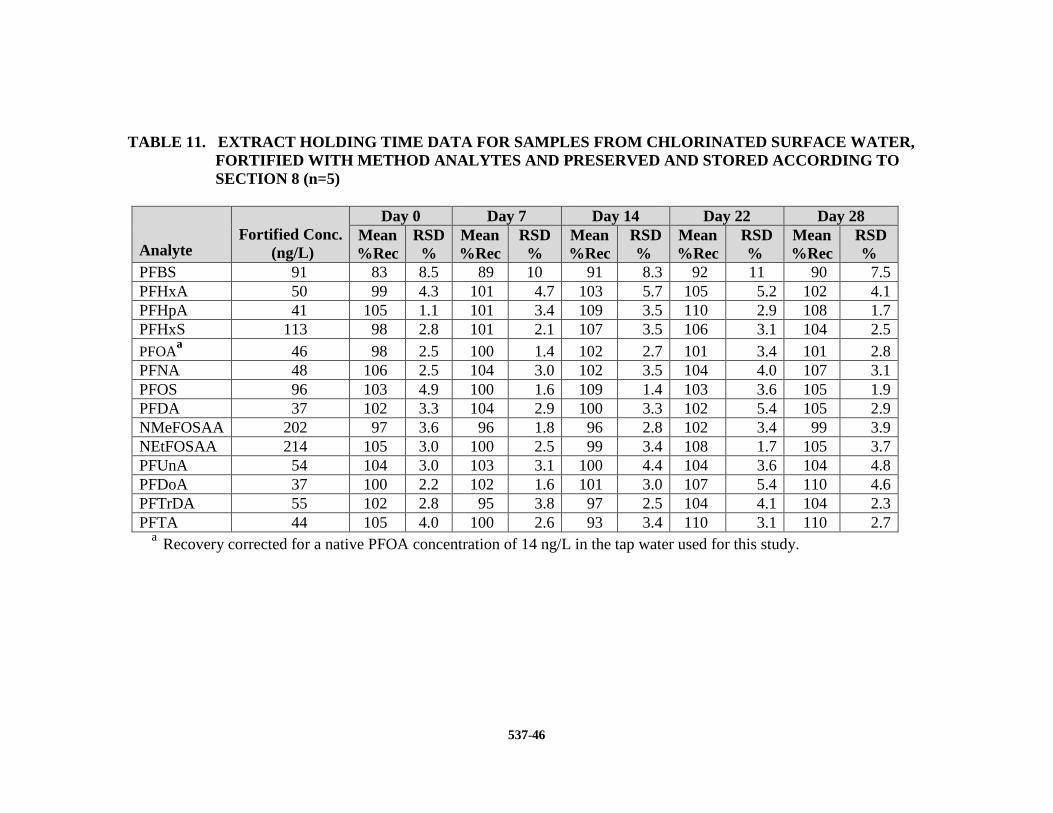
537-46
TABLE 11. EXTRACT HOLDING TIME DATA FOR SAMPLES F ROM CHLORINATED SURFACE WATER,
FORTIFIED WITH METHOD ANALYTES AND PRESERVED AND ST ORED ACCORDING TO SECTION 8 (n=5)
Analyte
Fortified Conc.
(ng/L)
Day 0 Day 7 Day 14 Day 22 Day 28 Mean %Rec
RSD %
Mean %Rec
RSD %
Mean %Rec
RSD %
Mean %Rec
RSD %
Mean %Rec
RSD %
PFBS 91 83 8.5 89 10 91 8.3 92 11 90 7.5 PFHxA 50 99 4.3 101 4.7 103 5.7 105 5.2 102 4.1 PFHpA 41 105 1.1 101 3.4 109 3.5 110 2.9 108 1.7 PFHxS 113 98 2.8 101 2.1 107 3.5 106 3.1 104 2.5 PFOA
a 46 98 2.5 100 1.4 102 2.7 101 3.4 101 2.8
PFNA 48 106 2.5 104 3.0 102 3.5 104 4.0 107 3.1 PFOS 96 103 4.9 100 1.6 109 1.4 103 3.6 105 1.9 PFDA 37 102 3.3 104 2.9 100 3.3 102 5.4 105 2.9 NMeFOSAA 202 97 3.6 96 1.8 96 2.8 102 3.4 99 3.9 NEtFOSAA 214 105 3.0 100 2.5 99 3.4 108 1.7 105 3.7 PFUnA 54 104 3.0 103 3.1 100 4.4 104 3.6 104 4.8 PFDoA 37 100 2.2 102 1.6 101 3.0 107 5.4 110 4.6 PFTrDA 55 102 2.8 95 3.8 97 2.5 104 4.1 104 2.3 PFTA 44 105 4.0 100 2.6 93 3.4 110 3.1 110 2.7
a Recovery corrected for a native PFOA concentration of 14 ng/L in the tap water used for this study.
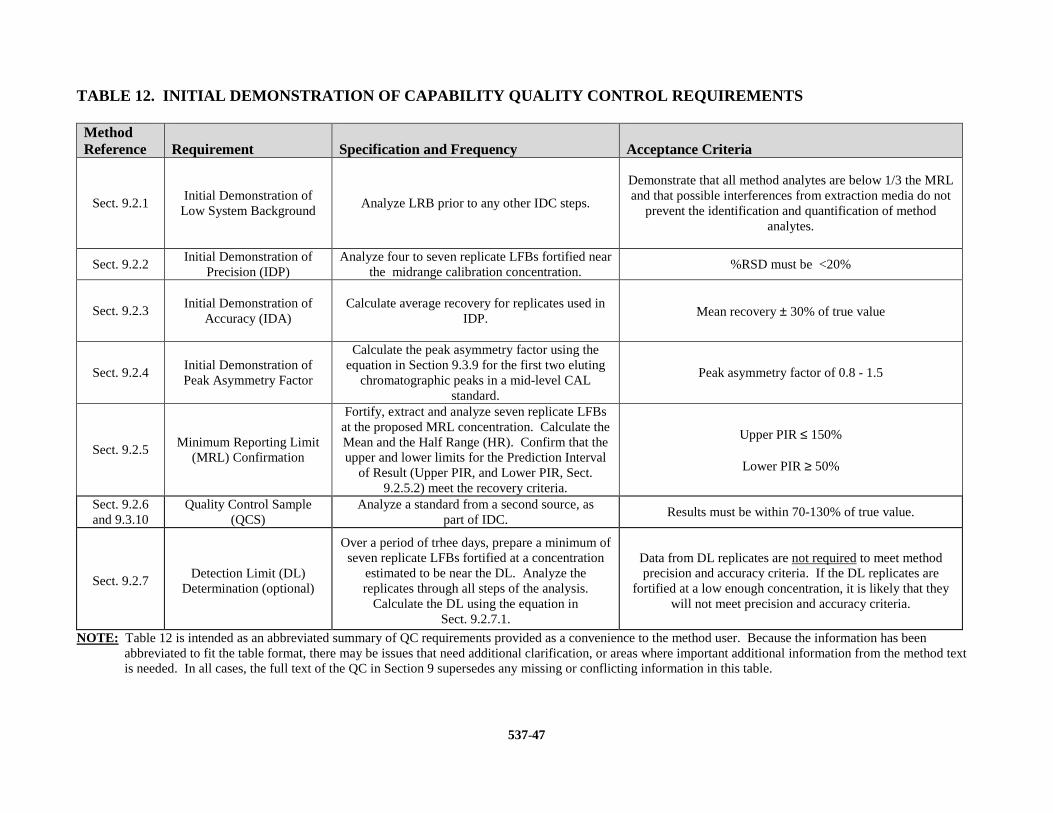
537-47
TABLE 12. INITIAL DEMONSTRATION OF CAPABILITY QUALITY CONTROL REQUIREMENTS Method Reference
Requirement
Specification and Frequency
Acceptance Criteria
Sect. 9.2.1 Initial Demonstration of Low System Background
Analyze LRB prior to any other IDC steps.
Demonstrate that all method analytes are below 1/3 the MRL and that possible interferences from extraction media do not
prevent the identification and quantification of method analytes.
Sect. 9.2.2 Initial Demonstration of
Precision (IDP) Analyze four to seven replicate LFBs fortified near
the midrange calibration concentration. %RSD must be <20%
Sect. 9.2.3
Initial Demonstration of
Accuracy (IDA)
Calculate average recovery for replicates used in
IDP.
Mean recovery ± 30% of true value
Sect. 9.2.4 Initial Demonstration of Peak Asymmetry Factor
Calculate the peak asymmetry factor using the equation in Section 9.3.9 for the first two eluting
chromatographic peaks in a mid-level CAL standard.
Peak asymmetry factor of 0.8 - 1.5
Sect. 9.2.5 Minimum Reporting Limit
(MRL) Confirmation
Fortify, extract and analyze seven replicate LFBs at the proposed MRL concentration. Calculate the Mean and the Half Range (HR). Confirm that the upper and lower limits for the Prediction Interval
of Result (Upper PIR, and Lower PIR, Sect. 9.2.5.2) meet the recovery criteria.
Upper PIR ≤ 150%
Lower PIR ≥ 50%
Sect. 9.2.6 and 9.3.10
Quality Control Sample (QCS)
Analyze a standard from a second source, as part of IDC.
Results must be within 70-130% of true value.
Sect. 9.2.7 Detection Limit (DL)
Determination (optional)
Over a period of trhee days, prepare a minimum of seven replicate LFBs fortified at a concentration
estimated to be near the DL. Analyze the replicates through all steps of the analysis.
Calculate the DL using the equation in Sect. 9.2.7.1.
Data from DL replicates are not required to meet method precision and accuracy criteria. If the DL replicates are
fortified at a low enough concentration, it is likely that they will not meet precision and accuracy criteria.
NOTE: Table 12 is intended as an abbreviated summary of QC requirements provided as a convenience to the method user. Because the information has been abbreviated to fit the table format, there may be issues that need additional clarification, or areas where important additional information from the method text is needed. In all cases, the full text of the QC in Section 9 supersedes any missing or conflicting information in this table.
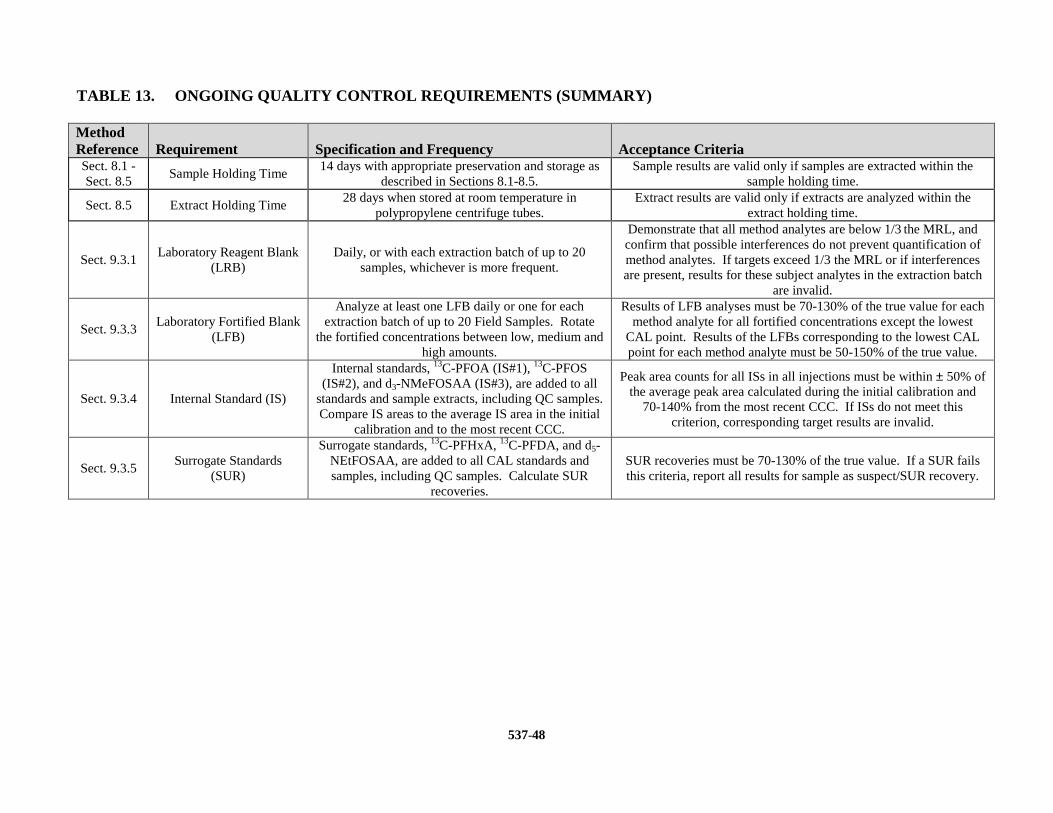
537-48
TABLE 13. ONGOING QUALITY CONTROL REQUIREMENTS (SUMMARY) Method Reference
Requirement
Specification and Frequency
Acceptance Criteria
Sect. 8.1 - Sect. 8.5
Sample Holding Time 14 days with appropriate preservation and storage as
described in Sections 8.1-8.5. Sample results are valid only if samples are extracted within the
sample holding time.
Sect. 8.5 Extract Holding Time 28 days when stored at room temperature in
polypropylene centrifuge tubes. Extract results are valid only if extracts are analyzed within the
extract holding time.
Sect. 9.3.1 Laboratory Reagent Blank
(LRB) Daily, or with each extraction batch of up to 20
samples, whichever is more frequent.
Demonstrate that all method analytes are below 1/3 the MRL, and confirm that possible interferences do not prevent quantification of method analytes. If targets exceed 1/3 the MRL or if interferences are present, results for these subject analytes in the extraction batch
are invalid.
Sect. 9.3.3 Laboratory Fortified Blank
(LFB)
Analyze at least one LFB daily or one for each extraction batch of up to 20 Field Samples. Rotate
the fortified concentrations between low, medium and high amounts.
Results of LFB analyses must be 70-130% of the true value for each method analyte for all fortified concentrations except the lowest
CAL point. Results of the LFBs corresponding to the lowest CAL point for each method analyte must be 50-150% of the true value.
Sect. 9.3.4 Internal Standard (IS)
Internal standards, 13C-PFOA (IS#1), 13C-PFOS (IS#2), and d3-NMeFOSAA (IS#3), are added to all
standards and sample extracts, including QC samples. Compare IS areas to the average IS area in the initial
calibration and to the most recent CCC.
Peak area counts for all ISs in all injections must be within ± 50% of the average peak area calculated during the initial calibration and
70-140% from the most recent CCC. If ISs do not meet this criterion, corresponding target results are invalid.
Sect. 9.3.5 Surrogate Standards
(SUR)
Surrogate standards, 13C-PFHxA, 13C-PFDA, and d5-NEtFOSAA, are added to all CAL standards and samples, including QC samples. Calculate SUR
recoveries.
SUR recoveries must be 70-130% of the true value. If a SUR fails this criteria, report all results for sample as suspect/SUR recovery.
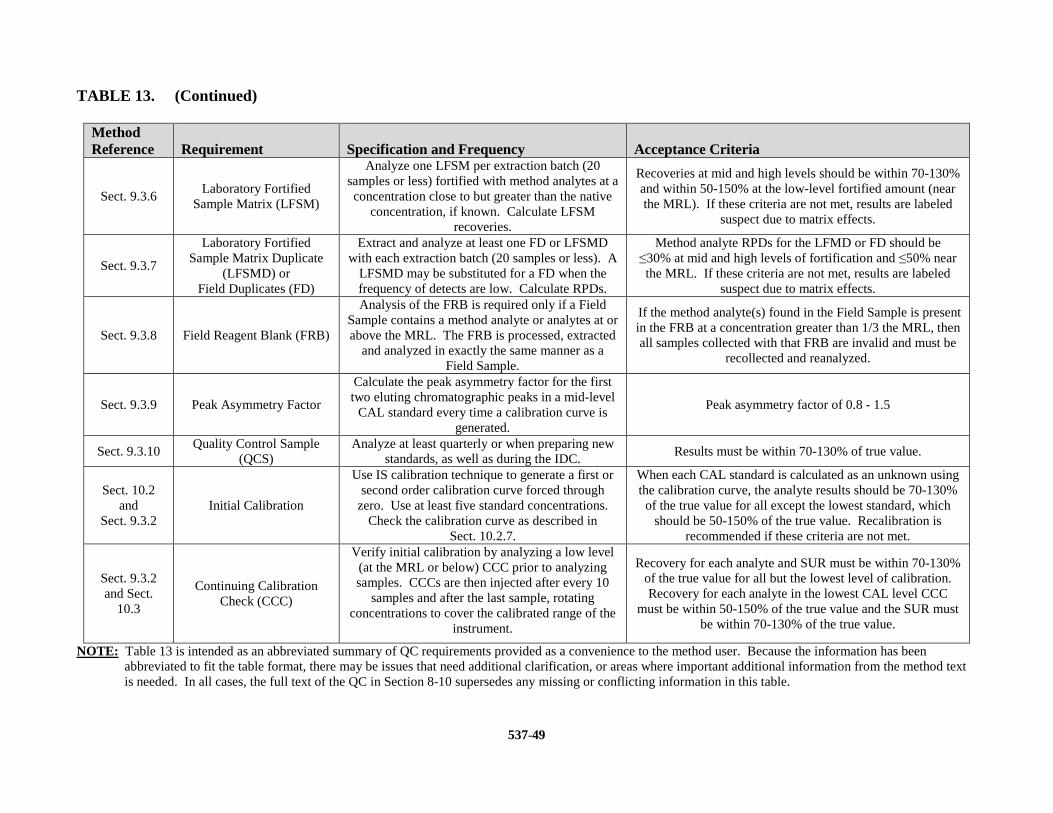
537-49
TABLE 13. (Continued)
Method Reference
Requirement
Specification and Frequency
Acceptance Criteria
Sect. 9.3.6 Laboratory Fortified
Sample Matrix (LFSM)
Analyze one LFSM per extraction batch (20 samples or less) fortified with method analytes at a concentration close to but greater than the native
concentration, if known. Calculate LFSM recoveries.
Recoveries at mid and high levels should be within 70-130% and within 50-150% at the low-level fortified amount (near the MRL). If these criteria are not met, results are labeled
suspect due to matrix effects.
Sect. 9.3.7
Laboratory Fortified Sample Matrix Duplicate
(LFSMD) or Field Duplicates (FD)
Extract and analyze at least one FD or LFSMD with each extraction batch (20 samples or less). A
LFSMD may be substituted for a FD when the frequency of detects are low. Calculate RPDs.
Method analyte RPDs for the LFMD or FD should be ≤30% at mid and high levels of fortification and ≤50% near the MRL. If these criteria are not met, results are labeled
suspect due to matrix effects.
Sect. 9.3.8 Field Reagent Blank (FRB)
Analysis of the FRB is required only if a Field Sample contains a method analyte or analytes at or above the MRL. The FRB is processed, extracted
and analyzed in exactly the same manner as a Field Sample.
If the method analyte(s) found in the Field Sample is present in the FRB at a concentration greater than 1/3 the MRL, then all samples collected with that FRB are invalid and must be
recollected and reanalyzed.
Sect. 9.3.9 Peak Asymmetry Factor
Calculate the peak asymmetry factor for the first two eluting chromatographic peaks in a mid-level
CAL standard every time a calibration curve is generated.
Peak asymmetry factor of 0.8 - 1.5
Sect. 9.3.10 Quality Control Sample
(QCS) Analyze at least quarterly or when preparing new
standards, as well as during the IDC. Results must be within 70-130% of true value.
Sect. 10.2 and
Sect. 9.3.2 Initial Calibration
Use IS calibration technique to generate a first or second order calibration curve forced through zero. Use at least five standard concentrations.
Check the calibration curve as described in Sect. 10.2.7.
When each CAL standard is calculated as an unknown using the calibration curve, the analyte results should be 70-130% of the true value for all except the lowest standard, which
should be 50-150% of the true value. Recalibration is recommended if these criteria are not met.
Sect. 9.3.2 and Sect.
10.3
Continuing Calibration Check (CCC)
Verify initial calibration by analyzing a low level (at the MRL or below) CCC prior to analyzing samples. CCCs are then injected after every 10
samples and after the last sample, rotating concentrations to cover the calibrated range of the
instrument.
Recovery for each analyte and SUR must be within 70-130% of the true value for all but the lowest level of calibration. Recovery for each analyte in the lowest CAL level CCC
must be within 50-150% of the true value and the SUR must be within 70-130% of the true value.
NOTE: Table 13 is intended as an abbreviated summary of QC requirements provided as a convenience to the method user. Because the information has been abbreviated to fit the table format, there may be issues that need additional clarification, or areas where important additional information from the method text is needed. In all cases, the full text of the QC in Section 8-10 supersedes any missing or conflicting information in this table.
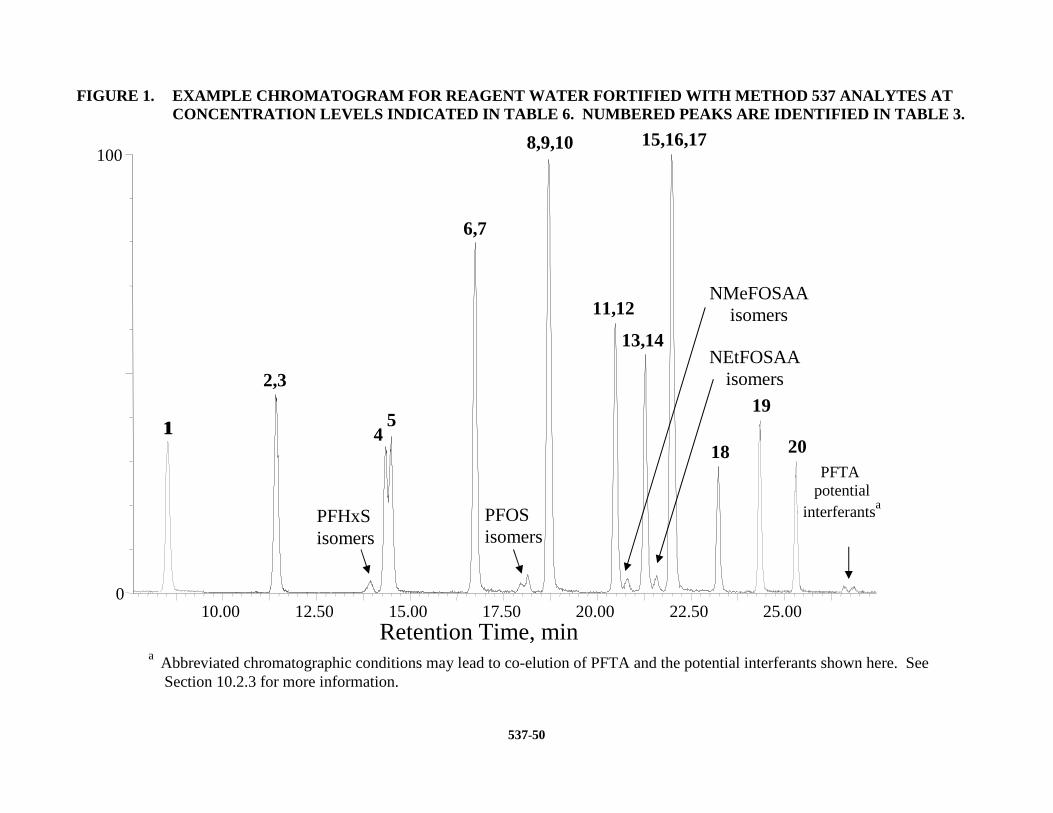
537-50
FIGURE 1. EXAMPLE CHROMATOGRAM FOR REAGENT WATER F ORTIFIED WITH METHOD 537 ANALYTES AT CONCENTRATION LEVELS INDICATED IN TABLE 6. NUMBERE D PEAKS ARE IDENTIFIED IN TABLE 3.
a Abbreviated chromatographic conditions may lead to co-elution of PFTA and the potential interferants shown here. See
Section 10.2.3 for more information.
10.00 12.50 15.00 17.50 20.00 22.50 25.000
100
Retention Time, min
1
2,3
4 5
6,7
8,9,10
11,12
13,14
15,16,17
18
19 1
20
PFHxS isomers
PFOS isomers
NEtFOSAA isomers
NMeFOSAA isomers
PFTA potential
interferantsa


![017 11/1 hinata MIYAZAKI 2017] · 2017. 11. 1. · hinata MIYAZAKI 2017] in 092-432-7612 092-262-8331 092-477-7255 092-432-5833 092-415-8118 092-432-7611 092-477-7545 092-473-0816](https://img.pdfslide.net/doc/110x75/60552fb60f45cc681a77ab1f/017-111-hinata-miyazaki-2017-2017-11-1-hinata-miyazaki-2017-in-092-432-7612.jpg)