Embed Size (px)
Citation preview

Ask The Expert Webinar Series
EPA's Revision to the 40 CFR Part 136 Method
Detection Limit (MDL) Procedure
Richard Burrows, Ph.D. – Corporate Technical Director

A Revision to the Method
Detection Limit
EPA finalized a revision to the 40
CFR Part 136 MDL procedure in the
Federal Register
This is a final rule published on August 28th
Effective September 27th 2017

Presentation Summary
• Part 1 – History of the MDL
• Part 2 – What the MDL is
• Part 3 – Problems with the MDL
• Part 4 – Why we need a MDL
• Part 5 – Details of the modifications
• Part 6 – How the modifications improve the procedure
• Part 7 – What does this mean to labs and data users?

History of the MDL


Further developments
1984 USEPA the MDL procedure is promulgated in 40 CFR, Part 136, Appendix B for use in the wastewater program and defined as 3.14 times the standard deviation of seven low level spiked blanks. The ML is also promulgated at this time.
1985 The MDL is widely adopted by other programs within EPA and written into many state and federal regulations.
1999 USEPA published Method 1631B for analysis of mercury using the old MDL approach and modified ML definition, which provided an opportunity for a legal challenge of the MDL and ML.
2000 USEPA entered into a settlement agreement with the Alliance of Automobile Manufactures, Chemical Manufacturer’s Association, Utility Water Act Group and AFPA.

Further Developments
2002 USEPA issues a Technical Support
Document of Detection and Quantitation
Regulations under the Clean Water Act
(TSD).
2003 Draft revised MDL published
2003 Consensus letter submitted to Assistant
Administrator of Office of Water signed by 31
parties urging EPA to consider a scientifically
sound approach to the detection and
quantification issue.

Yet More
2005 Federal Advisory Committee on Detection
and Quantification (FACDQ) formed by
USEPA Office of Water as a result of the
2000 Settlement Agreement
2007 FACDQ completes their work issuing a final
report with recommendations, with Office of
Water to complete a post FACDQ pilot study
based on FACDQ recommendations.

And even more….
2010 TNI forms Environmental Methods Measurement Expert Committee based on a USEPA grant to address Calibration, Detection, Quantification and other measurement issues.
2011 Final report on Post FACDQ pilot study issued, recommending further evaluation with additional methods and analytes.
2013 TNI EMEC (renamed Chemistry committee) completes work on a MDL revision and submits to EPA
2014 EPA completes internal review of the revised MDL and makes minor modifications
2015 EPA publishes revised MDL as part of a Methods Update Rule
2017 Signed by EPA Administrator Scott Pruitt
What is the MDL?

Lloyd Currie’s original
concept
LC
• The lowest result that can be reliably distinguished from
a blank
LD
• The lowest amount present in a sample that will reliably
give a result that is above LC
LQ
• The lowest amount that gives quantitative results
Not routinely used in environmental testing
(included in the DOD QAPP)
Equals the MDL equals the TNI LOD
Conceptually, equals TNI LOQ, EPA ML and EPA LLOQ

MDL
MDL The method detection limit (MDL) is defined as the
minimum measured concentration of a substance that can be
reported with 99% confidence that the measured concentration
is distinguishable from method blank results
MDL
0 MDL 40 CFR Part 136
0 LC Currie’s Critical Level
3.14 x Standard Deviation

What the MDL is
(and is not):
MDL = Lowest result that can be distinguished from
blanks
Or, lowest result that means there is actually
something in the sample
MDL ≠ Lowest amount in a sample that can be
reliably detected
MDL and Currie’s LD
Currie’s LD is the minimum true concentration that is
reliably detected (i.e., gives a result above the MDL)
LD (LOD)
0 MDL -- 40 CFR Part 136
0 LC LD Currie’s Detection Level
0 DL (LODDOD) DOD
MDL
1% chance of false negative

What does this mean
regarding verification?
• MDL can be verified by examining blank results
• MDL cannot be verified with spiked samples
• (Curries LD could be verified with spiked samples)

Problems with the Old MDL

Blank bias
Old MDL assumes blank results are centered around zero
If blanks are not centered around zero, then the MDL will
be too low and many false positives will result
MDL
0 MDL 40 CFR Part 136
0 LC Currie’s Critical Level
3.14 x Standard Deviation of 7 spikes

Lead in Particulate Matter
0
50
100
150
200
250
300
350
1 2 3 4 5 6 7
Ultrasonic extraction Quartz filter blanks
Blank result
MDL(S)
X+ts
Variance and Verification
• Old MDL assumes that short term and long term
variance are the same
• Variability of instrument response in one batch is
the same as variability of instrument response
over the course of a year???
• Old MDL has no verification that results obtained
are reasonable

Why Do we need a MDL?

Reason #1 that we need MDLs
We need to make the Quantitation limit meaningful
• Applies to MRL, LLOQ, or any quantitation limit
0
1
2
3
4
5
6
7
8
9
10
11
0 1 2 3 4 5 6 7 8
Re
po
rte
d C
on
cen
tra
tio
n
Replicate Number
9
Mean recovery
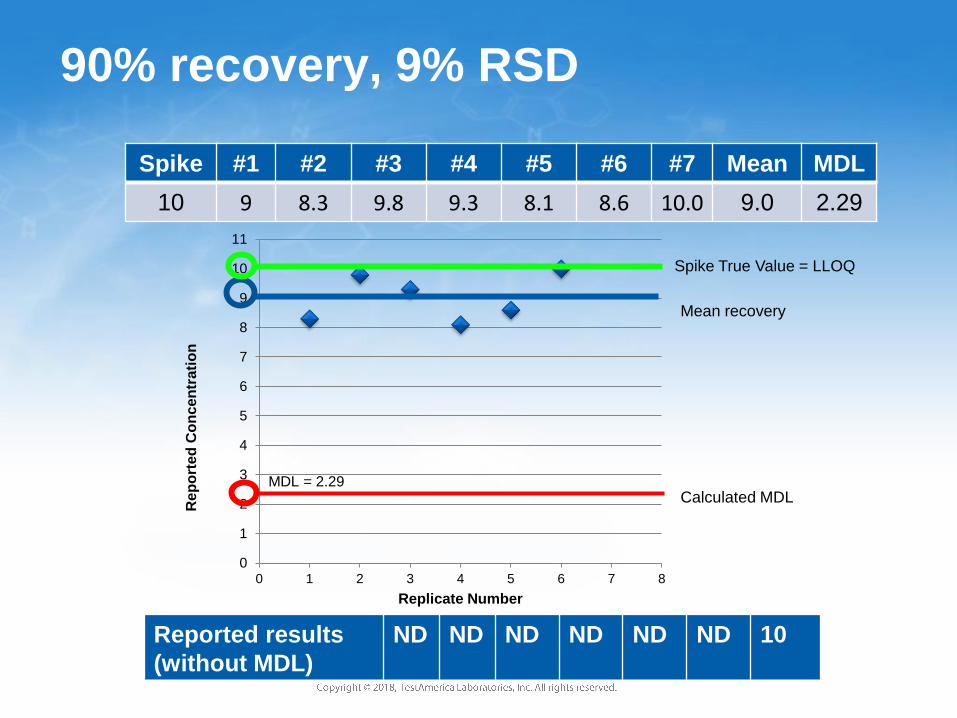
90% recovery, 9% RSD
Spike #1 #2 #3 #4 #5 #6 #7 Mean MDL
10 9 8.3 9.8 9.3 8.1 8.6 10.0 9.0 2.29
Spike True Value = LLOQ
Calculated MDL MDL = 2.29
Reported results
(without MDL)
ND ND ND ND ND ND 10

MDL ZERO LOQ
If you run 100 spikes at LLOQ…
What if you have 70% average recovery?
Assume 10% RSD
Now 99% False
Negative Rate

Reason #2 that we need MDLs
MDLs are needed in risk assessment
• Handling non-detects
~ Substitute a value such as ½ detection limit or
detection limit
~ More sophisticated methods such as Maximum
Likelihood estimation and Regression on Order
statistics
− These still benefit from a detection limit as low as
possible
If we do not have a detection limit, the Quantitation
limit will become the new Detection limit

Details of the Modifications

First, what stays the same?
• Fundamental concept is unchanged
• What is the lowest result that is qualitatively
reliable, i.e., the lowest result that reliably
indicates the analyte is in the sample?
• Fundamental approach is unchanged
• Describe the distribution as Student’s t times the
standard deviation of results

Revised MDL Procedure
Flow Chart
Run 7 low level
spikes
Run 7 method
blanks
Do
results
meet
qual ID?
Calculate MDLs Calculate MDLb
Set higher of
MDLs and MDLb
as MDL
Fix problem or
raise spike level
and repeat
No
Yes
INITIAL DETERMINATION OF MDL

Spikes and Blanks
Run 7 low level
spikes
Run 7 method
blanks
Do
results
meet
qual ID?
Calculate MDLs Calculate MDLb
Set higher of
MDLs and MDLb
as MDL
Fix problem or
raise spike level
and repeat
No
Yes
INITIAL DETERMINATION OF MDL
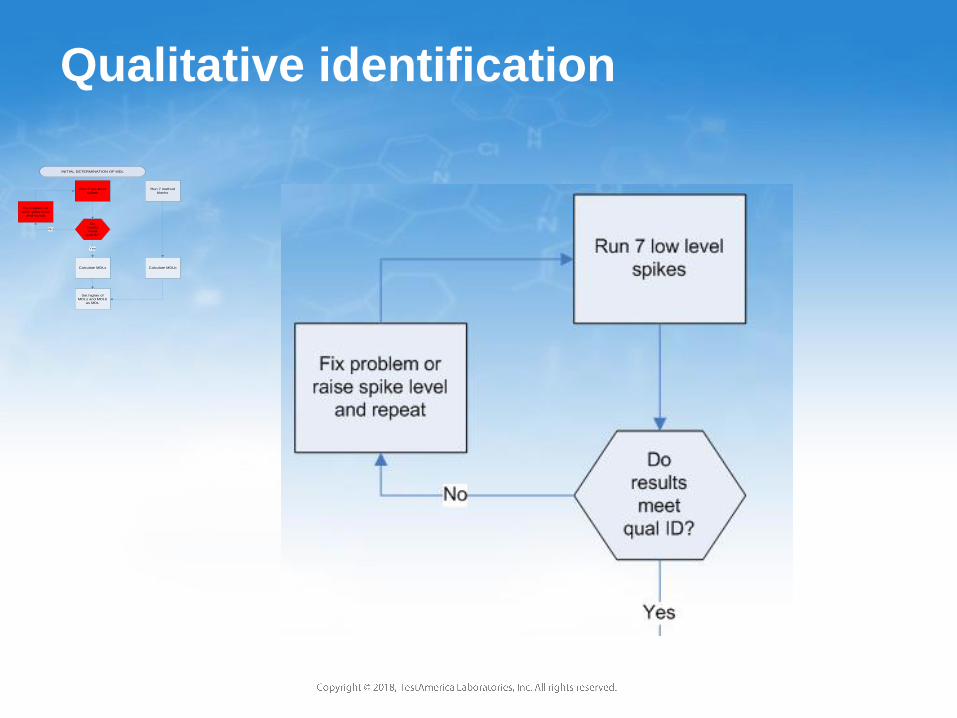
Qualitative identification
Run 7 low level
spikes
Run 7 method
blanks
Do
results
meet
qual ID?
Calculate MDLs Calculate MDLb
Set higher of
MDLs and MDLb
as MDL
Fix problem or
raise spike level
and repeat
No
Yes
INITIAL DETERMINATION OF MDL
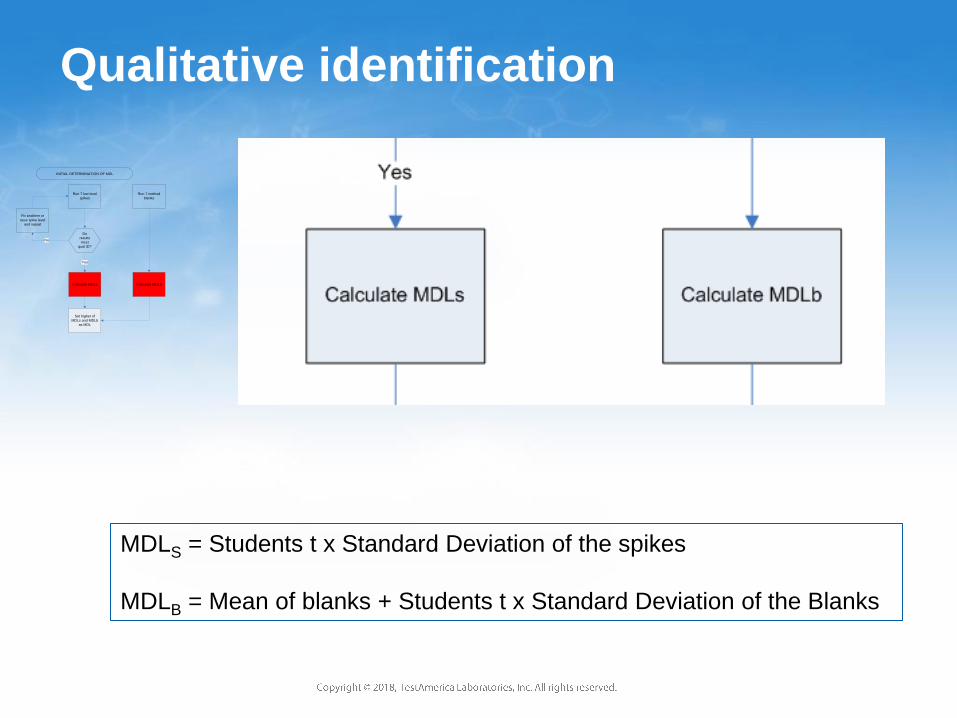
Qualitative identification
MDLS = Students t x Standard Deviation of the spikes
MDLB = Mean of blanks + Students t x Standard Deviation of the Blanks
Run 7 low level
spikes
Run 7 method
blanks
Do
results
meet
qual ID?
Calculate MDLs Calculate MDLb
Set higher of
MDLs and MDLb
as MDL
Fix problem or
raise spike level
and repeat
No
Yes
INITIAL DETERMINATION OF MDL
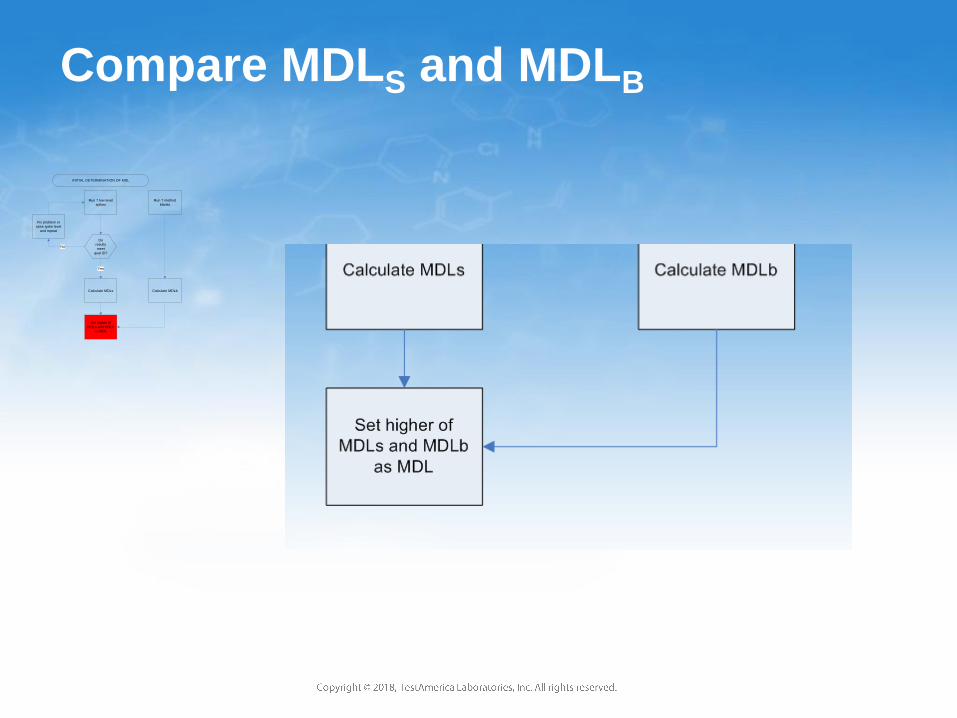
Compare MDLS and MDLB
Run 7 low level
spikes
Run 7 method
blanks
Do
results
meet
qual ID?
Calculate MDLs Calculate MDLb
Set higher of
MDLs and MDLb
as MDL
Fix problem or
raise spike level
and repeat
No
Yes
INITIAL DETERMINATION OF MDL
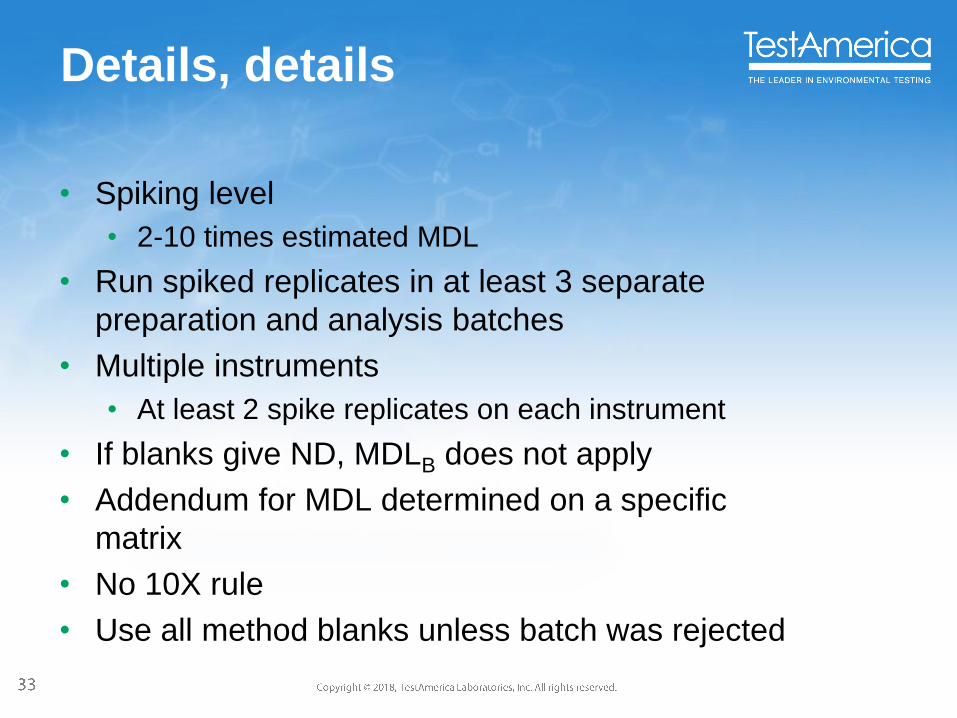
Details, details
• Spiking level
• 2-10 times estimated MDL
• Run spiked replicates in at least 3 separate
preparation and analysis batches
• Multiple instruments
• At least 2 spike replicates on each instrument
• If blanks give ND, MDLB does not apply
• Addendum for MDL determined on a specific
matrix
• No 10X rule
• Use all method blanks unless batch was rejected

Does the 10X rule protect
against MDLs that are too low?
True 1 2 3 4 5 6 7
100 100 103 99 102 97 98 102
Results within =/- 3%
Mean RSD Std Dev MDL
100 2.3% 2.3 7.1
True 1 2 3 4 5 6 7
1.0 1.0 1.4 0.8 1.3 0.7 0.8 1.3
Results within =/- 40%
Mean RSD Std Dev MDL
1.0 29% 0.29 0.90

Ongoing verification
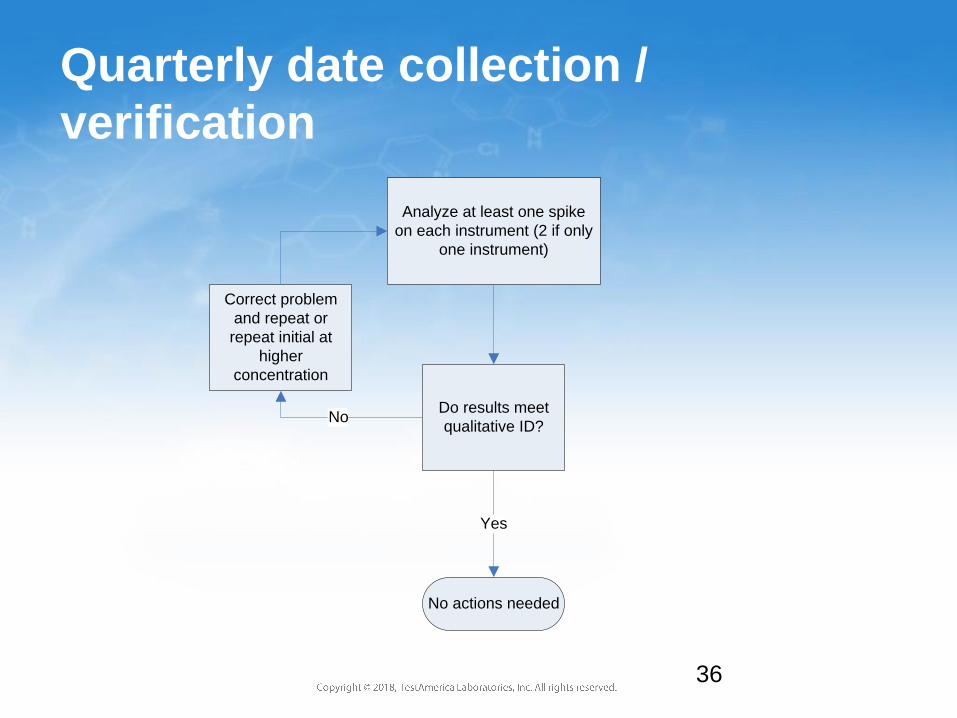
Quarterly date collection /
verification
36
Analyze at least one spike
on each instrument (2 if only
one instrument)
Do results meet
qualitative ID?
No actions needed
Correct problem
and repeat or
repeat initial at
higher
concentration
No
Yes

Annual recalculation
37
Collect Spike Data
and Recalculate
MDLS
Collect Blank Data
and Recalculate
MDLB
Is the newly
calculated MDL
within 2X of the
existing MDL?
Change MDL to
the newly
calculated MDL
Option: Leave the
MDL unchanged
or change to the
newly calculated
MDL
NO YES

Method blank Example -
Ammonia
38
0.016 (99th)
0.014 (last 50)
0.013 (all data)
4 results >
MDLs; MDLs
not valid
Why didn’t we do…..
Calibration design
LOD and MDL
Signal to noise
LOQ
Remove spiking requirement when blanks work

Calibration design
Hubaux-Vos
ASTM D6091
• H-V assumes constant variance – does not work
• Complex, D6091 depends on calibration fit, assumes minimal
calibration error
• Labor intensive – only really works if detection limit is very
stable
• Problems with positive blank bias

LOD and MDL
Pros
• More comprehensive description of detection
• Technically sound
Cons
• Difficult to properly estimate LD
• Pretty close to typical LQ

Signal to noise
• No consideration of sample prep
• No consideration of blank bias

Limit of Quantitation
LOQ
TNI LOQ
1.5.2.2.2 Ongoing verification of the LOQ
The laboratory shall prepare and analyze a minimum of one (1)
LOQ verification sample spiked at the same concentration as the
initial LOQ verification on each instrument during each quarter in
which samples are being analyzed for each quality system matrix,
method, and analyte.
a) Results of each LOQ verification sample analysis shall be
evaluated at the time of the testing and shall meet the qualitative
identification criteria in the method and laboratory Standard
Operating Procedure (SOP) and the quantitated result shall be
greater than the DL and meet the laboratory established
accuracy criteria.

Remove spiking
requirement when blanks
work
• Good idea!
• Maybe a next step

How the modifications
improve the procedure
• Sensible MDLs when there is blank bias
• 1980 Lead in tuna results overstated by 1000X due to blank
contamination
• 2004 EPA Episode 6000 data Chromium by ICPMS, 1400%
recovery at the MDL and 600% recovery at the ML due to
blank bias
• 2013 Multi-lab blank detection rates
~ 8270 SIM 6.4%
~ 8921B 16%
~ ICPMS 8%
• 2014 Lead in particulate matter
~ All blanks in the validation study exceeded the MDL
This problem is getting worse because of the need for low
level data and increasing sensitivity of instrumentation
How the modifications
improve the procedure
• Long term vs. short term bias
• The difference varies from method to method and
lab to lab, but can be large
• Long term bias is what matters when it comes to
the MDL
• Ongoing verification
• Very consistent with EPA office of Water MRL,
EPA ORCR LLOQ and the proposed TNI LOQ

What does this mean to
labs?
• Clear requirements
• Sensible MDLs
• Level playing field
• Low transition costs since existing data can be
used
• Some additional organizational requirements

What does this mean to
data users?
• MDLs that make sense
• Much lower rate of false positives, especially for
ICP, ICPMS and some general chemistry tests
• Easier to compare labs
• In general, more reliable data = better decision
making
How much will MDLs
change?
• Analytes with minimal or no detects in blanks, eg
most GC/MS analytes at normal levels:
Not Much
• Analytes with frequent detects in blanks, eg,
metals, very low level PAH, some general
chemistry tests:
Depends
• If the lab is currently adjusting MDLs to avoid
excessive false positives, not much
• If the lab has been pushing MDLs below levels
justified by the blanks, potentially quite a bit

Ask The Expert Webinar Series
Thank you for attending
To submit a question, type it into the Questions panel in the GoToWebinar toolbar and click Send.
If you have any additional questions for today’s presenter you may submit them directly to:
Please be sure to visit the Ask the Expert Webinar Series web page for other scheduled webinars at:
http://www.testamericainc.com/services-we-offer/webinars/
To view a recording of this webinar session, please contact:
EPA’S Revision To The 40 CFR Part 136 Method
Detection Limit (MDL) Procedure
http://www.testamericainc.com/services-we-offer/ask-the-expert/richard-burrows/