Embed Size (px)
DESCRIPTION
EPA’s Revisions to Particulate Matter National Ambient Air Quality Standards (PM NAAQS ). Air Quality Committee Meeting January 9, 2013 Sushma Masemore, PE Planning Section Chief. 2012 PM NAAQS. Final rule signed Dec. 14, 2012 To be published in the Federal Register soon - PowerPoint PPT Presentation
Citation preview

EPA’s Revisions to Particulate Matter
National Ambient Air Quality Standards (PM NAAQS)
Air Quality Committee MeetingJanuary 9, 2013
Sushma Masemore, PEPlanning Section Chief

2012 PM NAAQSFinal rule signed Dec. 14, 2012To be published in the Federal
Register soonIn response to lawsuits filed by
the American Lung Association, National Parks Conservation Association, and several states
Also in response to 2009 court ordered remand of primary and secondary annual fine particulate matter (PM2.5) standards
2

PM2.5 Primary (Health) StandardsExisting
1997 annual standard 15 μg/m3
2006 daily standard 35 μg/m3
2012 Final Strengthen annual standard to 12
μg/m3
Retain daily standard at 35 μg/m3
3μg/m3 = micrograms per cubic meter

How will it affect NC?
4
2009-2011 Annual PM2.5 Design Values
All monitors meet the revised annual standard 12 μg/m3
All monitors meet the daily standard 35 μg/m3 2009-2011 Daily PM2.5 Design Values

National Outlook
Nationally, 66 counties don’t currently meet 12 μg/m3 PM2.5 annual standard.Source: 2009-2011 air quality data as of July 15, 2012, www.epa.gov/pm
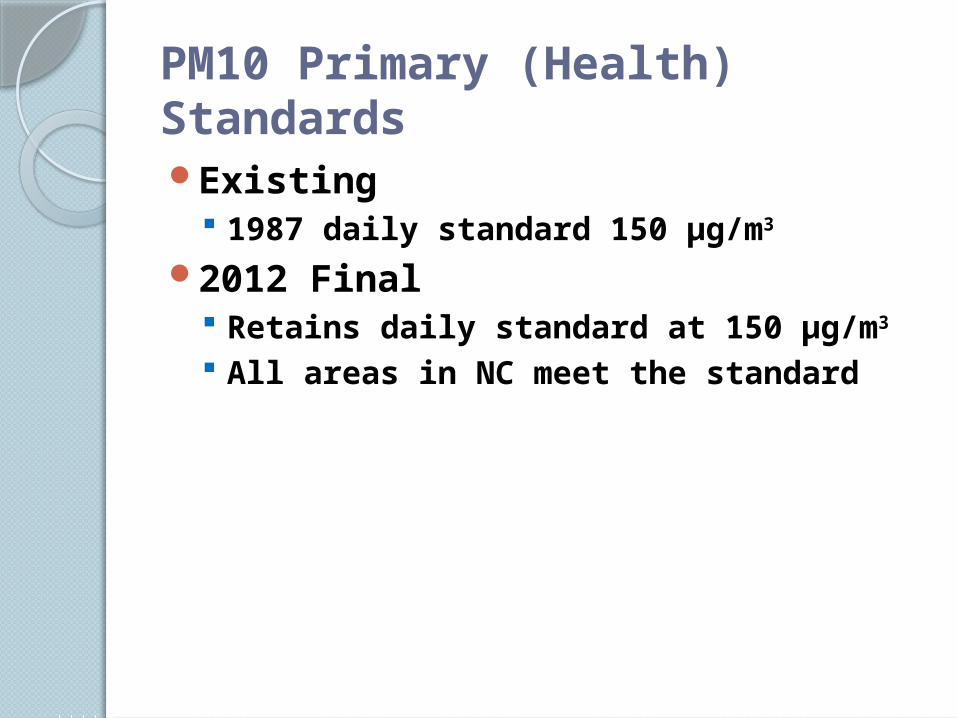
PM10 Primary (Health) StandardsExisting
1987 daily standard 150 μg/m3
2012 Final Retains daily standard at 150 μg/m3
All areas in NC meet the standard

PM2.5 and PM10 Secondary (Welfare) Standards2012 Final
Retaining existing secondary standards Annual PM2.5 -15.0 μg/m3
Daily PM 2.5 - 35 μg/m3
Daily PM10 – 150 μg/m3
EPA concluded that current secondary daily PM2.5 standard is appropriate to protect visibility in urban areas.
No impact to NC based on current data
7

Revisions to Air Quality Index (AQI) EPA’s color-coded tool for informing public
about air quality Converts ambient concentrations to a number
on a scale of 0 to 500 Effective 60 days after publication in the
Federal Register
8
AQI Category Index Values Previous Breakpoints (1999 AQI) (μg/m3, daily average)
Revised Breakpoints (μg/m3, daily average)
Good 0 – 50 0.0 - 15.0 0.0 – 12.0
Moderate 51-100 >15.0 - 40 12.1 – 35.4
Unhealthy for Sensitive Groups
101-150 >40 – 65 35.5 – 55.4
Unhealthy 151-200 > 65 – 150 55.5 – 150.4
Very Unhealthy 201 – 300 > 150 – 250 150.5 – 250.4
Hazardous 301 – 400 > 250 – 350 250.5 – 350.4
401 – 500 > 350 – 500 350.5 – 500

Permitting ImpactsFinal rule allows grandfathering
of pre-construction permit applications if: Application deemed complete by Dec.
14, 2012 Public notice for draft permit or
preliminary determination issued prior to effective date of the standard
Grandfathered applications will still have to comply with the 2006 PM2.5 standards
EPA to provide modeling guidance9

Ambient Monitoring ImpactsEstablish near-roadway PM2.5
monitors Population of 1 million or more Co-located with existing nitrogen
dioxide or carbon monoxide monitors Monitors in Charlotte and Raleigh by
Jan. 2015 Possibly Durham and Greensboro by
Jan. 2017Data will not be available in time
to make initial attainment and nonattainment designations.
10

Designation & Implementation ScheduleDec. 2013 – states recommend
areas to be designated attainment or nonattainment
Dec. 2014 – EPA makes final designations
2018 (3 yrs after designations) – states submit implementation plans
2020 (<5 yrs after designations) – states must meet the standards
11


![Federal No. andRegulations...EPA ' ¯ ¯ EPA) NAAQS. {' "" ¯ is-)-\[] ¯ ¯ [¯ ¯ ¯ ¯ ¯ ¯ ¯ (." +),,•](https://img.pdfslide.net/doc/110x75/5ece9c4fad639c66df582bc6/federal-no-andregulations-epa-epa-naaqs-is-.jpg)