Embed Size (px)
Citation preview
E P I B R I E F I N G PA P E RE C O N O M I C P O L I C Y I N S T I T U T E ● J U L Y 2 8 , 2 0 0 8 ● B R I E F I N G P A P E R # 2 1 9
ECONOMIC POLICY INSTITUTE • 1333 H STREET, NW • SUITE 300, EAST TOWER • WASHINGTON, DC 20005 • 202.775.8810 • WWW.EPI.ORG
Th e growth of U.S. trade with China since China entered the World Trade Organization in 2001 has had a devastat-ing eff ect on U.S. workers and the domestic economy. Between 2001 and 2007 2.3 million jobs were lost or displaced, including 366,000 in 2007 alone. New demographic research shows that, even when re-employed in non-traded indus-tries, the 2.3 million workers displaced by the increase in China trade defi cits in this period have lost an average $8,146 per worker/year. In 2007, these losses totalled $19.4 billion.1 Th e impacts of the China trade defi cit are not limited to its direct eff ects on the jobs and wages of those dis-placed. It is also critical to recognize that the indirect im-pact of trade on other workers is signifi cant as well. Trade with less-developed countries has reduced the bargaining power of all workers in the U.S. economy who resem-ble the import-displaced in terms of education, creden-tials, and skill. Annual earnings for all workers without a four-year college degree are roughly $1,400 lower today because of this competition, and this group constitutes a large majority of the entire U.S. workforce (roughly 100 million workers or about 70% of all workers, Bivens (2008a)). China, with nearly 40% of our non-oil imports from less-developed countries, is a chief contributor to this wage pressure. In addition to its fi nding of 2.3 million U.S. jobs lost and workers displaced between 2001 and 2007, this study fi nds:
T A B L E O F C O N T E N T S
False promises .......................................................................................4Growing trade defi cits and job losses ........................................4Trade and jobs, industry details ...................................................8Trade, wages, and labor force demographics ..................... 12Demographic impact of growng trade defi cits .................. 16 Education ............................................................................................ 16 Wages ................................................................................................... 19 Race ....................................................................................................... 20Conclusion ............................................................................................ 21
THE CHINA TRADE TOLLWidespread wage suppression,
2 million jobs lost in the U.S.
B Y R O B E R T E . S C O T T
www.epi.org
—DRAFT—
E P I B R I E F I N G PA P E R #219 ● J U LY 28, 2008 ● PAG E 2
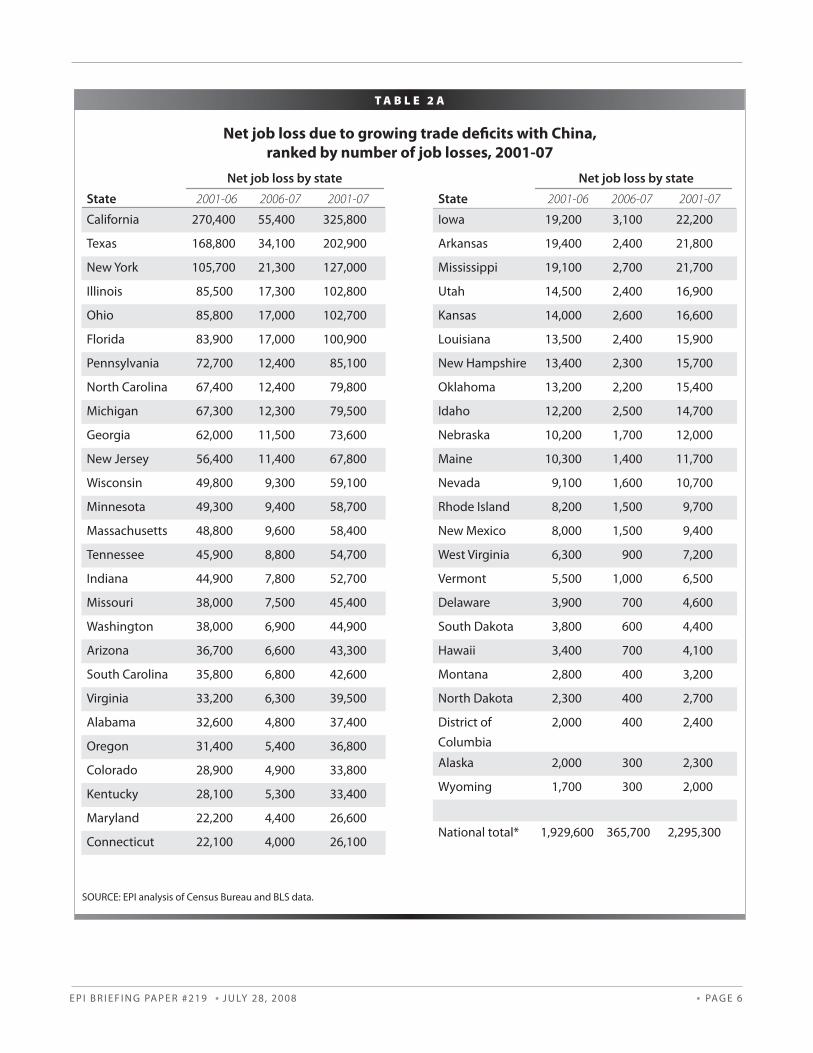
Because U.S. exports to China are much more com-• modity intensive (i.e., comprising products such as grains, steel scrap, and paper scrap) than Chinese imports (99% of which are manufactured products), average wages earned in jobs producing U.S. exports to China paid 4.4% less than the jobs displaced by imports from China. More than one-fourth of U.S. exports to China on a value basis were commodities. Th e 2.3 million jobs lost/workers displaced nation-• wide since 2001 are distributed among all 50 states and the District of Columbia, with the biggest los-ers, in numeric terms: California (325,800 jobs lost), Texas (202,900), New York (127,000), Illinois (102,800), Ohio (102,700), Florida (100,900), Penn-sylvania (85,100), North Carolina (79,800), Michi-gan (79,500), and Georgia (73,600).
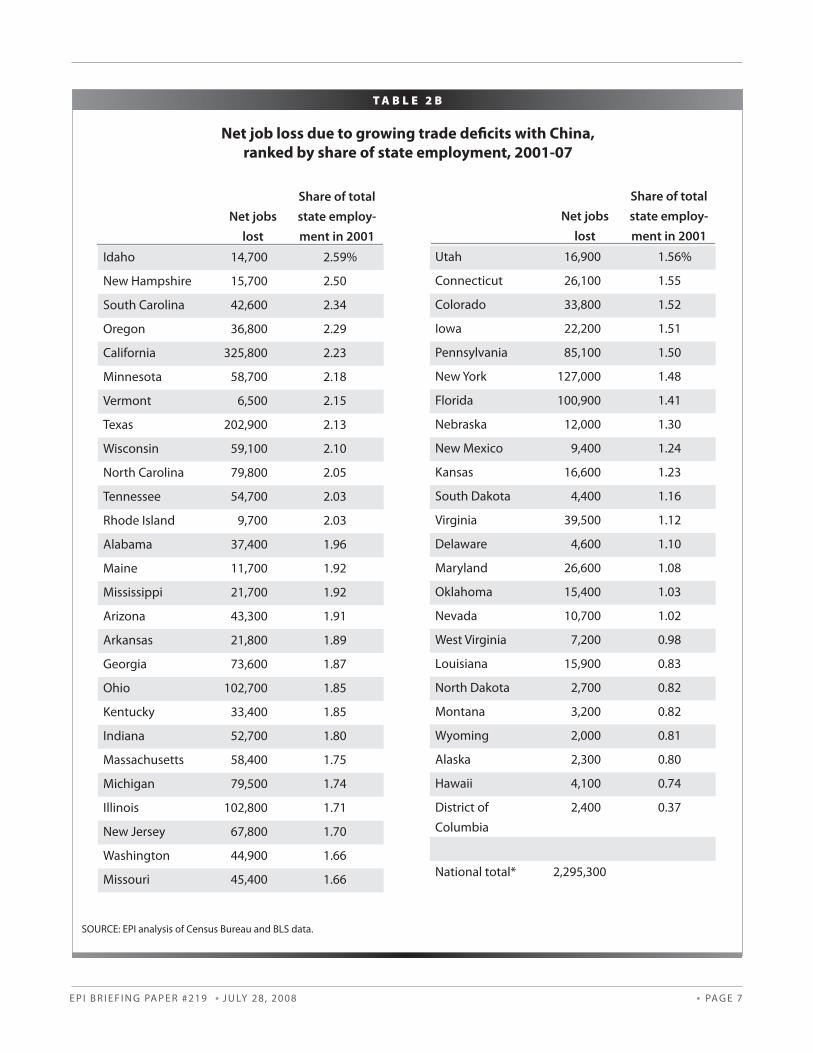
In the past year alone, each of these states has also lost • more than 10,000 jobs due to growing China trade defi cits, including California (55,400 jobs), Texas (34,100), New York (21,300), Illinois (17,300), Ohio (17,000), Florida (17,000), Pennsylvania (12,400), North Carolina (12,400), Michigan (12,300), and Georgia (11,500). Many of these are among the hard-est-hit states in the current labor market downturn. Th e hardest-hit states, as a share of total state employ-• ment, are Idaho (14,700, 2.59%), New Hampshire (15,700, 2.5o%), South Carolina (42,600, 2.34%), Oregon (36,800, 2.29%), California (325,800, 2.23%), Minnesota (58,700, 2.18%), Vermont (6,500, 2.15%), Texas (202,900, 2.13%), and Wis-consin (59,100, 2.10%).Rapidly growing imports of computers and electronic • parts accounted for almost half of the $178 billion increase in the U.S. trade defi cit with China between 2001 and 2007. Th e $68 billion defi cit in advanced technology products with China in 2007 was respon-sible for more than 25% of the total U.S.-China trade defi cit. Th e growth of this defi cit eliminated 561,000 U.S. jobs in computer and electronic products in this period. Other hard-hit industrial sectors include ap-parel and accessories (153,000 jobs), miscellaneous manufactured goods (134,000), and fabricated metal products (102,000); several service sectors were also hard hit by indirect job losses, including administra-
tive support services (139,000) and professional, sci-entifi c, and technical services (128,000). More than two-thirds of the jobs displaced by China • trade defi cits were in manufacturing, which tends to employ a higher-than-average share of workers with a high school degree or less (43.7% of workers dis-placed) and to provide those workers with good wages and benefi ts. More than half (55.6%) of the jobs dis-placed came from the top half of the U.S. wage dis-tribution, and among this group a disproportionate share came from the top 10th of all U.S. wage earn-ers. African Americans (230,000 jobs lost), Hispan-ics (339,000), and other ethnic groups (219,000) all suff ered from the loss of jobs such as these that pay substantially more and off er better benefi ts than jobs in other industries.
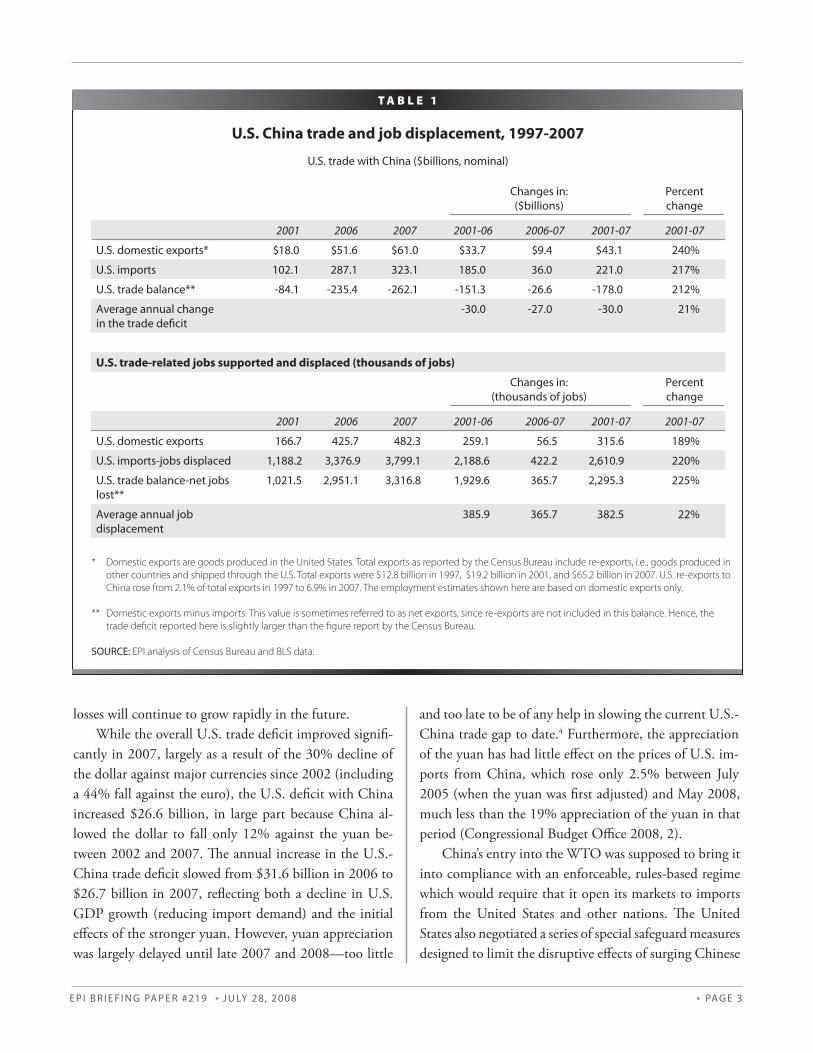
A major cause of the rapidly growing U.S. trade defi cit with China is currency manipulation. China has tightly pegged its currency to the dollar at a rate that en-courages a large bilateral surplus with the United States. Maintaining this peg required the purchase of about $460 billion in U.S. treasury bills and other securities in 2007 alone.2 Th is intervention makes the yuan artifi cially cheap and provides an eff ective subsidy on Chinese exports. Th e best estimates place this eff ective subsidy at roughly 30%, even after recent appreciation in the yuan(Cline and Wil-liamson 2008).3 China also engages in extensive suppression of la-bor rights. An AFL-CIO study estimated that repression of labor rights by the Chinese government has lowered manufacturing wages by 47% to 86% (AFL-CIO 2006, 138). China has also been accused of massive direct subsi-dization of export production in many key industries (see, e.g., Haley 2007). Finally, it maintains strict, non-tariff barriers to imports. As a result, China’s exports to the United States of $323 billion in 2007 were more than fi ve times greater than U.S. exports to China, which totaled only $61 billion (Table 1). China’s trade surplus was re-sponsible for 52.3% of the U.S. total non-oil trade defi cit in 2007, making the China trade relationship this coun-try’s most imbalanced by far. Unless China raises the real value of the yuan by an additional 30% and eliminates these other trade distortions, the U.S. trade defi cit and job
E P I B R I E F I N G PA P E R #219 ● J U LY 28, 2008 ● PAG E 3
losses will continue to grow rapidly in the future. While the overall U.S. trade defi cit improved signifi -cantly in 2007, largely as a result of the 30% decline of the dollar against major currencies since 2002 (including a 44% fall against the euro), the U.S. defi cit with China increased $26.6 billion, in large part because China al-lowed the dollar to fall only 12% against the yuan be-tween 2002 and 2007. Th e annual increase in the U.S.-China trade defi cit slowed from $31.6 billion in 2006 to $26.7 billion in 2007, refl ecting both a decline in U.S. GDP growth (reducing import demand) and the initial eff ects of the stronger yuan. However, yuan appreciation was largely delayed until late 2007 and 2008—too little
and too late to be of any help in slowing the current U.S.-China trade gap to date.4 Furthermore, the appreciation of the yuan has had little eff ect on the prices of U.S. im-ports from China, which rose only 2.5% between July 2005 (when the yuan was fi rst adjusted) and May 2008, much less than the 19% appreciation of the yuan in that period (Congressional Budget Offi ce 2008, 2). China’s entry into the WTO was supposed to bring it into compliance with an enforceable, rules-based regime which would require that it open its markets to imports from the United States and other nations. Th e United States also negotiated a series of special safeguard measures designed to limit the disruptive eff ects of surging Chinese
T A B L E 1
U.S. China trade and job displacement, 1997-2007
U.S. trade with China ($billions, nominal)
Changes in:($billions)
Percent change
2001 2006 2007 2001-06 2006-07 2001-07 2001-07
U.S. domestic exports* $18.0 $51.6 $61.0 $33.7 $9.4 $43.1 240%
U.S. imports 102.1 287.1 323.1 185.0 36.0 221.0 217%
U.S. trade balance** -84.1 -235.4 -262.1 -151.3 -26.6 -178.0 212%
Average annual change in the trade defi cit
-30.0 -27.0 -30.0 21%
U.S. trade-related jobs supported and displaced (thousands of jobs)
Changes in:(thousands of jobs)
Percent change
2001 2006 2007 2001-06 2006-07 2001-07 2001-07
U.S. domestic exports 166.7 425.7 482.3 259.1 56.5 315.6 189%
U.S. imports-jobs displaced 1,188.2 3,376.9 3,799.1 2,188.6 422.2 2,610.9 220%
U.S. trade balance-net jobs lost**
1,021.5 2,951.1 3,316.8 1,929.6 365.7 2,295.3 225%
Average annual job displacement
385.9 365.7 382.5 22%
* Domestic exports are goods produced in the United States. Total exports as reported by the Census Bureau include re-exports, i.e., goods produced in
other countries and shipped through the U.S. Total exports were $12.8 billion in 1997, $19.2 billion in 2001, and $65.2 billion in 2007. U.S. re-exports to
China rose from 2.1% of total exports in 1997 to 6.9% in 2007. The employment estimates shown here are based on domestic exports only.
** Domestic exports minus imports. This value is sometimes referred to as net exports, since re-exports are not included in this balance. Hence, the
trade defi cit reported here is slightly larger than the fi gure report by the Census Bureau.
SOURCE: EPI analysis of Census Bureau and BLS data.
E P I B R I E F I N G PA P E R #219 ● J U LY 28, 2008 ● PAG E 4
imports on domestic producers. However, the core of the agreement failed to include any protections to maintain or improve labor or environmental standards and, prior to 2007, the administration rejected all requests for special safeguards protection. As a result, China’s entry into the WTO has further tilted the international economic play-ing fi eld against domestic workers and fi rms and in favor of multinational companies from the United States and other countries as well as state- and privately owned ex-porters in China. Th is shift has increased the global “race to the bottom” in wages and environmental quality and closed thousands of U.S. factories, decimating employ-ment in a wide range of communities, states, and entire regions of the United States. U.S. national interests have suff ered while U.S. multinationals have enjoyed record profi ts on their foreign direct investments (Scott 2008).
False promisesProponents of China’s entry into the WTO frequently claimed that it would create jobs in the United States, in-crease U.S. exports, and improve the trade defi cit with China. President Clinton claimed that the agreement al-lowing China into the WTO, which was negotiated dur-ing his administration, “creates a win-win result for both countries” (Clinton 2000, 9). He argued that exports to China “now support hundreds of thousands of American jobs” and that “these fi gures can grow substantially with the new access to the Chinese market the WTO agree-ment creates” (Clinton 2000, 10). Others in the White House, such as Kenneth Liberthal, the special advisor to the president and senior director for Asia aff airs at the Na-tional Security Council, echoed Clinton’s assessment:
Let’s be clear as to why a trade defi cit might decrease in the short term. China exports far more to the U.S. than it imports [from] the U.S….It will not grow as much as it would have grown without this agreement and over time clearly it will shrink with this agree-ment.5
Promises about jobs and exports misrepresented the real eff ects of trade on the U.S. economy: trade both cre-ates and destroys jobs. Increases in U.S. exports tend to create jobs in the United States, but increases in imports
will lead to job loss—by destroying existing jobs and pre-venting new job creation—as imports displace goods that otherwise would have been made in the United States by domestic workers. Th e impact of changes in trade on employment is es-timated here by calculating the labor content of changes in the trade balance—the diff erence between exports and imports. Each $1 billion in computer exports to China from the United States supports American jobs. However, each $1 billion in computer imports from China displaces the American workers who would have been employed making them in the United States. On balance, the net employment eff ect of trade fl ows depends on the growth in the trade defi cit, not just exports. Another critically important promise made by the pro-moters of liberalized U.S.-China trade was that the United States would benefi t because of increased exports to a large and growing consumer market in China. However, despite widespread reports of the rapid growth of the Chinese middle class, this growth has not resulted in a signifi cant increase in U.S. consumer exports to China. Th e most rap-idly growing exports to China are bulk commodities such as grains, scrap, and chemicals; intermediate products such as semiconductors; and producer durables such as aircraft (see Table 3 below). Furthermore, the increase in U.S. ex-ports to China since 2001 has been overwhelmed by the growth of U.S. imports, as shown below.
Growing trade defi cits and job lossesTh e U.S. trade defi cit with China has risen from $84 bil-lion in 2001 to $262 billion in 2007, an increase of $178 billion, as shown in Table 1. Since China entered the WTO in 2001, this defi cit has increased by $30 billion per year on average, or 21% per year. While it is true that exports support jobs in the United States, it is equally true that imports displace them. Th e net eff ect of trade fl ows on employment is determined by changes in the trade balance.6 Th e employment impacts of growing trade defi cits are estimated in this paper using an input-output model that estimates the direct and indirect labor requirements of producing output in a given domes-tic industry. Th e model includes 201 U.S. industries, 84 of which are in the manufacturing sector.7
E P I B R I E F I N G PA P E R #219 ● J U LY 28, 2008 ● PAG E 5
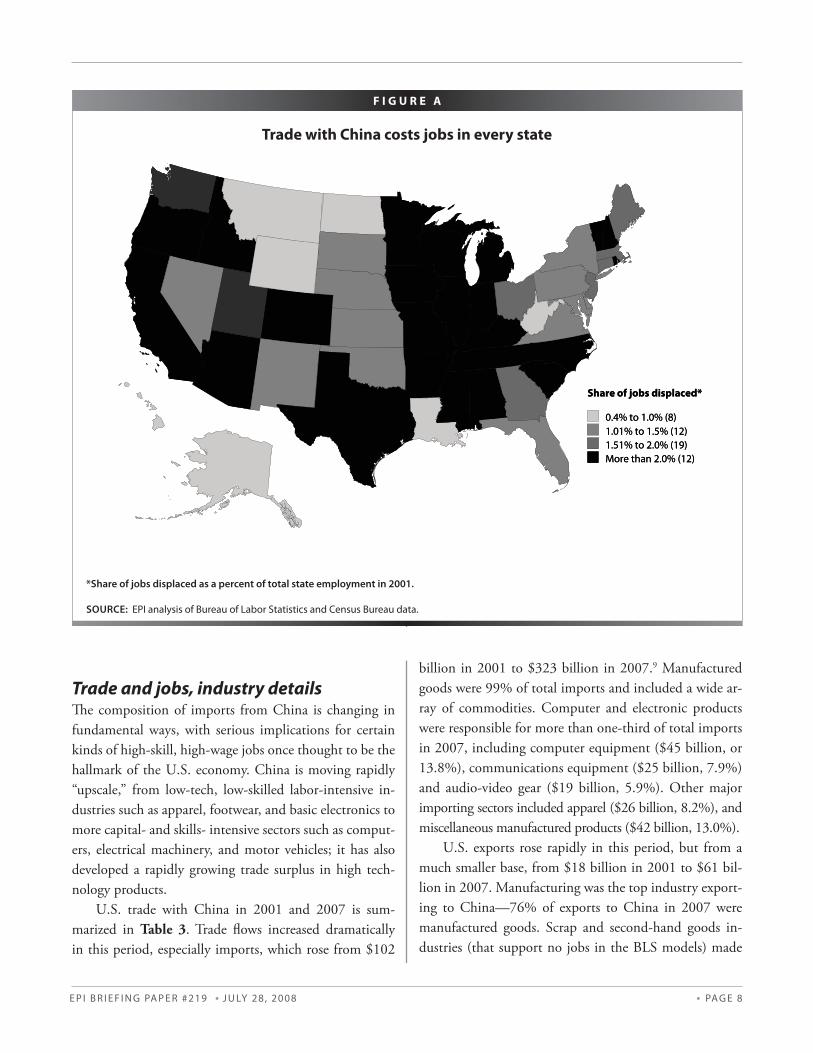
Th e model estimates the amount of labor (number of jobs) required to produce a given volume of exports and the labor displaced when a given volume of imports is substituted for domestic output.8 Th e net of these two numbers is essentially the jobs lost due to growing trade defi cits, holding all else equal. Jobs displaced by the growing China trade defi cit are a net drain on employment in trade-related industries, especially those in the manufacturing sector. Even if in-creases in demand in other sectors absorb all the workers displaced by trade (an unlikely event), it is likely that job-quality will suff er, as many non-traded industries such as retail trade and home health care pay lower wages and have less comprehensive benefi ts than traded goods indus-tries. U.S. exports to China in 2001 supported 166,700 jobs, but U.S. imports displaced production that would have supported 1,188,200 jobs, as shown in the bottom half of Table 1. Th erefore, the $84 billion trade defi cit in 2001 displaced 1,021,500 jobs in that year. Job displace-ment rose to 2,951,100 jobs in 2006 and 3,316,800 in 2007. Since China’s entry into the WTO in 2001 through 2007, the increase in U.S.-China trade defi cits eliminated or displaced 2,295,300 U.S. jobs, as shown in the bottom half of Table 1. In the past year alone 365,700 jobs were lost, either through the destruction of existing jobs or by the prevention of new job creation. On average, 382,500 jobs per year have been lost/displaced since China’s entry into the WTO. Growth in trade defi cits with China has reduced de-mand for goods produced in every region of the United States and has led to job displacement in all 50 states and the District of Columbia, as shown in Table 2A. More than 200,000 jobs were lost in each of California and Texas and more than 100,000 each in New York, Illinois, Ohio, and Florida. Jobs displaced due to growing defi cits with China exceeded 2.0% of total employment in 12 states in-cluding Idaho, New Hampshire, South Carolina, Oregon, California, Minnesota, Vermont, Texas, and Wisconsin, as shown in Table 2B and Figure A. An alphabetical list of job losses by state is shown in Table 2C. Th e state job loss map shows that the eff ects of grow-ing trade defi cits with China have been felt widely across
the United States and that no area has been exempt from impact. While traditional manufacturing states such as Wisconsin, Tennessee, and the Carolinas were certainly hard hit, so too were states in the tech sector such Califor-nia, Texas, Oregon, and Minnesota. Idaho, which lost an estimated 9,000 jobs in computer and electronic products alone, was the hardest-hit state in the country in terms of share of total state employment, as shown in Table 2B. Growing trade defi cits with China have clearly re-duced domestic employment in traded goods industries, especially in the manufacturing sector, which has been hard hit by plant closings and job losses. Workers dis-placed by trade from the manufacturing sector have had particular diffi culty in securing comparable employment elsewhere in the economy. More than one-third of workers displaced from manufacturing dropped out of the labor force (Kletzer 2001, 101, Table D2), and average wages of those who secured re-employment fell 11% to 13%. Some economists have argued that job loss numbers extrapolated from trade fl ows are uninformative because aggregate employment levels in the United States are set by a broad range of macroeconomic infl uences, not just by trade fl ows. However, while the trade balance is but one of many variables aff ecting aggregate job creation, the employment impacts of trade identifi ed in this paper can be interpreted as the “all else equal” eff ect of trade on domestic employment. Th e Federal Reserve, for example, may decide to cut interest rates to make up for job loss stemming from deteriorating trade balances (or any other economic infl uence), leaving net employment unchanged. Th is, however, does not change the fact that trade defi cits by themselves are a net drain on employment. Further, even in the best-case scenario in which other jobs rise up one-for-one to replace those displaced by trade fl ows, the job numbers in this paper are a (conservative) measure of the involuntary job displacement caused by growing trade defi cits and a potent indicator of imbalance in the U.S. labor market and wider economy. Economists may label it a wash when the loss of a hundred manufac-turing jobs in Ohio or Pennsylvania is off set by the hiring of a hundred construction workers in Phoenix, but in the real world these displacements often result in large income losses and even permanent damage to workers’ earning power (Bivens 2008b).
E P I B R I E F I N G PA P E R #219 ● J U LY 28, 2008 ● PAG E 6
Net job loss due to growing trade defi cits with China,
ranked by number of job losses, 2001-07
State
Net job loss by state
2001-06 2006-07 2001-07
California 270,400 55,400 325,800
Texas 168,800 34,100 202,900
New York 105,700 21,300 127,000
Illinois 85,500 17,300 102,800
Ohio 85,800 17,000 102,700
Florida 83,900 17,000 100,900
Pennsylvania 72,700 12,400 85,100
North Carolina 67,400 12,400 79,800
Michigan 67,300 12,300 79,500
Georgia 62,000 11,500 73,600
New Jersey 56,400 11,400 67,800
Wisconsin 49,800 9,300 59,100
Minnesota 49,300 9,400 58,700
Massachusetts 48,800 9,600 58,400
Tennessee 45,900 8,800 54,700
Indiana 44,900 7,800 52,700
Missouri 38,000 7,500 45,400
Washington 38,000 6,900 44,900
Arizona 36,700 6,600 43,300
South Carolina 35,800 6,800 42,600
Virginia 33,200 6,300 39,500
Alabama 32,600 4,800 37,400
Oregon 31,400 5,400 36,800
Colorado 28,900 4,900 33,800
Kentucky 28,100 5,300 33,400
Maryland 22,200 4,400 26,600
Connecticut 22,100 4,000 26,100
T A B L E 2 A
SOURCE: EPI analysis of Census Bureau and BLS data.
State
Net job loss by state
2001-06 2006-07 2001-07
Iowa 19,200 3,100 22,200
Arkansas 19,400 2,400 21,800
Mississippi 19,100 2,700 21,700
Utah 14,500 2,400 16,900
Kansas 14,000 2,600 16,600
Louisiana 13,500 2,400 15,900
New Hampshire 13,400 2,300 15,700
Oklahoma 13,200 2,200 15,400
Idaho 12,200 2,500 14,700
Nebraska 10,200 1,700 12,000
Maine 10,300 1,400 11,700
Nevada 9,100 1,600 10,700
Rhode Island 8,200 1,500 9,700
New Mexico 8,000 1,500 9,400
West Virginia 6,300 900 7,200
Vermont 5,500 1,000 6,500
Delaware 3,900 700 4,600
South Dakota 3,800 600 4,400
Hawaii 3,400 700 4,100
Montana 2,800 400 3,200
North Dakota 2,300 400 2,700
District of Columbia
2,000 400 2,400
Alaska 2,000 300 2,300
Wyoming 1,700 300 2,000
National total* 1,929,600 365,700 2,295,300
E P I B R I E F I N G PA P E R #219 ● J U LY 28, 2008 ● PAG E 7
Net job loss due to growing trade defi cits with China,
ranked by share of state employment, 2001-07
T A B L E 2 B
Net jobs
lost
Share of total
state employ-
ment in 2001
Idaho 14,700 2.59%
New Hampshire 15,700 2.50
South Carolina 42,600 2.34
Oregon 36,800 2.29
California 325,800 2.23
Minnesota 58,700 2.18
Vermont 6,500 2.15
Texas 202,900 2.13
Wisconsin 59,100 2.10
North Carolina 79,800 2.05
Tennessee 54,700 2.03
Rhode Island 9,700 2.03
Alabama 37,400 1.96
Maine 11,700 1.92
Mississippi 21,700 1.92
Arizona 43,300 1.91
Arkansas 21,800 1.89
Georgia 73,600 1.87
Ohio 102,700 1.85
Kentucky 33,400 1.85
Indiana 52,700 1.80
Massachusetts 58,400 1.75
Michigan 79,500 1.74
Illinois 102,800 1.71
New Jersey 67,800 1.70
Washington 44,900 1.66
Missouri 45,400 1.66
SOURCE: EPI analysis of Census Bureau and BLS data.
Net jobs
lost
Share of total
state employ-
ment in 2001
Utah 16,900 1.56%
Connecticut 26,100 1.55
Colorado 33,800 1.52
Iowa 22,200 1.51
Pennsylvania 85,100 1.50
New York 127,000 1.48
Florida 100,900 1.41
Nebraska 12,000 1.30
New Mexico 9,400 1.24
Kansas 16,600 1.23
South Dakota 4,400 1.16
Virginia 39,500 1.12
Delaware 4,600 1.10
Maryland 26,600 1.08
Oklahoma 15,400 1.03
Nevada 10,700 1.02
West Virginia 7,200 0.98
Louisiana 15,900 0.83
North Dakota 2,700 0.82
Montana 3,200 0.82
Wyoming 2,000 0.81
Alaska 2,300 0.80
Hawaii 4,100 0.74
District of Columbia
2,400 0.37
National total* 2,295,300
E P I B R I E F I N G PA P E R #219 ● J U LY 28, 2008 ● PAG E 8
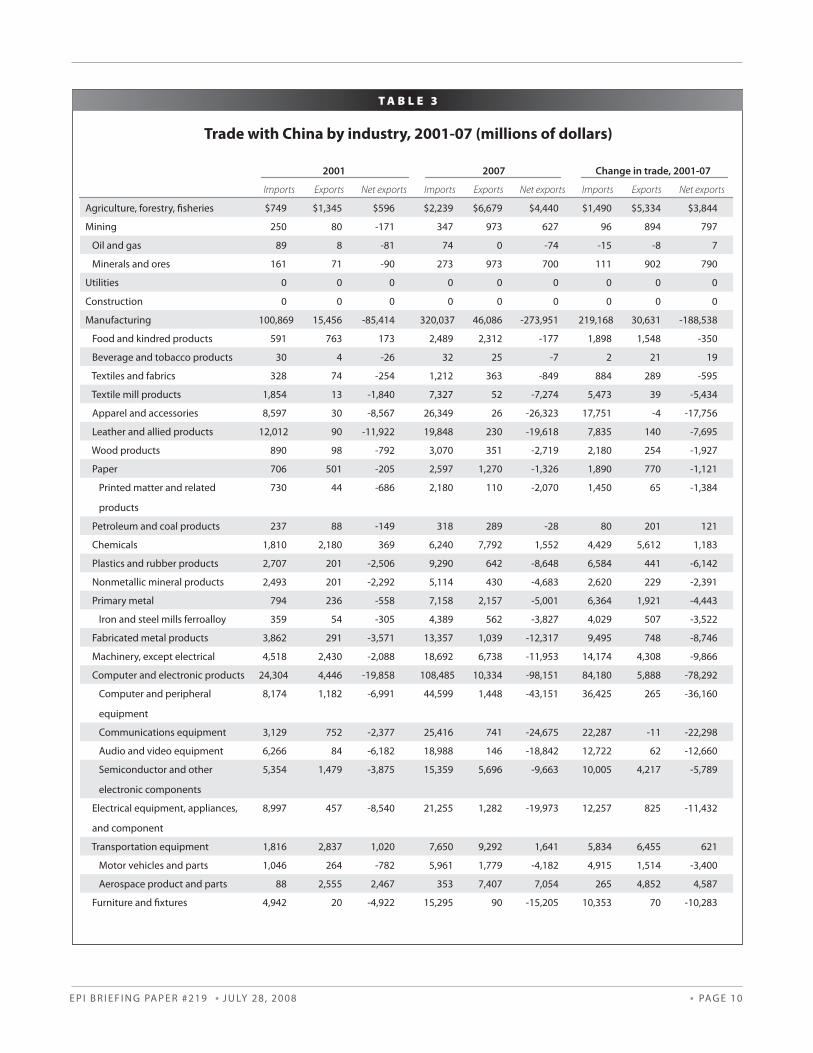
Trade and jobs, industry detailsTh e composition of imports from China is changing in fundamental ways, with serious implications for certain kinds of high-skill, high-wage jobs once thought to be the hallmark of the U.S. economy. China is moving rapidly “upscale,” from low-tech, low-skilled labor-intensive in-dustries such as apparel, footwear, and basic electronics to more capital- and skills- intensive sectors such as comput-ers, electrical machinery, and motor vehicles; it has also developed a rapidly growing trade surplus in high tech-nology products. U.S. trade with China in 2001 and 2007 is sum-marized in Table 3. Trade fl ows increased dramatically in this period, especially imports, which rose from $102
billion in 2001 to $323 billion in 2007.9 Manufactured goods were 99% of total imports and included a wide ar-ray of commodities. Computer and electronic products were responsible for more than one-third of total imports in 2007, including computer equipment ($45 billion, or 13.8%), communications equipment ($25 billion, 7.9%) and audio-video gear ($19 billion, 5.9%). Other major importing sectors included apparel ($26 billion, 8.2%), and miscellaneous manufactured products ($42 billion, 13.0%). U.S. exports rose rapidly in this period, but from a much smaller base, from $18 billion in 2001 to $61 bil-lion in 2007. Manufacturing was the top industry export-ing to China—76% of exports to China in 2007 were manufactured goods. Scrap and second-hand goods in-dustries (that support no jobs in the BLS models) made
Trade with China costs jobs in every state
F I G U R E A
*Share of jobs displaced as a percent of total state employment in 2001.
SOURCE: EPI analysis of Bureau of Labor Statistics and Census Bureau data.
Share of jobs displaced*
0.4% to 1.0% (8)1.01% to 1.5% (12)1.51% to 2.0% (19)More than 2.0% (12)
Share of jobs displaced*
0.4% to 1.0% (8)1.01% to 1.5% (12)1.51% to 2.0% (19)More than 2.0% (12)
E P I B R I E F I N G PA P E R #219 ● J U LY 28, 2008 ● PAG E 9
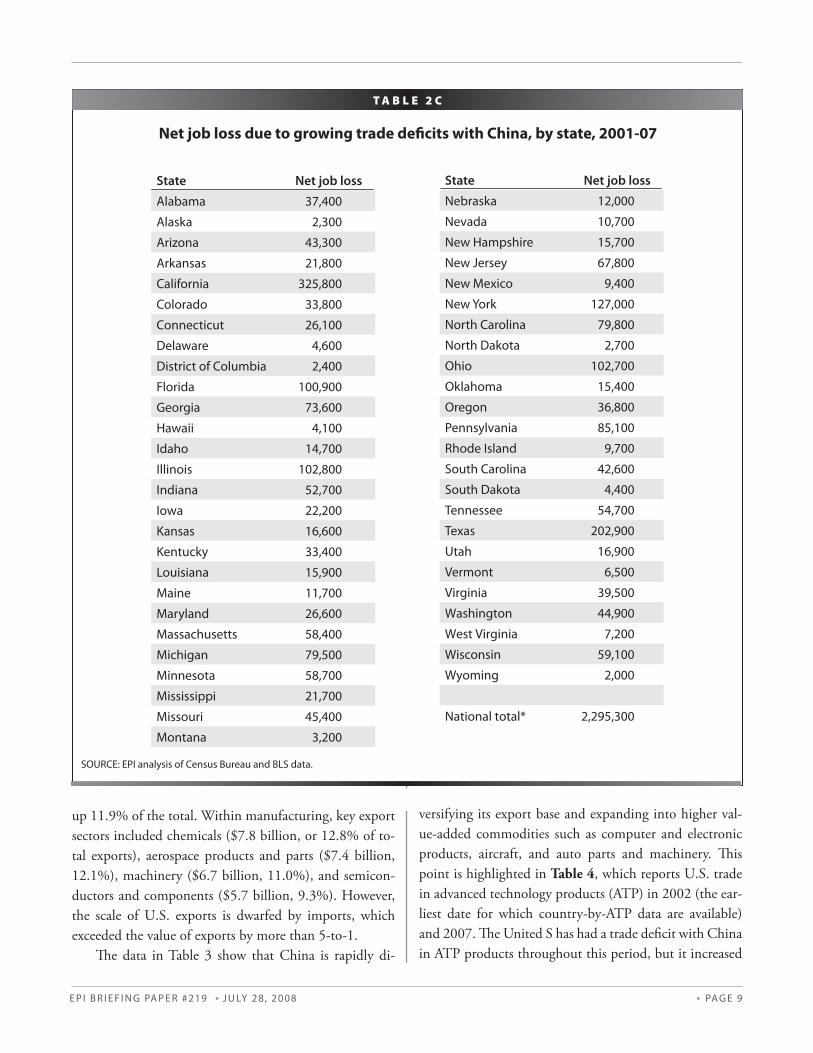
Net job loss due to growing trade defi cits with China, by state, 2001-07
T A B L E 2 C
SOURCE: EPI analysis of Census Bureau and BLS data.
State Net job loss
Alabama 37,400
Alaska 2,300
Arizona 43,300
Arkansas 21,800
California 325,800
Colorado 33,800
Connecticut 26,100
Delaware 4,600
District of Columbia 2,400
Florida 100,900
Georgia 73,600
Hawaii 4,100
Idaho 14,700
Illinois 102,800
Indiana 52,700
Iowa 22,200
Kansas 16,600
Kentucky 33,400
Louisiana 15,900
Maine 11,700
Maryland 26,600
Massachusetts 58,400
Michigan 79,500
Minnesota 58,700
Mississippi 21,700
Missouri 45,400
Montana 3,200
State Net job loss
Nebraska 12,000
Nevada 10,700
New Hampshire 15,700
New Jersey 67,800
New Mexico 9,400
New York 127,000
North Carolina 79,800
North Dakota 2,700
Ohio 102,700
Oklahoma 15,400
Oregon 36,800
Pennsylvania 85,100
Rhode Island 9,700
South Carolina 42,600
South Dakota 4,400
Tennessee 54,700
Texas 202,900
Utah 16,900
Vermont 6,500
Virginia 39,500
Washington 44,900
West Virginia 7,200
Wisconsin 59,100
Wyoming 2,000
National total* 2,295,300
up 11.9% of the total. Within manufacturing, key export sectors included chemicals ($7.8 billion, or 12.8% of to-tal exports), aerospace products and parts ($7.4 billion, 12.1%), machinery ($6.7 billion, 11.0%), and semicon-ductors and components ($5.7 billion, 9.3%). However, the scale of U.S. exports is dwarfed by imports, which exceeded the value of exports by more than 5-to-1. Th e data in Table 3 show that China is rapidly di-
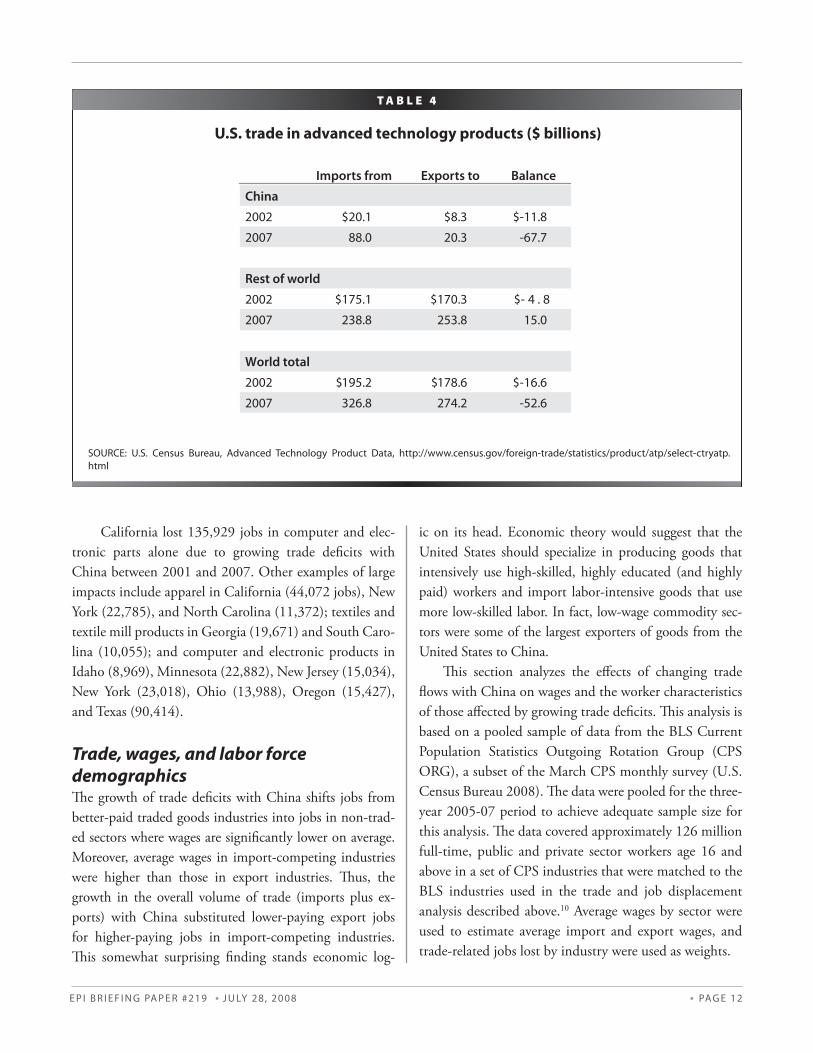
versifying its export base and expanding into higher val-ue-added commodities such as computer and electronic products, aircraft, and auto parts and machinery. Th is point is highlighted in Table 4, which reports U.S. trade in advanced technology products (ATP) in 2002 (the ear-liest date for which country-by-ATP data are available) and 2007. Th e United S has had a trade defi cit with China in ATP products throughout this period, but it increased
E P I B R I E F I N G PA P E R #219 ● J U LY 28, 2008 ● PAG E 10
Trade with China by industry, 2001-07 (millions of dollars)
T A B L E 3
2001 2007 Change in trade, 2001-07
Imports Exports Net exports Imports Exports Net exports Imports Exports Net exports
Agriculture, forestry, fi sheries $749 $1,345 $596 $2,239 $6,679 $4,440 $1,490 $5,334 $3,844
Mining 250 80 -171 347 973 627 96 894 797
Oil and gas 89 8 -81 74 0 -74 -15 -8 7
Minerals and ores 161 71 -90 273 973 700 111 902 790
Utilities 0 0 0 0 0 0 0 0 0
Construction 0 0 0 0 0 0 0 0 0
Manufacturing 100,869 15,456 -85,414 320,037 46,086 -273,951 219,168 30,631 -188,538
Food and kindred products 591 763 173 2,489 2,312 -177 1,898 1,548 -350
Beverage and tobacco products 30 4 -26 32 25 -7 2 21 19
Textiles and fabrics 328 74 -254 1,212 363 -849 884 289 -595
Textile mill products 1,854 13 -1,840 7,327 52 -7,274 5,473 39 -5,434
Apparel and accessories 8,597 30 -8,567 26,349 26 -26,323 17,751 -4 -17,756
Leather and allied products 12,012 90 -11,922 19,848 230 -19,618 7,835 140 -7,695
Wood products 890 98 -792 3,070 351 -2,719 2,180 254 -1,927
Paper 706 501 -205 2,597 1,270 -1,326 1,890 770 -1,121
Printed matter and related
products
730 44 -686 2,180 110 -2,070 1,450 65 -1,384
Petroleum and coal products 237 88 -149 318 289 -28 80 201 121
Chemicals 1,810 2,180 369 6,240 7,792 1,552 4,429 5,612 1,183
Plastics and rubber products 2,707 201 -2,506 9,290 642 -8,648 6,584 441 -6,142
Nonmetallic mineral products 2,493 201 -2,292 5,114 430 -4,683 2,620 229 -2,391
Primary metal 794 236 -558 7,158 2,157 -5,001 6,364 1,921 -4,443
Iron and steel mills ferroalloy 359 54 -305 4,389 562 -3,827 4,029 507 -3,522
Fabricated metal products 3,862 291 -3,571 13,357 1,039 -12,317 9,495 748 -8,746
Machinery, except electrical 4,518 2,430 -2,088 18,692 6,738 -11,953 14,174 4,308 -9,866
Computer and electronic products 24,304 4,446 -19,858 108,485 10,334 -98,151 84,180 5,888 -78,292
Computer and peripheral
equipment
8,174 1,182 -6,991 44,599 1,448 -43,151 36,425 265 -36,160
Communications equipment 3,129 752 -2,377 25,416 741 -24,675 22,287 -11 -22,298
Audio and video equipment 6,266 84 -6,182 18,988 146 -18,842 12,722 62 -12,660
Semiconductor and other
electronic components
5,354 1,479 -3,875 15,359 5,696 -9,663 10,005 4,217 -5,789
Electrical equipment, appliances,
and component
8,997 457 -8,540 21,255 1,282 -19,973 12,257 825 -11,432
Transportation equipment 1,816 2,837 1,020 7,650 9,292 1,641 5,834 6,455 621
Motor vehicles and parts 1,046 264 -782 5,961 1,779 -4,182 4,915 1,514 -3,400
Aerospace product and parts 88 2,555 2,467 353 7,407 7,054 265 4,852 4,587
Furniture and fi xtures 4,942 20 -4,922 15,295 90 -15,205 10,353 70 -10,283
E P I B R I E F I N G PA P E R #219 ● J U LY 28, 2008 ● PAG E 11
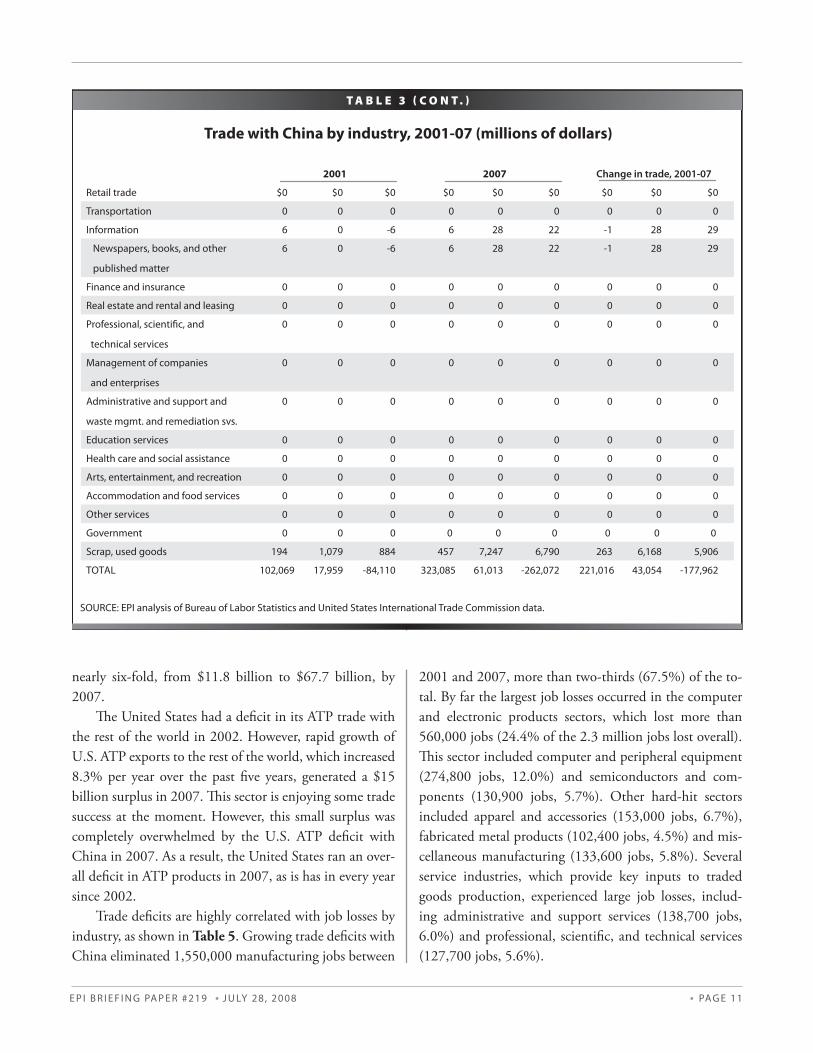
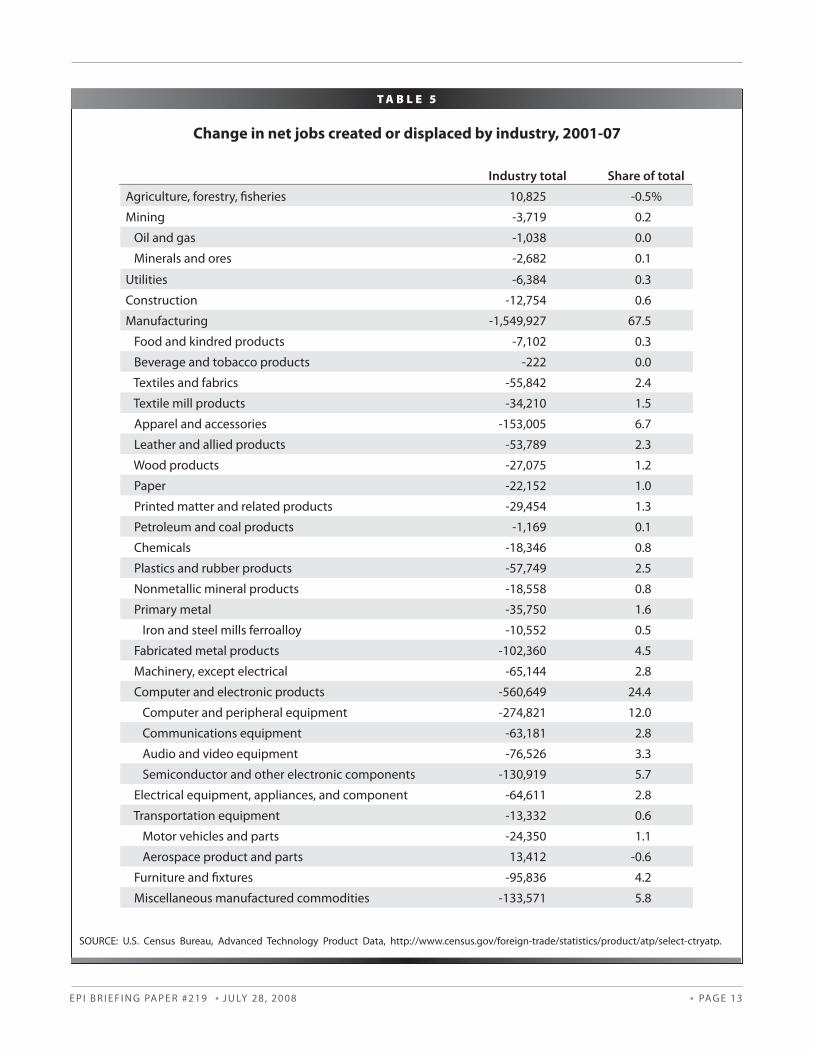
nearly six-fold, from $11.8 billion to $67.7 billion, by 2007. Th e United States had a defi cit in its ATP trade with the rest of the world in 2002. However, rapid growth of U.S. ATP exports to the rest of the world, which increased 8.3% per year over the past fi ve years, generated a $15 billion surplus in 2007. Th is sector is enjoying some trade success at the moment. However, this small surplus was completely overwhelmed by the U.S. ATP defi cit with China in 2007. As a result, the United States ran an over-all defi cit in ATP products in 2007, as is has in every year since 2002. Trade defi cits are highly correlated with job losses by industry, as shown in Table 5. Growing trade defi cits with China eliminated 1,550,000 manufacturing jobs between
Trade with China by industry, 2001-07 (millions of dollars)
T A B L E 3 C O N T .
SOURCE: EPI analysis of Bureau of Labor Statistics and United States International Trade Commission data.
2001 2007 Change in trade, 2001-07
Retail trade $0 $0 $0 $0 $0 $0 $0 $0 $0
Transportation 0 0 0 0 0 0 0 0 0
Information 6 0 -6 6 28 22 -1 28 29
Newspapers, books, and other
published matter
6 0 -6 6 28 22 -1 28 29
Finance and insurance 0 0 0 0 0 0 0 0 0
Real estate and rental and leasing 0 0 0 0 0 0 0 0 0
Professional, scientifi c, and
technical services
0 0 0 0 0 0 0 0 0
Management of companies
and enterprises
0 0 0 0 0 0 0 0 0
Administrative and support and
waste mgmt. and remediation svs.
0 0 0 0 0 0 0 0 0
Education services 0 0 0 0 0 0 0 0 0
Health care and social assistance 0 0 0 0 0 0 0 0 0
Arts, entertainment, and recreation 0 0 0 0 0 0 0 0 0
Accommodation and food services 0 0 0 0 0 0 0 0 0
Other services 0 0 0 0 0 0 0 0 0
Government 0 0 0 0 0 0 0 0 0
Scrap, used goods 194 1,079 884 457 7,247 6,790 263 6,168 5,906
TOTAL 102,069 17,959 -84,110 323,085 61,013 -262,072 221,016 43,054 -177,962
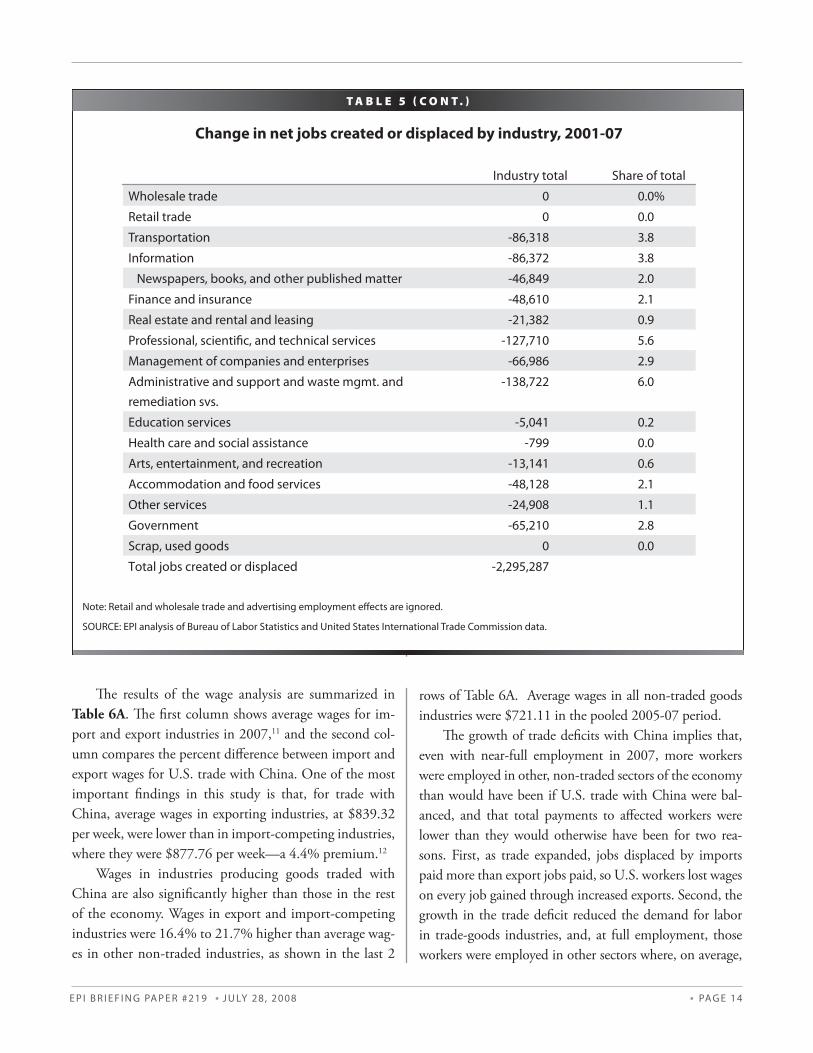
2001 and 2007, more than two-thirds (67.5%) of the to-tal. By far the largest job losses occurred in the computer and electronic products sectors, which lost more than 560,000 jobs (24.4% of the 2.3 million jobs lost overall). Th is sector included computer and peripheral equipment (274,800 jobs, 12.0%) and semiconductors and com-ponents (130,900 jobs, 5.7%). Other hard-hit sectors included apparel and accessories (153,000 jobs, 6.7%), fabricated metal products (102,400 jobs, 4.5%) and mis-cellaneous manufacturing (133,600 jobs, 5.8%). Several service industries, which provide key inputs to traded goods production, experienced large job losses, includ-ing administrative and support services (138,700 jobs, 6.0%) and professional, scientifi c, and technical services (127,700 jobs, 5.6%).
E P I B R I E F I N G PA P E R #219 ● J U LY 28, 2008 ● PAG E 12
California lost 135,929 jobs in computer and elec-tronic parts alone due to growing trade defi cits with China between 2001 and 2007. Other examples of large impacts include apparel in California (44,072 jobs), New York (22,785), and North Carolina (11,372); textiles and textile mill products in Georgia (19,671) and South Caro-lina (10,055); and computer and electronic products in Idaho (8,969), Minnesota (22,882), New Jersey (15,034), New York (23,018), Ohio (13,988), Oregon (15,427), and Texas (90,414).
Trade, wages, and labor force
demographicsTh e growth of trade defi cits with China shifts jobs from better-paid traded goods industries into jobs in non-trad-ed sectors where wages are signifi cantly lower on average. Moreover, average wages in import-competing industries were higher than those in export industries. Th us, the growth in the overall volume of trade (imports plus ex-ports) with China substituted lower-paying export jobs for higher-paying jobs in import-competing industries. Th is somewhat surprising fi nding stands economic log-
ic on its head. Economic theory would suggest that the United States should specialize in producing goods that intensively use high-skilled, highly educated (and highly paid) workers and import labor-intensive goods that use more low-skilled labor. In fact, low-wage commodity sec-tors were some of the largest exporters of goods from the United States to China. Th is section analyzes the eff ects of changing trade fl ows with China on wages and the worker characteristics of those aff ected by growing trade defi cits. Th is analysis is based on a pooled sample of data from the BLS Current Population Statistics Outgoing Rotation Group (CPS ORG), a subset of the March CPS monthly survey (U.S. Census Bureau 2008). Th e data were pooled for the three-year 2005-07 period to achieve adequate sample size for this analysis. Th e data covered approximately 126 million full-time, public and private sector workers age 16 and above in a set of CPS industries that were matched to the BLS industries used in the trade and job displacement analysis described above.10 Average wages by sector were used to estimate average import and export wages, and trade-related jobs lost by industry were used as weights.
SOURCE: U.S. Census Bureau, Advanced Technology Product Data, http://www.census.gov/foreign-trade/statistics/product/atp/select-ctryatp.html
Imports from Exports to Balance
China
2002 $20.1 $8.3 $-11.8
2007 88.0 20.3 -67.7
Rest of world
2002 $175.1 $170.3 $- 4 . 8
2007 238.8 253.8 15.0
World total
2002 $195.2 $178.6 $-16.6
2007 326.8 274.2 -52.6
U.S. trade in advanced technology products ($ billions)
T A B L E 4
E P I B R I E F I N G PA P E R #219 ● J U LY 28, 2008 ● PAG E 13
Industry total Share of total
Agriculture, forestry, fi sheries 10,825 -0.5%
Mining -3,719 0.2
Oil and gas -1,038 0.0
Minerals and ores -2,682 0.1
Utilities -6,384 0.3
Construction -12,754 0.6
Manufacturing -1,549,927 67.5
Food and kindred products -7,102 0.3
Beverage and tobacco products -222 0.0
Textiles and fabrics -55,842 2.4
Textile mill products -34,210 1.5
Apparel and accessories -153,005 6.7
Leather and allied products -53,789 2.3
Wood products -27,075 1.2
Paper -22,152 1.0
Printed matter and related products -29,454 1.3
Petroleum and coal products -1,169 0.1
Chemicals -18,346 0.8
Plastics and rubber products -57,749 2.5
Nonmetallic mineral products -18,558 0.8
Primary metal -35,750 1.6
Iron and steel mills ferroalloy -10,552 0.5
Fabricated metal products -102,360 4.5
Machinery, except electrical -65,144 2.8
Computer and electronic products -560,649 24.4
Computer and peripheral equipment -274,821 12.0
Communications equipment -63,181 2.8
Audio and video equipment -76,526 3.3
Semiconductor and other electronic components -130,919 5.7
Electrical equipment, appliances, and component -64,611 2.8
Transportation equipment -13,332 0.6
Motor vehicles and parts -24,350 1.1
Aerospace product and parts 13,412 -0.6
Furniture and fi xtures -95,836 4.2
Miscellaneous manufactured commodities -133,571 5.8
SOURCE: U.S. Census Bureau, Advanced Technology Product Data, http://www.census.gov/foreign-trade/statistics/product/atp/select-ctryatp.
Change in net jobs created or displaced by industry, 2001-07
T A B L E 5
E P I B R I E F I N G PA P E R #219 ● J U LY 28, 2008 ● PAG E 14
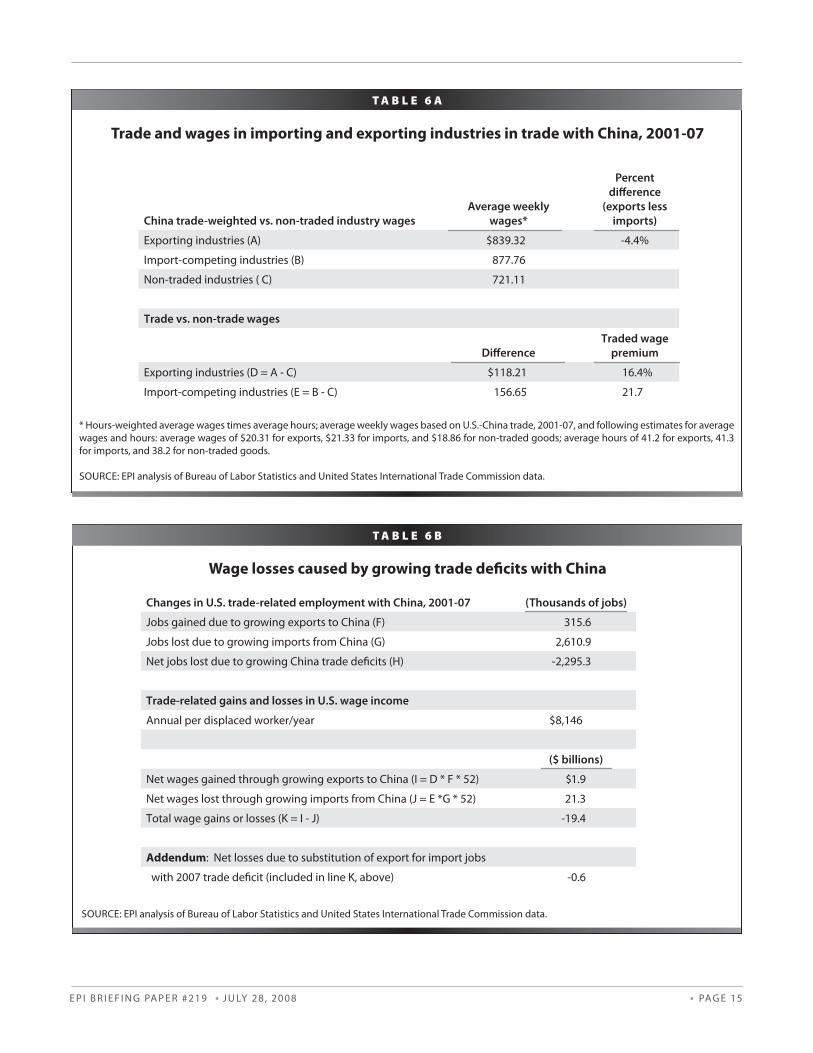
Th e results of the wage analysis are summarized in Table 6A. Th e fi rst column shows average wages for im-port and export industries in 2007,11 and the second col-umn compares the percent diff erence between import and export wages for U.S. trade with China. One of the most important fi ndings in this study is that, for trade with China, average wages in exporting industries, at $839.32 per week, were lower than in import-competing industries, where they were $877.76 per week—a 4.4% premium.12
Wages in industries producing goods traded with China are also signifi cantly higher than those in the rest of the economy. Wages in export and import-competing industries were 16.4% to 21.7% higher than average wag-es in other non-traded industries, as shown in the last 2
rows of Table 6A. Average wages in all non-traded goods industries were $721.11 in the pooled 2005-07 period. Th e growth of trade defi cits with China implies that, even with near-full employment in 2007, more workers were employed in other, non-traded sectors of the economy than would have been if U.S. trade with China were bal-anced, and that total payments to aff ected workers were lower than they would otherwise have been for two rea-sons. First, as trade expanded, jobs displaced by imports paid more than export jobs paid, so U.S. workers lost wages on every job gained through increased exports. Second, the growth in the trade defi cit reduced the demand for labor in trade-goods industries, and, at full employment, those workers were employed in other sectors where, on average,
Note: Retail and wholesale trade and advertising employment eff ects are ignored.
SOURCE: EPI analysis of Bureau of Labor Statistics and United States International Trade Commission data.
Change in net jobs created or displaced by industry, 2001-07
T A B L E 5 C O N T .
Industry total Share of total
Wholesale trade 0 0.0%
Retail trade 0 0.0
Transportation -86,318 3.8
Information -86,372 3.8
Newspapers, books, and other published matter -46,849 2.0
Finance and insurance -48,610 2.1
Real estate and rental and leasing -21,382 0.9
Professional, scientifi c, and technical services -127,710 5.6
Management of companies and enterprises -66,986 2.9
Administrative and support and waste mgmt. and remediation svs.
-138,722 6.0
Education services -5,041 0.2
Health care and social assistance -799 0.0
Arts, entertainment, and recreation -13,141 0.6
Accommodation and food services -48,128 2.1
Other services -24,908 1.1
Government -65,210 2.8
Scrap, used goods 0 0.0
Total jobs created or displaced -2,295,287
E P I B R I E F I N G PA P E R #219 ● J U LY 28, 2008 ● PAG E 15
Changes in U.S. trade-related employment with China, 2001-07 (Thousands of jobs)
Jobs gained due to growing exports to China (F) 315.6
Jobs lost due to growing imports from China (G) 2,610.9
Net jobs lost due to growing China trade defi cits (H) -2,295.3
Trade-related gains and losses in U.S. wage income
Annual per displaced worker/year $8,146
($ billions)
Net wages gained through growing exports to China (I = D * F * 52) $1.9
Net wages lost through growing imports from China (J = E *G * 52) 21.3
Total wage gains or losses (K = I - J) -19.4
Addendum: Net losses due to substitution of export for import jobs
with 2007 trade defi cit (included in line K, above) -0.6
Trade and wages in importing and exporting industries in trade with China, 2001-07
T A B L E 6 A
Average weekly
wages*
Percent
diff erence
(exports less
imports)China trade-weighted vs. non-traded industry wages
Exporting industries (A) $839.32 -4.4%
Import-competing industries (B) 877.76
Non-traded industries ( C) 721.11
Trade vs. non-trade wages
Diff erence
Traded wage
premium
Exporting industries (D = A - C) $118.21 16.4%
Import-competing industries (E = B - C) 156.65 21.7
* Hours-weighted average wages times average hours; average weekly wages based on U.S.-China trade, 2001-07, and following estimates for average wages and hours: average wages of $20.31 for exports, $21.33 for imports, and $18.86 for non-traded goods; average hours of 41.2 for exports, 41.3 for imports, and 38.2 for non-traded goods.
SOURCE: EPI analysis of Bureau of Labor Statistics and United States International Trade Commission data.
Wage losses caused by growing trade defi cits with China
T A B L E 6 B
SOURCE: EPI analysis of Bureau of Labor Statistics and United States International Trade Commission data.
E P I B R I E F I N G PA P E R #219 ● J U LY 28, 2008 ● PAG E 16
they earned much lower wages. Total wage gains and losses for all trade-aff ected jobs are estimated in Table 6B. Th e jobs gained due to grow-ing exports, jobs lost due to growing imports, and net job loss between 2001 and 2007 are shown in the top sec-tion of the table. Th e growth of exports to China gener-ated total wage premiums of $1.9 billion in this period (i.e., $118.21 per job per week times 315,600 export jobs gained times 52 weeks), while the growth of imports eliminated wage premiums of $21.3 billion in this period. Th us, there was a nationwide loss of $19.4 billion in wage premiums that would have been earned had trade been balanced. Each full-time worker of the 2.3 million dis-placed by the increase in “net” imports from China, even when re-employed in non-traded industries, lost an aver-age $8,146 per worker/year ($156.65 per week times 52 weeks). Net losses associated with the pure substitution of export jobs for import job opportunities for trade with China equaled $0.6 billion, as shown in the last line of Table 6B. Th ese losses off set some of the gains from trade with China (from specialization in products for which the United States has a comparative advantage) that are found in most economic models of the benefi ts of trade. But lost jobs and lower wages for displaced workers are just the tip of the iceberg. Competition with low-wage workers from less-developed countries has also driven down wages for workers in manufacturing and reduced the wages and bargaining power of similar workers throughout the economy—essentially all production workers with less than a four-year college degree, or 70% of the private sec-tor workforce (roughly 100 million workers). For a typical full-time median-wage earner in 2006 these indirect losses totaled approximately $1,400 (Bivens 2008a). China is the most important source of downward pressure from trade with less-developed countries, because its workers receive very low wages, and because it was responsible for nearly 40% of U.S. non-oil imports from less-developed countries in 2007.
Demographic impact of growing trade defi citsTh e models used in this study also allow an examination of the eff ects of growing China trade defi cits on diff erent demographic
groups in terms of education, wage distribution, and race.13
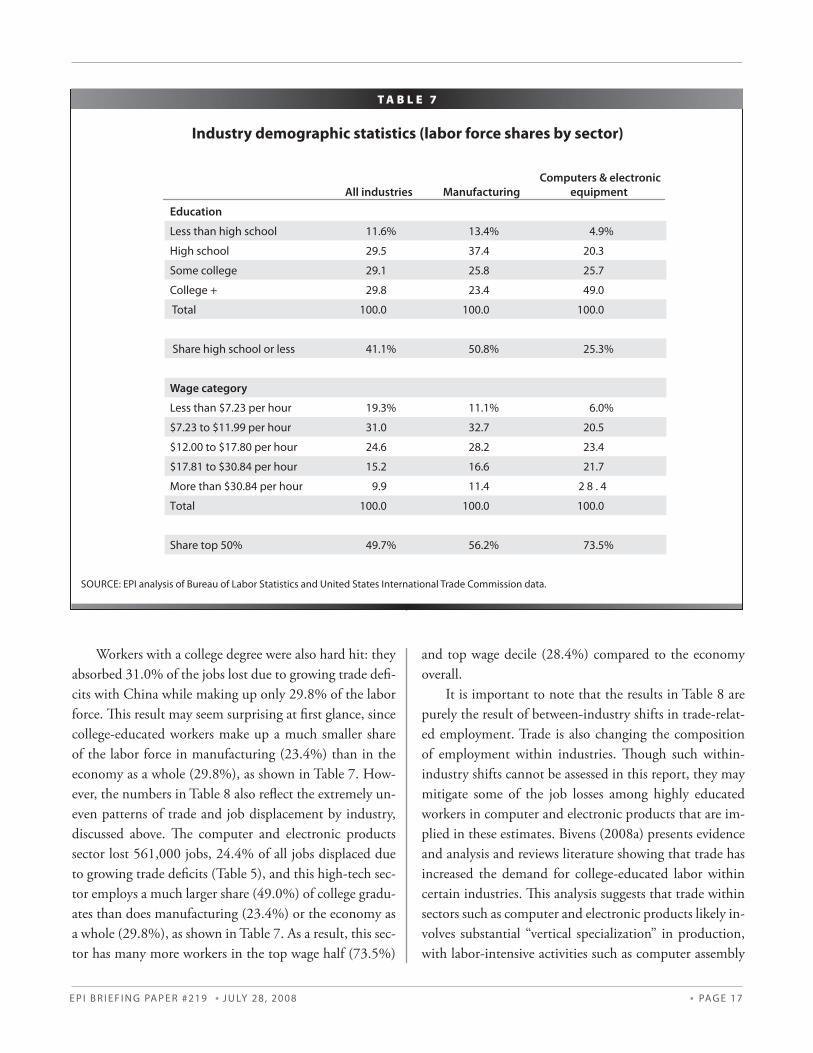
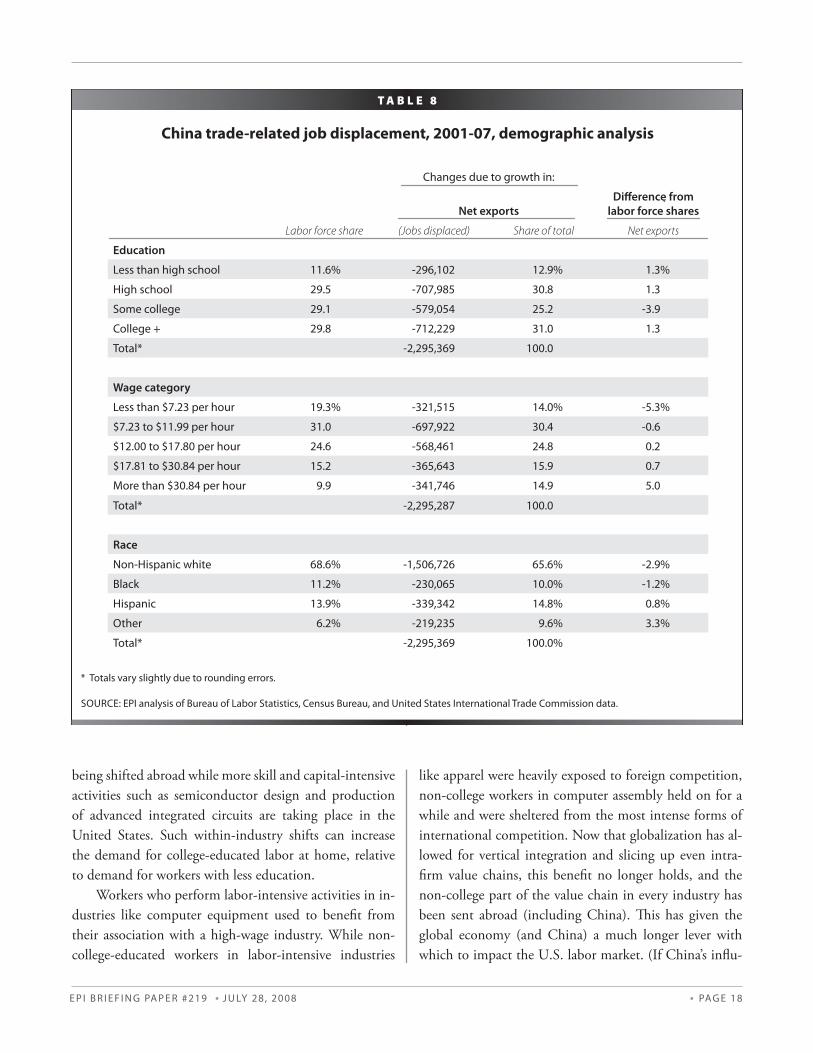
EducationWorkers with a high school degree or less have been particularly hard hit by rising China trade defi cits. Th e manufacturing sector, which produces most traded goods, employs a much higher-than-average share of such work-ers, as shown in Table 7, which details educational sta-tus and wage levels for all industries (i.e., all 125 million workers in the sample), manufacturing, and computers/electronic equipment. Workers with a high school degree or less made up 41.1% of the population overall, but they made up 50.8% of the manufacturing labor force. Manufacturing and trade-related jobs also pay well. Table 7 breaks down wages into fi ve broad categories: the fi rst group represents roughly the bottom two deciles (20%) of the labor force, and the second includes the next three deciles (totaling about 30%). Th e next three groups represent the top half of all jobs, or the best-paying jobs in the U.S. labor market, including the 50-75th percentile ($12.00 to $17.80), the 75-90th ($17.81 to $30.84 per hour) and the top decile, where wages exceed $30.84 per hour. Note that substantially more than half of the jobs in manufacturing (56.2%) were in this top half of the wage distribution, and the manufacturing share in each of the top three categories exceeded the national average. Th us, manufacturing provided more good jobs for more workers with a high school degree or less than did the other sectors of the economy as a whole. Th e com-puter and electronics sectors stand out for other reasons, and we return to these below. Th e number and shares of workers at diff erent levels of education who were displaced by growing trade defi cits with China between 2001 and 2007 are shown in col-umns 2 and 3 of Table 8; column 4 compares these shares to the breakdown of the labor force overall (column 1). For example, growing trade defi cits displaced 1.3% more workers with less than a high school degree and 1.3% more workers with a high school degree (but no more) compared with their share of the labor force. Workers with some college or more took a proportionately smaller hit, as those workers tend to be less intensively employed in traded goods than employed in the rest of the economy.
E P I B R I E F I N G PA P E R #219 ● J U LY 28, 2008 ● PAG E 17
Workers with a college degree were also hard hit: they absorbed 31.0% of the jobs lost due to growing trade defi -cits with China while making up only 29.8% of the labor force. Th is result may seem surprising at fi rst glance, since college-educated workers make up a much smaller share of the labor force in manufacturing (23.4%) than in the economy as a whole (29.8%), as shown in Table 7. How-ever, the numbers in Table 8 also refl ect the extremely un-even patterns of trade and job displacement by industry, discussed above. Th e computer and electronic products sector lost 561,000 jobs, 24.4% of all jobs displaced due to growing trade defi cits (Table 5), and this high-tech sec-tor employs a much larger share (49.0%) of college gradu-ates than does manufacturing (23.4%) or the economy as a whole (29.8%), as shown in Table 7. As a result, this sec-tor has many more workers in the top wage half (73.5%)
and top wage decile (28.4%) compared to the economy overall. It is important to note that the results in Table 8 are purely the result of between-industry shifts in trade-relat-ed employment. Trade is also changing the composition of employment within industries. Th ough such within-industry shifts cannot be assessed in this report, they may mitigate some of the job losses among highly educated workers in computer and electronic products that are im-plied in these estimates. Bivens (2008a) presents evidence and analysis and reviews literature showing that trade has increased the demand for college-educated labor within certain industries. Th is analysis suggests that trade within sectors such as computer and electronic products likely in-volves substantial “vertical specialization” in production, with labor-intensive activities such as computer assembly
Industry demographic statistics (labor force shares by sector)
T A B L E 7
SOURCE: EPI analysis of Bureau of Labor Statistics and United States International Trade Commission data.
All industries Manufacturing
Computers & electronic
equipment
Education
Less than high school 11.6% 13.4% 4.9%
High school 29.5 37.4 20.3
Some college 29.1 25.8 25.7
College + 29.8 23.4 49.0
Total 100.0 100.0 100.0
Share high school or less 41.1% 50.8% 25.3%
Wage category
Less than $7.23 per hour 19.3% 11.1% 6.0%
$7.23 to $11.99 per hour 31.0 32.7 20.5
$12.00 to $17.80 per hour 24.6 28.2 23.4
$17.81 to $30.84 per hour 15.2 16.6 21.7
More than $30.84 per hour 9.9 11.4 2 8 . 4
Total 100.0 100.0 100.0
Share top 50% 49.7% 56.2% 73.5%
E P I B R I E F I N G PA P E R #219 ● J U LY 28, 2008 ● PAG E 18
China trade-related job displacement, 2001-07, demographic analysis
T A B L E 8
* Totals vary slightly due to rounding errors.
SOURCE: EPI analysis of Bureau of Labor Statistics, Census Bureau, and United States International Trade Commission data.
Changes due to growth in:
Net exports
Diff erence from
labor force shares
Labor force share (Jobs displaced) Share of total Net exports
Education
Less than high school 11.6% -296,102 12.9% 1.3%
High school 29.5 -707,985 30.8 1.3
Some college 29.1 -579,054 25.2 -3.9
College + 29.8 -712,229 31.0 1.3
Total* -2,295,369 100.0
Wage category
Less than $7.23 per hour 19.3% -321,515 14.0% -5.3%
$7.23 to $11.99 per hour 31.0 -697,922 30.4 -0.6
$12.00 to $17.80 per hour 24.6 -568,461 24.8 0.2
$17.81 to $30.84 per hour 15.2 -365,643 15.9 0.7
More than $30.84 per hour 9.9 -341,746 14.9 5.0
Total* -2,295,287 100.0
Race
Non-Hispanic white 68.6% -1,506,726 65.6% -2.9%
Black 11.2% -230,065 10.0% -1.2%
Hispanic 13.9% -339,342 14.8% 0.8%
Other 6.2% -219,235 9.6% 3.3%
Total* -2,295,369 100.0%
being shifted abroad while more skill and capital-intensive activities such as semiconductor design and production of advanced integrated circuits are taking place in the United States. Such within-industry shifts can increase the demand for college-educated labor at home, relative to demand for workers with less education. Workers who perform labor-intensive activities in in-dustries like computer equipment used to benefi t from their association with a high-wage industry. While non-college-educated workers in labor-intensive industries
like apparel were heavily exposed to foreign competition, non-college workers in computer assembly held on for a while and were sheltered from the most intense forms of international competition. Now that globalization has al-lowed for vertical integration and slicing up even intra-fi rm value chains, this benefi t no longer holds, and the non-college part of the value chain in every industry has been sent abroad (including China). Th is has given the global economy (and China) a much longer lever with which to impact the U.S. labor market. (If China’s infl u-
E P I B R I E F I N G PA P E R #219 ● J U LY 28, 2008 ● PAG E 19
ence had, say, been capped by the share of apparel expen-ditures in the U.S. economy, it would have had a much smaller impact on U.S. jobs and wages.) Data on occupational employment trends shed further light on within- and between-industry employment shifts. For U.S. manufacturing as a whole, total employment of scientists and engineers (S&E) fell sharply between 2001 and 2007, though not quite as fast as total manufacturing employment. Total S&E employment in manufacturing fell from 1.9 million to 1.7 million workers in this period, a decline of 10.7%.14 Employment of all manufacturing workers fell from 17.3 to 15.0 million workers, a decline of 13.2%. Th us, the S&E employment share within man-ufacturing rose from 10.9% to 11.2%. Th ese data suggest that rapidly growing trade defi cits with China and other countries caused a fall in demand for S&E workers that overwhelmed any gains from within-industry shifts or gains from vertical specialization.15 However, the fact that workers with less education suff ered greater employment losses means that growing trade defi cits did put relatively greater downward pressure on their wages. Th e education results in Table 8 are markedly diff er-ent from those for trade with Mexico and Canada after NAFTA took eff ect. Scott (2006, Table 1-5, 16) per-formed a similar demographic analysis of the eff ects of NAFTA trade between 1993 and 2004. Workers with a high school degree were especially hard hit by growing trade defi cits after NAFTA, and this grouped absorbed 51.5% of job losses while making up only 42.9% of the labor force. Workers with a college degree absorbed only 22.0% of the job losses due to growing NAFTA defi cits, 5.5% less than their share in the total labor force.16 Th us, China trade displaced signifi cantly more workers with a college degree than NAFTA trade. Th is is particularly re-markable since more than half of NAFTA trade was with Canada, which has an advanced industrial economy (Scott 2006, Table 1-1a, 5). Overall, wages in traded-goods industries were signifi -cantly higher than in non-traded industries, as shown in Table 6A. Workers with a high school degree and below are particularly hard hit by growing trade defi cits with China, because larger-than-average shares of these workers are pushed out of high-wage jobs in traded-goods indus-tries.
Within manufacturing in particular, 50.8 % of work-ers have a high school degree or less, while such workers made up only 41.1 % of the labor force as a whole (Table 7). Hence, the manufacturing sector employs about a quarter more of these workers than other sectors of the economy. As noted above, more than two-thirds of the jobs displaced by growing trade defi cits with China were in manufacturing, which is one of the best sources of good jobs with good benefi ts for workers with a high school degree or less.
Wages Table 8 compares the impact of China trade by wage cat-egory in the same way as it did for education level, that is, by contrasting the share of displaced jobs at each wage level to share of all workers earning this particular wage. Growing China trade defi cits displaced fewer jobs on a proportional basis in the two lowest-paying wage groups (those earning $11.99 per hour or less) and more jobs at higher wage levels. Th e largest losses, on a proportional basis, were absorbed by workers in the top wage group, who earned more than $30.84 per hour; their share of net job displacement was 14.9%, 5.0 percentage points more than their share of the labor force (9.9%). Th ese results re-enforce the fi ndings in Table 6, which showed that jobs displaced by growing trade defi cits pay more than other jobs. Manufacturing has higher productivity than other sectors of the economy (U.S. Department of Labor 2008) and higher unionization rates (U.S. Department of Labor 2006b), allowing workers to earn a higher share of the higher marginal product of their labor in this sector. More than two-thirds of the jobs displaced by China-trade were in manufacturing (Table 5, above), many of them high-wage, unionized jobs that are in increasingly scarce supply. Many of those workers were displaced into lower-paying jobs outside of manufacturing. One reason that productivity growth is so high in manufacturing is that it is a relatively large employer of scientists and engineers. Even though fewer college gradu-ates are employed in manufacturing overall, it employs a much higher share of scientists and engineers than other sectors. In 2007, 1.7 million scientists and engineers were employed in manufacturing, or 11.2% of total manu-
E P I B R I E F I N G PA P E R #219 ● J U LY 28, 2008 ● PAG E 20
facturing employment.17 Th is share is one-and-a-quarter times the 5.0% share of such workers in non-manufactur-ing industries. It is likely that many of these workers are employed in computer and electronic products, and that many more science and engineering jobs would be created if U.S. trade with China in these products were more bal-anced.
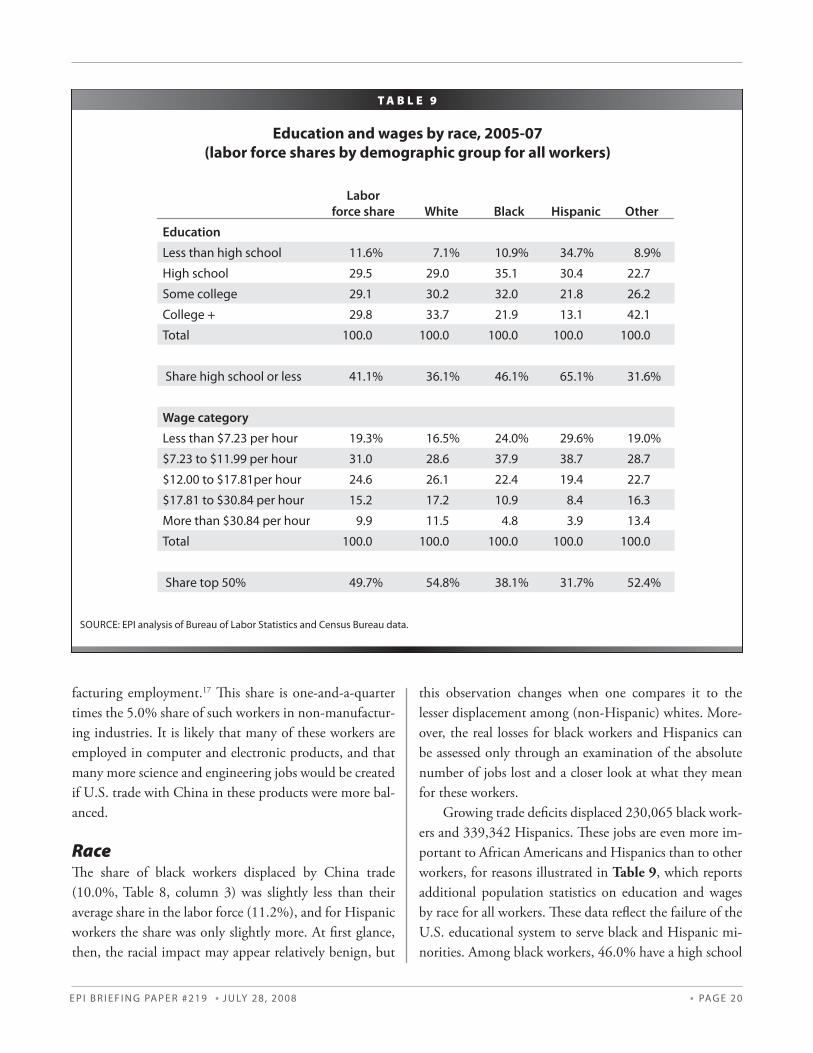
RaceTh e share of black workers displaced by China trade (10.0%, Table 8, column 3) was slightly less than their average share in the labor force (11.2%), and for Hispanic workers the share was only slightly more. At fi rst glance, then, the racial impact may appear relatively benign, but
this observation changes when one compares it to the lesser displacement among (non-Hispanic) whites. More-over, the real losses for black workers and Hispanics can be assessed only through an examination of the absolute number of jobs lost and a closer look at what they mean for these workers. Growing trade defi cits displaced 230,065 black work-ers and 339,342 Hispanics. Th ese jobs are even more im-portant to African Americans and Hispanics than to other workers, for reasons illustrated in Table 9, which reports additional population statistics on education and wages by race for all workers. Th ese data refl ect the failure of the U.S. educational system to serve black and Hispanic mi-norities. Among black workers, 46.0% have a high school
Education and wages by race, 2005-07
(labor force shares by demographic group for all workers)
T A B L E 9
SOURCE: EPI analysis of Bureau of Labor Statistics and Census Bureau data.
Labor
force share White Black Hispanic Other
Education
Less than high school 11.6% 7.1% 10.9% 34.7% 8.9%
High school 29.5 29.0 35.1 30.4 22.7
Some college 29.1 30.2 32.0 21.8 26.2
College + 29.8 33.7 21.9 13.1 42.1
Total 100.0 100.0 100.0 100.0 100.0
Share high school or less 41.1% 36.1% 46.1% 65.1% 31.6%
Wage category
Less than $7.23 per hour 19.3% 16.5% 24.0% 29.6% 19.0%
$7.23 to $11.99 per hour 31.0 28.6 37.9 38.7 28.7
$12.00 to $17.81per hour 24.6 26.1 22.4 19.4 22.7
$17.81 to $30.84 per hour 15.2 17.2 10.9 8.4 16.3
More than $30.84 per hour 9.9 11.5 4.8 3.9 13.4
Total 100.0 100.0 100.0 100.0 100.0
Share top 50% 49.7% 54.8% 38.1% 31.7% 52.4%
E P I B R I E F I N G PA P E R #219 ● J U LY 28, 2008 ● PAG E 21
degree or less, 10 percentage points or 27.5% more than for white workers. For Hispanics, the situation is even worse, 65% having no more than a high school education, 29 percentage points or nearly double the rate of white workers. Th e consequences of discrimination and lack of edu-cational attainment for workers’ wages are illustrated in the bottom half of Table 9. Only 38.1% of black work-ers earn wages in the top 50%, as compared to 54.8% of white workers, and only 31.7% of Hispanics are in the top half of wage earners. Th e contrast is even starker in the top decile. Only 4.8% of all blacks earned more than $30.84 per hour in 2005-07, and only 3.9% of Hispanics. However, 11.5% of white workers were in this top-decile group, shares 140% larger than blacks and 192% larger than Hispanics. Th e full implications of job losses for blacks and His-panics can only be appreciated by comparing Tables 7 and 9. Table 7 showed that manufacturing (which absorbed more than two-thirds of job losses caused by growing trade defi cits with China) provided nearly 25% more jobs for high-school-educated workers than did other sectors of the economy, and 13% more of those jobs were in the top half of the wage distribution. Th us, the manufactur-ing sector provides some of the best jobs available for black and Hispanic workers, who suff er from much lower levels of education and have much lower wages than white workers. Growing China trade defi cits are a special trag-edy for these workers, who lost more than half a million trade-related jobs between 2001 and 2007 alone. What is not well understood is that even a job lost in apparel production can be a huge loss for a minority or immigrant worker. Such jobs are more likely to be union-ized and to have benefi ts than alternative jobs outside of manufacturing. A job paying $9 or $10 per hour with benefi ts, and providing industrial experience, can be a life-line and provide a ladder out of poverty for such workers. When this worker loses his or her job and the alternative is a near-minimum wage, non-union job, an important pathway out of poverty is washed away.18 Th e “other” workers shown in Tables 8 and 9 are large-ly Asians. Th ey outperformed all other groups of workers in terms of education and wages, as shown in Table 9.
However, they also lost a relatively large number of jobs (219,235 or 9.6% of all jobs lost), a share 53% greater than their share in the total labor force. Th ese fi ndings likely refl ect the confl uence of two factors: the very high share of Asian and other minorities with more than a col-lege degree (42.1% of “other” workers, much higher than any other demographic group, as shown in Table 9) and the very large number of jobs lost in the high-tech com-puter and electronic products sector. Asian Americans and other minorities have been especially hard hit by growing China trade defi cits.
ConclusionTh e growing U.S. trade defi cit with China has displaced huge numbers of jobs in the United States and has been a prime contributor to the crisis in manufacturing employ-ment over the past six years. Moreover, the United States is piling up foreign debt, losing export capacity, and fac-ing a more fragile macroeconomic environment. Is America’s loss China’s gain? Th e answer is most cer-tainly no. China has become dependent on the U.S. con-sumer market for employment generation, has suppressed the purchasing power of its own middle class with a weak currency, and, most importantly, has held hundreds of bil-lions of hard currency reserves in low-yielding, risky as-sets instead of investing them in public goods that could benefi t Chinese households. Its vast purchases of foreign exchange reserves have stimulated the overheating of its domestic economy, and infl ation in China has accelerated rapidly in the past year. Its repression of labor rights has suppressed wages, thereby artifi cially subsidizing exports. Th e U.S-China trade relationship needs a fundamen-tal change. Addressing the exchange rate policies and la-bor standards issues in the Chinese economy are impor-tant fi rst steps.
Th e author thanks Lauren Marra and Emily Garr for re-search assistance and Josh Bivens for comments.
Th is research was made possible by support from the Alliance for American Manufacturing.
E P I B R I E F I N G PA P E R #219 ● J U LY 28, 2008 ● PAG E 22
Endnotes
Th e $19.4 billion includes losses experienced by workers 1. displaced by growing imports and net losses experienced by the movement of jobs from import-competing sectors to industries producing exports to China (see Table 6B).
Th ese purchases fi nanced more than one-half of the U.S. 2. $731 billion current account defi cit (the broadest measure of all U.S. trade and income fl ows) in 2007. But for these purchases, the reduced demand would have put signifi cant downward pressure on the U.S. dollar. A substantial depre-ciation in the dollar would begin to improve the U.S. trade defi cit within a few years.
Th e offi cial name of the Chinese currency is the renminbi 3. (RMB). Th e RMB is convertible for current account trans-actions but not for capital account fl ows. “Unlike the United States and many other countries, China uses a dif-ferent word—yuan—for the unit in which product prices, exchange rates, and other such values are denominated from the word used for its currency” (Congressional Bud-get Offi ce 2008, note 3). Hereinafter the word yuan will be used when referring to the Chinese exchange rate.
Th e trade balance usually responds to a fall in the dollar 4. with a substantial lag of at least one to two years, due to “J-curve” eff ects. Th e major initial impact of a deprecia-tion is usually to raise the price and total value of imports, and hence the trade defi cit. In the medium- and long-term, the trade fl ows usually respond to the increase in the rela-tive competitiveness of domestic products as the rate of growth of imports slows or imports decrease, and the rate of growth of exports accelerates, ultimately leading to an improvement in the trade balance for large currency adjust-ments. Most of the dollar adjustment against major curren-cies occurred between February 2002 and December 2004. For example, the dollar fell 36.4% against the euro in this period, and then fell only 4.0% between December 2004 and December 2007.
NewsHour With Jim Lehrer5. transcript. 1999. “Online NewsHour: Opening Trade - November 15, 1999.”<http://www.pbs.org/newshour/bb/asia/july-dec99/wto_11-15.html >
Output (gross domestic product or GDP) is the sum of 6. consumption, investment, government spending, and the trade balance. Th e trade balance is the sum of exports less imports. A declining trade balance lowers GDP. Th e growth of the U.S. trade defi cit with China has therefore reduced U.S. GDP and the demand for labor. Holding all other sources of demand constant, growing trade defi cits therefore reduce the demand for labor in the U.S.
See Scott (2006) for further details on the model and Rat-7. ner (2006) for a technical presentation and details on data
sources used. Th is model has been completely updated for this study using new employment requirements tables for 2001 and related economic data from the Bureau of Labor Statistics (2008). Trade data collected by the U.S. Census Bureau was downloaded from the U.S. International Trade Commission (2008).
For the purposes of this report it is necessary to distinguish 8. between exports produced domestically and re-exports—which are goods produced in other countries, imported into the United States, and then re-exported to other countries, in this case to China. Since re-exports are not produced domestically, their production does not support domestic employment and they are excluded from the model used here. See Table 1 for information about the levels of U.S. re-exports to China in this period.
Table 3 reports U.S. imports for consumption and domes-9. tic exports to China. Th ese fl ows were chosen to emphasize goods produced and consumed in the United States. News reports from the Census Bureau and Commerce Depart-ment usually emphasize general imports and total exports. Total exports as reported by the Census Bureau include re-exports, i.e., goods produced in other countries and shipped through the United States. For 2007, the Census Bureau reported general imports from China of $321.4 bil-lion, total exports of $65.2 billion, and a trade balance of -$256.2 billion.
Further details on the matching system used are available 10. on request. Identical matches were not available for some BLS industries, in part because the CPS survey aggregates a number of closely related four-digit NAICS sectors that are included separately in the BLS model. For example, motor vehicle assembly (NAICS 3361and BLS sector 88), motor vehicle body and trailer manufacturing (NAICS 3362 and BLS 89), and motor vehicle parts (NAICS 3363 and BLS 90) were all combined in the CPS survey. Th ese pooled demographic data were used to approximate demographic characteristics for each of these NAICS/BLS industries.
Estimates refl ect weighting by the total number of jobs dis-11. placed in each sector.
Note that for manufacturing only, average export wages 12. marginally exceed import wages. Th e overall result is large-ly a consequence of the very low level of average wages in the agricultural sector and the large share of agricultural products in U.S. exports to China.
Th e demographic data used for this analysis are derived 13. from the CPS ORG fi les (U.S. Census Bureau 2008) and are a sample representing 126 million full-time workers age 16 and above. Th e demographic characteristics of this group are shown in Tables 7 and 9. Total U.S. employ-ment includes workers such as those under age 16 and the
E P I B R I E F I N G PA P E R #219 ● J U LY 28, 2008 ● PAG E 23
self-employed. Total U.S. employment in 2006 was 148.8 million. Th e demographic characteristics in the CPS ORG data do not accurately refl ect the demographic charac-teristics of this larger group. Th us, for example, applying the education shares for each of the 201 industries in the model used here to total BLS employment for each of the 201 industries in the model yields smaller college-educated shares and larger shares for groups with less education than those shown for the total population in Table 7 (column 1). Reconciliation of these confl icting datasets is an impor-tant topic for future research.
Th e source for these data is the CPS ORG (U.S. Census 14. Bureau 2008). Sample includes all computer and math-ematical, architecture and engineering, and life, physical, and social science occupations (occupational classifi cations 15, 17 and 21).
Th e overall U.S. goods trade defi cit increased from $429.5 15. billion in 2001 to $819.4 billion in 2007 (U.S. Interna-tional Trade Commission 2008).
Th e NAFTA study was based on demographic data for 16. the year 2000. Table 8 in this paper is based on data for workers in a pooled sample for 2005-07, and that group includes a slightly higher overall share of college-educated workers (29.8% vs. 27.5% in the NAFTA study).
Th ese totals include all employees in computer and math-17. ematical; architecture and engineering; and life, physical, and social science occupations.
Workers in nondurable manufacturing industries were 18. more than twice as likely as workers in retail trade to be represented by a union in 2004 (13.2% vs. 6.1%). Only 1.6% of workers in food services and drinking places were represented by unions (U.S. Department of Labor 2006, Table 3).
E P I B R I E F I N G PA P E R #219 ● J U LY 28, 2008 ● PAG E 24
AFL-CIO, U.S. Representative Benjamin L. Cardin, and U.S. Representative Christopher H. Smith (AFL-CIO et al). 2006. “Section 301 Petition [on China’s repression of workers’ rights].” June 8.
Bivens, L. Josh. 2008a. Everybody Wins, Except for Most of Us: What Economics Teaches (But Economists Generally Don’t) About Globalization. Washington, D.C.: Economic Policy Institute. Forthcoming.
Bivens, L. Josh. 2008b. Trade, Jobs, and Wages: Are the Public’s Worries about Globalization Justifi ed? Issue Brief No. 244. Wash-ington, D.C.: Economic Policy Institute. http://www.epinet.org.
Bureau of Labor Statistics, Offi ce of Employment Projections. 2008a. Special Purpose Files— Industry Output and Employment. Washington, D.C.: U.S. Department of Labor. http://www.bls.gov/emp/empind2.htm.
Bureau of Labor Statistics, Offi ce of Employment Projections. 2008b. Special Purpose Files— Employment Requirements. Wash-ington, D.C.: U.S. Department of Labor. http://stats.bls.gov/emp/empind4.htm.
Bureau of Labor Statistics. 2005. Access to historical data for the “B” tables of the Employment Situation News Release. http://stats.bls.gov/ces/cesbtabs.htm.
Cline, William R., and John Williamson. 2008. New Esti-mates of Fundemntal Equilibrium Exchange Rates. Policy Brief #PB08-7. Washington, D.C.: Peterson Institute for Interna-tional Economics.
Clinton, Bill. 2000. Expanding trade, protecting values: why I’ll fi ght to make China’s trade status permanent. New Demo-crat, Vol. 12, No. 1, pp. 9-11.
Congressional Budget Offi ce. 2008. “How changes in the val-ue of the Chinese currency aff ect U.S. imports.” Washington, D.C.: Congress of the United States, Congressional Budget Offi ce.
Haley, Usha C. V. 2008. Shedding light on energy subsidies in China: An analysis of China’s steel industry from 2000-2007. Washington, D.C.: Alliance for American Manufacturing.
Faux, Jeff . 2007. Globalization that Works for Working Americans. Issue Brief. Washington, D.C.: Economic Policy Institute.
Faux, Jeff , Bruce Campbell, Carlos Salas, and Robert Scott. 2006. Revisiting NAFTA: Still not Working for North America’s Workers. Briefi ng Paper. Washington, D.C.: Economic Policy Institute.
Kletzer, Lori G. 2001. Job Loss From Imports: Measuring the Costs. Washington, D.C.: Institute for International Econom-ics.
Ratner, David. 2006. “Appendix: methodology and data sourc-es.” In Faux et al. 2006.
Rothstein, Jesse, and Robert E. Scott. 1997a. NAFTA’s Casual-ties: Employment Eff ects on Men, Women, and Minorities. Issue Brief. Washington, D.C.: Economic Policy Institute. http://www.epinet.org.
Rothstein, Jesse, and Robert E. Scott. 1997b. NAFTA and the States: job Destruction is Widespread. Issue Brief. Washington, D.C.: Economic Policy Institute. http://www.epinet.org.
Scott, Robert E. 2005. U.S.-China Trade, 1989-2003: Impact on Jobs and Industries, Nationally and State-by-State. Working Paper No. 270. Washington, D.C.: Economic Policy Institute.
Scott, Robert E. 2006. “NAFTA’s Legacy: Rising Trade Defi cits Lead to Signifi cant Job Displacement and Declining Job Qual-ity for the United States.” In Faux et al. 2006.
Scott, Robert E. 2008. Increase in Oil Prices, Fall in Investment Income Exacerbates Current Account Defi cit Woes. Washington, D.C.: Economic Policy Institute. http://www.epinet.org.
U.S. Bureau of Labor Statistics. 2008. Union Members in 2005. Washington, D.C.: U.S. Department of Labor. News Release USDL 06-99. January 20.
U.S. Bureau of Labor Statistics. 2008b. “Productivity Growth by Major Sector, 1947-2007.” Bar Chart. Washington, D.C.: USDL.
U.S. Census Bureau. 2008. “Basic Monthly Survey of the Cur-rent Population Survey (data for 2005-07).” Washington, D.C: U.S. Department of Commerce.
U.S. International Trade Commission. 2008. USITC Interac-tive Tariff and Trade DataWeb. http://dataweb.usitc.gov/scripts/user_set.asp
References

ECONOMIC POLICY INSTITUTE • 1333 H STREET, NW • SUITE 300, EAST TOWER • WASHINGTON, DC 20005 • 202.775.8810 • WWW.EPI.ORG