Embed Size (px)
Citation preview
Republic of Sudan National Ministry of Health Expanded Programme on Immunization
Sudan EPI
comprehensive
Multi- Year
Plan
2012 - 2016
Table of Contents
Comprehensive Multi-Year National Immunization Plan 2012-2016
pg. 1 / 65
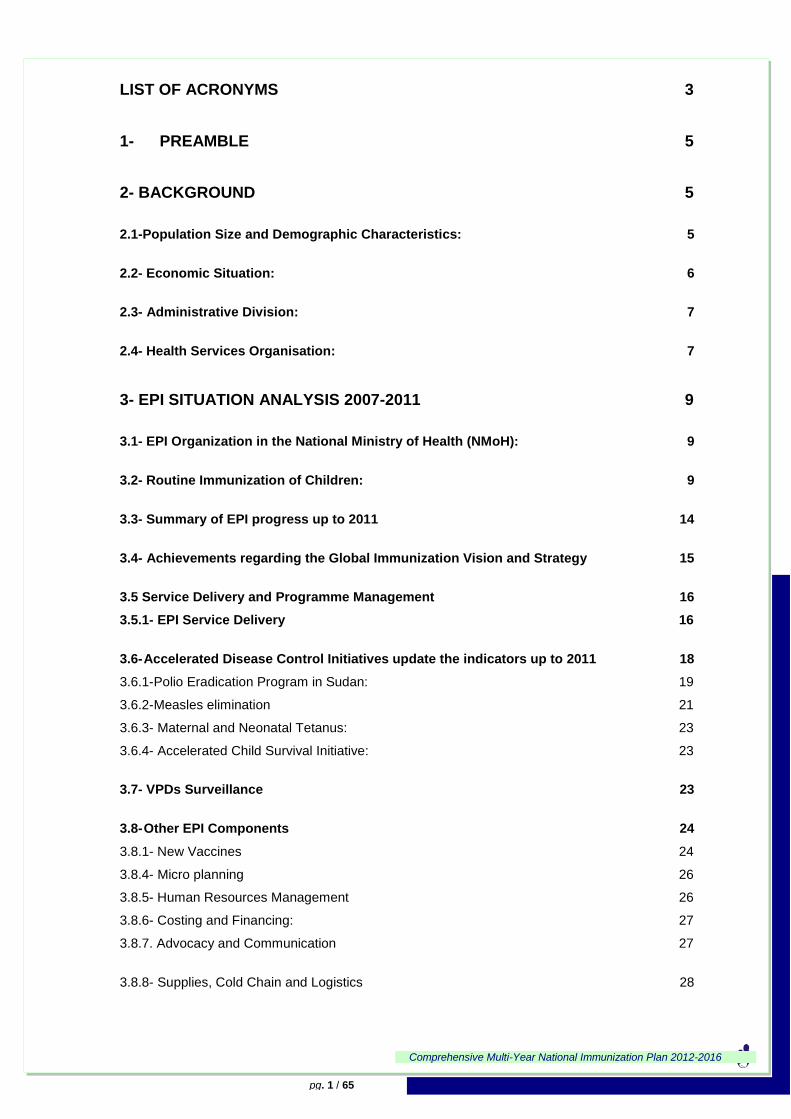
LIST OF ACRONYMS 3
1- PREAMBLE 5
2- BACKGROUND 5
2.1-Population Size and Demographic Characteristics: 5
2.2- Economic Situation: 6
2.3- Administrative Division: 7
2.4- Health Services Organisation: 7
3- EPI SITUATION ANALYSIS 2007-2011 9
3.1- EPI Organization in the National Ministry of Health (NMoH): 9
3.2- Routine Immunization of Children: 9
3.3- Summary of EPI progress up to 2011 14
3.4- Achievements regarding the Global Immunization Vision and Strategy 15
3.5 Service Delivery and Programme Management 16
3.5.1- EPI Service Delivery 16
3.6- Accelerated Disease Control Initiatives update the indicators up to 2011 18
3.6.1-Polio Eradication Program in Sudan: 19
3.6.2-Measles elimination 21
3.6.3- Maternal and Neonatal Tetanus: 23
3.6.4- Accelerated Child Survival Initiative: 23
3.7- VPDs Surveillance 23
3.8- Other EPI Components 24
3.8.1- New Vaccines 24
3.8.4- Micro planning 26
3.8.5- Human Resources Management 26
3.8.6- Costing and Financing: 27
3.8.7. Advocacy and Communication 27
3.8.8- Supplies, Cold Chain and Logistics 28
Comprehensive Multi-Year National Immunization Plan 2012-2016
pg. 2 / 65
3.9-SWOT analysis of EPI programme 29
3.9.1- EPI System components 29
3.9.2 Disease elimination/eradication Initiatives (Polio, Measles, and MNT) 31
3.9.3-Problems/Remaining challenges: 31
3.9.4-Future challenges: 31
4- THE COMPREHENSIVE MULTI-YEAR NATIONAL IMMUNIZATION PLAN
2012-2016 32
4.1-Vision statement: 32
4.2-Mission: 32
4.3 - Programme objectives and mile stones 32
4.4- Programme strategies and key activities 2011-2015. 37
4.5 Cost and Financial Analysis of cMYP 2012-2016 43
4.5.1- Notes/ assumptions relating to costing calculations 43
4.5.2-Base line year 2011 43
4.5.3- Future resource requirements, financing and gap analysis 2012-2016 46
4.5.4-Sustainability analysis 53
4.5.5-Strategies towards Sustainability 54
4.6- Monitoring and Evaluation of the Plan 57
ANNEXES 58
Comprehensive Multi-Year National Immunization Plan 2012-2016
pg. 3 / 65
LIST OF ACRONYMS
ACSD Accelerated Child Survival and Development
ACSI Accelerated Child Survival Initiative
AD Auto –destruct
AEFI Adverse Events Following Immunization
AFP Acute Flaccid Paralysis
ANC Antenatal care
BCG Bacille Calmette and Guirene
BMS Bacterial Meningitis Surveillance
C4D Communication for Development
CAH Child and Adolecent Health
CCEM Cold Chain Equipment Management
CDC Communicable Diseases Control
CHPs Community Health Promoters
CHWs Community Health workers
cMYP Comprehensive multi-year plan
CPA Comprehensive Peace Agreement
CRS Congenital Rubella Syndrome
DG Director General
DQA Data Qualtiy Audit
DQS Data Quality Self assessment
DTP Diphtheria Tetanus Pertussis vaccine
EH Environmental Health
EMR East Mediterranean Region
EPI Expanded Programme on Immunization
EVSMI Effective Vaccine Store Management Initiative
GAVI Global Alliance for Vaccines and Immunization
GDP Gross Domedtic Product
GHE Government Health Expenditure
GIVS Global Immunization Vision and Strategies
GoS Government of Sudan
Hep B Hepatitis B Vaccine
Hib Haemophilus Influenzae type B
HRL High Risk Localities (Districts)
HSS Health System Strengthening
IACC Inter-Agency Coordinating Committee
IEC Information Education Communication
IPV Injectable Polio Vaccine
ISS Immunization Services Support
ITD Intra-typic differentiation
KAP Knowledge, Attitude and Practice
LB Live Births
MCH Mother and Child Health
MCV Measles Containing Vaccine
MDGs Mellinnium Development Goals
MDVP Multi-Dose Vial Policy
MLM Mid Level Management
MNT Maternat and Neonatal Tetanus
mOPV monovalent Oral Polio Vaccine
MOU Memoranda Of Understanding
NGOs Non-governmental Organizations
NIDs National Immunization Days
Comprehensive Multi-Year National Immunization Plan 2012-2016
pg. 4 / 65
NITAG National Immunization Technical Advisory Group
NMoF National Ministry of Finance
NMoH National Ministry of Health
NNT Neonatal Tetanus
NRA National Regulatory Authority
NUVS New and Underused Vaccine Support
OPV Oral Polio Vaccine
PAB Protection At Birth
PCV10 Pneumococcal vaccine 10 serotypes
Penta Pentavalent vaccine (DTP-Hep B-Hib)
PHC Primary Health Care
QSI Quality of the System Index
RED Reaching Every District
RH Reproductive Health
SAGE Strategic Advisory Group of Experts
SHHS Sudan Household Health Survey
SIAs Supplementary Immunization Activities
SMoH State Ministry of Health
SNID Sub-National Immunization Day
SOO State operations Officer
SOPs Standard Operating Procedures
SWOT Strengths Weaknesses Opportunities Threats
THE Total Health Expenditure
TT Tetanus Toxoid vaccine
UNICEF United Nations children‟s Fund
VF Verification Factor
VMW Village Midwife
VPDs Vaccine Preventable Diseases
WCBA Women of Child Bearing Age
WHO World Health Organization
WPV Wild polio virus
YF Yellow Fever
Comprehensive Multi-Year National Immunization Plan 2012-2016
pg. 5 / 65
1- PREAMBLE
This is an updated version of the comprehensive multi-year plan (cMYP) for the Expanded
Programme on Immunization (EPI) for the period 2012-2016. It had been developed in an inclusive
process where senior EPI at central and states, planning directorate staff, partners such as WHO and
UNICEF were fully involved.
Although the previous cMYP covered the year 2010, the programme requires a plan that is valid for a
longer period of time to facilitate the application to GAVI New and under used vaccines window of
Support (NUVS) for the introduction of new vaccines (pneumococcal, Mening A conjucate vaccines,
Yellow Fever, etc) into the EPI program and for Health System Strengthening (HSS) support.
The cMYP was formulated following a detailed situation analysis of the national immunization
programme, the political and economic context and all were guided by the national immunization
policy, the 5year National Health strategic (2012-2016) plan, and 25 strategic plan of the National
Ministry of Health. It was also developed in line with the Global Immunization Vision and Strategies
(GIVS) taking into consideration the remaining and new challenges.
2- BACKGROUND
Sudan is characterized by a strategic geographical location, that links the Arab world to Sub Saharan
Africa, and it shares its borders with 8 countries, where the Sudanese population and those of the
neighbouring countries move freely across these borders. The northern part of the country is an
extension of the Sahara Desert, the central part is a dry savannah area and the southern part has a
typical tropical rainforest climate. Climatic factors can contribute to humanitarian emergencies related
to drought and flooding, and ecological factors expose much of the population to major infectious and
parasitic diseases. Difficult access to some areas, rural-urban migration, natural disasters, the
longstanding civil war and limited resources had a significant impact on the provision of immunization
services. As a consequence there are wide variations within the country in delivery of services,
vaccination coverage and disease incidence.
By closing the recent refrendum in January 2011, Southern Sudan has split as a searate country. The
Rebublic of Sudan remains with 15 states.
Reconstruction and development are needed as well as humanitarian assisstance in the health and
nutrition sectors, particularily in newly accessible and war affected areas. Poor coordination and weak
local capacity are seen as the main challenges facing the health sector development in the post
conflict setting
2.1-Population Size and Demographic Characteristics:
In 2008, a population census was conducted and the total resident population was reported to be
30.9 million. The rural population represents about 65%, while nomads represent 10%. 43% of the
population are less than 15 years of age. The population is unevenly distributed in the15 States, the
majority are concentrated in 6 States of the Central Region with a mean population density of 10
people per square kilometres, increasing to 50 in the agricultural areas. Natural disasters and conflict
resulted in high rates of rural-urban migration.
The infant mortality rate according to Sudan Household Health Survey (SHHS) in 2010 was 57 per
thousand live births. The cohort of surviving infants in 2008 is estimated to consist of 1.12 million
children. An estimated 5.2 million children are under 5 years of age. According to the 2011 health
statistical report the main causes of death among children under five were Septicaemia (14%),
malnutrition (10%), other diseases of respirotry system (6%) Nenatal tetuns (5%) Diarrhoea &
gastroentritis (5%)
Comprehensive Multi-Year National Immunization Plan 2012-2016
pg. 6 / 65
2.2- Economic Situation:
Sudan is rich in natural resources, including oil, mineral, agriculture and animal resources. Its
economy, with the export of crude oil in 1999, boomed due to increases in oil production, high oil
prices, and significant inflows of foreign direct investment. Despite sanctions and additional safeguard
policies of the west, it was one of the world‟s fastest growing economies until the second half of 2008
scoring an average annual growth rate in the range of 5-7% till 20101. The gross domestic product
(GDP) grew from US$ 9.9 billion in 1980 to US$ 66 billion in 2010. The Oil Sector has been the
driving force behind growth while the services and utilities sector has come to play an increasingly
important role. Agriculture remained important in the economy as it employs 80% of the work force
and contributes one third of GDP.
The economic growth has however promoted mainly the urban and main cities, leading to the
increasing disparities between rural and urban areas as well as between States. Poverty remains
widespread with 46.5%1 of the population living below the poverty line according to the national
definition of poverty (3.8 SDG per person/a day). Those who are most affected by poverty are the
rural dwellers, particularly women and internally displaced people.
The Human Development Index of Sudan is low and scored (0.408) in 2011 ranking 169 out of 179
countries on human development index2 as compared to 0.403 and 0.406 in 2009 and 2010,
respectively.
Sudan reached an oil production level of about 520,000 barrels per day (83,000 m3/d) in 2011.
However, with the secession of the South from the mother country Sudan to form an independent
state of South Sudan in July 2011, 75% of the oil production was taken by the new nation. Since 2011
Sudan is producing 115,000 barrels per day. This has significant impact on the government revenues
as oil was contributing to about 30% of the national budget. Further, this will impact the near future
economic forecast and the fiscal space and the resources available for social services including
health. The best scenario shows that the annual economic growth will decrease from 5-6% annual
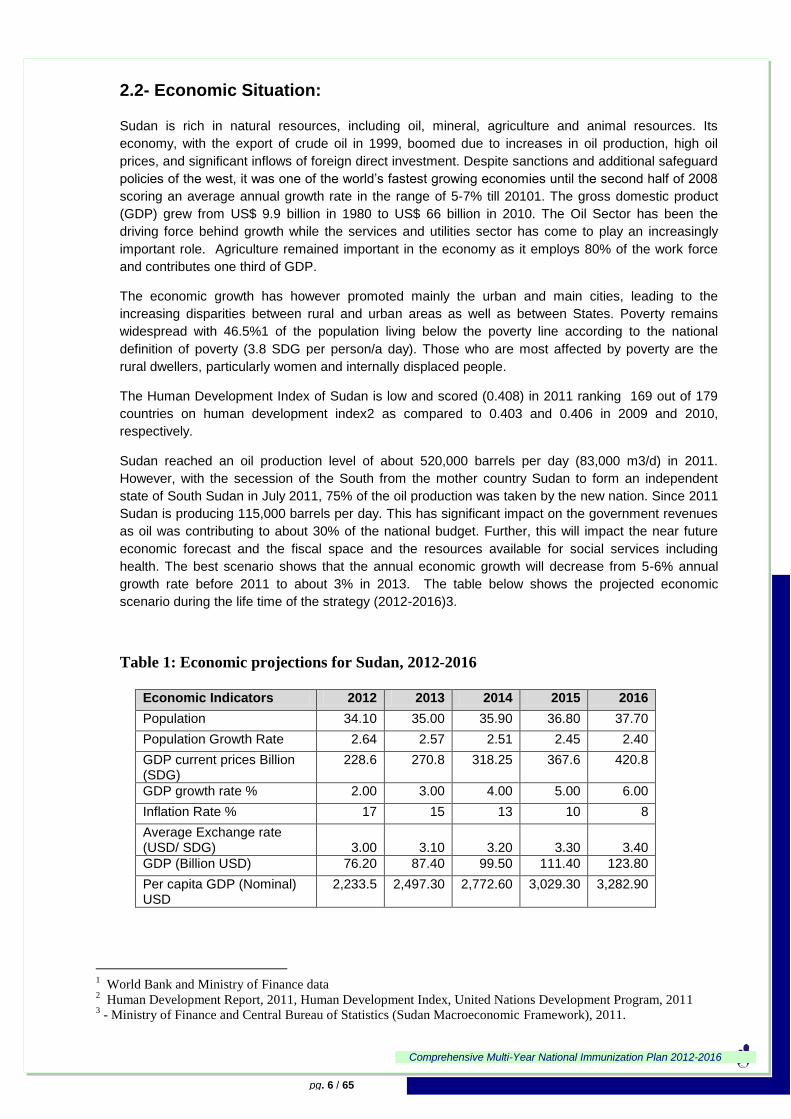
growth rate before 2011 to about 3% in 2013. The table below shows the projected economic
scenario during the life time of the strategy (2012-2016)3.
Table 1: Economic projections for Sudan, 2012-2016
Economic Indicators 2012 2013 2014 2015 2016
Population 34.10 35.00 35.90 36.80 37.70
Population Growth Rate 2.64 2.57 2.51 2.45 2.40
GDP current prices Billion (SDG)
228.6 270.8 318.25 367.6 420.8
GDP growth rate % 2.00 3.00 4.00 5.00 6.00
Inflation Rate % 17 15 13 10 8
Average Exchange rate (USD/ SDG) 3.00 3.10 3.20 3.30 3.40
GDP (Billion USD) 76.20 87.40 99.50 111.40 123.80
Per capita GDP (Nominal) USD
2,233.5 2,497.30 2,772.60 3,029.30 3,282.90
1 World Bank and Ministry of Finance data
2 Human Development Report, 2011, Human Development Index, United Nations Development Program, 2011
3 - Ministry of Finance and Central Bureau of Statistics (Sudan Macroeconomic Framework), 2011.
Comprehensive Multi-Year National Immunization Plan 2012-2016
pg. 7 / 65
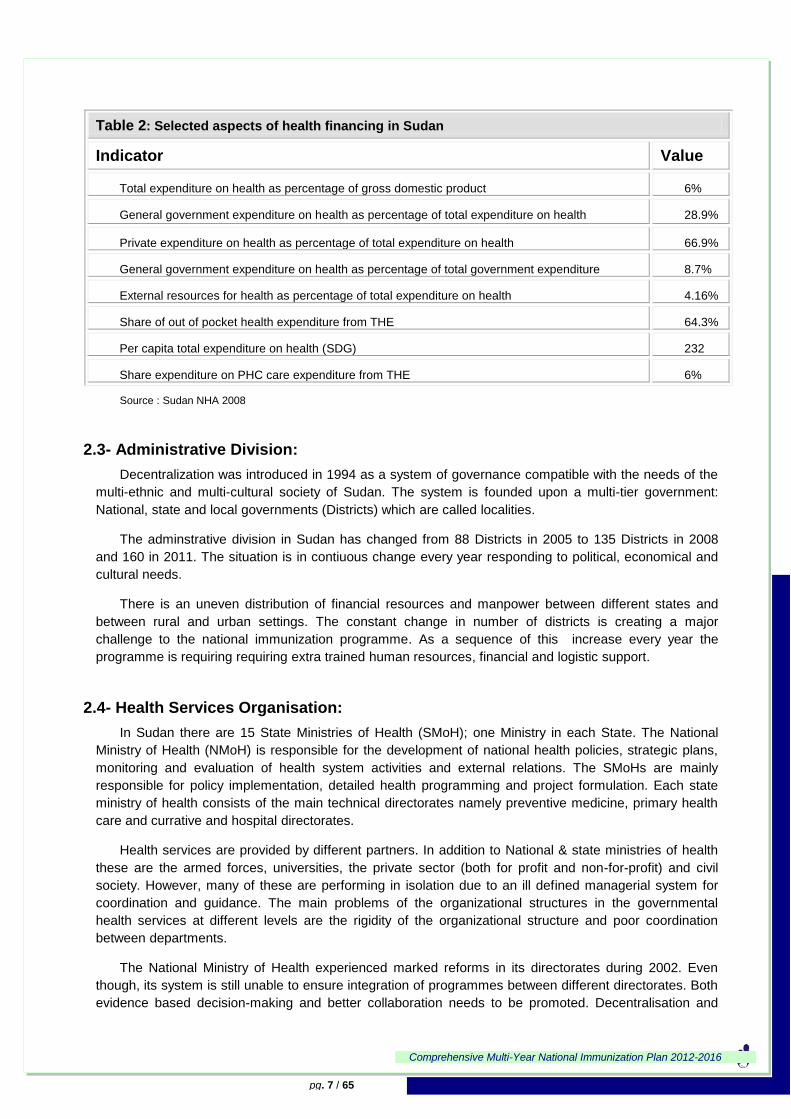
Table 2: Selected aspects of health financing in Sudan
Indicator Value
Total expenditure on health as percentage of gross domestic product 6%
General government expenditure on health as percentage of total expenditure on health 28.9%
Private expenditure on health as percentage of total expenditure on health 66.9%
General government expenditure on health as percentage of total government expenditure 8.7%
External resources for health as percentage of total expenditure on health 4.16%
Share of out of pocket health expenditure from THE 64.3%
Per capita total expenditure on health (SDG) 232
Share expenditure on PHC care expenditure from THE 6%
Source : Sudan NHA 2008
2.3- Administrative Division:
Decentralization was introduced in 1994 as a system of governance compatible with the needs of the
multi-ethnic and multi-cultural society of Sudan. The system is founded upon a multi-tier government:
National, state and local governments (Districts) which are called localities.
The adminstrative division in Sudan has changed from 88 Districts in 2005 to 135 Districts in 2008
and 160 in 2011. The situation is in contiuous change every year responding to political, economical and
cultural needs.
There is an uneven distribution of financial resources and manpower between different states and
between rural and urban settings. The constant change in number of districts is creating a major
challenge to the national immunization programme. As a sequence of this increase every year the
programme is requiring requiring extra trained human resources, financial and logistic support.
2.4- Health Services Organisation:
In Sudan there are 15 State Ministries of Health (SMoH); one Ministry in each State. The National
Ministry of Health (NMoH) is responsible for the development of national health policies, strategic plans,
monitoring and evaluation of health system activities and external relations. The SMoHs are mainly
responsible for policy implementation, detailed health programming and project formulation. Each state
ministry of health consists of the main technical directorates namely preventive medicine, primary health
care and currative and hospital directorates.
Health services are provided by different partners. In addition to National & state ministries of health
these are the armed forces, universities, the private sector (both for profit and non-for-profit) and civil
society. However, many of these are performing in isolation due to an ill defined managerial system for
coordination and guidance. The main problems of the organizational structures in the governmental
health services at different levels are the rigidity of the organizational structure and poor coordination
between departments.
The National Ministry of Health experienced marked reforms in its directorates during 2002. Even
though, its system is still unable to ensure integration of programmes between different directorates. Both
evidence based decision-making and better collaboration needs to be promoted. Decentralisation and
Comprehensive Multi-Year National Immunization Plan 2012-2016
pg. 8 / 65
bottom-up approaches have been promoted in the health sector: The execution and implementation of
promotional, preventive and curative activities have been shifted from the national to the state authorities.
The National Health Insurance Scheme, introduced in the mid 1990s, its coverage increases from
about 8% in 2002 to 29% of the population by end of 2008, mostly government employees, but also poor
families, families of martyrs and students. User fees for government health services were introduced in
the mid 1990s, including exemptions for vulnerable groups and for emergency services and casualties.
Government policies in recent years have encouraged the growth of the private sector. However, this
sector is concenrtated in urban and better off rural areas and invests mainly in clinics and hospitals.
The health system suffered severe loss of human resources and uneven distribution. Health facilities
are not equally distributed, and gaps need to be reduced in order to increase access in the under-served
areas and communities.
This cMYP plan is in line with the 25 strategic plan of National MoH which is explicit about the place
of immunization in improving health outcomes.This strategic plan, sets three explicit objectives for the
EPI, which high immunization coverage, achieve polio certification and maintain polio free status, and
eliminates measles.
Comprehensive Multi-Year National Immunization Plan 2012-2016
pg. 9 / 65
3- EPI SITUATION ANALYSIS 2007-2011
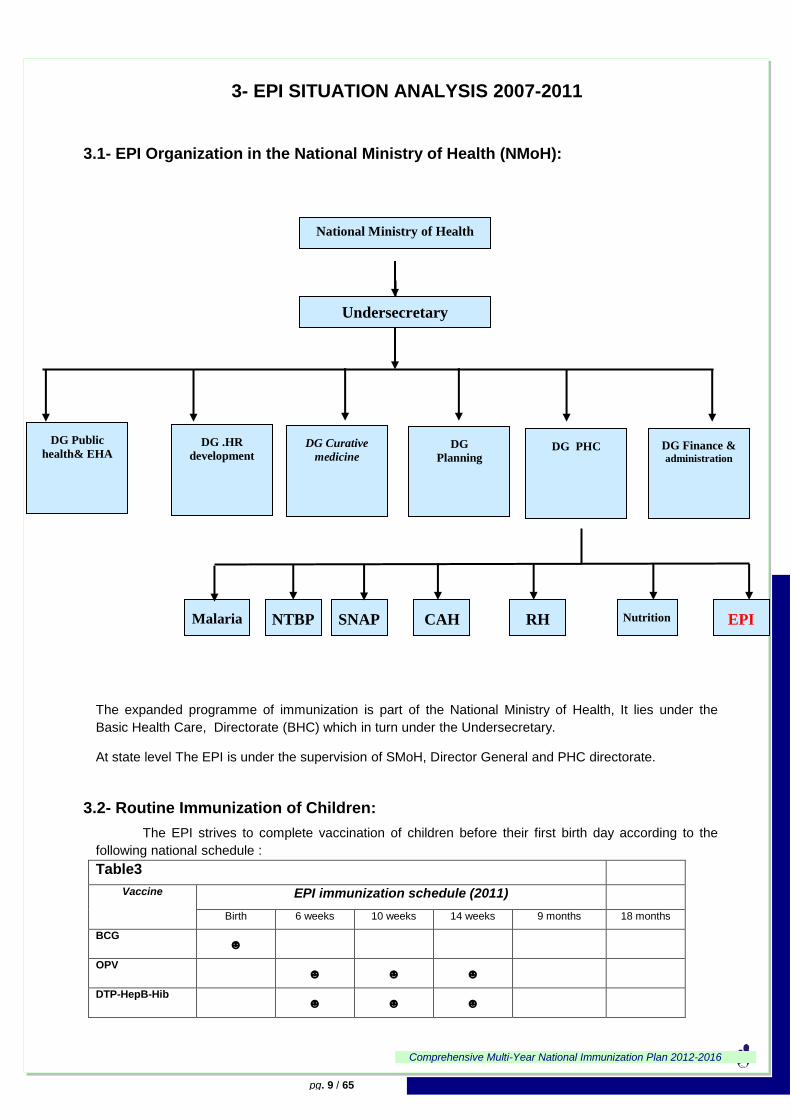
3.1- EPI Organization in the National Ministry of Health (NMoH):
The expanded programme of immunization is part of the National Ministry of Health, It lies under the
Basic Health Care, Directorate (BHC) which in turn under the Undersecretary.
At state level The EPI is under the supervision of SMoH, Director General and PHC directorate.
3.2- Routine Immunization of Children:
The EPI strives to complete vaccination of children before their first birth day according to the
following national schedule :
Table3
Vaccine EPI immunization schedule (2011)
Birth 6 weeks 10 weeks 14 weeks 9 months 18 months
BCG ☻
OPV ☻ ☻ ☻
DTP-HepB-Hib ☻ ☻ ☻
National Ministry of Health
Undersecretary
DG Finance & administration
DG PHC DG
Planning
DG Curative
medicine
DG .HR
development
DG Public
health& EHA
EPI Nutrition RH CAH SNAP NTBP Malaria
Comprehensive Multi-Year National Immunization Plan 2012-2016
pg. 10 / 65
HepB
Measles ☻
Rota virus ☻ ☻
PCV13 (planned 2012)
Mening A vaccine (planned 2013/2014)
Yellow Fever vaccine (planned 2014/2015)
Note: Symbol for new vaccines that will be added to the existing schedule after 2011. The
introduction of birth dose of HepatitisB and 2nd
dose of measles depend on the availability of vaccines.
Tetanus Vaccination for Pregnant Women
The EPI policy is to give tetanus vaccination to all pregnant women. In addition to routine vaccination
conducted in the health facilities, maternal and neonatal tetanus (MNT) campaigns are conducted in high
risk districts targeting all women of child-bearing age (15-45 years).
Table 4
Tetanus vaccination schedule (2010)
Dose Schedule Dose Schedule
TT1 At first contact TT4 After one year
TT2 After one month TT5 After one year
TT3 After six months
Based on the in-depth situation analysis, the updated cMYP (2012 – 2016) was established in
discussions and deliberations of senior EPI and planning staff together with full involvement of key
partners namely UNICEF and WHO. Priorities and major objectives were set with participation and
consultations of representatives of EPI staff at subnational levels as well. The plan takes the previous EPI
Five-Year Plan 2006-2010 forward, especially what was stated for the last year 2011. Remaining
problems from the previous plan are carried into the new one in addition to emerging new challenges
Annual work-plans with integrated and consolidated activities will be developed on the basis of this
cMYP for each of the years 2012 through 2016. The cMYP has to be regarded as “work in progress”
which needs to be revised on an annual basis in light of new developments in the field and/or possible
changes in financial contributions from both the Government of Sudan and international donors.
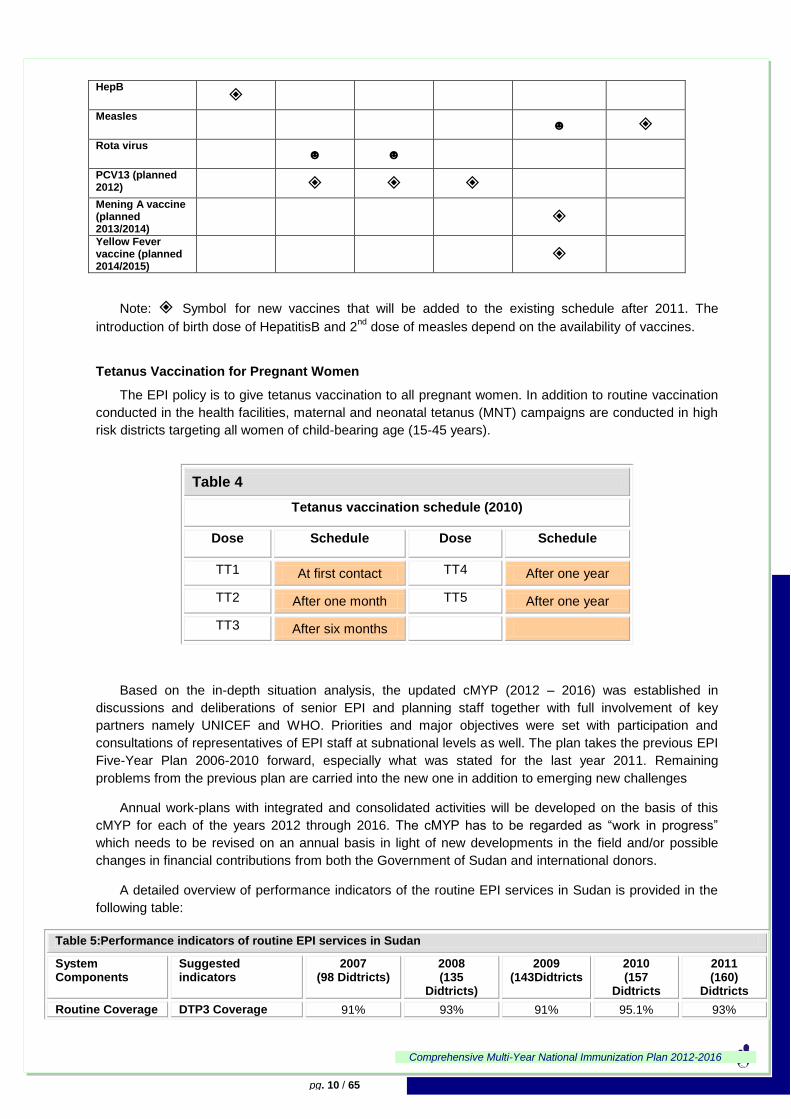
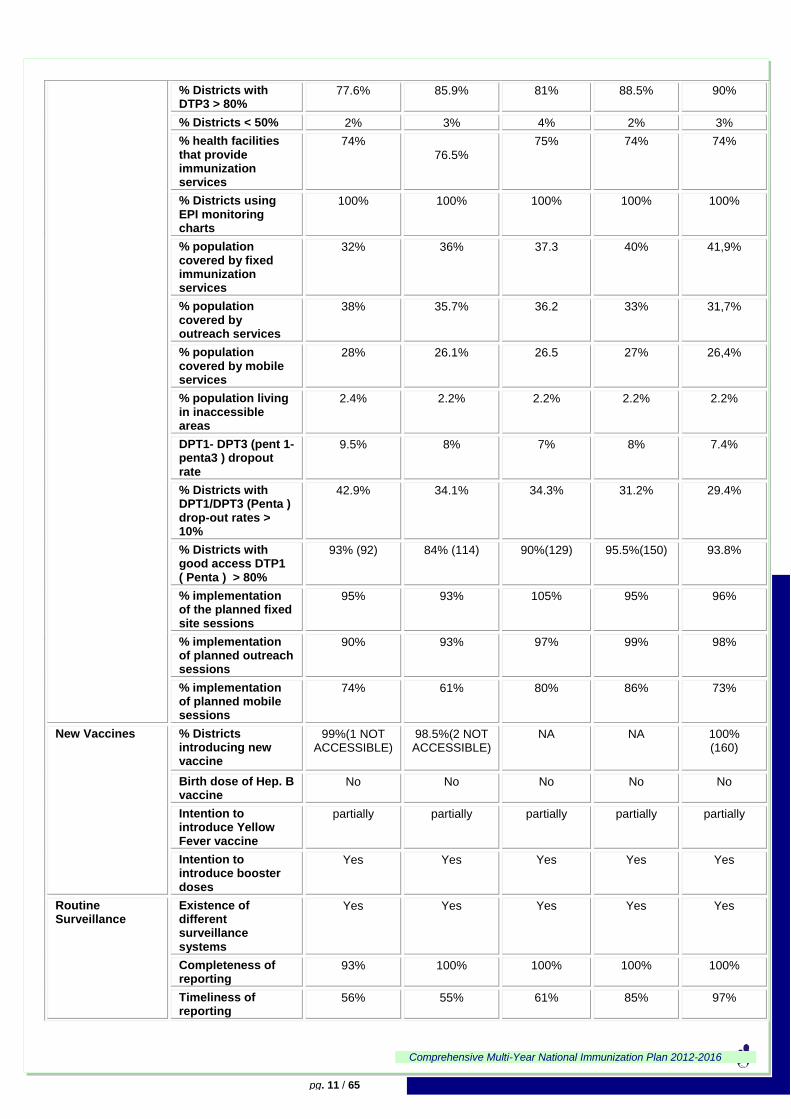
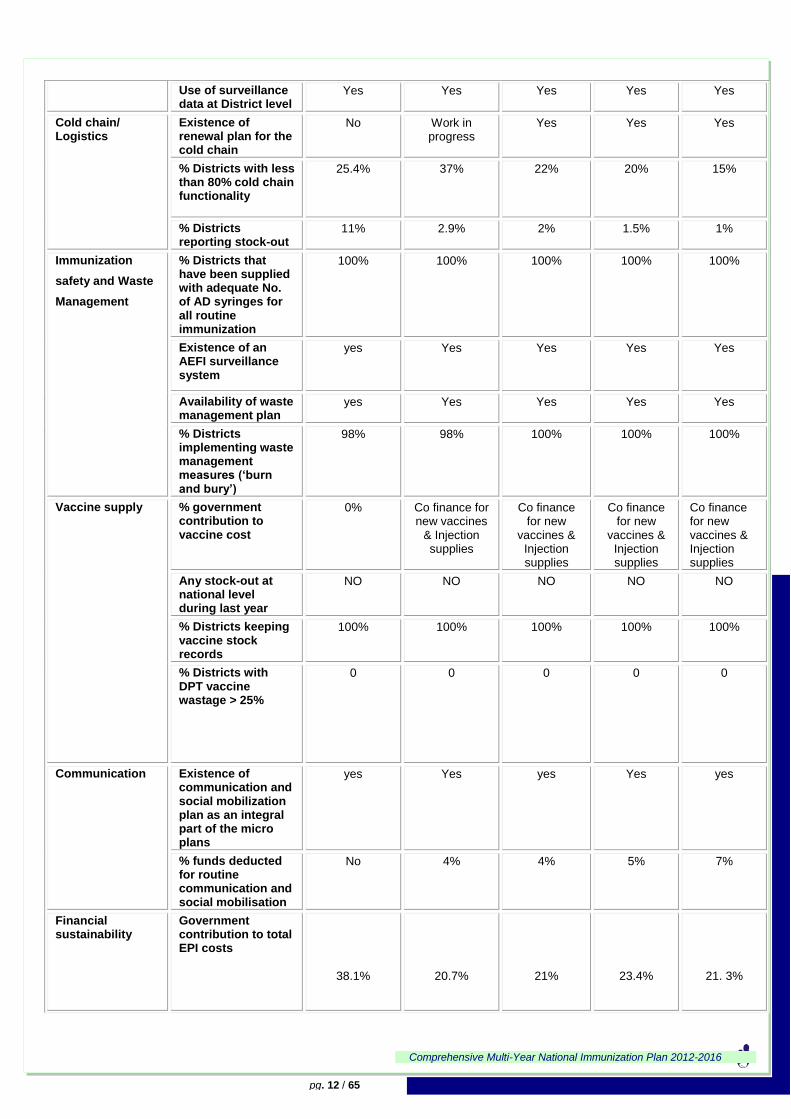
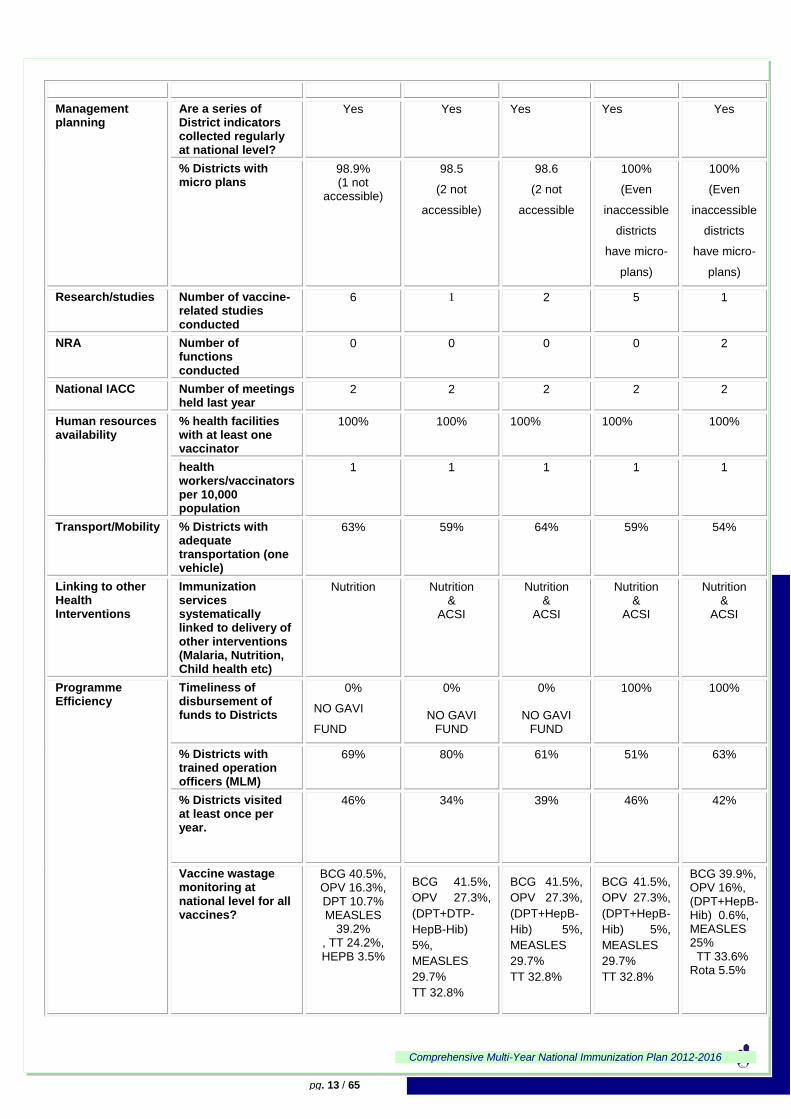
A detailed overview of performance indicators of the routine EPI services in Sudan is provided in the
following table:
Table 5:Performance indicators of routine EPI services in Sudan
System Components
Suggested indicators
2007 (98 Didtricts)
2008 (135
Didtricts)
2009 (143Didtricts
2010 (157
Didtricts
2011 (160)
Didtricts
Routine Coverage DTP3 Coverage 91% 93% 91% 95.1% 93%
Comprehensive Multi-Year National Immunization Plan 2012-2016
pg. 11 / 65
% Districts with DTP3 > 80%
77.6% 85.9% 81% 88.5% 90%
% Districts < 50% 2% 3% 4% 2% 3%
% health facilities that provide immunization services
74% 76.5%
75% 74% 74%
% Districts using EPI monitoring charts
100% 100% 100% 100% 100%
% population covered by fixed immunization services
32% 36% 37.3 40% 41,9%
% population covered by outreach services
38% 35.7% 36.2 33% 31,7%
% population covered by mobile services
28% 26.1% 26.5 27% 26,4%
% population living in inaccessible areas
2.4% 2.2% 2.2% 2.2% 2.2%
DPT1- DPT3 (pent 1-penta3 ) dropout rate
9.5% 8% 7% 8% 7.4%
% Districts with DPT1/DPT3 (Penta ) drop-out rates > 10%
42.9% 34.1% 34.3% 31.2% 29.4%
% Districts with good access DTP1 ( Penta ) > 80%
93% (92) 84% (114) 90%(129) 95.5%(150) 93.8%
% implementation of the planned fixed site sessions
95% 93% 105% 95% 96%
% implementation of planned outreach sessions
90% 93% 97% 99% 98%
% implementation of planned mobile sessions
74% 61% 80% 86% 73%
New Vaccines % Districts introducing new vaccine
99%(1 NOT ACCESSIBLE)
98.5%(2 NOT ACCESSIBLE)
NA NA 100% (160)
Birth dose of Hep. B vaccine
No No No No No
Intention to introduce Yellow Fever vaccine
partially partially partially partially partially
Intention to introduce booster doses
Yes Yes Yes Yes Yes
Routine Surveillance
Existence of different surveillance systems
Yes Yes Yes Yes Yes
Completeness of reporting
93% 100% 100% 100% 100%
Timeliness of reporting
56% 55% 61% 85% 97%
Comprehensive Multi-Year National Immunization Plan 2012-2016
pg. 12 / 65
Use of surveillance data at District level
Yes Yes Yes Yes Yes
Cold chain/ Logistics
Existence of renewal plan for the cold chain
No Work in progress
Yes Yes Yes
% Districts with less than 80% cold chain functionality
25.4% 37% 22% 20% 15%
% Districts reporting stock-out
11% 2.9% 2% 1.5% 1%
Immunization
safety and Waste
Management
% Districts that have been supplied with adequate No. of AD syringes for all routine immunization
100% 100% 100% 100% 100%
Existence of an AEFI surveillance system
yes Yes Yes Yes Yes
Availability of waste management plan
yes Yes Yes Yes Yes
% Districts implementing waste management measures (‘burn and bury’)
98% 98% 100% 100% 100%
Vaccine supply % government contribution to vaccine cost
0% Co finance for new vaccines
& Injection supplies
Co finance for new
vaccines & Injection supplies
Co finance for new
vaccines & Injection supplies
Co finance for new vaccines & Injection supplies
Any stock-out at national level during last year
NO NO NO NO NO
% Districts keeping vaccine stock records
100% 100% 100% 100% 100%
% Districts with DPT vaccine wastage > 25%
0 0 0 0 0
Communication Existence of communication and social mobilization plan as an integral part of the micro plans
yes Yes yes Yes yes
% funds deducted for routine communication and social mobilisation
No 4% 4% 5% 7%
Financial sustainability
Government contribution to total EPI costs
38.1%
20.7%
21%
23.4%
21. 3%
Comprehensive Multi-Year National Immunization Plan 2012-2016
pg. 13 / 65
Management planning
Are a series of District indicators collected regularly at national level?
Yes Yes Yes Yes Yes
% Districts with micro plans
98.9% (1 not
accessible)
98.5
(2 not
accessible)
98.6
(2 not
accessible
100%
(Even
inaccessible
districts
have micro-
plans)
100%
(Even
inaccessible
districts
have micro-
plans)
Research/studies Number of vaccine-related studies conducted
6 1 2 5 1
NRA Number of functions conducted
0 0 0 0 2
National IACC Number of meetings held last year
2 2 2 2 2
Human resources availability
% health facilities with at least one vaccinator
100% 100% 100% 100% 100%
health workers/vaccinators per 10,000 population
1 1 1 1 1
Transport/Mobility % Districts with adequate transportation (one vehicle)
63% 59% 64% 59% 54%
Linking to other Health Interventions
Immunization services systematically linked to delivery of other interventions (Malaria, Nutrition, Child health etc)
Nutrition Nutrition &
ACSI
Nutrition &
ACSI
Nutrition &
ACSI
Nutrition &
ACSI
Programme Efficiency
Timeliness of disbursement of funds to Districts
0%
NO GAVI
FUND
0%
NO GAVI FUND
0%
NO GAVI FUND
100% 100%
% Districts with trained operation officers (MLM)
69% 80% 61% 51% 63%
% Districts visited at least once per year.
46% 34% 39% 46% 42%
Vaccine wastage monitoring at national level for all vaccines?
BCG 40.5%, OPV 16.3%, DPT 10.7% MEASLES
39.2% , TT 24.2%, HEPB 3.5%
BCG 41.5%,
OPV 27.3%,
(DPT+DTP-
HepB-Hib)
5%,
MEASLES
29.7%
TT 32.8%
BCG 41.5%,
OPV 27.3%,
(DPT+HepB-
Hib) 5%,
MEASLES
29.7%
TT 32.8%
BCG 41.5%,
OPV 27.3%,
(DPT+HepB-
Hib) 5%,
MEASLES
29.7%
TT 32.8%
BCG 39.9%, OPV 16%, (DPT+HepB-Hib) 0.6%, MEASLES 25% TT 33.6% Rota 5.5%
Comprehensive Multi-Year National Immunization Plan 2012-2016
pg. 14 / 65
% system wastage 0.01% 1.3% 0 0 1.5
% Districts with Quality System Index > 80%
53% 41% 57% 57% 48%
% Districts with a Verification Factor < 0.8
100% 93% 100% 96% 99%
* Hep B in 2006 then DTP-HepB-Hib in 2008
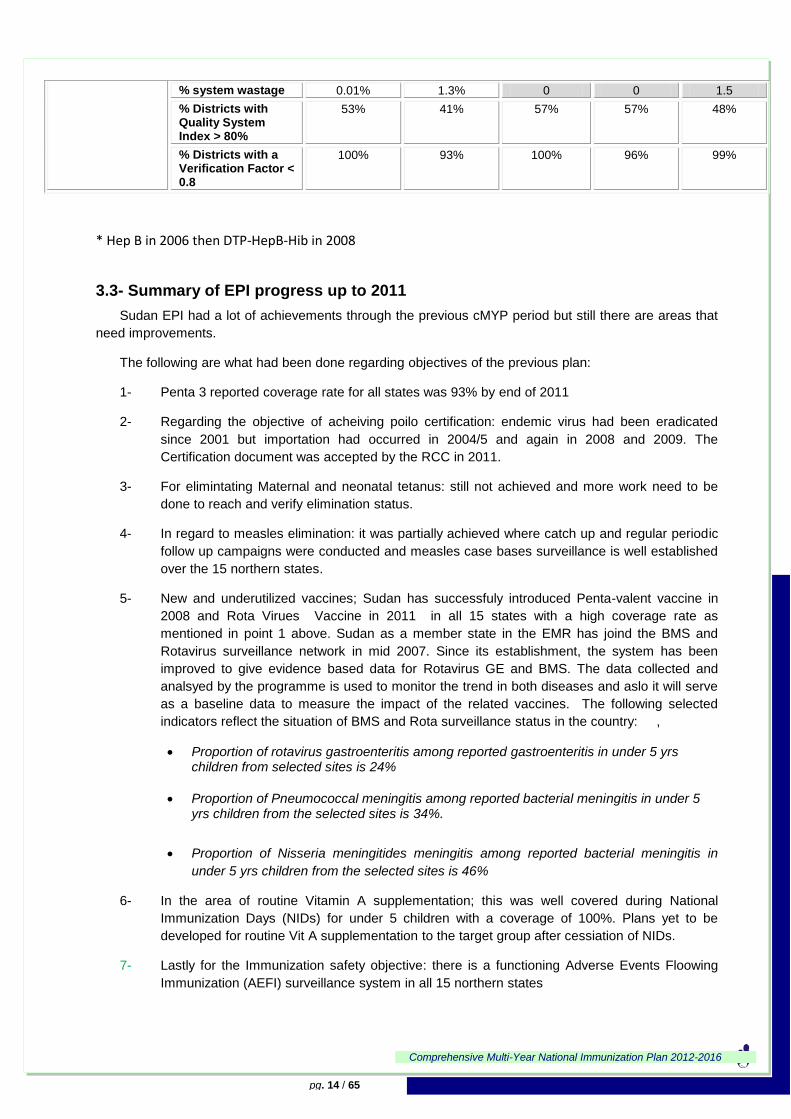
3.3- Summary of EPI progress up to 2011
Sudan EPI had a lot of achievements through the previous cMYP period but still there are areas that
need improvements.
The following are what had been done regarding objectives of the previous plan:
1- Penta 3 reported coverage rate for all states was 93% by end of 2011
2- Regarding the objective of acheiving poilo certification: endemic virus had been eradicated
since 2001 but importation had occurred in 2004/5 and again in 2008 and 2009. The
Certification document was accepted by the RCC in 2011.
3- For elimintating Maternal and neonatal tetanus: still not achieved and more work need to be
done to reach and verify elimination status.
4- In regard to measles elimination: it was partially achieved where catch up and regular periodic
follow up campaigns were conducted and measles case bases surveillance is well established
over the 15 northern states.
5- New and underutilized vaccines; Sudan has successfuly introduced Penta-valent vaccine in
2008 and Rota Virues Vaccine in 2011 in all 15 states with a high coverage rate as
mentioned in point 1 above. Sudan as a member state in the EMR has joind the BMS and
Rotavirus surveillance network in mid 2007. Since its establishment, the system has been
improved to give evidence based data for Rotavirus GE and BMS. The data collected and
analsyed by the programme is used to monitor the trend in both diseases and aslo it will serve
as a baseline data to measure the impact of the related vaccines. The following selected
indicators reflect the situation of BMS and Rota surveillance status in the country: ,
Proportion of rotavirus gastroenteritis among reported gastroenteritis in under 5 yrs children from selected sites is 24%
Proportion of Pneumococcal meningitis among reported bacterial meningitis in under 5 yrs children from the selected sites is 34%.
Proportion of Nisseria meningitides meningitis among reported bacterial meningitis in
under 5 yrs children from the selected sites is 46%
6- In the area of routine Vitamin A supplementation; this was well covered during National
Immunization Days (NIDs) for under 5 children with a coverage of 100%. Plans yet to be
developed for routine Vit A supplementation to the target group after cessiation of NIDs.
7- Lastly for the Immunization safety objective: there is a functioning Adverse Events Floowing
Immunization (AEFI) surveillance system in all 15 northern states
Comprehensive Multi-Year National Immunization Plan 2012-2016
pg. 15 / 65
3.4- Achievements regarding the Global Immunization Vision and Strategy
During the past planning period some progress has been acheivement in regards to the the GIVS,
this can be summerized as follows;
1- Protecting more people in a changing world: there was clear increase in vaccination coverage
frrom 81% in 2005 to 93% by end of 2011. Mealses follow up campagins with its high coverage
provided a second opportunity for children in the age group 9 months to 5 yrs.
2- Introducing new vaccines and technology: successfully EPI has introduced Hepatitis B vaccine
during 2005-2006 , introduced the pentavalent vaccine in 2008 , and introduced the Rota vaccine
in 2011in all the 15 Northern states. In 2011 Sudan applied for PCV13 and Mening A vaccine,
which were approved by GAVI.
3- Intergarting immunization and linked interventions in the health system context: during 2007 and
2009 and for the first time in Sudan, Accelerated Child Survival Initiative campagins were
conducted in collaboration with MCH directorate. It included 5 interventions namely Deworming,
Vitamin A supplementation, measles, OPV and health education messages (handwashing, breast
feeding) while selected states were also given extra interventions such as iodine and iron/folate
supplementation to target groups.
4- Immunizing in a context of global interdependence: The national Immunization programme has
formulated in 2009 its National Immunization Technical Advisory Group (NITAG) which
recommended the introduction of Rotavirus and Pneumococcal vaccines. Sudan, being a GAVI-
eligible country, will apply for GAVI's support for these two vaccines. The government of Sudan
has been financing 75% of routine injection supplies costs since 2006 and in 2008 it contributed
to the co-financing of Pentavalent vaccine and its injection supplies, then the GoS also co-
financed the Rota vaccine. Immunization is high in the government's agenda as reflected by the
fact that immunization coverage is one of the major indicators discussed in the Minister's cabinet
and after the introduction of these three vaccines the government will contribute around $2.4
million as a cofinance share. This partnership with GAVI Alliance and other donors will facilitate
move towards achieving MDGs.
Comprehensive Multi-Year National Immunization Plan 2012-2016
pg. 16 / 65
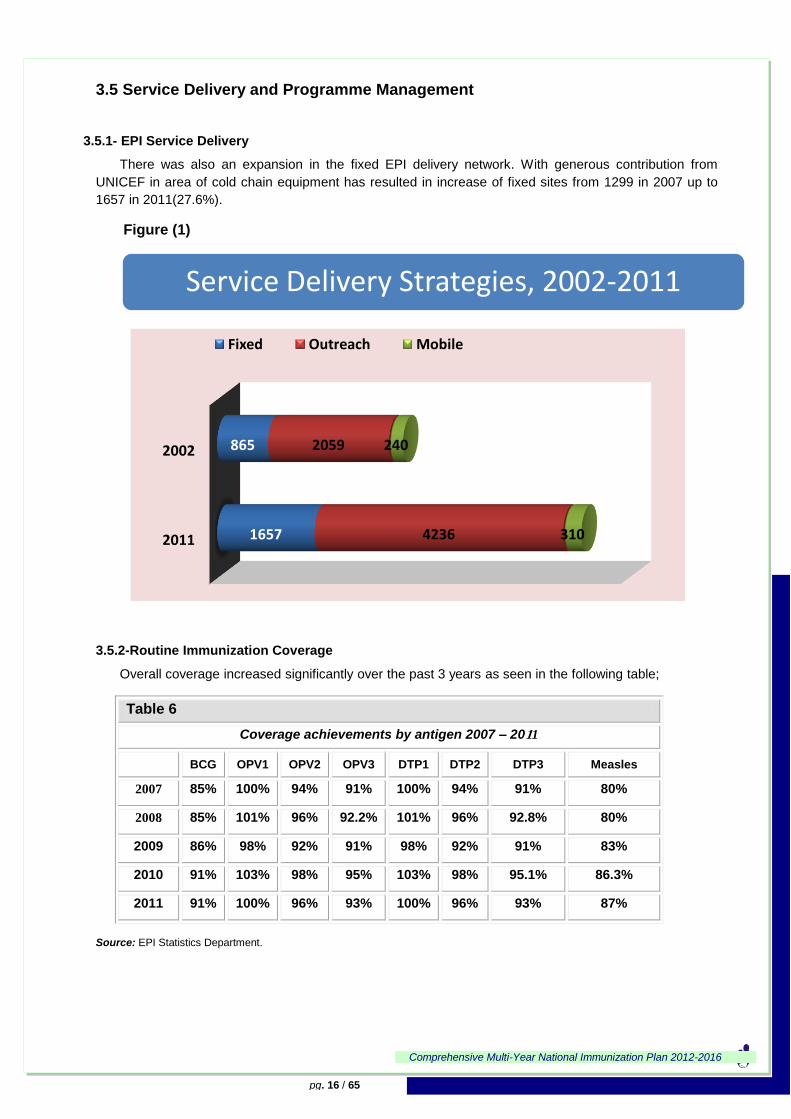
3.5 Service Delivery and Programme Management
3.5.1- EPI Service Delivery
There was also an expansion in the fixed EPI delivery network. With generous contribution from
UNICEF in area of cold chain equipment has resulted in increase of fixed sites from 1299 in 2007 up to
1657 in 2011(27.6%).
Figure (1)
3.5.2-Routine Immunization Coverage
Overall coverage increased significantly over the past 3 years as seen in the following table;
Table 6
Coverage achievements by antigen 2007 – 2011
BCG OPV1 OPV2 OPV3 DTP1 DTP2 DTP3 Measles
2007 85% 100% 94% 91% 100% 94% 91% 80%
2008 85% 101% 96% 92.2% 101% 96% 92.8% 80%
2009 86% 98% 92% 91% 98% 92% 91% 83%
2010 91% 103% 98% 95% 103% 98% 95.1% 86.3%
2011 91% 100% 96% 93% 100% 96% 93% 87%
Source: EPI Statistics Department.
Service Delivery Strategies, 2002-2011
2011
2002
1657
865
4236
2059
310
240
Fixed Outreach Mobile
Comprehensive Multi-Year National Immunization Plan 2012-2016
pg. 17 / 65
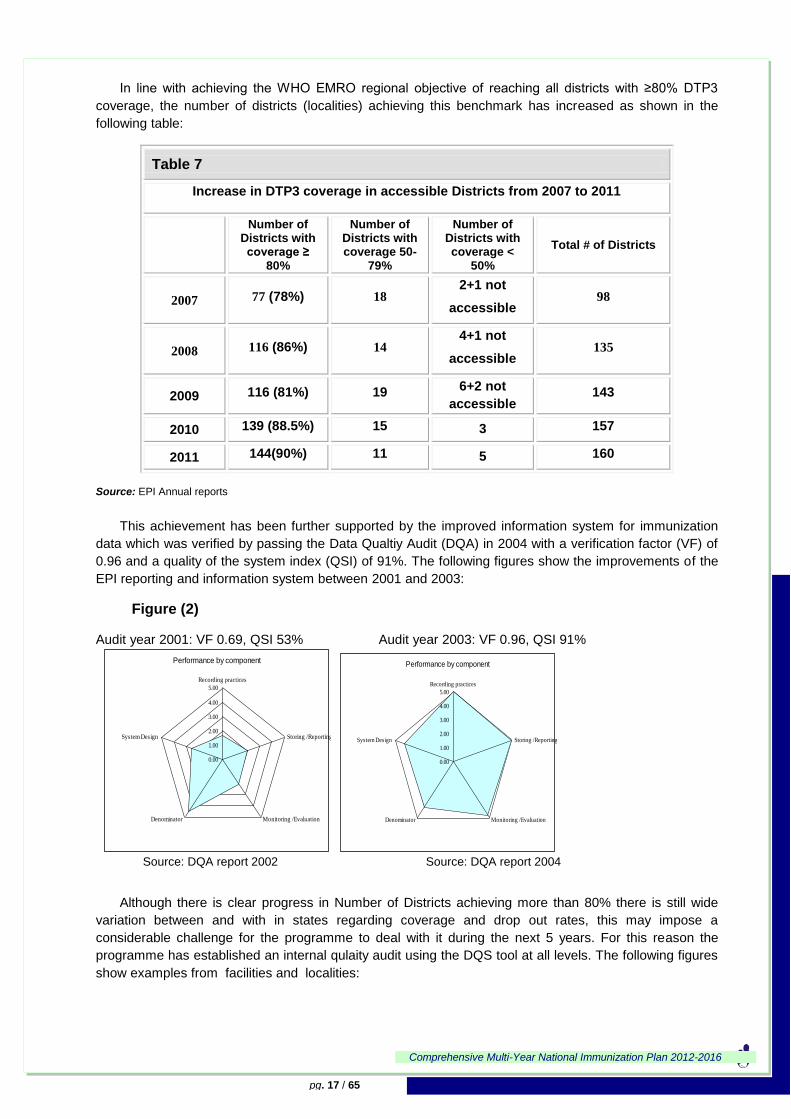
In line with achieving the WHO EMRO regional objective of reaching all districts with ≥80% DTP3
coverage, the number of districts (localities) achieving this benchmark has increased as shown in the
following table:
Table 7
Increase in DTP3 coverage in accessible Districts from 2007 to 2011
Number of Districts with coverage ≥
80%
Number of Districts with coverage 50-
79%
Number of Districts with coverage <
50%
Total # of Districts
2007 77 (78%) 18 2+1 not
accessible 98
2008 116 (86%) 14 4+1 not
accessible 135
2009 116 (81%) 19 6+2 not
accessible 143
2010 139 (88.5%) 15 3 157
2011 144(90%) 11 5 160
Source: EPI Annual reports
This achievement has been further supported by the improved information system for immunization
data which was verified by passing the Data Qualtiy Audit (DQA) in 2004 with a verification factor (VF) of
0.96 and a quality of the system index (QSI) of 91%. The following figures show the improvements of the
EPI reporting and information system between 2001 and 2003:
Figure (2)
Audit year 2001: VF 0.69, QSI 53% Audit year 2003: VF 0.96, QSI 91%
Source: DQA report 2002 Source: DQA report 2004
Although there is clear progress in Number of Districts achieving more than 80% there is still wide
variation between and with in states regarding coverage and drop out rates, this may impose a
considerable challenge for the programme to deal with it during the next 5 years. For this reason the
programme has established an internal qulaity audit using the DQS tool at all levels. The following figures
show examples from facilities and localities:
Performance by component
0.00
1.00
2.00
3.00
4.00
5.00
Recording practices
Storing /Reporting
Monitoring /EvaluationDenominator
System Design
Performance by component
0.00
1.00
2.00
3.00
4.00
5.00
Recording practices
Storing /Reporting
Monitoring /EvaluationDenominator
System Design
Comprehensive Multi-Year National Immunization Plan 2012-2016
pg. 18 / 65
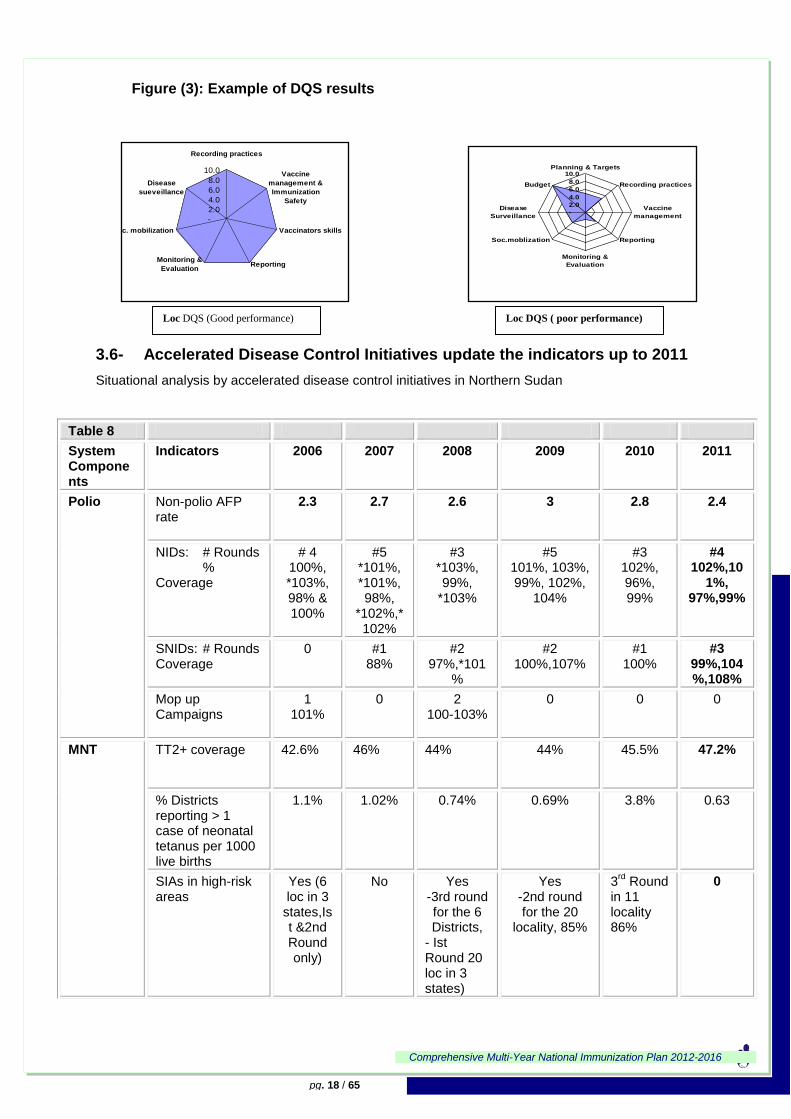
Figure (3): Example of DQS results
3.6- Accelerated Disease Control Initiatives update the indicators up to 2011
Situational analysis by accelerated disease control initiatives in Northern Sudan
-
2.0
4.0
6.0
8.0
10.0
Recording practices
Vaccine
management &
Immunization
Safety
Vaccinators skills
ReportingMonitoring &
Evaluation
Soc. mobilization
Disease
sueveillance
-
2.0
4.0
6.0
8.0
10.0Planning & Targets
Recording practices
Vaccine
management
Reporting
Monitoring &
Evaluation
Soc.moblization
Disease
Surveillance
Budget
Table 8
System Components
Indicators
2006 2007 2008 2009 2010 2011
Polio Non-polio AFP rate
2.3 2.7 2.6 3 2.8 2.4
NIDs: # Rounds % Coverage
# 4 100%, *103%, 98% & 100%
#5 *101%, *101%, 98%,
*102%,*102%
#3 *103%, 99%,
*103%
#5 101%, 103%, 99%, 102%,
104%
#3 102%, 96%, 99%
#4 102%,10
1%, 97%,99%
SNIDs: # Rounds Coverage
0 #1 88%
#2 97%,*101
%
#2 100%,107%
#1 100%
#3 99%,104%,108%
Mop up Campaigns
1 101%
0 2 100-103%
0 0 0
MNT TT2+ coverage 42.6% 46% 44% 44% 45.5% 47.2%
% Districts reporting > 1 case of neonatal tetanus per 1000 live births
1.1% 1.02% 0.74% 0.69% 3.8% 0.63
SIAs in high-risk areas
Yes (6 loc in 3
states,Ist &2nd Round only)
No Yes -3rd round for the 6 Districts,
- Ist Round 20 loc in 3 states)
Yes -2nd round for the 20
locality, 85%
3rd
Round in 11 locality 86%
0
DQS (Good performance) Loc DQS ( poor performance) Loc
Comprehensive Multi-Year National Immunization Plan 2012-2016
pg. 19 / 65
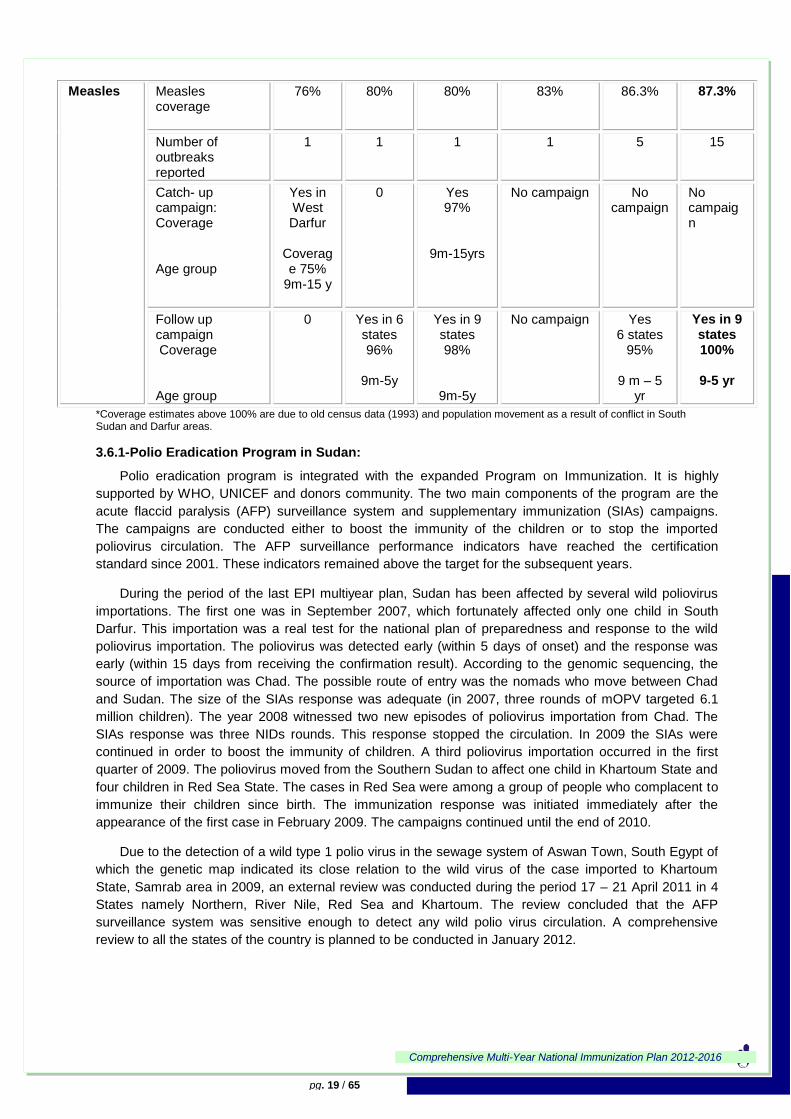
*Coverage estimates above 100% are due to old census data (1993) and population movement as a result of conflict in South Sudan and Darfur areas.
3.6.1-Polio Eradication Program in Sudan:
Polio eradication program is integrated with the expanded Program on Immunization. It is highly
supported by WHO, UNICEF and donors community. The two main components of the program are the
acute flaccid paralysis (AFP) surveillance system and supplementary immunization (SIAs) campaigns.
The campaigns are conducted either to boost the immunity of the children or to stop the imported
poliovirus circulation. The AFP surveillance performance indicators have reached the certification
standard since 2001. These indicators remained above the target for the subsequent years.
During the period of the last EPI multiyear plan, Sudan has been affected by several wild poliovirus
importations. The first one was in September 2007, which fortunately affected only one child in South
Darfur. This importation was a real test for the national plan of preparedness and response to the wild
poliovirus importation. The poliovirus was detected early (within 5 days of onset) and the response was
early (within 15 days from receiving the confirmation result). According to the genomic sequencing, the
source of importation was Chad. The possible route of entry was the nomads who move between Chad
and Sudan. The size of the SIAs response was adequate (in 2007, three rounds of mOPV targeted 6.1
million children). The year 2008 witnessed two new episodes of poliovirus importation from Chad. The
SIAs response was three NIDs rounds. This response stopped the circulation. In 2009 the SIAs were
continued in order to boost the immunity of children. A third poliovirus importation occurred in the first
quarter of 2009. The poliovirus moved from the Southern Sudan to affect one child in Khartoum State and
four children in Red Sea State. The cases in Red Sea were among a group of people who complacent to
immunize their children since birth. The immunization response was initiated immediately after the
appearance of the first case in February 2009. The campaigns continued until the end of 2010.
Due to the detection of a wild type 1 polio virus in the sewage system of Aswan Town, South Egypt of
which the genetic map indicated its close relation to the wild virus of the case imported to Khartoum
State, Samrab area in 2009, an external review was conducted during the period 17 – 21 April 2011 in 4
States namely Northern, River Nile, Red Sea and Khartoum. The review concluded that the AFP
surveillance system was sensitive enough to detect any wild polio virus circulation. A comprehensive
review to all the states of the country is planned to be conducted in January 2012.
Measles Measles coverage
76% 80% 80% 83% 86.3% 87.3%
Number of outbreaks reported
1 1 1 1 5 15
Catch- up campaign: Coverage Age group
Yes in West Darfur
Coverage 75%
9m-15 y
0 Yes 97%
9m-15yrs
No campaign No campaign
No campaign
Follow up campaign Coverage Age group
0 Yes in 6 states 96%
9m-5y
Yes in 9 states 98%
9m-5y
No campaign Yes 6 states
95% 9 m – 5
yr
Yes in 9 states 100%
9-5 yr
Comprehensive Multi-Year National Immunization Plan 2012-2016
pg. 20 / 65
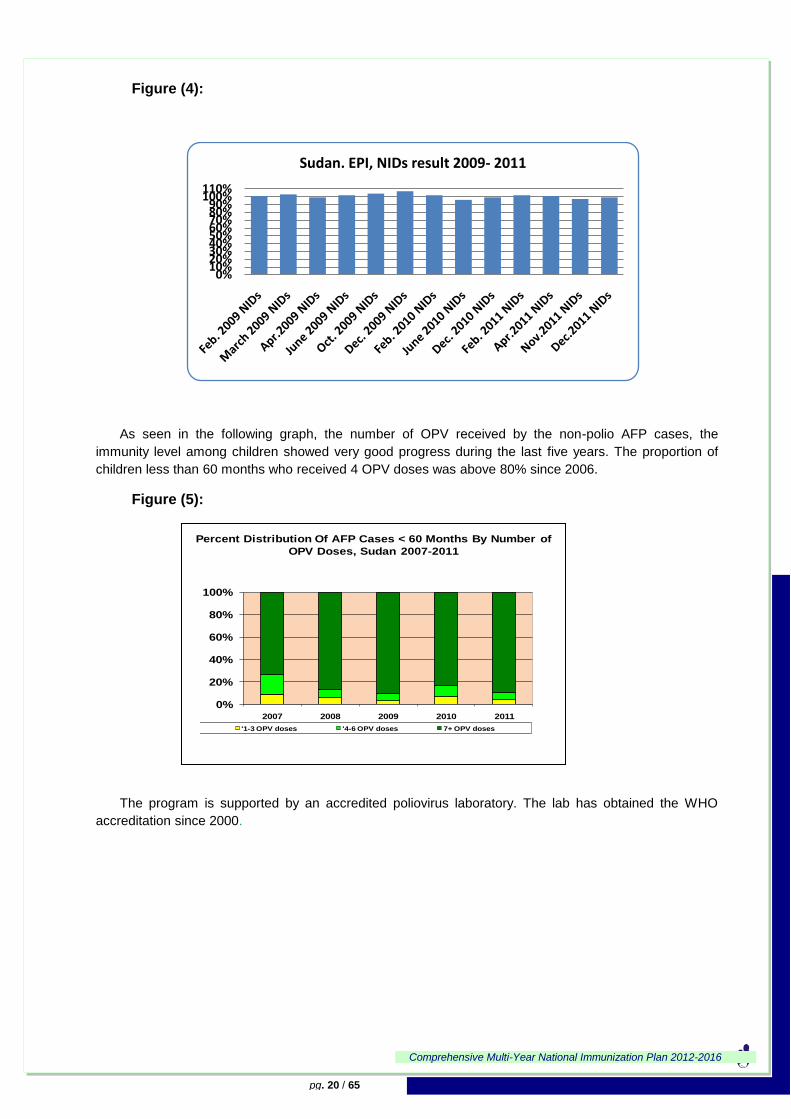
Figure (4):
As seen in the following graph, the number of OPV received by the non-polio AFP cases, the
immunity level among children showed very good progress during the last five years. The proportion of
children less than 60 months who received 4 OPV doses was above 80% since 2006.
Figure (5):
The program is supported by an accredited poliovirus laboratory. The lab has obtained the WHO
accreditation since 2000.
0%10%20%30%40%50%60%70%80%90%
100%110%
Sudan. EPI, NIDs result 2009- 2011
0%
20%
40%
60%
80%
100%
2007 2008 2009 2010 2011
'1-3 OPV doses '4-6 OPV doses 7+ OPV doses
Percent Distribution Of AFP Cases < 60 Months By Number of
OPV Doses, Sudan 2007-2011
Comprehensive Multi-Year National Immunization Plan 2012-2016
pg. 21 / 65
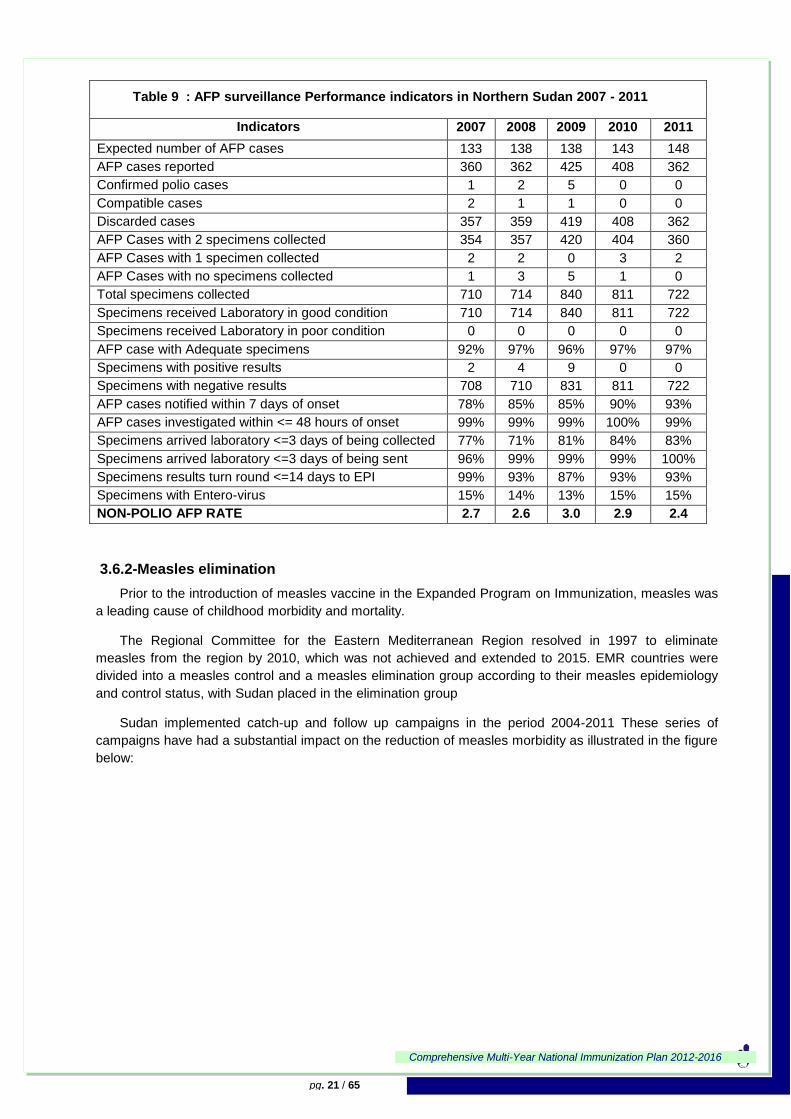
Table 9 : AFP surveillance Performance indicators in Northern Sudan 2007 - 2011
Indicators 2007 2008 2009 2010 2011
Expected number of AFP cases 133 138 138 143 148
AFP cases reported 360 362 425 408 362
Confirmed polio cases 1 2 5 0 0
Compatible cases 2 1 1 0 0
Discarded cases 357 359 419 408 362
AFP Cases with 2 specimens collected 354 357 420 404 360
AFP Cases with 1 specimen collected 2 2 0 3 2
AFP Cases with no specimens collected 1 3 5 1 0
Total specimens collected 710 714 840 811 722
Specimens received Laboratory in good condition 710 714 840 811 722
Specimens received Laboratory in poor condition 0 0 0 0 0
AFP case with Adequate specimens 92% 97% 96% 97% 97%
Specimens with positive results 2 4 9 0 0
Specimens with negative results 708 710 831 811 722
AFP cases notified within 7 days of onset 78% 85% 85% 90% 93%
AFP cases investigated within <= 48 hours of onset 99% 99% 99% 100% 99%
Specimens arrived laboratory <=3 days of being collected 77% 71% 81% 84% 83%
Specimens arrived laboratory <=3 days of being sent 96% 99% 99% 99% 100%
Specimens results turn round <=14 days to EPI 99% 93% 87% 93% 93%
Specimens with Entero-virus 15% 14% 13% 15% 15%
NON-POLIO AFP RATE 2.7 2.6 3.0 2.9 2.4
3.6.2-Measles elimination
Prior to the introduction of measles vaccine in the Expanded Program on Immunization, measles was
a leading cause of childhood morbidity and mortality.
The Regional Committee for the Eastern Mediterranean Region resolved in 1997 to eliminate
measles from the region by 2010, which was not achieved and extended to 2015. EMR countries were
divided into a measles control and a measles elimination group according to their measles epidemiology
and control status, with Sudan placed in the elimination group
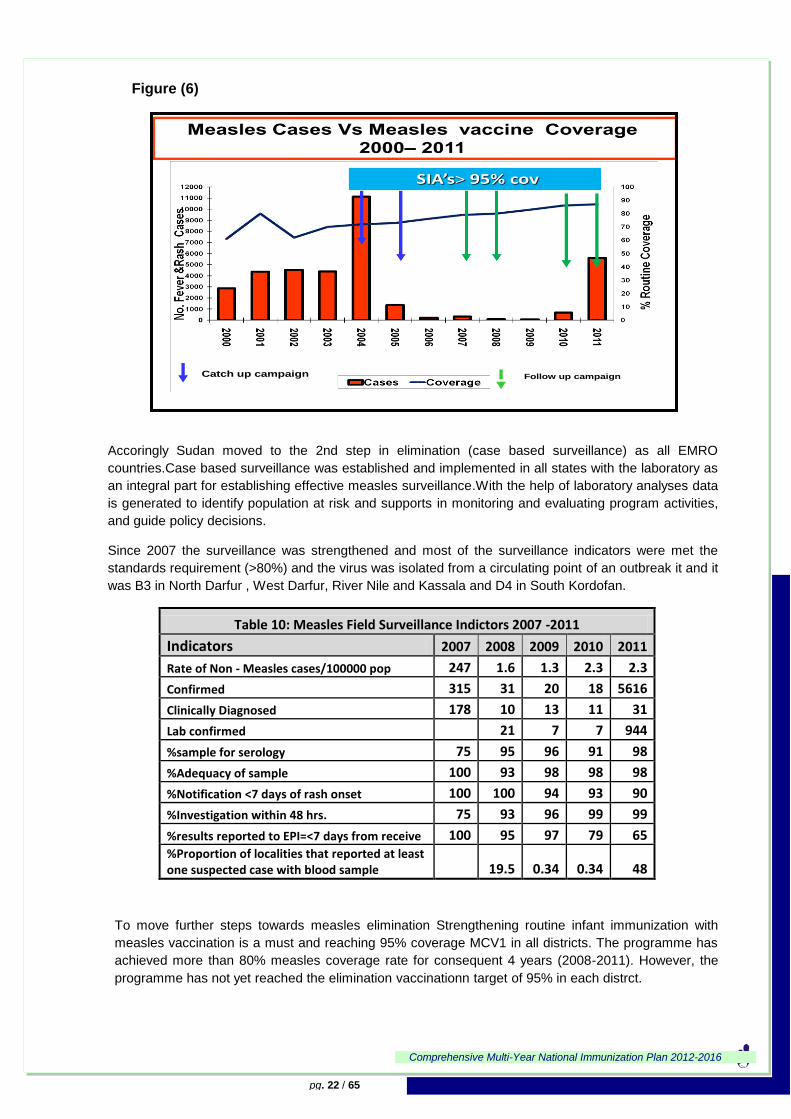
Sudan implemented catch-up and follow up campaigns in the period 2004-2011 These series of
campaigns have had a substantial impact on the reduction of measles morbidity as illustrated in the figure
below:
Comprehensive Multi-Year National Immunization Plan 2012-2016
pg. 22 / 65
Figure (6)
Accoringly Sudan moved to the 2nd step in elimination (case based surveillance) as all EMRO
countries.Case based surveillance was established and implemented in all states with the laboratory as
an integral part for establishing effective measles surveillance.With the help of laboratory analyses data
is generated to identify population at risk and supports in monitoring and evaluating program activities,
and guide policy decisions.
Since 2007 the surveillance was strengthened and most of the surveillance indicators were met the
standards requirement (>80%) and the virus was isolated from a circulating point of an outbreak it and it
was B3 in North Darfur , West Darfur, River Nile and Kassala and D4 in South Kordofan.
Table 10: Measles Field Surveillance Indictors 2007 -2011
Indicators 2007 2008 2009 2010 2011
Rate of Non - Measles cases/100000 pop 247 1.6 1.3 2.3 2.3
Confirmed 315 31 20 18 5616
Clinically Diagnosed 178 10 13 11 31
Lab confirmed 21 7 7 944
%sample for serology 75 95 96 91 98
%Adequacy of sample 100 93 98 98 98
%Notification <7 days of rash onset 100 100 94 93 90
%Investigation within 48 hrs. 75 93 96 99 99
%results reported to EPI=<7 days from receive 100 95 97 79 65 %Proportion of localities that reported at least one suspected case with blood sample 19.5 0.34 0.34 48
To move further steps towards measles elimination Strengthening routine infant immunization with
measles vaccination is a must and reaching 95% coverage MCV1 in all districts. The programme has
achieved more than 80% measles coverage rate for consequent 4 years (2008-2011). However, the
programme has not yet reached the elimination vaccinationn target of 95% in each distrct.
Catch up campaign Follow up campaign
SIA’s> 95% cov
Comprehensive Multi-Year National Immunization Plan 2012-2016
pg. 23 / 65
3.6.3- Maternal and Neonatal Tetanus:
Neonatal tetanus has remained a major public health probem in Sudan and its elimination a real
challenge. Despite previous attempts to accelerate the MNTE in the late 1990s, very little progress was
achieved. The results of the Sudan Household Health Survey (SHHS) 2010 indicated high mortality in the
neonatal and post natal periods: 33/1000 LB, 24/1000 LB respectively. This high proportion of neonatal
deaths in the first 4 weeks of life indicates poor pregnancy and pregnancy related care with a significant
number attributed to neonatal tetanus.
Due to several challenges including unavailability of funds delayed the implementation of the required
TT vaccination campaigns in the high risk localities. Another factor contributed to the slow progress
toward NNTE is low coverage of antenatal care and most of the deliveries are happening in houses.
3.6.4- Accelerated Child Survival Initiative:
During May 2008, for the first time in sudan and in line with the Mellinnium Development Goals
(MDGs); the expanded programme on immunization, in collaboration with other PHC programmes
(Nutrition, CAH, Malaria, and Bilharzia control programme), successfully conducted an accelerated child
survival jump start. In the subsequent years pulse compaigns known as Child Health days (CHDs) were
jointly conducted with other vaccination activities.
A package of interventions was provided to under five years children. It included Measles vaccine,
polio vaccine, Supplementation of vitamin A, Lipidol (Iodine supplemetation), Albendazol (derowrming),
distribution of Long Lasting Insecticide Treated Nets and health awareness messages.
Based on the accumulated experience of vaccination personnel, EPI took the lead in the coordination,
planning, implementation and evaluation of these campaigns.
3.7- VPDs Surveillance
At present, information on health and disease indicators, including Vaccine Preventable Diseases
(VPDs), is collected by different departments in the MOH according to their mandate.
The Directorate of Epidemiology is responsible for the collection, tabulation, analysis and distribution
of epidemiological information on all diseases. This directorate identified lists of communicable diseases
to be reported and all health professionals are required to report cases of these diseases. Diagnoses are
based solely on clinical criteria. Under-reporting occurs in the whole country, there are problems of timely
delivery of reports, poor local utilization of collected data, and lack of a proper feedback system. The
basic and continuing training for statistics clerks is deemed inadequate.
The Directorate of Health Statistics runs a separate health information system to collect data on
communicable and non-communicable diseases through monthly reports which are sent from health care
facilities to the National Ministry of Health.
EPI established the AFP surveillance system. The purpose of the system is to document the
interruption of wild poliovirus in the country. Since then, the system could achieved performance
indicators at the level of certification. The AFP rate kept continuosly above 2 per 100,000 while the
national adequate samples collection rate is maintained above 90% for the last ten years. Active
surveillance visits have been made to the different monitoring sites in all states, representing about 95%
of the visits planned. These visits have greatly contributed to upgrading the performance and following up
the indicators at the different states, Districts and reporting sites. The system enabled the early detection
of imported viruses and thus effective mopping up vaccination were done in good time.
Based on the success of the AFP surveillance system,measles and neonatal tetanus surveillance
was integrated with the AFP surveillance system. The measles surveillance was established as case-
based surveillance since 2006.
Comprehensive Multi-Year National Immunization Plan 2012-2016
pg. 24 / 65
Data collection on other VPDs is provided monthly from the Districts to the state and ultimately to
federal level. Specific guidelines for each disease was developed and distributed to all states.
As the surveillance system is getting maturation, an AEFI system was established in EPI. A national
protocol was developed and distributed to states‟ EPI officers. The notification of serious events are
immediately required.
Surviellance of diseases targeted by new vaccine:
Since 2007, case based surveillance of Rota virus and bacterial Meningitis BMS in under 5 years
children was established in 8 paediatric hospitals in order to detect and document the circulating strains
for new vaccines and to serve as a baseline data to assess the impact of introduction of these vaccines
As noted above, there are different surveillance systems,one of the big challenges in surveillance will
be the integration of this system into VPDs surveillance. Another challenge for VPDs surveillance is
establishment of community surveillance for Measles and NNT as most of Measles and NNT cases occur
and die before they are presented to health facilities.
3.8- Other EPI Components
3.8.1- New Vaccines
Within the previous 5-year plan, Sudan EPI had successfully inroduced hepatitis B vaccine in 2006 in all
Northern States. In January 2008 the DTP-HepB,Hib combination vaccine (Penta valent vaccine) has
been introduced also in all Northern states. By the end of December 2010 high coverage was achieved
(95%).
In Sudan, under five mortality rate is 78/1000 live birth. Diarrhea and gastroenteritis related diseases are 4
th cause of admission to the hospitals in children less than 5 years of age. Diarrhea and gastroenteritis
are 5th cause of death in hospital for children age ˂ 5 years4.
The Regional surveillance network data reflected the high burden of Rotavirus disease in Sudan which has been estimated to account for 28 %. Therefore Rotavirus related diseases have been considered as an important public health problem in Sudan.
In Sudan WHO Bacterial Meningitis Surveillance and Rotavirus surveillance data reflected high burden of Pneumococcal and Rotavirus diseases.
In 2009, NITAG Sudan recommended and prioritized the introduction of Rotavirus vaccine.The country choice was Rotarix vaccine in the form of oral fully liquid one dose vial vaccine presentation in 2 dose schedule. EPI programme Sudan launched the inclusion of Rotavirus vaccine in the routine immunization programme on 17 July 2011.
In anticipation of further potential vaccines to be included in the EPI and in line with the regional WHO
EMR immunization goals, burden of disease estimates related to, meningitis caused by Streptococcus
pneumoniae and Neisseria menigitidis had been started in 2007. The data available by the end of June
2009 18% as proportion of pnemucoccal meningitis cases out of the total reported bacterial meningitis
cases and 71% as proportion of Neisseria meningitis cases out of the total reported bacterial meningitis
cases.This data was used for the application for pnemucoccoal and Mening A vaccines. The country
experience with the last Yellow Fever outbreak in 2005 gave a good justification to introduce Yellow
Fever vaccine. The MOH is decided to conduct a mass vaccination campaign against Yellow Fever and
later to introduce the Yellow Fever vaccine in the routine vaccination programme in selected areas.
4 Sudan annual statistical report 2011
Comprehensive Multi-Year National Immunization Plan 2012-2016
pg. 25 / 65
The burden of disease estimates related to congenital rubella syndrome and pneumonia caused by
Streptococcus pneumoniae had not been implemented due to financial and logistics problems which will
be addressed during the coming years.
Post Introduction Evaluation (PIE) Pentavalent vaccine:-
WHO recommends a Post Introduction Evaluation ideally conducted between 6 and 12 month for the countries which introduced a new vaccine to assess the programmatic impact of the introduction. Therefore it was very important for the Immunization programme to document lessons learned following the introduction of Pentavalent vaccine before embarking for other new vaccines
• The PIE is a mean to help the EPI programme :
– To identify the strengths and areas which needs improvement following the introduction
– To correct on time any problems faced by the EPI programme
– To be more prepared in the planning of introduction of additional vaccine
– To document and share lessons learnt
In Sudan PIE was done for pentavalent vaccine in 2009 and its mainrecommendations were:
• Continue to sustain the excellent coverage
• Continuous financial support is needed from the Partners to maintain this achievement
• Maintain the progress made by the EPI programme in strengthening the supportive supervision at all level
• Update the denominator figures based on the finalized census
• Rely more and more on fixed and outreach strategy instead of mobile where possible
• As Sudan is planning to introduce more new vaccine, human resource component for the cold chain at National and State level should be planned well ahead
• Continue effort to establish NITAG for the EPI programme
• A plan for repair and maintenance of the cold rooms, generators, and other equipments should available in written form at National and State level
3.8.2- Immunization Safety
Over the past years the Federal Ministry of Health has introduced Auto Destruct (AD) syringes for
immunization purposes as well as safety boxes for the collection and disposal of used injection equipment
with UNICEF and GAVI support. AD syringes and safety boxes are distributed bundled with the vaccines
to the states, and are available and used in all centers. All health centers burn safety boxes either in the
general waste disposal area or in drums and bury the remains. All health service staff is guided to follow
this burn & bury procedure for health care waste disposal.
There is a specific department at the EPI directorate concerned mainly with safety of immunization
and surveillance of adverse events following immunization (AEFI) and a coordinator has been appointed.
A system to routinely report adverse events following immunizations (AEFI) has been established in the
Sudan in 15 states. AEFI are reported during routine & campaigns activities. Three types of reporting are
implemented , Immediate rewporting for any serious events following immunization, weekly zero
reportingto the EPI with AFP Zero Reports and monthly reports cpmpylying all events (minor & major).
The present EPI manual contains information for vaccinators on the AEFI for all routine vaccines and the
appropriate procedures to follow in cases of their potential occurrence.
In 2011 the reporting of AEFI expanded from sentinle sites reporting to include all the fixed
vaccination sites, also the AEFI guidlenies approved and distributed all over the states contain
Comprehensive Multi-Year National Immunization Plan 2012-2016
pg. 26 / 65
information about the AEFI case difintion, cases and classification of AEFI also the term of referance of
focal points at different level, causality assessment training work shop has been conducted and
formulation of causality assessment committee .
During the period 2007 – 2011, (87) AEFI cases were reported most them were minor ( local reaction,
injection site abscess) and had no adverse impact on immunization program.
Intussusception:
As WHO‟s Global Advisory Committee on Vaccine Safety (GACVS) recommended to develop a system of
post-marketing surveillance for New vaccines, and recommended a standardized approach to address
potential safety issues regarding rotavirus vaccine, Sudan started intussusception surveillance system for
infants in 2011 at 4 major pediatric hospitals. Surveillance will be continued till doubling of the sample
size as recommended.
3.8.3- Training and Capacity Building
In order to raise the technical capacity of EPI staff, training guidelines and manuals were prepared
properly in 2003 and updated in 2005 and 2007 and the last update was in 2011 to accommodate all the
new techniques and information concerning the introduction of new vaccines (Rota virus vaccine).
Many training courses had been conducted in 2007– 2011 for:
information focal peersons and Cold chain officers at national and states levels,
EPI operations officers, survillelance officers at all levels
and the vaccinators at the immunzation delivery sites.
To strengthen the quality of vaccine and cold chain management 4 cold chain officers were traind on
vaccine stock mangement software during the period 2010-2011 by national EPI office. The rest will be
trained during the cycle of this plan.
All training material and regisration documents will be updated again to include the Peumococcal,
Mening A and Yellow Fever vaccines.
3.8.4- Micro planning
As part of RED approach, the microplans of all Districts have been prepared since 2003 and annually
updated by the District operation officers and include clear identification of hard to reach and special
population and how to cover them. These microplans are the basis of the annual plans at state and
federal EPI.
3.8.5- Human Resources Management
A major issue in human resources management are insufficient salary levels and poor incentives,
causing:
High turnover and brain drain to other more financially rewarding posts
high dependence on Volunteers at health facility level
To reduce the negative impact, the EPI has come up with a system of incentives:
At federal level, the EPI has incorporated as part of its benefits structure subsidization of
training (obtaining university degrees and attending short courses as well) to retain medical
doctors and public health officers.
Comprehensive Multi-Year National Immunization Plan 2012-2016
pg. 27 / 65
At states level: there, was scheme is financed through GAVI and provides small monthly
incentives to state EPI Operation officers based on agreed performance in achieving
certain targets, but for financial reasons this project stopped during the last few years.
For Districts, the incentive consists of training for mid-level management in the areas of
vaccine management, and planning issues.
Participation of Volunteers in SIAs activities.
3.8.6- Costing and Financing:
Main partners of the EPI are WHO, UNICEF and some major NGOs. These partners provide
technical and financial support to the programme for routine services as well as for the supplementary
immunization activities. WHO‟s support includes deployment of international and national experts at
different locations and co-coordinators at both federal and state levels. WHO further supports the AFP
surveillance network, NIDs for polio eradication, training, and other routine and supplementary activities.
UNICEF provides vaccines bundled with AD syringes and safety boxes for routine and campaign use.
The Fund further supports polio NIDs, as well as MNT and other routine EPI activities (e.g. social
mobilization and cold chain).
The EPI received GAVI ISS support during 2002 -2010. GAVI support was used for routine activities
and it supported the phased introduction of new hepatitis B vaccine starting in 2005, DTP_HepB-Hib in
2008, and Rota vaccine in 2011 as welll. The Government is mainly responsible for payment of the
permanent EPI staff at all levels (National, state, District, health unit), and supporting the programme with
some transportation and other logistical issues; also since 2006 National government took over the cost
of injection supply, and since 2008 co-financed the cost of pentavalent and Rota vaccines, and showed
commitment to support additional new vaccinesintroduction into routine vaccination such as, PCV,
Mening A conjugate and Yellow Fever vaccines.
3.8.7. Advocacy and Communication
The EPI Social Mobilisation Section is active primarily during the accelerated disease control
campaigns. At the federal, state and Districts levels the section plays a major role in communication and
attracting the community towards immunization days. In routine EPI services, communication activities
are very poor especially in targeting reduction of drop-out rates and missed opportunities and this is
mainly due to lack of funds for routine activities.
During the previous planning cycle, a workshop was conducted for training of social mobilization focal
persons at state level. The workshop concluded certain recommendations. Some of those
recommendations focused on evaluation of reasons that prevent mothers from coming to the vaccination
centres through appropriate Knowledge, Attitude and Practice (KAP) studies. The workshop also
remmended to develop communication plans for each state according to its social context. The planning
of social mobilization activities at District level is one of the compomnents of the routine micoplan.
EPI has established associations of „Friends of Immunization‟ in some states in an attempt to
collevctively engage NGOs, religious leaders, and the private sector to support immunization services,
create community demand and to encourage community participation in planning and monitoring of these
services.
Annual celebration of immunization week started in Sudan since 2007 in month of July, In the last two
years EPI celebrated the immunization week in April along with other EMR countries and other WHO
regions.
Comprehensive Multi-Year National Immunization Plan 2012-2016
pg. 28 / 65
3.8.8- Supplies, Cold Chain and Logistics
Cold Chain
Between 2001 and 2004, the programme had completed the rehabilitation of the central cold store
with introduction of advanced technologies for vaccine stock management (VSSM tool), temperature and
electricity monitoring and control. Also during 2003 and 2004, the programme started the rehabilitation of
the cold chain in the states resulting in an improvement of cold chain functionality from 50% in 2001 to
80% in 2004 which is mentained at this level up to 2011.
The cold chain operates in all states with cold stores at various levels. The central store thus provides
adequate storage space for present and future needs for all infants vaccines as well as for potential
booster doses. It is estimated that the capacity will be adequate for all supplementary immunization
activities for the next 10 years. During the past few years, cold rooms have been installed in all 15 states.
All state level cold chambers are of a standard design, and have storage.
During 2008, the central cold store was certified under the WHO-Unicef Effective Vaccine Store
Management Initiative (EVSMI) to be the 4th store world wide that received this certificate and the second
in EMR. In 2009 an awrard of excellence from GAVI was given to for the effective cold store and vaccine
management sytem in Sudan.
As a step in the preparation for the introduction of Rota virus vaccine in 2011 a new cold room with
storage capacity of 8,000 Litre was installed to increase the total capacity from 60,950 in 2010 to 68,950
litre in 2011 at central cold store, also an assessment of the storage capacity needs at state and District
level was done and accordingly 6 cold room and 5 refrigrators at states level and 36 refrigrators at District
level were distributed, in addtion to rehabilitation activities at over all states the storage capacitiy at
states and Districts increase from 178,721 to 270,721 Litre
For the introduction of the new coming vaccines in the pipeline with its large volume; a reassessment
for the existing sotrage capacity and estimation of needed cold chain equipments will be done
Vaccine Wastage
Wastage rates indicators are regularly monitored at all levels. Health facility monthly reports contain
basic information to calculate this indicator. Supervisors check the vaccine wastage during their visits
and, the importance of reducing wastage rates is emphasised in programme planning at all EPI levels.
The open vial policy is known and in use for OPV and TT. As a general rule, all health facilities provide
BCG and Measles vaccines on fixed days in order to reduce wastage. Pentavalent and Rota virus
monovalent vaccines has helped alot in vaccinating children as soon as they present themselves to
health facilities and wastage was kept just below 5%.
Comprehensive Multi-Year National Immunization Plan 2012-2016
pg. 29 / 65
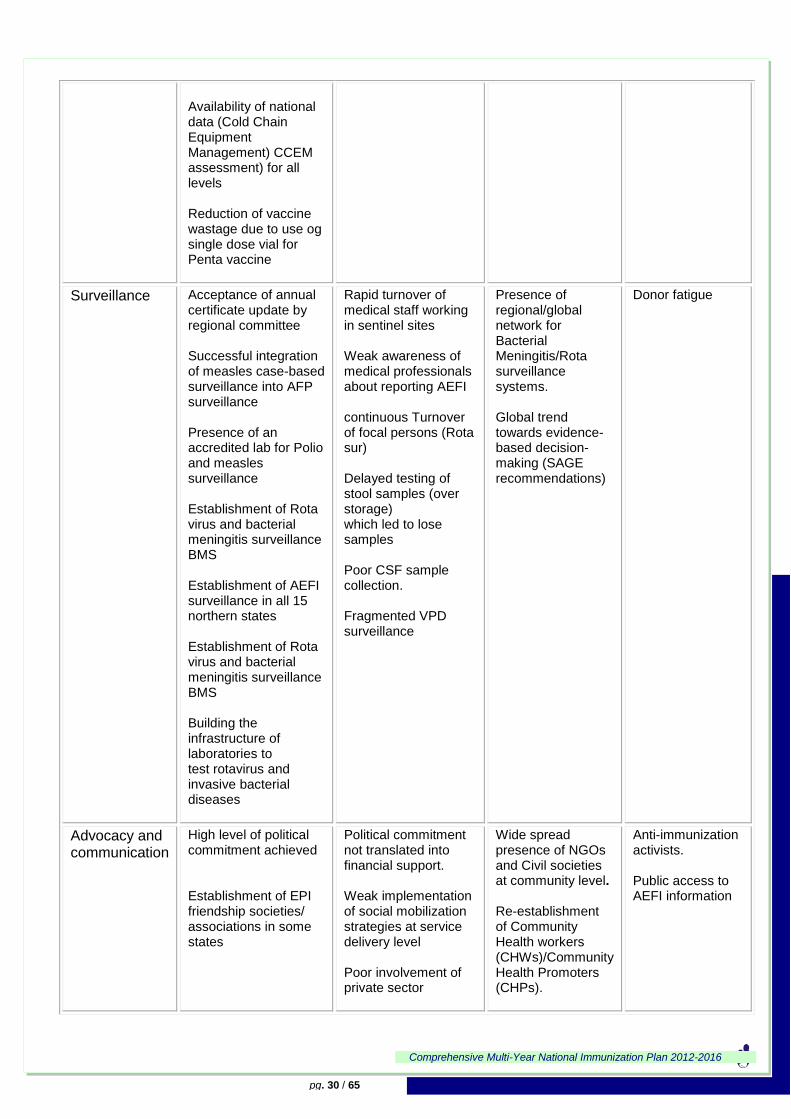
3.9-SWOT analysis of EPI programme
3.9.1- EPI System components
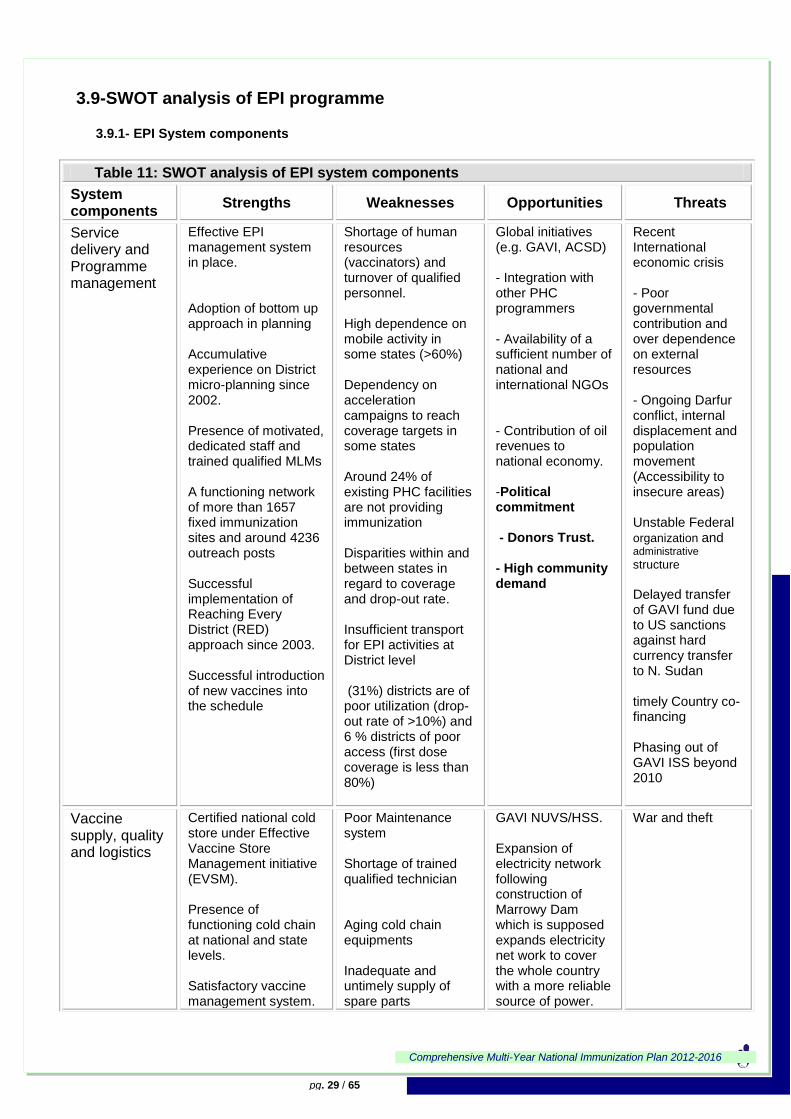
Table 11: SWOT analysis of EPI system components
System components
Strengths Weaknesses Opportunities Threats
Service delivery and Programme management
Effective EPI management system in place. Adoption of bottom up approach in planning Accumulative experience on District micro-planning since 2002. Presence of motivated, dedicated staff and trained qualified MLMs A functioning network of more than 1657 fixed immunization sites and around 4236 outreach posts Successful implementation of Reaching Every District (RED) approach since 2003. Successful introduction of new vaccines into the schedule
Shortage of human resources (vaccinators) and turnover of qualified personnel. High dependence on mobile activity in some states (>60%) Dependency on acceleration campaigns to reach coverage targets in some states Around 24% of existing PHC facilities are not providing immunization Disparities within and between states in regard to coverage and drop-out rate. Insufficient transport for EPI activities at District level (31%) districts are of poor utilization (drop-out rate of >10%) and 6 % districts of poor access (first dose coverage is less than 80%)
Global initiatives (e.g. GAVI, ACSD) - Integration with other PHC programmers - Availability of a sufficient number of national and international NGOs - Contribution of oil revenues to national economy. -Political commitment - Donors Trust. - High community demand
Recent International economic crisis - Poor governmental contribution and over dependence on external resources - Ongoing Darfur conflict, internal displacement and population movement (Accessibility to insecure areas) Unstable Federal organization and administrative structure Delayed transfer of GAVI fund due to US sanctions against hard currency transfer to N. Sudan
timely Country co-financing Phasing out of GAVI ISS beyond 2010
Vaccine supply, quality and logistics
Certified national cold store under Effective Vaccine Store Management initiative (EVSM). Presence of functioning cold chain at national and state levels. Satisfactory vaccine management system.
Poor Maintenance system Shortage of trained qualified technician Aging cold chain equipments Inadequate and untimely supply of spare parts
GAVI NUVS/HSS. Expansion of electricity network following construction of Marrowy Dam which is supposed expands electricity net work to cover the whole country with a more reliable source of power.
War and theft
Comprehensive Multi-Year National Immunization Plan 2012-2016
pg. 30 / 65
Availability of national data (Cold Chain Equipment Management) CCEM assessment) for all levels Reduction of vaccine wastage due to use og single dose vial for Penta vaccine
Surveillance
Acceptance of annual certificate update by regional committee Successful integration of measles case-based surveillance into AFP surveillance Presence of an accredited lab for Polio and measles surveillance Establishment of Rota virus and bacterial meningitis surveillance BMS Establishment of AEFI surveillance in all 15 northern states Establishment of Rota virus and bacterial meningitis surveillance BMS Building the infrastructure of laboratories to test rotavirus and invasive bacterial diseases
Rapid turnover of medical staff working in sentinel sites Weak awareness of medical professionals about reporting AEFI continuous Turnover of focal persons (Rota sur) Delayed testing of stool samples (over storage) which led to lose samples Poor CSF sample collection. Fragmented VPD surveillance
Presence of regional/global network for Bacterial Meningitis/Rota surveillance systems. Global trend towards evidence-based decision-making (SAGE recommendations)
Donor fatigue
Advocacy and communication
High level of political commitment achieved Establishment of EPI friendship societies/ associations in some states
Political commitment not translated into financial support. Weak implementation of social mobilization strategies at service delivery level Poor involvement of private sector
Wide spread presence of NGOs and Civil societies at community level. Re-establishment of Community Health workers (CHWs)/Community Health Promoters (CHPs).
Anti-immunization activists. Public access to AEFI information
Comprehensive Multi-Year National Immunization Plan 2012-2016
pg. 31 / 65
Poor involvement of PHC communication personnel in Routine EPI activities Weak community demand Inadequate use of evidence-based interventions,( e.g. Communication for development C4D) Low priority of resource's allocation for routine social mobilization activities
Wide and popular radio broadcast and availability of community radio listening groups supported by UNICEF. Advanced communication network in the country.
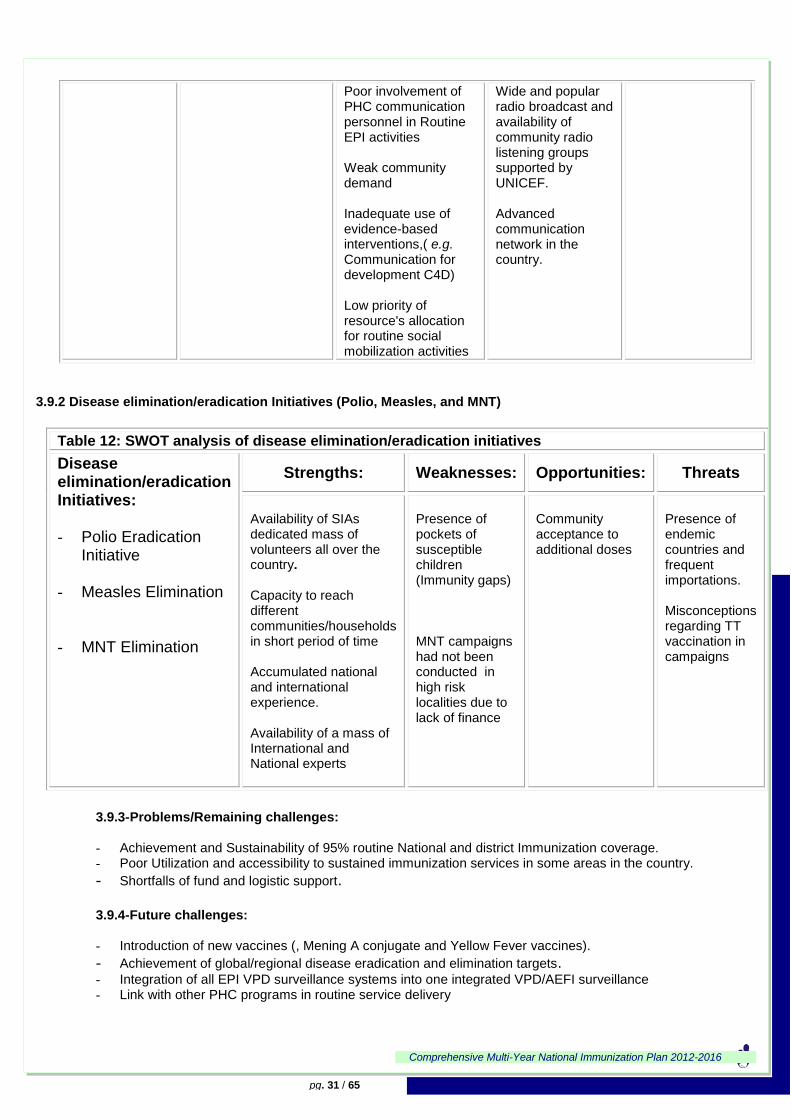
3.9.2 Disease elimination/eradication Initiatives (Polio, Measles, and MNT)
Table 12: SWOT analysis of disease elimination/eradication initiatives
Disease elimination/eradication Initiatives: - Polio Eradication
Initiative
- Measles Elimination
- MNT Elimination
Strengths: Weaknesses: Opportunities: Threats
Availability of SIAs dedicated mass of volunteers all over the country. Capacity to reach different communities/households in short period of time Accumulated national and international experience. Availability of a mass of International and National experts
Presence of pockets of susceptible children (Immunity gaps) MNT campaigns had not been conducted in high risk localities due to lack of finance
Community acceptance to additional doses
Presence of endemic countries and frequent importations. Misconceptions regarding TT vaccination in campaigns
3.9.3-Problems/Remaining challenges: - Achievement and Sustainability of 95% routine National and district Immunization coverage. - Poor Utilization and accessibility to sustained immunization services in some areas in the country.
- Shortfalls of fund and logistic support. 3.9.4-Future challenges: - Introduction of new vaccines (, Mening A conjugate and Yellow Fever vaccines).
- Achievement of global/regional disease eradication and elimination targets. - Integration of all EPI VPD surveillance systems into one integrated VPD/AEFI surveillance - Link with other PHC programs in routine service delivery
Comprehensive Multi-Year National Immunization Plan 2012-2016
pg. 32 / 65
4- THE COMPREHENSIVE MULTI-YEAR NATIONAL IMMUNIZATION
PLAN 2012-2016
4.1-Vision statement:
Provide equitable access for children, women of childbearing age (WCBA) and throughout the life-
course of population at risk to existing and new vaccines, and other interventions that lead to reduction of
morbidity and mortality from vaccine preventable diseases in Sudan.
4.2-Mission:
To achieve at least 95% coverage for all antigens and 70% coverage for WCBA with TT2+ coverage
in order to reduce maternal, child & target population ill-health, disability and deaths attributable to
vaccine preventable diseases.
4.3 - Programme objectives and mile stones By the end of 2016:
1. To achieve and sustain 95% coverage of the third dose of Penta-valent vaccine and 70%
TT2+ nationally.
2. To increase and sustain Penta 3 coverage by improving both equitable access and utilization
of immunization services as part of integrated PHC package in all districts
3. To maintain Sudan polio-free
4. To achieve and maintain Measles elimination.
5. To contribute to and maintain NNT elimination.
6. To reduce morbidity and mortality caused by Rota virus, N. Mengitidis, S. pneumonia, Yellow
Fever.
7. To strengthen an integrated Surveillance system of VPDs/AEFI.
8. To strengthen Program managerial capacity.
9. To ensure sufficient fund for EPI activities.
Comprehensive Multi-Year National Immunization Plan 2012-2016
pg. 33 / 65
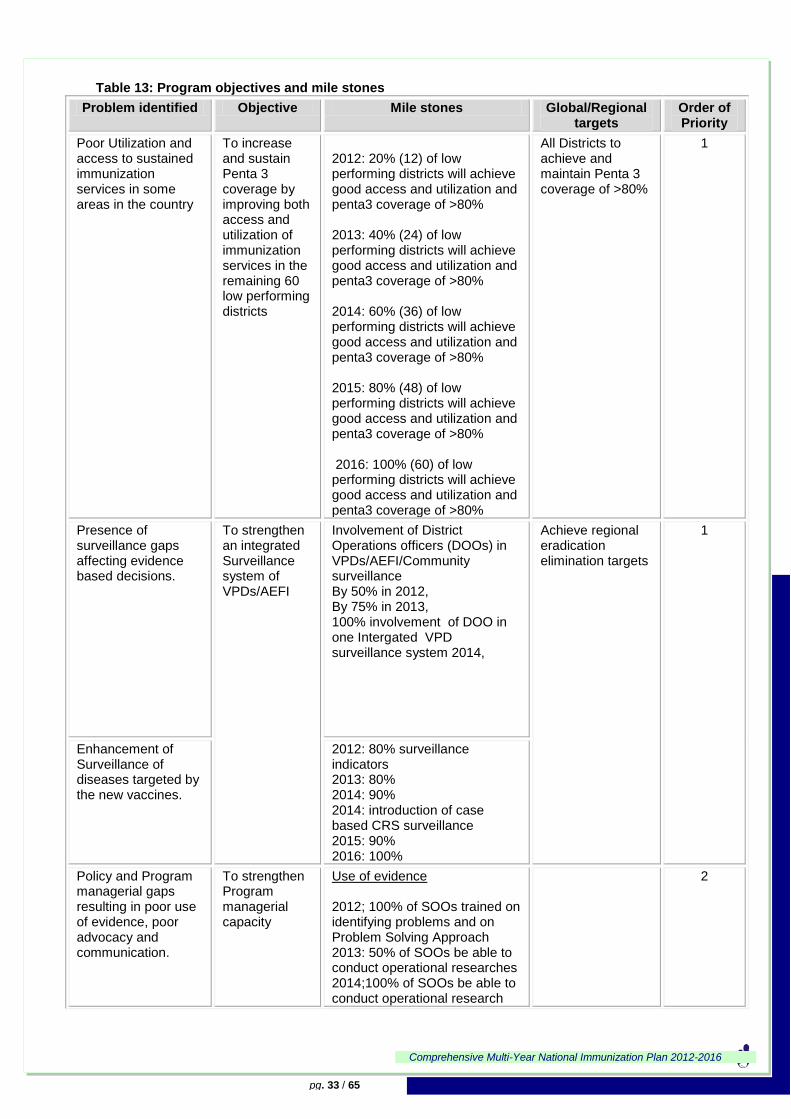
Table 13: Program objectives and mile stones
Problem identified Objective Mile stones Global/Regional targets
Order of Priority
Poor Utilization and access to sustained immunization services in some areas in the country
To increase and sustain Penta 3 coverage by improving both access and utilization of immunization services in the remaining 60 low performing districts
2012: 20% (12) of low performing districts will achieve good access and utilization and penta3 coverage of >80% 2013: 40% (24) of low performing districts will achieve good access and utilization and penta3 coverage of >80% 2014: 60% (36) of low performing districts will achieve good access and utilization and penta3 coverage of >80% 2015: 80% (48) of low performing districts will achieve good access and utilization and penta3 coverage of >80% 2016: 100% (60) of low performing districts will achieve good access and utilization and penta3 coverage of >80%
All Districts to achieve and maintain Penta 3 coverage of >80%
1
Presence of surveillance gaps affecting evidence based decisions.
To strengthen an integrated Surveillance system of VPDs/AEFI
Involvement of District Operations officers (DOOs) in VPDs/AEFI/Community surveillance By 50% in 2012, By 75% in 2013, 100% involvement of DOO in one Intergated VPD surveillance system 2014,
Achieve regional eradication elimination targets
1
Enhancement of Surveillance of diseases targeted by the new vaccines.
2012: 80% surveillance indicators 2013: 80% 2014: 90% 2014: introduction of case based CRS surveillance 2015: 90% 2016: 100%
Policy and Program managerial gaps resulting in poor use of evidence, poor advocacy and communication.
To strengthen Program managerial capacity
Use of evidence 2012; 100% of SOOs trained on identifying problems and on Problem Solving Approach 2013: 50% of SOOs be able to conduct operational researches 2014;100% of SOOs be able to conduct operational research
2
Comprehensive Multi-Year National Immunization Plan 2012-2016
pg. 34 / 65
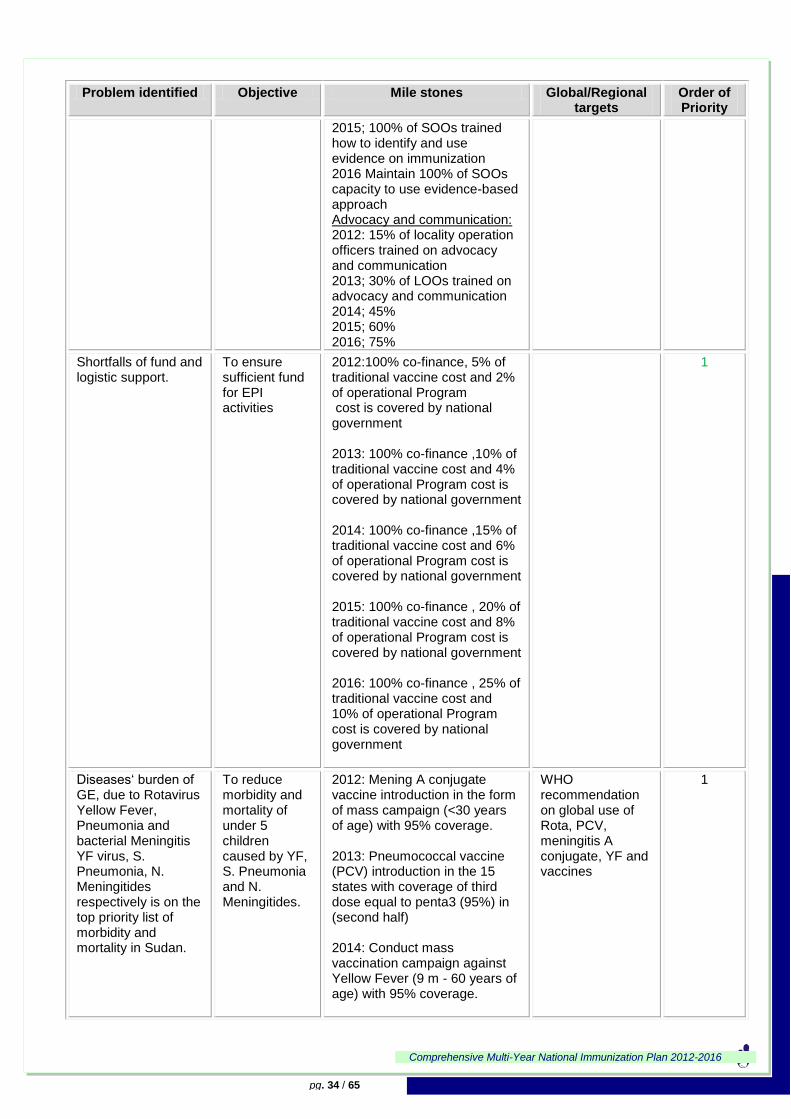
Problem identified Objective Mile stones Global/Regional targets
Order of Priority
2015; 100% of SOOs trained how to identify and use evidence on immunization 2016 Maintain 100% of SOOs capacity to use evidence-based approach Advocacy and communication: 2012: 15% of locality operation officers trained on advocacy and communication 2013; 30% of LOOs trained on advocacy and communication 2014; 45% 2015; 60% 2016; 75%
Shortfalls of fund and logistic support.
To ensure sufficient fund for EPI activities
2012:100% co-finance, 5% of traditional vaccine cost and 2% of operational Program cost is covered by national government 2013: 100% co-finance ,10% of traditional vaccine cost and 4% of operational Program cost is covered by national government 2014: 100% co-finance ,15% of traditional vaccine cost and 6% of operational Program cost is covered by national government 2015: 100% co-finance , 20% of traditional vaccine cost and 8% of operational Program cost is covered by national government 2016: 100% co-finance , 25% of traditional vaccine cost and 10% of operational Program cost is covered by national government
1
Diseases„ burden of GE, due to Rotavirus Yellow Fever, Pneumonia and bacterial Meningitis YF virus, S. Pneumonia, N. Meningitides respectively is on the top priority list of morbidity and mortality in Sudan.
To reduce morbidity and mortality of under 5 children caused by YF, S. Pneumonia and N. Meningitides.
2012: Mening A conjugate vaccine introduction in the form of mass campaign (<30 years of age) with 95% coverage. 2013: Pneumococcal vaccine (PCV) introduction in the 15 states with coverage of third dose equal to penta3 (95%) in (second half) 2014: Conduct mass vaccination campaign against Yellow Fever (9 m - 60 years of age) with 95% coverage.
WHO recommendation on global use of Rota, PCV, meningitis A conjugate, YF and vaccines
1
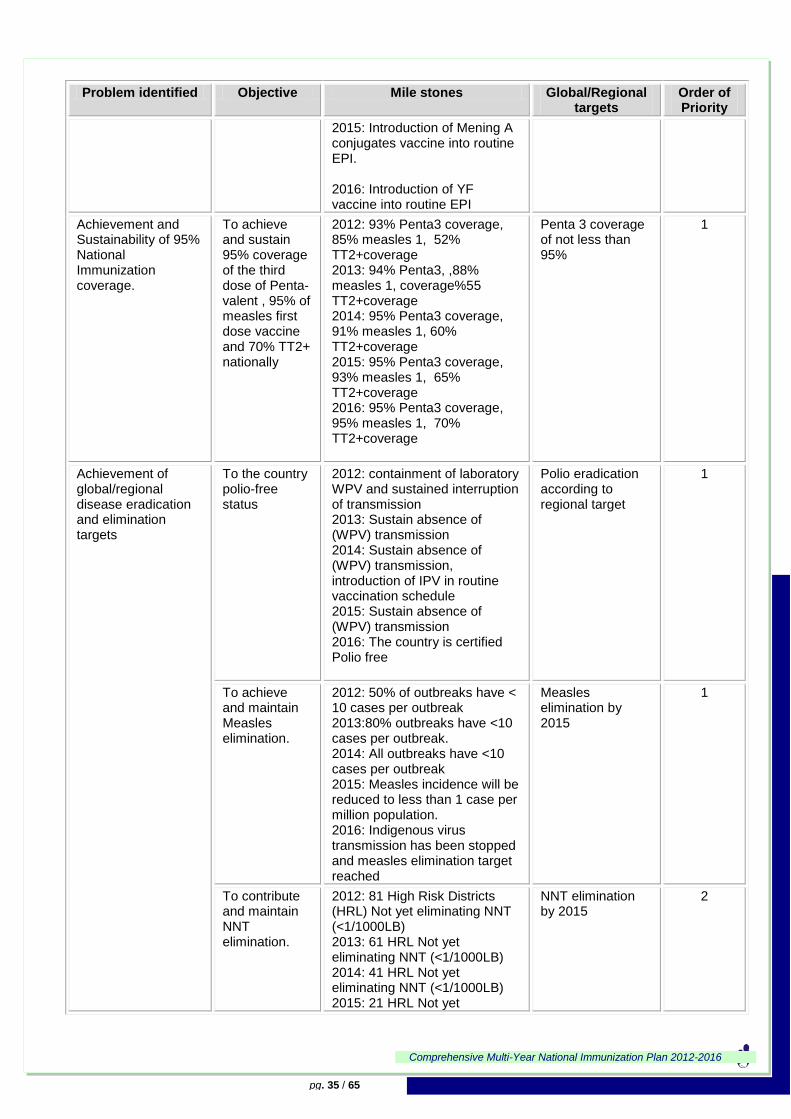
Comprehensive Multi-Year National Immunization Plan 2012-2016
pg. 35 / 65
Problem identified Objective Mile stones Global/Regional targets
Order of Priority
2015: Introduction of Mening A conjugates vaccine into routine EPI. 2016: Introduction of YF vaccine into routine EPI
Achievement and Sustainability of 95% National Immunization coverage.
To achieve and sustain 95% coverage of the third dose of Penta-valent , 95% of measles first dose vaccine and 70% TT2+ nationally
2012: 93% Penta3 coverage, 85% measles 1, 52% TT2+coverage 2013: 94% Penta3, ,88% measles 1, coverage%55 TT2+coverage 2014: 95% Penta3 coverage, 91% measles 1, 60% TT2+coverage 2015: 95% Penta3 coverage, 93% measles 1, 65% TT2+coverage 2016: 95% Penta3 coverage, 95% measles 1, 70% TT2+coverage
Penta 3 coverage of not less than 95%
1
Achievement of global/regional disease eradication and elimination targets
To the country polio-free status
2012: containment of laboratory WPV and sustained interruption of transmission 2013: Sustain absence of (WPV) transmission 2014: Sustain absence of (WPV) transmission, introduction of IPV in routine vaccination schedule 2015: Sustain absence of (WPV) transmission 2016: The country is certified Polio free
Polio eradication according to regional target
1
To achieve and maintain Measles elimination.
2012: 50% of outbreaks have < 10 cases per outbreak 2013:80% outbreaks have <10 cases per outbreak. 2014: All outbreaks have <10 cases per outbreak 2015: Measles incidence will be reduced to less than 1 case per million population. 2016: Indigenous virus transmission has been stopped and measles elimination target reached
Measles elimination by 2015
1
To contribute and maintain NNT elimination.
2012: 81 High Risk Districts (HRL) Not yet eliminating NNT (<1/1000LB) 2013: 61 HRL Not yet eliminating NNT (<1/1000LB) 2014: 41 HRL Not yet eliminating NNT (<1/1000LB) 2015: 21 HRL Not yet
NNT elimination by 2015
2
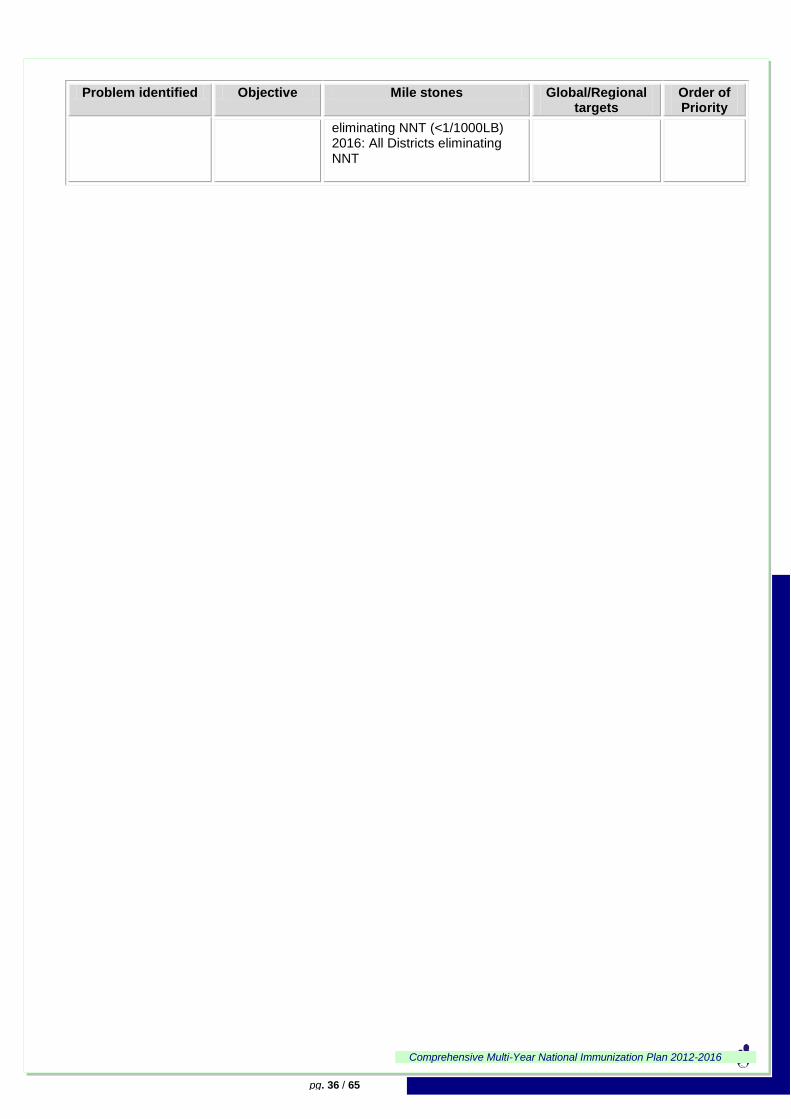
Comprehensive Multi-Year National Immunization Plan 2012-2016
pg. 36 / 65
Problem identified Objective Mile stones Global/Regional targets
Order of Priority
eliminating NNT (<1/1000LB) 2016: All Districts eliminating NNT
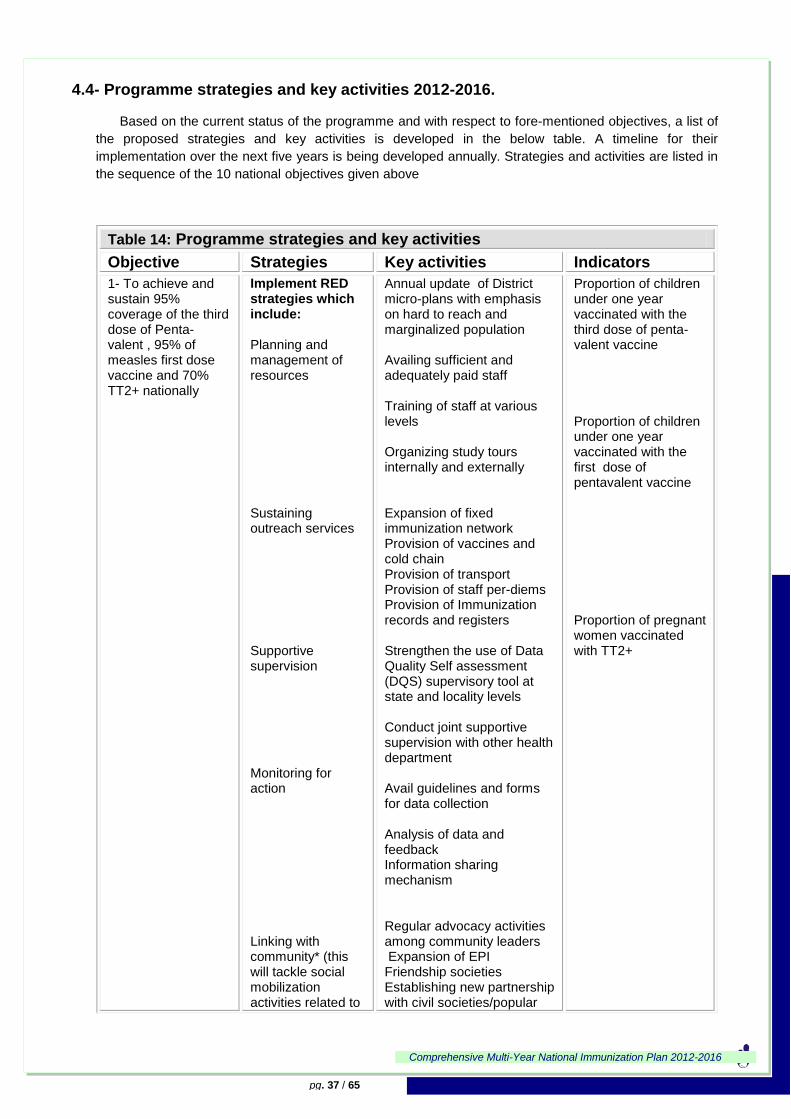
Comprehensive Multi-Year National Immunization Plan 2012-2016
pg. 37 / 65
4.4- Programme strategies and key activities 2012-2016.
Based on the current status of the programme and with respect to fore-mentioned objectives, a list of
the proposed strategies and key activities is developed in the below table. A timeline for their
implementation over the next five years is being developed annually. Strategies and activities are listed in
the sequence of the 10 national objectives given above
Table 14: Programme strategies and key activities
Objective Strategies Key activities Indicators
1- To achieve and sustain 95% coverage of the third dose of Penta-valent , 95% of measles first dose vaccine and 70% TT2+ nationally
Implement RED strategies which include: Planning and management of resources Sustaining outreach services Supportive supervision Monitoring for action Linking with community* (this will tackle social mobilization activities related to
Annual update of District micro-plans with emphasis on hard to reach and marginalized population Availing sufficient and adequately paid staff Training of staff at various levels Organizing study tours internally and externally Expansion of fixed immunization network Provision of vaccines and cold chain Provision of transport Provision of staff per-diems Provision of Immunization records and registers Strengthen the use of Data Quality Self assessment (DQS) supervisory tool at state and locality levels Conduct joint supportive supervision with other health department Avail guidelines and forms for data collection Analysis of data and feedback Information sharing mechanism Regular advocacy activities among community leaders Expansion of EPI Friendship societies Establishing new partnership with civil societies/popular
Proportion of children under one year vaccinated with the third dose of penta-valent vaccine Proportion of children under one year vaccinated with the first dose of pentavalent vaccine Proportion of pregnant women vaccinated with TT2+
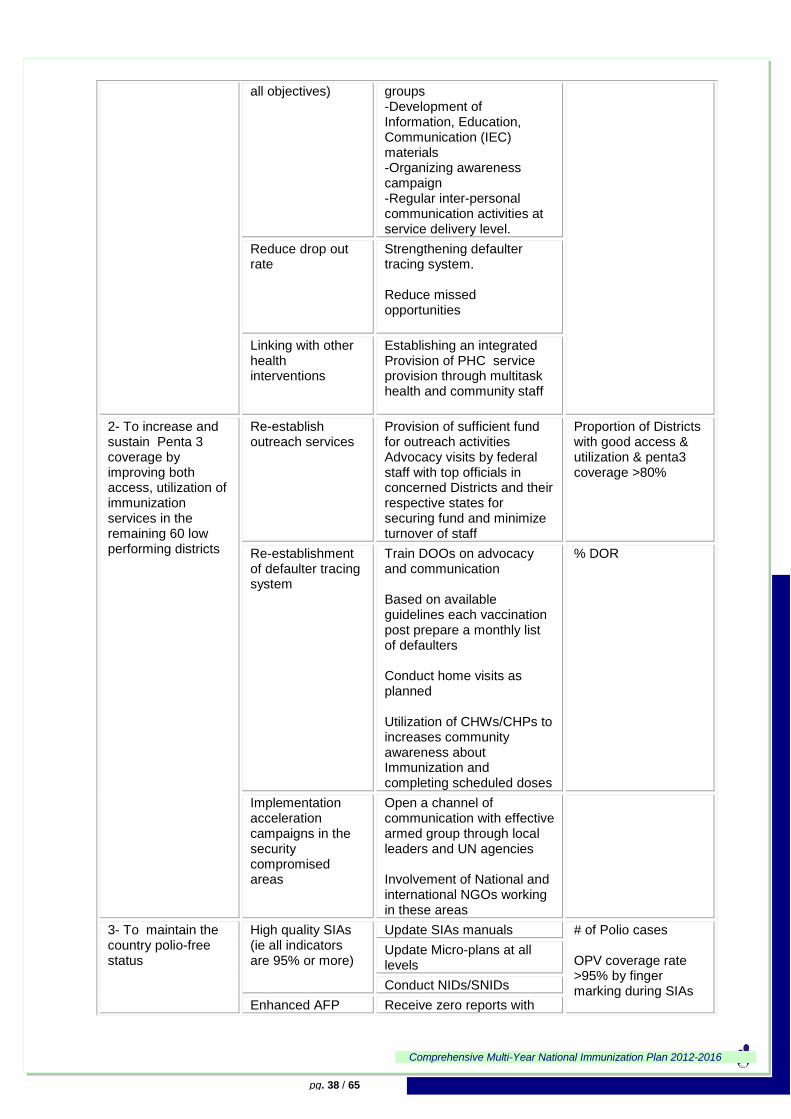
Comprehensive Multi-Year National Immunization Plan 2012-2016
pg. 38 / 65
all objectives)
groups -Development of Information, Education, Communication (IEC) materials -Organizing awareness campaign -Regular inter-personal communication activities at service delivery level.
Reduce drop out rate
Strengthening defaulter tracing system. Reduce missed opportunities
Linking with other health interventions
Establishing an integrated Provision of PHC service provision through multitask health and community staff
2- To increase and sustain Penta 3 coverage by improving both access, utilization of immunization services in the remaining 60 low performing districts
Re-establish outreach services
Provision of sufficient fund for outreach activities Advocacy visits by federal staff with top officials in concerned Districts and their respective states for securing fund and minimize turnover of staff
Proportion of Districts with good access & utilization & penta3 coverage >80%
Re-establishment of defaulter tracing system
Train DOOs on advocacy and communication Based on available guidelines each vaccination post prepare a monthly list of defaulters Conduct home visits as planned Utilization of CHWs/CHPs to increases community awareness about Immunization and completing scheduled doses
% DOR
Implementation acceleration campaigns in the security compromised areas
Open a channel of communication with effective armed group through local leaders and UN agencies Involvement of National and international NGOs working in these areas
3- To maintain the country polio-free status
High quality SIAs (ie all indicators are 95% or more)
Update SIAs manuals # of Polio cases OPV coverage rate >95% by finger marking during SIAs
Update Micro-plans at all levels
Conduct NIDs/SNIDs
Enhanced AFP Receive zero reports with
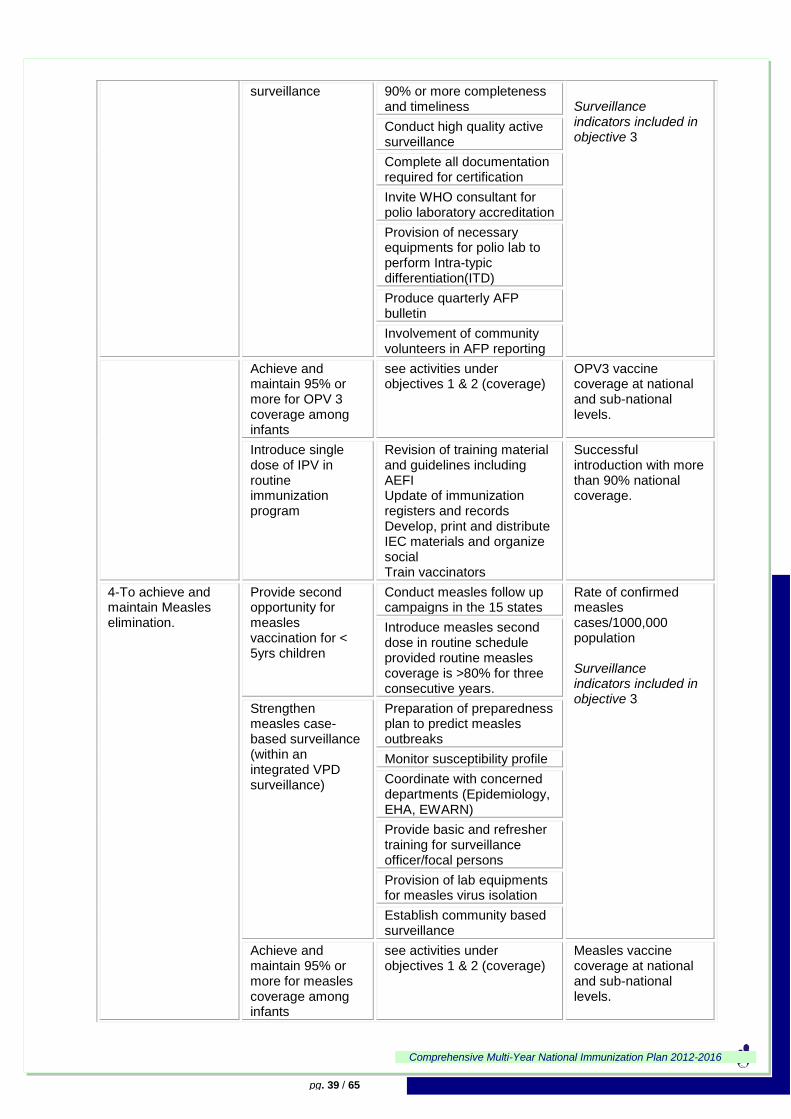
Comprehensive Multi-Year National Immunization Plan 2012-2016
pg. 39 / 65
surveillance 90% or more completeness and timeliness
Surveillance indicators included in objective 3
Conduct high quality active surveillance
Complete all documentation required for certification
Invite WHO consultant for polio laboratory accreditation
Provision of necessary equipments for polio lab to perform Intra-typic differentiation(ITD)
Produce quarterly AFP bulletin
Involvement of community volunteers in AFP reporting
Achieve and maintain 95% or more for OPV 3 coverage among infants
see activities under objectives 1 & 2 (coverage)
OPV3 vaccine coverage at national and sub-national levels.
Introduce single dose of IPV in routine immunization program
Revision of training material and guidelines including AEFI Update of immunization registers and records Develop, print and distribute IEC materials and organize social Train vaccinators
Successful introduction with more than 90% national coverage.
4-To achieve and maintain Measles elimination.
Provide second opportunity for measles vaccination for < 5yrs children
Conduct measles follow up campaigns in the 15 states
Rate of confirmed measles cases/1000,000 population Surveillance indicators included in objective 3
Introduce measles second dose in routine schedule provided routine measles coverage is >80% for three consecutive years.
Strengthen measles case-based surveillance (within an integrated VPD surveillance)
Preparation of preparedness plan to predict measles outbreaks
Monitor susceptibility profile
Coordinate with concerned departments (Epidemiology, EHA, EWARN)
Provide basic and refresher training for surveillance officer/focal persons
Provision of lab equipments for measles virus isolation
Establish community based surveillance
Achieve and maintain 95% or more for measles coverage among infants
see activities under objectives 1 & 2 (coverage)
Measles vaccine coverage at national and sub-national levels.
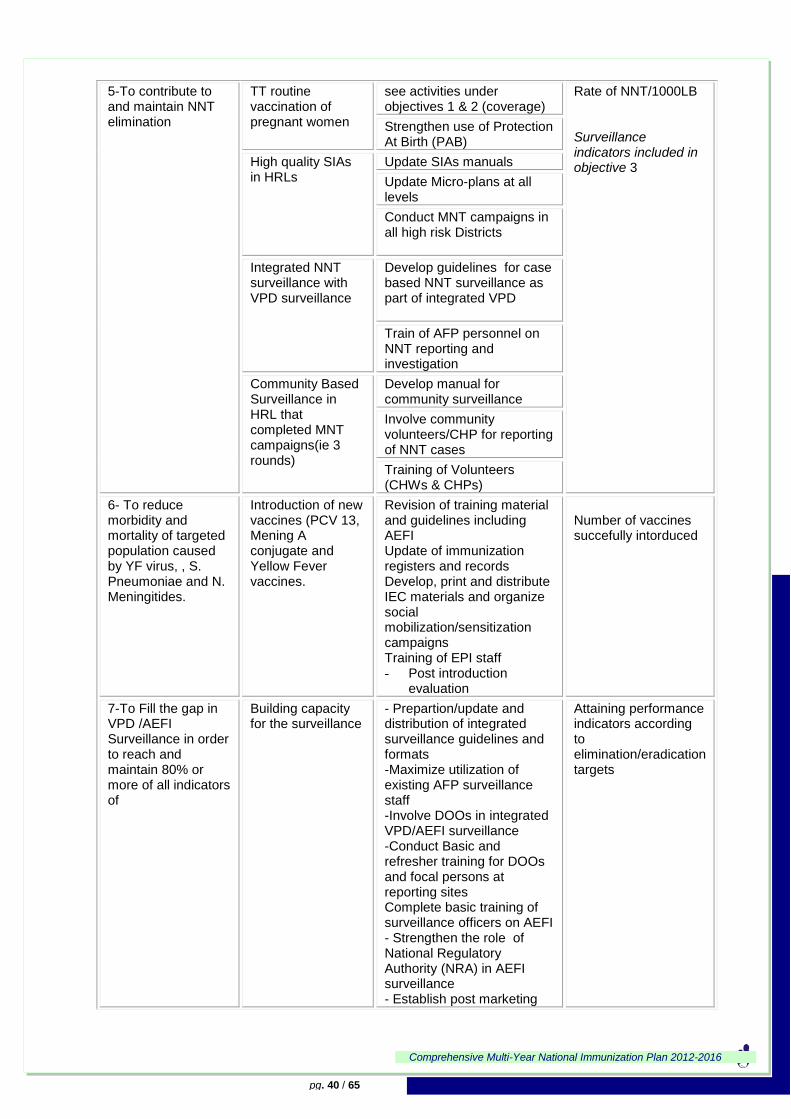
Comprehensive Multi-Year National Immunization Plan 2012-2016
pg. 40 / 65
5-To contribute to and maintain NNT elimination
TT routine vaccination of pregnant women
see activities under objectives 1 & 2 (coverage)
Rate of NNT/1000LB Surveillance indicators included in objective 3
Strengthen use of Protection At Birth (PAB)
High quality SIAs in HRLs
Update SIAs manuals
Update Micro-plans at all levels
Conduct MNT campaigns in all high risk Districts
Integrated NNT surveillance with VPD surveillance
Develop guidelines for case based NNT surveillance as part of integrated VPD
Train of AFP personnel on NNT reporting and investigation
Community Based Surveillance in HRL that completed MNT campaigns(ie 3 rounds)
Develop manual for community surveillance
Involve community volunteers/CHP for reporting of NNT cases
Training of Volunteers (CHWs & CHPs)
6- To reduce morbidity and mortality of targeted population caused by YF virus, , S. Pneumoniae and N. Meningitides.
Introduction of new vaccines (PCV 13, Mening A conjugate and Yellow Fever vaccines.
Revision of training material and guidelines including AEFI Update of immunization registers and records Develop, print and distribute IEC materials and organize social mobilization/sensitization campaigns Training of EPI staff - Post introduction
evaluation
Number of vaccines succefully intorduced
7-To Fill the gap in VPD /AEFI Surveillance in order to reach and maintain 80% or more of all indicators of
Building capacity for the surveillance
- Prepartion/update and distribution of integrated surveillance guidelines and formats -Maximize utilization of existing AFP surveillance staff -Involve DOOs in integrated VPD/AEFI surveillance -Conduct Basic and refresher training for DOOs and focal persons at reporting sites Complete basic training of surveillance officers on AEFI - Strengthen the role of National Regulatory Authority (NRA) in AEFI surveillance - Establish post marketing
Attaining performance indicators according to elimination/eradication targets
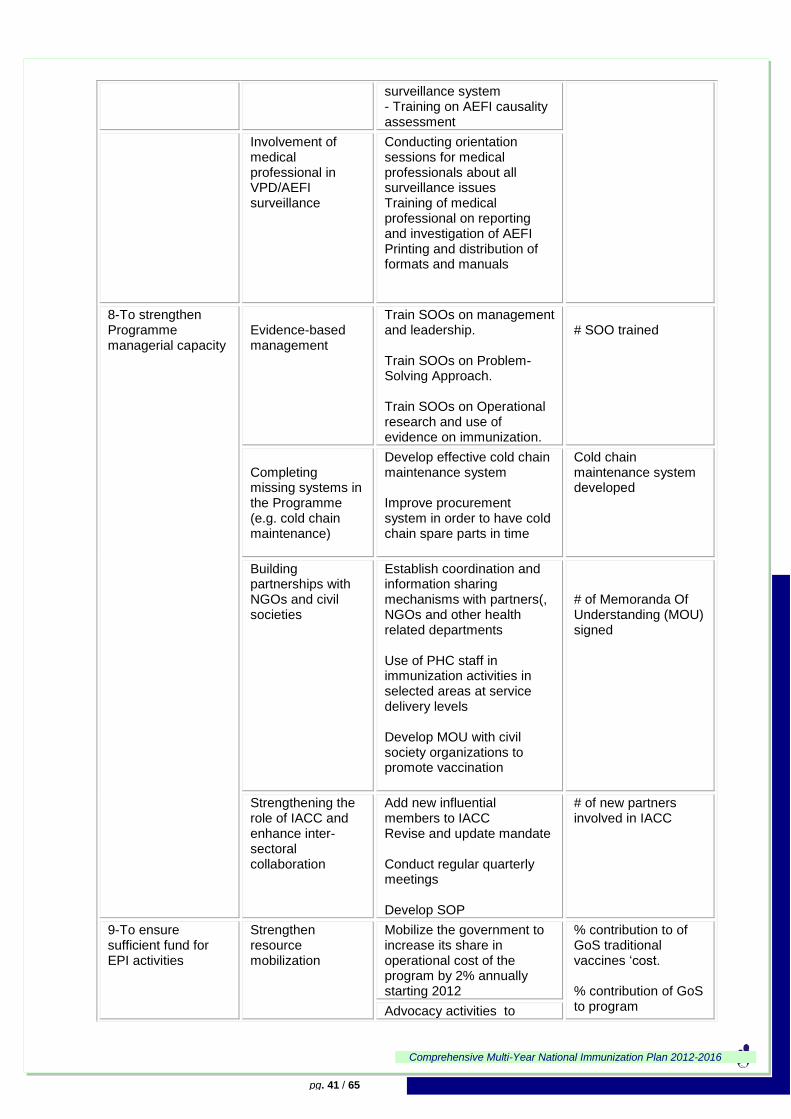
Comprehensive Multi-Year National Immunization Plan 2012-2016
pg. 41 / 65
surveillance system - Training on AEFI causality assessment
Involvement of medical professional in VPD/AEFI surveillance
Conducting orientation sessions for medical professionals about all surveillance issues Training of medical professional on reporting and investigation of AEFI Printing and distribution of formats and manuals
8-To strengthen Programme managerial capacity
Evidence-based management
Train SOOs on management and leadership. Train SOOs on Problem-Solving Approach. Train SOOs on Operational research and use of evidence on immunization.
# SOO trained
Completing missing systems in the Programme (e.g. cold chain maintenance)
Develop effective cold chain maintenance system Improve procurement system in order to have cold chain spare parts in time
Cold chain maintenance system developed
Building partnerships with NGOs and civil societies
Establish coordination and information sharing mechanisms with partners(, NGOs and other health related departments Use of PHC staff in immunization activities in selected areas at service delivery levels Develop MOU with civil society organizations to promote vaccination
# of Memoranda Of Understanding (MOU) signed
Strengthening the role of IACC and enhance inter-sectoral collaboration
Add new influential members to IACC Revise and update mandate Conduct regular quarterly meetings Develop SOP
# of new partners involved in IACC
9-To ensure sufficient fund for EPI activities
Strengthen resource mobilization
Mobilize the government to increase its share in operational cost of the program by 2% annually starting 2012
% contribution to of GoS traditional vaccines „cost. % contribution of GoS to program Advocacy activities to
Comprehensive Multi-Year National Immunization Plan 2012-2016
pg. 42 / 65
increase the GoS share in traditional vaccines cost by 5% annually starting 2012
operational cost. % contribution to new vaccines‟ cost.
Mobilize GoS fund to cover the new vaccines co-financing.
Conduct regular follow-up meetings with concerned financial departments in NMoH and FmoF
Mobilize and involve new national and international donors
Conduct national resource mobilization workshop
Prepare and submit appropriate funding proposals
Equitable resource allocation to various EPI component
Fair allocation of budget for each EPI component
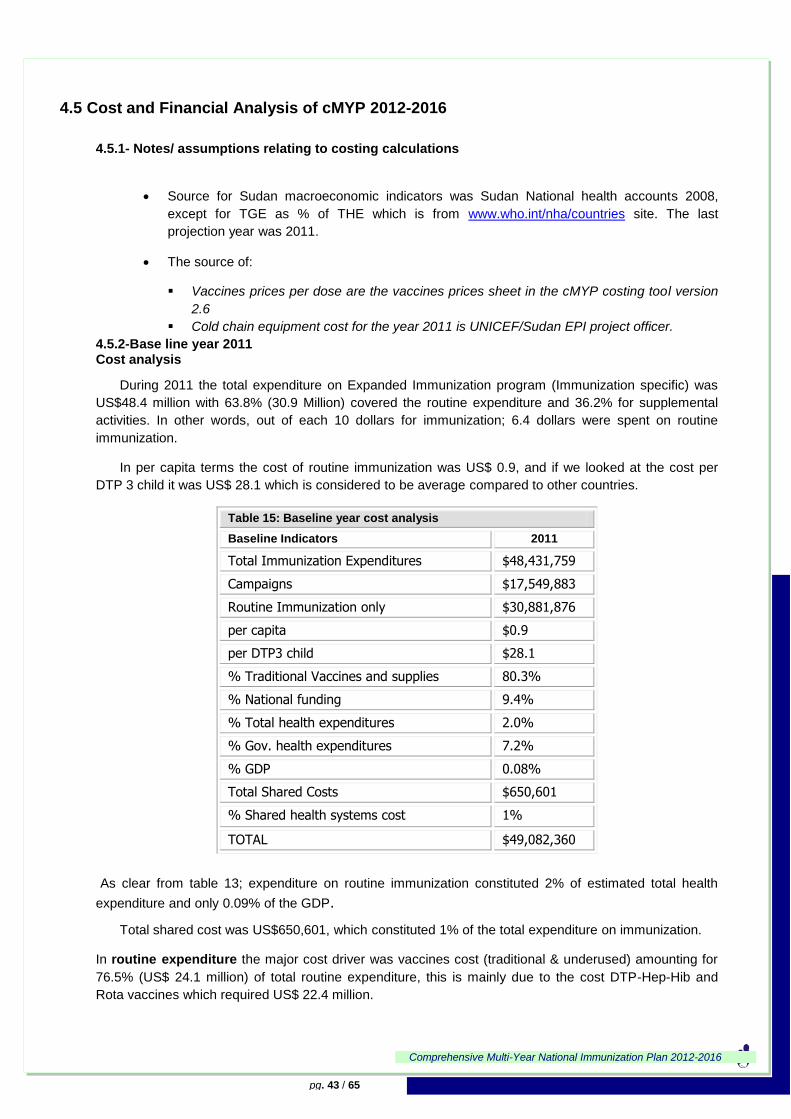
Comprehensive Multi-Year National Immunization Plan 2012-2016
pg. 43 / 65
4.5 Cost and Financial Analysis of cMYP 2012-2016
4.5.1- Notes/ assumptions relating to costing calculations
Source for Sudan macroeconomic indicators was Sudan National health accounts 2008,
except for TGE as % of THE which is from www.who.int/nha/countries site. The last
projection year was 2011.
The source of:
Vaccines prices per dose are the vaccines prices sheet in the cMYP costing tool version
2.6
Cold chain equipment cost for the year 2011 is UNICEF/Sudan EPI project officer.
4.5.2-Base line year 2011 Cost analysis
During 2011 the total expenditure on Expanded Immunization program (Immunization specific) was
US$48.4 million with 63.8% (30.9 Million) covered the routine expenditure and 36.2% for supplemental
activities. In other words, out of each 10 dollars for immunization; 6.4 dollars were spent on routine
immunization.
In per capita terms the cost of routine immunization was US$ 0.9, and if we looked at the cost per
DTP 3 child it was US$ 28.1 which is considered to be average compared to other countries.
Table 15: Baseline year cost analysis
Baseline Indicators 2011
Total Immunization Expenditures $48,431,759
Campaigns $17,549,883
Routine Immunization only $30,881,876
per capita $0.9
per DTP3 child $28.1
% Traditional Vaccines and supplies 80.3%
% National funding 9.4%
% Total health expenditures 2.0%
% Gov. health expenditures 7.2%
% GDP 0.08%
Total Shared Costs $650,601
% Shared health systems cost 1%
TOTAL $49,082,360
As clear from table 13; expenditure on routine immunization constituted 2% of estimated total health
expenditure and only 0.09% of the GDP.
Total shared cost was US$650,601, which constituted 1% of the total expenditure on immunization.
In routine expenditure the major cost driver was vaccines cost (traditional & underused) amounting for
76.5% (US$ 24.1 million) of total routine expenditure, this is mainly due to the cost DTP-Hep-Hib and
Rota vaccines which required US$ 22.4 million.
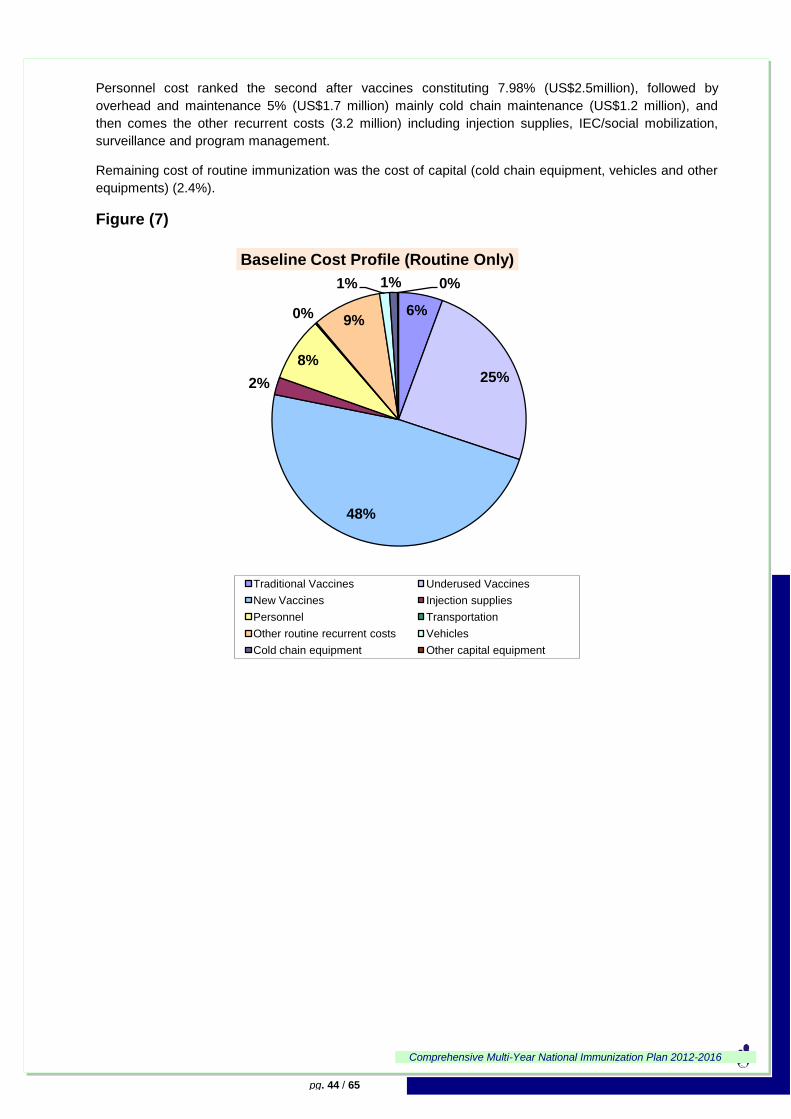
Comprehensive Multi-Year National Immunization Plan 2012-2016
pg. 44 / 65
Personnel cost ranked the second after vaccines constituting 7.98% (US$2.5million), followed by
overhead and maintenance 5% (US$1.7 million) mainly cold chain maintenance (US$1.2 million), and
then comes the other recurrent costs (3.2 million) including injection supplies, IEC/social mobilization,
surveillance and program management.
Remaining cost of routine immunization was the cost of capital (cold chain equipment, vehicles and other
equipments) (2.4%).
Figure (7)
6%
25%
48%
2%
8%
0%9%
1% 1% 0%
Baseline Cost Profile (Routine Only)
Traditional Vaccines Underused Vaccines
New Vaccines Injection supplies
Personnel Transportation
Other routine recurrent costs Vehicles
Cold chain equipment Other capital equipment
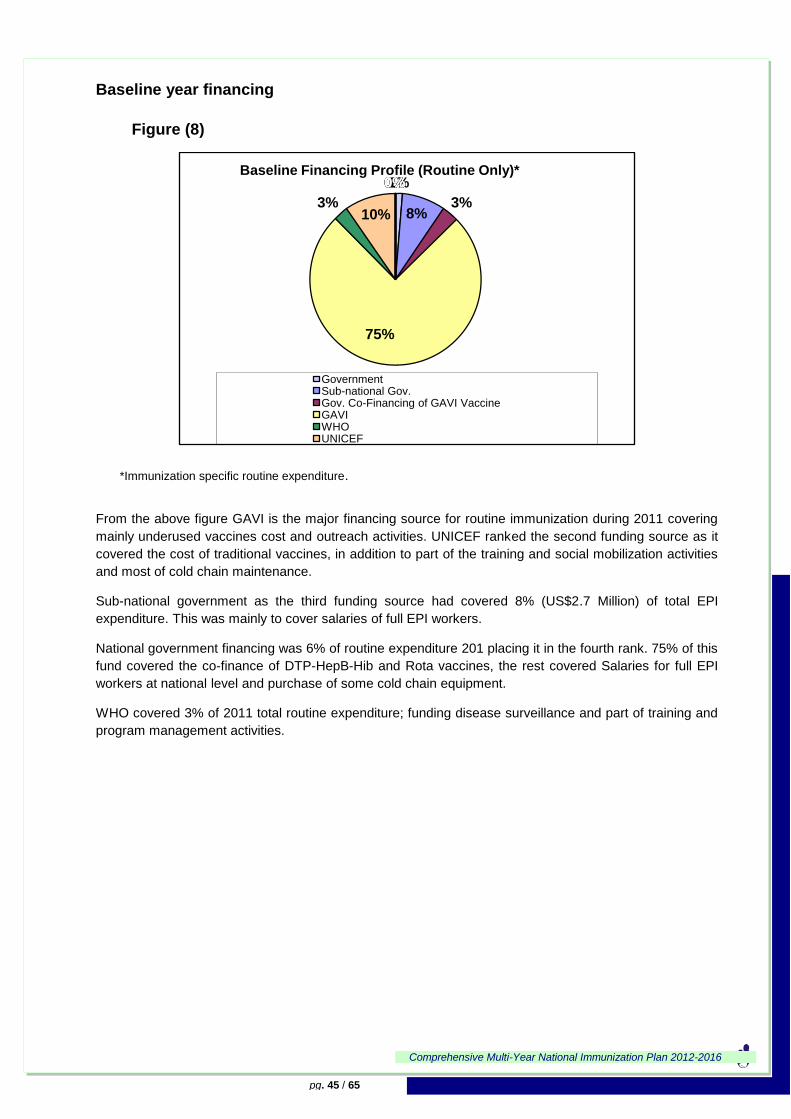
Comprehensive Multi-Year National Immunization Plan 2012-2016
pg. 45 / 65
Baseline year financing
Figure (8)
*Immunization specific routine expenditure.
From the above figure GAVI is the major financing source for routine immunization during 2011 covering
mainly underused vaccines cost and outreach activities. UNICEF ranked the second funding source as it
covered the cost of traditional vaccines, in addition to part of the training and social mobilization activities
and most of cold chain maintenance.
Sub-national government as the third funding source had covered 8% (US$2.7 Million) of total EPI
expenditure. This was mainly to cover salaries of full EPI workers.
National government financing was 6% of routine expenditure 201 placing it in the fourth rank. 75% of this
fund covered the co-finance of DTP-HepB-Hib and Rota vaccines, the rest covered Salaries for full EPI
workers at national level and purchase of some cold chain equipment.
WHO covered 3% of 2011 total routine expenditure; funding disease surveillance and part of training and
program management activities.
1%
8%3%
75%
3%10%
0%0%0%0%0%0%0%0%0%Baseline Financing Profile (Routine Only)*
GovernmentSub-national Gov.Gov. Co-Financing of GAVI VaccineGAVIWHOUNICEF
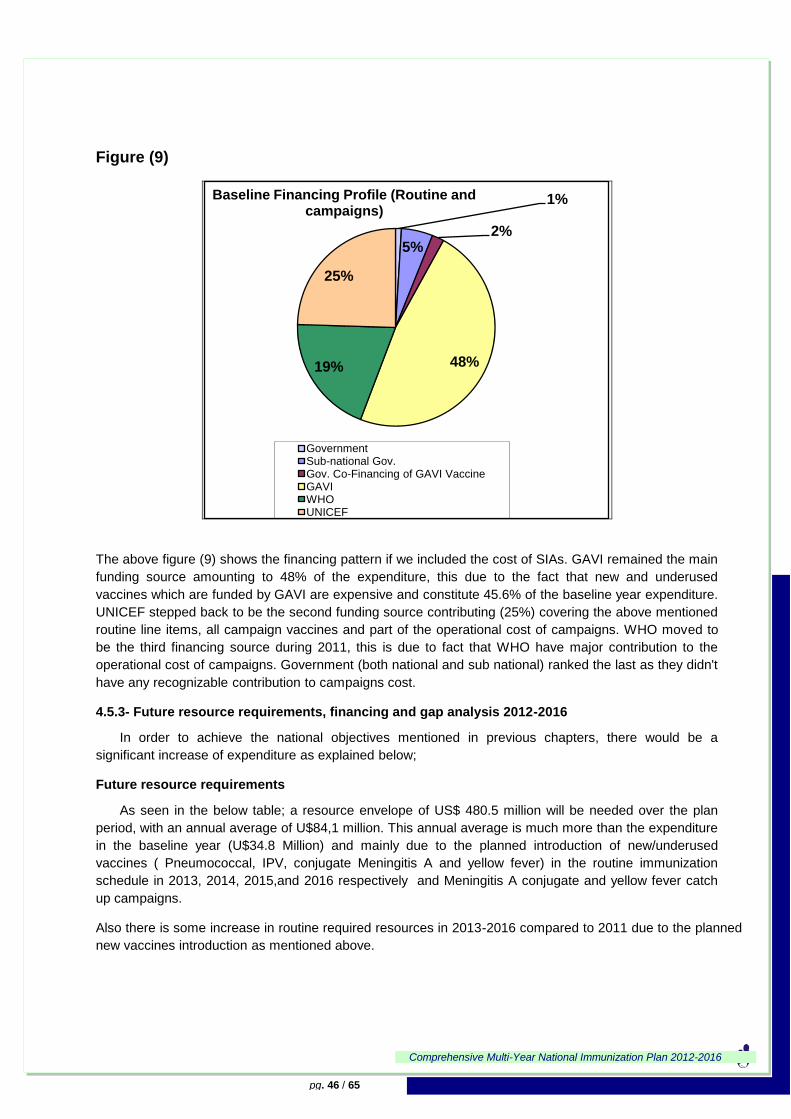
Comprehensive Multi-Year National Immunization Plan 2012-2016
pg. 46 / 65
Figure (9)
The above figure (9) shows the financing pattern if we included the cost of SIAs. GAVI remained the main
funding source amounting to 48% of the expenditure, this due to the fact that new and underused
vaccines which are funded by GAVI are expensive and constitute 45.6% of the baseline year expenditure.
UNICEF stepped back to be the second funding source contributing (25%) covering the above mentioned
routine line items, all campaign vaccines and part of the operational cost of campaigns. WHO moved to
be the third financing source during 2011, this is due to fact that WHO have major contribution to the
operational cost of campaigns. Government (both national and sub national) ranked the last as they didn't
have any recognizable contribution to campaigns cost.
4.5.3- Future resource requirements, financing and gap analysis 2012-2016
In order to achieve the national objectives mentioned in previous chapters, there would be a
significant increase of expenditure as explained below;
Future resource requirements
As seen in the below table; a resource envelope of US$ 480.5 million will be needed over the plan
period, with an annual average of U$84,1 million. This annual average is much more than the expenditure
in the baseline year (U$34.8 Million) and mainly due to the planned introduction of new/underused
vaccines ( Pneumococcal, IPV, conjugate Meningitis A and yellow fever) in the routine immunization
schedule in 2013, 2014, 2015,and 2016 respectively and Meningitis A conjugate and yellow fever catch
up campaigns.
Also there is some increase in routine required resources in 2013-2016 compared to 2011 due to the planned
new vaccines introduction as mentioned above.
1%
5%2%
48%19%
25%
Baseline Financing Profile (Routine and campaigns)
GovernmentSub-national Gov.Gov. Co-Financing of GAVI VaccineGAVIWHOUNICEF
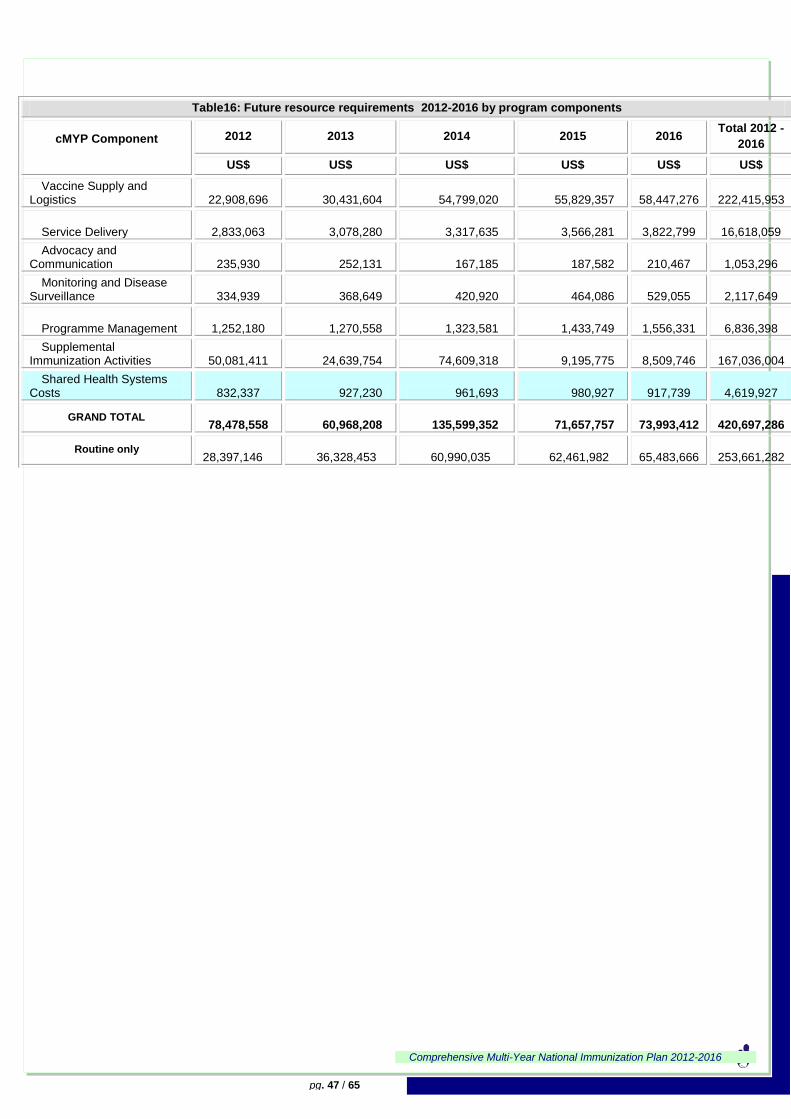
Comprehensive Multi-Year National Immunization Plan 2012-2016
pg. 47 / 65
Table16: Future resource requirements 2012-2016 by program components
cMYP Component
2012 2013 2014 2015 2016 Total 2012 -
2016
US$ US$ US$ US$ US$ US$
Vaccine Supply and Logistics
22,908,696 30,431,604 54,799,020 55,829,357
58,447,276
222,415,953
Service Delivery
2,833,063 3,078,280 3,317,635 3,566,281
3,822,799
16,618,059
Advocacy and Communication
235,930 252,131 167,185 187,582
210,467
1,053,296
Monitoring and Disease Surveillance
334,939 368,649 420,920 464,086
529,055
2,117,649
Programme Management
1,252,180 1,270,558 1,323,581 1,433,749
1,556,331
6,836,398
Supplemental Immunization Activities
50,081,411 24,639,754 74,609,318 9,195,775
8,509,746
167,036,004
Shared Health Systems Costs
832,337 927,230 961,693 980,927
917,739
4,619,927
GRAND TOTAL
78,478,558 60,968,208 135,599,352 71,657,757
73,993,412
420,697,286
Routine only 28,397,146 36,328,453 60,990,035 62,461,982
65,483,666
253,661,282
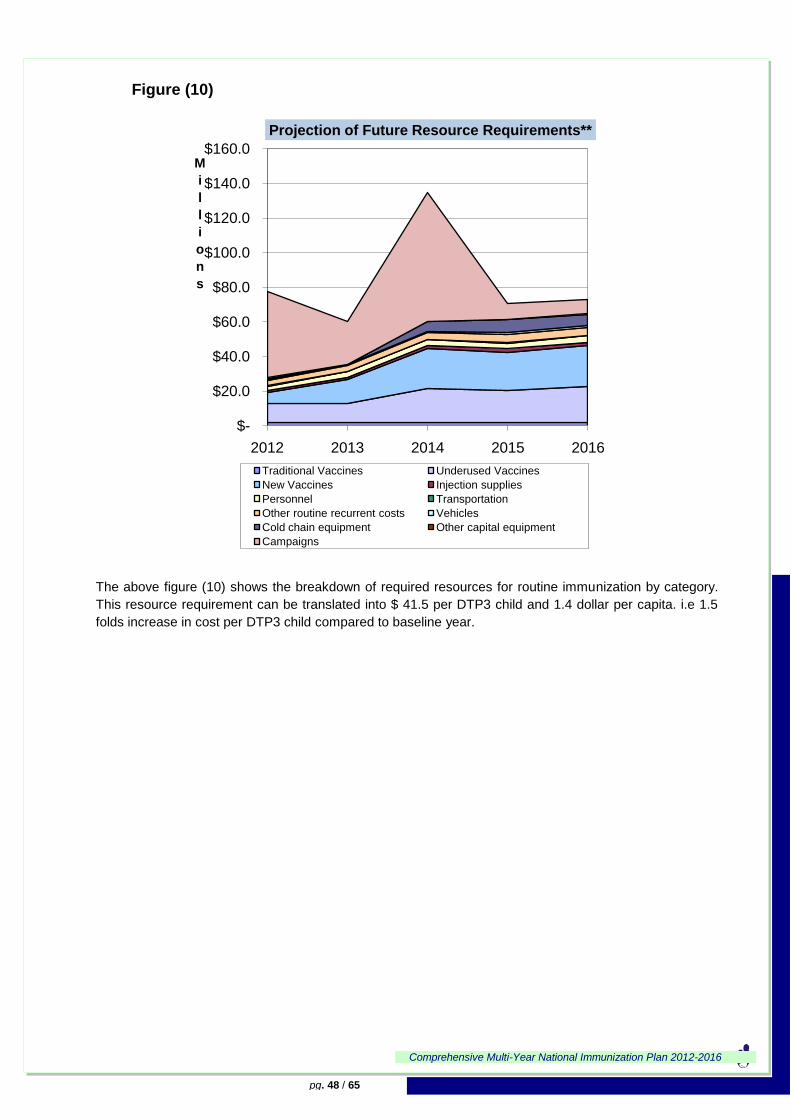
Comprehensive Multi-Year National Immunization Plan 2012-2016
pg. 48 / 65
Figure (10)
The above figure (10) shows the breakdown of required resources for routine immunization by category.
This resource requirement can be translated into $ 41.5 per DTP3 child and 1.4 dollar per capita. i.e 1.5
folds increase in cost per DTP3 child compared to baseline year.
$-
$20.0
$40.0
$60.0
$80.0
$100.0
$120.0
$140.0
$160.0
2012 2013 2014 2015 2016
M
i
l
l
i
o
n
s
Projection of Future Resource Requirements**
Traditional Vaccines Underused Vaccines
New Vaccines Injection supplies
Personnel Transportation
Other routine recurrent costs Vehicles
Cold chain equipment Other capital equipment
Campaigns
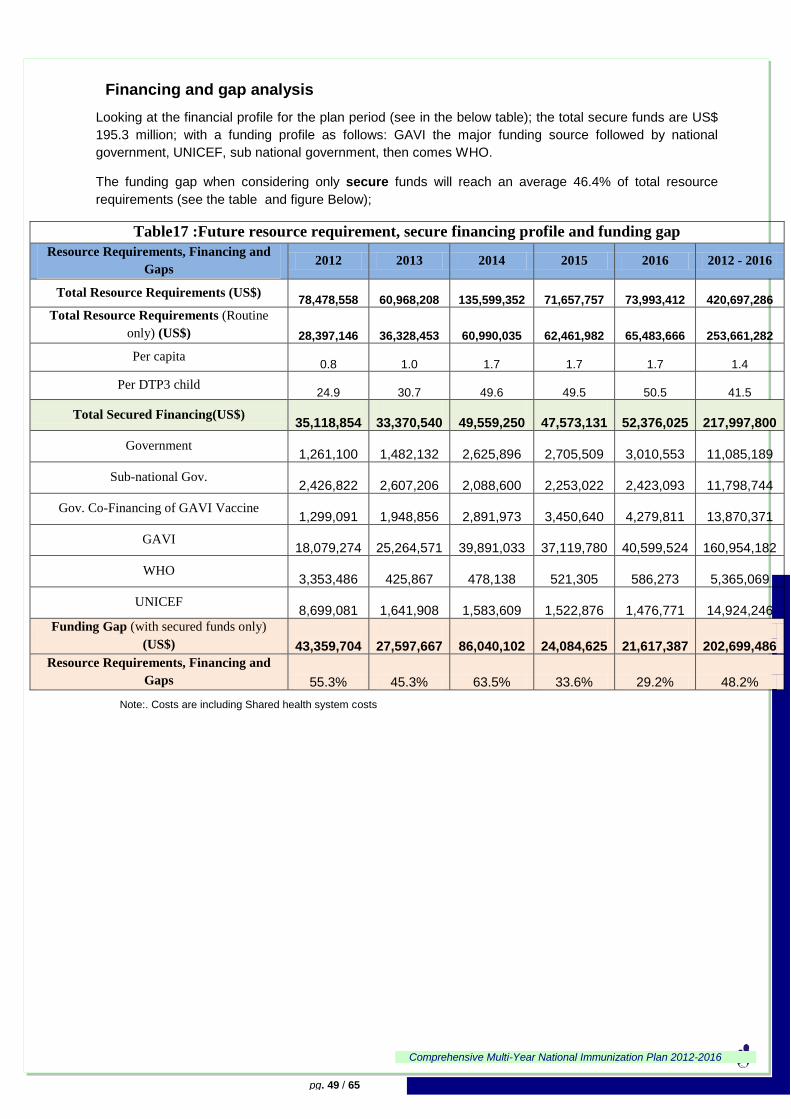
Comprehensive Multi-Year National Immunization Plan 2012-2016
pg. 49 / 65
Financing and gap analysis
Looking at the financial profile for the plan period (see in the below table); the total secure funds are US$
195.3 million; with a funding profile as follows: GAVI the major funding source followed by national
government, UNICEF, sub national government, then comes WHO.
The funding gap when considering only secure funds will reach an average 46.4% of total resource
requirements (see the table and figure Below);
Table17 :Future resource requirement, secure financing profile and funding gap
Resource Requirements, Financing and
Gaps 2012 2013 2014 2015 2016 2012 - 2016
Total Resource Requirements (US$)
78,478,558
60,968,208
135,599,352
71,657,757
73,993,412
420,697,286
Total Resource Requirements (Routine
only) (US$)
28,397,146
36,328,453
60,990,035
62,461,982
65,483,666
253,661,282
Per capita 0.8
1.0
1.7
1.7
1.7
1.4
Per DTP3 child 24.9
30.7
49.6
49.5
50.5
41.5
Total Secured Financing(US$)
35,118,854
33,370,540
49,559,250
47,573,131
52,376,025
217,997,800
Government
1,261,100
1,482,132
2,625,896
2,705,509
3,010,553
11,085,189
Sub-national Gov.
2,426,822
2,607,206
2,088,600
2,253,022
2,423,093
11,798,744
Gov. Co-Financing of GAVI Vaccine
1,299,091
1,948,856
2,891,973
3,450,640
4,279,811
13,870,371
GAVI
18,079,274
25,264,571
39,891,033
37,119,780
40,599,524
160,954,182
WHO
3,353,486
425,867
478,138
521,305
586,273
5,365,069
UNICEF
8,699,081
1,641,908
1,583,609
1,522,876
1,476,771
14,924,246
Funding Gap (with secured funds only)
(US$)
43,359,704
27,597,667
86,040,102
24,084,625
21,617,387
202,699,486
Resource Requirements, Financing and
Gaps 55.3% 45.3% 63.5% 33.6% 29.2% 48.2%
Note:. Costs are including Shared health system costs
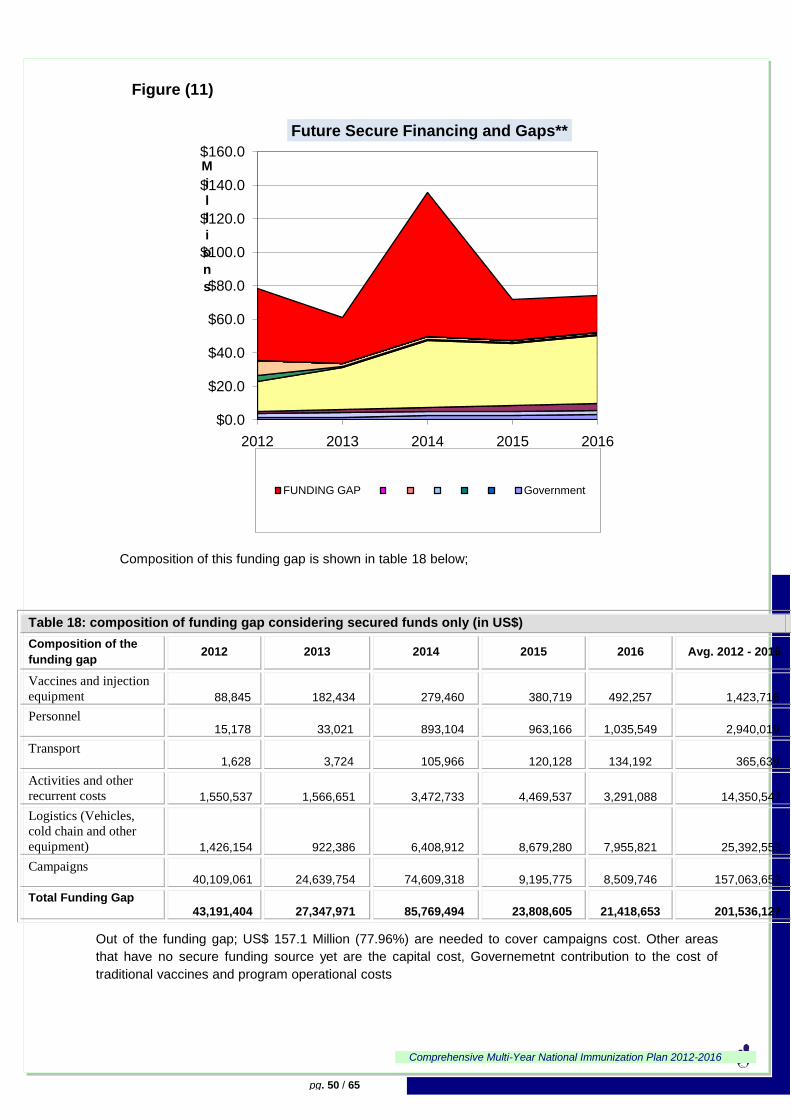
Comprehensive Multi-Year National Immunization Plan 2012-2016
pg. 50 / 65
Figure (11)
Composition of this funding gap is shown in table 18 below;
Table 18: composition of funding gap considering secured funds only (in US$)
Composition of the
funding gap 2012 2013 2014 2015 2016 Avg. 2012 - 2016
Vaccines and injection
equipment 88,845 182,434 279,460 380,719
492,257 1,423,716
Personnel 15,178 33,021 893,104 963,166
1,035,549 2,940,019
Transport 1,628 3,724 105,966 120,128
134,192 365,639
Activities and other
recurrent costs 1,550,537 1,566,651 3,472,733 4,469,537
3,291,088 14,350,547
Logistics (Vehicles,
cold chain and other
equipment) 1,426,154 922,386 6,408,912 8,679,280
7,955,821 25,392,553
Campaigns 40,109,061 24,639,754 74,609,318 9,195,775
8,509,746 157,063,653
Total Funding Gap 43,191,404 27,347,971 85,769,494 23,808,605
21,418,653 201,536,127
Out of the funding gap; US$ 157.1 Million (77.96%) are needed to cover campaigns cost. Other areas
that have no secure funding source yet are the capital cost, Governemetnt contribution to the cost of
traditional vaccines and program operational costs
$0.0
$20.0
$40.0
$60.0
$80.0
$100.0
$120.0
$140.0
$160.0
2012 2013 2014 2015 2016
M
i
l
l
i
o
n
s
Future Secure Financing and Gaps**
FUNDING GAP Government
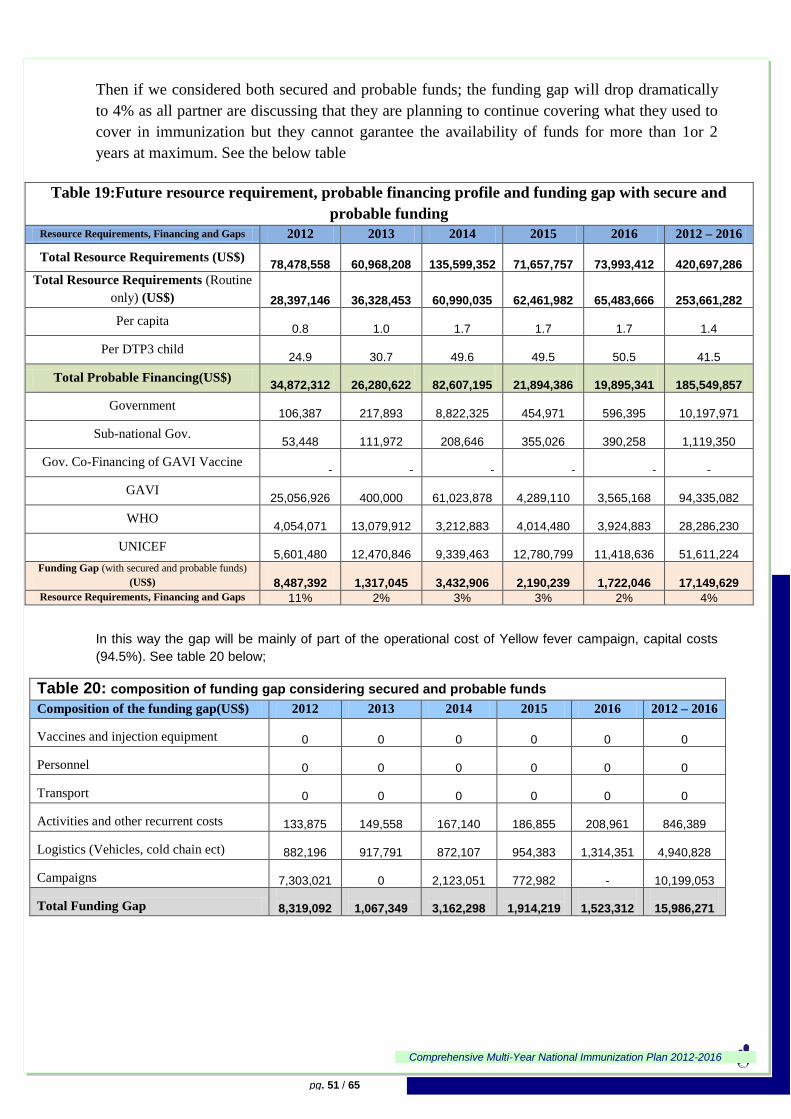
Comprehensive Multi-Year National Immunization Plan 2012-2016
pg. 51 / 65
Then if we considered both secured and probable funds; the funding gap will drop dramatically
to 4% as all partner are discussing that they are planning to continue covering what they used to
cover in immunization but they cannot garantee the availability of funds for more than 1or 2
years at maximum. See the below table
Table 19:Future resource requirement, probable financing profile and funding gap with secure and
probable funding
Resource Requirements, Financing and Gaps 2012 2013 2014 2015 2016 2012 – 2016
Total Resource Requirements (US$)
78,478,558
60,968,208
135,599,352
71,657,757
73,993,412
420,697,286
Total Resource Requirements (Routine
only) (US$)
28,397,146
36,328,453
60,990,035
62,461,982
65,483,666
253,661,282
Per capita 0.8
1.0
1.7
1.7
1.7
1.4
Per DTP3 child 24.9
30.7
49.6
49.5
50.5
41.5
Total Probable Financing(US$)
34,872,312
26,280,622
82,607,195
21,894,386
19,895,341
185,549,857
Government 106,387
217,893
8,822,325
454,971
596,395
10,197,971
Sub-national Gov. 53,448
111,972
208,646
355,026
390,258
1,119,350
Gov. Co-Financing of GAVI Vaccine - - - - -
-
GAVI 25,056,926
400,000
61,023,878
4,289,110
3,565,168
94,335,082
WHO 4,054,071
13,079,912
3,212,883
4,014,480
3,924,883
28,286,230
UNICEF 5,601,480
12,470,846
9,339,463
12,780,799
11,418,636
51,611,224
Funding Gap (with secured and probable funds)
(US$)
8,487,392
1,317,045
3,432,906
2,190,239
1,722,046
17,149,629
Resource Requirements, Financing and Gaps 11% 2% 3% 3% 2% 4%
In this way the gap will be mainly of part of the operational cost of Yellow fever campaign, capital costs
(94.5%). See table 20 below;
Table 20: composition of funding gap considering secured and probable funds
Composition of the funding gap(US$) 2012 2013 2014 2015 2016 2012 – 2016
Vaccines and injection equipment
0
0
0
0
0
0
Personnel
0
0
0
0
0
0
Transport
0
0
0
0
0
0
Activities and other recurrent costs
133,875
149,558
167,140
186,855
208,961
846,389
Logistics (Vehicles, cold chain ect)
882,196
917,791
872,107
954,383
1,314,351
4,940,828
Campaigns
7,303,021
0
2,123,051
772,982 -
10,199,053
Total Funding Gap
8,319,092
1,067,349
3,162,298
1,914,219
1,523,312
15,986,271
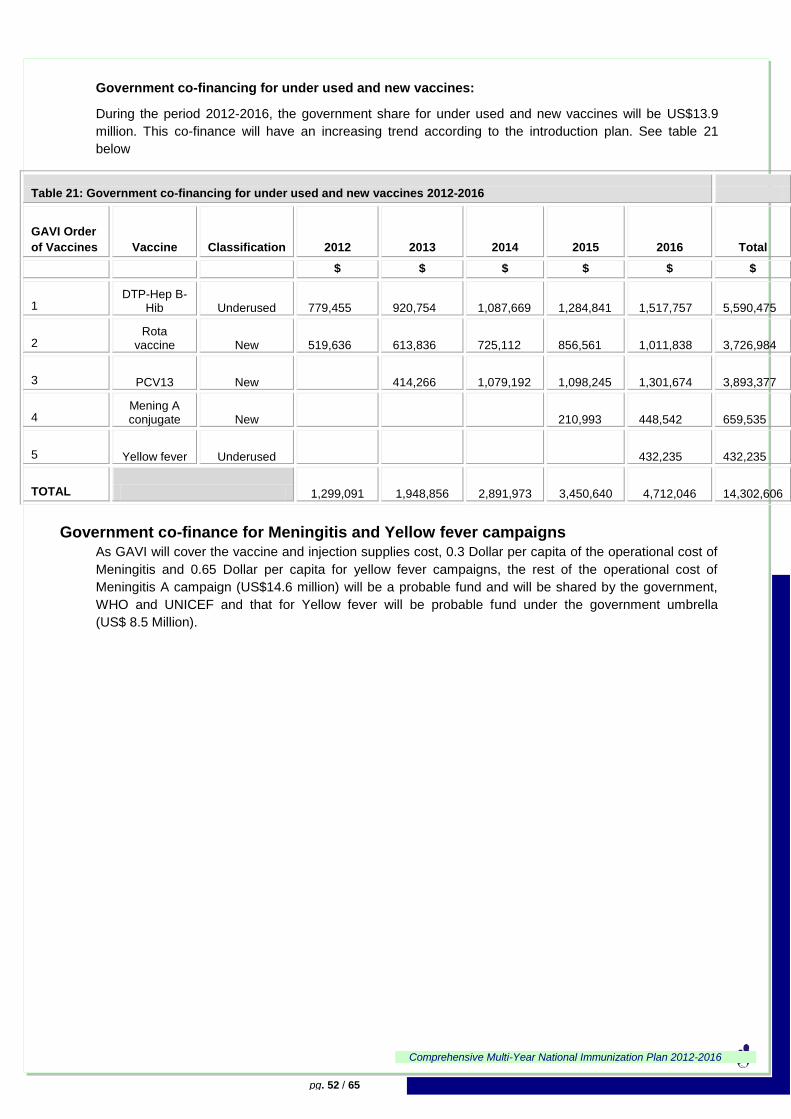
Comprehensive Multi-Year National Immunization Plan 2012-2016
pg. 52 / 65
Government co-financing for under used and new vaccines:
During the period 2012-2016, the government share for under used and new vaccines will be US$13.9
million. This co-finance will have an increasing trend according to the introduction plan. See table 21
below
Table 21: Government co-financing for under used and new vaccines 2012-2016
GAVI Order
of Vaccines Vaccine Classification 2012 2013 2014 2015 2016 Total
$ $ $ $ $ $
1 DTP-Hep B-
Hib Underused 779,455 920,754 1,087,669 1,284,841 1,517,757 5,590,475
2 Rota
vaccine New 519,636 613,836 725,112 856,561 1,011,838 3,726,984
3 PCV13 New 414,266 1,079,192 1,098,245 1,301,674 3,893,377
4 Mening A conjugate New 210,993 448,542
659,535
5 Yellow fever Underused 432,235 432,235
TOTAL 1,299,091 1,948,856 2,891,973 3,450,640 4,712,046 14,302,606
Government co-finance for Meningitis and Yellow fever campaigns As GAVI will cover the vaccine and injection supplies cost, 0.3 Dollar per capita of the operational cost of
Meningitis and 0.65 Dollar per capita for yellow fever campaigns, the rest of the operational cost of
Meningitis A campaign (US$14.6 million) will be a probable fund and will be shared by the government,
WHO and UNICEF and that for Yellow fever will be probable fund under the government umbrella
(US$ 8.5 Million).
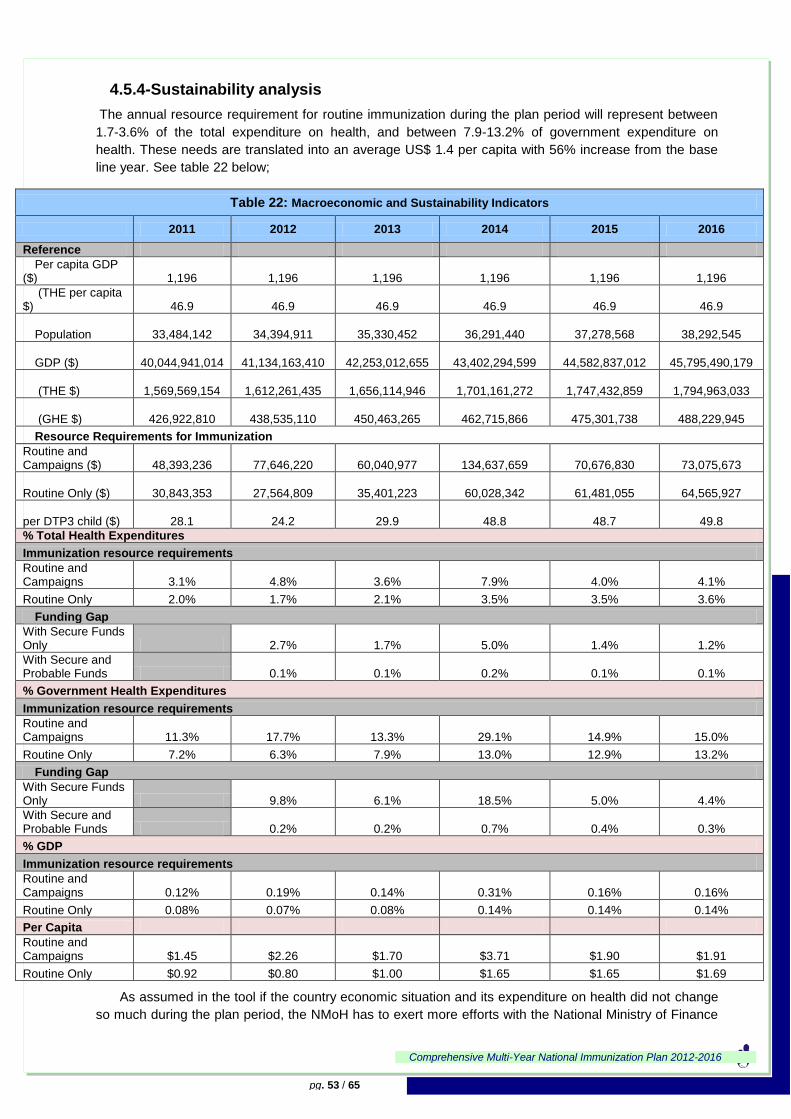
Comprehensive Multi-Year National Immunization Plan 2012-2016
pg. 53 / 65
4.5.4-Sustainability analysis
The annual resource requirement for routine immunization during the plan period will represent between
1.7-3.6% of the total expenditure on health, and between 7.9-13.2% of government expenditure on
health. These needs are translated into an average US$ 1.4 per capita with 56% increase from the base
line year. See table 22 below;
Table 22: Macroeconomic and Sustainability Indicators
2011 2012 2013 2014 2015 2016
Reference
Per capita GDP ($)
1,196
1,196
1,196
1,196
1,196
1,196
(THE per capita $)
46.9
46.9
46.9
46.9
46.9
46.9
Population
33,484,142
34,394,911
35,330,452
36,291,440
37,278,568
38,292,545
GDP ($)
40,044,941,014
41,134,163,410
42,253,012,655
43,402,294,599
44,582,837,012
45,795,490,179
(THE $)
1,569,569,154
1,612,261,435
1,656,114,946
1,701,161,272
1,747,432,859
1,794,963,033
(GHE $)
426,922,810
438,535,110
450,463,265
462,715,866
475,301,738
488,229,945
Resource Requirements for Immunization
Routine and Campaigns ($)
48,393,236
77,646,220
60,040,977
134,637,659
70,676,830
73,075,673
Routine Only ($)
30,843,353
27,564,809
35,401,223
60,028,342
61,481,055
64,565,927
per DTP3 child ($)
28.1
24.2
29.9
48.8
48.7
49.8
% Total Health Expenditures
Immunization resource requirements
Routine and Campaigns 3.1% 4.8% 3.6% 7.9% 4.0% 4.1%
Routine Only 2.0% 1.7% 2.1% 3.5% 3.5% 3.6%
Funding Gap
With Secure Funds Only 2.7% 1.7% 5.0% 1.4% 1.2%
With Secure and Probable Funds 0.1% 0.1% 0.2% 0.1% 0.1%
% Government Health Expenditures
Immunization resource requirements
Routine and Campaigns 11.3% 17.7% 13.3% 29.1% 14.9% 15.0%
Routine Only 7.2% 6.3% 7.9% 13.0% 12.9% 13.2%
Funding Gap
With Secure Funds Only 9.8% 6.1% 18.5% 5.0% 4.4%
With Secure and Probable Funds 0.2% 0.2% 0.7% 0.4% 0.3%
% GDP
Immunization resource requirements
Routine and Campaigns 0.12% 0.19% 0.14% 0.31% 0.16% 0.16%
Routine Only 0.08% 0.07% 0.08% 0.14% 0.14% 0.14%
Per Capita
Routine and Campaigns $1.45 $2.26 $1.70 $3.71 $1.90 $1.91
Routine Only $0.92 $0.80 $1.00 $1.65 $1.65 $1.69
As assumed in the tool if the country economic situation and its expenditure on health did not change
so much during the plan period, the NMoH has to exert more efforts with the National Ministry of Finance
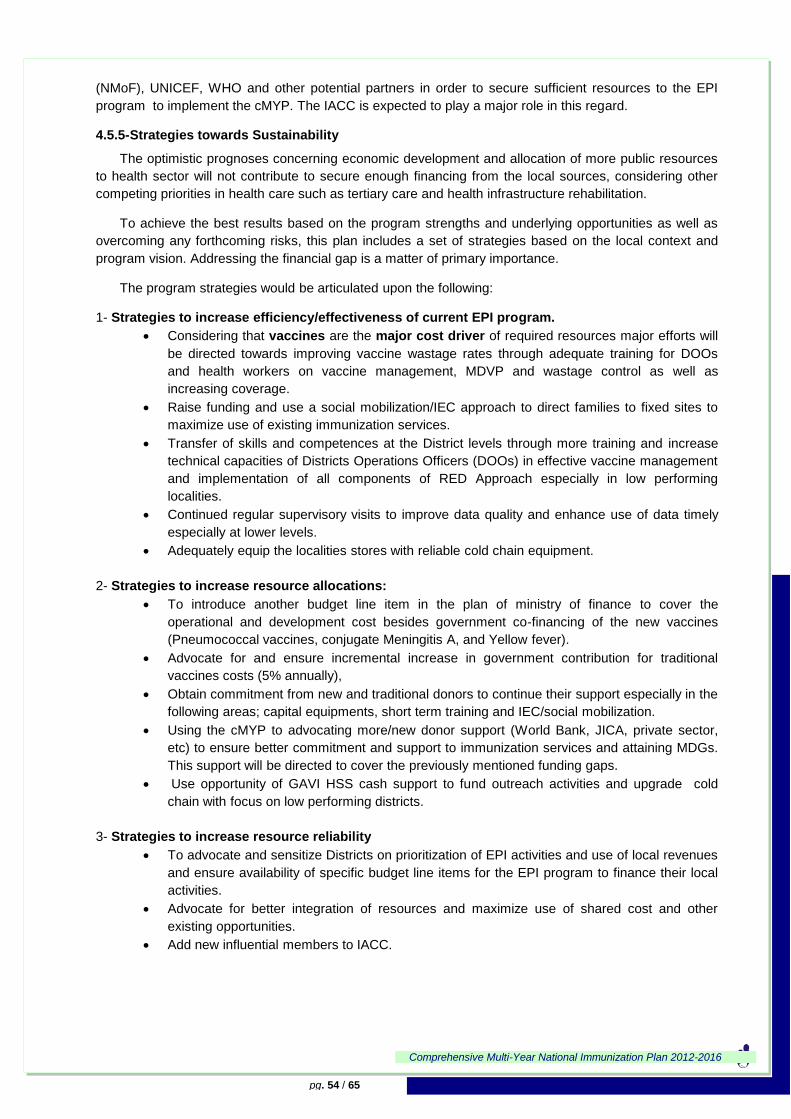
Comprehensive Multi-Year National Immunization Plan 2012-2016
pg. 54 / 65
(NMoF), UNICEF, WHO and other potential partners in order to secure sufficient resources to the EPI
program to implement the cMYP. The IACC is expected to play a major role in this regard.
4.5.5-Strategies towards Sustainability
The optimistic prognoses concerning economic development and allocation of more public resources
to health sector will not contribute to secure enough financing from the local sources, considering other
competing priorities in health care such as tertiary care and health infrastructure rehabilitation.
To achieve the best results based on the program strengths and underlying opportunities as well as
overcoming any forthcoming risks, this plan includes a set of strategies based on the local context and
program vision. Addressing the financial gap is a matter of primary importance.
The program strategies would be articulated upon the following:
1- Strategies to increase efficiency/effectiveness of current EPI program.
Considering that vaccines are the major cost driver of required resources major efforts will
be directed towards improving vaccine wastage rates through adequate training for DOOs
and health workers on vaccine management, MDVP and wastage control as well as
increasing coverage.
Raise funding and use a social mobilization/IEC approach to direct families to fixed sites to
maximize use of existing immunization services.
Transfer of skills and competences at the District levels through more training and increase
technical capacities of Districts Operations Officers (DOOs) in effective vaccine management
and implementation of all components of RED Approach especially in low performing
localities.
Continued regular supervisory visits to improve data quality and enhance use of data timely
especially at lower levels.
Adequately equip the localities stores with reliable cold chain equipment.
2- Strategies to increase resource allocations:
To introduce another budget line item in the plan of ministry of finance to cover the
operational and development cost besides government co-financing of the new vaccines
(Pneumococcal vaccines, conjugate Meningitis A, and Yellow fever).
Advocate for and ensure incremental increase in government contribution for traditional
vaccines costs (5% annually),
Obtain commitment from new and traditional donors to continue their support especially in the
following areas; capital equipments, short term training and IEC/social mobilization.
Using the cMYP to advocating more/new donor support (World Bank, JICA, private sector,
etc) to ensure better commitment and support to immunization services and attaining MDGs.
This support will be directed to cover the previously mentioned funding gaps.
Use opportunity of GAVI HSS cash support to fund outreach activities and upgrade cold
chain with focus on low performing districts.
3- Strategies to increase resource reliability
To advocate and sensitize Districts on prioritization of EPI activities and use of local revenues
and ensure availability of specific budget line items for the EPI program to finance their local
activities.
Advocate for better integration of resources and maximize use of shared cost and other
existing opportunities.
Add new influential members to IACC.
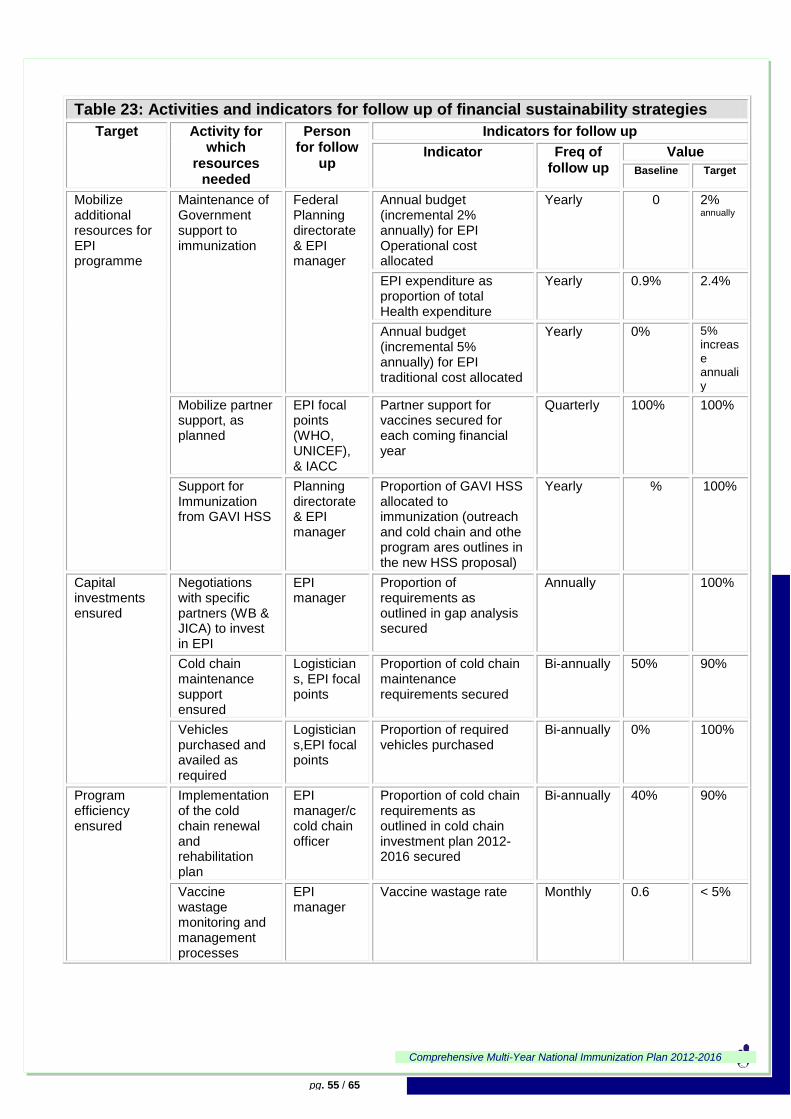
Comprehensive Multi-Year National Immunization Plan 2012-2016
pg. 55 / 65
Table 23: Activities and indicators for follow up of financial sustainability strategies
Target Activity for which
resources needed
Person for follow
up
Indicators for follow up
Indicator Freq of follow up
Value
Baseline Target
Mobilize additional resources for EPI programme
Maintenance of Government support to immunization
Federal Planning directorate & EPI manager
Annual budget (incremental 2% annually) for EPI Operational cost allocated
Yearly 0 2% annually
EPI expenditure as proportion of total Health expenditure
Yearly 0.9% 2.4%
Annual budget (incremental 5% annually) for EPI traditional cost allocated
Yearly 0% 5% increase annualiy
Mobilize partner support, as planned
EPI focal points (WHO, UNICEF), & IACC
Partner support for vaccines secured for each coming financial year
Quarterly 100% 100%
Support for Immunization from GAVI HSS
Planning directorate & EPI manager
Proportion of GAVI HSS allocated to immunization (outreach and cold chain and othe program ares outlines in the new HSS proposal)
Yearly % 100%
Capital investments ensured
Negotiations with specific partners (WB & JICA) to invest in EPI
EPI manager
Proportion of requirements as outlined in gap analysis secured
Annually 100%
Cold chain maintenance support ensured
Logisticians, EPI focal points
Proportion of cold chain maintenance requirements secured
Bi-annually 50% 90%
Vehicles purchased and availed as required
Logisticians,EPI focal points
Proportion of required vehicles purchased
Bi-annually 0% 100%
Program efficiency ensured
Implementation of the cold chain renewal and rehabilitation plan
EPI manager/ccold chain officer
Proportion of cold chain requirements as outlined in cold chain investment plan 2012-2016 secured
Bi-annually 40% 90%
Vaccine wastage monitoring and management processes
EPI manager
Vaccine wastage rate Monthly 0.6 < 5%
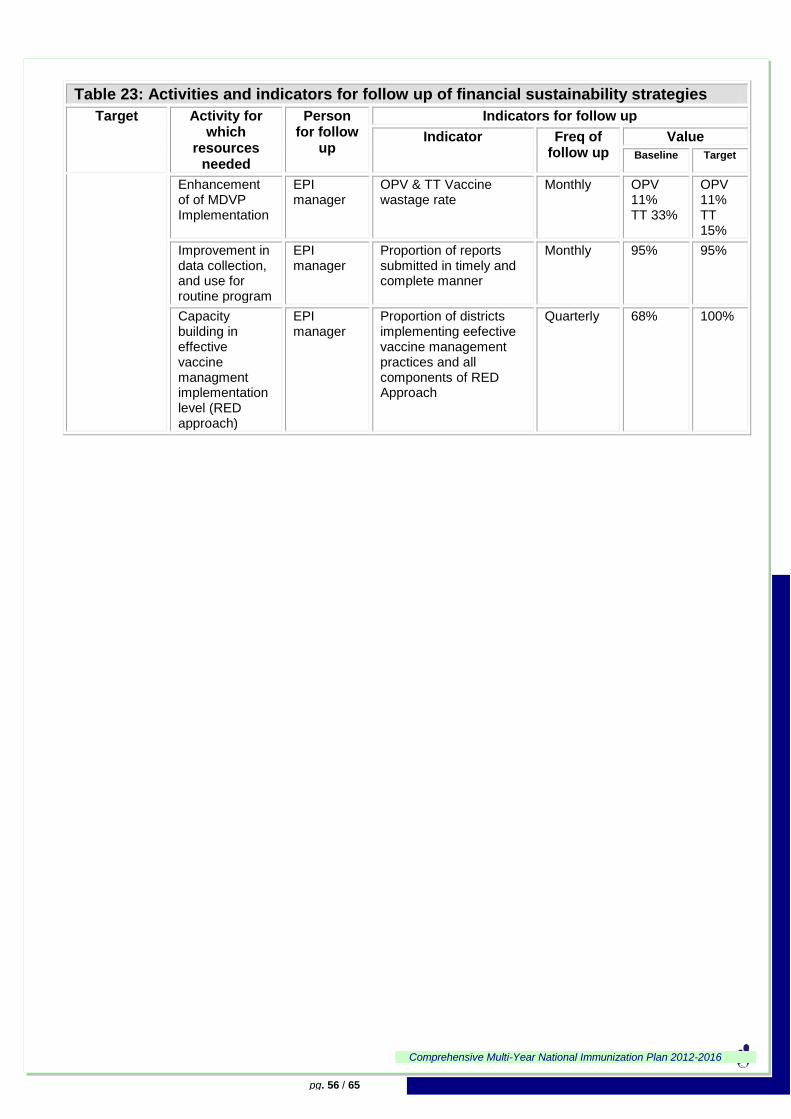
Comprehensive Multi-Year National Immunization Plan 2012-2016
pg. 56 / 65
Table 23: Activities and indicators for follow up of financial sustainability strategies
Target Activity for which
resources needed
Person for follow
up
Indicators for follow up
Indicator Freq of follow up
Value
Baseline Target
Enhancement of of MDVP Implementation
EPI manager
OPV & TT Vaccine wastage rate
Monthly OPV 11% TT 33%
OPV 11% TT 15%
Improvement in data collection, and use for routine program
EPI manager
Proportion of reports submitted in timely and complete manner
Monthly 95% 95%
Capacity building in effective vaccine managment implementation level (RED approach)
EPI manager
Proportion of districts implementing eefective vaccine management practices and all components of RED Approach
Quarterly 68% 100%
Comprehensive Multi-Year National Immunization Plan 2012-2016
pg. 57 / 65
4.6- Monitoring and Evaluation of the Plan with the support of partners using major guidelines will monitor the effective Implementation of cMYP
regularly and monitoring will be done at all levels as outlined below.
Implementing the Plan
This multi-year plan for immunization shall be implemented as a component of the 5 year national health
strategic plan Subtracted from the 25 years strategic plan of National Ministry of Health. All departments
at national level, states MOH and Districts shall ensure that they focus on the key strategic objectives and
activities in their respective areas of responsibilities. Linkages with other key stakholders and sectors as
needed, in order to facilitate implementation of the activities contained in this plan.
As the immunization program creates value and impacts health status by effectively leveraging the
human and organizational resources to conduct program processes, including service delivery, logistics,
surveillance, this interaction create value to communities and other stakeholders. The continuous
utilization of the services by stakeholders leads to increased coverage, reduction of disease burden and a
strengthened health system.
Monitoring the progress of the implementation of planned activities is an essential component of the
cMYP management process. The indicators for each strategic objective shall be monitored at all levels of
operations, federal, state and district.
In order to institutionalize the monitoring process, annual objectives shall be developed during each year
based on the cMYP and based on a review process, and this shall be the basis for development of the
annual Action Plan and the Task Lists to be developed by focal persons / teams responsible for each
activity area. The following management review mechanism shall be institutionalized:
Monthly review meetings at districts and states levels
Quarterly progress reviews by the IACC
Mid-year progress reviews and annual reviews by national EPI
NITAG meetings to follow up the new vaccines introduction and impact
Quarterly reviews shall focus on activity completion (Activity Performance Indicators) and expenditure,
while the mid-year and annual reviews shall concentrate on the overall outcome objectives and the Key
Performance Indicators outlined in this plan.
In order to evaluate progress toward achieving the objectives of this cMYP, the following evaluation
mechanisms shall be implemented:
Mid-term Evaluation
Summative (or End of Plan) Evaluation
These evaluation exercise shall be conducted by independent groups and institutions recommended by
the IACC.
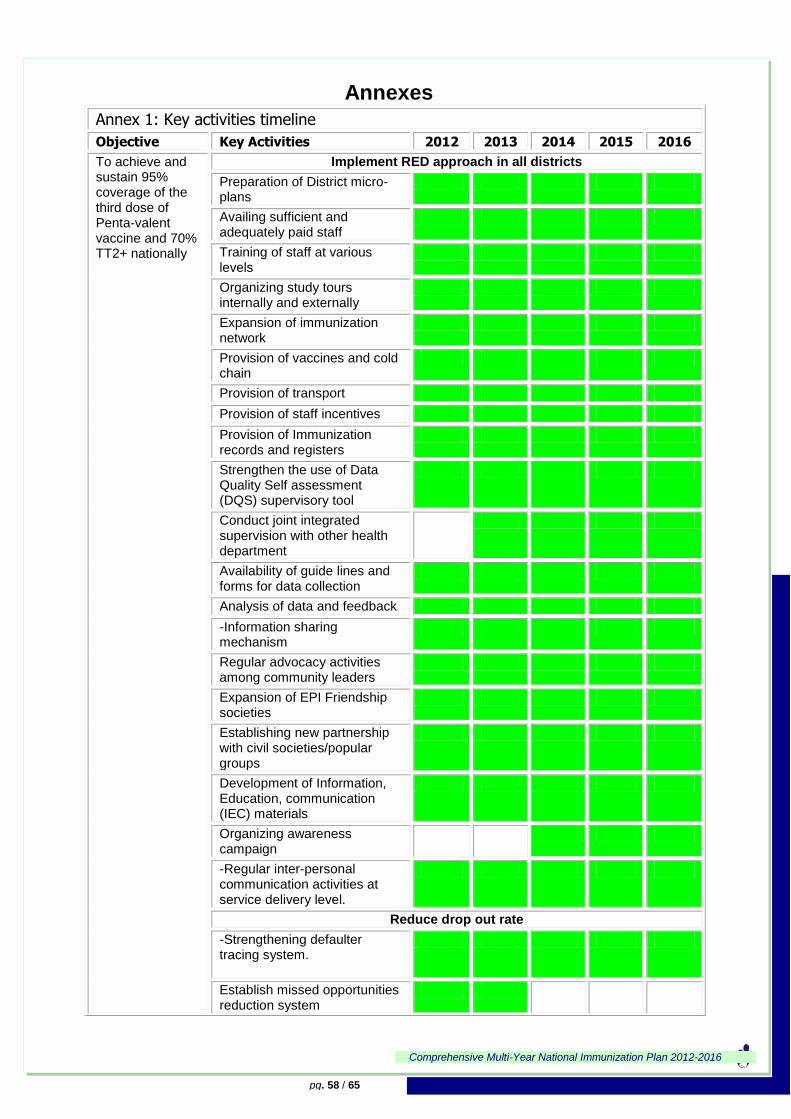
Comprehensive Multi-Year National Immunization Plan 2012-2016
pg. 58 / 65
Annexes
Annex 1: Key activities timeline
Objective Key Activities 2012 2013 2014 2015 2016
To achieve and sustain 95% coverage of the third dose of Penta-valent vaccine and 70% TT2+ nationally
Implement RED approach in all districts
Preparation of District micro-plans
Availing sufficient and adequately paid staff
Training of staff at various levels
Organizing study tours internally and externally
Expansion of immunization network
Provision of vaccines and cold chain
Provision of transport
Provision of staff incentives
Provision of Immunization records and registers
Strengthen the use of Data Quality Self assessment (DQS) supervisory tool
Conduct joint integrated supervision with other health department
Availability of guide lines and forms for data collection
Analysis of data and feedback
-Information sharing mechanism
Regular advocacy activities among community leaders
Expansion of EPI Friendship societies
Establishing new partnership with civil societies/popular groups
Development of Information, Education, communication (IEC) materials
Organizing awareness campaign
-Regular inter-personal communication activities at service delivery level.
Reduce drop out rate
-Strengthening defaulter tracing system.
Establish missed opportunities reduction system
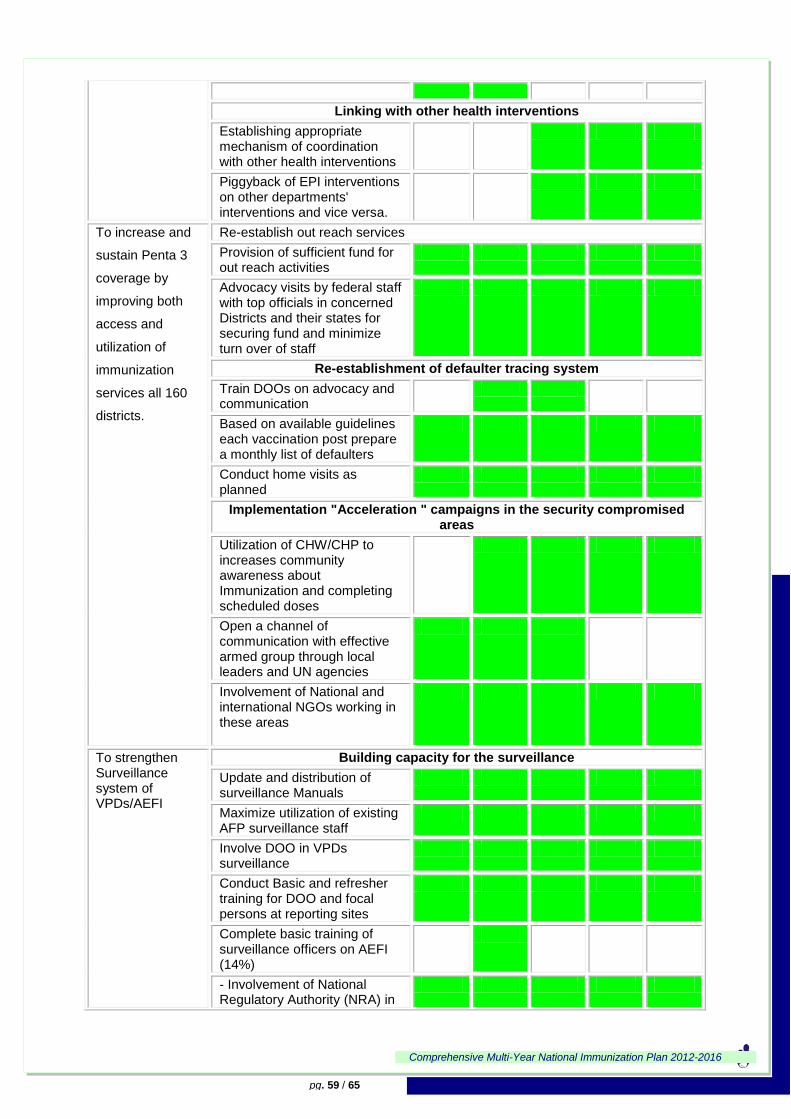
Comprehensive Multi-Year National Immunization Plan 2012-2016
pg. 59 / 65
Linking with other health interventions
Establishing appropriate mechanism of coordination with other health interventions
Piggyback of EPI interventions on other departments' interventions and vice versa.
To increase and
sustain Penta 3
coverage by
improving both
access and
utilization of
immunization
services all 160
districts.
Re-establish out reach services
Provision of sufficient fund for out reach activities
Advocacy visits by federal staff with top officials in concerned Districts and their states for securing fund and minimize turn over of staff
Re-establishment of defaulter tracing system
Train DOOs on advocacy and communication
Based on available guidelines each vaccination post prepare a monthly list of defaulters
Conduct home visits as planned
Implementation "Acceleration " campaigns in the security compromised areas
Utilization of CHW/CHP to increases community awareness about Immunization and completing scheduled doses
Open a channel of communication with effective armed group through local leaders and UN agencies
Involvement of National and international NGOs working in these areas
To strengthen Surveillance system of VPDs/AEFI
Building capacity for the surveillance
Update and distribution of surveillance Manuals
Maximize utilization of existing AFP surveillance staff
Involve DOO in VPDs surveillance
Conduct Basic and refresher training for DOO and focal persons at reporting sites
Complete basic training of surveillance officers on AEFI (14%)
- Involvement of National Regulatory Authority (NRA) in
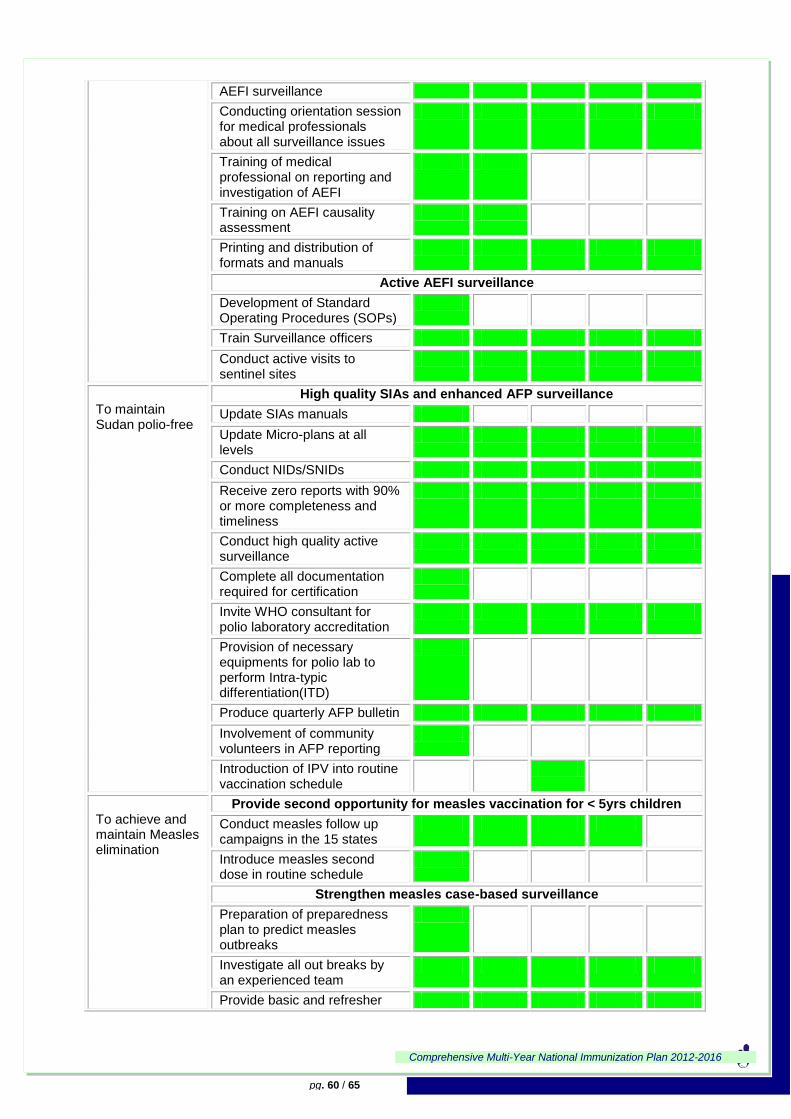
Comprehensive Multi-Year National Immunization Plan 2012-2016
pg. 60 / 65
AEFI surveillance
Conducting orientation session for medical professionals about all surveillance issues
Training of medical professional on reporting and investigation of AEFI
Training on AEFI causality assessment
Printing and distribution of formats and manuals
Active AEFI surveillance
Development of Standard Operating Procedures (SOPs)
Train Surveillance officers
Conduct active visits to sentinel sites
To maintain Sudan polio-free
High quality SIAs and enhanced AFP surveillance
Update SIAs manuals
Update Micro-plans at all levels
Conduct NIDs/SNIDs
Receive zero reports with 90% or more completeness and timeliness
Conduct high quality active surveillance
Complete all documentation required for certification
Invite WHO consultant for polio laboratory accreditation
Provision of necessary equipments for polio lab to perform Intra-typic differentiation(ITD)
Produce quarterly AFP bulletin
Involvement of community volunteers in AFP reporting
Introduction of IPV into routine vaccination schedule
To achieve and maintain Measles elimination
Provide second opportunity for measles vaccination for < 5yrs children
Conduct measles follow up campaigns in the 15 states
Introduce measles second dose in routine schedule
Strengthen measles case-based surveillance
Preparation of preparedness plan to predict measles outbreaks
Investigate all out breaks by an experienced team
Provide basic and refresher
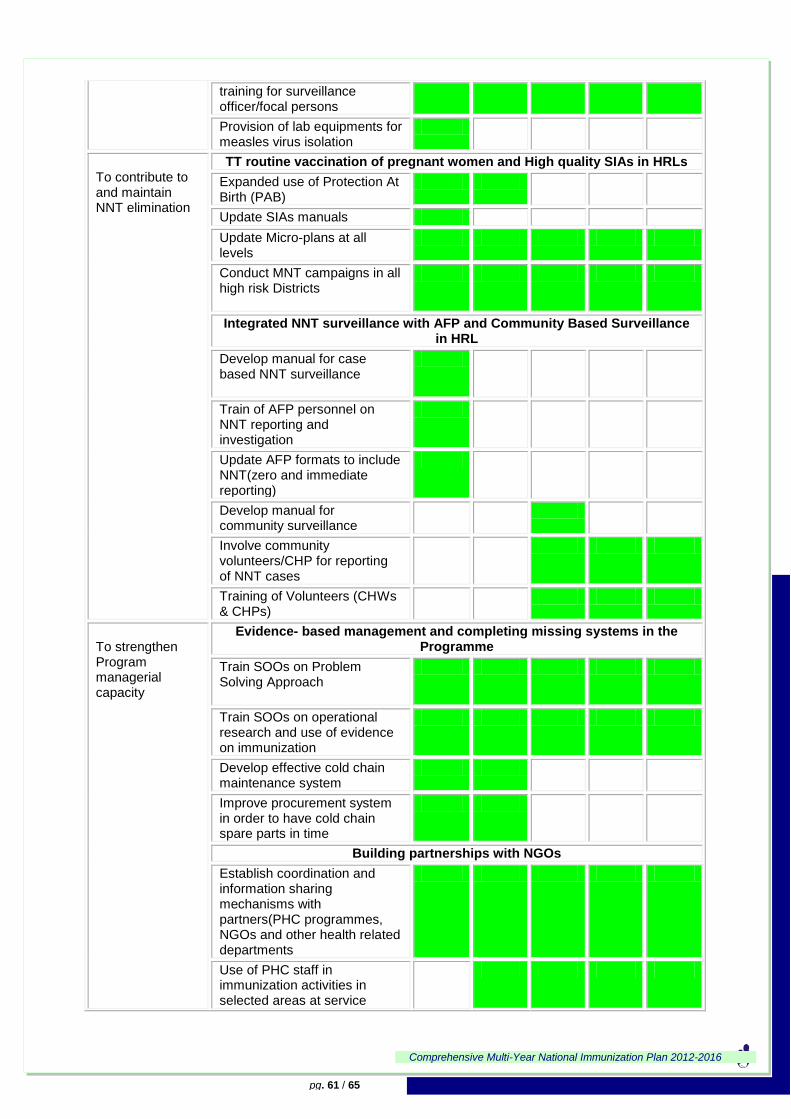
Comprehensive Multi-Year National Immunization Plan 2012-2016
pg. 61 / 65
training for surveillance officer/focal persons
Provision of lab equipments for measles virus isolation
To contribute to and maintain NNT elimination
TT routine vaccination of pregnant women and High quality SIAs in HRLs
Expanded use of Protection At Birth (PAB)
Update SIAs manuals
Update Micro-plans at all levels
Conduct MNT campaigns in all high risk Districts
Integrated NNT surveillance with AFP and Community Based Surveillance in HRL
Develop manual for case based NNT surveillance
Train of AFP personnel on NNT reporting and investigation
Update AFP formats to include NNT(zero and immediate reporting)
Develop manual for community surveillance
Involve community volunteers/CHP for reporting of NNT cases
Training of Volunteers (CHWs & CHPs)
To strengthen Program managerial capacity
Evidence- based management and completing missing systems in the Programme
Train SOOs on Problem Solving Approach
Train SOOs on operational research and use of evidence on immunization
Develop effective cold chain maintenance system
Improve procurement system in order to have cold chain spare parts in time
Building partnerships with NGOs
Establish coordination and information sharing mechanisms with partners(PHC programmes, NGOs and other health related departments
Use of PHC staff in immunization activities in selected areas at service
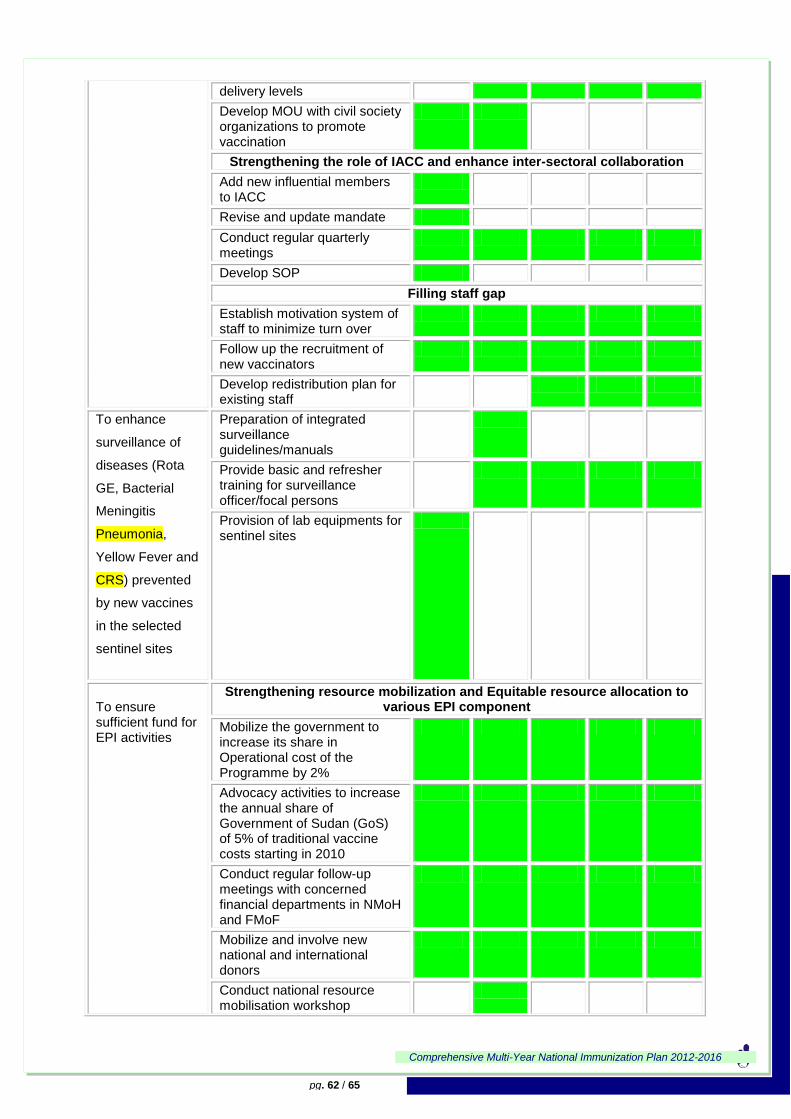
Comprehensive Multi-Year National Immunization Plan 2012-2016
pg. 62 / 65
delivery levels
Develop MOU with civil society organizations to promote vaccination
Strengthening the role of IACC and enhance inter-sectoral collaboration
Add new influential members to IACC
Revise and update mandate
Conduct regular quarterly meetings
Develop SOP
Filling staff gap
Establish motivation system of staff to minimize turn over
Follow up the recruitment of new vaccinators
Develop redistribution plan for existing staff
To enhance
surveillance of
diseases (Rota
GE, Bacterial
Meningitis
Pneumonia,
Yellow Fever and
CRS) prevented
by new vaccines
in the selected
sentinel sites
Preparation of integrated surveillance guidelines/manuals
Provide basic and refresher training for surveillance officer/focal persons
Provision of lab equipments for sentinel sites
To ensure sufficient fund for EPI activities
Strengthening resource mobilization and Equitable resource allocation to various EPI component
Mobilize the government to increase its share in Operational cost of the Programme by 2%
Advocacy activities to increase the annual share of Government of Sudan (GoS) of 5% of traditional vaccine costs starting in 2010
Conduct regular follow-up meetings with concerned financial departments in NMoH and FMoF
Mobilize and involve new national and international donors
Conduct national resource mobilisation workshop
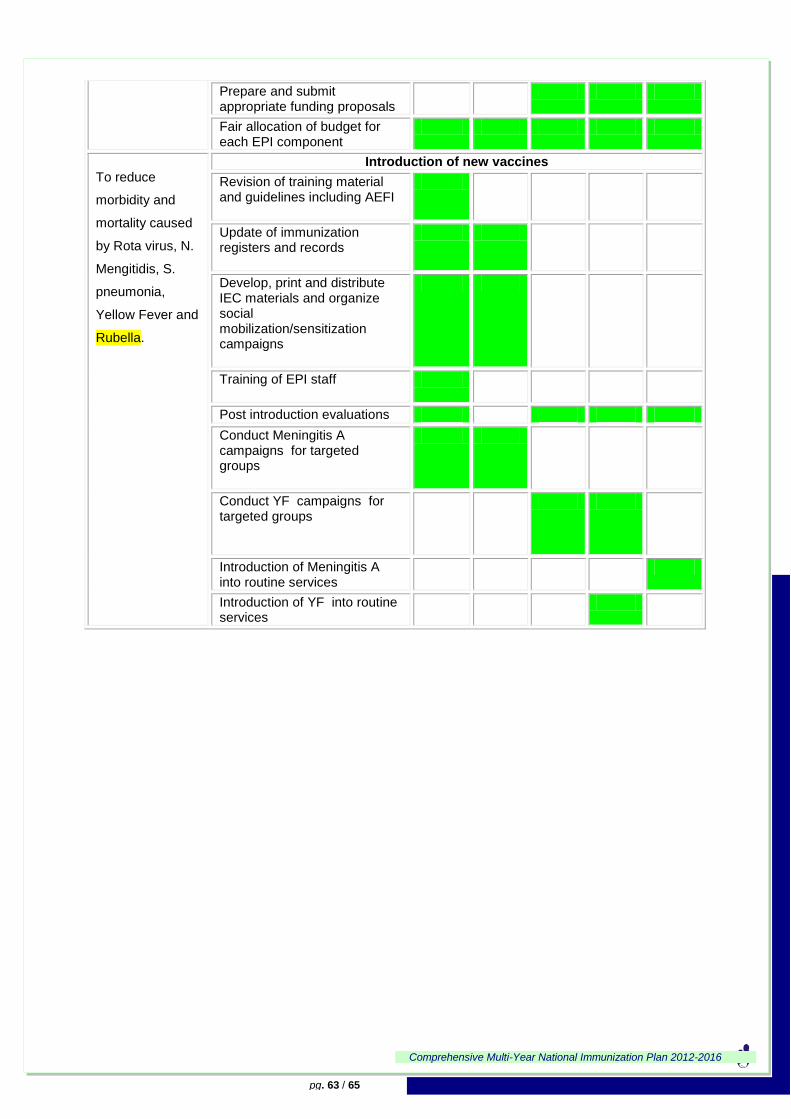
Comprehensive Multi-Year National Immunization Plan 2012-2016
pg. 63 / 65
Prepare and submit appropriate funding proposals
Fair allocation of budget for each EPI component
To reduce
morbidity and
mortality caused
by Rota virus, N.
Mengitidis, S.
pneumonia,
Yellow Fever and
Rubella.
Introduction of new vaccines
Revision of training material and guidelines including AEFI
Update of immunization registers and records
Develop, print and distribute IEC materials and organize social mobilization/sensitization campaigns
Training of EPI staff
Post introduction evaluations
Conduct Meningitis A campaigns for targeted groups
Conduct YF campaigns for targeted groups
Introduction of Meningitis A into routine services
Introduction of YF into routine services
Comprehensive Multi-Year National Immunization Plan 2012-2016
pg. 64 / 65
References/Documents Consulted
1. Central Bureau of Statistics Khartoum, 2008 census Primary results.
2. Sudan Household Health Survey 2010 report.
3. Liverpool Associates in Tropical Health. GAVI Data Quality Audit Sudan, October 2005
4. Republic of Sudan, National Ministry of Health, Mother and child health directorate, Expanded
Programme on Immunization. EPI Plan for 2010-2011.
5. Republic of Sudan, National Ministry of Health, Expanded Programme on Immunization: Acute
Flaccid Paralysis (AFP) Surveillance Central Unit. Annual Reports 2007-2011, Khartoum.
6. Republic of Sudan, National Ministry of Health, Expanded Programme on Immunization: Annual
Reports 2007- 2011.
7. Republic of Sudan, National Ministry of Health, Expanded Programme on Immunization: GAVI
Progress Report 2009, 2011 Khartoum
8. Republic of Sudan, National Ministry of Health, Expanded Programme on Immunization:
WHO/UNICEF Joint Reporting Forms on Immunization for2007,2008, 2009, 2010. 2011
Khartoum
9. Republic of Sudan, National Ministry of Health, Mother and child health directorate, Expanded
Programme on Immunization. Maternal and Neonatal Tetanus Control and Elimination
Campaigns in Sudan Reports
10. WHO/UNICEF. GIVS Global Immunization Vision and Strategy 2006 - 2015, October 2005
(WHO/IVB/05.05)
11. WHO/UNICEF. Making a Comprehensive Multi-Year Plan (cMYP), Revised Version 2.0, October
2005
12. Republic of Sudan, National Ministry of Health Sudan National Health Account 2008.
13. Republic of Sudan, National Ministry of Health National Health Sector Strategic Plan II (2012-16) July 2013
14. Sudan annual health statistical report 2011


![Djursjukhuset smadjur bl1 - husabyhastklinik.se smådj Allmän s1.pdf · Röd morfologi Blodkroppsindex MCV MCH MCHC Normalstatus Njurstatus Leverstatus Hematologistatus C] Ormbettstatus](https://img.pdfslide.net/doc/110x75/5e24dfadf617ed79bd4379da/djursjukhuset-smadjur-bl1-smadj-allman-s1pdf-rd-morfologi-blodkroppsindex.jpg)