Embed Size (px)
Citation preview
5
1 Epidemiology, e tiology, and c onsequences of o besity
Barbara J. Moore and Xavier Pi - Sunyer
Introduction “ Last week, I met with the G. family in the — clinic at my hospital. One of the parents was overweight, and the other was obese. The fi ve children were more severely obese and had numerous weight - related complications — one had evidence of fatty liver, one had high blood pressure, two had gastroesophageal refl ux, two had orthopedic problems, three had marked insulin resistance, four had dyslipidemia, and all had emotional problems related to their weight.
Sadly, this family might be a microcosm of 21st - century America: if we don ’ t take steps to reverse course, the children of each successive generation seem destined to be fatter and sicker than their parents. How will obesity affect the physical and psychological well - being of children in coming decades? What effects will childhood obesity have on life expectancy, the national economy, and our society? ”
D. Ludwig, New England Journal of Medicine , December 6, 2007 (1)
The above scenario typifi es the great challenge of obesity in the 21st century — stemming the epidemic of obesity that threatens the health and quality of life of millions of people in all walks of life. Obesity is an increasingly
Learning Objectives The reader will be able to:
• Defi ne obesity in adults and children. • Describe the estimated prevalence of obesity in adults and children in the United States and for adults, globally. • Discuss how obesity prevalence is estimated in the United States. • Discuss the health consequences of obesity with respect to diseases commonly associated with obesity, health - related quality of life,
and premature death. • Identify putative causal factors related to the development of obesity.
important problem in world health: its prevalence has greatly risen around the world in the last two decades; and it is affecting people of all ages and ethnicities, but some groups more than others, as will be discussed below. The onset of obesity is occurring at increasingly younger ages and its negative consequences are occur-ring earlier in life — a scenario with profound economic consequences as obesity becomes commonplace among the workforce. Obesity is affecting individuals in all social strata and it is escalating in the industrialized world as well as in developing countries. As the econo-mies of developing countries begin to shift, and as peoples all over the world become more urbanized and make the transition from hard physical labor to intensive use of labor - saving technology, the incidence of obesity increases. Also, as food production and distribution systems modernize and as people ’ s discretionary income increases, a wide variety of rich and highly palatable food is available to everyone. As a result, more people are overeating at a time when their energy expenditure is decreasing. Since fat storage occurs when the consump-tion of energy in food (i.e., calories, a measure of the chemical energy stored in food) exceeds energy expendi-ture (primarily, but not exclusively, through physical activity), these industrial, sociocultural, and economic
Textbook of Obesity: Biological, Psychological and Cultural Infl uences, First Edition. Edited by Sharon R. Akabas, Sally Ann Lederman, Barbara J. Moore.© 2012 John Wiley & Sons, Ltd. Published 2012 by John Wiley & Sons, Ltd.
COPYRIG
HTED M
ATERIAL
6 Textbook of Obesity
persons underestimate weight more than normal - weight persons), and there is also evidence that estimations may differ by ethnicity (4) . Such self - reported data can none-theless provide useful information about trends and regional information that might otherwise be too expen-sive to obtain. For the purpose of this chapter, we shall rely primarily on data collected through the National Health and Nutrition Examination Survey (NHANES), in which both height and weight are measured to yield a more accurate assessment of BMI.
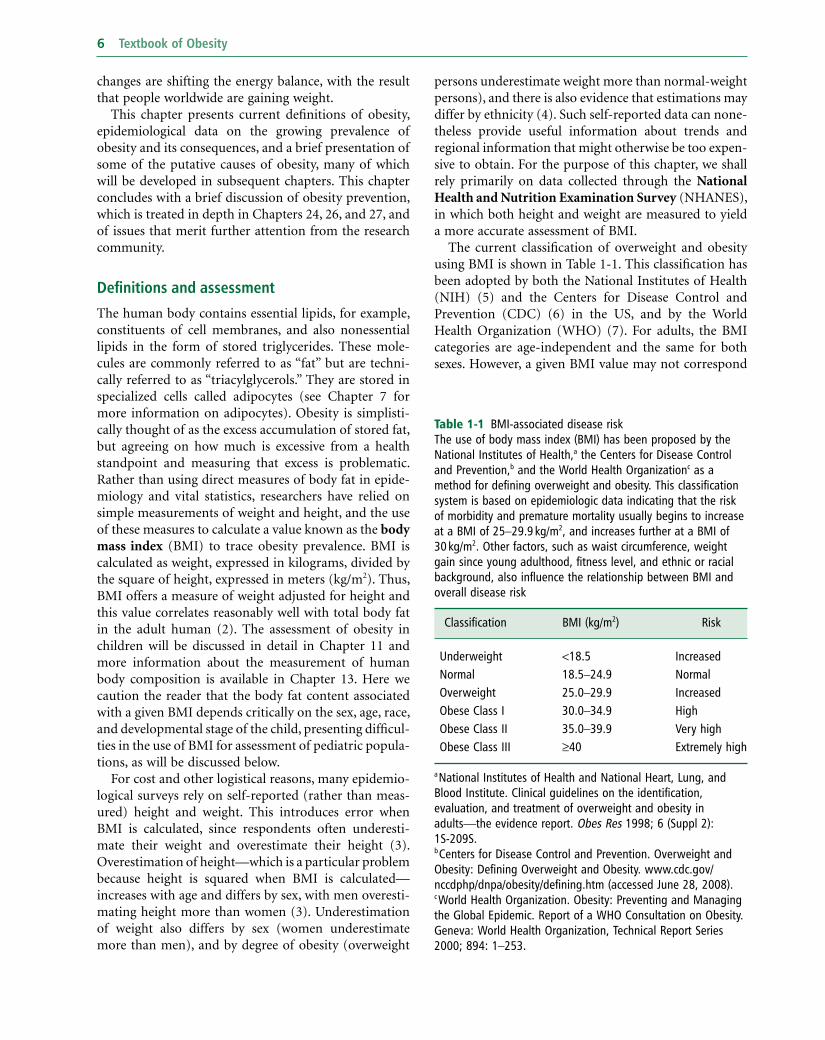
The current classifi cation of overweight and obesity using BMI is shown in Table 1 - 1 . This classifi cation has been adopted by both the National Institutes of Health (NIH) (5) and the Centers for Disease Control and Prevention (CDC) (6) in the US, and by the World Health Organization (WHO) (7) . For adults, the BMI categories are age - independent and the same for both sexes. However, a given BMI value may not correspond
changes are shifting the energy balance, with the result that people worldwide are gaining weight.
This chapter presents current defi nitions of obesity, epidemiological data on the growing prevalence of obesity and its consequences, and a brief presentation of some of the putative causes of obesity, many of which will be developed in subsequent chapters. This chapter concludes with a brief discussion of obesity prevention, which is treated in depth in Chapters 24 , 26 , and 27 , and of issues that merit further attention from the research community.
Defi nitions and a ssessment
The human body contains essential lipids, for example, constituents of cell membranes, and also nonessential lipids in the form of stored triglycerides. These mole-cules are commonly referred to as “ fat ” but are techni-cally referred to as “ triacylglycerols. ” They are stored in specialized cells called adipocytes (see Chapter 7 for more information on adipocytes). Obesity is simplisti-cally thought of as the excess accumulation of stored fat, but agreeing on how much is excessive from a health standpoint and measuring that excess is problematic. Rather than using direct measures of body fat in epide-miology and vital statistics, researchers have relied on simple measurements of weight and height, and the use of these measures to calculate a value known as the body mass index (BMI) to trace obesity prevalence. BMI is calculated as weight, expressed in kilograms, divided by the square of height, expressed in meters (kg/m 2 ). Thus, BMI offers a measure of weight adjusted for height and this value correlates reasonably well with total body fat in the adult human (2) . The assessment of obesity in children will be discussed in detail in Chapter 11 and more information about the measurement of human body composition is available in Chapter 13 . Here we caution the reader that the body fat content associated with a given BMI depends critically on the sex, age, race, and developmental stage of the child, presenting diffi cul-ties in the use of BMI for assessment of pediatric popula-tions, as will be discussed below.
For cost and other logistical reasons, many epidemio-logical surveys rely on self - reported (rather than meas-ured) height and weight. This introduces error when BMI is calculated, since respondents often underesti-mate their weight and overestimate their height (3) . Overestimation of height — which is a particular problem because height is squared when BMI is calculated — increases with age and differs by sex, with men overesti-mating height more than women (3) . Underestimation of weight also differs by sex (women underestimate more than men), and by degree of obesity (overweight
Table 1 - 1 BMI - associated disease risk The use of body mass index ( BMI ) has been proposed by the National Institutes of Health, a the Centers for Disease Control and Prevention, b and the World Health Organization c as a method for defi ning overweight and obesity. This classifi cation system is based on epidemiologic data indicating that the risk of morbidity and premature mortality usually begins to increase at a BMI of 25 – 29.9 kg/m 2 , and increases further at a BMI of 30 kg/m 2 . Other factors, such as waist circumference, weight gain since young adulthood, fi tness level, and ethnic or racial background, also infl uence the relationship between BMI and overall disease risk
Classifi cation BMI (kg/m 2 ) Risk
Underweight < 18.5 Increased Normal 18.5 – 24.9 Normal Overweight 25.0 – 29.9 Increased Obese Class I 30.0 – 34.9 High Obese Class II 35.0 – 39.9 Very high Obese Class III ≥ 40 Extremely high
a National Institutes of Health and National Heart, Lung, and Blood Institute. Clinical guidelines on the identifi cation, evaluation, and treatment of overweight and obesity in adults — the evidence report. Obes Res 1998; 6 (Suppl 2): 1S - 209S. b Centers for Disease Control and Prevention. Overweight and Obesity: Defi ning Overweight and Obesity. www.cdc.gov/nccdphp/dnpa/obesity/defi ning.htm (accessed June 28, 2008). c World Health Organization. Obesity: Preventing and Managing the Global Epidemic. Report of a WHO Consultation on Obesity. Geneva: World Health Organization, Technical Report Series 2000; 894: 1 – 253.
Epidemiology, Etiology, and Consequences of Obesity 7
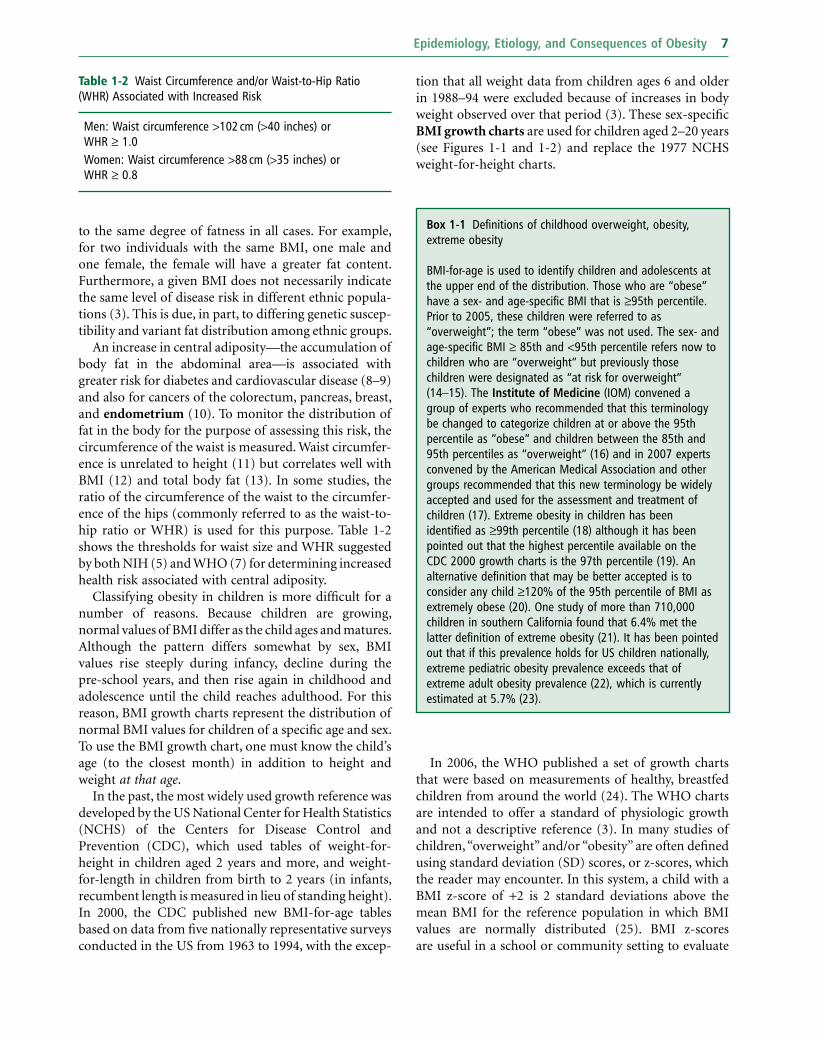
tion that all weight data from children ages 6 and older in 1988 – 94 were excluded because of increases in body weight observed over that period (3) . These sex - specifi c BMI growth charts are used for children aged 2 – 20 years (see Figures 1 - 1 and 1 - 2 ) and replace the 1977 NCHS weight - for - height charts.
to the same degree of fatness in all cases. For example, for two individuals with the same BMI, one male and one female, the female will have a greater fat content. Furthermore, a given BMI does not necessarily indicate the same level of disease risk in different ethnic popula-tions (3) . This is due, in part, to differing genetic suscep-tibility and variant fat distribution among ethnic groups.
An increase in central adiposity — the accumulation of body fat in the abdominal area — is associated with greater risk for diabetes and cardiovascular disease (8 – 9) and also for cancers of the colorectum, pancreas, breast, and endometrium (10) . To monitor the distribution of fat in the body for the purpose of assessing this risk, the circumference of the waist is measured. Waist circumfer-ence is unrelated to height (11) but correlates well with BMI (12) and total body fat (13) . In some studies, the ratio of the circumference of the waist to the circumfer-ence of the hips (commonly referred to as the waist - to - hip ratio or WHR) is used for this purpose. Table 1 - 2 shows the thresholds for waist size and WHR suggested by both NIH (5) and WHO (7) for determining increased health risk associated with central adiposity.
Classifying obesity in children is more diffi cult for a number of reasons. Because children are growing, normal values of BMI differ as the child ages and matures. Although the pattern differs somewhat by sex, BMI values rise steeply during infancy, decline during the pre - school years, and then rise again in childhood and adolescence until the child reaches adulthood. For this reason, BMI growth charts represent the distribution of normal BMI values for children of a specifi c age and sex. To use the BMI growth chart, one must know the child ’ s age (to the closest month) in addition to height and weight at that age .
In the past, the most widely used growth reference was developed by the US National Center for Health Statistics (NCHS) of the Centers for Disease Control and Prevention (CDC), which used tables of weight - for - height in children aged 2 years and more, and weight - for - length in children from birth to 2 years (in infants, recumbent length is measured in lieu of standing height). In 2000, the CDC published new BMI - for - age tables based on data from fi ve nationally representative surveys conducted in the US from 1963 to 1994, with the excep-
Table 1 - 2 Waist Circumference and/or Waist - to - Hip Ratio ( WHR ) Associated with Increased Risk
Men: Waist circumference > 102 cm ( > 40 inches) or WHR ≥ 1.0 Women: Waist circumference > 88 cm ( > 35 inches) or WHR ≥ 0.8
Box 1 - 1 Defi nitions of childhood overweight, obesity, extreme obesity
BMI - for - age is used to identify children and adolescents at the upper end of the distribution. Those who are “ obese ” have a sex - and age - specifi c BMI that is ≥ 95th percentile. Prior to 2005, these children were referred to as “ overweight ” ; the term “ obese ” was not used. The sex - and age - specifi c BMI ≥ 85th and < 95th percentile refers now to children who are “ overweight ” but previously those children were designated as “ at risk for overweight ” (14 – 15) . The Institute of Medicine (IOM) convened a group of experts who recommended that this terminology be changed to categorize children at or above the 95th percentile as “ obese ” and children between the 85th and 95th percentiles as “ overweight ” (16) and in 2007 experts convened by the American Medical Association and other groups recommended that this new terminology be widely accepted and used for the assessment and treatment of children (17) . Extreme obesity in children has been identifi ed as ≥ 99th percentile (18) although it has been pointed out that the highest percentile available on the CDC 2000 growth charts is the 97th percentile (19) . An alternative defi nition that may be better accepted is to consider any child ≥ 120% of the 95th percentile of BMI as extremely obese (20) . One study of more than 710,000 children in southern California found that 6.4% met the latter defi nition of extreme obesity (21) . It has been pointed out that if this prevalence holds for US children nationally, extreme pediatric obesity prevalence exceeds that of extreme adult obesity prevalence (22) , which is currently estimated at 5.7% (23) .
In 2006, the WHO published a set of growth charts that were based on measurements of healthy, breastfed children from around the world (24) . The WHO charts are intended to offer a standard of physiologic growth and not a descriptive reference (3) . In many studies of children, “ overweight ” and/or “ obesity ” are often defi ned using standard deviation (SD) scores, or z - scores, which the reader may encounter. In this system, a child with a BMI z - score of + 2 is 2 standard deviations above the mean BMI for the reference population in which BMI values are normally distributed (25) . BMI z - scores are useful in a school or community setting to evaluate

8 Textbook of Obesity
Figure 1 - 1 CDC growth chart — BMI for age percentiles for boys (2 – 20 years old)
2 543 6 7 8 9 10 11 12 13 14 15 16 17 18 19 20
26
24
22
20
18
16
14
12
kg/m2
28
26
24
22
20
18
16
14
12
kg/m2
30
32
34
BMI
BMI
AGE (YEARS)
13
15
17
19
21
23
25
27
13
15
17
19
21
23
25
27
29
31
33
35
95
90
75
50
25
10
5
85
2 to 20 years: BoysBody mass index-for-age percentiles
NAME
RECORD #
SOURCE: Developed by the National Center for Health Statistics in collaboration withthe National Center for Chronic Disease Prevention and Health Promotion (2000).http://www.cdc.gov/growthcharts
Date Age Weight Stature BMI* Comments
Published May 30, 2000 (modified 10/16/00).
*To Calculate BMI: Weight (kg) ÷ Stature (cm) ÷ Stature (cm) × 10,000or Weight (lb) ÷ Stature (in) ÷ Stature (in) × 703

Epidemiology, Etiology, and Consequences of Obesity 9
Figure 1 - 2 CDC growth chart — BMI for age percentiles for girls (2 – 20 years old)
2 to 20 years: GirlsBody mass index-for-age percentiles
NAME
RECORD #
SOURCE: Developed by the National Center for Health Statistics in collaboration withthe National Center for Chronic Disease Prevention and Health Promotion (2000).http://www.cdc.gov/growthcharts
2 543 6 7 8 9 10 11 12 13 14 15 16 17 18 19 20
26
24
22
20
18
16
14
12
kg/m2
28
26
24
22
20
18
16
14
12
kg/m2
30
32
34
BMI
BMI
AGE (YEARS)
13
15
17
19
21
23
25
27
13
15
17
19
21
23
25
27
29
31
33
35
Date Age Weight Stature BMI* Comments
95
90
85
75
50
10
25
5
Published May 30, 2000 (modified 10/16/00).
*To Calculate BMI: Weight (kg) ÷ Stature (cm) ÷ Stature (cm) × 10,000or Weight (lb) ÷ Stature (in) ÷ Stature (in) × 703
10 Textbook of Obesity
obesity. Surveys or studies of large populations are useful for this purpose.
United States National Center for Health Statistics National - level data for the US (i.e., data that are repre-sentative of the nation taken as a whole) are gathered by the National Center for Health Statistics (NCHS) of the Centers for Disease Control and Prevention (CDC) from measured data obtained through NHANES (30) . NHANES is designed to monitor the health and nutri-tional status of the civilian, non - institutionalized popu-lation, aged 2 years and older. NHANES (31) includes standardized health examinations in a mobile examina-tion center on a representative cross - sectional sample of the US population.
Originally conducted every decade or so since it was founded in the early 1960s, starting in 1999, NHANES has been conducted on a continuous basis, surveying approximately 5,000 people each year (32) . NHANES is the primary source for national data on overweight and obesity in adults, adolescents, and children. Because of the expense involved, NCHS also collects self - reported data obtained by telephone through the Behavioral Risk Factor Surveillance System (BRFSS) (33) . Although they underestimate prevalence, these data are useful for deter-mining state - by - state prevalence and changes in preva-lence in a state over time. Because it is more reliable, wherever possible we will be discussing primarily NHANES data based on measured height and weight.
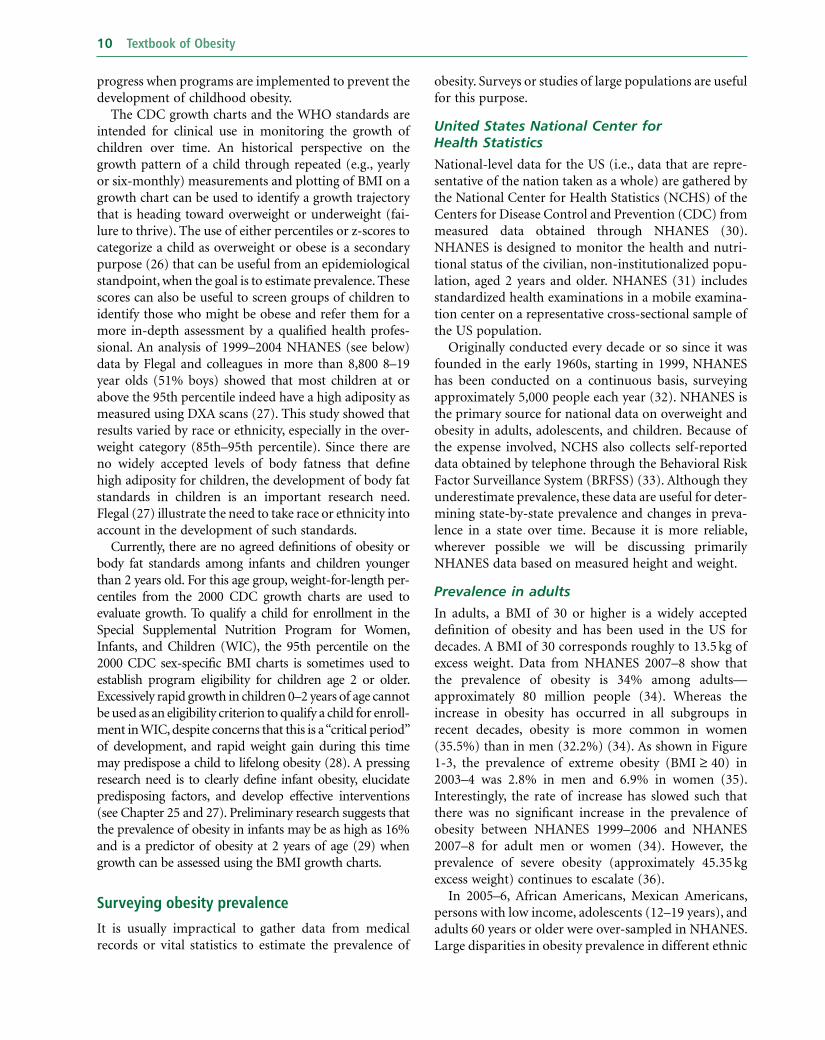
Prevalence in a dults In adults, a BMI of 30 or higher is a widely accepted defi nition of obesity and has been used in the US for decades. A BMI of 30 corresponds roughly to 13.5 kg of excess weight. Data from NHANES 2007 – 8 show that the prevalence of obesity is 34% among adults — approximately 80 million people (34) . Whereas the increase in obesity has occurred in all subgroups in recent decades, obesity is more common in women (35.5%) than in men (32.2%) (34) . As shown in Figure 1 - 3 , the prevalence of extreme obesity (BMI ≥ 40) in 2003 – 4 was 2.8% in men and 6.9% in women (35) . Interestingly, the rate of increase has slowed such that there was no signifi cant increase in the prevalence of obesity between NHANES 1999 – 2006 and NHANES 2007 – 8 for adult men or women (34) . However, the prevalence of severe obesity (approximately 45.35 kg excess weight) continues to escalate (36) .
In 2005 – 6, African Americans, Mexican Americans, persons with low income, adolescents (12 – 19 years), and adults 60 years or older were over - sampled in NHANES. Large disparities in obesity prevalence in different ethnic
progress when programs are implemented to prevent the development of childhood obesity.
The CDC growth charts and the WHO standards are intended for clinical use in monitoring the growth of children over time. An historical perspective on the growth pattern of a child through repeated (e.g., yearly or six - monthly) measurements and plotting of BMI on a growth chart can be used to identify a growth trajectory that is heading toward overweight or underweight (fai-lure to thrive). The use of either percentiles or z - scores to categorize a child as overweight or obese is a secondary purpose (26) that can be useful from an epidemiological standpoint, when the goal is to estimate prevalence. These scores can also be useful to screen groups of children to identify those who might be obese and refer them for a more in - depth assessment by a qualifi ed health profes-sional. An analysis of 1999 – 2004 NHANES (see below) data by Flegal and colleagues in more than 8,800 8 – 19 year olds (51% boys) showed that most children at or above the 95th percentile indeed have a high adiposity as measured using DXA scans (27) . This study showed that results varied by race or ethnicity, especially in the over-weight category (85th – 95th percentile). Since there are no widely accepted levels of body fatness that defi ne high adiposity for children, the development of body fat standards in children is an important research need. Flegal (27) illustrate the need to take race or ethnicity into account in the development of such standards.
Currently, there are no agreed defi nitions of obesity or body fat standards among infants and children younger than 2 years old. For this age group, weight - for - length per-centiles from the 2000 CDC growth charts are used to evaluate growth. To qualify a child for enrollment in the Special Supplemental Nutrition Program for Women, Infants, and Children (WIC), the 95th percentile on the 2000 CDC sex - specifi c BMI charts is sometimes used to establish program eligibility for children age 2 or older. Excessively rapid growth in children 0 – 2 years of age cannot be used as an eligibility criterion to qualify a child for enroll-ment in WIC, despite concerns that this is a “ critical period ” of development, and rapid weight gain during this time may predispose a child to lifelong obesity (28) . A pressing research need is to clearly defi ne infant obesity, elucidate predisposing factors, and develop effective interventions (see Chapter 25 and 27 ). Preliminary research suggests that the prevalence of obesity in infants may be as high as 16% and is a predictor of obesity at 2 years of age (29) when growth can be assessed using the BMI growth charts.
Surveying o besity p revalence
It is usually impractical to gather data from medical records or vital statistics to estimate the prevalence of
Epidemiology, Etiology, and Consequences of Obesity 11
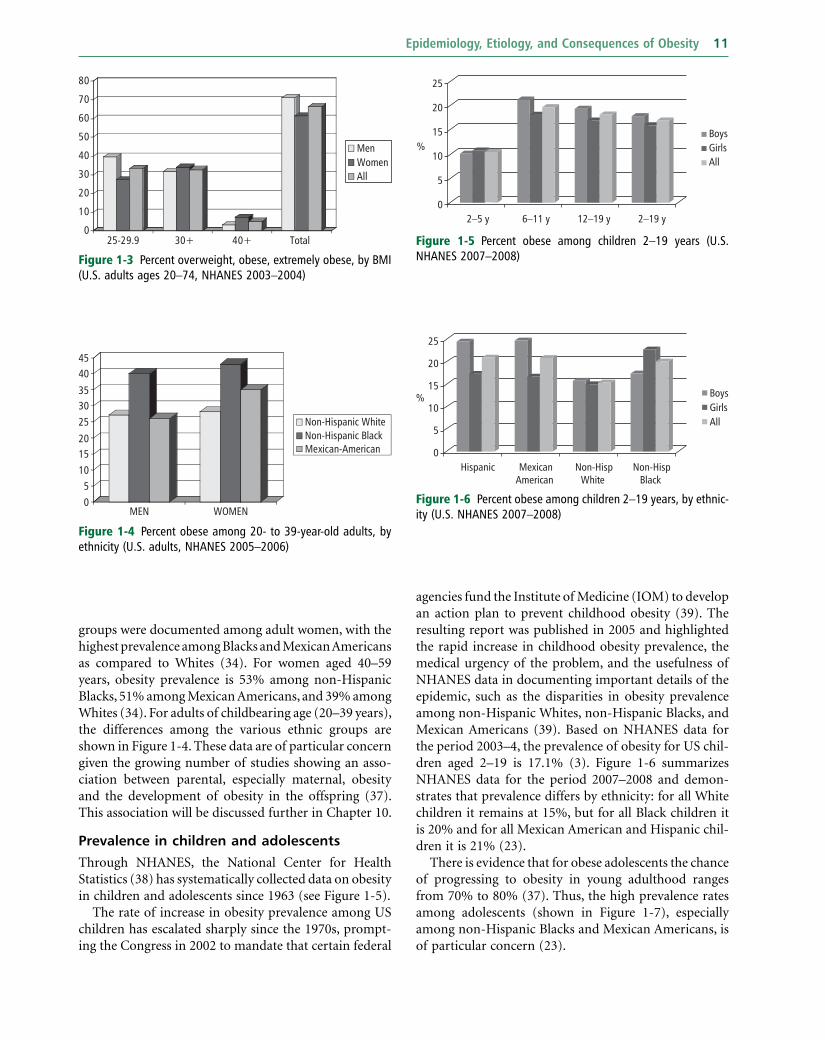
agencies fund the Institute of Medicine (IOM) to develop an action plan to prevent childhood obesity (39) . The resulting report was published in 2005 and highlighted the rapid increase in childhood obesity prevalence, the medical urgency of the problem, and the usefulness of NHANES data in documenting important details of the epidemic, such as the disparities in obesity prevalence among non - Hispanic Whites, non - Hispanic Blacks, and Mexican Americans (39) . Based on NHANES data for the period 2003 – 4, the prevalence of obesity for US chil-dren aged 2 – 19 is 17.1% (3) . Figure 1 - 6 summarizes NHANES data for the period 2007 – 2008 and demon-strates that prevalence differs by ethnicity: for all White children it remains at 15%, but for all Black children it is 20% and for all Mexican American and Hispanic chil-dren it is 21% (23) .
There is evidence that for obese adolescents the chance of progressing to obesity in young adulthood ranges from 70% to 80% (37) . Thus, the high prevalence rates among adolescents (shown in Figure 1 - 7 ), especially among non - Hispanic Blacks and Mexican Americans, is of particular concern (23) .
groups were documented among adult women, with the highest prevalence among Blacks and Mexican Americans as compared to Whites (34) . For women aged 40 – 59 years, obesity prevalence is 53% among non - Hispanic Blacks, 51% among Mexican Americans, and 39% among Whites (34) . For adults of childbearing age (20 – 39 years), the differences among the various ethnic groups are shown in Figure 1 - 4 . These data are of particular concern given the growing number of studies showing an asso-ciation between parental, especially maternal, obesity and the development of obesity in the offspring (37) . This association will be discussed further in Chapter 10 .
Prevalence in c hildren and a dolescents
Through NHANES, the National Center for Health Statistics (38) has systematically collected data on obesity in children and adolescents since 1963 (see Figure 1 - 5 ).
The rate of increase in obesity prevalence among US children has escalated sharply since the 1970s, prompt-ing the Congress in 2002 to mandate that certain federal
Figure 1 - 3 Percent overweight, obese, extremely obese, by BMI (U.S. adults ages 20 – 74, NHANES 2003 – 2004)
0
10
20
30
40
50
60
70
80
25-29.9 30+ 40+ Total
MenWomenAll
Figure 1 - 4 Percent obese among 20 - to 39 - year - old adults, by ethnicity (U.S. adults, NHANES 2005 – 2006)
05
101520
253035
4045
MEN WOMEN
Non-Hispanic WhiteNon-Hispanic BlackMexican-American
Figure 1 - 5 Percent obese among children 2 – 19 years (U.S. NHANES 2007 – 2008)
25
20
15 BoysGirls%
5
10 All
02–5 y 2–19 y6–11 y 12–19 y
Figure 1 - 6 Percent obese among children 2 – 19 years, by ethnic-ity (U.S. NHANES 2007 – 2008)
25
20
10
15BoysGirls
%
5All
0Hispanic Mexican
American Non-Hisp
White Non-Hisp
Black

12 Textbook of Obesity
now obese according to the WHO ( 43 – 44 ; see also Table 1 - 3 ). This is true also of some sub - populations in the developed world, such as the Pima Indians in Arizona, where 70% of the population is obese (45) . WHO data from Latin America and even Africa show a growth of obesity in these regions as well (44; and see Table 1 - 3 ).
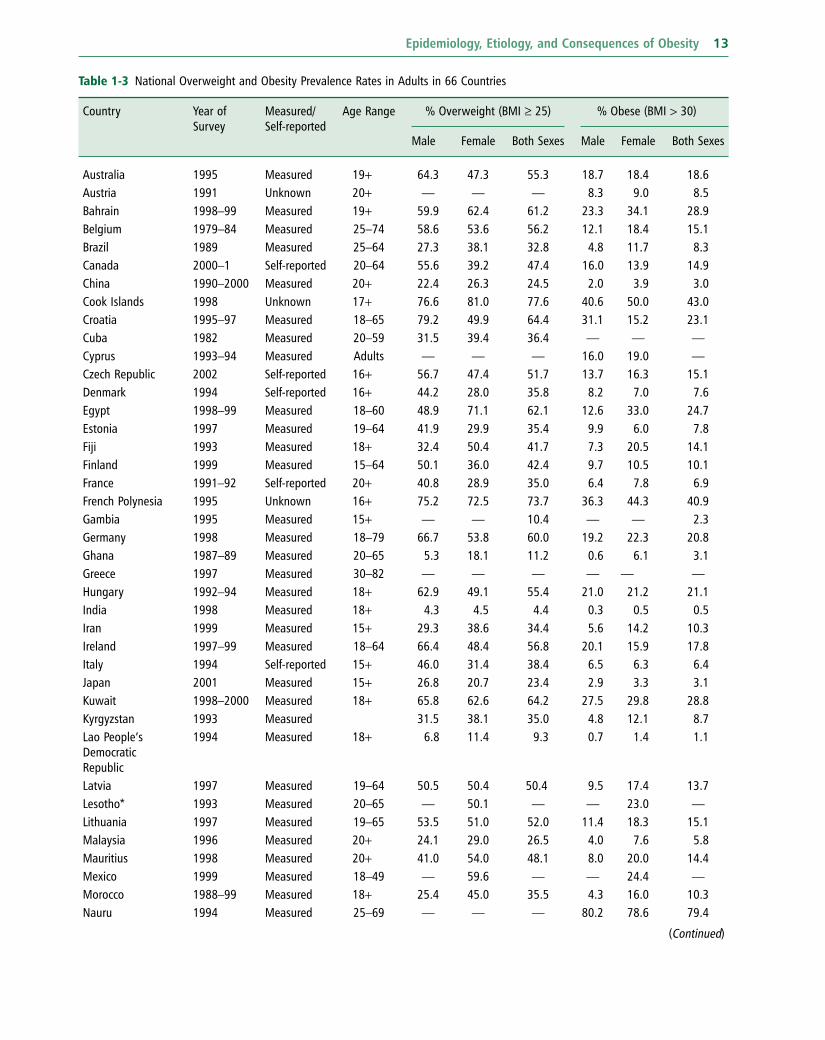
WHO global estimations of prevalence indicate that approximately 1.6 billion adults (aged 15 + ) were over-weight and at least 400 million were obese in 2005 (46) . In addition, at least 20 million children under the age of 5 years were obese as of 2005 (46) . An estimated 12.5 million children in the US are obese (40) , with 2.8 million of those children categorized as severely obese (41) . The WHO further projects that by 2015 approxi-mately 2.3 billion adults will be overweight and more than 700 million will be obese (46) . Table 1 - 3 lists over-weight and obesity prevalence fi gures for adults in 66 countries. The WHO obesity prevalence data shown in this table for China (3.0%), the world ’ s most populous country, are likely to be low since a 2008 estimate of obesity prevalence based on BMI reported that 22.8% of Chinese adults are overweight and 7.1% are obese (47) . The epidemic of overweight or obesity is affecting chil-dren and even infants (48) . Indeed, a 2007 – 8 national estimate of type 2 diabetes prevalence in China found that nearly 10% of the adult population (92.4 million people) are frankly diabetic and another 16% (148.2 million people) have pre - diabetes (48) .
Evidence from the Caribbean (Barbados, Cuba, Jamaica, and Saint Lucia) indicates that obesity is a growing problem in this region (7) . The growth in obesity prevalence is accompanied by a higher preva-lence of diabetes, cardiovascular disease, and hyperten-sion (7) . Experience in Cuba over the past two decades is illustrative of the profound impact of obesity on health. In contrast to many developing countries, Cuba has an extensive healthcare system and a well - developed system for tracking vital events (49) . Consequently, it is known with certainty, for example, that life expectancy in Cuba is 77 years and cardiovascular disease is the leading cause of death (49 – 50) .
Since the 1960s, Cuba has been subjected to an eco-nomic embargo by the US. In 1989, after losing the Soviet Union as an important trading partner, Cuba entered a prolonged crisis, which is referred to as the “ Special Period ” (49 – 50) . The crisis deepened from 1989 to 1995 with economic output in 1995 only half the level in 1990. Foreign trade contracted by 80%, with reduced imports, limited fuel availability, and a scarcity of many food items. Food was rationed and 40% reductions in per capita daily energy intake were documented (50) along with signifi cant increases in walking and cycling as public transportation became unavailable (49) .
The CDC has identifi ed the development of innova-tive childhood obesity practices as an important priority (40) since there are now more than 12 million obese children in the US, with several million of those severely obese (41) . Childhood obesity treatment and prevention are discussed further in Chapters 25 and 26 – 27 , respectively.
BRFSS and YRBS
To ensure that NHANES is nationally representative, it is not necessary for the mobile examination centers to enter all states in the US; consequently, NHANES is not useful for collecting state data. To address this gap in the data, as mentioned earlier, the Behavioral Risk Factor Surveillance System (BRFSS; see www.cdc.gov/brfss ), an ongoing, state - based, random - digit - dialed telephone survey of the non - institutionalized civilian population aged > 18 years, is used. BRFSS data allow the assess-ment of the prevalence of obesity among adults catego-rized by state and demographic characteristics , and are particularly useful in guiding policy and program devel-opment at the state and local level. Among youth, an analogous telephone survey system, the Youth Risk Behavior Survey (YRBS; see www.cdc.gov/HealthyYouth/yrbs/index.htm ), permits the collection of data on health - related behaviors, as well as on self - reported height and weight.
Global p revalence Although few countries have nutrition and health moni-toring systems equivalent to NHANES or BRFSS for assessing obesity prevalence, it is clear that the increase in obesity is occurring not only in the US, but through-out the world. The WHO has declared obesity as one of the world ’ s top 10 risk conditions and one of the top fi ve in developed nations (42) . There are areas of the world, such as the South Pacifi c island countries of Tonga and Nauru, where there has been such an enormous increase in obesity that the majority of the adult population is
Figure 1 - 7 Percent obese, adolescents 12 – 19 years, by ethnicity (U.S. NHANES 2007 – 2008)
25
30
20
10
15 BoysGirls
%
5All
0Hispanic Mexican
American Non-Hisp
White Non-Hisp
Black
Epidemiology, Etiology, and Consequences of Obesity 13
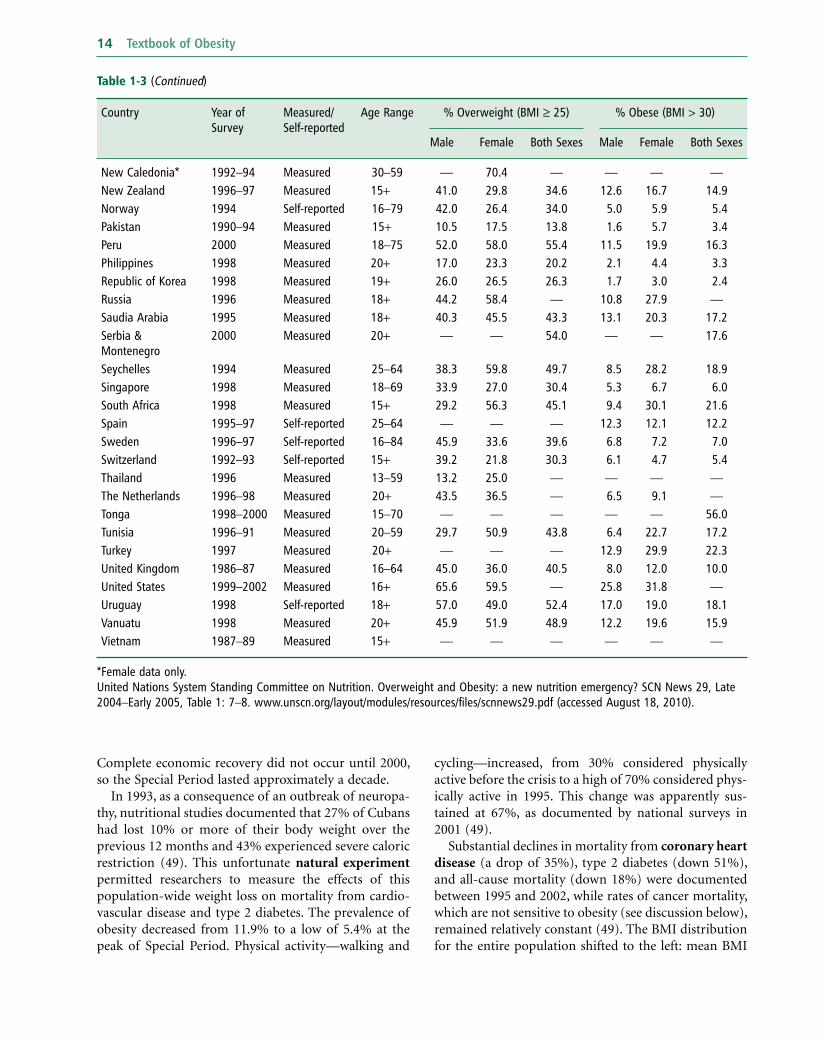
Table 1 - 3 National Overweight and Obesity Prevalence Rates in Adults in 66 Countries
Country Year of Survey
Measured/Self - reported
Age Range % Overweight (BMI ≥ 25) % Obese (BMI > 30)
Male Female Both Sexes Male Female Both Sexes
Australia 1995 Measured 19 + 64.3 47.3 55.3 18.7 18.4 18.6 Austria 1991 Unknown 20 + — — — 8.3 9.0 8.5 Bahrain 1998 – 99 Measured 19 + 59.9 62.4 61.2 23.3 34.1 28.9 Belgium 1979 – 84 Measured 25 – 74 58.6 53.6 56.2 12.1 18.4 15.1 Brazil 1989 Measured 25 – 64 27.3 38.1 32.8 4.8 11.7 8.3 Canada 2000 – 1 Self - reported 20 – 64 55.6 39.2 47.4 16.0 13.9 14.9 China 1990 – 2000 Measured 20 + 22.4 26.3 24.5 2.0 3.9 3.0 Cook Islands 1998 Unknown 17 + 76.6 81.0 77.6 40.6 50.0 43.0 Croatia 1995 – 97 Measured 18 – 65 79.2 49.9 64.4 31.1 15.2 23.1 Cuba 1982 Measured 20 – 59 31.5 39.4 36.4 — — — Cyprus 1993 – 94 Measured Adults — — — 16.0 19.0 — Czech Republic 2002 Self - reported 16 + 56.7 47.4 51.7 13.7 16.3 15.1 Denmark 1994 Self - reported 16 + 44.2 28.0 35.8 8.2 7.0 7.6 Egypt 1998 – 99 Measured 18 – 60 48.9 71.1 62.1 12.6 33.0 24.7 Estonia 1997 Measured 19 – 64 41.9 29.9 35.4 9.9 6.0 7.8 Fiji 1993 Measured 18 + 32.4 50.4 41.7 7.3 20.5 14.1 Finland 1999 Measured 15 – 64 50.1 36.0 42.4 9.7 10.5 10.1 France 1991 – 92 Self - reported 20 + 40.8 28.9 35.0 6.4 7.8 6.9 French Polynesia 1995 Unknown 16 + 75.2 72.5 73.7 36.3 44.3 40.9 Gambia 1995 Measured 15 + — — 10.4 — — 2.3 Germany 1998 Measured 18 – 79 66.7 53.8 60.0 19.2 22.3 20.8 Ghana 1987 – 89 Measured 20 – 65 5.3 18.1 11.2 0.6 6.1 3.1 Greece 1997 Measured 30 – 82 — — — — — — Hungary 1992 – 94 Measured 18 + 62.9 49.1 55.4 21.0 21.2 21.1 India 1998 Measured 18 + 4.3 4.5 4.4 0.3 0.5 0.5 Iran 1999 Measured 15 + 29.3 38.6 34.4 5.6 14.2 10.3 Ireland 1997 – 99 Measured 18 – 64 66.4 48.4 56.8 20.1 15.9 17.8 Italy 1994 Self - reported 15 + 46.0 31.4 38.4 6.5 6.3 6.4 Japan 2001 Measured 15 + 26.8 20.7 23.4 2.9 3.3 3.1 Kuwait 1998 – 2000 Measured 18 + 65.8 62.6 64.2 27.5 29.8 28.8 Kyrgyzstan 1993 Measured 31.5 38.1 35.0 4.8 12.1 8.7 Lao People ’ s Democratic Republic
1994 Measured 18 + 6.8 11.4 9.3 0.7 1.4 1.1
Latvia 1997 Measured 19 – 64 50.5 50.4 50.4 9.5 17.4 13.7 Lesotho * 1993 Measured 20 – 65 — 50.1 — — 23.0 — Lithuania 1997 Measured 19 – 65 53.5 51.0 52.0 11.4 18.3 15.1 Malaysia 1996 Measured 20 + 24.1 29.0 26.5 4.0 7.6 5.8 Mauritius 1998 Measured 20 + 41.0 54.0 48.1 8.0 20.0 14.4 Mexico 1999 Measured 18 – 49 — 59.6 — — 24.4 — Morocco 1988 – 99 Measured 18 + 25.4 45.0 35.5 4.3 16.0 10.3 Nauru 1994 Measured 25 – 69 — — — 80.2 78.6 79.4
(Continued)
14 Textbook of Obesity
Country Year of Survey
Measured/Self - reported
Age Range % Overweight (BMI ≥ 25) % Obese (BMI > 30)
Male Female Both Sexes Male Female Both Sexes
New Caledonia * 1992 – 94 Measured 30 – 59 — 70.4 — — — — New Zealand 1996 – 97 Measured 15 + 41.0 29.8 34.6 12.6 16.7 14.9 Norway 1994 Self - reported 16 – 79 42.0 26.4 34.0 5.0 5.9 5.4 Pakistan 1990 – 94 Measured 15 + 10.5 17.5 13.8 1.6 5.7 3.4 Peru 2000 Measured 18 – 75 52.0 58.0 55.4 11.5 19.9 16.3 Philippines 1998 Measured 20 + 17.0 23.3 20.2 2.1 4.4 3.3 Republic of Korea 1998 Measured 19 + 26.0 26.5 26.3 1.7 3.0 2.4 Russia 1996 Measured 18 + 44.2 58.4 — 10.8 27.9 — Saudia Arabia 1995 Measured 18 + 40.3 45.5 43.3 13.1 20.3 17.2 Serbia & Montenegro
2000 Measured 20 + — — 54.0 — — 17.6
Seychelles 1994 Measured 25 – 64 38.3 59.8 49.7 8.5 28.2 18.9 Singapore 1998 Measured 18 – 69 33.9 27.0 30.4 5.3 6.7 6.0 South Africa 1998 Measured 15 + 29.2 56.3 45.1 9.4 30.1 21.6 Spain 1995 – 97 Self - reported 25 – 64 — — — 12.3 12.1 12.2 Sweden 1996 – 97 Self - reported 16 – 84 45.9 33.6 39.6 6.8 7.2 7.0 Switzerland 1992 – 93 Self - reported 15 + 39.2 21.8 30.3 6.1 4.7 5.4 Thailand 1996 Measured 13 – 59 13.2 25.0 — — — — The Netherlands 1996 – 98 Measured 20 + 43.5 36.5 — 6.5 9.1 — Tonga 1998 – 2000 Measured 15 – 70 — — — — — 56.0 Tunisia 1996 – 91 Measured 20 – 59 29.7 50.9 43.8 6.4 22.7 17.2 Turkey 1997 Measured 20 + — — — 12.9 29.9 22.3 United Kingdom 1986 – 87 Measured 16 – 64 45.0 36.0 40.5 8.0 12.0 10.0 United States 1999 – 2002 Measured 16 + 65.6 59.5 — 25.8 31.8 — Uruguay 1998 Self - reported 18 + 57.0 49.0 52.4 17.0 19.0 18.1 Vanuatu 1998 Measured 20 + 45.9 51.9 48.9 12.2 19.6 15.9 Vietnam 1987 – 89 Measured 15 + — — — — — —
* Female data only. United Nations System Standing Committee on Nutrition. Overweight and Obesity: a new nutrition emergency? SCN News 29, Late 2004 – Early 2005, Table 1: 7 – 8. www.unscn.org/layout/modules/resources/fi les/scnnews29.pdf (accessed August 18, 2010).
Table 1-3 (Continued)
Complete economic recovery did not occur until 2000, so the Special Period lasted approximately a decade.
In 1993, as a consequence of an outbreak of neuropa-thy, nutritional studies documented that 27% of Cubans had lost 10% or more of their body weight over the previous 12 months and 43% experienced severe caloric restriction (49) . This unfortunate natural experiment permitted researchers to measure the effects of this population - wide weight loss on mortality from cardio-vascular disease and type 2 diabetes. The prevalence of obesity decreased from 11.9% to a low of 5.4% at the peak of Special Period. Physical activity — walking and
cycling — increased, from 30% considered physically active before the crisis to a high of 70% considered phys-ically active in 1995. This change was apparently sus-tained at 67%, as documented by national surveys in 2001 (49) .
Substantial declines in mortality from coronary heart disease (a drop of 35%), type 2 diabetes (down 51%), and all - cause mortality (down 18%) were documented between 1995 and 2002, while rates of cancer mortality, which are not sensitive to obesity (see discussion below), remained relatively constant (49) . The BMI distribution for the entire population shifted to the left: mean BMI

Epidemiology, Etiology, and Consequences of Obesity 15
Consequences of o besity and o verweight
The consequences of obesity cover a wide spectrum of social, medical, and economic domains (7) . Obesity is associated with diminished health and psychosocial well - being, reduced socioeconomic prospects of affected individuals and populations, and lower economic pro-ductivity of the workforce. Obesity is a major contri-butor to the higher healthcare costs of businesses and insurance providers, as well as workers. It contributes to decreased longevity and increased disability, as well as increased reliance on surgical procedures and medical interventions to treat obesity or to manage the various comorbidities of obesity (7) .
Health There are dozens of health conditions that are associated with obesity either directly or indirectly (see Chapter 12 ). In the following sections, we discuss a selected few disease conditions that are highly prevalent and whose prevalence is increasing as a consequence of the growing epidemic of obesity.
Type 2 d iabetes
Among adults, the relationship between BMI and type 2 diabetes is perhaps stronger than it is for any other obesity comorbidity (3) . It has been estimated that 64% of male and 77% of female cases of type 2 diabetes could be prevented if no one had a BMI above 24; or the reduc-tions would be 44% and 33%, respectively, if no one had a BMI above 29 (51 – 52) . The American Diabetes Association (53) estimates that about 19 million people in the US have type 2 diabetes, and another 54 million are “ pre - diabetic, ” which means that increasing weight gain in this latter population places them at extremely high risk for the development of frank diabetes. The mortality associated with diabetes is 73,000 people a year in the US, which makes it the fi fth leading cause of death (53) .
The Diabetes Prevention Program (DPP) targeted overweight pre - diabetic individuals and demonstrated that lifestyle change — weight loss, increased physical activity, and the adoption of a low - fat diet — outperformed a leading diabetes drug in preventing conversion from pre - diabetes to frank diabetes (54) . The DPP was a remarkable demonstration of the value of lifestyle change in the prevention of diabetes in high - risk over-weight individuals. Lifestyle change was protective against conversion to diabetes in 58% of the cases, whereas the drug prevented only one third of the cases (54) . Similar fi ndings from a Finnish study of individu-als with impaired glucose tolerance were reported in 2001 (55) . It is worth noting that data from the Diabetes
decreased from 24.8 in 1991 to 23.3 in 1995, refl ecting a 50% reduction in obesity prevalence (49) .
It is likely that the Special Period is the fi rst demonstra-tion of sustained negative energy balance — with docu-mented high levels of physical activity and weight loss that lasted 4 – 8 years — producing signifi cant reductions in dia-betes and cardiovascular disease mortality (49) . There was a shift in diet composition in Cuba during the Special Period with carbohydrate intake increasing from 65% to 77% of calories as sugar cane and rice became the primary sources of energy (49) . As the availability of animal prod-ucts declined, fat intake decreased from 20% to 13% of calories and protein intake fell from 15% to 10% of calories — a diet composition considered diabetogenic by some authorities, yet accompanied by marked decreases in diabetes mortality (49) .
There were many negative consequences of the Special Period: tuberculosis deaths increased by 48% (49) ; more elderly persons died, primarily of infections; the decline in infant mortality was interrupted for three years, and the incidence of low birth weight increased from 7.3% to 9.0% (49) . An epidemic of optical and peripheral neuropathy attributed to vitamin and protein defi cien-cies affecting at least 50,000 people, was documented between 1992 and 1993 (49) .
When the Special Period ended, the Cuban economy started to grow, productivity increased, energy and food availability increased, and public transportation improved. The nadir in mortality from type 2 diabetes and heart disease was reached in 2001 and mortality from these causes increased for the next four years. Like most countries, Cuba now faces the challenge to craft public health initiatives to stem this increase. The Special Period suggests the potential public health impact that could be achieved with a population intervention designed to maintain nutritional suffi ciency while boost-ing physical activity and moderating calorie intake. With a current life expectancy of 78.6 years, Cuba ’ s health system, including its Rural Social Medical Service, emphasizes disease prevention (high vaccination rates and high proportion of births attended by skilled health workers) and primary healthcare (65% of physicians practice primary care medicine), achieving “ developed - world health outcomes with a developing - world budget ” (50) . In contrast to the US, Cuba has been forced to rely more on education (community health literacy) than on medical supplies and sophisticated technologies to maintain a healthy population at a per capita cost of $355 (7.1% of total Gross Domestic Product) as com-pared to $6714 (15.3% of total GDP) in the US (50) . As the economy stabilizes and obesity prevalence increases in Cuba, it will be interesting to see what strategies are used to stem the problem.

16 Textbook of Obesity
Cardiovascular d isease, h ypertension, and s troke
Cardiovascular disease (CVD) includes coronary heart disease (CHD) and peripheral vascular disease. The evi-dence is strong that obesity is a major independent risk factor for CVD for men (62) and women (63) , and that weight reduction leads to an improvement in various cardiovascular parameters. In addition to obesity and CVD linkages through hypertension, dyslipidemia (especially low levels of high - density lipoproteins and high levels of circulating triglycerides), insulin resist-ance, and impaired glucose tolerance (64) , the role of infl ammation as an important risk factor is an emerging focus of active research (65) . The greater the degree of obesity, the higher the risk of CVD (66) . There are ethnic groups, such as Asian Indians, with high rates of CHD associated with a constellation of risk factors that differs somewhat from that occurring in White groups (67) . Nevertheless, the relative increase in risk associated with increasing degrees of obesity is fairly similar throughout the world (7) .
Elevated intra - abdominal (central) fat accumulation appears to play a key role in raising risk for heart disease, especially in men. The WHO has summarized character-istics of intra - abdominal fat that have been postulated to play a role in raising CHD risk (7) , possibly by pro-moting insulin resistance. They are:
• Increased fat cell number. • Higher rate of blood fl ow per unit tissue mass. • Elevated glucocorticoid (cortisol) receptor number. • Elevated androgen receptor number. • Increased catecholamine - (epinephrine and nore-
pinephrine) induced lipolysis (the breakdown of stored fat to release free fatty acids and glycerol).
The increased receptor number in abdominal fat may make it more susceptible, for example, to stress - induced hormonal stimulation. Since abdominal fat cells are located “ upstream ” from the liver, delivering fatty acids to the liver by way of the portal circulation, a high - stress lifestyle may expose the liver to high levels of nonesteri-fi ed fatty acids in an individual with abdominal obesity — a scenario in which insulin resistance, dyslipi-demia, and the full - blown metabolic syndrome (see below) may be more likely to develop (7) . The specifi c linkage between abdominal obesity and disease conse-quences, especially the metabolic syndrome, is another area of intensive research.
Both systolic and diastolic blood pressure increase with increasing BMI (68 – 70) and higher rates of hypertension — defi ned in these studies as a systolic
Prevention Program Research Group demonstrate that of the lifestyle changes accomplished by the participants in the DPP, weight loss had the greatest effect in prevent-ing diabetes (56) .
Once diabetes is established, it is notoriously diffi cult to treat with lifestyle change, and adjunctive medical treatment is usually required. Observational studies have shown that bariatric surgery can be useful in bringing about complete remission of diabetes (57) . A recent study examined the use of surgery in diabetic obese indi-viduals with a BMI between 30 and 40 (58) . This non - blinded, randomized controlled trial of weight loss induced by bariatric surgery vs. weight loss through life-style change was conducted in newly diagnosed diabetic patients. The results demonstrated signifi cant weight loss (20.7% of initial body weight) with bariatric surgery and remission of the disease in 22 out of 30 patients (73%), which compared to remission in only 4 out of 30 patients (13%) in the lifestyle change group (58) . The average weight loss in the lifestyle change group was only 1.7% of initial body weight, considerably less than that achieved in the DPP. This disappointing result may have been a consequence of inadequate programmatic support or the refractoriness to weight loss in patients once frank diabetes is established (58) . Nonetheless, this study dem-onstrates the interesting and puzzling relationship between diabetes and obesity, which is the focus of intensive research efforts. The use of bariatric surgery for the treatment of obesity will be discussed in greater detail in Chapter 19 .
In the pediatric population, type 2 diabetes is a very low prevalence condition (3) , but is an emerging concern because it is rapidly increasing (59) , especially in com-munities with a large population of ethnic minorities such as African American children, Native American children, children of Asian/South Pacifi c Islanders, or children of Hispanic origin. It is also an issue of increas-ing concern in sparsely populated rural communities, such as those in the majority of counties in Montana, where the population tends to be White and poor (see Chapter 27 ).
Among adolescents, preliminary reports identify alarmingly high rates of type 2 diabetes in the ethnic populations identifi ed above, with the vast majority ( > 90%) of those individuals classifi ed as overweight (60) . Data from NHANES showed a prevalence of diabetes (types 1 and 2 combined) of 9.3% in the adult popula-tion, with an additional 26% having impaired fasting glucose (5.6 – < 7.0 mmol/L) (61) . As will be discussed below, the cost associated with the treatment of type 2 diabetes is the major determinant of the direct economic costs of obesity.

Epidemiology, Etiology, and Consequences of Obesity 17
factors in the development of gallbladder disease associ-ated with obesity.
Osteoarthritis
Osteoarthritis of the knee, hip, and back is strongly asso-ciated with obesity (78 – 80) . An increased risk of oste-oarthritis has been shown at BMI ≥ 25 (80) , in studies in which confi rmation of the condition was made with radiographic evaluation. Osteoarthritis becomes a comorbidity of obesity when lifestyle is affected, espe-cially when physical activity is curtailed or treatments are required. Weight loss decreases symptoms of oste-oarthritis and improves the management of the condi-tion in weight - bearing joints (80 – 81) .
Sleep a pnea/ o besity h ypoventilation s yndrome
Obesity is the single most important cause of sleep apnea /obesity hypoventilation syndrome, which is char-acterized by brief periods during sleep when breathing ceases and, in some cases, hypoxemia occurs. A strong predictor of this condition is upper body obesity, espe-cially in males (78, 82) . Confi rmation of the condition is made by a formal sleep study. Sleep apnea contributes to impaired alertness during the day, which may contrib-ute to reduced productivity on the job. It is a serious condition that interferes with the quantity and quality of sleep, and is a risk factor for premature death (78, 82 – 83) . Weight reduction can be very effective in con-trolling sleep apnea (84 – 85) .
Cancer
A 2007 report, promulgated jointly by the World Cancer Research Fund and the American Institute for Cancer Research (10) , presents evidence that elevated body fat is linked to increased risk of cancer in the esophagus, pancreas, gallbladder, liver, colorectum, breast (in post-menopausal women), endometrium, and kidney (10) . Table 1 - 4 summarizes the conclusions of this report regarding the quality of the evidence linking elevated body fatness to the increased risk of these cancers. Note that the evidence of highest quality is identifi ed in the table as “ convincing ” and the evidence achieves this standard for six of the eight cancers identifi ed above. Note also that for certain cancer sites the notation “ Abd ” denotes abdominal obesity, which refers to increased fatness in the upper body, usually indicated by a waist circumference of 101.5 cm or more in males and 89 cm or more in females (10) . However, with respect to cancer mortality, one study estimates that only 2 – 3% of cancer mortality is explained by obesity (86) .
blood pressure of ≥ 140 mmHg, a diastolic blood pres-sure of ≥ 90 mmHg, or both — among obese persons as compared to lean are the consequence (68) . An increased risk for hypertension has been shown for BMI ≥ 23 and blood pressure tends to improve with weight loss (70) .
The connection between obesity and stroke has received less research attention, but a longer duration of obesity raises the risk of both hypertension and stroke (7, 71) . The mechanism of these effects is unclear, but it is thought that the higher circulating levels of insulin associated with insulin resistance in obese persons may cause increased renal retention of sodium, with a result-ing increase in blood pressure (7, 72) , raising the risk of stroke.
Gall b ladder d isease
An increased risk of gallstone formation and gall bladder disease has been shown at a BMI ≥ 25 (73) and gall-stones are more common among obese persons as compared with their lean counterparts (74 – 75) . It is important to note that the risk of gallstone formation increases with weight loss, especially precipitous weight loss (73) . Since the weight loss following bariatric surgery can be rapid, it is not unusual for persons undergoing a bariatric procedure to undergo simultaneous cholecys-tectomy (removal of the gall bladder).
Congenitally obese mice and lean mice fed a high - fat diet have increased gallbladder wall lipids and poor gall-bladder emptying (76) . Al - Azzawi and colleagues tested the hypothesis that compared to patients with a normal gallbladder, patients with infl ammation of the gallblad-der (with or without the presence of gallstones) would have increased gallbladder wall fat. Sixteen patients who underwent gallbladder removal for cholecystitis (without gallstones), 16 non - diseased controls who underwent incidental cholecystectomy during surgery for liver or pancreatic disease, and 16 diseased controls whose gall-bladder was removed for chronic gallstone formation were studied. Pathology specimens were reviewed in a blinded fashion for gallbladder wall fat, wall thickness, and infl ammation. The results were consistent with the hypothesis that increased infi ltration of the wall of the gallbladder by fat may lead to poor gallbladder emptying and the development of biliary symptoms (76) .
It has been suggested that the propensity for gallblad-der disease may be inherited. But Katsika and colleagues (77) examined a large Swedish twin registry and found a doubling of risk for gallstone formation in overweight persons and a more than tripling of risk among obese persons, but no differences between dizygotic or dis-cordant monozygotic twins (77) . Taken together, these fi ndings suggest an important role for environmental

18 Textbook of Obesity
there is little doubt that an increasing number of meta-bolic and cardiovascular risk factors confers an increased risk of morbidity and mortality. One analysis of NHANES data showed that 27% of US adults met the criteria for the metabolic syndrome (96) , an ominous development from a health and economic standpoint. Using criteria adapted for adolescents (97) , another analysis of NHANES data (1988 – 94) for 12 – 19 year olds showed that 30% of obese youth met the criteria for the metabolic syndrome, whereas fewer than 1% of children in the normal weight category ( < 85th percentile) did (98) . With an estimated 17 million teens living in the US in 2010 (99) , these data suggest that the number of ado-lescents with the metabolic syndrome is approaching 1 million.
Health - r elated q uality of l ife Obesity affects not only health, but other aspects of the quality of life. Obese individuals face discrimination in securing jobs, in career advancement, and even in uni-versity entrance, as discussed in detail in Chapter 2 . They tend to develop a poorer self - image than their lean coun-terparts and often have diffi culty managing social inter-actions. This can create stress, which may in turn lead to increased body weight and central adiposity (7) .
Health - related quality of life (QOL) is defi ned by the WHO as including physical, mental, and social well - being (100) . Instruments for measuring QOL in adults (101) , adolescents (102) , and children (103) are now available and suitable for use in epidemiological studies (104) . Williams and colleagues conducted a prospective, longi-tudinal study of > 1,400 primary school children (age 9 – 12 years) living in Victoria, Australia, and found that health - related QOL declined as weight category increased from normal weight to overweight to obesity. In clinical popu-lations, such declines in QOL related to increased weight are also seen and tend to be even steeper (105) .
Many workers have identifi ed a relationship between obesity and depression, anxiety, and other psychological dysphorias, but most data are cross - sectional, raising the question of what comes fi rst, the depression or the obesity. One longitudinal study (106) of 776 subjects examined the development of depression and anxiety disorder in both male and female adolescents 9 – 18 years of age. Using the > 95th percentile for age and sex as the defi nition of obesity, these workers found that adoles-cent obesity in females was strongly predictive of subse-quent depression and anxiety, assessed by means of structured diagnostic interviews, but it was not predic-tive in males (106) . The reasons for this striking sex difference deserve further study.
An interesting perspective on depression is provided by Ladwig and colleagues (107) , who examined the con-
Nonalcoholic f atty l iver d isease
Obesity is the most common risk factor associated with nonalcoholic fatty liver disease (NAFLD), a condition in which normal liver architecture is disrupted by the pres-ence of fat. The condition can progress to nonalcoholic steatohepatitis (NASH), in which there is infl ammation and injury to the liver cells, which can progress to fi brosis and cirrhosis. A very high proportion of severely obese patients who have undergone bariatric surgery (surgical treatment of obesity) have evidence of either NAFLD or NASH (87) . In adults, the prevalence of NAFLD or NASH is unclear (3) , but indirect evidence, based on liver transaminase levels and alanine aminotransferase levels from NHANES, suggests it may be as high as 7.9% (88) , with prevalence increasing in both children (89) and adults (90) . Estimates of the prevalence of NAFLD in obese children range from 22.5% to 52.8% (91 – 92) .
The m etabolic s yndrome
The metabolic syndrome is described as a “ constellation of risk factors ” including central adiposity, low high - density lipoprotein levels, high circulating triglycerides, increased blood pressure, and impaired fasting glucose (93) . The usefulness of the metabolic syndrome as a distinct diagnostic entity is controversial (94 – 95) , but
Table 1 - 4 Increased Body Fatness and Increased Cancer Risk
Site of Cancer Convincing Evidence
Probable Evidence
Suggestive Evidence
Esophagus √ Pancreas √ Abd Gallbladder √ Liver √ Colorectum √ , Abd Breast (postmenopause)
√ Abd
Endometrium √ Abd Kidney √
√ = increased body fatness is linked to an increased risk of cancer at the site indicated on the left. Column headings indicate the strength of the evidence linking body fatness to cancer risk. Abd = increased abdominal fat, specifi cally, is linked to the increased risk of cancer at the site indicated on the left. WCRF/AICR Report, Food, Nutrition, Physical Activity, and the Prevention of Cancer: a Global Perspective. Washington, DC: American Institute for Cancer Research, 2007 (10) .
Epidemiology, Etiology, and Consequences of Obesity 19
Many studies of obesity and mortality have added to the confusion regarding the exact nature of their rela-tionship because of a failure to control for smoking or pre - existing illness, both of which increase mortality for lean persons (7) . Another source of the confusion is the inappropriate control for hypertension and elevated glucose levels, which are very often effects of obesity, leading to analyses that underestimate the association of obesity and mortality (see side bar). These factors may explain why some workers have found that, in older adults, the association of BMI with mortality is either weak or nonexistent (117 – 118) , whereas the WHO has concluded that obesity raises the risk for premature mortality “ well into the ninth decade of life ” (7) .
Although there is continued disagreement about the risk of premature death associated with increased BMI and about how that risk differs with age, there is no disa-greement that severe obesity is strongly predictive of an increased risk of premature death. The WHO reported that severe obesity (BMI ≥ 40) is associated with a 12 - fold increase in mortality among young adults aged 25 – 35 (7) . One study of almost 5,000 Native American children followed for several decades shows that obese children are more likely to die prematurely (before age 55) from illness and self - infl icted injury than their normal - weight peers. The death rate among the obese children was more than double that of the leanest chil-dren (141) . The prevalence of obesity may be leveling off, but severe obesity is increasing in both adults and children, affl icting approximately 17 million people (41) in 2006. There is no doubt these people will face an increased risk of both morbidity and premature mortality making this an urgent public health concern Box 1 - 2 .
Economic c onsequences of o besity Assessments of the economic costs of obesity have been few, and this is an area in which more research is needed. There is no doubt that overweight and obesity and their associated health problems have a signifi cant economic impact on the US healthcare system. Costs associated with overweight and obesity are usually broken down into two categories: direct and indirect costs (142 – 143) . Direct medical costs include preventive, diagnostic, and treatment services, pharmaceuticals, physician and surgeon costs, hospital costs, etc. Indirect costs relate to both morbidity and mortality costs; the former include the value of income lost from decreased productivity, restricted activity, absenteeism, and bed days. Mortality costs are the value of future income lost because of pre-mature death.
In one study of national costs attributed to both over-weight and obesity, the authors used the 1998 Medical Expenditure Panel Survey (MEPS) and the 1996 and
tribution of depressed mood in obese subjects to the risk of a future coronary heart disease event. This was a pro-spective, population - based cohort study involving three independent cross - sectional surveys of more than 6,200 subjects, of whom 737 males (23%) and 773 females (26%) were obese. The subjects were 45 – 74 years of age and apparently free of CHD, stroke, and cancer at the start of the study. During the mean seven years of follow - up, 179 CHD events occurred in men and 50 in women. The results showed a more than doubling of risk for CHD among men who were both obese and judged to be depressed using a standardized questionnaire. The data for women were in the same direction, but failed to reach statistical signifi cance, perhaps because the study was underpowered (107) .
Relying on self - reported data, a study of 15 - and 17 - year - old Swedish students, the majority of whom were from one county, found a signifi cant statistical association between obesity and depression (108) . These workers found an association between obesity and “ experiences of shame, ” which they defi ned as experi-ences of being “ downgraded or ridiculed ” by others (108) . These workers concluded that shaming experi-ences, along with other family problems such as parental separation and parental socioeconomic factors, largely accounted for the increased rates of depression in this nonclinical population.
In ethnic minority populations, data are scant. One small but high - quality study using measured BMI and a validated instrument for measuring QOL in 175 over-weight Mexican American adolescents concluded that QOL was signifi cantly lower in the heaviest teens (109) . More research is needed to examine QOL among ethnic minorities, and in all overweight children, regardless of ethnicity, interventions to improve QOL are pressing. The relationship between obesity and psychosocial func-tioning is discussed further in Chapters 2 and 11 .
Mortality The pharmaceutical industry is aggressively developing new medical treatments for the comorbidities of obesity, and new surgical treatments (bariatric surgery, hip and knee replacements, etc.) are making a positive contribu-tion to health status and prolonging the life of obese individuals. Nonetheless, obesity is associated with an increased risk of mortality, primarily mortality from cardiovascular disease (110 – 111) and diabetes (53) . The relationship between BMI and mortality can be described as a U - shaped curve, with most studies showing the nadir of the curve associated with a BMI range of approximately 18.5 – 24.9 (112 – 116) . This corresponds to the currently accepted defi nition of the healthy BMI range.
20 Textbook of Obesity
Box 1 - 2 Obesity and mortality — historical perspective and current controversy
The life and medical insurance industries were the fi rst to investigate the relationship of body weight to risk of disease and, particularly, death. In the two largest of these studies, the Build and Blood Pressure Study of 1959 (119) and the Build and Blood Pressure Study of 1979 (120 – 121) , a J - shaped curve of mortality was described, with persons at low and high weights showing the greatest mortality risks. In the 1959 Build Study, mortality was 42% higher in obese persons, with obesity defi ned as a weight 30% or more above the median weight for individuals of the same height and sex. The results of this study were used to develop a set of tables of ideal weight for height for adults. Twenty years later, because of secular increases in weight in the US population, the 1979 Build Study revealed that the lowest mortality in men under 50 years of age was associated with weights 5 – 15% lower than the average weights of men at that time. In men, as age increased the optimal weights for the lowest mortality increased somewhat, but were still below the earlier range defi ned by the 1959 Metropolitan Life Tables. For women, the weights associated with lowest mortality increased with increasing age, suggesting that older individuals could safely be somewhat heavier. But it was also noted that the rise in mortality for obese individuals became steeper as excess weight increased.
Since the Metropolitan Life Tables guided clinical practice for decades by defi ning ideal or healthy weight - for - height, it is worth noting some limitations of the life insurance data on which the tables were based. They were primarily gathered from Caucasian, upper - and middle - income persons and as such were not representative of the US population as a whole. In an effort to address these limitations, the American Cancer Society (ACS) initiated a long - term longitudinal study in the general population (122 – 123) . The results of this study, conducted between 1969 and 1972 on 700,000 people, were similar to the two Build studies. This suggested that the data obtained from the insurance pool population could be extrapolated to the general population. All three studies found the lowest mortality at weights below the population average (119 – 120, 122 – 123) , suggesting that the distribution of weight in the US was shifting to higher levels and was associated with a shorter lifespan. Because the ACS was especially interested in cancer, it separated smokers from non - smokers, which the insurance studies had not done. Smoking is an independent risk factor for premature mortality and smokers tend to be leaner than nonsmokers. Since the two Build studies included smokers, they overstated the risks of being underweight and understated the mortality risk of being obese (119 – 120, 124) .
In 1984, Waaler and colleagues (125) reported on an extensive longitudinal study carried out in Norway. The lowest mortality was found in the BMI range of 23 – 25. In the younger male age groups, mortality began to rise more steeply at a BMI of 29. In women, the lowest mortality was in the BMI 23 – 27 range, and increased gradually above that.
The Framingham study was another longitudinal investigation, using a sample of the population of a typical
middle - class American town. This study also showed the lowest mortality occurred at weights that were 5 – 15% below the average weight of the population (126) . Two other longitudinal studies, in which subjects were followed for 34 and 26 years, respectively, showed a signifi cant independent effect of obesity on mortality (127 – 128) .
The Nurses ’ Health Study (63) , now in its 18th year, is following more than 100,000 US women to defi ne the association between a number of factors and mortality. The nurses ranged from 30 to 55 years of age at the start of the study. These workers reported a signifi cant association between BMI and mortality in a subpopulation that carefully excluded smokers. The lowest mortality was found at a weight at least 15% below the average weight for US women of similar age. The relative risk of dying prematurely from heart disease in non - smoking women began to rise at a BMI of 22, but reached statistical signifi cance at a BMI of 27, and was 7.7 times higher than the normal weight control group at a BMI > 32. The relative risk for all - cause mortality in non - smoking women also began to rise at a BMI of 22 and was 2.2 times greater at a BMI > 32. Thus, this study confi rms that overweight and obesity increase the risk of premature mortality in women, as had been previously reported for men in the Framingham study (126) .
Although many studies indicate a strong relationship between obesity and mortality, a number of studies have not found a relationship between the two (129 – 139) . There are at least two possible explanations for this. First, mortality studies must be of long enough duration so that the absolute number of deaths suitable for analysis is high enough to provide suffi cient statistical power to detect differences. In studies where different age groups are studied, this can be diffi cult to achieve. Second, in many of the studies the very diseases that are associated with or exacerbated by obesity have been eliminated or controlled for. For instance, diabetic patients have been excluded from most studies; hypertensive persons have either been excluded or blood pressure controlled in analyses. Because obesity exerts much of its effect through such conditions, the elimination of these comorbid conditions greatly attenuates the measured adverse effect of obesity. This has been discussed by Manson and colleagues (140) , who have shown that in 25 major prospective studies on the relationship between obesity and longevity, there was at least one of three biases that led to systematic underestimation of the impact of obesity on mortality. These biases are: 1) failure to control for cigarette smoking; 2) inappropriate control for the biological effects of obesity, such as hypertension and hyperglycemia; and 3) failure to control for the presence of subclinical disease. The latter is usually controlled for by discarding mortality data for the fi rst 3 – 5 years of the study in the event that those deaths were attributable to pre - existing disease that was undetected at the start of the study. These are some of the factors identifi ed by the WHO, which reviewed the evidence on this issue and concluded that obesity raises the risk for premature mortality “ well into the ninth decade of life ” (7) .

Epidemiology, Etiology, and Consequences of Obesity 21
In the US, corporate CEOs and state and federal polit-ical leaders are decrying healthcare costs which soared from $73 billion in 1970, to $253 billion in 1980, to $714 billion in 1990, to $2.1 trillion in 2006 (147 – 148) . These costs amount to more than $7,000 per resident and account for 16% of US gross domestic product (147 – 148) . The high prevalence of chronic illnesses has been identifi ed as one of the major factors driving healthcare costs. Other factors are long - term care services, such as nursing homes, prescription drugs, and assistive or ther-apeutic technology, the aging of the population, and escalating administrative costs. Except for administrative costs, as shown in Box 1 - 3 , obesity plays an important role in each factor identifi ed, although there is a great need for future research to provide more specifi c quan-titative information.
One Fortune 500 company recently documented a 19 cent reduction in earnings per share directly attributable to rising healthcare costs (149) . According to one source, since 2001 employees are paying 64% more in healthcare costs and employers are paying 78% more (150) . Indeed, the coffee giant Starbucks has 80,000 employees and in 2005 was reportedly spending more on health insurance than on coffee beans (151) .
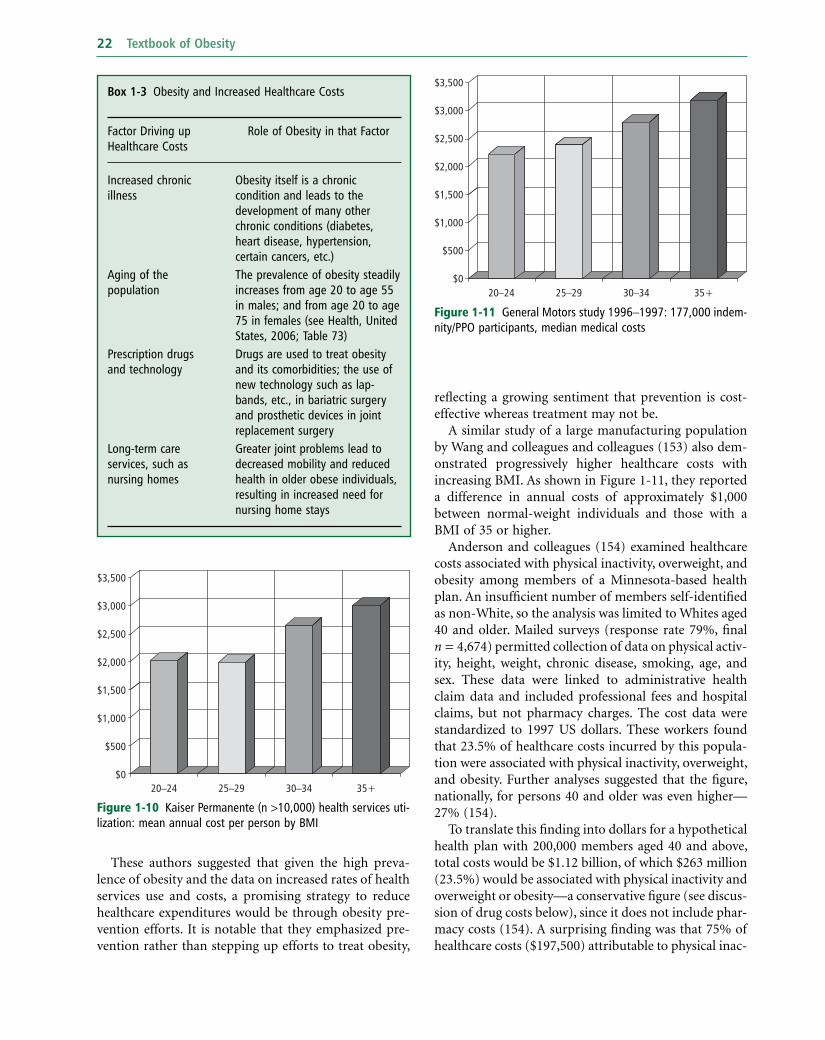
A number of workers have examined the linkage between obesity and rising healthcare costs. Quesenberry and colleagues (152) studied obesity and the cost of health services utilization among more than 10,000 respondents to a 1993 health survey of members of a large health maintenance organization in northern California (152) . The results (shown in Figure 1 - 10 ) indicated that the mean annual cost per person was 25 – 33% higher in obese persons — these additional costs amounting to as much as $500 – 1,000 per year (in 1993 dollars).
1997 National Health Interview Surveys (NHIS) to esti-mate direct medical costs. The data also included infor-mation about each person ’ s health insurance status and socio - demographic characteristics. This estimate of the costs of overweight and obesity combined amounted to as much as $78.5 billion, with $47.5 billion attributable to obesity alone, with Medicare and Medicaid fi nancing roughly half of these costs (144) .
When the costs of overweight and obesity are adjusted for infl ation and the data expressed in 2008 dollars, the direct costs of obesity reach as high as $147 billion (145) . It is estimated that this represented almost 10% of all medical spending in the US in 2008 (145) . Finkelstein and colleagues have estimated the costs of obesity at the state level, where costs range from $87 million (44% covered by Medicare and Medicaid) in Wyoming to $7.6 billion (45% covered by Medicare and Medicaid) in California (146) . It is worth noting that in 2009 the CDC budget specifi cally for the Division of Nutrition, Physical Activity and Obesity (DNPAO) for addressing obesity at the state level is insuffi ciently funded so that only 23 states are funded by the DNPAO for fi scal year 2009.
The cost of private insurance is usually shared by employers and individual workers, and is increasingly identifi ed as a sharply increasing business cost that is forcing some employers to withdraw health insurance for their employees. The majority of people who are privately insured obtain their insurance through their employer and the majority of employed persons regard health insurance as their most important job benefi t (147) . But the cost of health insurance is rising rapidly, especially for employers who employ fewer than 200 employees (see Figure 1 - 8 ).
The consequence is that smaller employers are forced to drop health insurance coverage for their employees, or they shift the costs — via higher premiums or co - pays — to their employees. Figure 1 - 9 illustrates the data for the years 2000 – 2.
Figure 1 - 8 Percent increase in costs of health insurance to employers, by size of workforce
18
1416
81012
2001%
246
02
<200 employees 200+ employees
Figure 1 - 9 Percentage of fi rms offering health benefi ts, by size of workforce
80
90
100
60
70
2000%
30
40
502001
2002
10
20
30
0<200 200+
22 Textbook of Obesity
refl ecting a growing sentiment that prevention is cost - effective whereas treatment may not be.
A similar study of a large manufacturing population by Wang and colleagues and colleagues (153) also dem-onstrated progressively higher healthcare costs with increasing BMI. As shown in Figure 1 - 11 , they reported a difference in annual costs of approximately $1,000 between normal - weight individuals and those with a BMI of 35 or higher.
Anderson and colleagues (154) examined healthcare costs associated with physical inactivity, overweight, and obesity among members of a Minnesota - based health plan. An insuffi cient number of members self - identifi ed as non - White, so the analysis was limited to Whites aged 40 and older. Mailed surveys (response rate 79%, fi nal n = 4,674) permitted collection of data on physical activ-ity, height, weight, chronic disease, smoking, age, and sex. These data were linked to administrative health claim data and included professional fees and hospital claims, but not pharmacy charges. The cost data were standardized to 1997 US dollars. These workers found that 23.5% of healthcare costs incurred by this popula-tion were associated with physical inactivity, overweight, and obesity. Further analyses suggested that the fi gure, nationally, for persons 40 and older was even higher — 27% (154) .
To translate this fi nding into dollars for a hypothetical health plan with 200,000 members aged 40 and above, total costs would be $1.12 billion, of which $263 million (23.5%) would be associated with physical inactivity and overweight or obesity — a conservative fi gure (see discus-sion of drug costs below), since it does not include phar-macy costs (154) . A surprising fi nding was that 75% of healthcare costs ($197,500) attributable to physical inac-
These authors suggested that given the high preva-lence of obesity and the data on increased rates of health services use and costs, a promising strategy to reduce healthcare expenditures would be through obesity pre-vention efforts. It is notable that they emphasized pre-vention rather than stepping up efforts to treat obesity,
Box 1 - 3 Obesity and Increased Healthcare Costs
Factor Driving up Healthcare Costs
Role of Obesity in that Factor
Increased chronic illness
Obesity itself is a chronic condition and leads to the development of many other chronic conditions (diabetes, heart disease, hypertension, certain cancers, etc.)
Aging of the population
The prevalence of obesity steadily increases from age 20 to age 55 in males; and from age 20 to age 75 in females (see Health, United States, 2006; Table 73)
Prescription drugs and technology
Drugs are used to treat obesity and its comorbidities; the use of new technology such as lap - bands, etc., in bariatric surgery and prosthetic devices in joint replacement surgery
Long - term care services, such as nursing homes
Greater joint problems lead to decreased mobility and reduced health in older obese individuals, resulting in increased need for nursing home stays
Figure 1 - 10 Kaiser Permanente (n > 10,000) health services uti-lization: mean annual cost per person by BMI
$3,500
$2,500
$3,000
$1,500
$2,000
$1,000
$0
$500
20–24 25–29 30–34 35+
Figure 1 - 11 General Motors study 1996 – 1997: 177,000 indem-nity/PPO participants, median medical costs
$3,500
$2,500
$3,000
$1,500
$2,000
$1,000
$0
$500
20–24 25–29 30–34 35+

Epidemiology, Etiology, and Consequences of Obesity 23
spread in women age 55 and older was even greater — approximately $3,000 per year (155) . These workers found that obesity was associated with higher costs in all major categories of care: hospital services, outpatient services, prescription medications, offi ce visits, and emergency room visits (155) . They singled out prescrip-tion medications, since obesity led to the largest relative rise in expenditures in this category, and suggested that this could mean that obesity is driving the rise in drug costs in the US. This observation may be relevant to another study, described below.
Over the next two and half decades, the number of people older than 65 will increase by 50%, predicting a precipitous rise in obesity - related health costs (155) associated with the aging of the population. According to the WHO, the estimated direct cost of obesity is com-parable to that of other prevalent chronic diseases, such as type 2 diabetes and coronary heart disease, and is more costly than both hypertension and stroke (7) . Moreover, obesity contributes to the development of other chronic diseases; it is estimated that 61% of the direct cost of type 2 diabetes, 17% of the direct cost of coronary heart disease, and 17% of the direct cost of hypertension are attributable to obesity (7) .
Costs of s evere o besity
According to Finkelstein and Brown (156) , 9% of the full - time US workforce is eligible for bariatric surgery. These severely obese (usually defi ned as a BMI of 40 or above) members of the workforce lose 5.1 additional days of work and incur more than $2,000 in excess medical costs each year compared to their normal - weight counterparts. Pregnancy in the severely obese is particularly costly because of the higher rate of preg-nancy complications, caesarean delivery and premature birth that requires placement of the infant in intensive care. At one hospital in New York City, it was estimated that the cost of pregnancies with those complications exceeds $200,000 as compared to $13,000 for a normal delivery (157) .
Only a small proportion of those eligible actually seek bariatric surgery for the treatment of their obesity. Barriers that have been identifi ed are lack of physician referrals, outmoded understanding of the various types and associated risks of bariatric procedures, and lack of insurance coverage for surgery. Bariatric surgery is a method of reducing food intake by reducing the size of the stomach to a tiny pouch, a procedure that usually involves rearranging the intestine to bypass the small intestine (see Chapter 19 ). The majority of patients lose 50 – 75% of their excess body weight within two years and keep most of it off over the long term. The procedure is costly to perform (see below) and requires a lifetime of
tivity and overweight or obesity were incurred by men, who comprised only 44% of the population (154) . This fi nding suggests the importance of designing population - level strategies to promote physical activity and stem overweight and obesity that are appealing to men aged 40 and older.
Wee and colleagues (155) used national 1998 Medical Expenditure Panel Survey (MEPS) data to examine the relationship between healthcare expenditures and BMI. MEPS is a national longitudinal survey funded by the Agency for Healthcare Research and Quality (AHRQ) (see www.meps.ahrq.gov ) which relies on self - reported data on healthcare expenditures, as well as demographic, insurance, and other information cross - validated with records kept by medical providers, insurers, and phar-macies. As shown in Figure 1 - 12 , these workers found a similar stepwise relationship between BMI category and costs in White women. Interestingly, these workers found no relationship between BMI and healthcare costs among Hispanics and Blacks. This might be explained by the small number of study subjects who were Black (i.e., insuffi cient power), but another factor cited by the authors was inferior access to and quality of healthcare and competing health risks and other causes of death for minority groups (155) .
An important fi nding in this study was that annual healthcare expenditures rose in a stepwise fashion with increasing BMI for all age groups older than 35 years. These workers noted that the relative rise was more sub-stantial as adults increased in age, so the difference in dollars spent between obese and normal - weight indi-viduals was nil in persons 18 – 34 years old, approximately $700 per year in persons 35 – 54 years old, and more than $2,000 per year in persons 55 years and older. The cost
Figure 1 - 12 National data on health care expenditures by BMI, white females 35 – 44 years old, 2003 dollars
$4,000
$3,000
$3,500
$2,000
$2,500
$1,000
$1,500
$0
$500
19–24 25–29 30–34 35–39 40+

24 Textbook of Obesity
surgical procedures that cost between $10,000 and $40,000 and require a lifetime of medical follow - up.
An emerging picture of signifi cantly higher medical costs among the obese will not necessarily result in greater advocacy for obesity treatment since treatment of obesity is in itself costly. One analysis, supported by AHRQ, on the cost - effectiveness of gastric bypass for severe obesity concluded that this procedure is cost - effective when compared to the cost of no treatment, and provides substantial lifetime benefi ts (164) . But AHRQ commented that since the reduction in lifetime medical cost was not greater than the cost of treatment, “ gastric bypass was not cost - saving from the payer perspective. ” An analysis by Heinen (149) focused on a large employer in the North - East who discovered that 85% of its 35,000 employees were overweight or obese. If just under half of those employees qualifi ed for drug treatment, Heinen calculated it would cost $1,800 per person or $27 million per year for an obesity “ drug that is prescribed indefi -nitely ” (149) . Studies such as these present a dilemma as to how to help people who are already obese lose weight, since the price tag for treatment can be high, especially when treatment involves costly drugs, medical services, surgery, and healthcare professional monitoring, and the success rate for nonsurgical treatment is reportedly low. Although the data are clear that for severe obesity bariatric surgery is effective and can produce sustained weight loss, the cost of such surgery is high, especially when the costs of postoperative complications and life-time follow up are factored in. Furthermore, surgery is not an appropriate choice for overweight people and perhaps not for obese people with a BMI of 30 – 40, although there is controversy regarding the threshold of BMI at which surgery is appropriate. There are lower - cost alternatives to surgery, such as the commercial Weight Watchers program and the noncommercial TOPS (Take Off Pounds Sensibly) program, but success rates of such programs are usually unknown and the training of service providers may be inadequate (7) . The continued growth of such programs, which were estab-lished in the US approximately 50 years ago, suggests that the model of trained laypersons delivering respon-sible weight - loss information and providing ongoing weight management support may well be a cost - effective approach that could be evaluated for its utility in com-munity settings. Such an approach is being used at the community level to increase physical activity and found to be cost - effective (165) . In January 2007, the state of West Virginia Medicaid program announced that it would begin providing free access to Weight Watchers to an estimated 75,000 eligible obese persons (166) . This approach is being attempted in 14 other states and the
follow - up, especially for patients with more than one obesity - related comorbidity prior to surgery, who face a higher risk of post - operative complications (158) . One study of 2,522 surgeries at 308 hospitals found that, in the fi rst 180 days postoperatively, the readmission rate was 18.2% and the total six - month risk - adjusted health-care payments were $65,031 in readmitted patients versus $27,125 in those without readmission (158) . Between 0.5% and 1.5% of patients die in the hospital (159) after the operation — a mortality rate that may not apply currently, as more and more hospitals and sur-geons start bariatric surgery programs (160) . In one study, researchers examined regional differences in severe obesity and bariatric surgery rates, as well as risk factors for death after surgery. They identifi ed nearly 70,000 patients who underwent the surgery in 2002 (161) and found that 85% were women and 76% were 18 – 49 years old. Interestingly, these workers found that the prevalence of severe obesity was lowest in the North - East and West and highest in the Mid - West and South (162) . However, the rates of bariatric surgery per 100,000 severely obese individuals ranged from a low of 139 in men aged 60 and older in the Mid - West to a high of 5,156 in women aged 40 to 49 in the North - East (162) .
Identifying appropriate candidates for bariatric surgery is crucial. In a study of nearly 55,000 adults who underwent bariatric surgery in 2001, Poulose and col-leagues (159, 161) found that being male or being older than 39 approximately doubled the risk of postoperative mortality. Patients insured through Medicaid faced a nearly fi ve - fold greater risk, and those requiring addi-tional surgery faced a more than 20 - fold greater risk of postoperative death (159) . These data emphasize the critical importance of appropriate patient selection, although other factors such as the number of procedures performed each year not just by the surgeon, but by the entire surgical team, are thought to be very important.
There is every reason to believe that the number of procedures performed each year will continue to rise as hospitals around the nation launch bariatric programs. The 2001 Surgeon General ’ s Report on Overweight and Obesity concluded that the economic costs of obesity exceed $100 billion annually (163) . As mentioned earlier, in 2008 direct costs alone were estimated to be nearly 50% higher than that fi gure (145) . Total economic costs of obesity (which would include both direct and indirect costs) are likely to be more than double that amount given the tremendous increase in the number of persons with a BMI of 40 or above since 2001 and the escalating number of hip and knee replacement surgeries due to overweight as well as the increased number of bariatric
Epidemiology, Etiology, and Consequences of Obesity 25
energy or calorie consumption, and the domain of insuf-fi cient energy expenditure, primarily through low levels of physical activity.
This section will address a variety of etiological factors that have been posited as favoring the development of obesity. It is offered from the point of view that no single factor is responsible for the development of obesity. Rather, many factors favor a positive energy balance, but the contribution of each is small and diffi cult to measure. If 0.45 kg of fat is roughly equivalent to 3,500 kcal, a positive energy balance of only 35 kcal a day leads to a weight gain of 0.9 – 1.35 kg a year. This translates to an increase of one BMI unit approximately every two years. Under this hypothetical scenario, a decade is suffi cient time to move from a BMI in the normal range to the obese range. Consequently, it is the identifi cation of all factors that favor positive energy balance that is the appropriate focus of our efforts to stem obesity. A few of these factors will be discussed below.
The Big Two: e ating and e xercise From a practical standpoint, there are only two avenues to weight control that an individual can infl uence — how much is consumed (i.e., food and drink) and how much physical activity engaged in. These are referred to as the Big Two (167) . It has rightly been pointed out that the environment, broadly defi ned to include the family, community, school, workplace, marketplace, built envi-ronment, and the entire cultural and socioeconomic context in which an individual lives, can profoundly infl uence the Big Two.
From the perspective of thermodynamics, body weight changes are a function of energy balance: weight gain occurs when energy intake exceeds energy expenditure, and weight loss occurs when energy expenditure exceeds energy intake. Energy is expended through three basic pathways: 1) resting metabolic rate (RMR), which is the energy expended to carry out bodily functions while the body is at rest, including the repair and maintenance of cells and tissues, the maintenance of resting heart rate, a constant body temperature, and other physiological processes needed to maintain a constant internal envi-ronmental and hormonal milieu; 2) the thermic effect of food, which is the excess heat generated when food is consumed, digested, and absorbed; and 3) physical activ-ity, which is variable and the only component of energy expenditure that is subject to voluntary control (7) .
The largest component of energy expenditure is RMR, which usually accounts for 60 – 70% of total daily energy expenditure (TEE) (168) . The thermic effect of food accounts for approximately 10%. The energy expendi-ture associated with physical activity is dependent on the
results will be of great interest to the public health com-munity, once they are available.
Taken together, the data presented above should galvanize employers to forge partnerships with health insurance providers to prevent weight gain among their normal - weight and overweight employees — and carefully examine their stake in addressing childhood obesity prevention, especially family - based approaches to treatment. Prevention and treatment of childhood obesity is not just right for the sake of protecting the health of children; it may also make good economic sense, although this remains to be demonstrated. Stemming healthcare costs associated with obesity depends on building a constituency for prevention, espe-cially a strategy for the prevention of childhood obesity that engages parents as well as other adults, as we strive to insure a healthy and competitive workforce in years to come.
The e tiology of o besity
Throughout most of human history corpulence was viewed as a sign of social status, health, and prosperity. For most people, a lifetime of hard physical labor, marked by daily struggles to secure a suffi cient amount and variety of food, was the common lot. Rural areas in third world countries such as India, where obesity is rare, demonstrate that the abundance and variety of afford-able food available in all seasons of the year and the widespread ability to earn a living without physical exer-tion are relatively recent phenomena. These are the ben-efi ts of technology, sophisticated agricultural techniques, and rapid transportation, supply, and distribution net-works that are still largely confi ned to fi rst world coun-tries and to rapidly modernizing urban centers in the third world.
It may seem odd to consider the etiology of obesity, when it may appear obvious that the cause is simply over - consumption of calories relative to the amount of calories needed for the maintenance of a healthy weight. But it is puzzling that some people seem to balance their food intake to match their energy expenditure without giving the matter much thought, whereas for others it is a constant struggle. It is equally puzzling that some people embrace physical activity with enthusiasm, while others make every effort to avoid it. The nature of the battle to control weight differs in subtle ways from one person to another. For some, the problem may be increased appetite and overeating, whereas for others, the issue is a sedentary lifestyle in which there is no necessity for physical activity. Perhaps for most of us, the challenge lies in both domains — the domain of excess

26 Textbook of Obesity
taste receptors on the tongue and stimulate neural signals to the brain that “ feed forward ” to encourage further consumption. This feed - forward concept is succinctly captured in the Madison Avenue slogan for a popular snack chip: “ Bet you can ’ t eat just one! ”
For an individual whose daily maintenance energy (calorie) needs are 1,800 kcal, the NHANES dietary intake data show that nearly 600 kcal are devoted to energy - dense, nutrient - poor foods, with two likely con-sequences: 1) it is a challenge to deliver a healthy diet and meet essential nutrient needs within the remaining 1,200 kcal; and 2) overeating is likely for the reasons discussed above. In this sense, the consumption of a high - fat, highly palatable diet can establish and perpetu-ate the obesity epidemic without delivering optimal nutrition.
Unlike the storage capacity for protein and carbohy-drate, which is very limited, the body ’ s storage capacity for fat is virtually unlimited. Since fat ’ s palatability and limited satiating capacity encourage overconsumption, a surfeit of dietary fat is a common occurrence. The human body does not respond to this physiological chal-lenge of excess fat consumption by increasing fat oxida-tion as a compensatory mechanism. Fat oxidation is generally proportionate to fat mass. So the physiological response is a slow expansion of fat stores (assuming calorie balance is positive); fat oxidation will slowly increase as fat stores expand until fat oxidation fi nally matches fat intake. But balance is achieved at the cost of a higher level of obesity. In summary, fat is especially fattening because it is the most energy - dense component of our diet and thus promotes a positive energy balance; in addition, it promotes its own consumption and it fails to stimulate its own oxidation (173 – 176) .
The widespread availability and affordability of a tasty, high - fat diet is a remarkable achievement of the 20th - century food, agriculture, transportation, and dis-tribution industries, but it favors a positive energy balance in a sedentary population such as the US popu-lation. Ready availability is buttressed by astute advertis-ing and merchandising strategies that encourage product trial. Further, the products are carefully formulated by food manufacturers to maximize their instant appeal to consumers (177) . The WHO has specifi cally suggested that lower fat intakes (in the range of 20 – 30% of energy) may be needed to minimize energy imbalance and weight gain in sedentary individuals (7) . How to achieve this reduction in fat intake on a population basis is a tremen-dous public health challenge, but large clinical trials to prevent diabetes (54 – 55) suggest that reductions in fat intake help produce and sustain weight loss over a period of several years and translate into signifi cant reductions in disease risk.
amount and nature of the physical activity one engages in. In a highly active individual, energy expended through physical activity might be as high as 40% of TEE, but it might be as little as 10% of TEE in a sedentary indi-vidual. Thus, for countries such as the US and UK in the 20th century, or China and India in the 21st, shifting from a primarily agricultural economy in which hard physical labor is common to a more technologically advanced, information - based economy in which it is not, the population will undergo a large reduction of energy expenditure, with perhaps as much as 600 – 1,000 fewer kcal expended per person per day. As physical activity levels decrease, appetite and calorie intake will spontaneously reduce as well (see Chapter 8 ), but other factors, such as the availability of inexpensive, highly palatable foods may interfere with this physiological down - regulation by stimulating food intake and pre-venting perfect compensation. This may explain the weight gain commonly observed under these circum-stances (169 – 170) . We will begin by considering the taste and palatability of foods which, evidence suggests, promote overconsumption.
Taste, f ood p alatability, and o verconsumption
The food industry is well aware that the single most important driver of food selection and consumption is taste. The taste and palatability of a new food product will be carefully tested on members of the market segment for whom the food is intended. The WHO has identifi ed palatability as “ one of the most powerful infl u-ences ” on feeding behavior, which acts by increasing the rate of eating, as well as the sense of hunger during and between meals (7) . (See Chapter 8 for more information on the regulation of appetite.)
A major contributor to the palatability of food is fat, which provides a pleasant “ mouth feel ” (as in ice cream) and is an excellent vehicle or carrier for fl avors, which is why it is used in sauces and gravies. But fat contains more than twice as many calories per gram as either carbohydrate or protein, and is therefore a major con-tributor to the energy density of foods, even as it con-tributes to their enhanced palatability. This may be a factor favoring positive energy balance, because, if an energy - dense food is consumed quickly, a large number of calories can be consumed before satiety has a chance to develop and the meal is terminated (171 – 172) .
A particularly palatable combination is fat and sugar, such as found in cupcakes, butter cookies, fudge, and so on. Drewnowski identifi ed combinations of fat and sugar as highly appealing to humans, and perhaps more appealing to obese women (171) than to their lean coun-terparts. Savory snack foods are formulated as highly palatable combinations of fat and salt that interact with

Epidemiology, Etiology, and Consequences of Obesity 27
described above. Nevertheless, the fi ndings of these two interventions support the notion that soda consumption favors a positive energy balance. Future studies of the value of reducing soft drink consumption as just one component of a multi - component prevention strategy should be pursued as a high priority.
Supersizing and p ortion c ontrol
Researchers have documented the increasing portion sizes offered on a routine basis to US consumers, includ-ing children (181) . Wansink has characterized portion size as one of the many external cues that encourage overeating and favor a positive energy balance (182) (see Chapter 6 ). Developmental data support this notion. Although infants are born with the ability to self - regulate their food intake, somewhere between the ages of 3 and 5 years that ability can be overridden by the presentation of large portion sizes, which will encourage them to eat, apparently in the absence of hunger (183) . Studies of the effects of portion size on the food intake of adults have documented a similar response. Adults will eat more when larger portions are offered (184) . Furthermore, larger plates and bowls and larger serving spoons encour-age them to serve larger portions and eat more as a consequence ( 185 ; see Chapter 6 ).
Supersizing is not just the marketing of a large portion of a food. It is an example of a marketing strategy that offers a highly attractive “ added value ” — a larger quan-tity of a tasty food — for little or no incremental cost. The consumer sees the supersized portion of food as a “ good value ” because the cost increment is negligibly small. Hence, the supersized portion appeals on a rational eco-nomic basis — because it is a bargain — as well as from a taste perspective. Supersized menu choices often are available in food establishments that are designed to appeal to children and their busy parents in many important ways: 1) the taste of the food is carefully crafted to appeal to children and adults alike through the strategic use of ingredients such as fat, salt, and sugar; 2) the economic value of supersized portions is appealing to those on a restricted food budget and to those who appreciate good value regardless of their budgetary con-straints; and 3) the convenience of such restaurants, many of which have drive - up window service or even a home delivery service that eliminates virtually all the time and trouble associated with planning, shopping, preparing, and cleaning up after meals. From a food industry perspective, a great deal of emphasis is being placed on the development of convenience foods for the US consumer. The appeal of convenience foods may involve a number of possible factors (see below), but this is an area in which more research is needed.
Sugar - s weetened s oft d rinks and s oda
The possible role of soda or soft drinks and other sugar - sweetened beverages in the development of positive energy balance is a matter of great interest. A meta - analysis of 88 studies (178) found associations of soft drink intake with increased energy intake and increased body weight. But not all studies have implicated soda as a cause of obesity. Vartanian and colleagues (178) sug-gested that study design signifi cantly infl uences the results. Larger effect sizes were found in studies using a stronger experimental design (i.e., longitudinal and experimental studies). Studies of weaker design (i.e., cross - sectional or observational studies) were less likely to fi nd an association. Thus, these workers concluded that population - based strategies to prevent childhood obesity by limiting soft drink consumption are “ strongly supported ” by the available scientifi c evidence.
In fact, only two of the 88 studies analyzed by Vartanian and colleagues (178) were designed to directly test whether reductions in soda consumption would lower BMI. One study by James and colleagues (179) designed a special curriculum to reduce soft drink consumption in 644 children aged 7 – 11 years old in six primary schools in south - west England from August 2001 to October 2002. After one year, the percentage of over-weight and obese children increased in the control group by 7.5% and decreased in the intervention group by 0.2%. This study has been criticized primarily because the documented decrease in soft drink consumption was very small ( ∼ 50 mL per day) and was of insuffi cient mag-nitude to explain this fi nding.
The second study was an intervention by Ebbeling and colleagues (180) conducted during the 2003 – 4 academic year. This was a small study of 103 subjects aged 13 – 18 years, who were daily consumers of at least 12 oz of soft drinks or other sugar - sweetened beverages. The subjects were randomized into two groups and calorie - free soda was delivered to the homes of the intervention subjects for 25 weeks. Control subjects were asked to continue usual beverage consumption habits for 25 weeks. Consumption of sugared soft drinks decreased by 82% in the intervention group and was unchanged in the controls. Change in BMI was not different between the two groups as a whole. However, an analysis of the heavi-est subjects in the two groups showed a greater benefi cial effect of reduced sweetened soda consumption in the intervention group as compared to the heaviest subjects in the control group (180) .
Because of the complexity of obesity and the many factors contributing to overweight, there is a low likeli-hood that a single change will have a benefi cial effect on weight gain, perhaps explaining the equivocal fi ndings
28 Textbook of Obesity
These results are certainly not an invitation to consume a 40% fat diet, which is unlikely to be heart - healthy in any event, but they do suggest that a low - fat diet favors the maintenance of energy balance, even in sedentary individuals. In physically fi t people, slowly increasing the level of fat in the diet will, at some point, overwhelm the body ’ s capacity to increase fat oxidation. Where this threshold lies in response to increases in exercise is not known and will likely vary from person to person, as the degree of training will also vary, but this needs to be verifi ed experimentally.
Other factors such as insulin secretion will likely modify this picture. Using a proxy measure of insulin secretion, Chaput and colleagues (192) showed that a high fi rst - phase insulin concentration (measured at 30 minutes after administration of a 75 g oral glucose load) predicts both gain in weight and waist circumference over six years in adults, especially among those consum-ing “ lower - fat ” diets.
A disappointing aspect of this study, as in so many studies of the effects of diet on weight gain and adiposity, was a failure to control for physical activity levels or fi tness. The natural experiment in Cuba described earlier showed that the Special Period was characterized by seve-ral years of a low - fat, high - carbohydrate “ diabetoge nic ” diet, accompanied by very high levels of physical activity, which resulted in signifi cant weight loss and improvement in diabetes and heart disease mortality (49) . In the Special Period, the intake of calories was limited by circumstances, whereas in the Chaput study (192) diet was not controlled, and in fact the mean changes in body weight and waist circumference did not differ between the lowest - and highest - fat diet groups (192) . If we are ever to determine the optimal diet composition for minimizing weight gain at all relevant levels of physical activity, an urgent research need is for researchers conducting diet studies to control for physical activity and for all exercise studies to control for diet (193) .
Energy fl ux and the m aintenance of e nergy b alance
An issue rarely receiving research attention is whether balancing food intake against energy expenditure is somehow more diffi cult to achieve at lower levels of energy fl ux. Consider the professional athlete who rou-tinely eats and expends 4,000 kcal a day and then retires from sports. His energy expenditure drops precipitously and, although his food intake decreases as well, he is no longer in energy balance and begins to steadily gain weight. Does the weight gain that usually accompanies such a change occur because balancing energy intake (i.e., food intake) against energy expenditure is more diffi cult at this new lower level of energy fl ux? This ques-
Convenience factors that have been identifi ed are 1) the parental time famine (186) , which leaves little time for meal planning, shopping, preparation, and clean - up; 2) marketing, which casts cooking as drudgery and presents purchased meals as cheaper and better than what can be made at home; 3) parental attitudes that each family member should be able to choose when and what to eat; and 4) cultural changes which have pro-moted TV time and TV dinners over family time and the family dinner (187) .
One interesting new tool designed to help researchers and program developers evaluate the nutritional features of foods as well as the pricing and promotion strategies of retail food outlets (restaurants, convenience stores, and grocery stores) is the Nutrition Environment Measurement Survey (NEMS) (188 – 189) . Although it requires training, NEMS can be used by laypersons to document the use of supersizing and other promotions that encourage the purchase of large portions that favor overeating. Work has begun to use NEMS data as the basis of programs designed to improve the nutrition environment in a community setting (190) .
Physical a ctivity
Physical activity exerts a powerful infl uence on the phys-iological regulation of body weight, partly because it is the major component of total energy expenditure that is under volitional control. Thus, increases in physical activity will boost energy expenditure and favor a nega-tive energy balance. An additional benefi cial adaptation of the human body to routine physical exercise is the enhanced capacity to preferentially oxidize fat. This means that physically trained individuals will oxidize more fat at a given level of energy expenditure than will an untrained individual. In other words, enhanced fat oxidation is a training effect; as much as a 20% increase in fat oxidation was documented in initially untrained individuals after a 12 - week fi tness training program (191) . This suggests that routine exercise suffi cient to become physically fi t will help maintain body weight not only by burning calories but also by specifi cally enhanc-ing fat oxidation.
This fi nding led other workers to examine whether the ability to handle dietary fat would differ depending on an individual ’ s customary level of physical activity. Stubbs and colleagues (175) found that sedentary indi-viduals consuming a low - fat (20% of calories) diet ad libitum remained in energy balance whereas the same individuals consuming a 40% fat diet ad libitum were in positive energy balance and stored the excess energy as fat. Moderate physical activity changed this by permit-ting ad libitum consumption of a 40% fat diet, without favoring a positive energy balance or fat storage (175) .

Epidemiology, Etiology, and Consequences of Obesity 29
Sleep d ebt
The possibility that sleep debt is a contributor to the obesity epidemic has gained currency in recent years (198 – 199) . It has been suggested that, in humans, sleep debt has a harmful effect on carbohydrate metabo-lism and endocrine function, and induces changes in hormones such as leptin and ghrelin (198, 200) . Lopez - Garcia and colleagues (201) conducted a prospective study, from 2001 to 2003, of > 3,500 older adults using self - reported data on sleep duration. These workers found that sleeping for 5 hours or less or sleeping 8 or 9 hours (but not 10 hours or more) was associated with obesity, but not abdominal obesity (201) , resulting in a roughly U - shaped relationship (if one ignores the ≥ 10 hour fi nding) between hours of sleep and obesity. Similar fi ndings have been reported in younger adults (201) and in a population aged 30 – 102 (202) .
Taheri has recommended that greater care should be taken to ensure that children get suffi cient sleep to prevent obesity (203) . Supporting this recommendation
tion is particularly important in children. If children are much more sedentary today than 20 years ago, as has been reported (194 – 195) , they need to regulate body weight at a lower level of energy fl ux. Gutin (196) , for example, studied 500 adolescent children using acceler-ometers to determine activity levels and 24 - hour recalls to assess diet. He found that vigorously active individuals had the highest calorie intake, yet were signifi cantly leaner than their less active counterparts who were con-suming fewer calories (196) . That obesity has become more prevalent in children of all ages is indisputable, as the data discussed above illustrate, but the possibility that the rise in obesity is a consequence of a mismatch of intake and expenditure that occurs more commonly and more readily at low levels of energy fl ux is intrigu-ing. Since the regulation of energy balance appears to be facilitated by high levels of vigorous, rather than moder-ate, activity in children (196) , promoting vigorous physi-cal activity in youth may be a critical refi nement of public health messages and strategies targeting youth.
In adults, public health messages to promote 30 minutes of daily physical activity are now well established, but the level of activity is carefully described as “ moderate ” and is an “ evidence - based ” message that relates to good health. For most people, however, 30 minutes of moderate physi-cal activity will not prevent the weight regain that often follows weight loss, nor is it likely to prevent weight gain, especially if overconsumption of foods and caloric bever-ages is a routine practice.
Other f actors i dentifi ed a s p utative c ontributors to o besity
Pharmaceutically i nduced w eight g ain
Aronne has helped raise awareness of the many drugs that induce weight gain and the need to carefully evaluate the possible undesirable consequences of the gain against the therapeutic benefi t, especially in cases where other options are available (197) (see Chapter 23 ). Keith and colleagues (167) have provided a convenient review of the wide range of drugs that produce weight gain and the list is impressive for its length and also for the wide range of disorders for which these drugs are prescribed (see Table 1 - 5 ).
These workers identifi ed several potential contributors to obesity that were known to have changed over the past 30 years, the period corresponding to the sharp increase in prevalence of obesity in the US, including the sales and use of the compounds on this list (167) . Clearly, the weight gain associated with these drugs is an unintended conse-quence of their use, but one that may understandably deter patient compliance. There seems little doubt that the widespread use of a wide variety of drugs is a likely con-tributing factor to the obesity epidemic.
Ref. (167) .
Table 1 - 5 Drugs that Produce Weight Gain
Pharmaceutical Agent Comments
Psychotropic medications (antipsychotics, antidepressants, mood stabilizers)
Many of these cause signifi cant weight gain
Anticonvulsants Promote weight gain
Anti - diabetics Insulin, sulfonylureas promote weight gain; thiazolidinediones promote adipocyte proliferation
Anti - hypertensives Beta - blockers induce mean weight gain of 1.2 kg
Steroid hormones and contraceptives
Data inconsistent on contraceptives
Antihistamines More potent compounds produce weight gain
Antidepressants Produce weight gain; data for selective serotonin reuptake inhibitors inconsistent
Atypical antipsychotics Olanzapine and clozapine produce as much as 4 kg over 10 weeks
HIV antiretroviral drugs Produce weight gain and abdominal adiposity
30 Textbook of Obesity
It is important to recall that BRFSS relies on self - reported height and weight to calculate BMI and does not include institutionalized individuals or individuals living without a telephone, the latter being a potentially important limitation in rural areas. Regrettably, these workers did not examine or control for physical activity levels, which are available through BRFSS. But they cite the work of others (208 – 209) showing that rural resi-dents are less likely than urban or suburban residents to meet recommendations for physical activity. Another issue not discussed is the quality of the foods available in grocery and convenience stores as well as restaurants in rural areas. Preliminary research (190) suggests that this lack of readily available produce and other nutri-tious foods of low energy density may also be a contribu-tory factor in accounting for urban/rural differences in obesity prevalence.
Socioeconomic s tatus and r ace/ e thnicity
In general, the literature suggests that in developed coun-tries there is an inverse relationship between socioeco-nomic status (SES) and obesity prevalence, whereas in developing countries it is the higher SES populations who are at higher risk for obesity (210 – 214) . Fewer studies of the relationship between obesity and SES in children and young people have been reported, and fewer still examine how race and ethnicity may change that relationship.
Wang and Zhang (215) examined secular trends in the relationship between obesity and SES, using NHANES data from 1971 to 2002 for 30,417 children aged 2 – 18 years. The ratio of household income to the poverty threshold varies with household size and other factors, and thus these workers divided the ratio data into “ Poverty income ratio ” tertiles to indicate low, middle, and high SES. Signifi cant differences by race, sex, and age were observed. These workers observed an inverse relationship between SES and obesity only in White girls. In other groups, the relationship was direct. African American chil-dren of high SES were at increased risk (215) .
A more recent study by Freedman and colleagues (216) , using NHANES data from 1999 to 2004, also found that White children of high SES were at decreased risk for obesity and that Mexican American children had a similarly decreased risk with high SES. Among Black children, however, the two studies showed that obesity is positively associated with SES (215 – 216) .
There is a strong similarity in the obesity – SES relation-ship for 6 – 11 - year - old children and 12 – 18 year olds within each ethnic group (216) . Whites and Mexican Americans are most similar to each other; in these two ethnic groups, obesity prevalence goes down as SES goes up in the two age categories. For Blacks, obesity prevalence increases with SES and that holds true for both 6 – 11 year
is a study of more than 8,500 four - year - old children showing that ensuring that children get adequate sleep (10.5 hours or more per night) was one of three house-hold routines associated with childhood obesity preven-tion (see Chapter 27 for more information). In children from homes supporting all three household routines, a 40% lower prevalence of obesity was observed as com-pared to children exposed to none of these routines (204) . The TV and other forms of recreational screen viewing (including texting on phones) interfere with sleep in a variety of ways; the location of TVs, videos, DVDs, and cell phones in the bedroom invite late - night phone calls and screen viewing that can delay bedtime or interrupt sleep. The content of shows can cause night-mares and delay the onset of sleep or cause sleep distur-bances (205) . Understanding how sleep may be connected to obesity is an area in which more research is needed, in both adults and youth.
Urban v s. r ural
Rural Healthy People 2010 (206) reported that individuals living in rural areas are more likely to be obese than resi-dents of urban areas, but studies are few. Jackson and col-leagues (207) used BRFSS data for the years 1994 – 96 ( n = 342,055) and for 2000 – 1 ( n = 385,384) to estimate the prevalence of obesity in rural areas and to describe trends. The data were organized into urban or rural categories based on county codes available on BRFSS. The rural cat-egory was further subdivided based on distance from a large metropolitan area or a town with ≥ 10,000 residents. The data showed that, overall, obesity prevalence was 20.5% in urban areas, but rural areas adjacent to large metropolitan centers had a 23.5% prevalence, sparsely populated rural areas had a prevalence of 23.3%, and more densely popu-lated rural areas had a prevalence of 21.1% (207) . These urban/rural differences were statistically signifi cant and the differences were smaller but remained signifi cant after the data were adjusted for other demographic factors. States with the highest rates of obesity in all types of rural counties combined were Mississippi, Texas, and Louisiana (207) . These workers noted interesting patterns in obesity preva-lence with respect to education. In urban areas, obesity prevalence declined substantially as years of education increased: prevalence among the college - educated was 5.1% lower than for those without a high school diploma. This gap narrowed to only 2% in sparsely populated rural areas. This fi nding suggested the possibility that options for preventing and reducing obesity are “ less accessible ” in rural than in urban counties (207) . They also reported substantially higher obesity prevalence among African Americans and also for American Indians living in rural counties, suggesting the need for culturally tailored inter-ventions (207) .
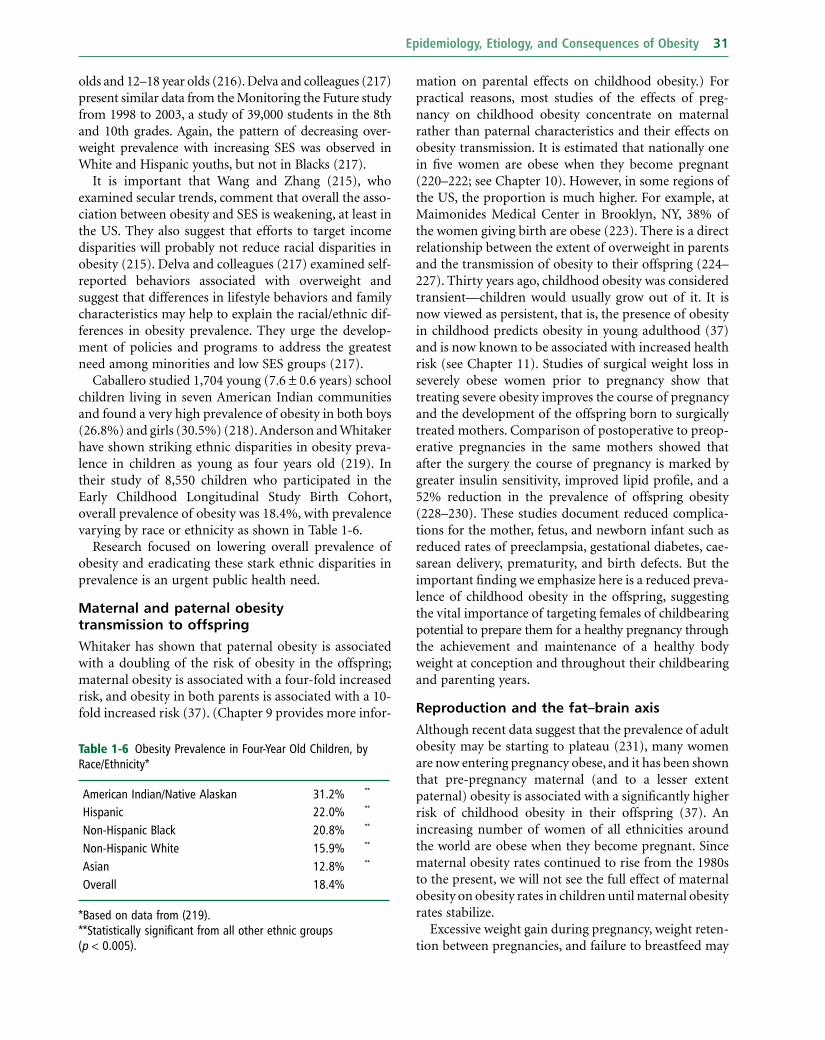
Epidemiology, Etiology, and Consequences of Obesity 31
mation on parental effects on childhood obesity.) For practical reasons, most studies of the effects of preg-nancy on childhood obesity concentrate on maternal rather than paternal characteristics and their effects on obesity transmission. It is estimated that nationally one in fi ve women are obese when they become pregnant ( 220 – 222 ; see Chapter 10 ). However, in some regions of the US, the proportion is much higher. For example, at Maimonides Medical Center in Brooklyn, NY, 38% of the women giving birth are obese (223) . There is a direct relationship between the extent of overweight in parents and the transmission of obesity to their offspring (224 – 227) . Thirty years ago, childhood obesity was considered transient — children would usually grow out of it. It is now viewed as persistent, that is, the presence of obesity in childhood predicts obesity in young adulthood (37) and is now known to be associated with increased health risk (see Chapter 11 ). Studies of surgical weight loss in severely obese women prior to pregnancy show that treating severe obesity improves the course of pregnancy and the development of the offspring born to surgically treated mothers. Comparison of postoperative to preop-erative pregnancies in the same mothers showed that after the surgery the course of pregnancy is marked by greater insulin sensitivity, improved lipid profi le, and a 52% reduction in the prevalence of offspring obesity (228 – 230) . These studies document reduced complica-tions for the mother, fetus, and newborn infant such as reduced rates of preeclampsia, gestational diabetes, cae-sarean delivery, prematurity, and birth defects. But the important fi nding we emphasize here is a reduced preva-lence of childhood obesity in the offspring, suggesting the vital importance of targeting females of childbearing potential to prepare them for a healthy pregnancy through the achievement and maintenance of a healthy body weight at conception and throughout their childbearing and parenting years.
Reproduction and the f at – b rain a xis
Although recent data suggest that the prevalence of adult obesity may be starting to plateau (231) , many women are now entering pregnancy obese, and it has been shown that pre - pregnancy maternal (and to a lesser extent paternal) obesity is associated with a signifi cantly higher risk of childhood obesity in their offspring (37) . An increasing number of women of all ethnicities around the world are obese when they become pregnant. Since maternal obesity rates continued to rise from the 1980s to the present, we will not see the full effect of maternal obesity on obesity rates in children until maternal obesity rates stabilize.
Excessive weight gain during pregnancy, weight reten-tion between pregnancies, and failure to breastfeed may
olds and 12 – 18 year olds (216) . Delva and colleagues (217) present similar data from the Monitoring the Future study from 1998 to 2003, a study of 39,000 students in the 8th and 10th grades. Again, the pattern of decreasing over-weight prevalence with increasing SES was observed in White and Hispanic youths, but not in Blacks (217) .
It is important that Wang and Zhang (215) , who examined secular trends, comment that overall the asso-ciation between obesity and SES is weakening, at least in the US. They also suggest that efforts to target income disparities will probably not reduce racial disparities in obesity (215) . Delva and colleagues (217) examined self - reported behaviors associated with overweight and suggest that differences in lifestyle behaviors and family characteristics may help to explain the racial/ethnic dif-ferences in obesity prevalence. They urge the develop-ment of policies and programs to address the greatest need among minorities and low SES groups (217) .
Caballero studied 1,704 young (7.6 ± 0.6 years) school children living in seven American Indian communities and found a very high prevalence of obesity in both boys (26.8%) and girls (30.5%) (218) . Anderson and Whitaker have shown striking ethnic disparities in obesity preva-lence in children as young as four years old (219) . In their study of 8,550 children who participated in the Early Childhood Longitudinal Study Birth Cohort, overall prevalence of obesity was 18.4%, with prevalence varying by race or ethnicity as shown in Table 1 - 6 .
Research focused on lowering overall prevalence of obesity and eradicating these stark ethnic disparities in prevalence is an urgent public health need.
Maternal and p aternal o besity t ransmission to o ffspring
Whitaker has shown that paternal obesity is associated with a doubling of the risk of obesity in the offspring; maternal obesity is associated with a four - fold increased risk, and obesity in both parents is associated with a 10 - fold increased risk (37) . (Chapter 9 provides more infor-
Table 1 - 6 Obesity Prevalence in Four - Year Old Children, by Race/Ethnicity *
American Indian/Native Alaskan 31.2% * * Hispanic 22.0% * * Non - Hispanic Black 20.8% * * Non - Hispanic White 15.9% * * Asian 12.8% * * Overall 18.4%
* Based on data from (219) . * * Statistically signifi cant from all other ethnic groups ( p < 0.005).
32 Textbook of Obesity
(167) discuss endocrine disrupters and other possible intra - uterine and intergenerational phenomena that may be at play, including the possible infl uence of adenovirus - 36 (167) .
A particularly interesting study of the development of obesity and the metabolic syndrome in an animal model suggests a possible role for the microbiota in the gastro intestinal tract (238) . These workers point out that the development of obesity is associated with a shift in the relative abundance of the bacterial phyla colonizing the gut, possibly causing a shift in the innate immunity of the organism and a decrease in metabolic health. Toll - like receptor 5 (TLR5) is a transmembrane protein that is highly expressed in the intestinal mucosal cell and is capable of binding bacterial fl agella. Mice that are geneti-cally defi cient in this receptor show signs of an infl am-matory state and are heavier and fatter than their wild counterparts, with a particular increase in visceral fat. The defi cient mice show substantial increases in serum lipids and blood pressure, mild elevations in blood glucose, elevated basal insulin levels, and loss of glycemic control. When high - fat fed, they displayed hepatic steatosis (fatty liver) and other signs of insulin resistance. When food intake is restricted, many of these changes normalize (238) . A crucial fi nding in these studies is that transfer of the gut microbiota from the defi cient mice to wild - type germ - free animals established the hyperphagia, obesity, hyperglycemia, insulin resistance, and elevated levels of infl ammatory markers in these new hosts, suggesting that host – microbiota interactions may play a fundamental role in the development of the hyperphagia and obesity (238) . These fi ndings warrant further investigation for their rel-evance to human obesity and the development of the metabolic syndrome.
With one third of the US adult population obese, the growing prevalence of obesity in women of childbearing age may be predisposing the next generation to enter their childbearing years in the obese state, creating a self - perpetuating cycle of maternal and child obesity (233) . It has long been known that excessive thinness and exces-sive obesity are both associated with infertility, but even so Keith and colleagues (167) have raised the possibility that women with higher BMI may have greater fecundity and higher reproductive fi tness, which they defi ne as “ one ’ s capacity to pass on one ’ s DNA ” (167) . They also suggest that “ assortative mating, ” in which phenotypi-cally similar individuals are more likely to mate with one another, may result in a higher rate of individuals with higher BMI mating with each other. Whether they pass on obesity to their offspring through a combination of genetic and environmental factors (since parents provide both to their offspring), the result is increasing preva-lence of obesity over time. This vicious cycle of events
all be factors contributing to the obesity epidemic. These factors will be considered in detail in Chapter 10 . It is noteworthy that cultural factors may play an important role. For example, Vallianatos and colleagues (232) examined the beliefs and practices of First Nation women (Cree women in north Quebec) about weight gain during pregnancy and breastfeeding practices. These workers found that the women acknowledged the health consequences of excessive weight gain but cited a number of barriers to controlling weight gain, such as lack of time, beliefs about diet, lack of child care, and a paucity of programs for new mothers (232) .
Catalano (233 – 235) has postulated that the presence of maternal insulin resistance and a chronic infl amma-tory condition associated with maternal obesity may play a role in the rising prevalence of obesity. Normal pregnancy is considered an insulin - resistant state, but obesity, especially obesity with underlying insulin resist-ance, may alter the hormonal milieu for the developing fetus to selectively favor fetal fat deposition. Elevated fat stores in the fetus would raise fetal leptin levels that shape feeding centers in the hypothalamus, altering neural development to favor increased appetite and a positive energy balance.
A normal infant is born with a fully developed capac-ity to experience hunger and responds by eating to satiety. Bouret and colleagues (236) have suggested that the hormone leptin affects both neuronal activity and synaptic plasticity in the arcuate nucleus of the hypoth-alamus, playing a neurotrophic role during a critical period of fetal brain development. This region of the hypothalamus is thought to house two populations of neurons with opposing actions on food intake (see Chapter 8 ). One population stimulates and the other suppresses food intake (237) . Whether this obtains in humans remains to be demonstrated, but it is possible that an enlarged fetal fat mass, driven by the insulin - resistant state prevailing in the obese mother, produces elevated levels of leptin and other hormones that drive the developing hypothalamic fetal appetite regulatory system toward a positive energy balance.
In their review of possible causes of obesity, Keith and colleagues (167) presented evidence that maternal age (i.e., the age at which women bear children) is increasing globally. They suggest that this secular trend might produce a clinically meaningful (approximately 7%) increase in the odds of obesity. The above scenario is but one possible explanation of how this might occur. The possibility of expanded fat stores in the fetus and newborn is troubling in light of increasing environmen-tal exposure to fat - soluble hormones and toxicants that may infl uence metabolism and the eventual develop-ment of obesity comorbidities. Keith and colleagues

Epidemiology, Etiology, and Consequences of Obesity 33
ternal or dizygotic) twin pairs. The differences between within - pair correlations observed in groups of the two types of twins provide us with an estimate of the contri-bution of the heritability of a trait — that is, a measure of the extent to which the phenotypic (manifested) vari-ation in a trait such as obesity is genetically determined. Remaining phenotypic variation in this trait is attributed to environmental factors (241) . There are studies com-paring twins (identical and fraternal) reared apart to those reared together, and these provide additional information about the effects of genetic inheritance as compared to the effects of environment.
Published adult twin and adoption studies have found that variation in BMI was largely due to heritable genetic factors and the heritability estimates in these studies range from 55% to 85% (241) . Twin studies have yielded the additional insight that most of the environmental infl uences on BMI come from unique infl uences (non - shared environmental effects), rather than from the shared family context.
Wardle and colleagues (241) observed that most twin studies have been conducted in adults and speculated that shared environment effects (family infl uences) may be stronger in pediatric samples. They also sought to study a pediatric sample born after the onset of the obesity epidemic (241) . These workers reported that BMI and abdominal obesity, as indicated by high waist circumference, have a high heritability factor, as high as 77% for BMI. They found that environmental effects are small and are roughly equally divided between shared and not - shared environmental effects (241) . It is note-worthy that the authors of this study still recommend targeting the family for obesity prevention in the earliest years, and suggest that “ longer - term weight control ” will require both “ individual engagement and society - wide efforts to modify the environment, ” clearly indicating their belief that the current obesity epidemic can be addressed, despite the high heritability of both BMI and central adiposity (241) . To explain what may appear to be a paradoxical position, the authors provide the example of phenylketonuria, a genetic disease that is entirely heritable which is nonetheless treated by an environmental intervention, specifi cally a phenylalanine - free diet. This illustrates the important point that although a trait such as BMI or central adiposity is highly heritable, it does not justify a fatalistic view that nothing can be done to address the problem.
Conclusion
Obesity is an increasingly prevalent and costly problem in the developed and developing world. It carries health risks for the populations affected, and increases
provides an entirely new rationale for addressing paren-tal, perhaps especially maternal, obesity as a cornerstone of childhood obesity prevention, and may represent an important strategy to stem the obesity epidemic.
One especially interesting study of the effects of maternal obesity on childhood obesity was conducted by Kral and colleagues (228 – 229) . These workers compared the prevalence of obesity among 172 children who were born to surgically weight - reduced mothers (BMI = 31 ± 9 kg/m 2 ) and 45 age - matched siblings born to severely obese mothers (BMI = 48 ± 8 kg/m 2 ) prior to surgery. In children born after maternal surgery, the prevalence of obesity decreased by 52% (with no increase in the preva-lence of underweight) and prevalence was reduced to population levels. The authors suggest that their results demonstrate the importance of “ potentially modifi able epigenetic factors ” that need to be identifi ed and char-acterized (229) . Since severe obesity, such as that present in these mothers prior to their bariatric surgery, is con-sidered by some to be under genetic control, the fi ndings of Kral and colleagues (228 – 229) raise important ques-tions about what that really means with respect to the obesity epidemic.
Genetics
According to the WHO, the rapid increase in obesity rates in recent years has occurred “ in too short a time for there to have been any signifi cant genetic changes within populations ” (7) . They suggest that the focus should be on “ environmental and societal changes ” that have “ overwhelmed the physiological regulatory proc-esses that operate to keep weight stable in the long term ” (7) . Others disagree (239) , citing numerous studies in the literature suggesting possible changes in the genetic background of contemporary populations by factors such as assortative mating, increased fecundity of mod-erately overweight persons, demographic changes in a population, and epigenetic effects (239) . (See Chapter 5 for more information on the genetics of obesity.)
Misunderstandings arise from how the heritability of obesity is discussed and understood by scientists and how it is represented in the media. Coverage often refl ects the “ all - or - nothing ” view of the issue (240) , whereas the actual science is complex and nuanced. The risk of wide-spread ignorant or irresponsible media coverage is that individuals or entire populations will regard their current weight, BMI, or waist circumference as inevitable and unchangeable, which may then translate into a fatalistic view of their current and future health.
The twin method of studying the heritability of obesity depends on comparing the manifested ( pheno-typic ) similarity or dissimilarity of genetically identical (i.e., monozygotic) vs. genetically non - identical (i.e., fra-

34 Textbook of Obesity
use. But food is more diffi cult to limit than tobacco, and physical activity is noxious to many people, especially as they get older. At a 2008 national summit on obesity prevention and control sponsored by the CDC (243) , 10 factors were identifi ed as targets for obesity prevention efforts (see Box 1 - 4 ). The fi rst six are identifi ed as “ behavior target areas that form an evidence - based framework to prevent and control obesity ” (244) . The last four are additional areas in the social domain that “ require attention to appropriately address the social impact of obesity ” (244) .
This book offers the reader valuable information on each of the target areas for obesity prevention that the CDC has identifi ed. Indeed, this book can be viewed as a tool that will inform and, we hope, galvanize readers who will help us pave the way toward the CDC vision of “ [a] world where regular physical activity, good nutrition, and healthy weight are part of everyone ’ s life ” (245) .
morbidity and mortality to such an extent as to present a very signifi cant public cost. The etiology of obesity has been diffi cult to untangle, but there is clearly a genetic component to acquiring excess weight. The genetic sus-ceptibility of an individual seems to be fully expressed in environments in which food is tasty, variable, plenti-ful, cheap, and widely promoted, and in which technol-ogy has replaced human physical labor in most aspects of endeavor. While the genetic mechanisms involved have begun to be unraveled, obesity in most cases is likely to be a polygenic disease in which numerous genes interact to facilitate obesity to develop when the envi-ronment is permissive.
Although studies are lacking, it may prove to be more cost - effective to prevent weight gain than to lose weight once obesity occurs. Without proof that this proposition is true, it is clear that prevention is viewed as the answer to this great public health problem, as it has been for the last fi ve decades (242) . Yet it is important to bear in mind that there is no natural constituency for obesity preven-tion, which is costly, as there is for obesity treatment, which is also costly, but represents a business opportu-nity for a number of industries. The industries that can view obesity treatment as an opportunity include phar-maceutical manufacturers, dietetic food and beverage manufacturers, weight loss services, and surgical device manufacturers, to name just a few.
Building support for prevention as a national priority requires an increased awareness of the health risks and costs associated with obesity and of the health advan-tages of increased physical activity, wholesome food choices, and healthy weight. A change in lifestyle is nec-essary for most Americans, the motivation of which is currently not well understood. It will likely require awareness of the dangers of obesity and embracing a healthy weight as a desirable and shared cultural value with a view to establishing it eventually as a cultural norm.
One factor militating against lifestyle change is the delay in onset of the negative consequences of obesity. It is diffi cult to change behavior if the desired outcome or benefi t is many years in the future and that benefi t is the absence of the development of a disease. To persuade an individual to change behavior now to prevent an event 10 – 20 years in the future is not easy. It requires a clear awareness of the health risks of obesity and acceptance that lifestyle change is possible, which is now missing in most population groups. It also requires the identifi ca-tion, availability, and affordability of solutions that will facilitate change.
Public education will be necessary, much as public education about tobacco was necessary to decrease its
Box 1 - 4 Targets for Obesity Prevention Efforts
1. Reducing consumption of “ energy - dense ” or high - calorie foods.
2. Reducing consumption of sugar - sweetened beverages. 3. Increasing consumption of fruit and vegetables. 4. Increasing the initiation and duration of exclusive
breastfeeding. 5. Reducing screen - time (TV, movies, computers, video
games). 6. Increasing physical activity across the lifespan. 7. Increasing development and dissemination of
guidelines for physical activity and physical education standards.
8. Improving societal responses to the causes and condition of obesity, including reducing stigma and discrimination and improving disparities in priority indicators among population subgroups.
9. Reducing disparities in access to healthcare services for obese persons (e.g., medical coverage for obesity - related health conditions and treatment, durable medical equipment to conduct regular and routine exams, education and information dissemination to healthcare providers).
10. Reducing barriers to obesity prevention and control (e.g., consensus - building on the defi nition and classifi cation of obesity as a disability and/or disabling condition) (244) .
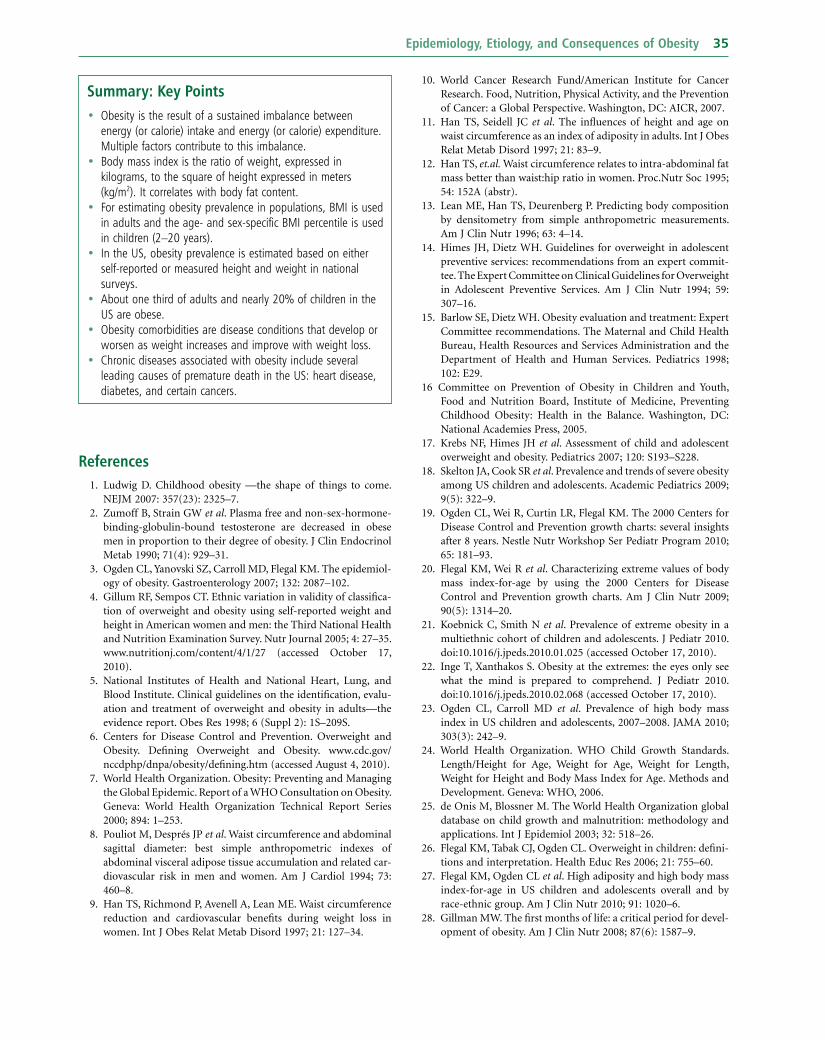
Epidemiology, Etiology, and Consequences of Obesity 35
10. World Cancer Research Fund/American Institute for Cancer Research . Food, Nutrition, Physical Activity, and the Prevention of Cancer: a Global Perspective . Washington, DC : AICR , 2007 .
11. Han TS , Seidell JC et al . The infl uences of height and age on waist circumference as an index of adiposity in adults . Int J Obes Relat Metab Disord 1997 ; 21 : 83 – 9 .
12. Han TS , et.al. Waist circumference relates to intra - abdominal fat mass better than waist:hip ratio in women . Proc.Nutr Soc 1995 ; 54 : 152A (abstr).
13. Lean ME , Han TS , Deurenberg P . Predicting body composition by densitometry from simple anthropometric measurements . Am J Clin Nutr 1996 ; 63 : 4 – 14 .
14. Himes JH , Dietz WH . Guidelines for overweight in adolescent preventive services: recommendations from an expert commit-tee. The Expert Committee on Clinical Guidelines for Overweight in Adolescent Preventive Services . Am J Clin Nutr 1994 ; 59 : 307 – 16 .
15. Barlow SE , Dietz WH . Obesity evaluation and treatment: Expert Committee recommendations. The Maternal and Child Health Bureau, Health Resources and Services Administration and the Department of Health and Human Services . Pediatrics 1998 ; 102 : E29 .
16 Committee on Prevention of Obesity in Children and Youth, Food and Nutrition Board, Institute of Medicine, Preventing Childhood Obesity: Health in the Balance . Washington, DC : National Academies Press , 2005 .
17. Krebs NF , Himes JH et al . Assessment of child and adolescent overweight and obesity . Pediatrics 2007 ; 120 : S193 – S228 .
18. Skelton JA , Cook SR et al . Prevalence and trends of severe obesity among US children and adolescents. Academic Pediatrics 2009 ; 9 ( 5 ): 322 – 9 .
19. Ogden CL , Wei R , Curtin LR , Flegal KM . The 2000 Centers for Disease Control and Prevention growth charts: several insights after 8 years . Nestle Nutr Workshop Ser Pediatr Program 2010 ; 65 : 181 – 93 .
20. Flegal KM , Wei R et al . Characterizing extreme values of body mass index - for - age by using the 2000 Centers for Disease Control and Prevention growth charts . Am J Clin Nutr 2009 ; 90 ( 5 ): 1314 – 20 .
21. Koebnick C , Smith N et al . Prevalence of extreme obesity in a multiethnic cohort of children and adolescents . J Pediatr 2010 . doi:10.1016/j.jpeds.2010.01.025 (accessed October 17, 2010).
22. Inge T , Xanthakos S . Obesity at the extremes: the eyes only see what the mind is prepared to comprehend . J Pediatr 2010 . doi:10.1016/j.jpeds.2010.02.068 (accessed October 17, 2010).
23. Ogden CL , Carroll MD et al . Prevalence of high body mass index in US children and adolescents, 2007 – 2008 . JAMA 2010 ; 303 ( 3 ): 242 – 9 .
24. World Health Organization . WHO Child Growth Standards. Length/Height for Age, Weight for Age, Weight for Length, Weight for Height and Body Mass Index for Age. Methods and Development . Geneva : WHO , 2006 .
25. de Onis M , Blossner M. The World Health Organization global database on child growth and malnutrition: methodology and applications . Int J Epidemiol 2003 ; 32 : 518 – 26 .
26. Flegal KM , Tabak CJ , Ogden CL . Overweight in children: defi ni-tions and interpretation . Health Educ Res 2006 ; 21 : 755 – 60 .
27. Flegal KM , Ogden CL et al . High adiposity and high body mass index - for - age in US children and adolescents overall and by race - ethnic group . Am J Clin Nutr 2010 ; 91 : 1020 – 6 .
28. Gillman MW. The fi rst months of life: a critical period for devel-opment of obesity . Am J Clin Nutr 2008 ; 87 ( 6 ): 1587 – 9 .
Summary: Key Points • Obesity is the result of a sustained imbalance between
energy (or calorie) intake and energy (or calorie) expenditure. Multiple factors contribute to this imbalance.
• Body mass index is the ratio of weight, expressed in kilograms, to the square of height expressed in meters (kg/m 2 ). It correlates with body fat content.
• For estimating obesity prevalence in populations, BMI is used in adults and the age - and sex - specifi c BMI percentile is used in children (2 – 20 years).
• In the US, obesity prevalence is estimated based on either self - reported or measured height and weight in national surveys.
• About one third of adults and nearly 20% of children in the US are obese.
• Obesity comorbidities are disease conditions that develop or worsen as weight increases and improve with weight loss.
• Chronic diseases associated with obesity include several leading causes of premature death in the US: heart disease, diabetes, and certain cancers.
References 1. Ludwig D. Childhood obesity — the shape of things to come .
NEJM 2007 : 357 ( 23 ): 2325 – 7 . 2. Zumoff B , Strain GW et al . Plasma free and non - sex - hormone -
binding - globulin - bound testosterone are decreased in obese men in proportion to their degree of obesity . J Clin Endocrinol Metab 1990 ; 71 ( 4 ): 929 – 31 .
3. Ogden CL , Yanovski SZ , Carroll MD , Flegal KM . The epidemiol-ogy of obesity . Gastroenterology 2007 ; 132 : 2087 – 102 .
4. Gillum RF , Sempos CT . Ethnic variation in validity of classifi ca-tion of overweight and obesity using self - reported weight and height in American women and men: the Third National Health and Nutrition Examination Survey . Nutr Journal 2005 ; 4 : 27 – 35 . www.nutritionj.com/content/4/1/27 (accessed October 17, 2010).
5. National Institutes of Health and National Heart, Lung, and Blood Institute . Clinical guidelines on the identifi cation, evalu-ation and treatment of overweight and obesity in adults — the evidence report . Obes Res 1998 ; 6 ( Suppl 2 ): 1S – 209S .
6. Centers for Disease Control and Prevention . Overweight and Obesity . Defi ning Overweight and Obesity. www.cdc.gov/nccdphp/dnpa/obesity/defi ning.htm (accessed August 4, 2010 ).
7. World Health Organization . Obesity: Preventing and Managing the Global Epidemic . Report of a WHO Consultation on Obesity. Geneva : World Health Organization Technical Report Series 2000 ; 894 : 1 – 253 .
8. Pouliot M , Despr é s JP et al . Waist circumference and abdominal sagittal diameter: best simple anthropometric indexes of abdominal visceral adipose tissue accumulation and related car-diovascular risk in men and women . Am J Cardiol 1994 ; 73 : 460 – 8 .
9. Han TS , Richmond P , Avenell A , Lean ME . Waist circumference reduction and cardiovascular benefi ts during weight loss in women . Int J Obes Relat Metab Disord 1997 ; 21 : 127 – 34 .
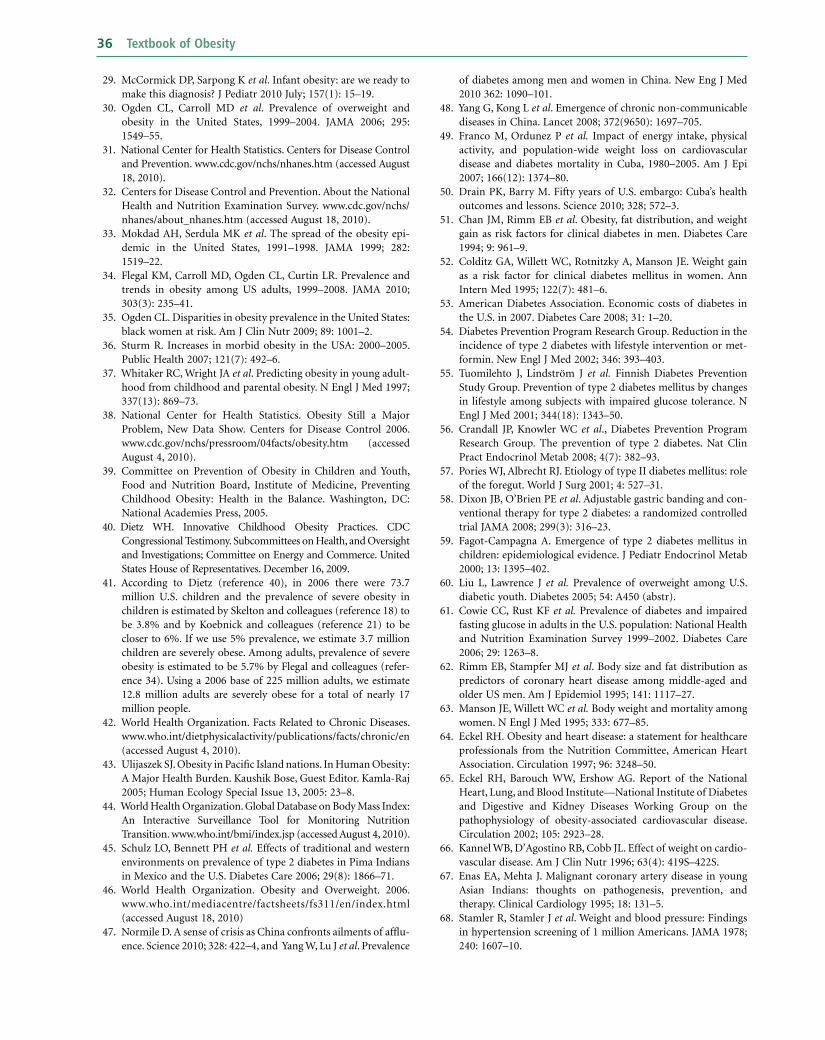
36 Textbook of Obesity
of diabetes among men and women in China . New Eng J Med 2010 362 : 1090 – 101 .
48. Yang G , Kong L et al . Emergence of chronic non - communicable diseases in China . Lancet 2008 ; 372 ( 9650 ): 1697 – 705 .
49. Franco M , Ordunez P et al. Impact of energy intake, physical activity, and population - wide weight loss on cardiovascular disease and diabetes mortality in Cuba, 1980 – 2005 . Am J Epi 2007 ; 166 ( 12 ): 1374 – 80 .
50. Drain PK , Barry M . Fifty years of U.S. embargo: Cuba ’ s health outcomes and lessons . Science 2010 ; 328 ; 572 – 3 .
51. Chan JM , Rimm EB et al . Obesity, fat distribution, and weight gain as risk factors for clinical diabetes in men . Diabetes Care 1994 ; 9 : 961 – 9 .
52. Colditz GA , Willett WC , Rotnitzky A , Manson JE . Weight gain as a risk factor for clinical diabetes mellitus in women . Ann Intern Med 1995 ; 122 ( 7 ): 481 – 6 .
53. American Diabetes Association . Economic costs of diabetes in the U.S. in 2007 . Diabetes Care 2008 ; 31 : 1 – 20 .
54. Diabetes Prevention Program Research Group . Reduction in the incidence of type 2 diabetes with lifestyle intervention or met-formin . New Engl J Med 2002 ; 346 : 393 – 403 .
55. Tuomilehto J , Lindstr ö m J et al. Finnish Diabetes Prevention Study Group. Prevention of type 2 diabetes mellitus by changes in lifestyle among subjects with impaired glucose tolerance . N Engl J Med 2001 ; 344 ( 18 ): 1343 – 50 .
56. Crandall JP , Knowler WC et al ., Diabetes Prevention Program Research Group. The prevention of type 2 diabetes . Nat Clin Pract Endocrinol Metab 2008 ; 4 ( 7 ): 382 – 93 .
57. Pories WJ , Albrecht RJ . Etiology of type II diabetes mellitus: role of the foregut . World J Surg 2001 ; 4 : 527 – 31 .
58. Dixon JB , O ’ Brien PE et al . Adjustable gastric banding and con-ventional therapy for type 2 diabetes: a randomized controlled trial JAMA 2008 ; 299 ( 3 ): 316 – 23 .
59. Fagot - Campagna A. Emergence of type 2 diabetes mellitus in children: epidemiological evidence . J Pediatr Endocrinol Metab 2000 ; 13 : 1395 – 402 .
60. Liu L , Lawrence J et al. Prevalence of overweight among U.S. diabetic youth . Diabetes 2005 ; 54 : A450 (abstr).
61. Cowie CC , Rust KF et al. Prevalence of diabetes and impaired fasting glucose in adults in the U.S. population: National Health and Nutrition Examination Survey 1999 – 2002 . Diabetes Care 2006 ; 29 : 1263 – 8 .
62. Rimm EB , Stampfer MJ et al . Body size and fat distribution as predictors of coronary heart disease among middle - aged and older US men . Am J Epidemiol 1995 ; 141 : 1117 – 27 .
63. Manson JE , Willett WC et al. Body weight and mortality among women . N Engl J Med 1995 ; 333 : 677 – 85 .
64. Eckel RH. Obesity and heart disease: a statement for healthcare professionals from the Nutrition Committee, American Heart Association . Circulation 1997 ; 96 : 3248 – 50 .
65. Eckel RH , Barouch WW , Ershow AG . Report of the National Heart, Lung, and Blood Institute — National Institute of Diabetes and Digestive and Kidney Diseases Working Group on the pathophysiology of obesity - associated cardiovascular disease . Circulation 2002 ; 105 : 2923 – 28 .
66. Kannel WB , D ’ Agostino RB , Cobb JL. Effect of weight on cardio-vascular disease . Am J Clin Nutr 1996 ; 63 ( 4 ): 419S – 422S .
67. Enas EA , Mehta J . Malignant coronary artery disease in young Asian Indians: thoughts on pathogenesis, prevention, and therapy . Clinical Cardiology 1995 ; 18 : 131 – 5 .
68. Stamler R , Stamler J et al . Weight and blood pressure: Findings in hypertension screening of 1 million Americans . JAMA 1978 ; 240 : 1607 – 10 .
29. McCormick DP , Sarpong K et al . Infant obesity: are we ready to make this diagnosis? J Pediatr 2010 July; 157 ( 1 ): 15 – 19 .
30. Ogden CL , Carroll MD et al . Prevalence of overweight and obesity in the United States, 1999 – 2004 . JAMA 2006 ; 295 : 1549 – 55 .
31. National Center for Health Statistics . Centers for Disease Control and Prevention . www.cdc.gov/nchs/nhanes.htm (accessed August 18, 2010 ).
32. Centers for Disease Control and Prevention . About the National Health and Nutrition Examination Survey . www.cdc.gov/nchs/nhanes/about_nhanes.htm (accessed August 18, 2010 ).
33. Mokdad AH , Serdula MK et al . The spread of the obesity epi-demic in the United States, 1991 – 1998 . JAMA 1999 ; 282 : 1519 – 22 .
34. Flegal KM , Carroll MD , Ogden CL , Curtin LR . Prevalence and trends in obesity among US adults, 1999 – 2008 . JAMA 2010 ; 303 ( 3 ): 235 – 41 .
35. Ogden CL. Disparities in obesity prevalence in the United States: black women at risk . Am J Clin Nutr 2009 ; 89 : 1001 – 2 .
36. Sturm R. Increases in morbid obesity in the USA : 2000 – 2005 . Public Health 2007 ; 121 ( 7 ): 492 – 6 .
37. Whitaker RC , Wright JA et al . Predicting obesity in young adult-hood from childhood and parental obesity . N Engl J Med 1997 ; 337 ( 13 ): 869 – 73 .
38. National Center for Health Statistics . Obesity Still a Major Problem, New Data Show . Centers for Disease Control 2006 . www.cdc.gov/nchs/pressroom/04facts/obesity.htm (accessed August 4, 2010).
39. Committee on Prevention of Obesity in Children and Youth, Food and Nutrition Board, Institute of Medicine, Preventing Childhood Obesity: Health in the Balance . Washington, DC : National Academies Press , 2005 .
40. Dietz WH. Innovative Childhood Obesity Practices . CDC Congressional Testimony. Subcommittees on Health, and Oversight and Investigations; Committee on Energy and Commerce. United States House of Representatives. December 16, 2009 .
41. According to Dietz (reference 40), in 2006 there were 73.7 million U.S. children and the prevalence of severe obesity in children is estimated by Skelton and colleagues (reference 18) to be 3.8% and by Koebnick and colleagues (reference 21) to be closer to 6%. If we use 5% prevalence, we estimate 3.7 million children are severely obese. Among adults, prevalence of severe obesity is estimated to be 5.7% by Flegal and colleagues (refer-ence 34). Using a 2006 base of 225 million adults, we estimate 12.8 million adults are severely obese for a total of nearly 17 million people.
42. World Health Organization . Facts Related to Chronic Diseases . www.who.int/dietphysicalactivity/publications/facts/chronic/en (accessed August 4, 2010 ).
43. Ulijaszek SJ. Obesity in Pacifi c Island nations . In Human Obesity: A Major Health Burden. Kaushik Bose, Guest Editor. Kamla - Raj 2005; Human Ecology Special Issue 13, 2005 : 23 – 8 .
44. World Health Organization . Global Database on Body Mass Index: An Interactive Surveillance Tool for Monitoring Nutrition Transition . www.who.int/bmi/index.jsp (accessed August 4, 2010 ).
45. Schulz LO , Bennett PH et al. Effects of traditional and western environments on prevalence of type 2 diabetes in Pima Indians in Mexico and the U.S . Diabetes Care 2006 ; 29 ( 8 ): 1866 – 71 .
46. World Health Organization . Obesity and Overweight . 2006 . www.who.int/mediacentre/factsheets/fs311/en/index.html (accessed August 18, 2010)
47. Normile D. A sense of crisis as China confronts ailments of affl u-ence . Science 2010 ; 328 : 422 – 4 , and Yang W , Lu J et al . Prevalence

Epidemiology, Etiology, and Consequences of Obesity 37
91. Schwimmer JB , Deutsch R et al . Prevalence of fatty liver in chil-dren and adolescents . Pediatrics 2006 ; 118 : 1388 – 93 .
92. Angulo P. Nonalcoholic fatty liver disease . N Engl J Med 2002 ; 346 : 1221 – 31 .
93. Bray GA , Bellanger T . Epidemiology, trends, and morbidities of obesity and the metabolic syndrome . Endocrine 2006 ; 29 : 109 – 17 .
94. Grundy SM. Does a diagnosis of metabolic syndrome have value in clinical practice? Am J Clin Nutr 2006 ; 83 : 1248 – 51 .
95. Kahn R , Buse J , Ferrannini E , Stern M . The metabolic syndrome: time for a critical appraisal. Joint statement from the American Diabetes Association and the European Association for the Study of Diabetes . Diabetologia 2005 ; 48 : 1684 – 99 .
96. Ford WS , Giles WH , Mokdad AH . Increasing prevalence of the metabolic syndrome among U.S. adults . Diabetes Care 2004 ; 27 : 2444 – 9 .
97. Cook S , Weitzman M et al . Prevalence of a metabolic syndrome phenotype in adolescents: fi ndings from the third National Health and Nutrition Examination Survey, 1988 – 1994 . Arch Pediatr Adolesc Med 2003 ; 157 : 821 – 7 .
98. Duncan GE , Li SM , Zhou XH . Prevalence and trends of a meta-bolic syndrome phenotype among U.S. adolescents, 1999 – 2000 . Diabetes Care 2004 ; 27 : 2438 – 43 .
99. US Census Bureau, Population Division . Table 2. Projections of the population by selected age groups and sex for the United States: 2010 to 2050 (NP2008 – T2). Release date: August 14, 2008 . www.census.gov/population/www/projections/summarytables.html (accessed June 5, 2010).
100. World Health Organization . Constitution of the World Health Organization . Geneva : WHO , 1948 .
101. US Centers for Disease Control and Prevention . Measuring Healthy Days: Population Assessment of Health - Related Quality of Life . Atlanta, GA : Centers for Disease Control and Prevention , 2000 .
102. Waters E , Doyle J et al . Infl uence of parental gender and self - reported health and illness on parent - reported child health . Pediatrics 2000 ; 106 : 1422 – 8 .
103. Wake M , Hesketh K , Cameron F . The Child Health Questionnaire in children with diabetes: cross sectional survey of parent and adolescent - reported functional health status . Diabet Med 2000 ; 17 : 700 – 7 .
104. Williams J , Wake M et al . Health - related qualify of life of over-weight and obese children . JAMA 2005 ; 293 : 70 – 6 .
105. Schwimmer JB , Burwinkle TM , Varni JW . Health - related quality of life of severely obese children and adolescents . JAMA 2003 ; 289 : 1813 – 19 .
106. Anderson SE , Cohen P et al . Adolescent obesity and risk for subsequent major depressive disorder and anxiety disorder: pro-spective evidence . Psychosom Med 2007 ; 69 ( 8 ): 740 – 7 .
107. Ladwig KH , Marten - Mittag B et al . Synergistic effects of depressed mood and obesity on long - term cardiovascular risks in 1510 obese men and women: results from the MONICA - KORA Augsburg Cohort Study 1984 – 1998 . Int J Obes (Lond) 2006 ; 30 ( 9 ): 1408 – 14 .
108. Sjoberg RL , Nilsson KW , Leppert J . Obesity, shame, and de-pression in school - aged children: a population - based study . Pediatrics 2005 ; 116 ( 3 ): e389 – 392 .
109. Tyler C , Johnston CA , Fullerton G , Foreyt JP . Reduced quality of life in very overweight Mexican American adolescents . J Adolesc Health 2007 ; 40 ( 4 ): 366 – 8 .
110. Dorn JM , Schisterman EF , Winkelstein W Jr ., Trevisan M. Body mass index and mortality in a general population sample of men and women. The Buffalo Health Study . Am J Epidemiol 1997 ; 146 : 919 – 31 .
69. Stamler J , Neaton JD , Wentworth DN . Blood pressure (systolic and diastolic) and risk of fatal coronary heart disease . Hypertension 1989 ; 13 ( 5 ): I2 – I12 .
70. Kochar MS. Hypertension in obese patients . Postgraduate Medicine 1993 ; 93 : 193 – 200 .
71. Shaper AG. Obesity and cardiovascular disease . In: Chadwick DJ , Cardew GC (eds.) The Origins and Consequences of obesity . Chichester : Wiley , 1996 : 90 – 107 (Ciba Foundation Symposium 201).
72. Brenner B , Garcia DL , Anderson S . Glomeruli and blood pres-sure. Less of one, more the other? Am J Hypertension 1988 ; 1 : 335 – 47 .
73. Everhart JE. Contributions of obesity and weight loss to gall-stone disease . Ann Int Med 1993 ; 119 : 1029 – 1035 .
74. Friedman GD , Kannel WB , Dawber TR . The epidemiology of gallbladder disease: observations in the Framingham study . J Chronic Dis 1996 ; 19 : 273 – 92 .
75. Bray GA. Complications of obesity . Ann Intern Med 1985 ; 103 : 1052 – 62 .
76. Al - Azzawi HH , Nakeeb A et al . Cholecystosteatosis: an explana-tion for increased cholecystectomy rates . J Gastrointest Surg 2007 ; 11 ( 7 ): 835 – 42 .
77. Katsika D , Tuvblad C et al . Body mass index, alcohol, tobacco and symptomatic gallstone disease: a Swedish twin study . J Intern Med 2007 ; 262 ( 5 ): 581 – 7 . www.ncbi.nlm.nih.gov/pubmed/17908165 (accessed October 18, 2010).
78. Pi - Sunyer FX. Medical hazards of obesity . Ann Intern Med 1993 ; 119 : 655 – 60 .
79. Sjostrom LV. Morbidity of severely obese subjects . Am J Clin Nutr 1992 ; 55 : 508S – 515S .
80. Felson DT. Weight and osteoarthritis . Am J Clin Nutr 1996 ; 63 : 430S – 432S .
81. Messier SP , Loeser RF et al. Exercise and dietary weight loss in overweight and obese older adults with knee osteoarthritis: the Arthritis, Diet, and Activity Promotion Trial . Arthritis Rheum 2004 ; 50 : 1501 – 10 .
82. Grunstein RR , Stenlof K , Hedner J , Sjostrom L . Impact of obstructive sleep apnea and sleepiness on metabolic and cardio-vascular risk factors in the Swedish Obesity Subjects (SOS) study . Int J Obes 1995 ; 19 : 410 – 18 .
83. Riley RW , Powell NB et al . Obstructive sleep apnea: trends in therapy . West J Med 1995 ; 162 : 143 – 8 .
84. Loube DI , Loube AA , Mitler MM . Weight loss for obstructive sleep apnea: the optimal therapy for obese patients . J Am Diet Assoc 1994 ; 94 : 1291 – 5 .
85. Grunstein RR , Stenl ö f K et al . Two year reduction in sleep apnea symptoms and associated diabetes incidence after weight loss in severe obesity . Sleep 2007 ; 30 ( 6 ): 703 – 10 .
86. Danaei G , Vander Hoom S et al . Comparative Risk Assessment collaborating group (Cancers). Causes of cancer in the world: comparative risk assessment of nine behavioural and environ-mental risk factors . Lancet 2005 ; 366 : 1784 – 93 .
87. Helling TS , Gurram K . Nonalcoholic fatty liver disease, nonal-coholic steatohepatitis, and bariatric surgery: a review . Surg Obes Relat Dis 2006 ; 2 : 213 – 20 .
88. Clark JM , Brancati FL , Diehl AM . The prevalence and etiology of elevated aminotransferase levels in the United States . Am J Gastroenterol 2003 ; 98 : 960 – 7 .
89. Wieckowska A , Feldstein AE . Nonalcoholic fatty liver disease in the pediatric population: a review . Curr Opin Pediatr 2005 ; 17 : 636 – 41 .
90. Sheth SG , Gordon FD , Chopra S . Nonalcoholic steatohepatitis (erratum in Ann Intern Med 1997; 127: 658) . Ann Intern Med 1997 ; 126 : 137 – 45 .

38 Textbook of Obesity
111. McGee DL , Diverse Populations Collaboration . Body mass index and mortality: a meta - analysis based on person - level data from twenty - six observational studies . Ann Epidemiol 2005 ; 15 : 87 – 97 .
112. Troiano RP , Frongillo EA Jr , Sobal J , Levitsky DA . The relation-ship between body weight and mortality: a quantitative analysis of combined information from existing studies . Int J Obes Relat Metab Disord 1996 ; 20 : 63 – 75 .
113. Engeland A , Bjorge T , Selmer RM , Tverdal A . Height and body mass index in relation to total mortality . Epidemiology 2003 ; 14 : 293 – 9 .
114. Durazo - Arvizu R , Mcgee D , Li Z , Cooper R. Establishing the nadir of the body mass index – mortality relationship: a case study . J Am Stat Assoc 1997 ; 92 : 1 , 312 – 19 .
115. Peeters A , Barendregt JJ et al ., NEDCOM, the Netherlands Epidemiology and Demography Compression of Morbidity Research Group. Obesity in adulthood and its consequences for life expectancy: a life - table analysis . Ann Intern Med 2003 ; 138 : 24 – 32 .
116. Fontaine KR , Redden DT et al . Years of life lost due to obesity . JAMA 2003 ; 138 : 24 – 32 .
117. Crimmins EM , Alley D et al . Changes in biological markers of health: older Americans in the 1990s . J Gerontol A Biol Sci Med Sci 2005 ; 60 : 1409 – 13 .
118. Diehr P , Bild DE et al . Body mass index and mortality in non-smoking older adults: the Cardiovascular Health Study . Am J Public Health 1998 ; 88 : 623 – 9 .
119. Metropolitan Life Insurance Company . Build and blood pressure study 1959 . Vols. I , II . Chicago, IL : Society of Actuaries , 1960 .
120. Build and Blood Pressure Study 1979. Chicago, IL, Society of Actuaries and Association of Life Insurance Directors of America, 1980 .
121. McCue H. The 1979 Build and Blood Pressure Study . In Bostrom H , Mancini M (eds.) Stockholm : Almquist & Wiksell International 1981 ; 182 – 98 .
122. Lew EA. Mortality and weight: insured lives and the American Cancer Society studies . Ann Intern Med 1985 ; 103 (no. 6 Part 2): 1024 – 9 .
123. Lew EA , Garfi nkel L . Variations in mortality by weight among 750,000 men and women . J Chronic Dis 1979 ; 32 : 563 – 76 .
124. Wooley SC. Should obesity be treated at all? Res Publ Assoc Res Nerv Ment Dis 1984 ; 62 : 185 – 92 .
125. Waaler HT. Height, weight, and mortality: the Norwegian expe-rience . Acta Med Scand 1984 ; Supplementum: 679.
126. Garrison RJ , Feinleib M , Castelli WP , McNamara PM. Cigarette smoking as a confounder of the relationship between relative weight and long - term mortality in the Framingham study . JAMA 1983 ; 249 : 2199 – 203 .
127. Rabkin SW , Mathewson FA , Hsu PH . Relation of body weight to development of ischemic heart disease in a cohort of young North American men after a 26 - year observation period. The Manitoba Study . Am J Cardiol 1978 ; 39 : 452 – 8 .
128. Blair BF , Haines LW . Mortality experience according to build at the higher durations . Society Actuaries Trans 1966 ; 18 , 35 – 41 .
129. Rose G , Hamilton PS et al . Myocardial ischemia, risk factors and death from coronary artery disease . Lancet 1977 ; 1 : 105 – 9 .
130. Keys A. Seven Countries: A Multivariate Analysis of Death and Coronary Heart Disease . Cambridge, MA : Harvard University Press , 1980 .
131. Kozarevic D , Pirc Z et al . The Yugoslavia cardiovascular disease study: II. Factors in the incidence of coronary heart disease . Am J Epidemiol 1976 ; 104 : 133 – 40 .
132. Borhani NO , Hechter HH , Breslow L . Report of a ten - year follow - up study of the San Francisco longshoremen . J Chronic Dis 1963 ; 1251 – 66 .
133. Westlund K , Nicolaysen R . Ten - year mortality and morbidity related to serum cholesterol. A follow - up of 3751 men aged 40 – 49 . Scand J Clin Lab Invest 1972 ; 30 : 1 – 24 .
134. Rosenman RH , Brand RJ , Scholtz RI , Friedman M . Multivariate prediction of coronary heart disease during 8.5 year follow - up in the Western Collaborative Group Study . Am J Cardiol 1976 ; 37 : 903 – 10 .
135. Chapman JM , Massey FJ . The interrelationship of serum choles-terol, hypertension, body weight, and risk of coronary disease: results of the fi rst ten years ’ follow - up in the Los Angeles Heart Study . J Chronic Dis 1964 ; 933 – 49 .
136. Paul O , Lepper MH et al . A longitudinal study of coronary heart disease . Circulation 1963 ; 20 – 31 .
137. Noppa H , Bengtsson C , Wedel H , Wilhemsen L . Obesity in rela-tion to morbidity and mortality from cardiovascular disease . Am J Epidemiol 1980 ; 111 : 682 – 92 .
138. Dyer AR , Stamler J , Berkson DM , Lindberg HA . Relationship of relative weight and body mass index to 24 - year mortality in the Chicago People ’ s Gas Company Study . J Chron Disease 1975 ; 28 : 109 – 23 .
139. Tibblin HA , Wilhemsen L , Werko L . Risk factors for myocardial infarction and death due to ischemic heart disease and other causes . Am J Cardiol 1975 ; 35 : 514 – 22 .
140. Manson JE , Stampfer MJ , Hennekens CH , Willett WC . Body weight and longevity: a reassessment . JAMA 1987 ; 257 : 353 – 8 .
141. Franks PW , Hanson RL et al . Childhood obesity, other cardio-vascular risk factors, and premature death . NEJM 2010 ; 362 ( 6 ): 485 – 93 .
142. Wolf AM , Colditz GA . Current estimates of the economic cost of obesity in the United States . Obes Res 1998 ; 6 : 97 – 106 .
143. Wolf A. What is the economic case for treating obesity? Obesity Res. 1998 ; 6 ( Suppl ), 2S – 7S .
144. Finkelstein EA , Fiebelkorn IC , Wang G . National medical spend-ing attributable to overweight and obesity: How much, and who ’ s paying? Health Aff. Suppl. 2003 ; w219 – w226 . content.healthaffairs.org/cgi/content/full/hlthaff.w3.219v1/DC1 (accessed October 21, 2010).
145. Finkelstein EA , Trogdon JG , Cohen JW , Dietz W . Annual medical spending attributable to obesity: payer and service - specifi c esti-mates . Health Affairs 2009 ; 28 ( 5 ): w822 – w831 .
146. Finkelstein EA , Fiebelkorn IC , Wang G . State - level estimates of annual medical expenditures attributable to obesity . Obes Res 2004 ; 12 : 18 – 24 .
147. Henry J Kaiser Family Foundation . U.S. Healthcare Costs: Background Brief . www.kaiseredu.org/topics_im.asp?imID=1 & parentID=61 & id=358 (accessed August 4, 2010 ).
148. CMS, Centers for Medicare and Medicaid Services, Offi ce of the Actuary, National Health Statistics Group, 2006 National Healthcare Expenditures Data, January 2008.
149. Heinen L. Obesity in (Corporate) America . NC Med J 2006 ; 67 : 307 – 9 . 150. Towers Perrin HR Services, Towers Perrin 2006 Healthcare Cost
Survey. 17th Annual Survey. Stamford, CT, 2006 . 151. Herrick D. Why employer - based health insurance is unraveling .
National Center for Policy Analysis. November 1, 2005 . www.ncpa.org/commentaries/why - employer - based - health - insurance - is - unraveling (accessed June 8, 2010).
152. Quesensberry CP , Caan B , Jacobson A . Obesity, health services use, and healthcare costs among members of a health mainte-nance organization . Arch Intern Med 1998 ; 158 : 466 – 72 .
Epidemiology, Etiology, and Consequences of Obesity 39
172. Prentice AM , Jebb SA . Obesity in Britain: gluttony or sloth? BMJ 1995 ; 311 : 437 – 9 .
173. Flatt JP. Importance of nutrient balance in body weight regula-tion . Diabetes/Metabolism Reviews 1988 ; 4 : 571 – 81 .
174. Schutz Y , Flatt JP , Jequier E . Failure of dietary fat intake to promote fat oxidation: a factor favoring the development of obesity . Am J Clin Nutr 1989 ; 50 : 307 – 14 .
175. Stubbs RJ , Ritz P , Coward WA , Prentice AM . Covert mani-pulation of the ratio of dietary fat to carbohydrate and energy density: effect on food intake and energy balance in free - living men eating ad libitum . Am J Clin Nutr 1995 ; 62 ( 2 ): 330 – 7 .
176. Stubbs RJ , Johnstone AM et al . The effect of covertly manipulat-ing the energy density of mixed diets on ad libitum food intake in ‘ pseudo free - living ’ humans . Int J Obes Relat Metab Disord 1998 October; 22 ( 10 ): 980 – 7 .
177. Kessler DA. The End of Overeating: Taking Control of the Insatiable American Appetite . Emmaus, PA : Rodale Press , 2009 .
178. Vartanian LR , Schwartz MB , Brownell KD . Effects of soft drink consumption on nutrition and health: a systematic review and meta - analysis . Am J Pub Health 2007 ; 97 ( 4 ): 667 – 75 .
179. James J , Thomas P , Cavan D , Kerr D . Preventing childhood obesity by reducing consumption of carbonated drinks: cluster randomised controlled trial . BMJ 2004 ; 328 : 1237 . doi:10.1136/bmj.38077.458438.EE (accessed October 18, 2010).
180. Ebbeling CB , Feldman HA et al . Effects of decreasing sugar - sweetened beverage consumption on body weight in adoles-cents: a randomized, controlled pilot study . Pediatrics 2006 ; 117 : 673 – 80 .
181. Nestle M. Increasing portion sizes in American diets: more calo-ries, more obesity . J Am Diet Assoc 2003 ; 103 ( 1 ): 39 – 40 .
182. Wansink B , Payne CR , Chandon P . Internal and external cues of meal cessation: the French paradox redux? Obesity 2007 December; 15 ( 12 ): 2920 – 4 .
183. Rolls BJ , Engell D , Birch LL . Serving portion size infl uences 5 - year old but not 3 year old children ’ s food intakes . J Am Diet Assoc 2000 ; 100 ( 2 ): 232 – 4 .
184. Rolls BJ. The Supersizing of America: portion size and the obesity epidemic . Nutr Today 2003 ; 38 ( 2 ): 42 – 53 .
185. Wansink B , van Ittersum K , Painter JE. Ice cream illusions bowls, spoons, and self - served portion sizes . Am J Prev Med 2006 ; 31 ( 3 ): 240 – 3 .
186. Hewlett SA , West C . The War against Parents . Boston, MA : Houghton Miffl in , 1999 .
187. Krebs NF , Himes JH et al . Assessment of child and adolescent overweight and obesity . Pediatrics 2007 ; 120 : S193 – S228 .
188. Glanz K , Sallis JF , Saelens BE , Frank LD . Nutrition environment measures survey in stores (NEMS - S): development and evalua-tion . Am J Prev Med 2007 ; 32 ( 4 ): 282 – 9 .
189. Saelens BE , Glanz K , Sallis JF , Frank LD . Nutrition environment measures survey in restaurants (NEMS - R): development and evaluation . Am J Prev Med 2007 ; 32 ( 4 ): 273 – 81 .
190. Frame IJ. Formative research for a childhood obesity prevention program in frontier Montana. Unpublished Master ’ s Thesis . Columbia University , New York, NY , 2007 .
191. Hurley BF , Nemeth PM et al . Muscle triglyceride utilization during exercise: effect of training . J Appl Physiol 1986 ; 60 ( 2 ): 562 – 7 .
192. Chaput JP , Tremblay A et al . A novel interaction between dietary composition and insulin secretion: effects on weight gain in the Quebec Family Study. Am J . Clin Nutr 2008 ; 87 ( 2 ): 303 – 9 .
153. Wang F , Schultz AB et al . The relationship between National Health, Lung, and Blood Institute weight guidelines and concur-rent medical costs in a manufacturing population . Am J Health Prom 2003 ; 17 ( 3 ): 183 – 9 .
154. Anderson LH , Martinson BC et al . Healthcare charges associated with physical inactivity, overweight, and obesity . Prev Chronic Dis. 2005 October; 2 ( 4 ): A09 . www.ncbi.nlm.nih.gov/pubmed/16164813 (accessed October 18, 2010).
155. Wee CC , Phillips RS et al . Healthcare expenditures associated with overweight and obesity among US adults: importance of age and race . American Journal of Public Health 2005 ; 95 ( 1 ): 159 – 65 .
156. Finkelstein EA , Brown DS . A cost – benefi t simulation model of coverage for bariatric surgery among full - time employees . Am J Manag Care 2005 ; 11 ( 10 ): 641 – 6 .
157. Hartocollis A. Growing obesity increases perils of childbearing . New York Times, June 5, 2010 . www.nytimes.com/2010/06/06/health/06obese.html (accessed June 9, 2010).
158. Cawley J , Sweeney MJ , Kurian M , Beane S , New York State Bariatric Surgery Workgroup. Predicting complications after bariatric surgery using obesity - related co - morbidities . Obes Surg 2007 ; 17 ( 11 ): 1451 – 6 .
159. Poulose BK , Griffi n MR et al. Risk factors for post - operative mortality in bariatric surgery . J Surg Res 2005 ; 127 ( 1 ): 1 – 7 .
160. Encinosa WE , Barnard DM , Chen CC , Steiner CA . Healthcare utilization and outcomes after bariatric surgery . Med Care 2006 ; 44 ( 8 ): 706 – 12 .
161. Poulose BK , Griffi n MR et al . National analysis of adverse patient safety for events in bariatric surgery . Am Surg 2005 ; 71 ( 5 ): 406 – 13 .
162. Poulose BK , Holzman MD et al . National variations in morbid obesity and bariatric surgery use . J Am Coll Surg 2005 ; 201 ( 1 ): 77 – 84 .
163. US Department of Health and Human Services . The Surgeon General ’ s call to action to prevent and decrease overweight and obesity . Rockville, MD : US Department of Health and Human Services, Public Health Service, Offi ce of the Surgeon General , 2001 .
164. Craig BM , Tseng DS . Cost - effectiveness of gastric bypass for severe obesity . Am J Med. 2002 ; 113 ( 6 ): 491 – 8 .
165. Roux L , Pratt M et al . Cost effectiveness of community - based physical activity interventions . Am J Prev Med 2008 ; 35 ( 6 ): 578 – 88 .
166. Breen T. W. Va. to offer free Weight Watchers plan . Book Rags, January 7, 2007 . www.bookrags.com/news/wva - to - offer - free - weight - watchers - moc/ (accessed October 21, 2010).
167. Keith SW , Redden DT et al . Putative contributors to the secular increase in obesity: exploring the roads less traveled . International J Obesity 2006 ; 30 : 1585 – 94 .
168. Ravussin E , Lillioja S et al . Determinants of 24 - hour energy expenditure in man: methods and results using a respiratory chamber . J Clin Invest 1986 ; 78 : 1568 – 78 .
169. Rissanen AM , Heli ö vaara M et al . Determinants of weight gain and overweight in adult Finns . Eur J Clin Nutr 1991 ; 45 ( 9 ): 419 – 30 .
170. Williamson DF. Dietary intake and physical activity as “ predic-tors ” of weight gain in observational, prospective studies of adults . Nutrition Reviews 1996 ; 54 ( 4 ): S101 – S109 .
171. Drewnowski A. Human preference for sugar and fat . In Fernstrom JD , Miller GD (eds.) Appetite and Body Weight Regulation: Sugar, Fat and Macronutrient Substitutes . Boca Raton, FL : CRC Press , 1994 : 137 – 47 .
40 Textbook of Obesity
216. Freedman DS , Ogden CL et al . Childhood overweight and family income . Med Gen Med 2007 ; 92 ( 2 ): 26 – 39 .
217. Delva , J , Johnston LD , O ’ Malley PM. The epidemiology of over-weight and related lifestyle behaviors: racial /ethnic and socio-economic status differences among American youth . Am J Prev Med 2007 ; 33 ( 4S ): S178 – S186 .
218. Caballero B , Himes JH et al . Body composition and overweight prevalence in 1704 school children from 7 American Indian communities . Am J Clin Nutr 2003 ; 78 ( 2 ): 308 – 12 .
219. Anderson SE , Whitaker RC . Prevalence of obesity among US preschool children in different racial and ethnic groups . Arch Pediatr Adolesc Med 2009 ; 163 ( 4 ): 344 – 8 .
220. Dietz PM , Callaghan WM et al. Combined effects of prepreg-nancy body mass index and weight gain during pregnancy on the risk of preterm delivery . Epidemiology 2006 ; 17 ( 2 ): 170 – 7 .
221. Zhong Y , Cahill AG et al . The association between prepregnancy maternal body mass index and preterm delivery . Am J Perinatol 2009 ; 27 ( 4 ): 293 – 8 .
222. Bodnar LM , Siega - Riz AM et al . Severe obesity, gestational weight gain and adverse birth outcomes . Am J Clin Nutr 2010 ; 91 : 1642 – 8 .
223. Hartocollis A. Growing obesity increases perils of childbearing . New York Times June 5, 2010 . www.nytimes.com/2010/06/06/health/06obese.html (accessed June 9, 2010).
224. Jacobson P , Torgerson JS , Sj ö str ö m L , Bouchard C . Spouse resemblance in body mass index: effects on adult obesity preva-lence in the offspring generation . Am J Epidemiol 2007 ; 165 ( 1 ): 101 – 8 .
225. Adams TD , Hunt SC et al . Familial aggregation of morbid obesity . Obes Res 1993 ; 1 ( 4 ): 261 – 70 .
226. Kral JG. Preventing and treating obesity in girls and young women to curb the epidemic . Obes Res 2004 ; 12 ( 10 ): 1539 – 45 .
227. Whitaker RC. Predicting preschooler obesity at birth: the role of maternal obesity in early pregnancy . Pediatrics 2004 ; 114 ( 1 ): e29 – 36 .
228. Smith J , Cianfl one K et al . Effects of maternal surgical weight loss in mothers on intergenerational transmission of obesity . J Clin Endocrin Metab 2009 ; 94 ( 11 ). doi:10.1210/jc.2009 – 0709 (accessed October 18, 2010).
229. Kral JG , Biron S et al . Large maternal weight loss from obesity surgery prevents transmission of obesity to children who were followed for 2 to 18 years . Pediatrics 2006 ; 118 : 1644 – 9 . www.pediatrics.org/cgi/content/full/118/6/e1644 (accessed October 18, 2010).
230. Dixon JB , Dixon ME , O ’ Brien PE. Birth outcomes in obese women after laparoscopic adjustable gastric banding . Obstet Gynecol 2005 ; 106 : 965 – 72 .
231. Ogden CL , Carroll MD , McDowell MA , Flegal KM , Division of Health and Nutrition Examination Surveys . National Center for Health Statistics . Obesity among adults in the United States — no change since 2003 – 2004. NCHS Data Brief 1, Nove-mber 2007 .
232. Vallianatos H , Brennand EA et al . Beliefs and practices of First Nation women about weight gain during pregnancy and lacta-tion: implications for women ’ s health . Can J Nurs Res 2006 ; 38 ( 1 ): 102 – 19 .
233. Catalano PM. Editorial: Obesity and pregnancy — the propaga-tion of a viscous [ sic ] cycle? J Clin Endocr Metab 2003 ; 88 ( 8 ): 3505 – 6 .
234. Catalano PM , Thomas A , Huston - Presley L , Amini SB , Increased fetal adiposity: a very sensitive marker of abnormal in utero development . Am J Obstet Gynecol 2003 ; 189 ( 6 ): 1698 – 704 .
193. Blair S. Personal communication . 194. Dietz WH Jr , Gortmaker SL . Do we fatten our children at the
television set? Obesity and television viewing in children and adolescents . Pediatrics 1985 ; 75 ( 5 ): 807 – 12 .
195. Dietz WH. The role of lifestyle in health: the epidemiology and consequences of inactivity . Proc Nutr Soc 1996 ; 55 ( 3 ): 829 – 40 .
196. Gutin B , Yin Z , Humphries M , Barbeau P . Relations of moderate & vigorous physical activity to fi tness & fatness in adolescents . Am J Clin Nutr 2005 ; 81 : 746 – 50 .
197. Aronne LJ (ed.). A Practical Guide to Drug - induced Weight Gain . Minneapolis, MN : McGraw - Hill , 2002 .
198. Spiegel K , Leproult R , Van Cauter E. Impact of sleep debt on metabolic and endocrine function . Lancet 1999 ; 354 : 1435 – 9 .
199. Patel SR , Redline S . Two epidemics: are we getting fatter as we sleep less? Sleep 2004 : 27 : 602 – 3 .
200. Taheri S , Lin L et al . Short sleep duration is associated with reduced leptin, elevated ghrelin, and increased body mass index . PLoS Med 2004 ; 1 : E62 .
201. Lopez - Garcia E , Faubel R et al . Sleep duration, general and abdominal obesity, and weight change among the older adult population of Spain . Am J Clin Nutr 2008 ; 87 : 310 – 16 .
202. Kripke DF , Garfi nkel L et al . Mortality associated with sleep duration and insomnia . Arch Gen Psychiatry 2002 ; 59 : 131 – 6 .
203. Taheri S. The link between short sleep duration and obesity: we should recommend more sleep to prevent obesity . Arch Dis Child 2006 ; 91 : 881 – 4 .
204. Anderson SE , Whitaker RC . Household routines and obesity in US preschool - aged children . Pediatrics 2010 ; 125 : 420 – 8 .
205. Zimmerman FJ. Report for the Henry J . Kaiser Family Foundation. Children ’ s media use and sleep problems: Issues and unanswered questions. 2008 , June.
206. Tai - Seale T , Chandler C. Nutrition and overweight concerns in rural areas: a literature review. Rural Healthy People 2010: A Companion Document to Health People . Vol. 2 . College Station, TX : The Texas A & M University System Health Science Center, School of Public Health, Southwest Rural Health Research Center ; 2003 .
207. Jackson EJ , Doescher MP , Jerant AF , Hart LG . A national study of obesity prevalence and trends by type of rural county . J Rural Health 2005 ; 21 ( 2 ): 140 – 8 .
208. Parks SD , Housemann RA , Brownson RC . Differential correlates of physical activity in urban and rural adults of various socio-economic backgrounds in the United States . J Epi Community Health 2003 ; 57 : 29 – 35 .
209. Patterson PD , Moore CG , Probst JC , Shinogle JA . Obesity and physical inactivity in rural America . J Rural Health 2004 ; 20 : 151 – 9 .
210. Sobal J , Stunkard AJ . Socioeconomic status and obesity: a review of the literature . Psychol Bull 1989 ; 105 : 260 – 75 .
211. Stunkard AJ , Sorenson TIA . Obesity and socioeconomic status: a complex relation . N Engl J Med 1993 ; 329 : 1036 – 7 .
212. Sobal J. Social and economic consequences of overweight in adolescence . N Engl J Med 1994 ; 330 : 647 .
213. Wang Y. Cross - national comparison of childhood obesity: the epidemic and the relationship between obesity and socioeco-nomic status . Int J Epidemiol 2001 ; 30 : 1129 – 36 .
214. Wang Y , Monteiro C , Popkin BM . Trends of obesity and under-weight in older children and adolescents in the United States, Brazil, China and Russia . Am J Clin Nutr 2002 ; 75 : 971 – 7 .
215. Wang Y , Zhang Q . Are American children and adolescents of low socioeconomic status at increased risk of obesity? Changes in the association between overweight and family income between 1971 and 2002 . Am J Clin Nutr 2006 ; 84 : 707 – 16 .

Epidemiology, Etiology, and Consequences of Obesity 41
242. Sebrell WH , Jr . Symposium on prevention of obesity. Summary of reports . Bull NY Acad Med 1960 ; 36 : 407 – 13 .
243. 2008 National Summit on Legal Preparedness for Obesity Prevention and Control. Program book presented by the Centers for Disease Control and Prevention, Robert Wood Johnson Foundation and the American Society for Law, Medicine & Ethics. Marriott Evergreen Conference Resort. Stone Mountain, GA. June 18 – 20, 2008.
244. Centers for Disease Control and Prevention, Robert Wood Johnson Foundation and the American Society for Law, Medicine & Ethics. Program book for 2008 National Summit on Legal Preparedness for Obesity Prevention and Control. June 18 – 20, 2008.
245. 2008 National Summit on Legal Preparedness for Obesity Prevention and Control. Program book presented by the Centers for Disease Control and Prevention, Robert Wood Johnson Foundation and the American Society for Law, Medicine & Ethics. Marriott Evergreen Conference Resort. Stone Mountain,
GA. June 18 – 20, 2008.
235. Catalano PM , Drago NM , Amini SB. Maternal carbohydrate metabolism and its relationship to fetal growth and body com-position . Am J Obstet Gynecol 1995 ; 172 : 1464 – 70 .
236. Bouret SG , Draper SJ , Simerly RB . Trophic action of leptin on hypothalamic neurons that regulate feeding . Science 2004 ; 304 : 108 – 10 .
237. Elmquist JK , Flier JS . The fat – brain axis enters a new dimension . Science 2004 ; 304 : 63 – 4 .
238. Vijay - Kumar M , Aitken JD et al . Metabolic syndrome and altered gut microbiota in mice lacking toll - like receptor 5 . Science 2010 ; 328 : 228 – 31 .
239. Musani SK , Erickson S , Allison DB. Obesity — still highly herit-able after all these years . Am J Clin Nutr 2008 ; 87 : 275 – 6 .
240. Reuters . Nature tops nurture in childhood obesity study . February 7, 2008 . www.reuters.com/article/healthNews/idUSL0793070220080207 (accessed August 4, 2010).
241. Wardle J , Carnell S , Haworth CM , Plomin R . Evidence for a strong genetic infl uence on childhood adiposity despite the force of the obesigenic environment . Am J Clin Nutr 2008 ; 87 ( 2 ): 398 – 404 .


![1ac aquaculture - opencaselist12.paperlessdebate.com · Web view“The c onsequences [of current trends] could be dire, depending on whether supply gains are feasible,” says Mahfuzuddin](https://img.pdfslide.net/doc/110x75/5fb54adaa9de6a3a833adbb8/1ac-aquaculture-web-view-aoethe-c-onsequences-of-current-trends-could-be-dire.jpg)