Embed Size (px)
Citation preview
In South Africa, 7-valent pneumococcal conjugate vac-cine (PCV) was introduced in April 2009 and replaced with 13-valent PCV in April 2011. We describe the epidemiology of serotype 1 Streptococcus pneumoniae disease during the pre- and post-PCV eras (2003–2013). Using laboratory-based invasive pneumococcal disease (IPD) surveillance, we calculated annual incidences, identified IPD clusters, and determined serotype 1–associated factors. Of 46,483 IPD cases, 4,544 (10%) were caused by serotype 1. Two clusters of serotype 1 infection were detected during 2003–2004 and 2008–2012, but incidence decreased after 2011. Among children <5 years of age, those who had non–sero-type 1 IPD had shorter hospital stays, fewer cases of pen-icillin-nonsusceptible disease, and lower HIV prevalence and in-hospital death rates than did those with serotype 1 IPD; similar factors were noted for older patients. Serotype 1 IPD had distinctive clinical features in South Africa, and annual incidences fluctuated, with decreases noted after the introduction of PCV13.
Streptococcus pneumoniae serotype 1 is highly invasive and rarely carried asymptomatically (1). The incidence
of serotype 1 invasive pneumococcal disease (IPD) fluctu-ates year to year; disease is associated with outbreaks in closed communities and hospitals and, in Africa, with com-munitywide meningitis outbreaks (2). Compared with other S. pneumoniae serotypes, serotype 1 tends to cause fewer cases of fatal disease, and antibiotic-resistant cases are un-usual (1).
IPD is common in children with underlying diseases, especially HIV. A study conducted among children <18 years of age in Israel before introduction of 7-valent pneu-mococcal conjugate vaccine (PCV7) showed that, com-pared with other common serotypes, serotype 1 caused more bacteremic pneumonia and peritonitis, occurred in older children and certain ethnic groups, and affected otherwise healthy children (3). After PCV7 introduction, infections caused by serotypes included in the vaccine de-clined, but other pneumococcal serotypes (e.g., serotype 1, which was later included in 13-valent vaccine [PCV13]) became relatively more common (4–6); serotype 1 ranked among the top 4 serotypes infecting children <5 years of age (7). Although PCV7 use may have contributed to the relative increase in serotype 1 infections, some studies showed no correlation between the vaccine and serotype 1 disease incidence (8). Lack of correlation is likely due to the epidemic-prone nature of serotype 1 disease and annual fluctuations in disease incidence (9). In addition, replacement disease is mainly due to common colonizing serotypes. An indirect cohort analysis using data from the United Kingdom Health Protection Agency (now Public Health England) surveillance program could not dem-onstrate significant protection against serotype 1 IPD by PCV13, although the point estimate suggested protection (vaccine effectiveness 62% [95% CI −112% to 92%]) (10). Two trials of a 9-valent vaccine showed waning protection against serotype 1 in the absence of a booster vaccine dose in the second year of life; vaccine failures clustered in chil-dren >18 months of age (11,12).
In South Africa, PCV7 was introduced into the na-tional immunization schedule in April 2009 as a 3-dose
Epidemiology of Serotype 1 Invasive Pneumococcal Disease,
South Africa, 2003–2013Claire von Mollendorf, Cheryl Cohen, Stefano Tempia, Susan Meiring, Linda de Gouveia, Vanessa Quan, Sarona Lengana, Alan Karstaedt, Halima Dawood, Sharona Seetharam,
Ruth Lekalakala, Shabir A. Madhi, Keith P. Klugman, Anne von Gottberg, for the Group for Enteric, Respiratory, and Meningeal Disease Surveillance in South Africa (GERMS-SA)
Emerging Infectious Diseases • www.cdc.gov/eid • Vol. 22, No. 2, February 2016 261
Author affiliations: National Institute for Communicable Diseases, Johannesburg, South Africa (C. von Mollendorf, C. Cohen, S. Tempia, S. Meiring, L. de Gouveia, V. Quan, S. Lengana, S.A. Madhi, K.P. Klugman, A. von Gottberg); University of the Witwatersrand, Johannesburg (C. von Mollendorf, C. Cohen, A. Karstaedt, S. Seetharam, S.A. Madhi, A. von Gottberg); Centers for Disease Control and Prevention, Atlanta, Georgia, USA (S. Tempia), and Pretoria, South Africa (S. Tempia); Chris Hani Baragwanath Academic Hospital, Johannesburg (A. Karstaedt, S. Seetharam); Pietermaritzburg Metropolitan Hospital, Pietermaritzburg, South Africa (H. Dawood); University of KwaZulu-Natal, Pietermaritzburg (H. Dawood); National Health Laboratory Service, Johannesburg (S. Seetharam), National Health Laboratory Service, Polokwane, South Africa (R. Lekalakala); University of Limpopo, Polokwane (R. Lekalakala); Emory University, Atlanta, Georgia, USA (K.P. Klugman)
DOI: http://dx.doi.org/10.3201/eid2202.150967
RESEARCH
regimen for infants 6 weeks, 14 weeks, and 9 months of age; in April 2011, the vaccine was replaced with PCV13. Among children <1 year of age, reported coverage for the third dose of PCV improved from 10% in 2009 to 81% in 2012 but declined to 62% in 2013 (13). In 2012, after PCV13 introduction, serotype 1 IPD incidence showed a temporally associated decline in children <2 years of age (–57%, 95% CI –79% to –16%) and adults 25–44 years of age (–33%, 95% CI –46% to –17%) compared with inci-dence in 2005–2008 (14).
Information regarding S. pneumoniae serotype 1 epi-demiology in Africa is limited. We compared serotype 1 disease epidemiology in South Africa with that of other serotypes over an 11-year period, before and after intro-duction of PCV7 and PCV13. We also explored whether temporal or spatial clusters of serotype 1 disease occurred during the study period.
Methods
Study Design and SettingPersons of any age were included in the study if they were hospitalized in South Africa during 2003–2013 for labo-ratory-confirmed IPD and had an available S. pneumoniae serotype result for an isolate from a normally sterile site. Patients were identified through an active national, lab-oratory-based surveillance program for S. pneumoniae. Data were contributed by >200 hospital-based diagnostic laboratories that submitted pneumococcal isolates to the National Institute for Communicable Diseases, Johannes-burg, South Africa. Most laboratories were nonenhanced sites where only isolates and accompanying laboratory report forms with patient age, sex, date and source of the specimen were submitted. However, 24 sites (primarily tertiary hospitals) implemented enhanced surveillance, in which dedicated surveillance officers collected additional clinical information on identified patients; at least 1 site was located in each South Africa province, giving na-tional representation (14). Enhanced sites were chosen on the basis of convenience, interest from site investigators, and number of isolates submitted each year; thus, some differences existed between enhanced and nonenhanced sites (online Technical Appendix, http://wwwnc.cdc.gov/EID/article/22/2/15-0967-Techapp1.pdf). Annual audits conducted by using a laboratory-based information sys-tem were used to identify unreported cases, which were included and used in incidence calculations.
Participants identified from enhanced and nonen-hanced sites were included for determining incidence rates and cluster mapping. For the analyses of factors associated with serotype 1 pneumococcal disease and fatality, only participants from enhanced sites with detailed clinical in-formation and known in-hospital outcomes were included.
Approval was obtained from the Human Research Eth-ics Committee (Medical), University of the Witwatersrand, Johannesburg (M081117), and other hospital or provincial ethics committees, as required. Informed consent was ob-tained for all patients.
DefinitionsIPD cases were defined as disease in persons with S. pneu-moniae detected in cultures of specimens from normally sterile sites or persons with culture-negative samples that were positive by latex agglutination and/or Gram stain mi-croscopy or lytA PCR (15). Pneumococci were serotyped by the Quellung method (Statens Serum Institut, Copenha-gen, Denmark).
Serotype 1 clusters were defined as an increase in se-rotype 1 IPD numbers relative to other serotype numbers in a specific geographic area and time. Cluster location was based on hospital district where cases were diagnosed; ac-tual geographic location was considered to be the centroid of the district polygon. Other definitions are provided in the online Technical Appendix.
Incidence EstimationsWe calculated annual incidence of serotype 1 disease per 100,000 population during 2003–2013 by using data for participants in defined age groups. We divided the num-ber of age-specific, culture-positive serotype 1 IPD cases reported each year by age-specific midyear population estimates. Incidences for non–serotype 1 disease were similarly calculated. Serotype data for cases without se-rotype results from culture (including cases with only PCR serotype results) were imputed by age and year to obtain final incidence rates. Missing data were as-sumed to be random among different serotypes. Midyear population denominators were obtained from Statistics South Africa (http://www.statssa.gov.za/). To show dif-ferences in serotype incidences between prevaccine and postvaccine years, we compared an average incidence from prevaccine years (2003–2008) to 1 postvaccine year (2013). As a baseline for comparison, we included the average for years without clusters (2005–2007). CIs were calculated by using Poisson distribution for inci-dence rates.
Factors Associated with Serotype 1 IPD and Case-Fatality RatesFor the analyses of factors associated with serotype 1 IPD, we included only participants with culture- and PCR-pos-itive results from enhanced sites during 2003–2013. Pa-tients were stratified into 2 age groups (<5 and >5 years), and disease-associated factors in those with serotype 1 IPD were compared with those in patients with non–serotype 1 IPD by using a multivariable logistic regression model. A
262 Emerging Infectious Diseases • www.cdc.gov/eid • Vol. 22, No. 2, February 2016
Serotype 1 Pneumococcal Disease, South Africa
second model to assess in-hospital fatalities restricted the analysis to serotype 1 IPD cases.
For both models, we assessed all variables considered significant (p<0.2) on univariate analysis and removed non-significant factors (p>0.05) by manual backward elimina-tion. Patients with missing data for included variables were excluded. Statistical analysis was implemented by using Sta-ta version 13.1 (StataCorp LP, College Station, TX, USA).
Spatiotemporal Analysis for Detection of Serotype 1 IPD ClustersWe conducted a space–time scan analysis to detect sero-type 1 clusters by aggregating IPD cases with available serotype results from January 2003–December 2013 by month and district. To minimize potential biases intro-duced by temporal and geographic differences in spec-imen-collecting practices, healthcare-seeking behavior, or surveillance system improvements over time, we com-pared cases (serotype 1 IPD cases) with controls (non–serotype 1 IPD cases) from the same geographic area and time period; a Bernoulli model (16,17) was used for the comparison.
To account for control number reductions after PCV7 introduction, we adjusted (increased) observed control numbers by the percent reduction from the prevaccine peri-od (14). To obtain estimated monthly numbers of controls, assuming no PCV introduction, we linearly interpolated es-timated annual proportional reductions from June to June of consecutive years from 2009 through 2013. Because the percentage of reduction in the control numbers may have differed by geographic area due to locality differences in PCV7 uptake over time, we obtained monthly adjustment factors for each province. This adjustment would decrease the likelihood of detecting a cluster if, in fact, a cluster did not occur (null hypothesis).
To identify spatial clusters, we used an elliptical area of search that was allowed to vary in size, shape, and di-rection. Significance was assessed at p<0.05 over 999 replications. Space-time analysis was conducted by using SaTScan version 9.3.1 (http://www.satscan.org/); maps were generated by using ArcGIS version 9.2 (http://www.esri.com/). To calculate relative risks for districts, we di-vided observed number of cases by expected number of cases in each district.
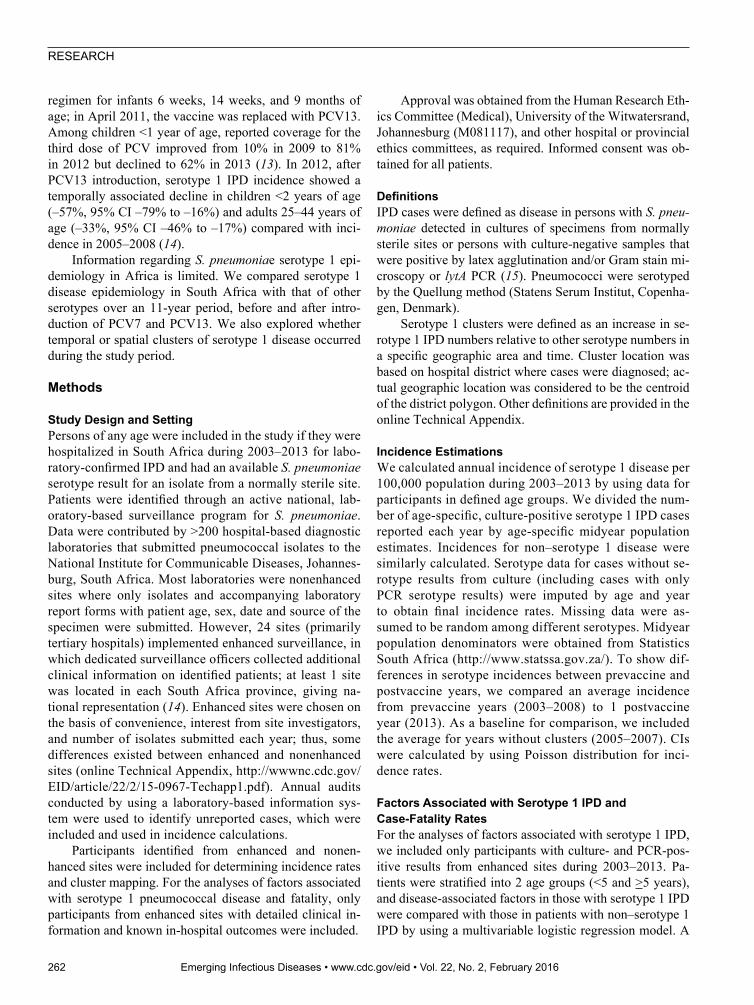
ResultsDuring 2003–2013, a total of 46,483 persons with IPD were enrolled in the study; 32,841 (71%) had viable iso-lates and known S. pneumoniae serotype, and 1,204 (3%) had serotype determination by PCR. Of the 46,483 persons, 20,564 (44%) were enrolled from enhanced sites; of these 6,211 (30%) were <5 years of age, 14,004 (68%) were >5 years of age, and 349 (2%) had unknown age (Figure 1). Of
the 4,985 patients who died, 68% (3,365) did so within 3 days of admission. Of the 12,013 patients who recovered, 14% (1,673) were hospitalized for <3 days, 62% (7,427) for 4–14 days, and 24% (2,913) for >2 weeks. In the pre-PCV7 period (2003–2008), serotype 1 was the sixth most common S. pneumoniae serotype among children <5 years of age, but by 2013, it was eleventh. In contrast, among persons >5 years of age, serotype 1 was the most common serotype across all years, although case numbers decreased after PCV13 introduction.
Emerging Infectious Diseases • www.cdc.gov/eid • Vol. 22, No. 2, February 2016 263
Figure 1. Selection flowchart for study of invasive Streptococcus pneumoniae disease (IPD) cases in South Africa, 2003–2013. Cases were reported by Group for Enteric Respiratory and Meningeal Disease Surveillance sites (GERMS-SA). Years indicate prevaccine (2003–2008), baseline (2005–2007), and postvaccine (2013) periods. Nonenhanced sites only submitted isolates and accompanying laboratory report forms, which included patient age and sex and the date and source of the specimen; enhanced sites (primarily tertiary hospitals) implemented enhanced surveillance, in which dedicated surveillance officers collected additional clinical information on identified patients.
RESEARCH
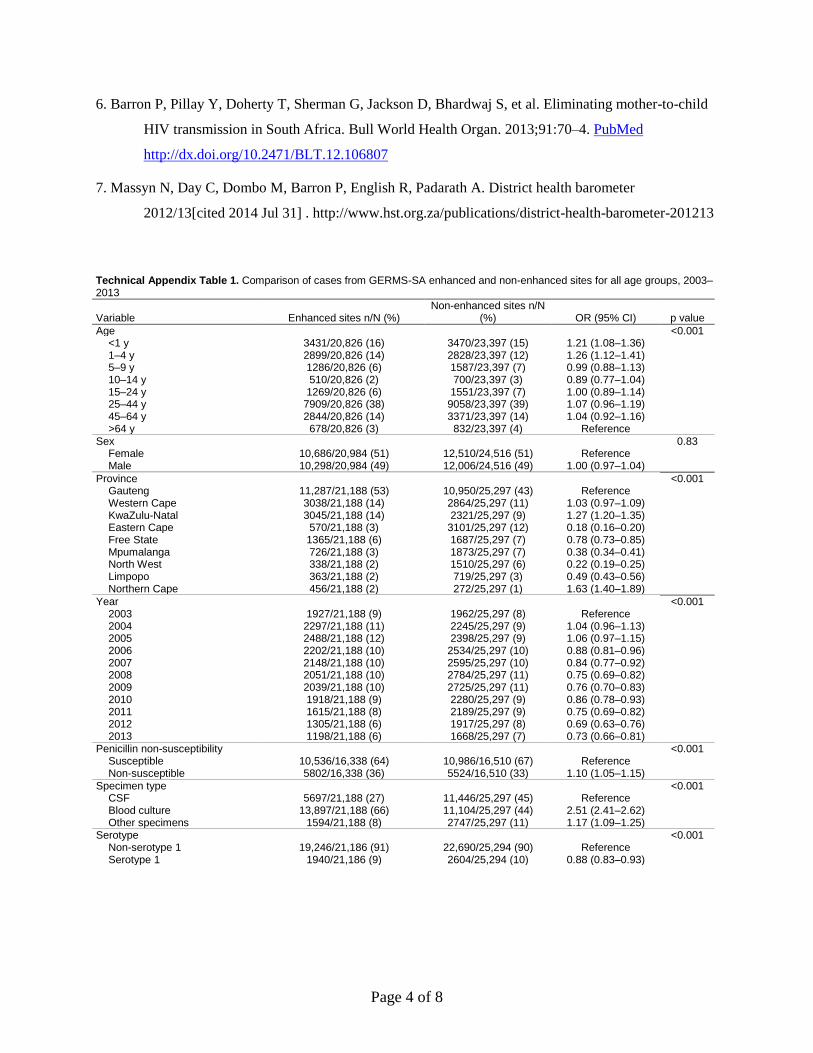
Comparison of Enhanced and Nonenhanced SitesCharacteristics of enhanced and nonenhanced sites differed (online Technical Appendix Table 1). Compared with nonenhanced sites, enhanced sites had a higher proportion of cases among younger children, more cases from certain provinces, fewer cases in 2012–2013, more penicillin-nonsusceptible cases, more blood culture results, and fewer serotype 1 IPD cases.
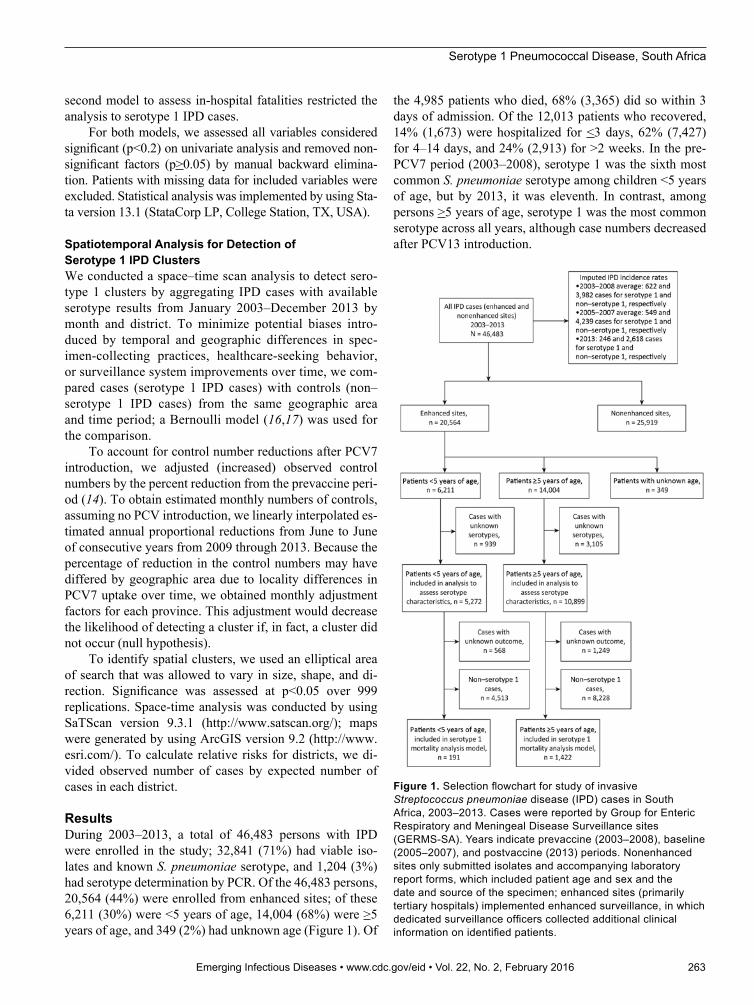
Incidence of Serotype-Specific IPD in Different Age GroupsDuring the prevaccine era (2003–2008), serotype 1 inci-dence per 100,000 population was highest among persons <1 (1.8 cases), 5–9 (1.6 cases), and 25–44 (1.8 cases) years of age (Figure 2, panel A). Serotype 1 incidence did not dif-fer significantly for 2003–2008 compared with 2005–2007, when there were no clusters. In 2013, serotype 1 incidence
was highest among persons 5–9 (0.7 cases) and 25–44 (0.6 cases) years of age; reductions were significant (p<0.001) in all age groups except the >64-year-old age group (p = 0.07).
For all other serotypes during 2003–2008, the highest incidence rates per 100,000 population were among per-sons <1 (71.8 cases), 1–4 (13.9 cases), and 25–44 (10.1 cases) years of age (Figure 2, panel B). In 2013, the high-est incidence rates were among persons <1 (27.3 cases) and >25 (>5.0 cases) years of age. Reductions in incidence among persons <5 and 25–44 years of age were significant (p<0.001).
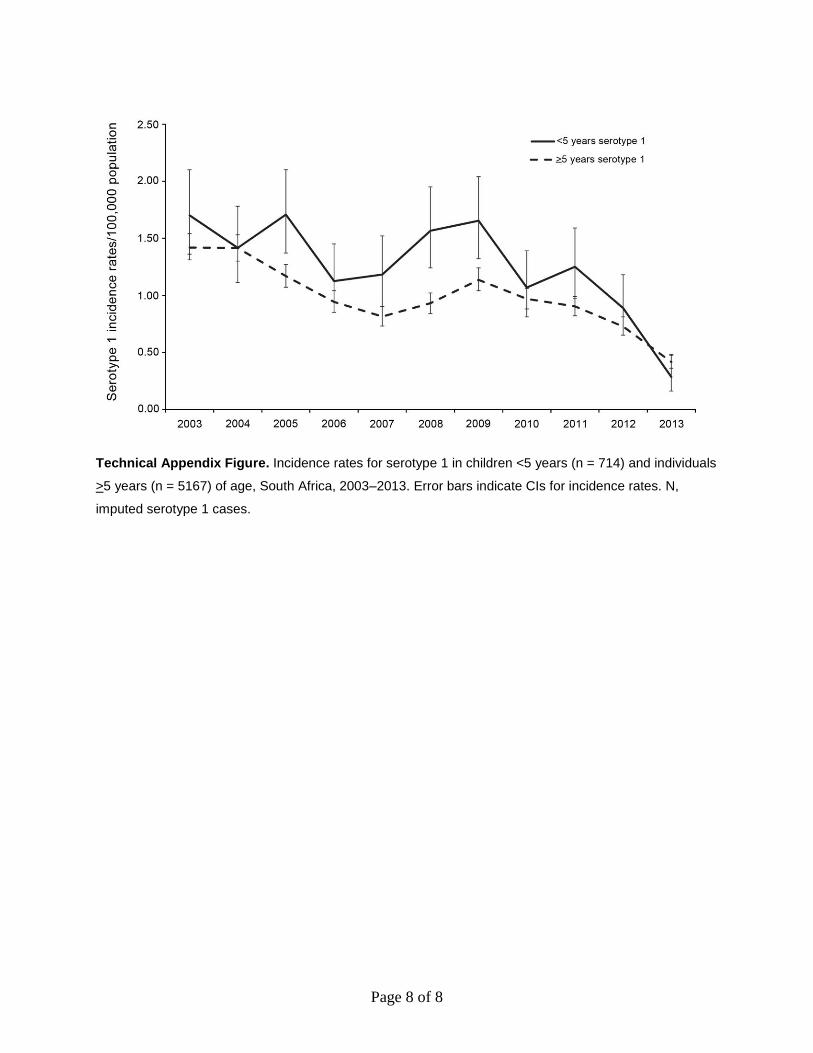
The incidence of serotype 1 IPD fluctuated over the 11-year period (online Technical Appendix Figure 1). For the <5-year-old age group, incidence rates were significant-ly reduced in 2006 (p = 0.01), 2007 (p = 0.03), 2010 (p = 0.006), and 2012–2013 (p<0.001) compared with rates in 2005. In the >5-year-old age group, incidence rates were significantly higher in 2003 (p = 0.001) and 2004 (p = 0.002) compared with 2005 but lower during 2006–2008 and 2010–2013 (p<0.001).
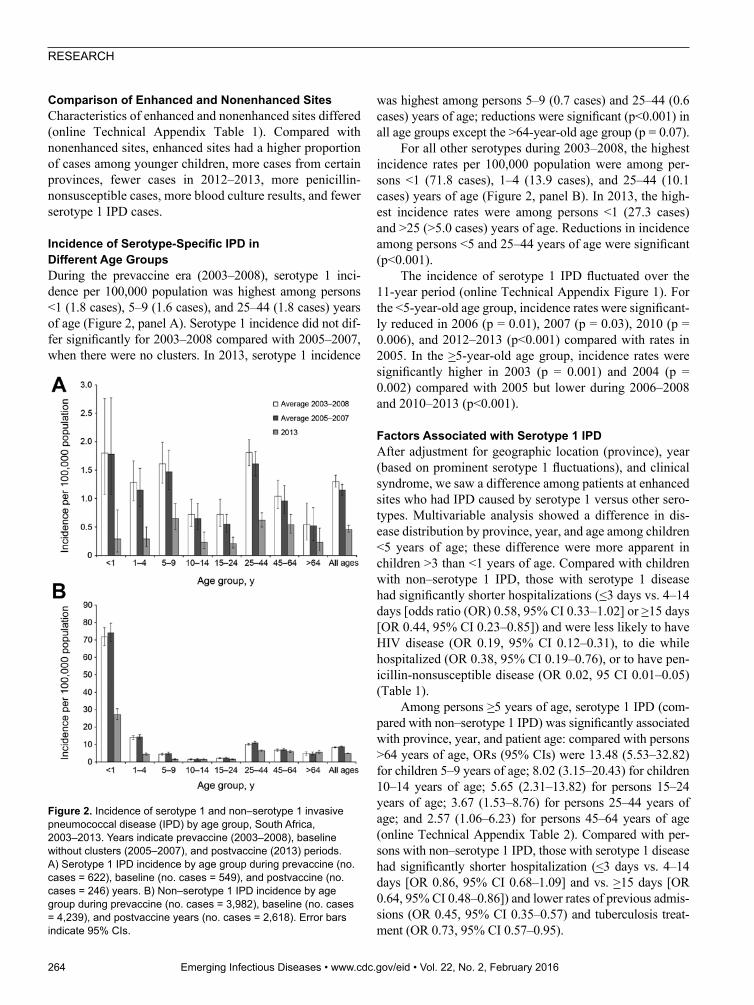
Factors Associated with Serotype 1 IPDAfter adjustment for geographic location (province), year (based on prominent serotype 1 fluctuations), and clinical syndrome, we saw a difference among patients at enhanced sites who had IPD caused by serotype 1 versus other sero-types. Multivariable analysis showed a difference in dis-ease distribution by province, year, and age among children <5 years of age; these difference were more apparent in children >3 than <1 years of age. Compared with children with non–serotype 1 IPD, those with serotype 1 disease had significantly shorter hospitalizations (<3 days vs. 4–14 days [odds ratio (OR) 0.58, 95% CI 0.33–1.02] or >15 days [OR 0.44, 95% CI 0.23–0.85]) and were less likely to have HIV disease (OR 0.19, 95% CI 0.12–0.31), to die while hospitalized (OR 0.38, 95% CI 0.19–0.76), or to have pen-icillin-nonsusceptible disease (OR 0.02, 95 CI 0.01–0.05) (Table 1).
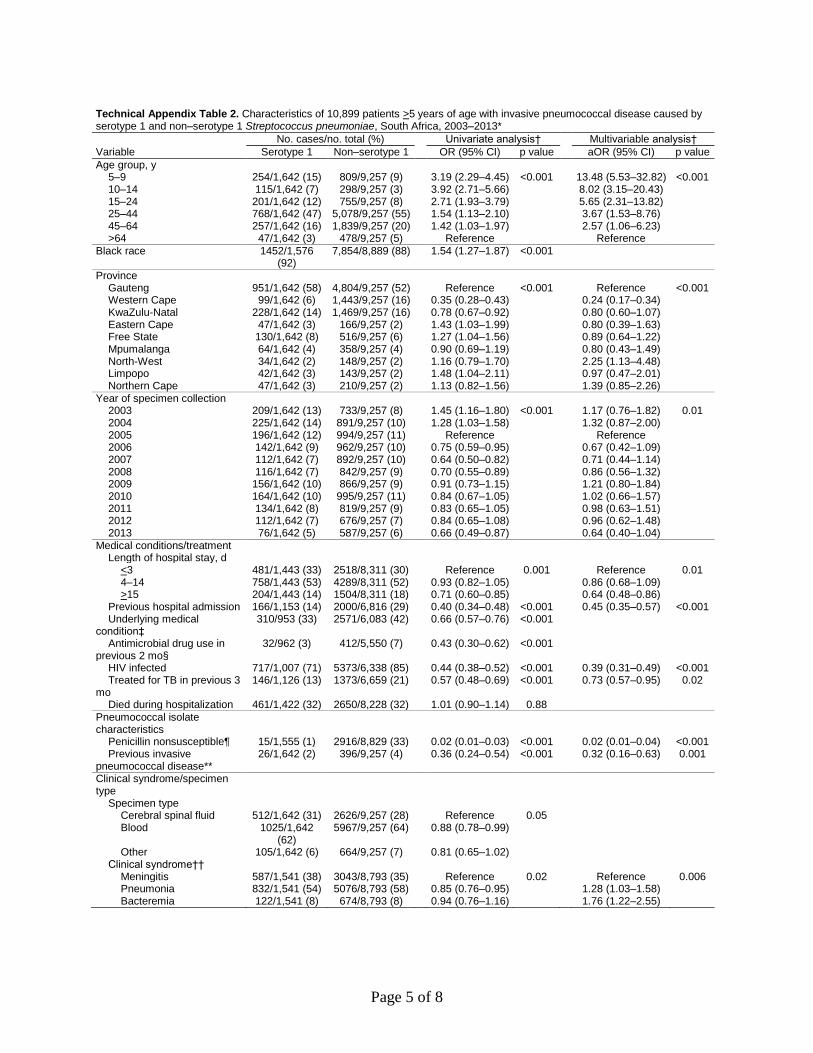
Among persons >5 years of age, serotype 1 IPD (com-pared with non–serotype 1 IPD) was significantly associated with province, year, and patient age: compared with persons >64 years of age, ORs (95% CIs) were 13.48 (5.53–32.82) for children 5–9 years of age; 8.02 (3.15–20.43) for children 10–14 years of age; 5.65 (2.31–13.82) for persons 15–24 years of age; 3.67 (1.53–8.76) for persons 25–44 years of age; and 2.57 (1.06–6.23) for persons 45–64 years of age (online Technical Appendix Table 2). Compared with per-sons with non–serotype 1 IPD, those with serotype 1 disease had significantly shorter hospitalization (<3 days vs. 4–14 days [OR 0.86, 95% CI 0.68–1.09] and vs. >15 days [OR 0.64, 95% CI 0.48–0.86]) and lower rates of previous admis-sions (OR 0.45, 95% CI 0.35–0.57) and tuberculosis treat-ment (OR 0.73, 95% CI 0.57–0.95).
264 Emerging Infectious Diseases • www.cdc.gov/eid • Vol. 22, No. 2, February 2016
Figure 2. Incidence of serotype 1 and non–serotype 1 invasive pneumococcal disease (IPD) by age group, South Africa, 2003–2013. Years indicate prevaccine (2003–2008), baseline without clusters (2005–2007), and postvaccine (2013) periods. A) Serotype 1 IPD incidence by age group during prevaccine (no. cases = 622), baseline (no. cases = 549), and postvaccine (no. cases = 246) years. B) Non–serotype 1 IPD incidence by age group during prevaccine (no. cases = 3,982), baseline (no. cases = 4,239), and postvaccine years (no. cases = 2,618). Error bars indicate 95% CIs.
Serotype 1 Pneumococcal Disease, South Africa
Emerging Infectious Diseases • www.cdc.gov/eid • Vol. 22, No. 2, February 2016 265
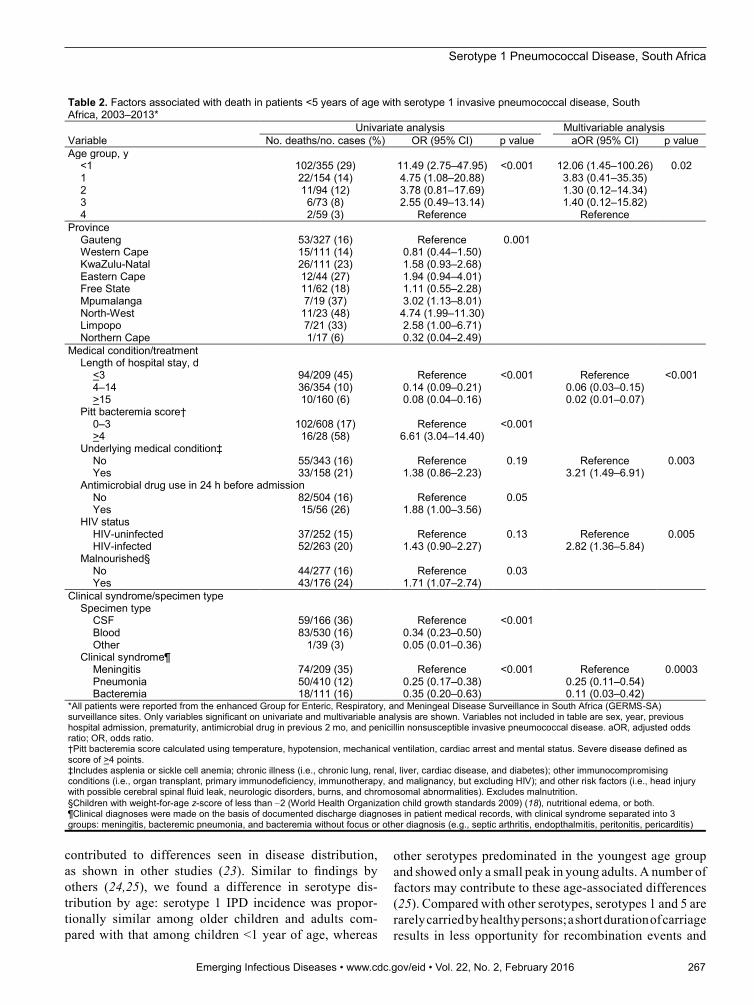
Table 1. Characteristics of 5,272 patients <5 years of age with invasive pneumococcal disease caused by serotype 1 or non–serotype 1 Streptococcus pneumoniae, South Africa, 2003–2013*
Variable No. cases/no. total (%)
Univariate analysis†
Multivariable analysis†
Serotype 1 Non–serotype 1 OR (95% CI) p value aOR (95% CI) p value Age, y <1 63/211 (30) 2,754/5,061 (54) Reference <0.001 Reference <0.001 1 35/211 (17) 1,155/5,061 (23) 1.32 (0.87–2.01) 2.36 (1.31–4.26) 2 43/211 (20) 519/5,061 (10) 3.62 (2.43–5.40) 6.91 (3.78–12.64) 3 37/211 (18) 355/5,061 (7) 4.56 (2.99–6.94) 12.03 (6.12–23.64) 4 33/211 (16) 278/5,061 (5) 5.19 (3.35–8.05) 7.13 (3.60–14.13) Province Gauteng 95/211 (45) 2,067/5,061 (41) Reference <0.001 Reference <0.001 Western Cape 11/211 (5) 1,158/5,061 (23) 0.21 (0.11–0.39) 0.11 (0.04–0.26) KwaZulu-Natal 46/211 (22) 957/5,061 (19) 1.05 (0.73–1.50) 1.04 (0.59–1.84) Eastern Cape 15/211 (7) 152/5,061 (3) 2.15 (1.22–3.79) 1.98 (0.74–5.28) Free State 25/211 (12) 383/5,061 (8) 1.42 (0.90–2.24) 1.06 (0.56–2.00) Mpumalanga 4/211 (2) 104/5,061 (2) 0.84 (0.30–2.32) 0.58 (0.07–4.86) North-West 5/211 (2) 46/5,061 (1) 2.36 (0.92–6.09) 5.65 (1.33–24.05) Limpopo 4/211 (2) 48/5,061 (1) 1.81 (0.64–5.13) 1.79 (0.41–7.90) Northern Cape 6/211 (3) 146/5,061 (3) 0.89 (0.39–2.08) 0.50 (0.15–1.64) Year of specimen collection 2003 31/211 (15) 544/5,061 (11) 1.20 (0.72–1.99) 0.004 1.10 (0.49–2.49) 0.05 2004 26/211 (12) 699/5,061 (14) 0.78 (0.46–1.32) 0.58 (0.25–1.34) 2005 32/211 (15) 672/5,061 (13) Reference Reference 2006 21/211 (10) 551/5,061 (11) 0.80 (0.46–1.40) 0.77 (0.34–1.72) 2007 15/211 (7) 547/5,061 (11) 0.58 (0.31–1.07) 0.67 (0.26–1.75) 2008 10/211 (5) 542/5,061 (11) 0.39 (0.19–0.80) 0.40 (0.15–1.03) 2009 23/211 (11) 494/5,061 (10) 0.98 (0.57–1.69) 1.43 (0.63–3.24) 2010 19/211 (9) 361/5,061 (7) 1.11 (0.62–1.98) 0.82 (0.33–2.08) 2011 19/211 (9) 240/5,061 (5) 1.66 (0.92–2.99) 1.04 (0.44–2.44) 2012 12/211 (6) 190/5,061 (4) 1.33 (0.67–2.63) 0.49 (0.18–1.33) 2013 3/211 (1) 221/5,061 (4) 0.29 (0.09–0.94) 0.12 (0.02–0.59) Medical conditions/treatment Length of hospital stay, d <3 57/186 (31) 1,238/4,489 (28) Reference 0.09 Reference 0.04 4–14 96/186 (52) 2,138/4,489 (48) 0.98 (0.70–1.36) 0.58 (0.33–1.02) >15 33/186 (18) 1,113/4,489 (25) 0.64 (0.42–1.00) 0.44 (0.23–0.85) Previously hospitalized 39/164 (24) 1,676/4,110 (41) 0.45 (0.31–0.65) <0.001 Underlying medical condition‡ 27/114 (24) 1,321/3,371 (39) 0.48 (0.31–0.75) 0.001 Antimicrobial drug use in previous 2 mo§
10/147 (7) 742/3,549 (21) 0.28 (0.14–0.53) <0.001
HIV infected 43/132 (33) 2,125/3,539 (60) 0.32 (0.22–0.47) <0.001 0.19 (0.12–0.31) <0.001 TB treatment in previous 3 mo 11/161 (7) 570/3,928 (15) 0.43 (0.23–0.80) 0.008 Malnourished¶ 24/95 (25) 1,109/2,619 (42) 0.46 (0.29–0.74) 0.001 Died during hospitalization 24/191 (13) 1,105/4,513 (24) 0.44 (0.29–0.68) <0.001 0.38 (0.19–0.76) 0.006 Pneumococcal isolate characteristics
Penicillin nonsusceptible# 4/203 (2) 2,580/4,950 (52) 0.02 (0.01–0.05) <0.001 0.02 (0.01–0.05) <0.001 Previous invasive pneumococcal disease**
2/211 (1) 356/5,061 (7) 0.13 (0.03–0.51) 0.004
Clinical syndrome†† Meningitis 59/198 (30) 1,668/4,736 (35) Reference 0.001 Pneumonia 124/198 (63) 2,358/4,736 (50) 1.49 (1.08–2.04) Bacteremia 15/198 (8) 710/4,736 (15) 0.60 (0.34–1.06) *All patients were reported from the enhanced Group for Enteric, Respiratory, and Meningeal Disease Surveillance in South Africa (GERMS-SA) surveillance sites. aOR, adjusted odds ratio; OR, odds ratio; TB, tuberculosis. †Only variables significant on univariate and multivariable analysis are shown. Variables not included are sex, race, Pitt bacteremia score, prematurity, antimicrobial drug use in previous 24 h, viable culture, and specimen type. ‡Includes asplenia or sickle cell anemia; chronic illness (i.e., chronic lung, renal, liver, cardiac disease, and diabetes); other immunocompromising conditions (i.e. including organ transplant, primary immunodeficiency, immunotherapy, and malignancy, but excluding HIV); and other risk factors (i.e., head injury with possible cerebral spinal fluid leak, neurologic disorders, burns, and chromosomal abnormalities). Excludes malnutrition. §Use of any antimicrobial drug in 2 mo prior to admission. ¶Malnutrition was classified as a weight-for-age z-score of less than 2 (World Health Organization child growth standards 2009) (18), nutritional edema, or both. #Considered penicillin nonsusceptible at MIC >0.12 g/mL; intermediately resistant and resistant groups were combined into a nonsusceptible group. **Invasive pneumococcal disease diagnosis >21 d before this episode. ††Clinical diagnoses were made on the basis of documented discharge diagnoses in patient medical records; clinical syndrome were separated into 3 groups: meningitis, bacteremic pneumonia, and bacteremia without focus or other diagnosis (e.g., septic arthritis, endopthalmitis, peritonitis, pericarditis).
RESEARCH
Persons >5 years of age with serotype 1 disease were also significantly less likely to have HIV (OR 0.39, 95% CI 0.31–0.49) or penicillin-nonsusceptible disease (OR 0.02, 95% CI 0.01–0.04), and they were more likely than those with non–serotype 1 IPD to receive a diagnosis of pneumonia (OR 1.28, 95% CI 1.03–1.58) or bacteremia (OR 1.76, 95% CI 1.22–2.55) rather than meningitis. In-hospital death compared with recovery was not significant in the >5 year age group.
Factors Associated with In-Hospital Deaths among Patients with Serotype 1 IPDWe conducted multivariable analysis to explore factors as-sociated with death in children <5 years of age with sero-type 1 IPD (Table 2). Compared with 4-year-old children, those <1 year of age were more likely to die (OR 12.06, 95% CI 1.45–100.26), as were children with underlying medical conditions than those without. Odds of death were also increased among children with HIV (OR 2.82, 95% CI 1.36–5.84) or meningitis versus those with pneumonia or bacteremia. Duration of hospitalization was shorter among persons who died compared with those who recovered (<3 days vs. 4–14 days [OR 0.06, 95% CI 0.03–0.15] or >15 days [OR 0.02, 95% CI 0.01–0.07]).
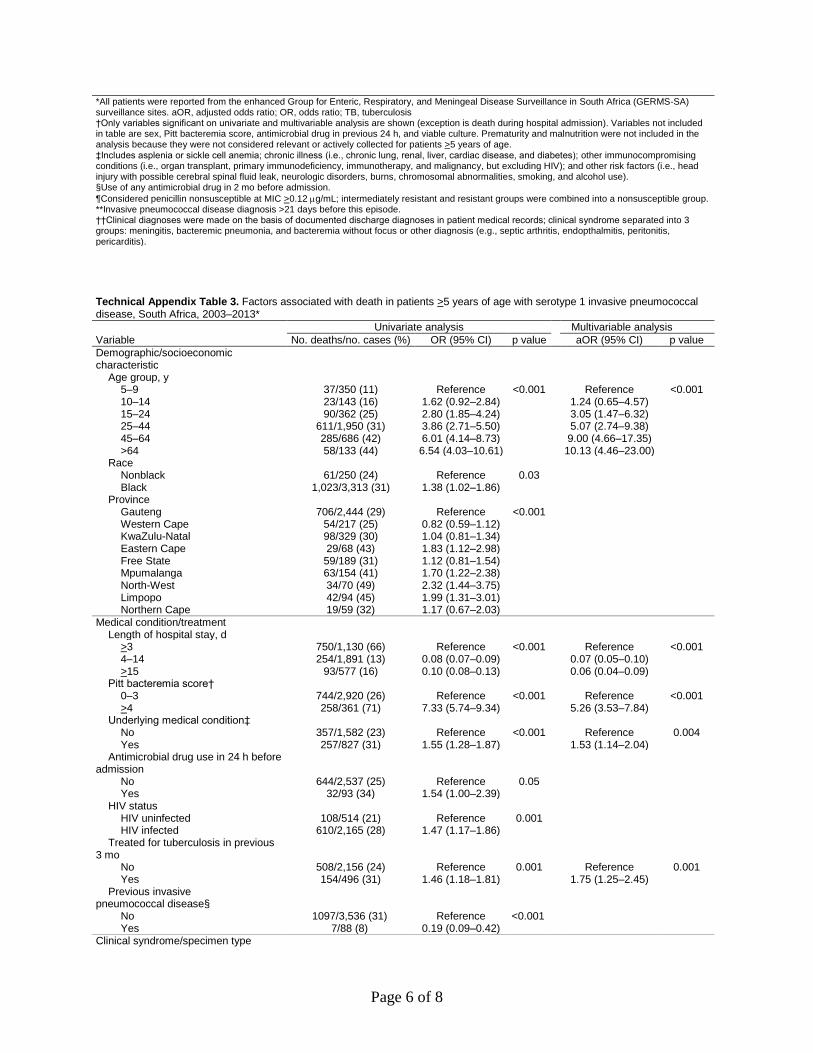
Similar factors were associated with increased odds of death in persons >5 years of age with serotype 1 IPD (online Technical Appendix Table 3). In addition, death was more likely among persons who had received tu-berculosis treatment in the previous 3 months (OR 1.75, 95% CI 1.25–2.45) and among severely ill persons (OR 5.26, 95% CI 3.53–7.84 for patients with a Pitt bacteremia score >4). No difference was seen in the odds of death by HIV status. Compared with children 5–9 years of age, persons >25 years of age had incrementally increased odds of death by age group: 25–44 years of age, OR 5.07 (95% CI 2.74–9.38); 45–64 years of age, OR 9.00 (95% CI 4.66–17.35); and >64 years of age, OR 10.13 (95% CI 4.46–23.00).
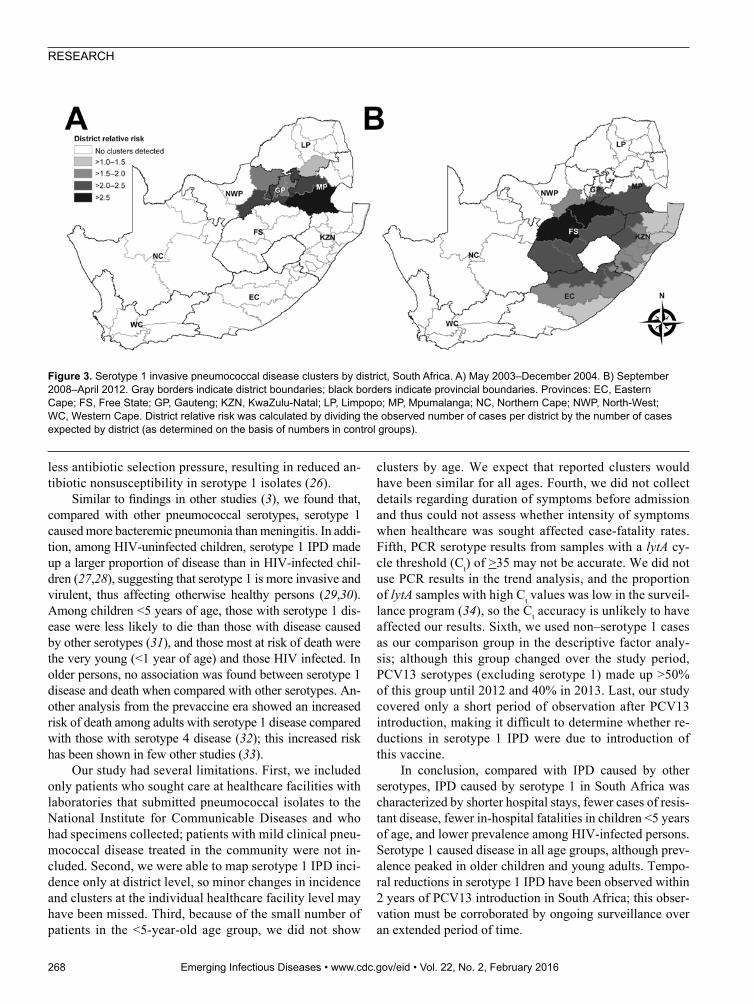
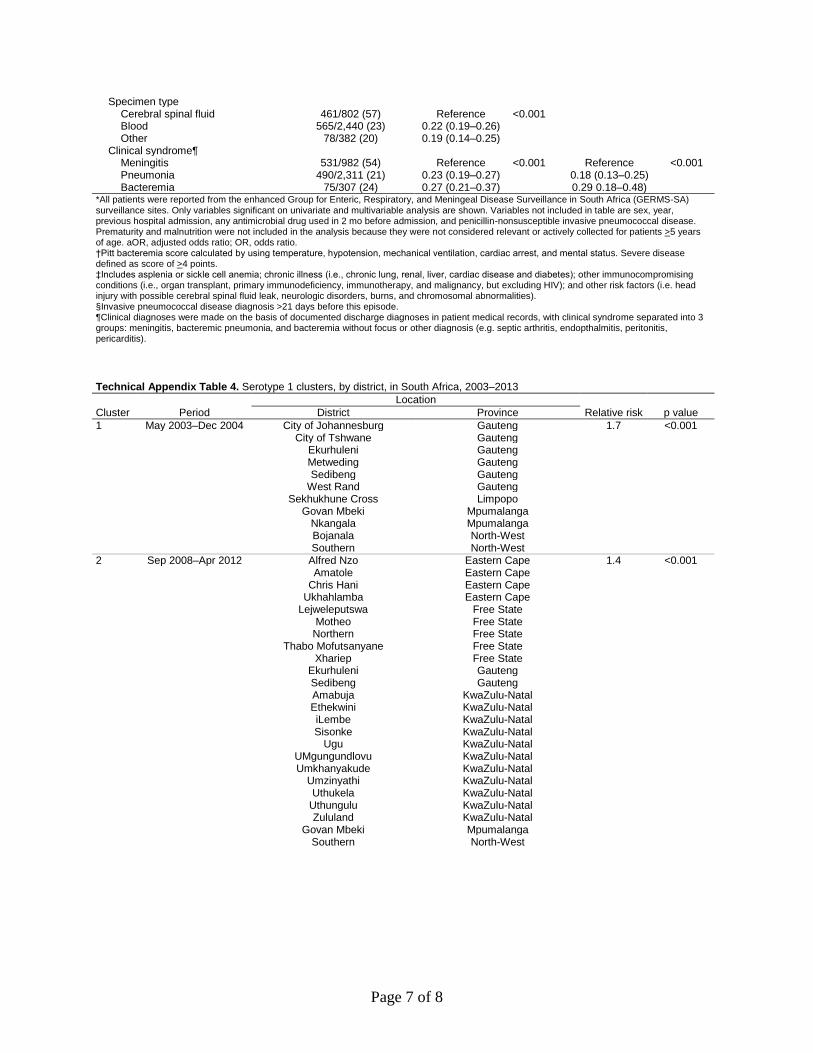
Detection of Serotype 1 IPD ClustersOf the 46,483 IPD cases, 34,032 (73%) had available data (i.e., date of specimen collection, geographic location of patient, and serotype results) and were included in the space–time scan analysis. Of these 34,032 cases, 4,544 (13%) were caused by serotype 1 IPD. Two clusters of serotype 1 were detected. The first (713 cases) occurred during May 2003–December 2004 and affected Gauteng Province and adjacent districts of Mpumalanga, Limpopo, and North-West Provinces (Figure 3, panel A; online Tech-nical Appendix Table 4). The second cluster (718 cases) occurred during September 2008–April 2012 and affected KwaZulu-Natal and Free State Provinces and adjacent dis-tricts of Gauteng, North-West, Mpumalanga, and Eastern
Cape Provinces (Figure 3, panel B; online Technical Ap-pendix Table 4). We also assessed clustering of disease caused by 2 other epidemic-prone serotypes (serotypes 5 and 8); neither showed significant increases in case num-bers compared with numbers in 2005.
DiscussionIn South Africa, serotype 1 pneumococcal disease had a number of distinct features. Children <5 years of age with serotype 1 IPD were less likely to die than were children with disease caused by other serotypes; this association be-tween serotype 1 and death was not seen in older children and adults. Patients with serotype 1 IPD had fewer cases of penicillin-nonsusceptible disease, a lower prevalence of HIV, and less severe disease than patients with non–sero-type 1 IPD. However, pneumonia and bacteremia occurred more commonly in patients with serotype 1 IPD than in patients with IPD caused by other serotypes.
Serotype 1 IPD incidence differed by geographic area and year, reflecting its epidemic potential (1). In older chil-dren and adults, serotype 1 was the most common serotype over the entire study period, even though numbers were lower after PCV13 introduction. Before PCV7 introduc-tion, serotype 1 was the sixth most common serotype in children <5 years of age; by 2013, it no longer ranked in the top 10 serotypes in this age group.
IPD is common in children with underlying diseases, including HIV. Compared with infections caused by other common pneumococcal serotypes, serotype 1 IPD was as-sociated with more bacteremic pneumonia and peritonitis, occurred in older children and specific ethnic groups, and affected otherwise healthy children (3).
Serotype 1 IPD has marked temporal variability (19) and is associated with outbreaks (20,21). In our study, we noted fluctuations in incidence rates for serotype 1 IPD, es-pecially among young children before PCV introduction. Incidence of serotype 1 IPD decreased in all age groups af-ter 2011, likely due to the effect of PCV13, and serotype 1 disease nearly disappeared among the youngest children by 2013, two years after PCV13 introduction (10). We cannot exclude that other factors (e.g., improvements in access to antiretroviral treatment and programs for the prevention of mother-to-child HIV transmission) may have contributed to this decrease (14,22). We identified 2 large clusters that were not recognized prospectively because of the difficulty in identifying communitywide clusters in real time, espe-cially using laboratory-based surveillance.
Our findings showed differences in the geograph-ic distribution of serotype 1 and non–serotype 1 dis-ease. Serotype 1 has been described to occur more frequently in underprivileged populations in develop-ing countries (19); in our study, differences in speci-men collection practices between provinces may have
266 Emerging Infectious Diseases • www.cdc.gov/eid • Vol. 22, No. 2, February 2016
Serotype 1 Pneumococcal Disease, South Africa
contributed to differences seen in disease distribution, as shown in other studies (23). Similar to findings by others (24,25), we found a difference in serotype dis-tribution by age: serotype 1 IPD incidence was propor-tionally similar among older children and adults com-pared with that among children <1 year of age, whereas
other serotypes predominated in the youngest age group and showed only a small peak in young adults. A number of factors may contribute to these age-associated differences (25). Compared with other serotypes, serotypes 1 and 5 are rarely carried by healthy persons; a short duration of carriage results in less opportunity for recombination events and
Emerging Infectious Diseases • www.cdc.gov/eid • Vol. 22, No. 2, February 2016 267
Table 2. Factors associated with death in patients <5 years of age with serotype 1 invasive pneumococcal disease, South Africa, 2003–2013*
Variable Univariate analysis Multivariable analysis
No. deaths/no. cases (%) OR (95% CI) p value aOR (95% CI) p value Age group, y <1 102/355 (29) 11.49 (2.75–47.95) <0.001 12.06 (1.45–100.26) 0.02 1 22/154 (14) 4.75 (1.08–20.88) 3.83 (0.41–35.35) 2 11/94 (12) 3.78 (0.81–17.69) 1.30 (0.12–14.34) 3 6/73 (8) 2.55 (0.49–13.14) 1.40 (0.12–15.82) 4 2/59 (3) Reference Reference Province Gauteng 53/327 (16) Reference 0.001 Western Cape 15/111 (14) 0.81 (0.44–1.50) KwaZulu-Natal 26/111 (23) 1.58 (0.93–2.68) Eastern Cape 12/44 (27) 1.94 (0.94–4.01) Free State 11/62 (18) 1.11 (0.55–2.28) Mpumalanga 7/19 (37) 3.02 (1.13–8.01) North-West 11/23 (48) 4.74 (1.99–11.30) Limpopo 7/21 (33) 2.58 (1.00–6.71) Northern Cape 1/17 (6) 0.32 (0.04–2.49) Medical condition/treatment Length of hospital stay, d <3 94/209 (45) Reference <0.001 Reference <0.001 4–14 36/354 (10) 0.14 (0.09–0.21) 0.06 (0.03–0.15) >15 10/160 (6) 0.08 (0.04–0.16) 0.02 (0.01–0.07) Pitt bacteremia score† 0–3 102/608 (17) Reference <0.001 >4 16/28 (58) 6.61 (3.04–14.40) Underlying medical condition‡ No 55/343 (16) Reference 0.19 Reference 0.003 Yes 33/158 (21) 1.38 (0.86–2.23) 3.21 (1.49–6.91) Antimicrobial drug use in 24 h before admission No 82/504 (16) Reference 0.05 Yes 15/56 (26) 1.88 (1.00–3.56) HIV status HIV-uninfected 37/252 (15) Reference 0.13 Reference 0.005 HIV-infected 52/263 (20) 1.43 (0.90–2.27) 2.82 (1.36–5.84) Malnourished§ No 44/277 (16) Reference 0.03 Yes 43/176 (24) 1.71 (1.07–2.74) Clinical syndrome/specimen type Specimen type CSF 59/166 (36) Reference <0.001 Blood 83/530 (16) 0.34 (0.23–0.50) Other 1/39 (3) 0.05 (0.01–0.36) Clinical syndrome¶ Meningitis 74/209 (35) Reference <0.001 Reference 0.0003 Pneumonia 50/410 (12) 0.25 (0.17–0.38) 0.25 (0.11–0.54) Bacteremia 18/111 (16) 0.35 (0.20–0.63) 0.11 (0.03–0.42) *All patients were reported from the enhanced Group for Enteric, Respiratory, and Meningeal Disease Surveillance in South Africa (GERMS-SA) surveillance sites. Only variables significant on univariate and multivariable analysis are shown. Variables not included in table are sex, year, previous hospital admission, prematurity, antimicrobial drug in previous 2 mo, and penicillin nonsusceptible invasive pneumococcal disease. aOR, adjusted odds ratio; OR, odds ratio. †Pitt bacteremia score calculated using temperature, hypotension, mechanical ventilation, cardiac arrest and mental status. Severe disease defined as score of >4 points. ‡Includes asplenia or sickle cell anemia; chronic illness (i.e., chronic lung, renal, liver, cardiac disease, and diabetes); other immunocompromising conditions (i.e., organ transplant, primary immunodeficiency, immunotherapy, and malignancy, but excluding HIV); and other risk factors (i.e., head injury with possible cerebral spinal fluid leak, neurologic disorders, burns, and chromosomal abnormalities). Excludes malnutrition. §Children with weight-for-age z-score of less than 2 (World Health Organization child growth standards 2009) (18), nutritional edema, or both. ¶Clinical diagnoses were made on the basis of documented discharge diagnoses in patient medical records, with clinical syndrome separated into 3 groups: meningitis, bacteremic pneumonia, and bacteremia without focus or other diagnosis (e.g., septic arthritis, endopthalmitis, peritonitis, pericarditis)
RESEARCH
less antibiotic selection pressure, resulting in reduced an-tibiotic nonsusceptibility in serotype 1 isolates (26).
Similar to findings in other studies (3), we found that, compared with other pneumococcal serotypes, serotype 1 caused more bacteremic pneumonia than meningitis. In addi-tion, among HIV-uninfected children, serotype 1 IPD made up a larger proportion of disease than in HIV-infected chil-dren (27,28), suggesting that serotype 1 is more invasive and virulent, thus affecting otherwise healthy persons (29,30). Among children <5 years of age, those with serotype 1 dis-ease were less likely to die than those with disease caused by other serotypes (31), and those most at risk of death were the very young (<1 year of age) and those HIV infected. In older persons, no association was found between serotype 1 disease and death when compared with other serotypes. An-other analysis from the prevaccine era showed an increased risk of death among adults with serotype 1 disease compared with those with serotype 4 disease (32); this increased risk has been shown in few other studies (33).
Our study had several limitations. First, we included only patients who sought care at healthcare facilities with laboratories that submitted pneumococcal isolates to the National Institute for Communicable Diseases and who had specimens collected; patients with mild clinical pneu-mococcal disease treated in the community were not in-cluded. Second, we were able to map serotype 1 IPD inci-dence only at district level, so minor changes in incidence and clusters at the individual healthcare facility level may have been missed. Third, because of the small number of patients in the <5-year-old age group, we did not show
clusters by age. We expect that reported clusters would have been similar for all ages. Fourth, we did not collect details regarding duration of symptoms before admission and thus could not assess whether intensity of symptoms when healthcare was sought affected case-fatality rates. Fifth, PCR serotype results from samples with a lytA cy-cle threshold (Ct) of >35 may not be accurate. We did not use PCR results in the trend analysis, and the proportion of lytA samples with high Ct values was low in the surveil-lance program (34), so the Ct accuracy is unlikely to have affected our results. Sixth, we used non–serotype 1 cases as our comparison group in the descriptive factor analy-sis; although this group changed over the study period, PCV13 serotypes (excluding serotype 1) made up >50% of this group until 2012 and 40% in 2013. Last, our study covered only a short period of observation after PCV13 introduction, making it difficult to determine whether re-ductions in serotype 1 IPD were due to introduction of this vaccine.
In conclusion, compared with IPD caused by other serotypes, IPD caused by serotype 1 in South Africa was characterized by shorter hospital stays, fewer cases of resis-tant disease, fewer in-hospital fatalities in children <5 years of age, and lower prevalence among HIV-infected persons. Serotype 1 caused disease in all age groups, although prev-alence peaked in older children and young adults. Tempo-ral reductions in serotype 1 IPD have been observed within 2 years of PCV13 introduction in South Africa; this obser-vation must be corroborated by ongoing surveillance over an extended period of time.
268 Emerging Infectious Diseases • www.cdc.gov/eid • Vol. 22, No. 2, February 2016
Figure 3. Serotype 1 invasive pneumococcal disease clusters by district, South Africa. A) May 2003–December 2004. B) September 2008–April 2012. Gray borders indicate district boundaries; black borders indicate provincial boundaries. Provinces: EC, Eastern Cape; FS, Free State; GP, Gauteng; KZN, KwaZulu-Natal; LP, Limpopo; MP, Mpumalanga; NC, Northern Cape; NWP, North-West; WC, Western Cape. District relative risk was calculated by dividing the observed number of cases per district by the number of cases expected by district (as determined on the basis of numbers in control groups).
Serotype 1 Pneumococcal Disease, South Africa
AcknowledgmentsWe thank all persons, and their caregivers, who kindly agreed to be included in this study. We acknowledge all GERMS-SA surveillance officers for their hard work in enrolling partici-pants into the study and obtaining vaccination histories; the GERMS-SA coordinators for assisting the surveillance officers and clinical and intellectual input for the surveillance; laboratory staff throughout the country for submitting isolates to NICD; and staff at the NICD laboratory, Centre for Respiratory Diseases and Meningitis, for their efforts in processing and characterizing these isolates.
This study was supported by NICD/National Health Laboratory Service, South Africa; PEPFAR (President’s Emergency Plan for AIDS Relief) through the Centers for Disease Control and Prevention (cooperative agreement No. 5U2GPS001328); and the Global Alliance for Vaccines and Immunisation, Accelerated Vaccine Introduction Initiative Special Studies Team.
C.vM. has received honoraria from Pfizer. A.vG. has received research funding from Pfizer. S.A.M. has received honoraria from GlaxoSmithKline, Pfizer, and Sanofi Pasteur, and research funding from GlaxoSmithKline, Pfizer, and Novartis. H.D. has received honoraria from Novartis, Pfizer, Merck & Co., Inc. and a travel grant from Mylan. C.C. has received research funding from Pfizer and Sanofi Pasteur.
Dr. von Mollendorf is a medical epidemiologist in the Centre for Respiratory Diseases and Meningitis at the National Institute for Communicable Diseases in Johannesburg, South Africa. Her pri-mary research interests include the epidemiology of respiratory diseases and meningitis and vaccine-preventable diseases.
References 1. Ritchie ND, Mitchell TJ, Evans TJ. What is different about
serotype 1 pneumococci? Future Microbiol. 2012;7:33–46. http://dx.doi.org/10.2217/fmb.11.146
2. Gessner BD, Mueller JE, Yaro S. African meningitis belt pneumococcal disease epidemiology indicates a need for an effective serotype 1 containing vaccine, including for older children and adults. BMC Infect Dis. 2010;10:22. http://dx.doi.org/ 10.1186/1471-2334-10-22
3. Fuchs I, Dagan R, Givon-Lavi N, Greenberg D. Serotype 1 childhood invasive pneumococcal disease has unique characteristics compared to disease caused by other Streptococcus pneumoniae serotypes. Pediatr Infect Dis J. 2013;32:614–8. http://dx.doi.org/10.1097/INF.0b013e31828691cb
4. Calbo E, Diaz A, Canadell E, Fabrega J, Uriz S, Xercavins M, et al. Invasive pneumococcal disease among children in a health district of Barcelona: early impact of pneumococcal conjugate vaccine. Clin Microbiol Infect. 2006;12:867–72. http://dx.doi.org/10.1111/j.1469-0691.2006.1502_1.x
5. Aguiar SI, Brito MJ, Goncalo-Marques J, Melo-Cristino J, Ramirez M. Serotypes 1, 7F and 19A became the leading causes of pediatric invasive pneumococcal infections in Portugal after 7 years of heptavalent conjugate vaccine use. Vaccine. 2010;28:5167–73. http://dx.doi.org/10.1016/j.vaccine.2010.06.008
6. Feikin DR, Kagucia EW, Loo JD, Link-Gelles R, Puhan MA, Cherian T, et al. Serotype-specific changes in invasive
pneumococcal disease after pneumococcal conjugate vaccine introduction: a pooled analysis of multiple surveillance sites. PLoS Med. 2013;10:e1001517. http://dx.doi.org/10.1371/ journal.pmed.1001517
7. Johnson HL, Deloria-Knoll M, Levine OS, Stoszek SK, Freimanis Hance L, Reithinger R, et al. Systematic evaluation of serotypes causing invasive pneumococcal disease among children under five: the pneumococcal global serotype project. PLoS Med. 2010;7:e1000348. http://dx.doi.org/10.1371/journal.pmed.1000348
8. Hanquet G, Kissling E, Fenoll A, George R, Lepoutre A, Lernout T, et al. Pneumococcal serotypes in children in 4 European countries. Emerg Infect Dis. 2010;16:1428–39. http://dx.doi.org/10.3201/eid1609.100102
9. Jefferies JM, Smith AJ, Edwards GF, McMenamin J, Mitchell TJ, Clarke SC. Temporal analysis of invasive pneumococcal clones from Scotland illustrates fluctuations in diversity of serotype and genotype in the absence of pneumococcal conjugate vaccine. J Clin Microbiol. 2010;48:87–96. http://dx.doi.org/10.1128/JCM.01485-09
10. Miller E, Andrews NJ, Waight PA, Slack MP, George RC. Effectiveness of the new serotypes in the 13-valent pneumococcal conjugate vaccine. Vaccine. 2011;29:9127–31. http://dx.doi.org/ 10.1016/j.vaccine.2011.09.112
11. Klugman KP, Madhi SA, Adegbola RA, Cutts F, Greenwood B, Hausdorff WP. Timing of serotype 1 pneumococcal disease suggests the need for evaluation of a booster dose. Vaccine. 2011;29:3372–3. http://dx.doi.org/10.1016/j.vaccine.2011.02.089
12. Cutts FT, Zaman SM, Enwere G, Jaffar S, Levine OS, Okoko JB, et al. Efficacy of nine-valent pneumococcal conjugate vaccine against pneumonia and invasive pneumococcal disease in The Gambia: randomised, double-blind, placebo-controlled trial. Lancet. 2005;365:1139–46. http://dx.doi.org/10.1016/ S0140-6736(05)71876-6
13. World Health Organization. WHO UNICEF estimates of PCV3 coverage [cited 2015 Aug 14]. http://apps.who.int/immunization_monitoring/globalsummary/timeseries/tswucoveragepcv3.html
14. von Gottberg A, de Gouveia L, Tempia S, Quan V, Meiring S, von Mollendorf C, et al. Effects of vaccination on invasive pneumococcal disease in South Africa. N Engl J Med. 2014;371:1889–99. http://dx.doi.org/10.1056/NEJMoa1401914
15. Carvalho MG, Tondella ML, McCaustland K, Weidlich L, McGee L, Mayer LW, et al. Evaluation and improvement of real-time PCR assays targeting lytA, ply, and psaA genes for detection of pneumococcal DNA. J Clin Microbiol. 2007;45: 2460–6. http://dx.doi.org/10.1128/JCM.02498-06
16. Kulldorff M. A spatial scan statistic. Comm Stat Theory Methods. 1997;26:1481–96. http://dx.doi.org/10.1080/ 03610929708831995
17. Kulldorff M, Nagarwalla N. Spatial disease clusters: detection and inference. Stat Med. 1995;14:799–810. http://dx.doi.org/10.1002/sim.4780140809
18. WHO Multicentre Growth Reference Study Group. WHO Child Growth Standards: Growth velocity based on weight, length and head circumference: Methods and development. Geneva: World Health Organization; 2009 [cited 2015 Aug 14]. http://www.who.int/childgrowth/publications/ technical_report_velocity/en/
19. Lagos R, Muñoz A, San Martin O, Maldonado A, Hormazabal JC, Blackwelder WC, et al. Age- and serotype-specific pediatric invasive pneumococcal disease: insights from systematic surveillance in Santiago, Chile, 1994–2007. J Infect Dis. 2008;198:1809–17. http://dx.doi.org/10.1086/593334
20. Le Hello S, Watson M, Levy M, Marcon S, Brown M, Yvon JF, et al. Invasive serotype 1 Streptococcus pneumoniae outbreaks in the South Pacific from 2000 to 2007. J Clin Microbiol. 2010;48:2968–71. http://dx.doi.org/10.1128/JCM.01615-09
Emerging Infectious Diseases • www.cdc.gov/eid • Vol. 22, No. 2, February 2016 269
RESEARCH
21 Antonio M, Hakeem I, Awine T, Secka O, Sankareh K, Nsekpong D, et al. Seasonality and outbreak of a predominant Streptococcus pneumoniae serotype 1 clone from The Gambia: expansion of ST217 hypervirulent clonal complex in West Africa. BMC Microbiol. 2008;8:198. http://dx.doi.org/10.1186/1471-2180-8-198
22. Johnson LF. Access to antiretroviral treatment in South Africa, 2004–2011. Southern African Journal of HIV Medicine. 2012;13:22–7.
23. Hausdorff WP, Siber G, Paradiso PR. Geographical differences in invasive pneumococcal disease rates and serotype frequency in young children. Lancet. 2001;357:950–2. http://dx.doi.org/10.1016/S0140-6736(00)04222-7
24. Ciruela P, Soldevila N, Selva L, Hernández S, Garcia-Garcia JJ, Moraga F, et al. Are risk factors associated with invasive pneumococcal disease according to different serotypes? Hum Vaccin Immunother. 2013;9:712–9. http://dx.doi.org/ 10.4161/hv.23270
25. Hausdorff WP, Feikin DR, Klugman KP. Epidemiological differences among pneumococcal serotypes. Lancet Infect Dis. 2005;5:83–93. http://dx.doi.org/10.1016/S1473-3099(05)70083-9
26. Porat N, Trefler R, Dagan R. Persistence of two invasive Streptococcus pneumoniae clones of serotypes 1 and 5 in comparison to that of multiple clones of serotypes 6B and 23F among children in southern Israel. J Clin Microbiol. 2001;39:1827–32. http://dx.doi.org/10.1128/JCM.39.5.1827-1832.2001
27. Jones N, Huebner R, Khoosal M, Crewe-Brown H, Klugman K. The impact of HIV on Streptococcus pneumoniae bacteraemia in a South African population. AIDS. 1998;12:2177–84. http://dx.doi.org/10.1097/00002030-199816000-00013
28. Scott JA, Hall AJ, Hannington A, Edwards R, Mwarumba S, Lowe B, et al. Serotype distribution and prevalence of resistance to benzylpenicillin in three representative populations of Streptococcus pneumoniae isolates from the coast of Kenya. Clin Infect Dis. 1998;27:1442–50. http://dx.doi.org/10.1086/ 515013
29. Brueggemann AB, Peto TE, Crook DW, Butler JC, Kristinsson KG, Spratt BG. Temporal and geographic stability of the serogroup-specific invasive disease potential of Streptococcus pneumoniae in children. J Infect Dis. 2004;190:1203–11. http://dx.doi.org/10.1086/423820
30. Hausdorff WP. The roles of pneumococcal serotypes 1 and 5 in paediatric invasive disease. Vaccine. 2007;25:2406–12. http://dx.doi.org/10.1016/j.vaccine.2006.09.009
31. Weinberger DM, Harboe ZB, Sanders EA, Ndiritu M, Klugman KP, Ruckinger S, et al. Association of serotype with risk of death due to pneumococcal pneumonia: a meta-analysis. Clin Infect Dis. 2010;51:692–9. http://dx.doi.org/10.1086/655828
32. Cohen C, Naidoo N, Meiring S, de Gouveia L, von Mollendorf C, Walaza S, et al. Streptococcus pneumoniae serotypes and mortality in adults and adolescents in South Africa: analysis of national surveillance data, 2003–2008. PLoS ONE. 2015;10:e0140185. http://dx.doi.org/10.1371/journal.pone.0140185
33. Martens P, Worm SW, Lundgren B, Konradsen HB, Benfield T. Serotype-specific mortality from invasive Streptococcus pneumoniae disease revisited. BMC Infect Dis. 2004;4:21. http://dx.doi.org/10.1186/1471-2334-4-21
34. Magomani V, Wolter N, Tempia S, du Plessis M, de Gouveia L, von Gottberg A. Challenges of using molecular serotyping for surveillance of pneumococcal disease. J Clin Microbiol. 2014;52:3271–6. http://dx.doi.org/10.1128/JCM.01061-14
Address for correspondence: Claire von Mollendorf, Centre for Respiratory Diseases and Meningitis, National Institute for Communicable Diseases, 1 Modderfontein Rd, NHLS, Sandringham, 2193, Gauteng, South Africa; email: [email protected]
270 Emerging Infectious Diseases • www.cdc.gov/eid • Vol. 22, No. 2, February 2016
Dr. Aron Hall, a CDC coronavirus
epidemiologist, discusses Middle East Respiratory Syndrome Coronavirus
Unraveling the Mysteries of Middle East
Respiratory Syndrome Coronavirus
http://www2c.cdc.gov/podcasts/ player.asp?f=8631627
Page 1 of 8
Article DOI: http://dx.doi.org/10.3201/eid2202.150967
Epidemiology of Serotype 1 Invasive Pneumococcal Disease, South Africa,
2003–2013
Technical Appendix
Methods
Invasive Pneumococcal Disease Surveillance in South Africa
Invasive pneumococcal disease (IPD) surveillance began in South Africa in 1999 (1) and
was limited to the collection of laboratory data and isolates from pneumococcal cases. The
surveillance program was expanded in 2003 through GERMS-SA (Group for Enteric,
Respiratory and Meningeal Disease Surveillance in South Africa), a national, active, laboratory-
based surveillance system. The number of hospitals and laboratories covered by the surveillance
increased over time, however more than 70% of hospitals remained consistent in the program
over most of the reported period (2).
All laboratories record basic demographic information (age, sex, date of specimen
collection, and source of isolate) for all pneumococcal isolates. Enhanced surveillance with
trained surveillance officers at 24 sentinel hospitals located in all nine provinces of South Africa,
includes the collection of additional clinical data, for example, admission and discharge date,
HIV serologic status, vaccination information and discharge diagnosis and outcome. Enhanced
surveillance sites account for 50% of all reported pneumococcal cases nationally.
Enhanced surveillance sites were chosen based on convenience, interest from site
investigators and number of isolates submitted. Larger sites with higher isolate submissions were
favored, resulting in enhanced sites being mainly tertiary and some secondary (regional)
hospitals. Non-enhanced sites include district, regional and tertiary public hospitals, private
hospitals and clinics. The regional and tertiary hospitals however made up over 70% of isolates
sent from non-enhanced sites.
Page 2 of 8
To identify missed unreported cases, annual laboratory audits were conducted throughout
the study period using a centralized National Health Laboratory Service Corporate Data
Warehouse which consolidates cases for all public-sector laboratories. Audit cases were included
in the surveillance database for incidence rate calculations. Cases were likely missed as isolates
were submitted by staff working in busy routine clinical microbiological laboratories. Isolates
were often delayed at the sites and submitted in batches with other surveillance organisms sent to
the NICD. As S. pneumoniae is fastidious it was often non-viable by the time it reached the
NICD.
Definitions
At enhanced sites where additional clinical information was available, underlying
conditions were defined as asplenia, including sickle cell anemia; chronic illness (chronic lung,
renal, liver, cardiac disease and diabetes); other immunocompromising conditions (excluding
HIV), including organ transplant and malignancy; and other risk factors, including head injury
with possible CSF leak, neurologic disorders, burns, chromosomal abnormalities, alcohol use
and smoking. Clinical diagnoses were based on documented discharge diagnoses in patient
medical records, with clinical syndrome separated into three groups: meningitis, bacteremic
pneumonia, and bacteremia without focus/other. Pitt bacteremia score was calculated using 5
parameters: (1) oral temperature, (2) hypotension, (3) receipt of mechanical ventilation, (4)
cardiac arrest, and (5) mental status. Severe disease was defined as a score of ≥4 points (3).
Serotypes were defined as serotype 1 or non-serotype 1 IPD. Penicillin non-susceptibility
was categorized using 2013 Clinical and Laboratory Standards Institute breakpoints for oral
penicillin V (susceptible, ≤0.06 g/L; intermediately resistant, 0.12–1 g/L and resistant, ≥2
g/L) (4). Intermediately resistant and resistant groups were combined into a non-susceptible
group for analysis. Pneumococcal disease was considered recurrent if diagnosed >21 days after a
previous case in the same patient.
Other Interventions Affecting Invasive Pneumococcal Disease Trends in South Africa
Comprehensive HIV/AIDS treatment programs were implemented in South Africa in
2003 and access to treatment improved steadily with 80% coverage reported by 2012 (5).
Page 3 of 8
Prevention of mother-to-child transmission programs also improved steadily with an associated
decrease in mother-to-child HIV transmission rates from 12% in 2007 to 2.7% in 2011 (6) and
2.5% during 2012/2013 (7). This was despite a relatively constant prevalence of HIV in pregnant
women of around 30% over the same period.
A manuscript describing the reduction in IPD in South Africa following the introduction
of PCV (2) showed a 49% reduction in all serotype IPD and 85% reduction in PCV7 serotypes in
HIV-uninfected children <2 years of age by 2012. In HIV-infected children PCV7 serotypes
decreased by 86% and non-vaccine serotypes by 31% which showed the benefit of
improvements in prevention of mother-to-child transmission of HIV, antiretroviral treatment in
children and PCV7. Reductions in PCV13-serotype disease in 2009 and 2010, before the
introduction of PCV13, were also most likely a result of ART. In HIV-infected children it was
thought to be difficult to tease out the exact amount of reduction in pneumococcal disease due to
PCV and that due to other interventions.
References
1. Huebner RE, Klugman KP, Matai U, Eggers R, Hussey G. Laboratory surveillance for Haemophilus
influenzae type B meningococcal, and pneumococcal disease. Haemophilus Surveillance
Working Group. S Afr Med J. 1999;89:924–5. PubMed
2. von Gottberg A, de Gouveia L, Tempia S, Quan V, Meiring S, von Mollendorf C, et al. Effects of
vaccination on invasive pneumococcal disease in South Africa. N Engl J Med. 2014;371:1889–
99. PubMed http://dx.doi.org/10.1056/NEJMoa1401914
3. Paterson DL, Ko WC, Von Gottberg A, Mohapatra S, Casellas JM, Goossens H, et al. Antibiotic
therapy for Klebsiella pneumoniae bacteremia: implications of production of extended-spectrum
beta-lactamases. Clin Infect Dis. 2004;39:31–7. PubMed http://dx.doi.org/10.1086/420816
4. Clinical and Laboratory Standards Institute. Performance standards for antimicrobial susceptibility
testing; twenty-third informational supplement. Document M100–S23.Wayne (PA): The Institute;
2013.
5. Johnson LF. Access to antiretroviral treatment in South Africa, 2004–2011. Southern African Journal
of HIV Medicine. 2012;13:22–7.
Page 4 of 8
6. Barron P, Pillay Y, Doherty T, Sherman G, Jackson D, Bhardwaj S, et al. Eliminating mother-to-child
HIV transmission in South Africa. Bull World Health Organ. 2013;91:70–4. PubMed
http://dx.doi.org/10.2471/BLT.12.106807
7. Massyn N, Day C, Dombo M, Barron P, English R, Padarath A. District health barometer
2012/13[cited 2014 Jul 31] . http://www.hst.org.za/publications/district-health-barometer-201213
Technical Appendix Table 1. Comparison of cases from GERMS-SA enhanced and non-enhanced sites for all age groups, 2003–2013
Variable Enhanced sites n/N (%) Non-enhanced sites n/N
(%) OR (95% CI) p value
Age <0.001 <1 y 3431/20,826 (16) 3470/23,397 (15) 1.21 (1.08–1.36) 1–4 y 2899/20,826 (14) 2828/23,397 (12) 1.26 (1.12–1.41) 5–9 y 1286/20,826 (6) 1587/23,397 (7) 0.99 (0.88–1.13) 10–14 y 510/20,826 (2) 700/23,397 (3) 0.89 (0.77–1.04) 15–24 y 1269/20,826 (6) 1551/23,397 (7) 1.00 (0.89–1.14) 25–44 y 7909/20,826 (38) 9058/23,397 (39) 1.07 (0.96–1.19) 45–64 y 2844/20,826 (14) 3371/23,397 (14) 1.04 (0.92–1.16) >64 y 678/20,826 (3) 832/23,397 (4) Reference
Sex 0.83 Female 10,686/20,984 (51) 12,510/24,516 (51) Reference Male 10,298/20,984 (49) 12,006/24,516 (49) 1.00 (0.97–1.04)
Province <0.001 Gauteng 11,287/21,188 (53) 10,950/25,297 (43) Reference Western Cape 3038/21,188 (14) 2864/25,297 (11) 1.03 (0.97–1.09) KwaZulu-Natal 3045/21,188 (14) 2321/25,297 (9) 1.27 (1.20–1.35) Eastern Cape 570/21,188 (3) 3101/25,297 (12) 0.18 (0.16–0.20) Free State 1365/21,188 (6) 1687/25,297 (7) 0.78 (0.73–0.85) Mpumalanga 726/21,188 (3) 1873/25,297 (7) 0.38 (0.34–0.41) North West 338/21,188 (2) 1510/25,297 (6) 0.22 (0.19–0.25) Limpopo 363/21,188 (2) 719/25,297 (3) 0.49 (0.43–0.56) Northern Cape 456/21,188 (2) 272/25,297 (1) 1.63 (1.40–1.89)
Year <0.001 2003 1927/21,188 (9) 1962/25,297 (8) Reference 2004 2297/21,188 (11) 2245/25,297 (9) 1.04 (0.96–1.13) 2005 2488/21,188 (12) 2398/25,297 (9) 1.06 (0.97–1.15) 2006 2202/21,188 (10) 2534/25,297 (10) 0.88 (0.81–0.96) 2007 2148/21,188 (10) 2595/25,297 (10) 0.84 (0.77–0.92) 2008 2051/21,188 (10) 2784/25,297 (11) 0.75 (0.69–0.82) 2009 2039/21,188 (10) 2725/25,297 (11) 0.76 (0.70–0.83) 2010 1918/21,188 (9) 2280/25,297 (9) 0.86 (0.78–0.93) 2011 1615/21,188 (8) 2189/25,297 (9) 0.75 (0.69–0.82) 2012 1305/21,188 (6) 1917/25,297 (8) 0.69 (0.63–0.76) 2013 1198/21,188 (6) 1668/25,297 (7) 0.73 (0.66–0.81) Penicillin non-susceptibility <0.001 Susceptible 10,536/16,338 (64) 10,986/16,510 (67) Reference Non-susceptible 5802/16,338 (36) 5524/16,510 (33) 1.10 (1.05–1.15)
Specimen type <0.001 CSF 5697/21,188 (27) 11,446/25,297 (45) Reference Blood culture 13,897/21,188 (66) 11,104/25,297 (44) 2.51 (2.41–2.62) Other specimens 1594/21,188 (8) 2747/25,297 (11) 1.17 (1.09–1.25) Serotype <0.001 Non-serotype 1 19,246/21,186 (91) 22,690/25,294 (90) Reference Serotype 1 1940/21,186 (9) 2604/25,294 (10) 0.88 (0.83–0.93)
Page 5 of 8
Technical Appendix Table 2. Characteristics of 10,899 patients >5 years of age with invasive pneumococcal disease caused by serotype 1 and non–serotype 1 Streptococcus pneumoniae, South Africa, 2003–2013*
Variable
No. cases/no. total (%)
Univariate analysis†
Multivariable analysis†
Serotype 1 Non–serotype 1 OR (95% CI) p value aOR (95% CI) p value
Age group, y 5–9 254/1,642 (15) 809/9,257 (9) 3.19 (2.29–4.45) <0.001 13.48 (5.53–32.82) <0.001 10–14 115/1,642 (7) 298/9,257 (3) 3.92 (2.71–5.66) 8.02 (3.15–20.43) 15–24 201/1,642 (12) 755/9,257 (8) 2.71 (1.93–3.79) 5.65 (2.31–13.82) 25–44 768/1,642 (47) 5,078/9,257 (55) 1.54 (1.13–2.10) 3.67 (1.53–8.76) 45–64 257/1,642 (16) 1,839/9,257 (20) 1.42 (1.03–1.97) 2.57 (1.06–6.23) >64 47/1,642 (3) 478/9,257 (5) Reference Reference
Black race 1452/1,576 (92)
7,854/8,889 (88) 1.54 (1.27–1.87) <0.001
Province Gauteng 951/1,642 (58) 4,804/9,257 (52) Reference <0.001 Reference <0.001 Western Cape 99/1,642 (6) 1,443/9,257 (16) 0.35 (0.28–0.43) 0.24 (0.17–0.34) KwaZulu-Natal 228/1,642 (14) 1,469/9,257 (16) 0.78 (0.67–0.92) 0.80 (0.60–1.07) Eastern Cape 47/1,642 (3) 166/9,257 (2) 1.43 (1.03–1.99) 0.80 (0.39–1.63) Free State 130/1,642 (8) 516/9,257 (6) 1.27 (1.04–1.56) 0.89 (0.64–1.22) Mpumalanga 64/1,642 (4) 358/9,257 (4) 0.90 (0.69–1.19) 0.80 (0.43–1.49) North-West 34/1,642 (2) 148/9,257 (2) 1.16 (0.79–1.70) 2.25 (1.13–4.48) Limpopo 42/1,642 (3) 143/9,257 (2) 1.48 (1.04–2.11) 0.97 (0.47–2.01) Northern Cape 47/1,642 (3) 210/9,257 (2) 1.13 (0.82–1.56) 1.39 (0.85–2.26)
Year of specimen collection 2003 209/1,642 (13) 733/9,257 (8) 1.45 (1.16–1.80) <0.001 1.17 (0.76–1.82) 0.01 2004 225/1,642 (14) 891/9,257 (10) 1.28 (1.03–1.58) 1.32 (0.87–2.00) 2005 196/1,642 (12) 994/9,257 (11) Reference Reference 2006 142/1,642 (9) 962/9,257 (10) 0.75 (0.59–0.95) 0.67 (0.42–1.09) 2007 112/1,642 (7) 892/9,257 (10) 0.64 (0.50–0.82) 0.71 (0.44–1.14) 2008 116/1,642 (7) 842/9,257 (9) 0.70 (0.55–0.89) 0.86 (0.56–1.32) 2009 156/1,642 (10) 866/9,257 (9) 0.91 (0.73–1.15) 1.21 (0.80–1.84) 2010 164/1,642 (10) 995/9,257 (11) 0.84 (0.67–1.05) 1.02 (0.66–1.57) 2011 134/1,642 (8) 819/9,257 (9) 0.83 (0.65–1.05) 0.98 (0.63–1.51) 2012 112/1,642 (7) 676/9,257 (7) 0.84 (0.65–1.08) 0.96 (0.62–1.48) 2013 76/1,642 (5) 587/9,257 (6) 0.66 (0.49–0.87) 0.64 (0.40–1.04)
Medical conditions/treatment Length of hospital stay, d <3 481/1,443 (33) 2518/8,311 (30) Reference 0.001 Reference 0.01 4–14 758/1,443 (53) 4289/8,311 (52) 0.93 (0.82–1.05) 0.86 (0.68–1.09) >15 204/1,443 (14) 1504/8,311 (18) 0.71 (0.60–0.85) 0.64 (0.48–0.86) Previous hospital admission 166/1,153 (14) 2000/6,816 (29) 0.40 (0.34–0.48) <0.001 0.45 (0.35–0.57) <0.001 Underlying medical condition‡
310/953 (33) 2571/6,083 (42) 0.66 (0.57–0.76) <0.001
Antimicrobial drug use in previous 2 mo§
32/962 (3) 412/5,550 (7) 0.43 (0.30–0.62) <0.001
HIV infected 717/1,007 (71) 5373/6,338 (85) 0.44 (0.38–0.52) <0.001 0.39 (0.31–0.49) <0.001 Treated for TB in previous 3 mo
146/1,126 (13) 1373/6,659 (21) 0.57 (0.48–0.69) <0.001 0.73 (0.57–0.95) 0.02
Died during hospitalization 461/1,422 (32) 2650/8,228 (32) 1.01 (0.90–1.14) 0.88
Pneumococcal isolate characteristics
Penicillin nonsusceptible¶ 15/1,555 (1) 2916/8,829 (33) 0.02 (0.01–0.03) <0.001 0.02 (0.01–0.04) <0.001 Previous invasive pneumococcal disease**
26/1,642 (2) 396/9,257 (4) 0.36 (0.24–0.54) <0.001 0.32 (0.16–0.63) 0.001
Clinical syndrome/specimen type
Specimen type Cerebral spinal fluid 512/1,642 (31) 2626/9,257 (28) Reference 0.05 Blood 1025/1,642
(62) 5967/9,257 (64) 0.88 (0.78–0.99)
Other 105/1,642 (6) 664/9,257 (7) 0.81 (0.65–1.02) Clinical syndrome†† Meningitis 587/1,541 (38) 3043/8,793 (35) Reference 0.02 Reference 0.006 Pneumonia 832/1,541 (54) 5076/8,793 (58) 0.85 (0.76–0.95) 1.28 (1.03–1.58) Bacteremia 122/1,541 (8) 674/8,793 (8) 0.94 (0.76–1.16) 1.76 (1.22–2.55)
Page 6 of 8
*All patients were reported from the enhanced Group for Enteric, Respiratory, and Meningeal Disease Surveillance in South Africa (GERMS-SA) surveillance sites. aOR, adjusted odds ratio; OR, odds ratio; TB, tuberculosis †Only variables significant on univariate and multivariable analysis are shown (exception is death during hospital admission). Variables not included in table are sex, Pitt bacteremia score, antimicrobial drug in previous 24 h, and viable culture. Prematurity and malnutrition were not included in the analysis because they were not considered relevant or actively collected for patients >5 years of age. ‡Includes asplenia or sickle cell anemia; chronic illness (i.e., chronic lung, renal, liver, cardiac disease, and diabetes); other immunocompromising conditions (i.e., organ transplant, primary immunodeficiency, immunotherapy, and malignancy, but excluding HIV); and other risk factors (i.e., head injury with possible cerebral spinal fluid leak, neurologic disorders, burns, chromosomal abnormalities, smoking, and alcohol use). §Use of any antimicrobial drug in 2 mo before admission.
¶Considered penicillin nonsusceptible at MIC >0.12 g/mL; intermediately resistant and resistant groups were combined into a nonsusceptible group. **Invasive pneumococcal disease diagnosis >21 days before this episode. ††Clinical diagnoses were made on the basis of documented discharge diagnoses in patient medical records; clinical syndrome separated into 3 groups: meningitis, bacteremic pneumonia, and bacteremia without focus or other diagnosis (e.g., septic arthritis, endopthalmitis, peritonitis, pericarditis).
Technical Appendix Table 3. Factors associated with death in patients >5 years of age with serotype 1 invasive pneumococcal disease, South Africa, 2003–2013*
Variable
Univariate analysis
Multivariable analysis
No. deaths/no. cases (%) OR (95% CI) p value aOR (95% CI) p value
Demographic/socioeconomic characteristic
Age group, y 5–9 37/350 (11) Reference <0.001 Reference <0.001 10–14 23/143 (16) 1.62 (0.92–2.84) 1.24 (0.65–4.57) 15–24 90/362 (25) 2.80 (1.85–4.24) 3.05 (1.47–6.32) 25–44 611/1,950 (31) 3.86 (2.71–5.50) 5.07 (2.74–9.38) 45–64 285/686 (42) 6.01 (4.14–8.73) 9.00 (4.66–17.35) >64 58/133 (44) 6.54 (4.03–10.61) 10.13 (4.46–23.00) Race Nonblack 61/250 (24) Reference 0.03 Black 1,023/3,313 (31) 1.38 (1.02–1.86) Province Gauteng 706/2,444 (29) Reference <0.001 Western Cape 54/217 (25) 0.82 (0.59–1.12) KwaZulu-Natal 98/329 (30) 1.04 (0.81–1.34) Eastern Cape 29/68 (43) 1.83 (1.12–2.98) Free State 59/189 (31) 1.12 (0.81–1.54) Mpumalanga 63/154 (41) 1.70 (1.22–2.38) North-West 34/70 (49) 2.32 (1.44–3.75) Limpopo 42/94 (45) 1.99 (1.31–3.01) Northern Cape 19/59 (32) 1.17 (0.67–2.03)
Medical condition/treatment Length of hospital stay, d >3 750/1,130 (66) Reference <0.001 Reference <0.001 4–14 254/1,891 (13) 0.08 (0.07–0.09) 0.07 (0.05–0.10) >15 93/577 (16) 0.10 (0.08–0.13) 0.06 (0.04–0.09) Pitt bacteremia score† 0–3 744/2,920 (26) Reference <0.001 Reference <0.001 >4 258/361 (71) 7.33 (5.74–9.34) 5.26 (3.53–7.84) Underlying medical condition‡ No 357/1,582 (23) Reference <0.001 Reference 0.004 Yes 257/827 (31) 1.55 (1.28–1.87) 1.53 (1.14–2.04) Antimicrobial drug use in 24 h before admission
No 644/2,537 (25) Reference 0.05 Yes 32/93 (34) 1.54 (1.00–2.39) HIV status HIV uninfected 108/514 (21) Reference 0.001 HIV infected 610/2,165 (28) 1.47 (1.17–1.86) Treated for tuberculosis in previous 3 mo
No 508/2,156 (24) Reference 0.001 Reference 0.001 Yes 154/496 (31) 1.46 (1.18–1.81) 1.75 (1.25–2.45) Previous invasive pneumococcal disease§
No 1097/3,536 (31) Reference <0.001 Yes 7/88 (8) 0.19 (0.09–0.42) Clinical syndrome/specimen type
Page 7 of 8
Specimen type Cerebral spinal fluid 461/802 (57) Reference <0.001 Blood 565/2,440 (23) 0.22 (0.19–0.26) Other 78/382 (20) 0.19 (0.14–0.25) Clinical syndrome¶ Meningitis 531/982 (54) Reference <0.001 Reference <0.001 Pneumonia 490/2,311 (21) 0.23 (0.19–0.27) 0.18 (0.13–0.25) Bacteremia 75/307 (24) 0.27 (0.21–0.37) 0.29 0.18–0.48) *All patients were reported from the enhanced Group for Enteric, Respiratory, and Meningeal Disease Surveillance in South Africa (GERMS-SA) surveillance sites. Only variables significant on univariate and multivariable analysis are shown. Variables not included in table are sex, year, previous hospital admission, any antimicrobial drug used in 2 mo before admission, and penicillin-nonsusceptible invasive pneumococcal disease. Prematurity and malnutrition were not included in the analysis because they were not considered relevant or actively collected for patients >5 years of age. aOR, adjusted odds ratio; OR, odds ratio. †Pitt bacteremia score calculated by using temperature, hypotension, mechanical ventilation, cardiac arrest, and mental status. Severe disease defined as score of >4 points. ‡Includes asplenia or sickle cell anemia; chronic illness (i.e., chronic lung, renal, liver, cardiac disease and diabetes); other immunocompromising conditions (i.e., organ transplant, primary immunodeficiency, immunotherapy, and malignancy, but excluding HIV); and other risk factors (i.e. head injury with possible cerebral spinal fluid leak, neurologic disorders, burns, and chromosomal abnormalities). §Invasive pneumococcal disease diagnosis >21 days before this episode. ¶Clinical diagnoses were made on the basis of documented discharge diagnoses in patient medical records, with clinical syndrome separated into 3 groups: meningitis, bacteremic pneumonia, and bacteremia without focus or other diagnosis (e.g. septic arthritis, endopthalmitis, peritonitis, pericarditis).
Technical Appendix Table 4. Serotype 1 clusters, by district, in South Africa, 2003–2013
Cluster Period Location
Relative risk p value District Province 1 May 2003–Dec 2004 City of Johannesburg Gauteng 1.7 <0.001 City of Tshwane Gauteng Ekurhuleni Gauteng Metweding Gauteng Sedibeng Gauteng West Rand Gauteng Sekhukhune Cross Limpopo Govan Mbeki Mpumalanga Nkangala Mpumalanga Bojanala North-West Southern North-West 2 Sep 2008–Apr 2012 Alfred Nzo Eastern Cape 1.4 <0.001 Amatole Eastern Cape Chris Hani Eastern Cape Ukhahlamba Eastern Cape Lejweleputswa Free State Motheo Free State Northern Free State Thabo Mofutsanyane Free State Xhariep Free State Ekurhuleni Gauteng Sedibeng Gauteng Amabuja KwaZulu-Natal Ethekwini KwaZulu-Natal iLembe KwaZulu-Natal Sisonke KwaZulu-Natal Ugu KwaZulu-Natal UMgungundlovu KwaZulu-Natal Umkhanyakude KwaZulu-Natal Umzinyathi KwaZulu-Natal Uthukela KwaZulu-Natal Uthungulu KwaZulu-Natal Zululand KwaZulu-Natal Govan Mbeki Mpumalanga Southern North-West
Page 8 of 8
Technical Appendix Figure. Incidence rates for serotype 1 in children <5 years (n = 714) and individuals
>5 years (n = 5167) of age, South Africa, 2003–2013. Error bars indicate CIs for incidence rates. N,
imputed serotype 1 cases.