Embed Size (px)
Citation preview

EPIDEMIOLOGY OF SUBURBAN DEER
BY
KARMEN M. HOLLIS
DISSERTATION
Submitted in partial fulfillment of the requirements
for the degree of Doctor of Philosophy in Natural Resources and Environmental Sciences
in the Graduate College of the
University of Illinois at Urbana-Champaign, 2011
Urbana, Illinois
Doctoral Committee:
Professor Richard Warner, Chair
Professor Jeffrey Brawn
Professor Patrick Brown, Northern Michigan University
Associate Professor Timothy VanDeelen

ii
ABSTRACT
Urban and suburban development has expanded beyond the traditional core of major
cities. Preservation of open spaces in metropolitan landscapes provides aesthetic and
recreational values for humans. However, white-tailed deer (Odocoileus virginianus)
populations in North America are overabundant in many suburban areas. This trend is directly
related to changes to habitat as a result of landscape alteration and fragmentation caused by
humans. This close relationship between humans and wildlife increases the risk for zoonotic
disease transmission from many vectors, such as mosquitoes and ticks. There is limited research
for suburban deer examining the relationship between zoonotic prevalence and ecological
factors, such as habitat. Additionally, an extensive search of deer ecology and wildlife disease
literature revealed no peer-reviewed publications of zoonoses from suburban white-tailed deer.
From 1995-99, I conducted a zoonotic serological survey of live-captured (tagged and
radio-collared) and culled deer from Chicago, Illinois forest preserves for Jamestown Canyon
(JC) and LaCrosse (LAC) encephalitis viruses, toxoplasmosis, and leptospirosis. The prevalence
of sera samples collected from suburban white-tailed deer (live-captured and culled) was 55.9%
for Toxoplasma gondii (n=443), 16.2% for Leptospira spp. (n=444), 38.1% for JC virus (n=404),
and 6.7% for LAC virus (n=404). Prevalence was higher for adult deer for all pathogens
sampled except Leptospira spp. Prevalence also was less likely in males for JC virus. A higher
prevalence for T. gondii and JC virus was detected at Des Plaines (DP) and prevalence for
Leptospira spp. was less likely at DP. Differences in year the sample was collected were present
for T. gondii, Leptospira spp., and JC virus. Variation in month the samples were collected was
evident for T. gondii, Leptospira spp., and LAC virus. Main effects variables (age, sex, site,
year, and month) for multivariate logistic regression (LR) models were screened using backward

iii
stepwise elimination (p<0.20). The final LR model for T. gondii contained all main effects
variables. Leptospira spp. and JC viral models both contained age, site, and year, while the final
LAC viral LR model contained age, sex, and month. A subsample of deer (n=169 from DP and
Palos; radio-collared and culled) analyzed for JC and LAC viral antibodies was used to evaluate
habitat characteristics. Radio-collared does selected for forest, savanna, and grassland habitats
(available habitat=p<0.0001; home range=p<0.001). Akaike’s Information Criterion (AICc)
optimal models for JC contained water and wetland habitat parameters while LAC models
contained forested habitat. Deer biological parameters for JC viral models included age and
month/year the samples were collected. Total home-range or buffer size and month were
biological parameters contained in LAC viral models. Blood samples from live-captured and
culled deer tested for JC (238 seropositive and 402 seronegative cases) and LAC viruses (51
seropositive and 402 seronegative cases) from 11 forest preserves were used for spatial analysis.
Using the Bernoulli model in the space-time scan statistic in SaTScan®, a significant viral “hot
spot” was revealed for JC virus in DP (p=0.009). A significant cluster for LAC virus was also
found in DP (p=0.005). All clusters were independent of each other. Temporal patterns for JC
virus spanned samples from December 1, 1995 to March 31, 1998. This research demonstrates
deer are positive for several zoonotic diseases in the Chicago area. The environmental and
habitat factors required to maintain pathogens and vectors are present at various levels in Cook
County Forest Preserves. “Hot spots” are present for JC and LAC viruses and deer serve as an
effective wildlife sentinel. The relationship between habitat and spatial data can be used to focus
surveillance. This research not only quantifies deer exposures to pathogens, but also provides a
more sensitive assessment of risk than human or pet surveillance alone. Wildlife species, such as
deer, serve as effective disease sentinels because they are exposed to potential pathogens

iv
everyday in their natural environment when humans and pets are typically random and accidental
exposures. Wildlife ecologists have a responsibility to increase public knowledge about the
health status of animal populations while protecting humans and domestic animals from zoonotic
diseases. This research represents the largest suburban deer zoonotic surveillance project to date
in the United States and provides evidence that suburban deer are effective biomonitors for
zoonoses. International, federal, and state management agencies collect various harvested
wildlife species annually which could be easily accessed for zoonoses sampling. Annual culling
of deer continues in Chicago area forest preserves and samples should be collected and analyzed
for zoonotic diseases with minimum effort and cost. Results should be communicated to public
health officials to assist in focusing vector control and to notify the public of potential exposures.

v
ACKNOWLEDGEMENTS
This research could not have been conducted or completed without the endless advice,
assistance, and support of numerous individuals. I want to thank my advisor, Dr. Richard
Warner for his guidance, knowledge, and commitment to me and this research project. Even
when I could not see the light at the end of the tunnel, he was there. You have set a life-time
example for me as an advisor, and you are the most patient man I know. I want to thank my
present and past committee members, Dr. Jeff Brawn, Dr. Patrick Brown, Dr. Phil Mankin, Dr.
Randy Peper, Dr. Gary Rolfe, and Dr. Tim Van Deelen for their knowledge, support, scientific,
and editorial input while completing my dissertation.
I have some very good friends in the Forest Preserve District of Cook County’s Wildlife
Field Office. I am indebted to Chris Anchor and Jim Chelsvig. They literally spent years
working on this project with me. They opened their doors, loaned equipment and vehicles, and
allowed me to work with them side by side. We spent hours in the office discussing strategies
and many nights in the field catching, radio-tracking, culling, and processing deer. It is not just
the postman who delivers in the wind, rain, sleet or snow, so do Chris and Jim. I know it has
been a long time coming. Thanks for trusting me.
In addition, a project of this magnitude cannot be completed without the assistance of
many professionals in their field of expertise and knowledge of data analysis. Thank you for the
many hours that were sacrificed by Dr. Pat Brown, Dr. Dwayne Etter, and Dr. Richard Warner
while reviewing and editing the dissertation. It would not have been completed without you.
Additional thanks to Dr. Jeff Brawn, Dr. Dwayne Etter, and Dr. Tim Van Deelen for sharing
their statistical expertise. I want to thank Dr. Uriel Kitron for his review and input on
geographical information systems and spatial analysis. Thank you to Dr. Leo Chapa for his

vi
extensive knowledge and assistance in running the geographic data. Additional
acknowledgements to my publication co-authors Dr. J. P. Dubey, Dr. Paul Grimstad, Dr. Marvin
Godsey, and Diane Lovin for performing serological analysis during this research project and to
Dr. Laura Hungerford who taught me epidemiology. Thank you to Dr. Sagar Goyal and his staff
at the Minnesota Veterinary Diagnostic Laboratory for running all the leptospirosis serology.
Hats also go off to the Natural Resources and Environmental Sciences (NRES) Graduate Office
staff, especially Karen and Piper, who guided me repeatedly through the department and
graduate college processes.
Many thanks to the Cook County Department of Animal Control, Forest Preserve District
of Cook County, and University of Illinois for generously funding and supporting this research.
I greatly appreciate the assistance with sample collection by the Forest Preserve District of
DuPage County. Special thanks goes out to D. Antilitz, T. Anchor, R. Bartman, M. Ermer, B.
Green, L. Kammin, R. Keough, N. Komar, S. Lavin, W. Luby, M. Narrish, J. Nevis, D. Parmer,
M. F-Peters, J. Phillips, B. Piccolo, C. Pollock, C. Ryndak, S. Strack, R. Trakur, M. VanKast,
and T. Weicherding for their outstanding assistance and extensive contributions to this project in
the field, office, and political arenas.
Last, but not least, I want to thank my husband, Dr. Dwayne Etter. Not only did we
move to Chicago and start our research projects together, we sacrificed a large part of our lives
while pursuing our PhD’s. He is the perpetual example of an ideal leader, wildlife research
biologist, published scientist, and excels with the Michigan Department of Natural Resources.
He stood by me through thick and thin while picking me up many times during this journey. It
has been a very long road. Thank you for believing in me and loving me like no one else.
vii
TABLE OF CONTENTS
INTRODUCTION……………………………………………………………………………...…1
GENERAL MATERIALS AND METHODS…………………………………………………...14
SEROLOGICAL SURVEY OF SUBURBAN DEER……………………..……………………22
HABITAT MODELING OF ENCEPHALITIDES USING SUBURBAN DEER.......................53
SPATIAL AND TEMPORAL ANALYSIS OF ENCEPHALITIDES IN SUBURBAN
DEER…………………………………………………………………………………………….73
MANAGEMENT RECOMMENDATIONS..…………………………………………………...88
APPENDIX A: SUBURBAN WHITE-TAILED DEER SEROPOSITIVE FOR BABESIA…..90
APPENDIX B: SUBURBAN WHITE-TAILED DEER SEROPOSITIVE FOR CACHE
VALLEY VIRUS………………………………………………………………………………...91
APPENDIX C: SUBURBAN WHITE-TAILED DEER SEROPOSITIVE FOR EHRLICHIA
CHAFFEENSIS…………….…………………………………………………………………....93
APPENDIX D: SUBURBAN WHITE-TAILED DEER SEROPOSITIVE FOR EPIZOOTIC
HEMORRHAGIC VIRUS………………………….………………………………………..…..94
APPENDIX E: SUBURBAN WHITE-TAILED DEER SEROPOSITIVE FOR ESCHERICHIA
COLI……………………………………………………………………………………………..95
APPENDIX F: SUBURBAN WHITE-TAILED DEER SEROPOSITIVE FOR JAMESTOWN
CANYON VIRUS……………………………………………………………………………….96
APPENDIX G: SUBURBAN WHITE-TAILED DEER SEROPOSITIVE FOR LACROSSE
VIRUS…………………………………………………………………………………………...98
APPENDIX H: SUBURBAN WHITE-TAILED DEER SEROPOSITIVE FOR
LEPTOSPIRA…………………………………………………………………………………..100

viii
APPENDIX I: SUBURBAN WHITE-TAILED DEER SEROPOSITIVE FOR NEOSPORA
CANINUM……………………………………………………………………………………..102
APPENDIX J: SUBURBAN WHITE-TAILED DEER SEROPOSITIVE FOR POTOSI
VIRUS………………………………………………………………………………………….104
APPENDIX K: SUBURBAN WHITE-TAILED DEER SEROPOSITIVE FOR TOXOPLASMA
GONDII………………………………………………………………………………………...105
APPENDIX L: MAP OF DUPAGE COUNTY FOREST PRESERVES, CHICAGO, ILLINOIS,
USA, 1995-99…………………………………………………………………………………..107
APPENDIX M: FRAGSTATS VARIABLES INCLUDED IN THE ORIGINAL ANALYSIS
TO MODEL HABITAT………………………………………………………………………..108

1
INTRODUCTION
Zoonoses are infectious diseases that can be transmitted naturally between humans and
wild or domestic animals (Slingenbergh et al., 2004). Zoonoses from wildlife and vector-borne
pathogens threaten human health, global economics, and are driving an emerging infectious
disease (EID) trends worldwide. More than half of the defined 1,400 EID organisms can cause
human infections (Woolhouse and Gowtage-Sequeria, 2005). Greater than 60% of EID events
are caused by zoonotic pathogens and more than 70% of these events result from pathogens with
a wildlife origin. Additionally, vector-borne diseases are responsible for 23% of EID events and
29% have occurred in the last decade (Jones et al., 2008). Examples of some important EIDs
include human immunodeficiency virus (HIV), tuberculosis, cholera, Lyme disease, Parvovirus
B19, rotavirus, Escherichia coli (E. coli) 0517-H7, and West Nile virus (WNV). Some diseases
like tularemia and plague are established diseases capable of causing mass mortalities in small
mammals and are now appearing in new locations. In the United States, more than a dozen food
borne diseases have emerged and the Pan American Health Organization reports several food
borne zoonoses have increased by 100% in recent years (Friend, 2006).
Presently, there are several anthropogenic changes occurring to natural ecosystems
globally that have the potential to influence pathogen dynamics (McCallum, 2008). Climate
change facilitates expansion of diseases into new territories. Change in weather patterns and
temperature may influence arthropod vectors, their life cycles, and life histories. Such changes
may result in altered vector and pathogen distribution and transmission. Climate can affect the
way pathogens interact with arthropod vector(s) and human or animal
hosts. With increased
temperatures and rainfall associated with global warming in some parts of the world, new
habitats where vector mosquitoes can breed contributes to a suitable climate for disease

2
transmission, like dengue fever. In 1970 dengue fever was only documented in nine countries
and now is documented in over 100 countries (Hales et al., 2002). Other diseases linked to
climate change include Lyme disease, schistosomiasis, tuberculosis, bubonic plague, and cholera
(Cunningham and Cunningham, 2009).
Rapid international travel also makes it possible for diseases to spread around the world.
In 2008, 992 million people travelled internationally (World Tourism Organization, 2009). West
Nile virus was introduced into North America in 1999 by imported birds or mosquitoes. The
disease rapidly spread across the United States from New York in less than two years. The virus
found a foothold within populations of susceptible birds, hosts, vectors, and mammals that had
never had contact with the virus (Enserink, 2000). The abundance of susceptible native avian
species and available habitats for avian hosts and vector mosquitoes supported the establishment
and rapid expansion of WNV across the United States (McLean, 2008). The virus is now found
in all 48 lower states and infects at least 250 bird and 18 mammalian species, including humans
(Cunningham and Cunningham, 2009). Travel-associated fungal infections, such as
histoplasmosis and coccidioidomycosis, are worldwide illnesses on the rise. The fungus creates
diagnostic challenges when human disease may not develop for many years and away from the
endemic area where the fungus was contracted (Friend, 2006).
International trade of livestock and wildlife also increases the spread of zoonotic diseases
and may have important economic and/or public health impacts. In 2003, humans in the United
States became infected with monkey pox from the importation of wild west African rodents
(Reed et al., 2004). Severe acute respiratory syndrome (SARS) and highly pathogenic avian
influenza (H5N1) are emerging infections that have the potential for massive public health and
economic consequences. Both diseases are maintained in wildlife reservoir hosts: H5N1 in wild

3
fowl and SARS in horseshoe bats (Rhinolophus spp.) in China. The trade in bats has likely
brought SARS into contact with susceptible amplifying hosts such as the masked palm civet
(Parguma larvata). Dog (Canis familiaris) and fox (Vulpes vulpes) rabies outbreaks reported in
the United States during the late 1700’s was likely exacerbated by the introduction of canines
imported for fox hunting (Winkler, 1975). Translocation of raccoons (Procyon lotor) from
Florida to Virginia for hunting led to the emergence of raccoon rabies in the mid-Atlantic states
(Jenkins and Winkler, 1987). The threat of animal translocations and invasions into new
geographic areas pose risks for native species, endangered species, and species diversity (Lau et
al., 2005; Li et al, 2005).
Infectious disease studies in wildlife are crucial because wild animals serve as a reservoir,
amplifier, and/or host for many pathogenic agents transmitted to humans and domestic animals
(Hudson et al., 2001; Newman, et al, 2005). Pathogen surveillance is an early warning system
for disease emergence, potential disease outbreaks, and opportunities for public health education.
However, effective management of infectious diseases requires knowledge about the factors
influencing infection within a host and transmission dynamics of the pathogen. Laboratory
studies of infections assist in understanding disease transmission, but these studies are not
sufficient to understand, indicate, or predict transmission dynamics in open populations between
hosts and vectors. It is essential to understand the factors that increase transmission between
wildlife and humans when developing surveillance programs, wildlife management plans, and
predictive approaches to disease emergence.
Wildlife have an intimacy with the environment and provide enhanced sensitivity for
disease detection (Friend, 2006). They have direct contact with the soil, water, vegetation,
insects, and other food sources. For example, coyotes (Canis latrans) may act as biological

4
sensors for bovine tuberculosis (TB) by consuming infected host material (VerCauteren et al.,
2008). Wildlife have been used as biomonitors for nuclear wastes at Chernobyl and chemical
contaminates have been measured in fish and waterfowl (National Research Council, 1991).
Captive chickens, pigeons, and dead crows have been used for WNV surveillance (Komar,
2001). White-tailed deer (Odocoileus virginianus) have served as biomonitors for encephalitis,
anaplasmosis, and Ehrlichia chaffeensis (Trainer, 1973; Yabsley, 2003; Dugan, 2006). Disease
surveillance in free-ranging wildlife populations provides an early warning system for public
health agencies.
Urbanization changes landscape structure by creating fragmented habitats and brings
certain wildlife species into closer contact with domestic animals and humans (Power and
Mitchell, 2004). Landscape changes can also lead to disease emergence by increasing the
abundance and/or distribution of disease vectors like mosquitoes and ticks. Urban/suburban
landscapes are ideal locations to study zoonoses among wildlife, vectors, and pathogens that can
threaten human health.
The greater Chicago, Illinois region consists of dense human development with
interspersed green belts (parks and forest preserves), many associated with riparian corridors.
Wetland and riparian areas contain ecological biodiversity, but also serve as habitat for mosquito
larvae and disease vectors. Epidemiological models indicate corridors increase contact among
various populations and can enhance the transmission of infectious diseases (Hess, 1994; Hess,
1996). Human population density in the Chicago area exceeds 2,100 people per km2 (U. S.
Census Bureau, 2000). In Chicago, numbers for domestic dogs and cats (Felis catus) are
estimated at 1.3 and 1.5 million, respectively (Wise et al., 2002). Physical recreation (i.e.,
biking, canoeing, jogging, fishing, and outdoor sports) and picnicking are very common

5
activities in parks and forest preserves throughout the Chicago Region. Human recreationists are
sometimes accompanied by pets (primarily domestic dogs) and sometimes encounter wildlife
either directly (i.e., hand feeding or handling young wildlife) or indirectly (i.e., contacting urine,
feces, and disease vectors like mosquitoes and ticks). These encounters increase the risk for
contacting zoonoses and potentially expose other family members by bringing disease agents
into the home. The interface of dense human development with abundant habitat for disease
vectors in the Chicago region provided a unique opportunity to examine potential exposure to
zoonoses.
Due to a lack of natural predators and because many jurisdictions do not permit
recreational hunting and trapping to control wildlife populations, many common suburban
wildlife species exist at high densities (Brown et al., 2000; Conover, 2001). Suburban raccoon
densities in Chicago have exceeded 80 raccoons km2 while adult coyote populations average 3-6
animals km2 (Prange et al., 2003; Gehrt et al., 2009). Recent estimates of white-tailed deer
densities in the Chicago region have exceeded 40-100 deer/km2 (Witham and Jones, 1990; Etter,
2001). Within the Chicago region, white-tailed deer culling programs were effective at reducing
deer densities for management of natural areas (Etter, 2001).
The awareness of infectious diseases and the population, community, and ecosystem
level impacts have increased dramatically over the past decade (Daszak et al., 2000; Deem et al.,
2001). Deer are widely recognized as the premier big game mammal in North America (Baker,
1984). However, deer are host to numerous bacteria, viruses, and parasites. Mycobacterium
bovis is a bacterial pathogen causing bovine tuberculosis and can be transmitted to humans from
deer by consuming infected tissues (Clifton-Hadley et al., 2001). This organism is now
commonly found in deer in Michigan (Schmitt et al., 1997). Leptospiria is a zoonotic bacterium

6
typically transmitted in contaminated water and deer are known to be reservoir hosts by shedding
the organism (Leighton and Kuiken, 2001). Toxoplasma is a parasitic pathogen known to cause
human disease when consuming infected venison (Davidson and Nettles, 1997). Many
pathogenic parasites maintain transmission cycles on white-tailed deer, such as mosquitoes and
ticks. Deer do not directly transmit disease to humans, but contribute to zoonoses such as Lyme
disease, Babesiosis, and Ehrlichiosis by harboring the parasites (Thompson et al., 2001).
To be effective sentinels, suburban deer 1) facilitate detection of pathogen presence with
a reasonable sampling effort and abundant numbers, 2) can be used to detect several pathogens at
a time instead of sampling several different wildlife hosts/reservoirs for the same pathogens, 3)
have a direct ecological relationship with the pathogen over time, 4) are easily identified and
biological data collected (age and sex), 5) live for a long time in a relatively defined sedentary
home range, and 6) interact with other wildlife and domestic species (Trainer, 1973; Beeby,
2001). Therefore, deer are a cost-effective way to infer pathogen prevalence in wildlife
populations.
The conditions in Chicago area forest preserves created a unique opportunity to study
wildlife pathogens present in a suburban environment. I began by examining zoonotic pathogen
seroprevalence for Jamestown Canyon (JC) and LaCrosse (LAC) viral encephalitis,
toxoplasmosis, and leptospirosis in white-tailed deer. I further examined the spatial and
ecological factors associated with the epidemiology of JC and LAC viruses. Effectively, this
project examined the unique approach of using white-tailed deer as a zoonotic surveillance tool.
Such an approach can be combined with ongoing deer culling programs in the region to monitor
zoonoses. This unique biomonitoring approach between epidemiology and deer ecology will
supply wildlife managers and public health officials with valuable information to make decisions

7
about public health, managing wildlife populations, suburban development, and future emerging
and reemerging infectious disease threats.

8
LITERATURE CITED
BAKER, R. H. 1984. Origin, classification, and distribution In White-tailed deer: Ecology and
management, W. R. Davidson, F. A. Hayes, V. F. Nettles, and F. E. Kellog (eds). Stackpole
Books, Harrisburg, Pennsylvania, pp. 1-18.
BEEBY, A. 2001. What do sentinels stand for? Environmental Pollution 112:285-298.
BROWN, T. L., D. J. DECKER, S. J. RILEY, J. W. ENCK, B. LAUBER, P. D. CURTIS, AND
G. F. MATTFELD. 2000. The future of hunting as a mechanism to control white-tailed deer
populations. Wildlife Society Bulletin 28(4):797-807.
CLIFTON-HADLEY, R. S., I. W. LUGTON, R. JACKSON, P. A. DURR, AND J. W.
WILESMITH. 2001. Mycobacterial diseases In Infectious diseases of wild mammals, E. S.
Williams and I. K. Barker (eds). Iowa State University Press, Ames, Iowa, pp.340-361.
CONOVER, M. R. 2001. Effect of hunting and trapping on wildlife damage. Wildlife Society
Bulletin 29(2):521-553.
CUNNINGHAM, W. P. AND M. A. CUNNINGHAM. 2009. Environmental health and
toxicology. In Principles of environmental science: Inquiry and applications. McGraw Hill
Companies, New York, New York, pp. 175-198.
DASZAK, P. A., A. CUNNINGHAM, AND A. D. HYATT. 2000. Emerging infectious
diseases of wildlife: Threats to biodiversity and human health. Science 287:443-449.
DAVIDSON, W. R. AND V. F. NETTLES. 1997. Field manual of wildlife diseases in the
Southeastern United States. Southeastern Cooperative Wildlife Disease Study, Athens, Georgia,
417 pp.
DEEM, S. L., W. B. KARESH, AND W. WEISMAN. 2001. Putting theory into practice:
Wildlife health and conservation. Conservation Biology 15:1224-1233.

9
DUGAN, V. G., M. J. YABSLEY, C. M. TATE, D. G. MEAD, U. G. MUNDERLOH, M. J.
HERRON, D. E. STALLKNECHT, S. E. LITTLE, AND W. R. DAVIDSON. 2006. Evaluation
of white-tailed deer (Odocoileus virginianus) as natural sentinels for Anaplasma
phagocytophilum. Vector-Borne and Zoonotic Diseases 6(2):192-207.
ENSERINK, M. 2000. The enigma of West Nile. Science 290(5496):1482-1484.
ETTER, D. R. 2001. Ecology and management of overabundant white-tailed deer from
suburban Chicago, Illinois. Ph.D. Thesis. University of Illinois, Urbana-Champaign, 107 pp.
FRIEND, M. 2006. Disease emergence and resurgence: The wildlife-human connection.
USGA National Wildlife Health Center in cooperation with the U.S. Fish and Wildlife Service,
387 pp.
GEHRT, S. D., C. ANCHOR, AND L. A. WHITE. 2009. Home range and landscape use of
coyotes in a metropolitan landscape: Conflict or coexistence? Journal of Mammalogy
90(5):1045-1057.
HALES, S., N. DE WET, J. MAINDONALD, AND A. WOODWARD. 2002. Potential effect
of population and climate changes on global distribution of dengue fever: An empirical model.
Lancet 360(9336):830-834.
HESS, G. 1994. Conservation corridors and contagious disease: A cautionary note.
Conservation Biology 8:256-262.
_____. 1996. Disease in metapopulation models: Implications for conservation. Ecology
77:1617-1632.
HUDSON, P. J., A. RIZZOLI, B. T. GRENFELL, J. A. P. HEESTERBEEK, AND A. P.
DOBSON. 2001. Ecology of wildlife diseases. Oxford University Press, Oxford, 197 pp.

10
JONES, K. E., N. G. PATEL, M. A. LEVY, A. STOREYGARD, D. BALK, J. L. GITTLEMAN,
AND P. DASZAK. 2008. Global trends in emerging infectious diseases. Nature 451:990-993.
JENKINS, S. R. AND W. G. WINKLER. 1987. Descriptive epidemiology from an epizoonotic
of raccoon rabies in the middle Atlantic States, 1982-82. American Journal of Epidemiology
126(3):429-437.
KOMAR, N. 2001. West Nile virus surveillance using sentinel birds. Annuals New York
Academy of Science 951:58-73.
LAU, S. K. P., P. C. Y. WOO, K. S. M. LI, Y. HUANG, H. W. TSOI, B. H. L. WONG, S. S. Y.
WONG, S. Y. LEUNG, K. H. CHAN, AND K. Y. YUE. 2005. Severe acute respiratory
syndrome coronavirus-like virus in Chinese horseshoe bats. Proceedings of the National
Academy of Science USA 102(39):14040-14045.
LEIGHTON, F. A. AND T. KUIKEN. 2001. Leptospirosis In Infectious diseases of wild
mammals, E. S. Williams and I. K. Barker (eds). Iowa State University Press, Ames, Iowa, pp.
498-502.
LI, W., Z. SHI, M. UY, W. RNE, C. SMITH, J. H. EPSTEIN, H. WANG, G. CRAMERI, Z. HU,
H. ZHANG, J. ZHANG, J. MCEACHERN, H. FIELD, P. DASZAK, B. T. EATON, S.
ZHANG, AND L. F. WANG. 2005. Bats are natural reservoirs of SARS-like Coronaviruses.
Science 310:676-679.
MCCALLUM, H. 2008. Landscape structure, disturbance, and disease dynamics. In Infectious
disease ecology: The effects of ecosystems on disease and of disease on ecosystems, R. S.
Ostfeld, F. Kessing, and V. T. Eviner (eds). Princeton University Press, Princeton, New Jersey,
pp. 100-122.
11
MCLEAN, R. G. 2008. The introduction and emergence of wildlife diseases in North America.
In Wildlife science: Linking ecological theory and management implications, T. E. Fulbright
and D. G Hewitt (eds). CRC Press, Boca Raton, Florida, pp. 261-278.
NATIONAL RESEARCH COUNCIL. 1991. Animals as sentinels of environmental health
hazards. National Academy Press, Washington D. C., 160 pp.
NEWMAN, S. H., J. H. EPSTEIN, AND L. M. SCHLOEGEL. 2005. The nature of emerging
zoonotic diseases: Ecology, prediction, and prevention. Medical Laboratory Observer
37(7):10-19.
POWER, A. G. AND C. E. MITCHELL. 2004. Pathogen spillover in disease epidemics.
American Naturalist 164:S79-S89.
PRANGE, S., S. D. GEHRT, AND E. P. WIGGERS. 2003. Demographic factors contributing
to high raccoon densities in urban landscapes. Journal of Wildlife Management 67(2)324-333.
REED, K. D, J. W. MELSKI, M. B. GRAHAM, R. L. REGNERY, M. J. SOTIR, M. V.
WEGNER, J. J. KAZMIERCZAK, E. J. STRATMAN, Y. LI, J. A. FAIRLEY, G. R. SWAIN, V.
A. OLSON, E. K, SARGENT, S. C. KEHL, M. A. FRACE, R. KLINE, S. L. FOLDY, J. P.
DAVIS, AND I. K. DAMON. 2004. The detection of monkeypox in humans in the western
hemisphere. New England Journal of Medicine 350:342-350.
SCHMITT, S. M., S. D. FITZGERALD, T. M. COOLEY, C. S. BRUNING-FANN, L.
SULLIVAN, D. BERRY, T. CARLSON, R. B. MINNIS, J. B. PAYEUR, AND J. SIKARSKIE.
1997. Bovine tuberculosis in free-ranging white-tailed deer from Michigan. Journal of Wildlife
Diseases 33:749-758.

12
SLINGENBERGH, J., M. GILBERT, K. DE BALOGH, AND W. WINT. 2004. Ecological
sources of zoonotic diseases. Scientific and Technical Review International Office of Epizootics
23(2):467-484.
THOMPSON, C., A. SPIELMAN, AND P. J. KRAUSE. 2001. Coinfecting deer-associated
zoonoses: Lyme disease, babesiosis, and ehrlichiosis. Clinical Infectious Diseases 33(5):676-
685.
TRAINER, D. O. 1973. Wildlife as monitors of disease. American Journal of Public Health
63(3):201-203.
U. S. CENSUS BUREAU. 2000. Annual estimates of the population of metropolitan and
micropolitan statistical areas.
VERCAUTEREN, K. C., T. C. ATWOOD, T. J. DELIBERTO, H. J. SMITH, J. S.
STEVENSON, B. V. TOMSEN, T. GIDLEWSKI, AND J. PAYEUR. 2008. Sentinel-based
surveillance of coyotes to detect bovine tuberculosis, Michigan. Emerging Infectious Diseases
14(12):1862-1869.
WINKLER, W. G. 1975. Fox rabies. In The natural history of rabies, G. M. Baer (ed).
Academic Press, New York, pp. 3-22.
WISE, J. K., B. L. HEATHCOTT, AND M. L. GONZALEZ. 2002. Results of the AVMA
survey on companion animal ownership in the US pet-owning households. Journal of the
American Veterinary Medical Association 221(11):1572-1573.
WITHAM, J. H. AND J. M. JONES. 1990. White-tailed deer abundance on metropolitan forest
preserves during winter in northeastern Illinois. Wildlife Society Bulletin 18:13-16.
WOOLHOUSE, M. E. J. AND S. GOWTAGE-SEQUERIA. 2005. Host range and emerging
and reemerging pathogens. Emerging Infectious Diseases 11(12):1842-1847.

13
WORLD TOURISM ORGANIZATION. 2009. Tourism highlights 2009. 12 pp.
YABSLEY, M. J., V. G. DUGAN, D. E. STALLKNECHT, S. E. LITTLE, J. M. LOCKHART,
J. E. DAWSON, AND W. R. DAVIDSON. 2003. Evaluation of a Prototype Ehrlichia
chaffeensis surveillance system using white-tailed deer (Odocoileus virginianus) as natural
sentinels. Vector-Borne and Zoonotic Diseases 3(4):195-207.

14
GENERAL MATERIALS AND METHODS
Study area
The study areas encompassed >27,499 ha (11% land cover) of forest preserves in
suburban Chicago, Illinois (41o85' N, 87
o65' W) owned and managed by the Forest Preserve
District of Cook County (FPDCC). The forest preserves include over 200 picnic areas, 161 km
of bike trails, lakes, rivers, and 323 km of multiuse trails. The study included 11 managed tracts
within the FPDCC including Bemis (437 ha), Black Partridge (177 ha), Busse (1508 ha), Camp
Sagawau (24 ha), Crab Tree (668 ha), Des Plaines (DP; 1168 ha), Palos (1178 ha), Popular Creek
(1204 ha), Somme (201 ha), Swallow Cliff (959 ha), and Zander-Jurgenson (815 ha) preserves
(C. Anchor, pers. comm.). Land cover in the region varied including urbanization, urban
grassland, forested woodland, cropland, rural grassland, wetland, and open water.
Witham and Jones (1987) estimated deer densities in Busse and DP exceeded 50
deer/km2
in 1985-86. Aerial surveys in Cook County conducted from 1985-99 suggested
minimum deer estimates of >23 deer/km2 (FPDCC, unpublished data). Etter et al. (2000)
estimated aerial surveys only detect approximately 2/3 of the deer within suburban forest
preserves; therefore deer densities were likely greater. Aerial surveys suggest populations were
at high-density indicating a population at carrying capacity (Etter et al. 2000; Piccolo et al.,
2010).
Regional climate is temperate, consisting of warm, humid summers and cold winters.
The average high daily temperature is 28 oC during the midsummer months and -10.4
oC as the
low in January. Mean annual rainfall is 84.9 cm and annual snowfall is 97.3 cm (Mapes, 1979).
Deer capture and culling
Deer were captured with drop-nets (Wildlife Materials Inc., Carbondale, Illinois, USA;

15
Ramsey, 1968) or remote dart gun (Pneu-Dart Inc., Williamsport, Pennsylvania, USA; Kilpatrick
et al., 1997) from December to March (1995-1998) from the two primary study sites DP and
Palos (Fig. 1). Netted deer were anesthetized with xylazine hydrochloride (2.0 mg/kg
Cervazine®, Wildlife Pharmaceuticals Inc., Fort Collins, Colorado, USA) and darted deer with
tiletamine/zolazepam hydrochloride (4.4 mg/kg Telazol®, Fort Dodge Laboratories, Fort Dodge,
Iowa, USA) and 2.0 mg/kg xylazine hydrochloride. The xylazine hydrochloride was reversed
with yohimbine hydrochloride (0.25 mg/kg Antagonil®, Wildlife Pharmaceuticals Inc., Fort
Collins, Colorado, USA; A. DeNicola, White Buffalo Inc., pers. comm.). Additionally, deer
were culled from all study sites (Fig. 1) by state certified sharp shooters as part of a management
program. Deer were removed strategically from approved bait sites and throughout the forest
preserves from accessible trails. Culling sites were selected based upon deer use, sharp shooter
accessibility, and human safety. All sites were approved by the Illinois Department of Natural
Resources (IDNR). Deer were removed from bait sites and opportunistically from trails when
traveling between sites. To maximize population reduction efforts, females were preferred
during culling.
All live-captured deer (tagged and radio-collared) were marked with two numbered
plastic ear tags for visual identification and with metal ear tags with FPDCC return information.
Selected female deer were fitted with radio-collars equipped with an 8-hour, time delayed,
mortality switch (Advanced Telemetry Systems, Isanti, Minnesota, USA; Telonics, Mesa,
Arizona, USA; Etter et al., 2002) to examine female social behavior and population dynamics.
Physiological information (age and sex) was recorded from all live-captured and culled deer.
Locations were recorded on topographic images and later transferred to ArcView® 3.2
(Environmental Systems Research Institute Inc., Redlands, California, USA; ESRI, 1996)

16
geographic information system (GIS). Deer age was determined for live-captured deer by tooth
replacement and wear as fawn (<1 year old), yearling (1-2 years old), or adult (>2 years old;
Severinghaus, 1949). For culled deer, age was determined by cementum annuli (Matson’s
Laboratory, Milltown, Montana, USA; Gilbert, 1966). Blood was collected (<45 cc) from
carcasses of culled deer. Blood was collected from the jugular vein (25-40 cc) from
live-captured deer. Blood samples were centrifuged to separate sera from whole blood and
stored at -60oC.
Radio-telemetry
All radio-collared females were radio-tracked to examine home ranges and movement
patterns. In addition, radio-telemetry data allowed for inferences to culled deer about home
range size and habitats use. To describe home range characteristics for radio-tracked deer,
radio-locations were attempted 1-3 times per week using two truck mounted, 4-element yagi
antennas, aligned in a null configuration (Nixon et al., 1991). All telemetry data were entered
into in a spreadsheet and transferred in Locate II®
software 1.3 (Pacer, Truro, Nova Scotia,
Canada; Nams, 1990). To determine deer locations, the maximum likelihood estimator was used
from >3 radio-bearings collected within a 20 minute interval. The 90th
percentile of deer
location error ellipses (11.5 ha) was used as the upper limit for acceptable error and locations
with larger error were deleted (Etter et al., 2002). Ninety-five and 50% minimum convex
polygon (MCP) home ranges were generated in software CALHOME® (Fortran 5.0, U. S. Forest
Service, Pacific Southwest Research Station, California, USA; Kie et al., 1994).
Serology
For detection of Jamestown Canyon (JC) and LaCrosse (LAC) encephalitis zoonotic
pathogen antibodies, sera were initially tested by CAL group virus IgG captured enzyme linked

17
immunosorbent assay (ELISA) (Grimstad et al., 1984; Godsey, 1995-1996 samples, Centers for
Disease Control (CDC), Fort Collins, Colorado, USA; Grimstad, 1997-1999 samples, University
of Notre Dame, Notre Dame, Indiana, USA). Samples were determined as positive for CAL
group antibodies (JC and LAC) when the mean absorbance for the three test wells was >2 times
the mean of the negative control. Samples were retested if positive for both CAL groups using
plaque-reduction neutralization assays (PRNA) with serum dilutions of 1:20-1:160 (Pantuwatana
et al., 1972; Grimstad et al., 1984). The PRNA titers were compared to differentiate closely
related JC and LAC viruses. The higher antibody titer was used to indicate virus specificity
when >2 fold difference in antibody titer was detected against closely related viruses (Boromisa
and Grimstad, 1987; Grimstad et al., 1987; Neitzel and Grimstad, 1991; Osorio et al., 1996).
Samples were classified as non-determined when testing was <2 fold titer difference for a
positive result. All serological testing for deer was completed by laboratories with the highest
gold standard to reduce false positive and false negative results.
All culled venison was processed and donated to local food depositories (Good Samaritan
Act, House Bill 3412, 1991-1992). The University of Illinois Laboratory Animal Care Advisory
Committee reviewed and approved all methods (Protocol V5R246 and V5R246/8340). Deer
were collected and captured under Illinois Department of Natural Resources (IDNR) and FPDCC
ecological study permits.

18
FIGURE 1. Map of Cook County Forest Preserves in Chicago, Illinois, USA, 1995-99. Deer
samples were collected from primary study sites Des Plaines and Palos. Additional culled
samples were collected from 1=Crab Tree, 2= Poplar Creek, 3=Busse, 4=Somme, 5= Bemis,
6= Black Partridge, 7=Camp Sagawau, 8=Swallow Cliff, and 9=Zander-Jurgenson study sites.
5
4
7
8
9
3
1
Chicago
Cook County
Des Plaines
Palos
2
6
0 2 4
km
Cook County Land Cover Legend
Agriculture
Forest
Savanna-Grass
Urban
Water
Wetland

19
LITERATURE CITED
BOROMISA, R. D. AND P. R. GRIMSTAD. 1987. Seroconversion rates to Jamestown Canyon
virus among six populations of white-tailed deer (Odocoileus virginianus) in Indiana. Journal of
Wildlife Diseases 23(1):23-33.
ESRI (ENVIRONMENTAL SYSTEMS RESEARCH INSTITUTE). 1996. ArcView® GIS: The
geographic information system for everyone. Redlands, California.
ETTER, D. R., K. M. HOLLIS, T. R. VAN DEELEN, D. R. LUDWIG, J. E. CHELSVIG, C. L.
ANCHOR, AND R. E. WARNER. 2002. Survival and movements of white-tailed deer in
suburban Chicago, Illinois. Journal of Wildlife Management 66(2):500-510.
_____, T. R. VAN DEELEN, D. R. LUDWIG, S. N. KOBEL, AND R. E. WARNER. 2000.
Management of white-tailed deer in Chicago, Illinois forest preserves. In Proceedings 19th
Vertebrate Pest Conference, T. P. Salmon and C. Crabb (eds). University of California, Davis,
California, pp. 190-196.
GILBERT, F. F. 1966. Aging white-tailed deer by annuli in the cementum of the first incisor.
Journal of Wildlife Management 30(1):200-202.
GRIMSTAD, P. R., C. L. BARRETT., R. L. HUMPHREY, AND M. J. SINSKO. 1984.
Serological evidence for wide-spread infection with LaCrosse and St. Louis encephalitis viruses
in the Indiana human population. American Journal of Epidemiology 119:913-930.
GRIMSTAD, P. R., D. G. WILLIAMS, AND S. M. SCHMITT. 1987. Infection of white-tailed
deer (Odocoileus virginianus) in Michigan with Jamestown Canyon virus (California Serogroup)
and the importance of maternal antibody viral maintenance. Journal of Wildlife Diseases
23(1):12-22.

20
KIE, J. G., J. A. BALDWIN, AND C. J. EVANS. 1994. CALHOME®: Home range analysis
program. Electronic user’s manual. United States Forest Service, Fresno, California.
KILPATRICK H. J., S. M. SPOHR, AND A. J. DENICOLA. 1997. Darting urban deer:
Techniques and technology. Wildlife Society Bulletin 25(2):542-546.
MAPES, D. R. 1979. Soil survey of DuPage and part of Cook counties, Illinois. Illinois
Agricultural Experiment Station Report 108, Urbana, Illinois.
NAMS, V. O. 1990. Locate II®
user’s guide. Pacer, Truro, Nova Scotia, 82 pp.
NEITZEL, D. F. AND P. R. GRIMSTAD. 1991. Serological evidence of California group and
Cache Valley virus infection in Minnesota white-tailed deer. Journal of Wildlife Diseases
27(2):230-237.
NIXON, C. M., L. P. HANSEN, P. A. BREWER, AND J. E. CHELSVIG. 1991. Ecology of
white-tailed deer in an intensively farmed region of Illinois. Wildlife Monographs 118, 77 pp.
OSORIO, J. E., M. S. GODSEY, G. R., DEFOLIART, AND T. M. YUILL. 1996. LaCrosse
viremias in white-tailed deer and chipmunks exposed by injection or mosquito bite. American
Journal of Tropical Medicine and Hygiene 54(4):338-342.
PANTUWATANA, S., W. H. THOMPSON, D. M. WATTS, AND R. P. HANSON. 1972.
Experimental infection of chipmunks and squirrels with LaCrosse and Trivittatus viruses and
biological transmission of LaCrosse virus by Aedes triseriatus. American Journal of Tropical
Medicine and Hygiene 21(4):476-481.
PICCOLO, B.P., T. R. VANDEELEN, K. HOLLIS-ETTER, D. R. ETTER, R. E. WARNER,
AND C. ANCHOR. 2010. Behavior and survival of white-tailed deer neonates in 2 suburban
forest preserves. Canadian Journal of Zoology 88:487-495.
RAMSEY, C. W. 1968. A drop-net deer trap. Journal of Wildlife Management 32(1):187-190.

21
SEVERINGHAUS, C. A. 1949. Tooth development and wear as criteria of age in white-tailed
deer. Journal of Wildlife Management 13:195-216.
WITHAM, J. H. AND J. M. JONES. 1987. Chicago Urban Deer Study. Illinois Natural History
Survey Report No. 265, Champaign, Illinois.

22
CHAPTER 1
SEROLOGICAL SURVEY OF SUBURBAN DEER
ABSTRACT: The presence and abundance of vertebrates influences the circulation of zoonotic
diseases. White-tailed deer (Odocoileus virginianus) are widely distributed in North America
and deer densities are frequently high in unhunted areas, including most major metropolitan
regions. This study investigated the seroprevalence of four disease agents from live-captured
and culled deer sampled in two suburban forest preserves around Chicago, Illinois from 1995-99.
Seroprevalence for Toxoplasma gondii was 55.9% (n=443), Leptospira spp. 16.2% (n=444),
Jamestown Canyon (JC) virus 38.1% (n=404), and LaCrosse (LAC) virus 6.7% (n=404).
Prevalence was higher for adult deer for all pathogens sampled except Leptospira spp.
Prevalence was less likely in males for JC virus. A higher prevalence for T. gondii and JC virus
was detected at Des Plaines (DP) and prevalence for Leptospira spp. was less likely at DP.
Differences in year the sample was collected were present for T. gondii, Leptospira spp., and JC
virus. Variation in month the samples were collected was evident for T. gondii, Leptospira spp.,
and LAC virus. Multivariate logistic regression (LR) screened main effects variables (age, sex,
site, year, and month) by backward stepwise elimination (p<0.20). The final LR model for
T. gondii contained all main effects variables. Leptospira spp. and JC viral models both
contained age, site, and year, while the final LAC viral LR model contained age, sex, and month.
Deer are an appropriate wildlife species for this investigation because they inhabit the same
environment as disease vectors and humans who recreate in suburban parks. Chicago area deer
are indicators for zoonoses as evidenced by the prevalence rates in this study. This information
will serve as baseline data for prevalence of four pathogens providing information to public
health officials.

23
INTRODUCTION
Wild mammals can serve as hosts, amplifiers, or reservoirs for various zoonotic diseases
(Day et al., 1996). Serological surveys of white-tailed deer (Odocoileus virginianus) have
examined the presence of antibodies against many zoonotic agents (Thomas and Trainer, 1970;
Hoff et al., 1973; Adrian and Keiss, 1977; Acha and Szyfres, 1994; Dawson et al., 1994). Deer
populations can be pathogenic hosts, reservoirs, or amplifiers and have been considered a link in
zoonotic disease emergence (Daszak et al., 2001). Open deer populations have direct contact
with the environment and are considered a sentinel pathogen species because of their wide
distribution, abundance, and sedentary behavior (Trainer and Hanson, 1969).
Toxoplasmosis is a zoonotic infection caused by the protozoan parasite Toxoplasma
gondii. It is an obligate intracellular protozoan parasite that may cause abortion in domestic
animals and wildlife. The oocyst readily infects humans, including approximately 30% of the
population depending on age and environment, but clinical illness is relatively uncommon.
Those at risk of developing clinical illness include pregnant women, as the parasite can pose a
serious threat to the unborn child and individuals who are immunosuppressed. The two most
likely sources of human infection are ingestion of raw or rare cooked meat containing live
T. gondii tissue cysts from intermediate hosts like deer or exposure to oocysts derived from cat
(Felis catus) feces found in gardens, litter boxes, and children's sand pits (Dubey, 2010).
Leptospirosis is a contagious disease caused by the bacterial spirochete Leptospira. The
organism is transmitted through contaminated urine from animals to humans in water, food, or
soil. The common route of entry in humans is oral (food and/or water) but may also occur
through the skin (Acha and Szyfres, 1994; Benenson, 1995). Many different animals serve as a
host for the bacterium and may be asymptomatic or sick. Leptospira organisms have been found
24
in cattle, pigs, horses, dogs, rodents, and wild animals.
Arboviruses (arthropod-borne viruses), like Jamestown Canyon (JC) and LaCrosse
(LAC) viral encephalitis, are spread by Aedes mosquitoes in the eastern United States (Grimstad,
1989). Jamestown Canyon virus persists in cycles of infection among wild ungulates, especially
deer as the primary reservoir host (Andreadis et al., 2008). Jamestown Canyon virus is
maintained in a variety of different ecological habitats where ungulates are present and in several
mosquito spp. with a wide range of habitats and geographical regions. Grimstad et al. (1984)
reported humans’ seropositive for JC in Michigan. LaCrosse virus circulates between small
mammalian hosts and specifically tree-hole mosquitoes, A. triseriatus. The mosquito breeds in
forested areas or containers conducive for reproduction. Deer are amplifiers for LAC viral
transmission once it has been established (Clark et al., 1983; Osorio et al., 1996). LaCrosse virus
has been reported to produce central nervous system infections in humans (Grimstad et al. 1984).
Long-term monitoring for zoonoses can indicate transmission risks for humans, endemic
patterns in a population, and/or disease presence. Deer seroprevalence can serve to inform
resource managers and public health officials about the risk of zoonoses in a targeted
surveillance area. I investigated seroprevalence patterns for T. gondii, Leptospira spp., JC virus,
and LAC virus in white-tailed deer (live-captured and culled) in suburban Des Plaines (DP) and
Palos forest preserves in Cook County, Illinois from 1995-99. This information will serve as
baseline data for prevalence of four pathogens providing information to public health officials.
MATERIALS AND METHODS
General materials and methods are specified in pages 14-21.
Samples were collected from a more extensive network of forest preserves throughout the
Chicago region. However, DP and Palos were the preferred sites for this chapter analysis due to

25
samples from live-captured deer and large samples sizes from culled deer. Additional samples
and sites collected by pathogen are included in Appendix A-L.
Samples were tested for T. gondii by Dr. J. P. Dubey at the United States Department of
Agricultural (USDA) Research Center in Beltsville, Maryland, USA. Serum agglutination tests
for T. gondii were examined at dilutions of 1:25, 1:50, 1:500, and >500 (Dubey and Desmonts,
1987). Samples were classified as positive if the titer was >1:25.
Samples for six L. interrogans serovars (bratislava, canicola, grippotyphosa, hardjo,
icterohaemorrhagiae, and pomona) were analyzed by the Minnesota Veterinary Diagnostic
Laboratory at the University of Minnesota, St. Paul, Minnesota, USA. Microscopic serum
agglutination (MAT) to six common leptospire strains were tested and a four-fold rise in
antibody titers determined diagnostic positive animals (Cole et al, 1979; 1983). Samples were
tested at dilutions of 1:100, 1:200, 1:400, and 1:800. Samples were classified as positive if the
titer was >1:100.
Univariate analyses were used to detect differences in prevalence by serological outcome
for age, sex, site, and collection period (year, month; Crosstabs in SPSS® 17.0, Chicago, Illinois,
USA; Rothman, 1986). Pearson chi-square statistics (p<0.05) and Cochran-Mantel-Haenszel
(CMH) odds ratios (OR) were used to examine significant relationships (Fleiss, 1981).
Biological parameters were stratified (controlled) by age and sex. Multivariate logistic
regression (LR) was used to evaluate deer parameters for each serological outcome (Nash et al.,
1995). The initial models included age, sex, site, and collection period (year, month). The
variables were screened by backward stepwise elimination to remove main effect variables
(p<0.20) which did not significantly affect the likelihood statistics or the magnitude of remaining
variables (Hosmer and Lemeshow, 1989; Kleinbaum, 1994). Hosmer and Lemeshow goodness

26
of fit (GOF) statistic was used to determine model fit (Hosmer and Lemeshow, 1989).
Biologically relevant interactions of main effects variables were also evaluated. Receiver
operating characteristic (ROC) curves were used to plot the sensitivity values (true positive
fraction) versus the equivalent 1-specificity values (false positive fraction) for final logistic
regression model variables (Hanley and McNeil, 1982). Area under the curve (AUC) was used
as a measure of model accuracy and is evaluated from 0-1 with 1 indicating perfect
discrimination (Viña et al., 2010).
RESULTS
Overall seroprevalence for T. gondii was 55.9% (n=443), Leptospira spp. 16.2% (n=444),
Jamestown Canyon (JC) virus 38.1% (n=404), and LaCrosse (LAC) virus 6.7% (n=404). Field
data and/or sera analyses were incomplete for some deer and could not be included for all
seroprevalence analyses. The R2 and AUC values indicate minor variation in the models.
However, the results and discussion also consider the biological parameters for data typically
contained in open populations of large game species and noisy ecological systems.
Prevalence for T. gondii increased with age (χ2=40.86, 2 df, p<0.001; Table 1). There
was a higher prevalence by site for DP (OR=2.97, CI=2.02-4.39, χ2=30.97, p<0.001).
Seroprevalence differed by year (χ2=11.26, 3 df, p=0.01) favoring 1996-97 and 1997-98 and
month (χ2=11.52, 3 df, p=0.009) being higher in December and January. The final LR model
included age (beta= -0.830, SE=0.134), sex (beta=0.455, SE=0.238), site (beta=0.70, SE=0.014),
year (beta=-0.201, SE=0.105), and month (beta=-0.080, SE=0.037; R2=0.214, GOF=0.544, 5df,
p<0.001). Area under the curve values for the final LR model were >0.50 except study site=0.37
(Table 2). Interaction terms did not contribute any biological significance beyond the final LR
model.

27
Leptospira spp. seroprevalence varied by site (OR=0.59, CI=0.35-0.98, χ2=4.20, p=0.04;
Table 3) and was less likely in DP. Seroprevalence also differed by year (χ 2
=47.73, 3 df,
p<0.001) being higher in 1998-99 and month (χ2=7.84, 3 df, p=0.05) was higher in March. The
most prevalent serovar found in deer from the two study sites was L. interrogans grippotyphosa
(14.6%). The final LR model included age (beta= -0.448, SE=0.171), site (beta=-0.041,
SE=0.018), and year (beta=-0.791, SE=0.147; R2=0.152, GOF=0.037, 3 df, p<0.001). Area
under the curve values for the final LR model were >0.50 (Table 2). Interactions of main effects
variables did not contribute to any significant multivariate models.
Prevalence for JC virus was higher for adult deer (χ2=75.47, 2 df, p<0.001) and less likely
for males (OR=0.56, CI=0.36-0.86, χ2=6.59, p=0.01; Table 4). There was also a difference by
site favoring DP (OR=1.76, CI=1.17-2.65, χ2=7.47, p=0.006). Seroprevalence varied among
years (χ2=28.17, 3 df, p<0.001) and was higher in 1996-97 and 1997-98. The final LR model
included age (beta= -1.237, SE=0.162), site (beta=0.029, SE=0.015), and year (beta=-0.150,
SE=0.116; R2=0.258, GOF=0.001, 3 df, p<0.001). Area under the curve values for the final LR
model were >0.50 except for study site=0.43 (Table 2). None of the interaction terms were
significant.
LAC viral prevalence increased by age (χ2=8.52, 2 df, p=0.01; Table 5) and by month
(χ2=9.16, 3 df, p=0.03) with higher prevalence detected in January and February. The final LR
model included age (beta= -0.724, SE=0.319), sex (beta=-0.678, SE=0.522), and month
(beta=0.253, SE=0.148; R2=0.094, GOF=0.202, 3 df, p=0.002). Area under the curve values for
the final LR model were >0.50 except for month=0.35 (Table 2). There were no significant
interaction terms.

28
DISCUSSION
The advantage of any wildlife zoonoses monitoring program is early detection of new
and emerging diseases, some with serious disease and economic implications. Wild animals, like
deer, inhabit natural environments where they have direct contact with vectors and may be
exposed to zoonoses. I took advantage of an existing deer culling program and samples from
collared deer to investigate prevalence for zoonoses in a suburban environment. Deer were an
appropriate wildlife species for this investigation because they inhabit the same environments as
disease vectors and humans who recreate in suburban parks and forest preserves. Chicago area
deer are indicators for zoonotic agents as evidenced by prevalence rates for T. gondii, Leptopira
spp., JC virus, and LAC virus in this study.
White-tailed deer are herbivores and may become exposed and/or infected with
toxoplasmosis by ingesting plants, soil, or contaminated water containing the oocysts
(Humphreys et al., 1995). Toxoplasma oocysts have been recovered from oak-hickory woodland
habitats in Missouri and prevalence is higher in warm, humid climates (Acha and Szyfres, 1994;
Smith and Frenkel, 1995). Smith and Frenkel (1995) reported 11% (n=117) of the herbivores
were positive for the parasite from Missouri and Kansas during a mammal study. The
prevalence for T. gondii was higher (60.2%) in hunter killed deer in 1991 in Pennsylvania
compared to this study (55.9%; Humphreys et al., 1995).
The trend of increasing T. gondii with age (Table 1) is expected due to continual
exposure of oocysts by long-lived animals, like suburban deer. Increased prevalence in adult
deer indicates pathogen presence, long-term, and/or repeated exposures. It is likely that
increased prevalence in yearlings is due to new annual exposures to the oocyte. Prevalence in
black-tailed deer (Odecoileus hemionus) from northern California ranged from 11% in fawns,

29
40% in yearlings, and 30.6% in adults (Franti et al., 1975). Ferreira et al. (1997) found the
prevalence for the organism in marsh (Blastocerus dichotomus) and pampas (Ozotocerus
bezoarticus) deer was 13% in fawns, 32% in yearlings, and 27% in adults. The results from this
study indicate a higher prevalence in all age groups for suburban deer compared to elsewhere,
likely because of high domestic cat populations, increased deer densities, and persistence of the
parasite over time. Felines (i.e., domestic and feral cats) are the definitive host while actively
shedding the parasite. In Chicago, domestic cat populations are estimated at 1.5 million or more
(Wise et al., 2002). Feral cat populations also pose a potential health risk for infecting people
with T. gondii (Jessup, 2004). In a study from California, outdoor fecal deposition by free-
roaming domestic cats was estimated at 69.31 metric tons per year and an additional 26.76
metric tons per year by feral cats (Dabritz et al., 2006). Many feral cats were observed in the
forests preserves during this study (C. Anchor, J. Chelsvig, and D. Etter, pers. comm.). The
environmental contamination from cat feces is a concern for human health (Jessup, 2004).
Witham and Jones (1987) stated deer densities in Busse and DP forest preserves exceeded 50
deer/km2 or higher. Many other species of warm-blooded mammals (i.e., raccoons, Procyon
lotor; coyotes, Canis latrans) found in Chicago can also serve as intermediate hosts for the
ocysts. The parasites also have the ability to remain infective in water or moist soil while
surviving various environmental conditions, including heat, freezing, and humidity for up to 18
months (Frenkel et al., 1975). All these conditions contributed to the increased prevalence for
the parasite by age in suburban white-tailed deer.
Difference in prevalence by site (Table 1) may be due to differences in abundance of the
definitive host for toxoplasmosis, domestic or feral cats. Toxoplasmosis antibodies have been
found in more than 63% of non-domestic mammals in the presence of cats (Dubey et al, 1995).

30
The DP forest preserve is surrounded by residential homes and commercial development while
Palos has very little residential development directly adjacent to the preserve.
Hunter killed deer from Minnesota serologically examined for Toxoplasma did not reveal
any difference by year (Vanek et al., 1996). However, temporal trends (year and month) were
revealed in this study (Table 1) and can be used as indicators for oocyst exposure(s). Change in
prevalence among years will provide information relevant to increases or decreases in annual
parasitic presence. Annual variation in human serology for toxoplasmosis from Ontario, Canada
was not detected (Tizard et al., 1977) due to human’s constant exposure to domestic cats. Month
the sample was collected indicates that deer are more likely to have measureable positive titers in
early winter months rather than later (Table 1). Seasonal transmission (spring and summer) was
identified in skunks (Mephitis mephitis) from Canada by a predominance of high titer levels
collected from animals in April-September (Schowalter et al., 1980). Experimental exposures
for cattle and elk (Cervus canadensis) indicate measurable antibody levels within 28 days or less
(Beverley et al., 1977; Costa et al., 1977; Dubey et al., 1980). However, research on
experimental infection dynamics in white-tailed deer is limited.
The multivariate model for T. gondii also included sex. Differences in sex may be
attributed to differences in home range size between the sexes (Nixon et al., 1991). Female deer
from the Chicago region maintained smaller home ranges (Etter et al., 2002); therefore
increasing potential repeated exposures to foci in contaminated soil, vegetation, and water
sources. Additionally, sampling for deer (live-captured or culled) in this study favored females
due to population control and social behavior study goals.
Leptospires cannot survive in acidic urine, therefore herbivores and animals with alkaline
urine are more important carriers of the organism (Faine, 1994). Overall prevalence for

31
Leptospira spp. (Table 3) in deer from Chicago forest preserves (16.4%) was similar to
previously reported rates. The prevalence for antibody titers to leptospires in deer populations in
North America varies between 7-27% (Wedman and Driver, 1957; Ferris et al., 1961; Shotts and
Hayes, 1970; Fournier et al.1986). In this study, the common leptospire grippotyphosa was
identified in deer samples. Domestic dogs (Canis familiaris) and cats have predominant serovars
for canicola and icterohaemorrhagiae (Acha and Szyfres, 1994). Raccoons and skunks have
been documented as a natural reservoir for this common pathogenic leptospire and 48% (n=459)
of raccoons sampled in rural Illinois were positive for grippotyphosa (Shotts et al., 1975;
Mitchell et al., 1999). Raccoon densities are high in the Chicago region, documented as 8-12
times higher than rural areas (Gehrt, 2005). Skunks examined from Busse forest preserve in
Chicago, Illinois had low prevalence for L. interrogans (17%) and are unlikely to be a primary
reservoir for the spirochete, even though skunk populations are high (Gehrt et al., 2010). Other
rural deer studies have reported various serovars including canicola, grippotyphosa, hardjo, and
pomona (Clark et al., 1961; Goyal et al., 1992; New et al., 1993; Leighton and Kuiken, 2001).
Deer positive for this strain of leptospirosis is evidence for environmental exposure and
interspecies transmission within preserves commonly used by humans.
Site specific differences in prevalence for Leptospira spp. (Table 3) may be due in part to
differences in water sources between preserves. The risk of infection rates increases with high
rainfall and areas along river corridors and flood plains with poor drainage (Heath and Johnson,
1994). Raccoons frequent areas with standing water while hunting for aquatic foods and are
known to actively shed the bacterial spirochete in urine (Mitchell et al., 1999). Even though DP
encompasses a river corridor, Palos contained numerous lakes and wetlands without constant
free-flowing water. These standing water bodies were more likely to be contaminated with

32
grippotyphosa and create an environment where the organism may be more persistent and focal
for deer in Palos compared to DP. Additionally, deer from Palos selected for wetland habitats
more than DP when habitat use was compared to habitat availability (Hollis, 2011). Humans and
pets are at higher risk of infection from leptospirosis during warmer weather and after heavy
rains with standing water (Acha and Szyfres, 1994).
Prevalence by year and month (Table 3) for leptospires indicated sampling from deer in
the winter can be used to identify positive animals. Experimental infection of deer with
Leptospira indicated antibody seroconversion in blood samples in ~5 days with persistence for
~15 weeks, while deer may shed the organism in the urine for approximately 35 days post
exposure (Trainer et al., 1961; Reilly et al., 1962). High prevalence of seropositive animals has
been correlated to high mean annual temperatures in domestic cattle sampled during the summer,
fall, and winter (Miller et al., 1991). In domestic dogs infected with leptospirosis, a seasonal
distribution of late summer to fall and rainfall recordings three months prior to diagnosis were
significant in the disease model (Ward et al., 2002). Prevalence for leptospirosis increased
significantly from deer sampled in 1998-99. Further investigation of the data revealed 57% of
the deer sampled from Palos were seropositive while 27% were positive from DP. Both rates
from each site are higher than previously sampled years. I hypothesize that water supplies and/or
other reservoir species (i.e., raccoons) influenced these results, however, additional data would
need to be collected for analysis.
Age was included in the final logistic regression model. The older the animal is, the
more likely it has experienced past and/or a repeated exposure, resulting in positive deer. Deer
examined in Tennessee and Wisconsin also had a higher prevalence for adults than subadults
(Trainer and Hanson, 1960; New et al., 1993).

33
“California group” (CAL) viruses include pathogenic agents to man such as JC and LAC
(Grimstad, 1989; Acha and Szyfres, 1994). Transmission of these viruses often occurs in an
endemic pattern among animals within a limited geographic region (Neitzel and Grimstad,
1991). Etter et al. (2002) determined that survivorship was high and dispersal low for deer from
the Chicago region suggesting that populations within individual preserves were insular. High
densities of deer may create a potential for increased activity of the viruses by increasing
mosquito larval stages during the spring and late summer emergence and breeding cycles
(Matschke et al., 1984; Grimstad et al., 1987). Deer densities were high on both areas during this
study. Minimum winter aerial counts indicated 28.4-32.3 deer/km2 at DP and 14.9-27.5
deer/km2 at Palos (Forest Preserve District of Cook County, unpublished data); however, aerial
counts typically detect <35% of deer present (Ludwig, 1981; Beringer et al., 1998) suggesting
that densities were higher at both sites.
The prevalence rate for JC virus (38.1%) in this study falls between ranges previously
reported. Prevalence for JC was 21% in hunter killed deer from Connecticut, 91% in Minnesota,
and 56% in Wisconsin (Murphy, 1989; Neitzel and Grimstad, 1991; Zamparo et al., 1997).
Additional studies reported on prevalence rates for LAC in deer from Wisconsin (16%) and
Minnesota (6.9%; Issel et al., 1972b; Neitzel and Grimstad, 1991).
Jamestown Canyon and LAC viral seroprevalence was higher in adults (Tables 4 and 5).
It is likely deer are maintaining measurable titers from regular exposure(s) to infected Aedes spp.
for JC virus and A. triseriatus for LAC virus. Grimstad et al. (1987) reported 47% of adult does
in Michigan were positive for JC while fawns had lower prevalence for antibodies. Only 2% of
the adult deer sampled in Wisconsin in 1972 were positive for LAC (Issel et al., 1972b).
Prevalence was less likely to be found in males for JC virus (Table 4) and sex was

34
included in the final LR model for LAC virus (Table 5). Few male deer were collared and home
ranges for males were not determined in this study, but rural male deer home ranges significantly
exceed those of females (Nixon et al., 1991). Larger male home range sizes may reduce repeated
exposures to focal areas of infected mosquitoes over time. The LAC tree-hole mosquito vector
A. triseriatus does not venture far from a tree hole (<30m) and not above the forest canopy
(Thompson, 1984).
Site differences for JC and LAC (Table 4 and 5) indicated habitat use and/or availability
by deer are variable (Hollis, 2011), therefore creating variable habitats for vectors. Mosquito
population fluctuations, time of vector emergence, and deer density may influence prevalence by
site. Additionally, the DP site is along a riparian corridor which is known to fluctuate regularly
during storm events. During dryer periods the water recedes forming pools and ideal breeding
habitat for mosquitoes. Boromisa and Grimstad (1987) found differences in JC prevalence
between northern and southern deer populations in Indiana. The differences were attributed to
seasonal water pools and increased vector presence. Palos contains many lakes and wetlands,
however water levels, even with seasonal fluctuations, create common mosquito breeding areas.
The difference in seroprevalence for JC virus by year (Table 4) and LAC virus by month
(Table 5) confirms deer are antibody positive and can be tested in the winter for the pathogen.
Grimstad et al. (1987) reported annual seroconversion of deer for JC overlapped with the spring
emergence of aedine mosquitoes. Deer experimentally infected with JC had peak titers by day 5
and detectable antibody titers beyond 180 days (Issel et al., 1972a). Even human infections for
LAC peak seasonally from July to September in central Illinois, reflective of infected mosquito
activity (Kitron et al., 1997). Additionally, the role of LAC viral amplification by deer is not
clear, because viremic levels are very short and not sufficient for infecting mosquitoes.

35
However, seasonal breeding cycles by mosquitoes are triggered by blood meals and deer can
amplify LAC virus by providing this food resource (Clark et al., 1983; Osorio et al., 1996).
Sampling deer over time could indicate a variation in mosquito presence, vertebrate exposure,
and/or pathogen existence/cycles.
Deer are important monitors for examining zoonoses because they can be hosts,
ecological amplifiers, or reservoirs (Day et al., 1996) for pathogen existence and emergence.
Results from this study indicate deer are useful biomonitors while providing baseline information
for pathogen exposure. An advantage of using deer is that samples are easily obtained from
culled or hunted animals globally (Tataruch and Kierdorf, 2003). Deer as sentinels can provide
information for emerging pathogen detection and continual screening for changes in zoonoses
that are present. For example, fawn and/or yearling deer are indicators for immediate exposures
to disease agents while adult deer can provide information about long-term, repeated exposures.
Caution is advised when examining fawn exposures because of the exchange of maternal
antibodies, which may alter interpretation of samples. Issel (1974) reported JC maternal
antibodies in fawns from 8-23 weeks.
Stratifying a subsample from various deer populations in a region would provide an
effective biomonitoring tool for specific pathogens. For example, deer could be sampled from
specific locations for JC and LAC virus monitoring while considering specific mosquito species
and mosquito habitat(s). This surveillance technique would provide specific data for potential
disease reemergence relative to seasonal or annual variation in weather patterns and mosquito
abundance. As mosquito species continue to be introduced into the United States, so are
potential vectors. Furthermore, additional mosquito species (Anopheles, Culiseta, and
Ochlerotatus) are being identified as positive for JC virus and increasing possible viral

36
transmitters in specific geographic locations (Andreadis et al. 2008). However it remains to be
examined if all mosquito species use deer as a primary blood source and actively transmit JC
virus to humans. Grimstad et al. (1986) reported only 22% of encephalitis cases were of known
etiologies in 1986. If diagnostic laboratories continue to only use the LAC viral antigen, JC viral
infections will rarely be diagnosed and reported only as “California encephalitis.”
Penned deer studies replicating natural conditions are needed to examine pathogen
exposures, seroconversion rates, and detailed maternal antibody transmission for all organisms.
Additional research explaining the likelihood of encephalitis viral transmission directly between
deer and vector(s) should be conducted. However, environmental factors such as soil, water,
vectors, other wildlife species, and climate have potential to influence interpretation of pathogen
data and these studies should attempt to duplicate and/or control for true environmental
conditions.
Overlapping site specific human and pet disease cases may result in a more accurate risk
evaluation map for the Chicago region. A survey of residents from communities surrounding DP
and Palos forest preserves should be conducted to assist in risk assessment. The survey should
address human and pet population dynamics such as: number of pets, type of pet(s), feces
disposal location, if pets are allowed to roam freely, how often people and pets use the
recreational areas, and what activities are pursued. Additionally, research investigating the
relationship between accurately estimated wildlife densities and disease prevalence should be
explored. Additional studies should include extensive radio-telemetry work on suburban male
deer because of the differences in pathogen prevalence between the sexes revealed in this study
and a lack of male ecology information in published urban/suburban deer literature.
Information about zoonoses and parasites in white-tailed deer will become increasingly

37
important as deer populations continue to rise and habitat decreases (Gaydos, 2005). Emerging
and reemerging infectious diseases continue to increase worldwide and it is important to monitor
for zoonotic pathogens that persist in the environment before outbreaks become endemic.
Understanding the health status of wildlife populations provides an investigative tool and
surveillance for wildlife zoonoses. Using sentinel animals can be a cost-effective means to infer
prevalence in host or reservoir populations when direct estimation is difficult (VerCauteren et al,
2008). This is an essential component in managing free-ranging wildlife and protecting public
health in urban/suburban environments.

38
TABLE 1. Prevalence for Toxoplasma gondii in suburban white-tailed deer (n=443) from
Chicago, Illinois, USA, 1995-99.
_____________________________________________________________________
Variables Positive deer Prevalence (%)
_____________________________________________________________________
Age
Fawn 36 32.4
Yearling 42 49.4
Adult 168 68.0
Sex
Female 171 56.3
Male 75 54.0
Study site
Des Plaines 159 68.0
Palos 87 41.6
Year
1995-96 48 45.7
1996-97 76 61.8
1997-98 84 62.3
1998-99 38 47.0
Month
December 36 73.5
January 61 62.2
February 56 49.1
March 93 51.1
_____________________________________________________________________

39
Table 2. Area under the curve (AUC) values by pathogen for the final logistic regression models
for suburban white-tailed deer from Chicago, Illinois, USA, 1995-99.
_____________________________________________________________________
Pathogen Deer variables AUC value
_____________________________________________________________________
Toxoplasma gondii Age 0.66
Sex 0.51
Study site 0.37
Year 0.52
Month 0.50
Leptospira spp. Age 0.56
Study site 0.57
Year 0.69
Jamestown Canyon virus Age 0.72
Study site 0.43
Year 0.51
LaCrosse virus Age 0.65
Month 0.35
_____________________________________________________________________

40
TABLE 3. Prevalence for Leptospira spp. in suburban white-tailed deer (n=444) from Chicago,
Illinois, USA, 1995-99.
_____________________________________________________________________
Variables Positive deer Prevalence (%)
_____________________________________________________________________
Age
Fawn 13 11.7
Yearling 13 15.1
Adult 46 18.6
Sex
Female 51 15.2
Male 21 16.7
Study site
Des Plaines 30 12.8
Palos 42 20.0
Year
1995-96 9 8.5
1996-97 13 10.6
1997-98 16 12.0
1998-99 34 41.5
Month
December 3 6.1
January 14 14.3
February 16 14.0
March 39 21.3
_____________________________________________________________________

41
TABLE 4. Prevalence for Jamestown Canyon virus in suburban white-tailed deer (n=404) from
Chicago, Illinois, USA, 1995-99.
_____________________________________________________________________
Variables Positive deer Prevalence (%)
_____________________________________________________________________
Age
Fawn 5 4.5
Yearling 31 41.9
Adult 118 53.6
Sex
Female 114 42.5
Male 40 29.4
Study site
Des Plaines 93 44.5
Palos 61 31.3
Year
1995-96 17 20.5
1996-97 58 49.2
1997-98 62 47.3
1998-99 17 23.6
Month
December 18 45.0
January 32 35.6
February 35 36.1
March 69 39.0
_____________________________________________________________________

42
TABLE 5. Prevalence for LaCrosse virus in suburban white-tailed deer (n=404) from Chicago,
Illinois, USA, 1995-99.
_____________________________________________________________________
Variables Positive deer Prevalence (%)
_____________________________________________________________________
Age
Fawn 3 2.7
Yearling 2 2.7
Adult 22 10.0
Sex
Female 22 8.2
Male 5 3.7
Study site
Des Plaines 14 6.7
Palos 13 6.7
Year
1995-96 7 8.4
1996-97 3 2.5
1997-98 10 7.6
1998-99 7 9.7
Month
December 1 2.5
January 9 10.0
February 11 11.3
March 6 3.4
_____________________________________________________________________

43
LITERATURE CITED
ACHA, P. N. AND B. SZYFRES. 1994. California encephalitis. In Zoonoses and
communicable diseases common to man and animals, 2nd
Edition, Pan American Health
Organization, Washington, D.C., pp. 304-308.
ADRIAN, W. J. AND R. E. KEISS. 1977. Survey of Colorado’s wild ruminants for serologic
titers to brucellosis and leptospirosis. Journal of Wildlife Diseases 13:429-431.
ANDREADIS, T. G., J. F. ANDERSON, P. M. ARMSTRONG, AND A. J. MAIN. 2008.
Isolations of Jamestown Canyon virus (Bunyaviridae: Orthobunyavirus) from field-collected
mosquitoes (Diptera: Culicidae) in Connecticut, USA: A ten-year analysis, 1997-2006.
Vector-Borne and Zoonotic Diseases 8(2):175-188.
BENENSON, A. S. 1995. Control of communicable diseases manual. American Public Health
Association, Washington, D. C., pp. 267-270.
BERINGER, J., L. P. HANSEN, AND O. SEXTON. 1998. Detection rates of white-tailed deer
with a helicopter over snow. Wildlife Society Bulletin 26:24-28.
BEVERLEY, J. K. A., L. HENRY, D. HUNTER, AND M. E. BROWN. 1977. Experimental
toxoplasmosis in calves. Research Veterinary Science 23(33):33-37.
BOROMISA, R. D. AND P. R. GRIMSTAD. 1987. Seroconversion rates to Jamestown Canyon
virus among six populations of white-tailed deer (Odocoileus virginianus) in Indiana. Journal of
Wildlife Diseases 23(1):23-33.
CLARK, L. G., J. I. KRESSE, A. CARBREY, R. R. MARSHAK, AND C. J. HOLLISTER.
1961. Leptospirosis in cattle and wildlife on a Pennsylvania farm. Journal of the American
Veterinary Medical Association 139(8):889-891.

44
CLARK, G. C., H. L. PRETULA, C. W. LANGKOP, R. J. MARTIN, AND C. H. CALISHER.
1983. Persistence of LaCrosse virus (California encephalitis serogroup) in North-Central
Illinois. American Journal of Tropical Medicine and Hygiene 32:175-184.
COLE, J. R., H. C. ELLINGHAUSEN, AND H. L. RUBIN. 1979. Laboratory diagnosis of
leptospirosis of domestic animals. Proceedings of U. S. Animal Health Association 83:189-195.
COLE, J. R., C. R. SULZER, AND A. R. PURSEL. 1983. Improved microtechnique for the
leptospiral microscopic agglutination test. Applied Microbiology 25(6):976-980.
COSTA, A. J., F. G. ARAUJO, J. O. COSTA, J. D. LIMA, AND E. NASCIMENTO. 1977.
Experimental infection of bovines with oocyts of Toxoplasma gondii. Journal of Parasitology
63(2):212-218.
DABRITZ, H. A., E. R. ATWILL, I. A. GARDNER, M. A. MILLER, AND P. A. CONRAD.
2006. Outdoor fecal deposition by free-roaming cats and attitudes of cat owners and nonowners
toward stray pets, wildlife, and water pollution. Journal of the American Veterinary Medical
Association 229:74-81.
DASZAK, P., A. A. CUNNINGHAM, AND A. D. HYATT. 2001. Anthropogenic
environmental change and the emergence of infectious diseases in wildlife. ACTA Tropica
78:103-116.
DAWSON, J. E., J. E. CHILDS, K. L. BIGGIE, C. MOORE, D. STALLKNECHT, J.
SHADDOCK, J. BOUSEMAN, E. HOFMEISTER, AND J. G. OLSON. 1994. White-tailed
deer as a potential reservoir of Ehrlichia spp. Journal of Wildlife Diseases 30(2):162-168.
DAY, J. F., L. M. STARK, J. ZHANG, A. M. RAMSEY, AND T. W. SCOTT. 1996.
Antibodies to arthropod-borne encephalitis viruses in small mammals from southern Florida.
Journal of Wildlife Diseases 32(3):431-436.

45
DUBEY, J. P. 2010. Toxoplasmosis of animals and humans. 2nd
Edition, CRC Press, Boca
Raton, Florida.
DUBEY, J. P. AND G. DESMONTS. 1987. Serological responses of equids fed Toxoplasma
gondii oocyts. Equine Veterinary Journal 19:337-339.
_____, E. T. THORNE, AND S. P. SHARMA. 1980. Experimental toxoplasmosis in elk
(Cervus canadensis). American Journal of Veterinary Research 41(5):792-793.
_____, R. M. WEIGEL, A. M. SIEGEL, P. THULLIEZ, U. D. KITRON, M .A. MITCHEL, A.
MANNELLI, N. E. MATEUS-PINILLA, S. K. SHEN, O. C. H. KWOK., AND K. S. TODD.
1995. Sources and reservoirs of Toxoplasma gondii infection on 47 swine farms in Illinois.
Journal of Parasitology 81(5)723-729.
ETTER, D. R., K. M. HOLLIS, T. R. VAN DEELEN, D. R. LUDWIG, J. E. CHELSVIG, C. L.
ANCHOR, AND R. E. WARNER. 2002. Survival and movements of white-tailed deer in
suburban Chicago, Illinois. Journal of Wildlife Management 66(2):500-510.
FAINE, S. 1994. Leptospira and leptospirosis. CRC Press, Boca Raton, Florida, 353 pp.
FERREIRA, R. A., J. R. MINEO, J. M. DUARTE, D. A. O. SILVA, AND J. H. PATARROYO.
1997. Toxoplasmosis in naturally infected deer from Brazil. Journal of Wildlife Diseases
33(4):896-899.
FERRIS, D. H., L. E. HANSON, H. E. RHOADES, AND J. O. ALBERTS. 1961.
Bacteriological and serological investigations of brucellosis and leptospirosis in Illinois deer.
Journal of the American Veterinary Medical Association 139:892-896.
FLEISS, J. 1981. Statistical methods for rates and proportions. 2nd
Edition, John Wiley and
Sons, New York, New York.

46
FOURNIER, J. S., J. C. GORDON, AND C. R. DORN. 1986. Comparison of antibodies to
Leptospira in white-tailed deer (Odocoileus virginianus) and cattle in Ohio. Journal of Wildlife
Diseases 22:335-359.
FRANTI, C. E., G. E. CONNOLLY, H. P. RIEMANN, D. E. BEHYMER, R. RUPPANNER, C.
M. WILLADSEN, AND W. LONGHURST. 1975. A survey of Toxoplasma gondii antibodies
in deer and other wildlife on a sheep range. Journal of the American Veterinary Medical
Association 167:565-568.
FRENKEL, J. F., A. RUIZ, AND M. CHINCHILLA. 1975. Soil survival of Toxoplasma
oocysts in Kansas and Costa Rica. American Journal of Tropical Medicine and Hygiene
24(3):439-443.
GAYDOS, J. K. 2005. Diseases of white-tailed deer. In Wildlife diseases: Landscape
epidemiology, spatial distribution, and utilization of remote sensing technology, S. K. Majumdar,
J. E. Huffman, F. J. Brenner, and A. I. Panah (eds). The Pennsylvania Academy of Science,
Easton, Pennsylvania, pp. 259-271.
GEHRT, S. D. 2005. Urban raccoon study provides clues to improve rabies prevention. Ohio
State University Extension.
GEHRT, S. D., M. J. KINSEL, AND C. ANCHOR. 2010. Pathogen dynamics and morbidity of
striped skunks in the absence of rabies. Journal of Wildlife Diseases 46(2):335-347.
GOYAL, S. M., L. D. MECH, AND M. E. NELSON. 1992. Prevalence of antibody titers to
Leptospira spp. in Minnesota white-tailed deer. Journal of Wildlife Diseases 28(3):445-448.
GRIMSTAD, P. R. 1989. California group virus disease. In The arboviruses: Epidemiology
and ecology, T. P. Monath (ed). CRC Press, Boca Raton, Florida, pp. 99-136.

47
_____. C. L. BARRETT, R. L. HUMPHREY, AND M. J. SINSKO. 1984. Serological
evidence for wide-spread infection with LaCrosse and St. Louis encephalitis viruses in the
Indiana human population. American Journal of Epidemiology 119:913-930.
_____, C. H. CALISHER, R. N. HARROFF, AND B. B. WENTWORTH. 1986. Jamestown
Canyon virus (California Serogroup) is the etiological agent of widespread infection in Michigan
humans. American Society of Tropical Medicine and Hygiene 35(2):376-386.
_____, P. R., D. G. WILLIAMS, AND S. M. SCHMITT. 1987. Infection of white-tailed deer
(Odocoileus virginianus) in Michigan with Jamestown Canyon virus (California Serogroup) and
the importance of maternal antibody viral maintenance. Journal of Wildlife Diseases 23(1):12-
22.
HANLEY, J. A. AND B. J. MCNEIL. 1982. The meaning and use of the area under a receiver
operating characteristic (ROC) curve. Radiology 143:29–36.
HEATH, S. E. AND R. JOHNSON. 1994. Leptospirosis. Journal of the American Veterinary
Medical Association 205(11):1518-1523.
HOFF, G. L., C. J. ISSEL, D. O. TRAINER, AND S. H. RICHARDS. 1973. Arbovirus
serology in North Dakota mule and white-tailed deer. Journal of Wildlife Diseases
9(4):291-295.
HOLLIS, K. M. 2011. Epidemiology of suburban deer. Ph.D. Thesis. University of Illinois,
Urbana-Champaign.
HOSMER, D. W. AND S. LEMESHOW. 1989. Applied logistic regression. John Wiley and
Sons, New York, New York.

48
HUMPHREYS, J. G., R. L. STEWART, AND J. P. DUBEY. 1995. Prevalence of Toxoplasma
gondii antibodies in sera of hunter-killed white-tailed deer in Pennsylvania. American Journal of
Veterinary Research 56(2):172-173.
ISSEL, C. J. 1974. Maternal antibody to Jamestown Canyon virus in white-tailed deer. The
American Journal of Tropical Medicine and Hygiene 23(2):242-245.
_____, D. O. TRAINER, AND W. H. THOMPSON. 1972a. Experimental studies with
white-tailed deer and four California group arboviruses (LaCrosse, Trivittatus, Snowshoe Hare,
and Jamestown Canyon). American Journal of Tropical Medicine and Hygiene 21(6):979-984.
_____, _____, AND _____. 1972b. Serologic evidence of infections of white-tailed deer in
Wisconsin with three California group arboviruses (La Crosse,Trivittatus, and Jamestown
Canyon). American Journal of Tropical Medicine and Hygiene 21(6):985-988.
JESSUP, D. A. 2004. The welfare of feral cats and wildlife. Journal of the American Veterinary
Medical Association 225:1377-1383.
KITRON, U., J. MICHAEL, J. SWANSON, AND L. HARAMIS. 1997. Spatial analysis of the
distribution of LaCrosse encephalitis in Illinois, using a geographic information system and local
and global spatial statistics. American Journal of Tropical Medicine and Hygiene 57(4):469-475.
KLEINBAUM, D. G. 1994. Logistic regression: A self-learning text. Springer-Verlag, New
York, New York, 282 pp.
LEIGHTON, F. A. AND T. KUIKEN. 2001. Leptospirosis In Infectious diseases of wild
mammals, E. S. Williams and I. K. Barker (eds). Iowa State University Press, Ames, Iowa, pp.
498-502.
LUDWIG, J. 1981. Proportion of deer seen in aerial counts. Minnesota Wildlife Resources
Quarterly 41:11-19.

49
MATSCHKE, G. H., K. A. FAGERSTONE, R. F. HARLOW, F. A. HAYES, V. F. NETTLES,
W. PARKER, AND D. O. TRAINER. 1984. Population influences. In White-tailed deer
ecology and management, L. K. Halls (ed). Stackpole, Harrisburg, Pennsylvania, pp. 169-188.
MILLER, D. A., M. A. WILSON, AND G. W. BERAN. 1991. Survey to estimate prevalence of
Leptospira interrogans infection in mature cattle in the United States. American Journal of
Veterinary Research 52(1111):1761-1765.
MITCHELL, M. A., L. L. HUNGERFORD, C. NIXON, T. ESKER, J. SULLIVAN, R.
KOERKENMEIER, AND J. P. DUBEY. 1999. Serological survey for selected infectious
disease agents in raccoons from Illinois. Journal of Wildlife Diseases 35(2):347-355.
MURPHY, R. K. 1989. Serologic evidence of arboviral infections in white-tailed deer from
Central Wisconsin. Journal of Wildlife Diseases 25(2):300-301.
NASH, M. L., L. L. HUNGERFORD, T. G. NASH, AND G. M. ZINN. 1995. Epidemiology
and economics of clinical listeriosis in a sheep flock. Preventive Veterinary Medicine
24:147-156.
NEITZEL, D. F. AND P. R. GRIMSTAD. 1991. Serological evidence of California group and
cache valley virus infection in Minnesota white-tailed deer. Journal of Wildlife Diseases
27(2):230-237.
NEW, J. C., W. G. WATHEN, AND S. DLUTKOWSKI. 1993. Prevalence of Leptospira
antibodies in white-tailed deer, Cades Cove, Great Smoky Mountains National Park, Tennessee,
USA. Journal of Wildlife Diseases 29(4):561-567.
NIXON, C. M., L. P. HANSEN, P. A. BREWER, AND J. E. CHELSVIG. 1991. Ecology of
white-tailed deer in an intensively farmed region of Illinois. Wildlife Monographs 118, 77 pp.

50
OSORIO, J. E., M. S. GODSEY, G. R., DEFOLIART, AND T. M. YUILL. 1996. LaCrosse
viremias in white-tailed deer and chipmunks exposed by injection or mosquito bite. American
Journal of Tropical Medicine and Hygiene 54(4):338-342.
REILLY, J. R., T. F. MURASCHI, AND D. J. DEAN. 1962. Experimental Leptospira pomona
infection in white-tailed deer, Odocoileus virginianus, and in cattle. Journal of the American
Veterinary Medical Association 140(1):53-57.
ROTHMAN, K. J. 1986. Modern epidemiology. Little, Brown and Company, Boston,
Massachusetts.
SCHOWALTER, D. B., J. O. IVERSEN, L. C. CORNER, AND J. R. GUNSON. 1980.
Prevalence of antibodies from Toxoplasma gondii in striped skunks from Saskatchewan and
Alberta. Journal of Wildlife Diseases 16(2):189-194.
SHOTTS, E. B., C. L. ANDREWS, AND T. W. HARVEY. 1975. Leptospirosis in selected
wild mammals of the Florida panhandle and southwestern Georgia. Journal of the American
Veterinary Medical Association 167:587-589.
_____ AND F. A. HAYES. 1970. Leptospiral antibodies in white-tailed deer of the
southeastern United States. Journal of Wildlife Diseases 6:295-298.
SMITH, D. D. AND J. K. FRENKEL. 1995. Prevalence of antibodies to Toxoplasma gondii in
wild mammals of Missouri and east central Kansas: biologic and ecologic considerations of
transmission. Journal of Wildlife Diseases 31(1):15-21.
TATARUCH, F. AND H. KIERDORF. 2003. Mammals as biomonitors. In Bioindicators and
biomonitors: Principles, concepts, and applications, B. Markert, A. Breure, and H. Zechmeister
(eds). Elsevier Science Limited, Kidlington, Oxford.

51
THOMAS, F. C. AND D. O. TRAINER. 1970. Bluetongue virus in white-tailed deer.
American Journal of Veterinary Research 31(2):271-278.
TIZARD, I. R., S. S. CHAUHAN, AND CH. H. LAI. 1977. The prevalence and epidemiology
of toxoplasmosis in Ontario. Journal of Hygiene 78:275-282.
TRAINER D. O. AND R. P. HANSEN. 1960. Leptospirosis and brucellosis serological reactors
in Wisconsin deer, 1957-58. Journal of Wildlife Management 24(1):44-52.
_____ AND _____. 1969. Serologic evidence of arbovirus infections in wild ruminants.
American Journal of Epidemiology 90(4):354-358.
_____, L. KARSTAD, AND R. P. HANSEN. 1961. Experimental leptospirosis in white-tailed
deer. The Journal of Infectious Diseases 108:278-286.
VANEK, J. A., J. P. DUBEY, P. THULLIEZ, M. R. RIGGS, AND B. E. STROMBERG. 1996.
Prevalence of Toxoplasma gondii antibodies in hunter-killed white-tailed deer (Odocoileus
virginianus) in four regions of Minnesota. Journal of Parasitology 82(1):41-44.
VERCAUTEREN, K. C., T. C. ATWOOD, T. J. DELIBERTO, H. J. SMITH, J. S.
STEVENSON, B. V. THOMSEN, T. GIDLEWSKI, AND J. PAYEUR. 2008. Sentinel-based
surveillance of coyotes to detect bovine tuberculosis, Michigan. Emerging Infectious Diseases
14(12):1862-1869.
VIÑA, A., M-N. TUANMU, W. XU, Y. LI, Z. OUYANG, R. DEFRIES, AND J. LIU. 2010.
Range-wide analysis of wildlife habitat: Implications for conservation. Biological Conservation
143:1960-1969.
WARD, M. P., L. T. GLICKMAN, AND L. F. GUPTILL. 2002. Prevalence of and risk factors
for leptospirosis among dogs in the United States and Canada: 677 cases (1970-1998). Journal
of the American Veterinary Medical Association 220(1):53-58.

52
WEDMAN, E. E. AND F. C. DRIVER. 1957. Leptospirosis and brucellosis titers in deer blood.
Journal of the American Veterinary Medical Association 130:513-514.
WISE, J. K., B. L. HEATHCOTT, AND M. L. GONZALEZ. 2002. Results of the AVMA
survey on companion animal ownership in the US pet-owning households. Journal of the
American Veterinary Medical Association 221(11):1572-1573.
WITHAM, J. H. AND J. M. JONES. 1987. Chicago Urban Deer Study. Illinois Natural History
Survey Report No. 265, Champaign, Illinois.
ZAMPARO, J. M., T. G. ANDREADIS, R. E. SHOPE, AND S. J. TIRRELL. 1997. Serologic
evidence of Jamestown Canyon virus infection in white-tailed deer populations from
Connecticut. Journal of Wildlife Diseases, 33(3):623-627.

53
CHAPTER 2
HABITAT MODELING OF ENCEPHALITIDES USING SUBURBAN DEER
ABSTRACT: Wildlife disease ecology has gained much attention because of the emergence
and re-emergence of pathogens causing human disease. The study of zoonoses in wildlife
populations requires an understanding of relationships between organisms and their environment.
I modeled habitat use for 169 radio-collared and culled suburban white-tailed deer (Odocoileus
virginianus) to understand viral seroprevalence for Jamestown Canyon (JC) and LaCrosse (LAC)
encephalitis in two suburban Chicago forest preserves (DesPlaines and Palos) from 1995-99.
Radio-collared does selected for forest, savanna, and grassland habitats (total available
habitat=p<0.0001; home range=p<0.001). Akaike’s Information Criterion (AICc) optimal
models for JC contained water and wetland habitat parameters while LAC models contained
forested habitat. Deer biological parameters in JC viral models included age and month/year
samples were collected. Total home-range or buffer size and month were biological parameters
contained in LAC viral models. Deer are sufficient biomonitors for zoonotic pathogens and a
better understanding of the relationship between deer and habitat use will assist in focusing
future research and surveillance for JC and LAC viruses.
INTRODUCTION
Alterations in land use and habitat availability can alter contact between humans and
pathogens. Urbanization creates a shift in disease host(s) geographic ranges and densities,
interspecific interactions, and pathogen contamination (Bradley and Altizer, 2006). During the
past quarter-century the emergence of new diseases and the re-emergence of previous
“conquered” diseases have become an international focus for concern and action (McLean,
2001). It is becoming increasingly important to understand the relationship among wildlife,

54
zoonoses, and pathogen ecology.
Jamestown Canyon (JC) and LaCrosse (LAC) viruses belong to the California
encephalitis viral group and are widely distributed throughout North America (Grimstad et al.,
1986; Acha and Szyfres, 1994). Jamestown Canyon virus is transmitted vertically to Aedes spp.
mosquito offspring and horizontally to vertebrates, especially deer (Odocoileus virginianus;
Acha and Szyfres, 1994). Jamestown Canyon vectors breed in ground pools of semi-permanent
to permanent waters (Horsfall, 1972). After a 1984 (Mokry et al.) retrospective study in New
York, 62% of patients with central nervous system (CNS) infections had been infected with JC.
Grimstad et al. (1984) found widespread JC endemic human infection in Michigan.
LaCrosse virus is transmitted by the primary mosquito vector, A. triseriatus. LAC
mosquitoes breed in tree-holes or man-made containers confining water (Kitron et al., 1997).
The virus is transmitted by the vector transovarially and to various squirrel species (Tamias
striatus, Sciurus carloinensis, and S. niger) in oak forests (Acha and Szyfres, 1994). Additional
mammal species serve to maintain the virus through vector mosquitoes in the summer months.
LaCrosse antibodies were reported in 16% of southwestern Wisconsin deer (Issel et al., 1974).
LaCrosse virus has been documented as an important California serogroup producing CNS
illness in humans, however there is a lack of serological detection and differentiation among the
California viruses in many clinical cases (Kappus et al., 1983; Grimstad et al., 1984).
Deer are useful indictors for the presence of arboviral pathogens because of their large
population, ubiquitous distribution, non-migratory behavior, and opportunity for large sera
samples (Trainer, 1973). In addition, deer have distinct habitat use patterns based upon
landscape characteristics associated with food and cover requirements (Nixon et al., 1994).
Many infectious agents have necessary optimal habitat types, especially arboviral zoonoses like

55
JC and LAC viruses, requiring mosquito vectors (Anderson and Gutzwiller, 1996; Wilson,
2000). Transient water sources for mosquitoes include temporary water pools created by
flooding, melting snow, or near homes in man-made debris such as tires and buckets. Tree-holes
found in common maple, oak, or mixed hardwood forests generally hold water useful for
mosquito breeding. Jamestown Canyon virus was isolated from Aedes mosquitoes collected
from transient water pools in Canada (Iverson et al., 1969). During a LAC encephalitis study in
Illinois, 14 out of 50 tree-hole pools were positive for infected mosquito larvae (Clark et al.,
1983). Dynamic interactions among wildlife species, vector(s), disease agent, and the
environment allow modeling of complex ecological and environmental data.
I modeled habitat use in white-tailed deer to understand viral seroprevalence (JC and
LAC) in two suburban Chicago forest preserves (Des Plaines and Palos) from 1995-99. The goal
was to determine if specific habitat characteristics within deer home ranges and culled deer
buffers was useful in determining pathogen presence. This research will provide insight about
the relationship between habitat used by deer and required by mosquito vectors as it relates to
pathogens.
MATERIALS AND METHODS
General materials and methods are specified in pages 14-21.
ANOVA was used to compare deer home range size (95% and 50%) by JC and LAC
viruses (α<0.05; JMP®
4.02, SAS Institute Inc., Carey, North Carolina, USA; SAS Institute,
2000; Sokal and Rohlf, 1995). The software ArcView® 3.2 (Environmental Systems Research
Institute Inc., Redlands, California, USA; ESRI, 1996) was used to create a geographic
information system (GIS) from 1999 thermatic mapper land cover data generated by the Illinois
Natural History Survey (INHS). Every 5th
culled deer from Des Plaines (DP) and Palos were

56
systematically selected to reduce potential overlap among family groups of deer removed from
the same site. Data points were imported into a GIS for culled deer and 95% minimum convex
polygon (MCP) home ranges for radio-collared deer from Des Plaines (DP) and Palos. It was
assumed individual locations of culled deer were the center of each deer’s home range. Culled
deer locations were buffered with a 95% MCP (DP = 83 ha, Palos = 45 ha) and the buffered area
was representative of the average live female deer home ranges for each respective site. Male
deer were not radio-tracked so buffered areas for culled male deer were underestimated because
male home ranges average larger than females (Nixon et al., 1991; 1994).
Patterns of habitat selection were evaluated by compositional analysis for radio-collared
does from DP and Palos. Compositional analysis treats each animal as a sampling unit, thereby
avoiding autocorrelation and pseudoreplication problems associated with use of telemetry
observations as sampling units (Hurlbert, 1984; Aebischer et al., 1993; Otis and White, 1999).
Resource Selection software (RSW® 1.0, University of Idaho, Pocatello, Idaho, USA; Leban,
1998) was used to test for departure from habitat use among radio-collared deer by site
considering 1) home range and 2) total available habitat (Hurlbet, 1984; Aebisher et al., 1993;
Sokal and Rohlf, 1995; Otis and White, 1999). Analysis of habitat use allows for large scale
analysis (home range selection). Log ratios were derived in RSW to identify selection indexes
and detect differences in habitat use and availability within sites (Aebisher et al., 1993).
Land cover variables from satellite images were reduced from 23 land cover categories to
six based on habitat use patterns for Midwest deer, while also considering important habitats for
vector mosquitoes (Table 6). From previous deer studies and the compositional analysis, deer
favored agriculture, forest, savanna, wetland, grasslands, and urban sites as homes supply lawns

57
and enhanced landscapes as a food resource (Murphy et al., 1985; Nixon et al., 1991; Swihart et
al., 1995).
Fragstats® 2.0 (Fragstats, Oregon State University, Corvallis, Oregon, USA; McGarigal
and Marks, 1993) in ArcInfo® 8.0 software (Environmental Systems Research Institute Inc.,
Redlands, California, USA; ESRI, 1995) was used to estimate habitat metrics. Habitat
parameters were calculated at the class level for deer (Appendix M). Variable selection
continued based upon deer habitat and JC/LAC viral studies while considering available
Fragstats metrics (Halls, 1984; Grimstad, 1988; Nixon et al., 1991; 1994; McShea et al., 1997;
Yuill and Seymour, 2001). Many Fragstats variables provided duplicate or redundant
information and were deleted. Highly correlated Fragstat habitat class variables (Table 7) were
reduced using multivariate pair wise comparisons by JC or LAC viral prevalence (<0.25;
JMP® 4.02, SAS Institute Inc., Carey, North Carolina, USA; SAS, 2000; Sokal and Rohlf, 1995).
Fragstat variables were reduced further by viral prevalence using t-tests (<0.10).
A priori I posited logistic regression models based upon deer ecology, mosquito habitat,
and JC/LAC viruses (Table 8). I selected models best supported by the data using Akaike’s
Information Criterion for small sample sizes (AICc). Models were selected based upon
empirical support by evaluating the delta AIC (ΔAIC) values ~2.0 (Burnham and Anderson,
2002).
RESULTS
Since there was no difference in viral prevalence between 50% or 95% MCP (JC p=0.65;
LAC p=0.60), 95% MCP was selected for home range analyses. Female deer maintained
sedentary home ranges during the study (Etter et al., 2002). The original Fragstats analysis

58
included 32 radio-collared and 137 culled deer (total n=169). Radio-collared does positively
selected for forested, savanna, and grassland habitats while negatively selecting for urban,
agriculture, wetland, and open water land cover classifications (available habitat (p<0.0001) and
home range (p<0.001); Fig. 2).
Four models had support for JC virus based on ΔAIC values ranging from 0-2.13 (Table
9). All four models contained month the deer sample was collected (month) and deer age. Year
the deer sample was collected (year) was also present in three of the four top models. Models
two and three contained habitat variables water IJI and wet %Land.
Three models contained supportive ΔAIC values for LAC virus ranging from 0-2.76
(Table 9). Habitat variables ft NNCV, ft PSCV, and ft AWMSI appeared in the top two models.
Deer parameters month and total home range or buffer size (total) also appeared in the top
model.
DISCUSSION
White-tailed deer have distinct patterns for habitat requirements (Nixon et al., 1991;
Grund et al., 2002) and many infectious agents require specific habitat types (Anderson and
Gutzwiller, 1996; Wilson, 2000). Deer use various habitat types for cover and as a transitional
shift when food supplies are limited (Nixon et al., 1991; Grund et al., 2002). A behavioral
response by deer to humans may also play a role in habitat use. Deer in highly fragmented
agricultural landscapes search out maximum cover from intruding human activities (Storm et al.,
2006; Nixon et al., 2007). However, deer studied in suburban environments did not appear to
avoid human activities and were even observed being directly fed by humans on several
occasions (C. Anchor, D. Etter, pers. comm.). It is probable that the more humans and wildlife
interact, the more likely for zoonoses transmission.
59
JC viral models 2 and 3 (Table 9) included habitat variables related to standing water, a
prerequisite for mosquitoes. Deer from both sites had a negative selection for water and a strong
negative (DP) to slightly positive (Palos) selection for wetlands. Mosquitoes and biting insects
averaged 15 times more abundant in bottom-lands compared to upland habitats during a study of
rural deer in Illinois (Nixon et al., 1991). This suggests deer with lowland habitats or wet areas
in their home ranges would be at greater risk of being bitten by infected mosquitoes. The
distribution, proximity, and patch relationship of the water and wetland resources increases the
likelihood that deer will be exposed to JC virus carrying mosquitoes in these specific habitats.
The top two models for LAC virus (LAC viral models 1 and 2; Table 9) contained
forested parameters and metrics supporting the likely exposure of deer to tree-hole mosquitoes,
the primary vector. A. triseriatus breed inside tree-holes commonly found in deciduous oak
forests and other places where water collects, including tires near homes (Acha and Szyfres,
2001). The relationship among forested habitat, size of the habitat patches, and the percent of
landscape covered by savanna-grass (Table 9, LAC model 3) supports deer using a greater
number of habitat types which may increase the risk of exposure to vectors and pathogenic
organisms. Increased rainfall can have a positive effect on vectors by providing adequate
microenvironments for breeding mosquitoes, even in urban areas (Pherez, 2007).
GIS data layers, while they are easily used and offer powerful data manipulation and
measurement capabilities, have limitations when evaluating large regions. Large-scale GIS
databases may not contain the data layers required for examining the specific ecological
question(s) of interest (Pendleton et al., 1998). For example, the GIS databases used did not
contain specific mosquito breeding habitat. Land cover classification, errors in classification
images, and the reduction of land cover categories into six habitat types may have also

60
influenced results. Land cover images from data collected in 1999 were used because they
overlapped with the study time frame. However, the accuracy of the images (forests=75.6%
accurate; INHS, Land Cover Classification Accuracy, 1999-2000) and the lack of fine scale
details could affect results. For example, water was an important component in JC viral models,
but deer negatively selected for open water habitats. In addition, land cover data is influenced by
when it is collected and landscapes change annually due to development, vegetative growth, and
seasonal weather patterns. I noted error in the classification of agriculture and grasslands in
specific areas of both preserves. However, I suspect that because deer and pathogen vectors like
mosquitoes occur at different habitat scales, it may be difficult to elucidate fine-scale pathogen-
vector-host relationships without detailed ecological data from both deer and mosquitoes.
Top models for JC and LAC (Table 9) viruses also included repeated parameters related
to basic deer biology (month, age, and year). As deer get older, they increase the risk of
pathogen exposure over time and maintain antibodies (Grimstad, 1988; Grimstad et al., 1987).
Many infectious diseases have seasonal and annual cycles (Wilson, 2000), explaining the
importance of month and year in our models. Most human infections occur during occupational
or recreational activities from July to September (Acha and Szyfres, 2001). Therefore, deer
sampled in the winter will provide indicators for annual exposure(s) to encephalitis. Age of deer
sampled for JC and LAC viruses should also be considered because maternal antibodies and
seroconversion rates may influence serological results. Yearlings are useful in determining new
exposures and adults for long-term information. Prevalence analysis including specific deer
parameters and conclusions was detailed in Hollis (2011).
White-tailed deer were a useful sentinel for determining the absence or presence of JC
and LAC viruses in a fragmented suburban environment. Deer are a generalist species and use
61
various ecotones within forested and savanna cover (Nixon, et al., 1991). Deer have larger home
ranges compared to many sedentary mammals in the Chicago region, use multiple habitat types,
and therefore increase exposures to various pathogens. However, a specialist species may serve
as a better sentinel to intensely survey specific focal areas, especially for LAC. A fine-scale
analysis involving both generalist and specialist species could serve to identify habitat
differences and create more detailed risk profiles at different scales for host, vectors, and disease.
I only had data available for two sites in Cook County where deer were radio-collared and
culled. Increasing sample sizes, number of study sites, and focusing on seasonal home ranges
overlapping with vector emergence and abundance may also alter the results because habitat
availability and use by deer varied between the two study sites.
This research revealed that deer serve as a sufficient biomonitor for locating pathogens
and create a potential for human exposure to disease (Hollis, 2011). The habitat, zoonotic
pathogens, and vectors are present in Cook County Forest Preserves. This research further
allows scientists to finely focus future projects. Occasional sampling for pathogen antibodies
among deer populations may be beneficial for documenting viral changes, habitat differences,
landscape alterations, and human encroachment into wildlife habitat (Arjo et al., 2003).
Proactive surveillance can identify gaps in zoonotic information by locating areas where human
outbreaks have not occurred but where pathogens are present. Investigative strategies analyzing
the relationship between mammals, habitat use, zoonotic organisms, and vectors will serve to
advance our understanding of ecological and pathogen relationships.

62
-3
-2
-1
0
1
2
3
4
Sel
ecti
on
In
dex
Urban
Ag
Forest
Savanna
Wetland
Marsh
Grass
Other
Des Plaines Palos
FIGURE 2. Suburban white-tailed deer habitat selection index from compositional
analysis by study site Chicago,, Illinois, USA, 1995-99 (α<0.05).
Water
Undeveloped

63
TABLE 6. Reduction of 23 original land cover types to 6 habitat categories from Landstat 1999
TM images for suburban white-tailed deer from Chicago, Illinois, USA, 1995-99.
______________________________________________________________________________
1999 Land cover types Habitat category
______________________________________________________________________________
High density urban Urban
Medium density urban
Low density urban
Undifferentiated urban mix
Row crop-rural grass Agriculture
Agriculture-mixed uses
Agriculture-corn
Agriculture-small grains
Agriculture-soybeans
Agriculture-winter wheat
Rural grasses
Urban forest Savanna-Grass
Urban grasses
Dry savanna
Mesic forest Forest
Savanna/mesic-dry mesic forest
Mesic/dry-mesic forest
Dry-mesic forest
Shallow marsh emergent wetland Wetland
Deep marsh emergent wetland
Non-swamp forested wetland
Mixed wetlands
Open water Water
______________________________________________________________________________
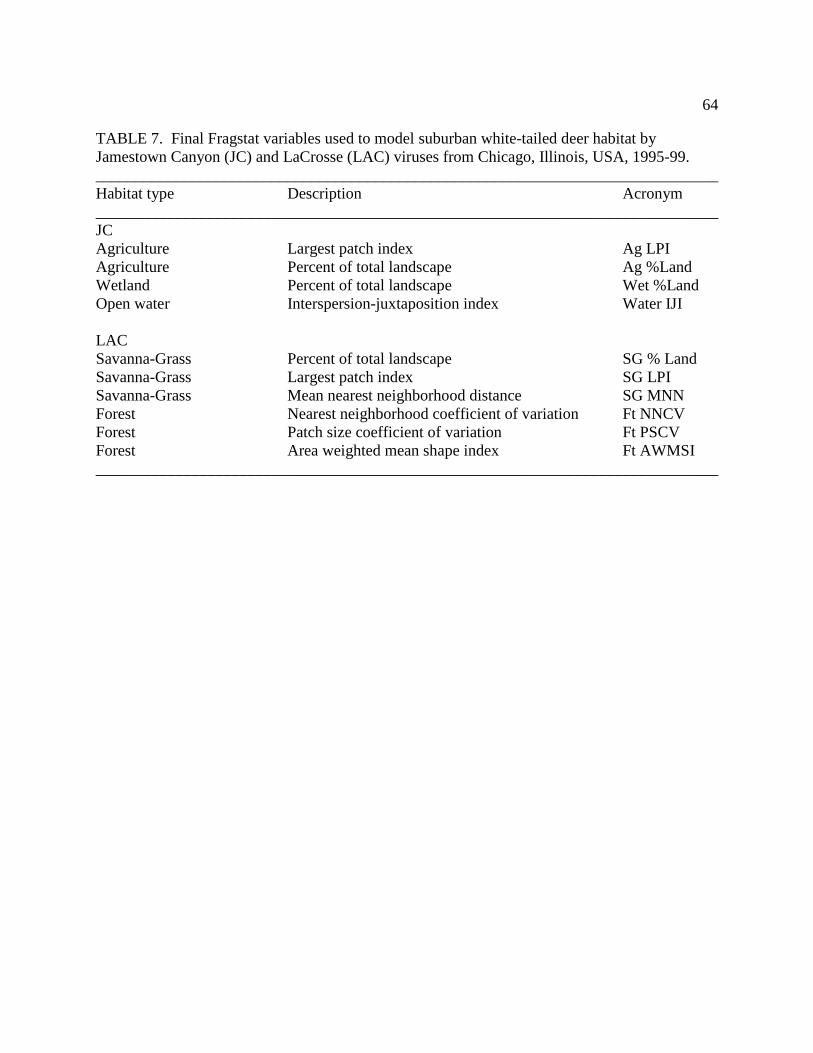
64
TABLE 7. Final Fragstat variables used to model suburban white-tailed deer habitat by
Jamestown Canyon (JC) and LaCrosse (LAC) viruses from Chicago, Illinois, USA, 1995-99.
______________________________________________________________________________
Habitat type Description Acronym
______________________________________________________________________________
JC
Agriculture Largest patch index Ag LPI
Agriculture Percent of total landscape Ag %Land
Wetland Percent of total landscape Wet %Land
Open water Interspersion-juxtaposition index Water IJI
LAC
Savanna-Grass Percent of total landscape SG % Land
Savanna-Grass Largest patch index SG LPI
Savanna-Grass Mean nearest neighborhood distance SG MNN
Forest Nearest neighborhood coefficient of variation Ft NNCV
Forest Patch size coefficient of variation Ft PSCV
Forest Area weighted mean shape index Ft AWMSI
______________________________________________________________________________

65
Table 8. Data considered when creating logistic regression models for Akaike’s Information
Criterion (AICc) to infer Jamestown Canyon (JC) and LaCrosse (LAC) viruses and habitat
relationships for suburban white-tailed deer, Chicago, Illinois, USA, 1995-99.
_________________________________________________________________________
Parameters Interpretation References
_________________________________________________________________________
Deer ecology Deer habitat, home-range Nixon et al., 1991, Grund et
al., 2002, Horsefall, 1972
Mosquitoes Habitat use Grimstad et al., 1987
JC/LAC viruses Disease exposure Grimstad et al., 1987, 1988
_________________________________________________________________________

64
TABLE 9. Logistic regression models used for Akaike’s Information Criterion (AICc) to evaluate Jamestown Canyon
(JC) and LaCrosse (LAC) viruses and habitat relationships for suburban white-tailed deer, Chicago, Illinois, USA,
1995-99
__________________________________________________________________________________________
Rank Modela, b
K R2
AICc ΔAIC wi c
__________________________________________________________________________________________
JC viral models
1 Month, age, year 5 0.197 202.65 0.00 0.375
2 Month, age, year, water IJI 6 0.203 203.42 0.77 0.255
3 Month, age, total, wet %Land, water IJI 7 0.208 204.66 2.01 0.137
4 Month, age, year, habitats 6 0.197 204.78 2.13 0.129
LAC viral models
1 Month, total, ft NNCV 5 0.050 83.01 0.00 0.505
2 Ft NNCV, ft PSCV, ft AWMSI 5 0.036 85.59 2.58 0.139
3 Month, sg LPI 4 0.023 85.76 2.76 0.127
6 __________________________________________________________________________________________ a See Table 7 for description of Fragstats model variables.
b Month=month sample collected, age=fawn (<6 months old), yearling (1.5 years old), or adult (>2.5 years old),
year=year sample collected, total=home range or buffer size, and habitats= number of habitat types per home
range or buffer size.
c wi=Akaike weight; interpreted as the probability a model is the best model supported by the data, given a set of
alternative models (Burnham and Anderson, 2002).
66

67
LITERATURE CITED
ACHA, P. N. AND B. SZYFRES. 1994. California encephalitis. In Zoonoses and
communicable diseases common to man and animals, 2nd
Edition, Pan American Health
Organization, Washington, D.C., pp. 304-308.
_____ AND _____. 2001. California encephalitis. In Zoonoses and communicable diseases
common to man and animals: Volume II Chlamydioses, Rickettsioses, and Viruses, 3rd
Edition,
Pan American Health Organization, Washington, D.C., pp. 68-72.
AEBISCHER, N. J., P. A. ROBERTSON, AND R. E. KENWOOD. 1993. Compositional
analysis of habitat use from animal radio-tracking data. Ecology 74:1313-1325.
ANDERSON, S. H. AND K. J. GUTZWILLER. 1996. Habitat evaluation methods. In
Research and management techniques for wildlife and habitats, T. A. Bookhout (ed). The
Wildlife Society, Bethesda, Maryland.
ARJO, W. M., E. M. GESE, C. BROMLEY, A. KOZLOWSKI, AND E. S. WILLIAMS. 2003.
Serological survey for diseases in free-ranging coyotes (Canis latrans) from two ecological
distinct areas of Utah. Journal of Wildlife Diseases 39(2):449-455.
BRADLEY, C. A. AND S. ALTIZER. 2006. Urbanization and the ecology of wildlife disease.
Trends in Ecology and Evolution 22(2):95-122.
BURNHAM, K. P. AND D. R. ANDERSON. 2002. Model selection and inference: A practical
information-theoretic approach. Springer-Verlag, New York, New York.
CLARK, G. C., H. L. PRETULA, C. W. LANGKOP, R. J. MARTIN, AND C. H. CALISHER.
1983. Persistence of LaCrosse virus (California encephalitis serogroup) in North-Central
Illinois. American Journal of Tropical Medicine and Hygiene 32:175-184.

68
ESRI (ENVIRONMENTAL SYSTEMS RESEARCH INSTITUTE). 1995. Understanding GIS:
the ARC/INFO method: self study workbook. GeoInformation International, Cambridge, United
Kingdom. _____. 1996. ArcView® GIS: The geographic information system for everyone.
Redlands, California.
ETTER, D. R., K. M. HOLLIS, T. R. VAN DEELEN, D. R. LUDWIG, J. E. CHELSVIG, C. L.
ANCHOR, AND R. E. WARNER. 2002. Survival and movements of white-tailed deer in
suburban Chicago, Illinois. Journal of Wildlife Management 66(2):500-510.
GRIMSTAD, P. R. 1988. California group virus disease. In The arboviruses: epidemiology and
ecology, T.P. Monath (ed.). CRC Press, Boca Raton, Florida, pp. 99-136.
_____. C. L. BARRETT, R. L. HUMPHREY, AND M. J. SINSKO. 1984. Serological
evidence for wide-spread infection with LaCrosse and St. Louis encephalitis viruses in the
Indiana human population. American Journal of Epidemiology 119:913-930.
_____, S. M. SCHMITT, AND D. G. WILLIAMS. 1986. Prevalence of neutralizing antibody to
Jamestown Canyon virus (California group) in populations of elk and moose in northern
Michigan and Ontario, Canada. Journal of Wildlife Diseases 22(4):453-458.
_____, D. G. WILLIAMS, AND S. M. SCHMITT. 1987. Infection of white-tailed deer
(Odocoileus virginianus) in Michigan with Jamestown Canyon virus (California serogroup) and
the importance of maternal antibody viral maintenance. Journal of Wildlife Diseases 23:12-22.
GRUND, M. D., J. B. MCANINCH, AND E. P. WIGGERS. 2002. Seasonal movements and
habitat use of female white-tailed deer associated with an urban park. Journal of Wildlife
Management 66(1):123-130.
HALLS, L. K. (ed). 1984. White-tailed deer: Ecology and management. The Wildlife
Management Institute, Washington D. C.

69
HOLLIS, K. M. 2011. Epidemiology of suburban deer. Ph.D. Thesis. University of Illinois,
Urbana-Champaign.
HORSFALL, W. R. 1972. Mosquitoes: Their bionomics and relation to disease. Hafner Press,
New York.
HURLBERT, S. H. 1984. Pseudoreplication and the design of ecological field experiments.
Ecological Monographs 54:187-211.
ISSEL, C. J. 1974. Maternal antibody to Jamestown Canyon virus in white-tailed deer.
American Journal of Tropical Medicine and Hygiene 23(2):242-245.
IVERSON, J., R. P. HANSON, O. PAPADOPULOS, C. V. MORRIS, AND G. R.
DEFOLIART. 1969. Isolation of viruses of the California encephalitis virus group from boreal
Aedes mosquitoes. American Journal of Tropical Medicine and Hygiene 18:735-742.
KAPPUS, K. D., T. P. MONATH, R. M. KAMINSKI, AND C. H. CALISHER. 1983.
Reported encephalitis associated with California serogroup virus infections in the United States,
1963 to 1981. In California serogroup viruses, C. H. Calisher and W. H. Thompson (eds). Alan
R. Liss, New York.
KITRON, U., J. MICHAEL, J. SWANSON, AND L. HARAMIS. 1997. Spatial analysis of the
distribution of LaCrosse encephalitis in Illinois, using a geographic information system and local
and global spatial statistics. Journal of Tropical Medicine and Hygiene 57(4):469-475.
LEBAN, F. 1998. Resource selection for windows. University of Idaho, Pocatello, Idaho.
MARCHINTON, R. L. AND D. H. HIRTH. 1984. Behavior In White-tailed deer: Ecology and
management, L. K. Halls (ed). The Wildlife Management Institute, Washington D. C., pp.
129-168.

70
MCGARIGAL, K. AND B. J. MARKS. 1993. FRAGSTATS®: Spatial pattern analysis program
for quantifying landscape structure (Version 1.0). Forest Science Department, Oregon State
University, Corvallis, Oregon.
MCLEAN, R. G. 2001. Changing patterns of wildlife diseases. Transactions of the North
American Wildlife and Natural Resource Conference 66:320-326.
MCSHEA, W. J., H. B. UNDERWOOD, AND J. H. RAPPOLE (eds). 1997. The science of
overabundance: Deer ecology and population management. Smithsonian Institution Press,
Washington D. C., 402 pp.
MOKRY, J., H. ARTSOB, AND R. BUTLER. 1984. Studies on California serogroup virus
activity in Newfoundland, Canada, 1980-83. Mosquito News 44:310-314.
MURPHY, R. K., N. F. PAYNE, AND R. K. ANDERSON. 1985. White-tailed deer use of an
irrigated agriculture-grassland complex in Central Wisconsin. Journal of Wildlife Management
49(1):125-128.
NIXON, C. M., L. P. HANSEN, P. A. BREWER, AND J. E. CHELSVIG. 1991. Ecology of
white-tailed deer in an intensively farmed region of Illinois. Wildlife Monographs 118, 77 pp.
_____, _____, _____, _____, J. B. SULLIVAN, T. ESKER, R. K. KOERKENMEIER, D. R.
ETTER, J. CLINE, AND J. A. THOMAS. 1994. Behavior, dispersal, and survival of male
white-tailed deer in Illinois. Biological Note 139, Illinois Natural History Survey, Urbana,
Illinois.
_____, P. C. MANKIN, D. R. ETTER, L. P. HANSEN, P. A. BREWER, J. E. CHELSVIG, T. E.
ESKER, AND J. B. SULLIVAN. 2007. White-tailed deer dispersal behavior in an agricultural
environment. American Midland Naturalist 157:212-220.

71
OTIS, D. L. AND G. C. WHITE. 1999. Autocorrelation of location estimates and the analysis
of radio-tracking data. Journal of Wildlife Management 63:1039-1044.
PENDLETON, G. W., K. TITUS, E. DEGAYNER, C. J. FLATTEN, AND R. E. LOWELL.
1998. Compositional analysis and GIS for study of habitat selection by goshawks in southeast
Alaska. Journal of Agricultural, Biological, and Environmental Statistics 3(3):280-295.
PHEREZ, F. M. 2007. Factors affecting the emergence and prevalence of vector borne
infections (VBI) and the role of vertical transmission (VT). Journal of Vector Borne Diseases
44:157-163.
SAS INSTITUTE. 2000. JMP® statistics and graphics guide, Version 3. SAS Institute, Inc.,
Cary, North Carolina.
SOKAL, R. R. AND F. J. ROHLF. 1995. Biometry. W. H. Freeman and Company, New York,
New York.
STORM, D. J., C. K. NIELSEN, E. M. SCHAUBER, AND A. WOOLF. 2006. Space use and
survival of white-tailed deer in an exurban landscape. Journal of Wildlife Management
71:1170-1176.
SWIHART, R. K., P. M. PICONE, A. J. DENICOLA, G. S. KANIA, AND L. CORNICELLI.
1995. Ecology of urban and suburban white-tailed deer. In Urban deer: A manageable
resource?, J. B. McAninch (ed). Proceedings of the 1993 Symposium of the North Central
Section, The Wildlife Society, pp. 35-44.
TRAINER, D. O. 1973. Wildlife as monitors of disease. American Journal of Public Health
63(3):201-203.
WILSON, M. E. 2000. Environmental change and infectious disease. Ecosystem Health
6(1):7-12.

72
YUILL, T. M. AND C. SEYMOUR. 2001. Arbovirus infectious. In Infectious Diseases of
Wildlife Mammals, E. S. Williams and I. K. Barker (eds). Iowa State University Press, Ames,
Iowa, pp. 98-118.
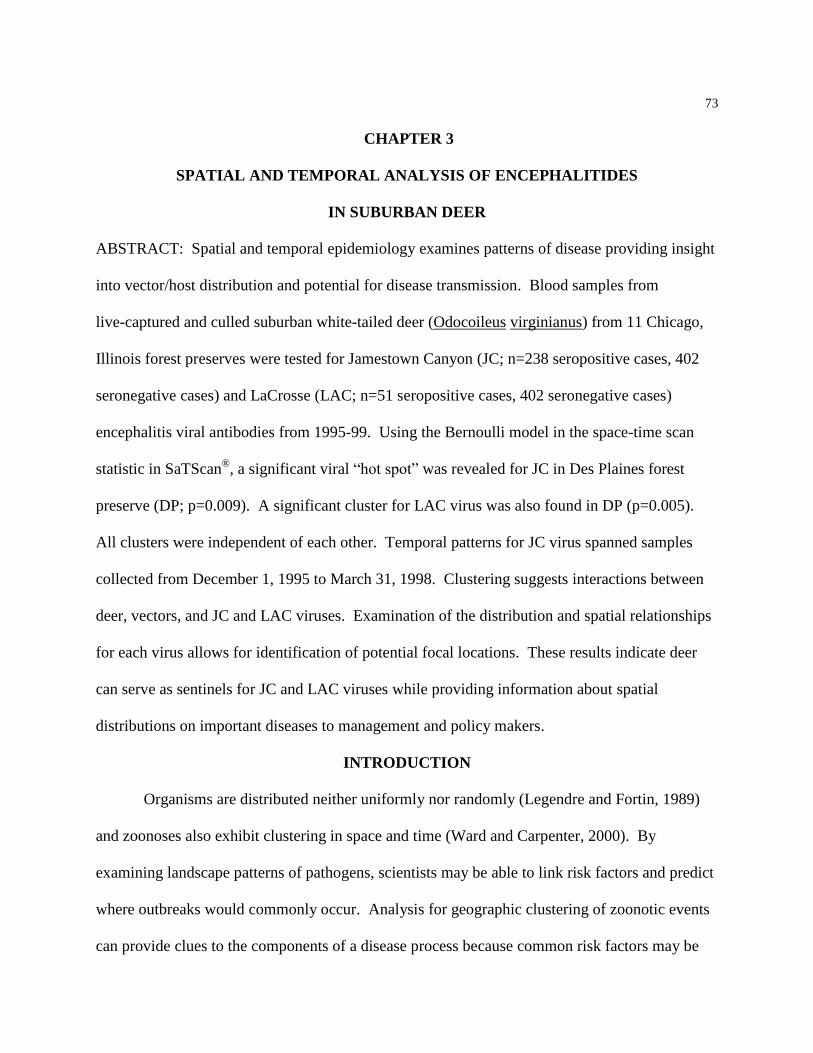
73
CHAPTER 3
SPATIAL AND TEMPORAL ANALYSIS OF ENCEPHALITIDES
IN SUBURBAN DEER
ABSTRACT: Spatial and temporal epidemiology examines patterns of disease providing insight
into vector/host distribution and potential for disease transmission. Blood samples from
live-captured and culled suburban white-tailed deer (Odocoileus virginianus) from 11 Chicago,
Illinois forest preserves were tested for Jamestown Canyon (JC; n=238 seropositive cases, 402
seronegative cases) and LaCrosse (LAC; n=51 seropositive cases, 402 seronegative cases)
encephalitis viral antibodies from 1995-99. Using the Bernoulli model in the space-time scan
statistic in SaTScan®, a significant viral “hot spot” was revealed for JC in Des Plaines forest
preserve (DP; p=0.009). A significant cluster for LAC virus was also found in DP (p=0.005).
All clusters were independent of each other. Temporal patterns for JC virus spanned samples
collected from December 1, 1995 to March 31, 1998. Clustering suggests interactions between
deer, vectors, and JC and LAC viruses. Examination of the distribution and spatial relationships
for each virus allows for identification of potential focal locations. These results indicate deer
can serve as sentinels for JC and LAC viruses while providing information about spatial
distributions on important diseases to management and policy makers.
INTRODUCTION
Organisms are distributed neither uniformly nor randomly (Legendre and Fortin, 1989)
and zoonoses also exhibit clustering in space and time (Ward and Carpenter, 2000). By
examining landscape patterns of pathogens, scientists may be able to link risk factors and predict
where outbreaks would commonly occur. Analysis for geographic clustering of zoonotic events
can provide clues to the components of a disease process because common risk factors may be

74
responsible for observed events. Various disease models and geographic risk maps have been
created to describe spatial and/or temporal patterns to interpret disease processes (Siegel et al.,
1991; Kitron et al., 1992; Lockhart et al., 1996; Joly et al., 2003).
All arboviral encephalitidies are zoonotic, have a global distribution, and are maintained
through complex life cycles between vertebrate hosts and arthropod vectors (Centers for Disease
Control, 2005). Jamestown Canyon (JC) virus occurs throughout much of temperate North
America. White-tailed deer (Odocoileus virginianus) are the primary reservoir host and boreal
Aedes mosquitoes are the primary vectors (Andreadis et al., 2008). Perennial exposures of
Jamestown Canyon virus in deer occur as early as February through October with 100% of
captive animals seroconverting within 2-10 weeks of exposure (Grimstad et al., 1987).
Jamestown Canyon’s temporal transmission occurs from months to years and most human cases
are reported between April and October (Grimstad, 1988).
LaCrosse encephalitis (LAC) has a focal distribution in the north-central/eastern United
States and is the leading cause of pediatric encephalitis (Elmore et al., 2000). In the Midwest,
LAC produces continuous seasonal endemic infections (Grimstad et al., 1994). Incidences of
LAC are highly seasonal, depending on the vector (A. triseriatus), weather, viral amplification,
and host presence (Clark et al., 1983; Acha and Szyfres, 1994).
The objective of this study was to examine spatial and temporal foci for JC and LAC
viral antibodies in live-captured and culled white-tailed deer from11 Chicago, Illinois forest
preserves from 1995-99. Analyzing spatial and temporal patterns for JC and LAC can identify
focal areas for potential human exposure. Disease clustering provides compelling evidence to
help improve control and prevention programs (Ward and Carpenter, 2000).

75
MATERIALS AND METHODS
General materials and methods are specified in pages 14-21.
ArcView® 3.2 (Environmental Systems Research Institute Inc., Redlands, California,
USA; ESRI, 1996) software was used to create data layers of plotted locations for live tagged
and culled deer, home ranges for radio-collared deer, calculated point of central tendency for
radio-collared deer, and land cover generated by the Illinois Natural History Survey (INHS) from
thermatic mapper (TM) 1999 images.
Data recorded for each deer included sera samples classified as seropositive (case) or
seronegative (control) for JC or LAC viruses, x-y coordinates generated in ArcView, date, age,
and sex. Coordinates were based upon point removal locations for all sites, tagged deer capture
location, or point of central tendency for radio-collared deer from Des Plaines (DP) and Palos.
Data were analyzed using the Bernoulli model in SaTScan® 4.0.3
with retrospective space-time
scan statistics creating log likelihood ratios (LLR) and Monte Carlo simulations generating
p-values (SaTScan, National Cancer Institute, Bethesda, Maryland, USA; Kulldorff and
Nagarwalla, 1995; Kulldorff et al., 1997; Kulldorff, 2002). LLR indicates how much the
positive odds for disease increases in a specific location and/or time when compared to
non-diseased individuals (Pfeiffer, 2002). The LLR statistic was calculated for each random
replication as well as for the true data set. If the true data set was among the highest 5%, then
the test was significant at the p<0.05 level (Viel et al., 2000). Relative risk (RR) was calculated
as the estimated risk within the cluster divided by the estimated risk outside the cluster.
A space-time statistic generates a cylindrical window. The base is defined by the infinite
number of distinct geographic circles encompassing seropositive versus seronegative candidates
with overlapping potential candidate clusters. The height reflects the time period of each

76
potential cluster. The cluster windows are then moved in space and time so that each possible
location overlaps each time period creating an infinite number of overlapping potential clusters.
The maximum possible spatial cluster size was set at 50% of the total population at risk.
P-values were obtained by repeating the same analytical functions on a large number of random
replications of the data (Kulldorff and Nagarwalla, 1995; Kulldorff et al., 1998; Smith et al.,
2000). Output files from SaTScan were imported into ArcView to create maps.
RESULTS
Jamestown Canyon virus samples included 238 seropositive and 402 seronegative cases.
LaCrosse virus samples included 51 seropositive and 402 seronegative cases. Spatial analysis
resulted in two clusters for JC virus. The DP cluster contained 62 cases including a radio-
collared doe from Beck Lake in DP (p=0.009; Figs. 3, 4). Relative risk was 1.60 (or 1.6 times
more likely to be positive than random data replications), indicating an increased risk of
pathogen exposure within this region. Temporal patterns included deer sampled from December
1, 1995 to March 31, 1998. Space and time clustering indicated LLR=12.77 representing an
independence of clustering.
Spatial analysis for LAC virus contained only one cluster for exposure at Dam 1 in DP
(p=0.005; Fig. 5). Six clusters in Palos were identified as secondary but were not statistically
significant. The DP cluster included eight LAC viral cases with increased risk for exposure in
the northern DP region (RR=6.88). Space and time analysis resulted in LLR=12.99 representing
an independence of clustering.
DISCUSSION
It is important to define the distribution of a disease within its overall geographic range
(Wobeser, 2007). In this study of suburban white-tailed deer, there was a northern cluster for JC

77
virus in the areas sampled from Chicago, Illinois. In Indiana white-tailed deer, Boromisa and
Grimstad (1987) reported a difference in JC antibody prevalence between north and south zones.
This pattern indicates a vector mosquito (Aedes) and deer association likely mediated by open
water and riparian corridors. JC vectors require transient to permanent ground pools for
breeding and egg survival. Radio-collared doe #98 was positive for JC virus and her home-range
overlaps with the identified JC virus positive cluster at Beck Lake in DP (Fig. 4). Her home
range also overlapped open water and riparian corridors including Beck Lake and the DesPlaines
river. Aedes mosquitoes are present and documented by various mosquito abatement districts in
the Chicago region, including the DP forest preserve (Northwest Mosquito Abatement District,
pers. comm.). JC vectors require transient to permanent ground pools for breeding and egg
survival.
Spatial distribution of disease factors must always be considered in conjunction with time
and changes in distribution over time (Wobeser, 2007). Timing of JC transmission was
associated with spring or summer Aedes mosquito populations for the years sampled.
Temporal analysis for JC viral positive deer collected between December, 1995 and March, 1998
indicated repeated viral exposures and annual pathogen presence. The incidence of many
pathogens and parasites are well documented as seasonal (Altizer et al., 2006). Annual patterns
in host dynamics and biology can generate incidences around the same time each year. The
timing for host exposure in wildlife populations can be used to estimate the timing and severity
of viral presence. In the upper Midwest, JC virus is transmitted to deer in mid-to late spring with
the emergence of the first over wintering Aedes mosquitoes (Grimstad, 1988; Heard et al., 1990)
with annual reinfection occurring (Neitzel and Grimstad, 1991). Seasonal variation in rainfall
and temperature can limit or enhance the abundance of mosquito vectors.
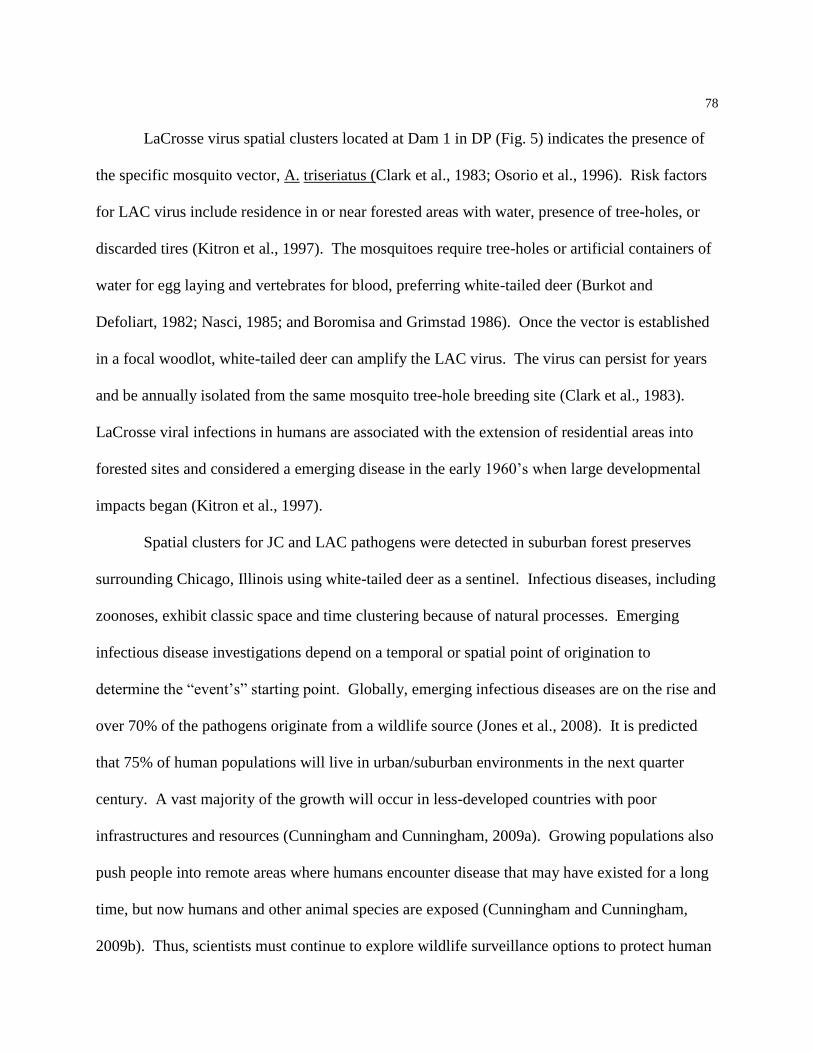
78
LaCrosse virus spatial clusters located at Dam 1 in DP (Fig. 5) indicates the presence of
the specific mosquito vector, A. triseriatus (Clark et al., 1983; Osorio et al., 1996). Risk factors
for LAC virus include residence in or near forested areas with water, presence of tree-holes, or
discarded tires (Kitron et al., 1997). The mosquitoes require tree-holes or artificial containers of
water for egg laying and vertebrates for blood, preferring white-tailed deer (Burkot and
Defoliart, 1982; Nasci, 1985; and Boromisa and Grimstad 1986). Once the vector is established
in a focal woodlot, white-tailed deer can amplify the LAC virus. The virus can persist for years
and be annually isolated from the same mosquito tree-hole breeding site (Clark et al., 1983).
LaCrosse viral infections in humans are associated with the extension of residential areas into
forested sites and considered a emerging disease in the early 1960’s when large developmental
impacts began (Kitron et al., 1997).
Spatial clusters for JC and LAC pathogens were detected in suburban forest preserves
surrounding Chicago, Illinois using white-tailed deer as a sentinel. Infectious diseases, including
zoonoses, exhibit classic space and time clustering because of natural processes. Emerging
infectious disease investigations depend on a temporal or spatial point of origination to
determine the “event’s” starting point. Globally, emerging infectious diseases are on the rise and
over 70% of the pathogens originate from a wildlife source (Jones et al., 2008). It is predicted
that 75% of human populations will live in urban/suburban environments in the next quarter
century. A vast majority of the growth will occur in less-developed countries with poor
infrastructures and resources (Cunningham and Cunningham, 2009a). Growing populations also
push people into remote areas where humans encounter disease that may have existed for a long
time, but now humans and other animal species are exposed (Cunningham and Cunningham,
2009b). Thus, scientists must continue to explore wildlife surveillance options to protect human

79
health because urban/suburban environments are continuing to expand. Public health
organizations have focused on large incidences of disease mortality in the past and this fails to
capture the impacts of disease emergence over time (Cunningham and Cunningham, 2009b).
Monitoring for zoonoses will identify potential endemic and emerging or epidemic conditions.
Creating more detailed risk assessment maps with spatial epidemiology will allow for
interpretation of biotic and abiotic factors identified through surveillance programs and
contribute to understanding pathogens and vectors over space and time.
Knowledge about host wildlife populations and disease processes can improve our
understanding of pathogen patterns. Deer presence can exert a powerful influence on
vector-borne zoonoses, not as a reservoir, but by affecting the distribution and abundance of the
pathogenic vector (Wilson and Childs, 1997). Spatial “hot spots” and time relationships for JC
and LAC viruses were found in suburban white-tailed deer from Cook County, Illinois forest
preserves. Suitable habitat is present in Cook County forest preserves for specific pathogen
vectors (Hollis, 2011) and spatial analysis identified focal locations for JC and LAC. The cluster
locations can be examined further for specific mosquito species that may transmit encephalitis
viruses. In addition, vector species in these study sites could be specifically monitored for spring
and fall emergence patterns and changes in potential species transmitting the viruses; both
influencing transmission potential and duration of disease. The results quantify deer prevalence
data and can be used as a baseline reference for any future JC or LAC virus reemerging disease
events in the Chicago region. Spatial statistics and knowledge of pathogen patterns provides a
means to assess clustering of seropositive cases and can assist in pathogen surveillance and virus
detection.

80
FIGURE 3. Location of Jamestown Canyon (JC) viral cluster in suburban white-tailed deer from
DesPlaines area of the Cook County Forest Preserve, Chicago, Illinois, USA, 1995-99 (p=0.009).
Chicago
Des Plaines
0 2 4
km
Cook County Land Cover Legend
Agriculture
Forest
Savanna-Grass
Urban
Water
Wetland
Positive Cluster

81
FIGURE 4. Representation of Beck Lake in Des Plaines Cook County Forest Preserve. The
calculated seropositive cluster for deer (red dot) in this location and locations of all individual
seropositive white-tailed deer (blue dots) for Jamestown Canyon (JC) virus from Chicago,
Illinois, USA, 1995-99 (p=0.009). Home range of seropositive radio-collared doe #98 is
included in this cluster.
0 1 2
km
DesPlaines Topographic Map Legend
Wooded Vegetation
Urban
Lake
River, stream
Primary Highway
Secondary Highway
Light Duty Road
Unimproved Road
Trail
Positive Cluster
Individual Deer Locations
Positive Deer Home Range

82
FIGURE 5. Location of LaCrosse (LAC) virus cluster in suburban white-tailed deer at Dam 1 in
Des Plaines area of the Cook County Forest Preserve, Chicago, Illinios, USA, 1995-99
(p=0.005).
Chicago
Des Plaines
0 2 4
km
Cook County Land Cover Legend
Agriculture
Forest
Savanna-Grass
Urban
Water
Wetland
Positive Cluster

83
LITERATURE CITED
ACHA, P. N. AND B. SZYFRES. 1994. California encephalitis. In Zoonoses and
communicable diseases common to man and animals, 2nd
Edition, Pan American Health
Organization, Washington, D.C., pp. 304-308.
ALTIZER, S., A. DOBSON, P. HOSSEINI, P. HUDSON, M. PASCUAL, AND P. ROHANI.
2006. Seasonality and the dynamics of infectious disease. Ecology Letters 9:467-484.
ANDREADIS, T. G., J. F. ANDERSON, P. M. ARMSTRONG, AND A. J. MAIN. 2008.
Isolations of Jamestown Canyon virus (Bunyaviridae: Orthobunyavirus) from field-collected
mosquitoes (Diptera: Culicidae) in Connecticut, USA: A ten-year analysis, 1997-2006.
Vector-Borne and Zoonotic Diseases 8(2):175-188.
BOROMISA, R. D. AND P. R. GRIMSTAD. 1986. Virus-vector- host relationships of Aedes
stimulans and Jamestown Canyon virus in a Northern Indiana enzootic focus. American Journal
of Tropical Medicine and Hygiene 35(6):1285-1295.
_____ AND _____. 1987. Seroconversion rates to Jamestown Canyon virus among six
populations of white-tailed deer (Odocoileus virginianus) in Indiana. Journal of Wildlife
Diseases 23(1):23-33.
BURKOT, T. R. AND G. R. DEFOLIART. 1982. Bloodmeal sources of Aedes triseriatus and
Aedes vexans in a southern Wisconsin forest endemic for LaCrosse encephalitis virus. American
Journal of Tropical Medicine and Hygiene 31(2):376-381.
CENTERS FOR DISEASE CONTROL. 2005. Information on arboviral encephalitides.
Division of Vector-Borne Infectious Diseases, Fort Collins, Colorado.

84
CLARK, G. C., H. L. PRETULA, C. W. LANGKOP, R. J. MARTIN, AND C. H. CALISHER.
1983. Persistence of LaCrosse virus (California encephalitis serogroup) in North-Central
Illinois. American Journal of Tropical Medicine and Hygiene 32:175-184.
CUNNINGHAM, W. P. AND M. A. CUNNINGHAM. 2009a. Economics and urbanization.
In Principles of environmental science: Inquiry and applications. McGraw Hill Companies,
New York, New York, pp. 328-351.
_____ AND _____. 2009b. Environmental health and toxicology. In Principles of
environmental science: Inquiry and applications. McGraw Hill Companies, New York, New
York, pp. 175-198.
ELMORE, S. K., M. J. LANCASTER, J. ANDERSON, J. SWANSON, M. CRANDELL, L.
HARAMIS, P. GRIMSTAD, C. JONES, AND U. KITRON. 2000. LaCrosse encephalitis
infection patterns in chipmunks and squirrels in Peoria, Illinois. American Journal of Tropical
Medicine and Hygiene 62(3):374.
ESRI (ENVIRONMENTAL SYSTEMS RESEARCH INSTITUTE). 1996. ArcView® GIS: The
geographic information system for everyone. Redlands, California.
GRIMSTAD, P. R. 1988. California group virus disease. In The arboviruses: Epidemiology and
ecology, Volume 2, T. P. Monath (ed). CRC Press, Boca Raton, Florida, pp. 99-136.
_____. 1994. California group viral infections. In Handbook of zoonoses, Section B viral, G.
W. Beran (ed). CRC Press, Boca Raton, Florida, pp. 71-79.
_____, D. G. WILLIAMS, AND S. M. SCHMITT. 1987. Infection of white-tailed deer
(Odocoileus virginianus) in Michigan with Jamestown Canyon virus (California Serogroup) and
the importance of maternal antibody viral maintenance. Journal of Wildlife Diseases
23(1):12-22.

85
HEARD, P. B., M. ZHANG, AND P. R. GRIMSTAD. 1990. Isolations of Jamestown Canyon
Virus (California Serogroup) from Aedes mosquitoes in an enzootic focus in Michigan. Journal
of the American Mosquito Control Association 6:461-468.
HOLLIS, K. M. 2011. Epidemiology of suburban deer. Ph.D. Thesis. University of Illinois,
Urbana-Champaign.
JOLY, D. O., C. A. RIBIC, J. A. LANGENBERG, K. BEHELER, C. A. BATHA, B. J. DHUEY,
R. E. ROLLEY, G. BARTELT, T. R. VAN DEELEN, AND M. D. SAMUEL. 2003. Chronic
wasting disease in free-ranging Wisconsin white-tailed deer. Emerging Infectious Diseases
9(5):599-601.
JONES, K. E., N. G. PATEL, M. A. LEVY, A. STOREYGARD, D. BALK, J. L. GITTLEMAN,
AND P. DASZAK. 2008. Global trends in emerging infectious diseases. Nature 451:990-993.
KITRON, U., C. J. JONES, J. K. BOUSEMAN, J. A. NELSON, AND D. L. BAUMGARTNER.
1992. Spatial analysis of the distribution of Ixodes dammini (Acari: Ixodidae) on white-tailed
deer in Ogle County, Illinois. Journal of Medical Entomology 29:259-266.
_____, J. MICHAEL, J. SWANSON, AND L. HARAMIS. 1997. Spatial analysis of the
distribution of LaCrosse encephalitis in Illinois, using a geographic information system and local
and global spatial statistics. Journal of Tropical Medicine and Hygiene 57(4):469-475.
KULLDORFF, M. 2002. SaTScan® user guide for version 3.0. National Cancer Institute,
Bethesda, Maryland, 59 pp.
_____, W. F. ATHAS, E. J. FEUER, B. A. MILLER, AND C. R. KEY. 1998. Evaluating
cluster alarms: A space-time statistic and brain cancer in Los Alamos. American Journal of
Public Health 88:1377-1380.

86
_____, E. J. FEUER, B. A. MILLER, AND L. S. FREEDMAN. 1997. Breast cancer clusters in
the northeastern United States: A geographic analysis. American Journal of Epidemiology
146:161-170.
_____ AND N. NAGARWALLA. 1995. Spatial disease clusters: Detection and inference.
Statistics in Medicine 14:799-810.
LEDGENDRE, P. AND M. J. FORTIN. 1989. Spatial pattern and ecological analysis.
Vegetation 80(2):101-138.
LOCKHART, J. M., W. R. DAVIDSON, D. E. STALLKNECHT, AND J. E. DAWSON. 1996.
Site-specific geographic association between Amblyomma americanum (Acari: Ixodidae)
infestations and Ehrlichia chaffeensis-reactive (Rickettsiales: Ehrlichieae) antibodies in
white-tailed deer. Journal of Medical Entomology 33:153-158.
NASCI, R. S. 1985. Local variation in blood feeding by Aedes triseriatus and Aedes hendersoni
(Diptera: Culicidae). Journal of Medical Entomology 22:619-623.
NEITZEL, D. F. AND P. R. GRIMSTAD. 1991. Serological evidence of California group and
cache valley virus infection in Minnesota white-tailed deer. Journal of Wildlife Diseases
27(2):230-237.
OSORIO, J. E., M. S. GODSEY, G. R., DEFOLIART, AND T. M. YUILL. 1996. LaCrosse
viremias in white-tailed deer and chipmunks exposed by injection or mosquito bite. American
Journal of Tropical Medicine and Hygiene 54(4):338-342.
PFEIFFER, D. U. 2002. Veterinary epidemiology – An introduction. University of London,
62 pp.

87
SIEGEL, J. P., U. KITRON, AND J. K. BOUSEMAN. 1991. Spatial and temporal distribution
of Ixodes dammini (Acari: Ixodidae) in a northwestern Illinois state park. Journal of Medical
Entomology 28:101-104.
SMITH, K. L., V. DEVOS, H. BRYDEN, L. B. PRICE, M. E. HUGH-JONES, AND P. KEIM.
2000. Bacillus anthracis diversity in Kruger National Park. Journal of Clinical Microbiology
38:3780-3784.
VIEL, J-F., P. ARVEUX, J. BAVEREL, AND J.-Y. CAHN. 2000. Soft-tissue sarcoma and
non-Hodgkin’s lymphoma clusters around a municipal solid waste incinerator with high dioxin
emission levels. American Journal of Epidemiology 152:13-19.
WARD, M. P. AND T. E. CARPENTER. 2000. Analysis of space-time clustering in veterinary
epidemiology. Preventive Veterinary Medicine 43:225-237.
WILSON, M. L. AND J. E. CHILDS. 1997. Vertebrate abundance and the epidemiology of
zoonotic diseases. In The science of overabundance: Deer ecology and population management,
W. J. McShea, H. B. Underwood, and J. H. Rappole (eds). Smithsonian Institution Press,
Washington D. C., pp. 224-248.
WOBESER, G. A. 2007. Disease in wild animals: Investigation and management, 2nd
edition.
Springer-Verlag, Heidelberg, Germany, 393 pp.

88
MANAGEMENT RECOMMENDATIONS
Management of zoonoses and disease in wild mammals should be sustainable, based on
sound science, and balance the requirements for preserving biodiversity while protecting the
health of humans, domestic pets, and livestock. The use of wildlife as sentinels is a valuable
approach to surveillance for emerging infectious diseases. This study of suburban white-tailed
deer suggests a proactive approach for zoonotic surveillance and validates deer as an effective
biomonitor. Results will provide baseline information to state and county agencies while
bringing worldwide awareness to suburban zoonoses in the United States. Understanding the
seroprevalence of pathogens is necessary to make informed decisions in management of
wildlife-human-pet interactions. This information will allow the appropriate agencies to
implement control and management plans while circulating public health information.
Results from this study indicate the presence and prevalence for pathogens in Cook
County Forest Preserves that may cause Jamestown Canyon (JC) and LaCrosse (LAC)
encephalitis, toxoplasmosis, and leptospirosis. Recommendations for wildlife management and
surveillance include, 1) Continue culling programs to maintain deer populations at low densities.
This will reduce animal to animal contact and pathogen transmission, potential human exposures,
and hosts for parasites and vectors. 2) Continue county-wide surveillance of wildlife populations
including deer for zoonoses and emerging infectious diseases. This will allow scientists and
managers to distinguish between endemic and emerging or epidemic conditions. 3) Yearling
deer should be sampled for new annual exposures and adults for long-term repeated exposures.
Sampling for fawns may not indicate immediate exposures for all zoonoses. 4) Use identified
“hot spots” for specific pathogen monitoring while continuing to identify new locations from
surveillance and as human cases occur. 5) Implement and focus monitoring and control

89
programs for vectors like mosquitoes while considering breeding habitats. 6) Reduce
human-wildlife-pet interactions to decrease possible zoonotic exposures, especially wildlife
feeding. 7) Conduct fine-scale habitat analysis to examine relationships between vectors and
pathogens. 8) Sampling should increase after floods and during abnormal seasonal weather to
monitor for changes in vectors and zoonoses. 9) Deer are the primary vertebrate host for JC
virus and likely amplifiers for LAC virus transmission. Additional research is needed to better
understand the ecological relationships among vectors, deer, and pathogens.
Additional recommendations for the public, public health agencies, and veterinarians
include, 1) Proper hand washing for all people visiting forest preserves to decrease the risk of
infection through ingestion of pathogens. 2) Public education about common forms of zoonotic
exposures in forest preserves and the common signs/symptoms of human infection. 3) Inform
the public to reduce exposure to mosquitoes by remaining on forest preserve trails and direct or
indirect use of chemical repellents. 4) Public education about the exposure to zoonoses from
natural water resources like ponds, lakes and rivers. 5) Keep all pets on a leash to reduce
possible exposure to zoonotic pathogens and vectors, including bringing vectors and parasites
into the home. 6) Deer meat provided by the county to food depositories should be frozen in
small packages (~2.2-4.6 kg) immediately after processing and cooked thoroughly before
serving. 7) Clear brush and debris along trails to reduce habitat available for mosquito vectors.
8) Implement surveillance programs for human and pet zoonoses. Overlapping this information
with deer surveillance will facilitate better decision making.

90
Appendix A. Suburban white-tailed deer (n=245) seropositive for Babesia spp. in Cook and
DuPage Counties, Chicago, Illinois, USA, 1996-97.
______________________________________________________________________
Variables N Positive deer
______________________________________________________________________
Age
Fawn 53 0
Yearling 71 0
Adult 121 1
Sex
Female 164 1
Male 81 0
Cook County site
Beck Lake 26 0
Bemis 14 0
Busse (North and South) 31 0
Camp Pine 22 0
Camp Sagawau 5 0
Crab Tree Nature Center 12 0
Dam 1 18 0
Palos 52 1
River Trail Nature Center 5 0
Somme 5 0
Swallow Cliff 15 0
Zander-Jurgenson 7 0
DuPage County site
Blackwell 4 0
Greene Valley 8 0
Herrick Lake 1 0
Timber Ridge 1 0
Waterfall Glen 19 0
Year
1996-97 245 1
Month
December 33 0
January 62 0
February 50 0
March 99 1
August a 1 0
______________________________________________________________________ a Radio-collared animal found dead in August and sampled.
Palos
Des Plaines
Des Plaines

91
Appendix B. Suburban white-tailed deer (n=1033) seropositive for Cache Valley virus in Cook
and DuPage Counties, Chicago, Illinois, USA, 1995-99.
______________________________________________________________________
Variables Na Positive deer
______________________________________________________________________
Age
Fawn 313 97
Yearling 230 92
Adult 490 172
Sex
Female 739 272
Male 294 89
Cook County site
Beck Lake 107 41
Bemis 57 25
Black Partridge 3 0
Busse (North and South) 12 49
Camp Pine 83 35
Camp Sagawau 19 8
Crab Tree Nature Center 47 15
Dam 1 50 13
Palos 211 51
Popular Creek 1 0
River Trail Nature Center 15 7
Somme 19 4
Swallow Cliff 68 19
Zander-Jurgenson 50 19
DuPage County site
Blackwell 8 3
Greene Valley 34 8
Herrick Lake 17 7
Pratt’s Wayne Woods 5 3
Timber Ridge 11 5
West DuPage Woods 6 3
Waterfall Glen 100 41
Winfield Mounds 3 2
Wood Ridge 6 3
Year
1995-96 178 35
1996-97 244 58
1997-98 397 150
1998-99 214 118

92
Appendix B. Continued.
______________________________________________________________________
Variables Na Positive deer
______________________________________________________________________
Month
December 122 48
January 276 102
February 316 110
March 318 101
Augustb 1 0
______________________________________________________________________ aIncludes non-determined samples.
bRadio-collared animal found dead in August and sampled.

93
Appendix C. Suburban white-tailed deer (n=49) seropositive for Ehrlichia chaffeensis in Cook
County, Chicago, Illinois, USA, 1995-96.
______________________________________________________________________
Variables N Positive deer
______________________________________________________________________
Age
Fawn 13 1
Yearling 8 0
Adult 28 0
Sex
Female 38 0
Male 11 1
Cook County site
Beck Lake 11 0
Bemis 3 0
Busse (North and South) 6 0
Camp Pine 3 0
Camp Sagawau 1 0
Crab Tree Nature Center 2 0
Palos 12 0
Somme 4 1
Swallow Cliff 2 0
Zander 5 0
Year
1995-96 49 1
Month
December 5 0
January 14 0
February 16 0
March 14 1
_______________________________________________________________________

94
Appendix D. Suburban white-tailed deer (n=172) a seropositive for Epizootic Hemorrhagic virus
in Cook County, Chicago, Illinois, USA, 1995-96.
______________________________________________________________________
Variables N Positive deer
______________________________________________________________________
Age
Fawn 48 1
Yearling 41 0
Adult 83 0
Sex
Female 123 0
Male 49 1
Cook County site
Beck Lake 30 0
Bemis 5 0
Black Partridge 3 1
Busse (North and South) 12 0
Camp Pine 18 0
Camp Sagawau 4 0
Crab Tree Nature Center 6 0
Dam 1 9 0
Palos 42 0
Poplar Creek 1 0
River Trail Nature Center 3 0
Somme 13 0
Swallow Cliff 13 0
Zander 13 0
Year
1995-96 172 1
Month
December 27 0
January 34 0
February 71 1
March 40 0
______________________________________________________________________ aAll deer tested negative for bluetongue virus.

95
Appendix E. Suburban white-tailed deer (n=88) seropositive for Escherichia coli spp. in Cook
County, Chicago, Illinois, USA, 1996-97.
______________________________________________________________________
Variables N Positive deer
______________________________________________________________________
Age
Fawn 22 13
Yearling 20 18
Adult 46 41
Sex
Female 67 55
Male 21 17
Cook County site
Beck Lake 1 1
Bemis 6 5
Busse (North and South) 14 11
Camp Pine 8 6
Camp Sagawau 1 1
Crab Tree Nature Center 3 3
Dam 1 10 8
Palos 25 20
Somme 1 1
Swallow Cliff 14 12
Zander-Jurgenson 5 4
Year
1996-97 88 72
Month
January 7 6
February 30 25
March 51 41
______________________________________________________________________

96
Appendix F. Suburban white-tailed deer (n=1034) seropositive for Jamestown Canyon virus in
Cook and DuPage Counties, Chicago, Illinois, USA, 1995-99.
______________________________________________________________________
Variables Na Positive deer
______________________________________________________________________
Age
Fawn 314 14
Yearling 230 85
Adult 490 214
Sex
Female 740 233
Male 294 80
Cook County site
Beck Lake 107 42
Bemis 57 14
Black Partridge 3 0
Busse (North and South) 113 26
Camp Pine 83 38
Camp Sagawau 19 5
Crab Tree Nature Center 47 19
Dam 1 51 22
Palos 211 63
Popular Creek 1 0
River Trail Nature Center 15 5
Somme 19 5
Swallow Cliff 68 17
Zander-Jurgenson 50 13
DuPage County site
Blackwell 8 3
Greene Valley 34 5
Herrick Lake 17 5
Pratt’s Wayne Woods 5 2
Timber Ridge 11 4
West DuPage Woods 6 1
Waterfall Glen 100 23
Winfield Mounds 3 0
Wood Ridge 6 1
Year
1995-96 178 28
1996-97 244 97
1997-98 398 142
1998-99 214 46

97
Appendix F. Continued.
______________________________________________________________________
Variables Na Positive deer
______________________________________________________________________
Month
December 122 37
January 276 70
February 316 95
March 319 111
Augustb 1 0
______________________________________________________________________ aIncludes non-determined samples.
bRadio-collared animal found dead in August and sampled.

98
Appendix G. Suburban white-tailed deer (n=1034) seropositive for LaCrosse virus in Cook and
DuPage Counties, Chicago, Illinois, USA, 1995-99.
______________________________________________________________________
Variables Na Positive deer
______________________________________________________________________
Age
Fawn 314 14
Yearling 230 18
Adult 490 48
Sex
Female 740 70
Male 294 10
Cook County site
Beck Lake 107 10
Bemis 57 3
Black Partridge 3 0
Busse (North and South) 113 11
Camp Pine 83 2
Camp Sagawau 19 0
Crab Tree Nature Center 47 1
Dam 1 51 2
Palos 211 15
Popular Creek 1 0
River Trail Nature Center 15 0
Somme 19 1
Swallow Cliff 68 7
Zander-Jurgenson 50 5
DuPage County site
Blackwell 8 0
Greene Valley 34 3
Herrick Lake 17 2
Pratt’s Wayne Woods 5 0
Timber Ridge 11 1
West DuPage Woods 6 1
Waterfall Glen 100 14
Winfield Mounds 3 0
Wood Ridge 6 2
Year
1995-96 178 9
1996-97 244 5
1997-98 398 41
1998-99 214 25

99
Appendix G. Continued.
______________________________________________________________________
Variables Na Positive deer
______________________________________________________________________
Month
December 122 9
January 276 27
February 316 32
March 319 12
Augustb 1 0
_____________________________________________________________________ aIncludes non-determined samples.
bRadio-collared animal found dead in August and sampled.

100
Appendix H. Suburban white-tailed deer (n=1032) seropositive for Leptospira spp. in Cook and
DuPage Counties, Chicago, Illinois, USA, 1995-99.
______________________________________________________________________
Variables N Positive deer
______________________________________________________________________
Age
Fawn 311 25
Yearling 231 42
Adult 490 90
Sex
Female 739 110
Male 293 47
Cook County site
Beck Lake 107 16
Bemis 57 7
Black Partridge 3 0
Busse (North and South) 113 18
Camp Pine 83 11
Camp Sagawau 19 2
Crab Tree Nature Center 47 7
Dam 1 51 4
Palos 210 41
Popular Creek 1 0
River Trail Nature Center 15 4
Somme 19 2
Swallow Cliff 68 6
Zander-Jurgenson 50 10
DuPage County site
Blackwell 8 2
Greene Valley 34 4
Herrick Lake 17 1
Pratt’s Wayne Woods 5 0
Timber Ridge 11 3
West DuPage Woods 6 1
Waterfall Glen 99 16
Winfield Mounds 3 0
Wood Ridge 6 2
Year
1995-96 178 12
1996-97 245 29
1997-98 395 55
1998-99 214 61

101
Appendix H. Continued.
______________________________________________________________________
Variables N Positive deer
______________________________________________________________________
Month
December 121 18
January 275 29
February 315 43
March 320 67
August a 1 0
______________________________________________________________________ aRadio-collared animal found dead in August and sampled.

102
Appendix I. Suburban white-tailed deer (n=405) a seropositive for Neospora caninum in Cook
and DuPage Counties, Chicago, Illinois, USA, 1995-98.
______________________________________________________________________
Variables N Positive deer
______________________________________________________________________
Age
Fawn 148 54
Yearling 66 31
Adult 191 81
Sex
Female 298 118
Male 107 48
Cook County site
Beck Lake 26 11
Bemis 18 9
Busse (North and South) 37 6
Camp Pine 29 13
Camp Sagawau 5 2
Crab Tree Nature Center 17 4
Dam 1 18 5
Palos 75 41
River Trail Nature Center 4 3
Somme 1 0
Swallow Cliff 21 14
Zander-Jurgenson 10 3
DuPage County site
Blackwell 5 3
Greene Valley 20 8
Herrick Lake 14 5
Pratt’s Wayne Woods 5 3
Timber Ridge 10 1
West DuPage Woods 6 5
Waterfall Glen 75 29
Winfield Mounds 3 1
Wood Ridge 6 0
Year
1995-96 1 0
1996-97 33 16
1997-98 371 150

103
Appendix I. Continued.
______________________________________________________________________
Variables N Positive deer
______________________________________________________________________
Month
December 49 17
January 105 43
February 118 48
March 132 58
August b
1 0
______________________________________________________________________ aData published by J. P. DUBEY, K. HOLLIS, S. ROMAND, P. THULLIEZ, O. C. H. KWOK,
L. HUNGERFORD, C. ANCHOR, AND D. ETTER. 1999. High prevalence of antibodies to
Neospora caninum in white-tailed deer (Odocoileus virginianus). International Journal of
Parasitology 29:1709-1711. bRadio-collared animal found dead in August and sampled.
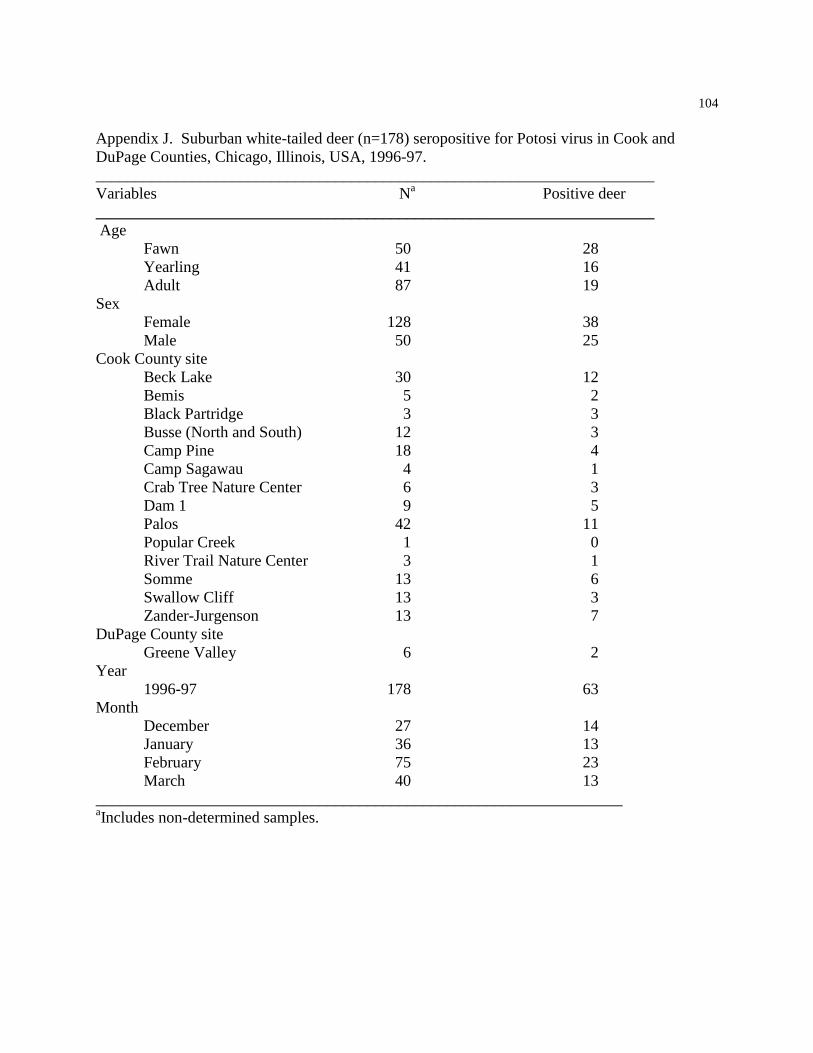
104
Appendix J. Suburban white-tailed deer (n=178) seropositive for Potosi virus in Cook and
DuPage Counties, Chicago, Illinois, USA, 1996-97.
______________________________________________________________________
Variables Na Positive deer
______________________________________________________________________
Age
Fawn 50 28
Yearling 41 16
Adult 87 19
Sex
Female 128 38
Male 50 25
Cook County site
Beck Lake 30 12
Bemis 5 2
Black Partridge 3 3
Busse (North and South) 12 3
Camp Pine 18 4
Camp Sagawau 4 1
Crab Tree Nature Center 6 3
Dam 1 9 5
Palos 42 11
Popular Creek 1 0
River Trail Nature Center 3 1
Somme 13 6
Swallow Cliff 13 3
Zander-Jurgenson 13 7
DuPage County site
Greene Valley 6 2
Year
1996-97 178 63
Month
December 27 14
January 36 13
February 75 23
March 40 13
__________________________________________________________________ aIncludes non-determined samples.

105
Appendix K. Suburban white-tailed deer (n=1024) seropositive for Toxoplasma gondii in Cook
and DuPage Counties, Chicago, Illinois, USA, 1995-99.
______________________________________________________________________
Variables N Positive deer
______________________________________________________________________
Age
Fawn 310 85
Yearling 229 117
Adult 485 296
Sex
Female 734 366
Male 290 132
Cook County site
Beck Lake 107 65
Bemis 57 39
Black Partridge 3 2
Busse (North and South) 112 47
Camp Pine 83 54
Camp Sagawau 18 12
Crab Tree Nature Center 47 16
Dam 1 51 41
Palos 210 83
Popular Creek 1 1
River Trail Nature Center 15 11
Somme 17 8
Swallow Cliff 68 16
Zander-Jurgenson 49 22
DuPage County site
Blackwell 8 4
Greene Valley 28 12
Herrick Lake 17 5
Pratt’s Wayne Woods 5 1
Timber Ridge 11 7
West DuPage Woods 6 4
Waterfall Glen 102 42
Winfield Mounds 3 1
Wood Ridge 6 5
Year
1995-96 168 69
1996-97 245 134
1997-98 399 204
1998-99 212 91

106
Appendix K. Continued.
______________________________________________________________________
Variables N Positive deer
______________________________________________________________________
Month
December 123 77
January 272 143
February 311 142
March 317 136
August a 1 0
______________________________________________________________________ aRadio-collared animal found dead in August and sampled.

107
Appendix L. Map of DuPage County Forest Preserves, Chicago, Illinois, USA, 1995-99. White-
tailed deer were sampled from the following study sites: 1=Pratt’s Wayne Woods, 2=Timber
Ridge, 3=West DuPage Woods, 4=Winfield Mounds, 5=Blackwell, 6=Herrick Lake, 7=Greene
Valley, 8= Waterfall Glen, and 9=Wood Ridge.
DuPage County
7
5
6
1
2
3
8
4
9
km
DuPage County Land Cover Legend
Agriculture
Forest
Savanna-Grass
Urban
Water
Wetland

108
Appendix M. Fragstats variables included in the original analysis to model habitat (forest,
agriculture, savanna-grass, urban, water, wetland) for radio-collared and culled suburban
white-tailed deer from Chicago, Illinois, USA, 1995-99.
________________________________________________________
Variable (measurement) Abbreviation
________________________________________________________
Class area (ha) CA
Total landscape area (ha) TA
Percent of landscape %Land
Largest patch index LPI
Number of patches NP
Patch density (#/100 ha) PD
Mean patch size (ha) MPS
Patch size standard deviation (ha) PSSD
Patch size coefficient of variation (%) PSCV
Total edge (m) TE
Edge density (m/ha) ED
Landscape shape index LSI
Mean shape index MSI
Area weighted mean shape index AWMSI
Double log fractal dimension DLFD
Mean patch fractal dimension MPFD
Area weighted mean patch fractal dimension AWMPFD
Core area percent of landscape C%Land
Total core area (ha) TCA
Number of core areas NCA
Core area density (#/100 ha) CAD
Mean core area per patch (ha) MCA1
Patch core area standard deviation (ha) CASD1
Patch core area coefficient of variation (%) CACV1
Mean area per disjunct core (ha) MCA2
Disjunct core area standard deviation (ha) CASD2
Disjunct core area coefficient of variation (%) CACV2
Total core area index (%) TCAI
Mean core area index (%) MCAI
Mean nearest neighborhood distance (m) MNN
Nearest neighborhood standard deviation (m) NNSD
Nearest neighborhood coefficient of variation (%) NNCV
Interspersion and juxtaposition index (%) IJI
________________________________________________________