Embed Size (px)
Citation preview

Epidemiology of TB in Ireland
National Tuberculosis Conference May 2011
Dr Joan O’Donnell

Outline of Presentation
Surveillance
Epidemiology
Current challenges– Migration patterns– MDR-TB and XDR-TB– TB associated with HIV infection
Ireland: Towards global eliminationConclusions

Surveillance (1)TB is statutorily notifiable by both clinicians and laboratories since 2003It is also mandatory to report outbreaks of TBEnhanced data on TB collected since 1998Incorporated onto CIDR from January 2011EU case definition will be applied (P. 6, National TB Guidelines) Latent TB infection is not statutorily notifiable

Surveillance (2) Data:Case based, disaggregate and anonymised
Variables: Demographics including occupation, place of residence and country of birth, asylum seeker status, clinical (site of disease radiological), risk factors, previous history of TB and BCG, microbiology (smear, culture, histology, DST results and PCR), outcome data.
Outputs:Quarterly and Annual ReportsAnnual data to ECDC and WHO

EpidemiologyMarked decline in the number of cases since 1950sLowest rate in 2001 (9.7/100,000)
HOWEVER Decline not Sustained More recent rates:– 2007: 11.3/100,000 (480 cases)– 2008: 11.0/100,000 (468 cases)– 2009: 11.1/100,000 (472 cases) (Provisional)– 2010: 10.1/100,000 (427 cases) (Provisional)Inner city pockets of high incidence (2008)– HSE-East
Dublin South City: 29.8/100,000Dublin West: 28.4/100,000Dublin North Central: 24.5/100,000
– HSE-South (North Lee): 22.1/100,000

National TB notifications, rate & 3 year moving average 1991-2010*
*2009 & 2010 provisional data only


Source: WHO

Source: ECDC


Bacteriological results 2008In 2008:
312 (66.7%) of all cases were culture positive Species were reported in 306 (98.1%) culture confirmed
cases:Mycobacterium tuberculosis 294 (96.1%)Mycobacterium bovis 12 (3.9%)Mycobacterium africanum 0 (0.0%)
Pulmonary Cases:158 (47.0%) were positive for at least one AFB
microscopy244 (72.6%) were culture positive
EU monitoring framework: Target= ≥ 80% culture confirmation among new pulmonary TB cases.
In 2009, 58% of all TB cases were culture confirmed, however the level differed widely across countries (range: 44.0%–100.0%).Only 7 countries reached the target.
12
0
10
20
30
40
50
60
70
80
90
100
% o
f all
notif
ied
TB c
ases
* Luxembourg reported only culture-confirmed cases
Figure 3: Percentage of culture confirmation among all reported TB cases, 2009

Treatment outcome data 2008Outcomes reported for 414 (88.5%) of all 468 cases and in 91.1% of Sputum smear positive cases

Treatment Outcomes 2000-2008
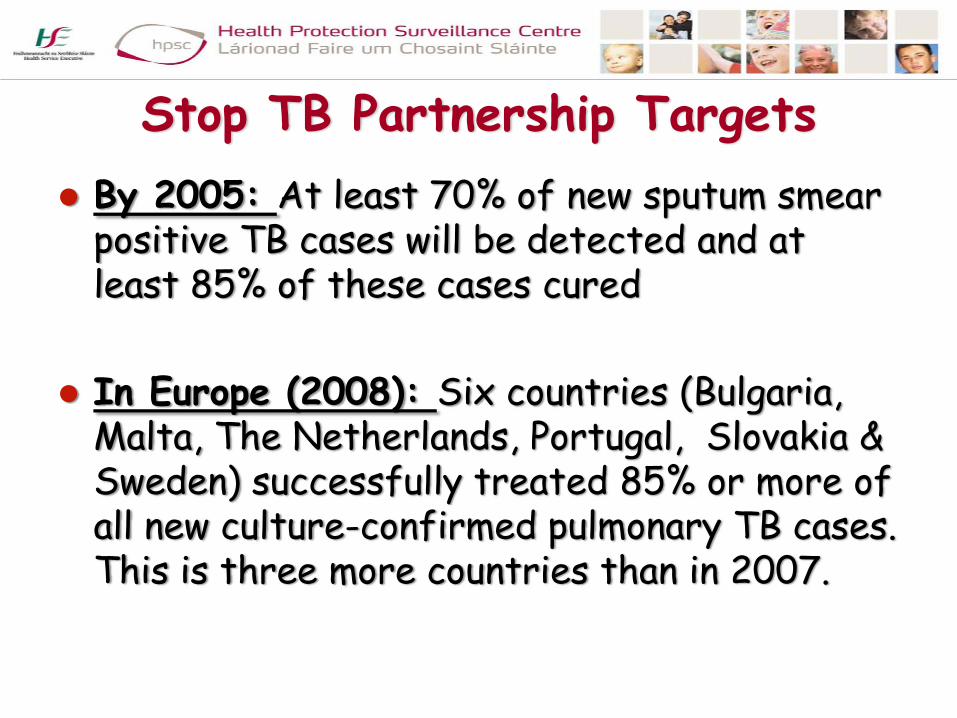
Stop TB Partnership TargetsBy 2005: At least 70% of new sputum smear positive TB cases will be detected and at least 85% of these cases cured
In Europe (2008): Six countries (Bulgaria, Malta, The Netherlands, Portugal, Slovakia & Sweden) successfully treated 85% or more of all new culture-confirmed pulmonary TB cases. This is three more countries than in 2007.

In 2009, six countries met the treatment success rate goal of 85%
Complete and successful TB treatment contributes at reducing disease transmission and preventing emergence of resistant strains.
16
71 to 84%
≥ 85%
60 to 70%
< 60%
Not included or not reporting
Figure 6: Treatment success rate among new laboratory-confirmed pulmonary TB cases diagnosed in 2008, EU/EEA

Current Challenges
Migration PatternsMDR-TB/XDR-TBTB cases associated with HIV infection

Migration PatternsProportion of immigrant cases has more than doubled since 2001 – 2001: 17.0% of cases.– 2008: 43.6% of cases– 2009: 40.5% of cases (Provisional)– 2010: 39.6% of cases (Provisional)In 2008:– The majority of foreign-born cases were from Asia
(52.0%) & Africa (27.5% ) with 17.2% from Europe In 2008:– The rate in the indigenous population was 7.4/100,000– The rate in foreign born population was 33.3/100,000

TB rates per 100,000 population by geographic origin, 1998 to 2010*

TB cases and rates by age group and geographic origin:2008

TB cases and rates per 100,000 population by HSE area and geographic origin, 2008

Proportion of TB notifications of foreign origin in Europe:2009
Source: ECDC

Drug Resistant CasesThe proportion of drug resistant cases is still low In 2008:– 3.4% (16) of total cases were resistant to isoniazid– MDR-TB: 0.4% (2 cases) of total cases– No XDR-TB case notified– No MDR-TB or XDR-TB cases notified in 2009– 2 MDR-TB cases notified in 2010 (Provisional)
An increasing challenge due to globalisationIn 2009, 28 EU countries: – Overall proportion of MDR-TB cases: 5.3%– Baltic States: MDR (17.4%-28.0%)– Romania: 11%– MDR TB among previously untreated cases: 2.8% ranging from
0-22% (Highest in Baltic states: 10-22%)

MDR TB cases- 2002 to 2010*
21 cases of MDR-TB1 case of XDR-TB (2005)
Previous History of TB• 6 cases (28.6%)
Place of birth•15 (71%) foreign born•6 (29%) Irish

Proportion of TB cases with isoniazid resistance and multidrug resistance, 2002 to 2010*

Percentage of notified TB cases with primary multidrug resistance, EU/EEA, 2009
Percentage of notified TB cases with primary multidrug resistance, EU/EEA, 2008
Source: ECDC

TB/HIV casesData on HIV status of TB cases is incomplete and
an underestimateHIV/AIDS: to become statutorily notifiable (2011)– Unable to link TB and HIV cases at present
New guidance recommends improving this surveillance Inclusion of TB data on CIDR will make it easier to identify TB/HIV cases-more accurate estimate

HIV co-infected cases 2000-2009*
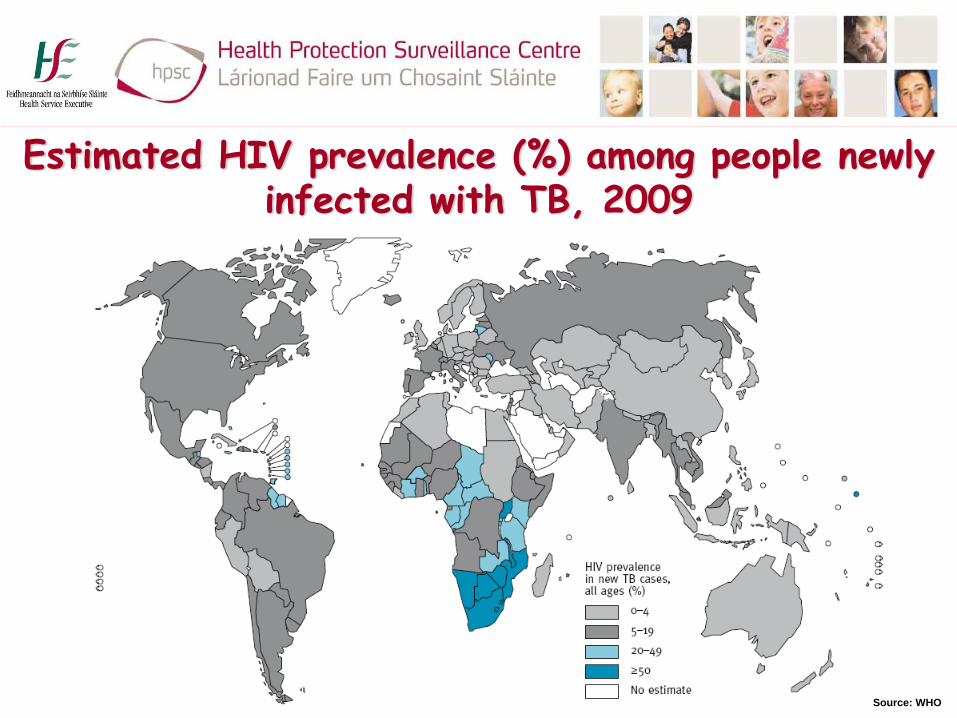
Estimated HIV prevalence (%) among people newly infected with TB, 2009
Source: WHO
TB EliminationElimination of TB
Move towards elimination as proposed by WHO STOP TB strategy– (< 1 case per million population)– 4 cases of TB annually by 2050 (Irish context)
Global TB control is required to achieve TB elimination in countries with low incidence– Borgdorff MW et al. Emerging Infectious
Diseases Vol 11 (No. 4) April 2005

Towards EliminationMany EU countries: low TB notification rate at < 20/100,000 cases. – Need to consolidate efforts to move
towards the elimination goalCountries considered to be at the elimination phase if the case notification rate < 20/100,000 and the case notification rate has been decreasing over the previous five years

ECDC Indicators (November 2010)Trends in:1. Case notification rate
1. A mean declining trend in the case notification rate over the previous five years allowing for random variation in the context where case finding efforts remained constant or increased
2. MDR-TB case notification rate1. A mean declining trend in MDR-TB case
notification rate over the previous five years allowing for random variation in the context where case finding efforts remained constant or increased

TB Case Notification Rate

MDR-TB Case Notification Rate

ECDC Indicators (November 2010)3. Ratio of notification rates in
children to adults3. A mean declining trend in the ratio of
the notification rate in children to that in adults over the previous ten years allowing for annual random variation
4. The mean age of TB cases 1. An increasing trend in the mean age of
TB cases over the previous 10 years
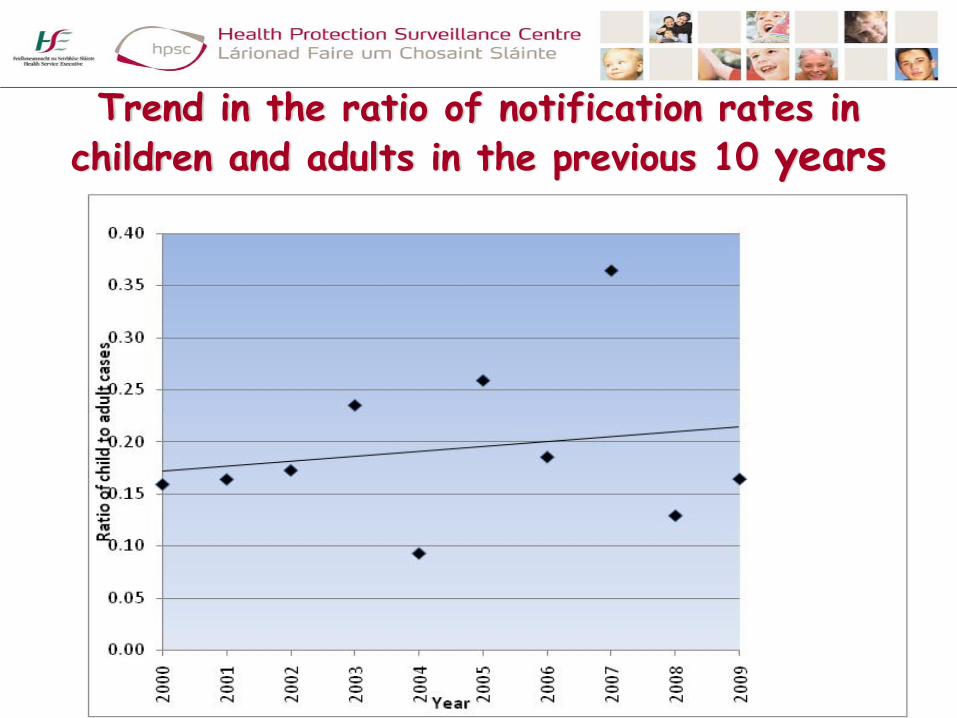
Trend in the ratio of notification rates in children and adults in the previous 10 years

Trend in Mean Age of TB cases in the previous 10 years

TB diagnosis in children: a continuing challenge
Figure 2: Notification rates of childhood TB in low-incidence and high/intermediate-incidence countries in the EU/EEA, 2000–2009
* Defined as incidence < 20 per 100 000** Defined as incidence > 20 per 100 000
A decline or stabilisation of trends was recorded in high- and intermediate-incidence countries** (13 to 20 per 100 000 child population).Low-incidence countries* have recorded an increase in rates in all paediatric age groups.
0
2
4
6
8
10
12
14
16
18
20
2000 2001 2002 2003 2004 2005 2006 2007 2008 2009
Notif
icat
ion
rate
s (p
er 1
00 0
00
popu
latio
n)
Intermediate/high-incidence countries
Low-incidence countries
EU/EEA

Conclusions (1)TB notification rates dropped at the beginning of the decade, however, not sustained Regional variation with urban pockets with higher notification rates similar to other EU countries Increasing number of foreign born cases with lower rates in indigenous populationMean age of foreign born cases younger than indigenous casesMost frequently reported risk factors were– Alcohol misuse– Born in country of high TB endemnicity – Being a contact of an active case– Immunosuppressive illness

Conclusions (2)Ratio of notification rates in adults and children increasing slightly– Similar in other European low incidence countries
Trend in mean age of cases decreasing slightly Low rates of MDR-TB and XDR-TB

Conclusions (2)67% all cases are culture positive– 73% of pulmonary cases are culture positiveOutcome data on 89% cases– 72% of all TB cases completed treatment– 76% of smear positive TB cases completed
treatment

Challenges
To achieve the target of ≥80% culture confirmation among new pulmonary casesTo achieve the Stop TB target of detecting at least 70% of new sputum smear positive TB cases and that at least 85% of these cases are cured To further improve outcome dataTo reach the elimination target by 2050

Acknowledgments
HPSC: Sarah Jackson, Lorraine Hickey, Piaras O Lorcain, Ajay Oza and Darina O FlanaganDepartments of Population HealthCliniciansLaboratoriesEuroTB and WHO colleagues