Embed Size (px)
Citation preview

Acc
epte
d A
rtic
le
This article has been accepted for publication and undergone full peer review but has not been through the copyediting, typesetting, pagination and proofreading process, which may lead to differences between this version and the Version of Record. Please cite this article as doi: 10.1111/1755-0998.12247 This article is protected by copyright. All rights reserved.
Received Date : 02-Dec-2013
Revised Date : 19-Feb-2014
Accepted Date : 28-Feb-2014
Article type : Resource Article
Epigenetic estimation of age in humpback whales
Andrea M Polanowski1, Jooke Robbins2, David Chandler3 and Simon N Jarman1*
1. Australian Antarctic Division, 203 Channel Highway, Kingston, TAS, 7050, Australia
2. Center for Coastal Studies, 5 Holway Avenue, Provincetown, MA, 02657, USA
3. Australian Genome Research Facility, 50 Murray St, Perth, WA, 6000, Australia
* For correspondence:
Australian Antarctic Division
203 Channel Highway
Kingston
TAS
7050
Australia
Telephone: (+61) 362323174
Keywords: Age, DNA methylation, epigenetics, cetacean, population
Acc
epte
d A
rtic
le
This article is protected by copyright. All rights reserved.
Abstract
Age is a fundamental aspect of animal ecology, but is difficult to determine in many species.
Humpback whales exemplify this as they have a lifespan comparable to humans, mature
sexually as early as four years and have no reliable visual age indicators after their first year.
Current methods for estimating humpback age cannot be applied to all individuals and
populations. Assays for human age have recently been developed recently based on age-
induced changes in DNA methylation of specific genes. We used information on age-
associated DNA methylation in human and mouse genes to identify homologous gene regions
in humpbacks. Humpback skin samples were obtained from individuals with a known year of
birth and employed to calibrate relationships between cytosine methylation and age. Seven of
37 cytosines assayed for methylation level in humpback skin had significant age-related
profiles. The three most age-informative cytosine markers were selected for a humpback
epigenetic age assay. The assay has an R2 of 0.787 (p = 3.04e-16) and predicts age from skin
samples with a standard deviation of 2.991 years. The epigenetic method correctly
determined which of parent-offspring pairs is the parent in more than 93% of cases. To
demonstrate the potential of this technique, we constructed the first modern age profile of
humpback whales off eastern Australia and compared the results to population structure five
decades earlier. This is the first epigenetic age estimation method for a wild animal species
and the approach we took for developing it can be applied to many other non model
organisms.
Introduction
Animal age is a determinant of many individual and population characteristics. Estimates of

Acc
epte
d A
rtic
le
This article is protected by copyright. All rights reserved.
age can be used to understand traits in wild animals such as reproductive potential (Clapham
1992), developmental processes (Cook et al. 2006) and factors affecting survival and
reproductive success (Chaloupka et al. 1999; Campana 2001). A common approach for age
estimation in wild animals that have not previously been encountered is to count annually
accrued features such as the growth rings found in fish otoliths that are widely used for
producing population age estimates for informing fishery management (Campana 2001).
Animals that cannot be lethally sampled provide a greater challenge as many have no
outward features that change with age. In these species, individuals can be marked artificially,
or records can be made of natural individual features in early life and the elapsed time
determined upon re-identification. Whale age estimation was important when whales were
the subject of commercial fisheries for monitoring population status (Chittleborough 1959,
1965). It continues to be important for monitoring the recovery of whale populations from the
effects of past harvesting (Chaloupka et al. 1999; Baker & Clapham 2004).
Humpback whales (Megaptera novaeangliae, 'humpbacks') are one of the best studied
cetacean species. However, they display no accurate visual markers for age after they are
weaned at about one year (Chittleborough 1959) and lack of age information continues to
limit our understanding of them. Sexual maturity is reached early in life and age at first
parturition can be as young as 5 years (Chittleborough 1965; Clapham 1992; Barlow &
Clapham 1997). The age of dead humpback whales can be estimated from ear plug growth
layer groups (GLGs), a waxy structure within the ear (Chittleborough 1959, 1965; Lockyer
1984; Gabriele et al. 2010); and baleen plate thickness or ovary condition (Chittleborough
1959). Humpbacks have a maximum verified lifespan of 95 years (Chittleborough 1965), if
single ear plug GLGs are considered to accrue annually (Gabriele et al. 2010). None of these
age estimation methods can be applied to live whales.
Acc
epte
d A
rtic
le
This article is protected by copyright. All rights reserved.
Age estimation methods for live humpbacks are based either on repeat photographic
identification, or minimally-invasive sampling of whale tissues. Humpbacks have natural
individual markings on the underside of the tail flukes that identify them (Chaloupka et al.
1999). Repeat sightings of whales whose natural markings were photographed as calves
allow age to be estimated (Gabriele et al. 2010). Humpback DNA is used for a wide range of
genetic analyses including population size by mark-recapture (Palsbøll et al. 1997; Rew et al.
2011), population structure (Baker et al. 1993; Schmitt et al. 2013), population assignment of
individuals (Pomilla & Rosenbaum 2005), effective population size (Roman & Palumbi
2003), kinship (Valsecchi et al. 2002) and sex determination (Morin et al. 2005). Attempts to
use humpback whale DNA for age estimation have so far focused on telomere length assays
(Dennis 2006; Olsen et al. 2012) but these suffer from numerous sources of measurement
error (Olsen et al. 2012); factors other than age that cause telomere length changes (Dunshea
et al. 2011); and a wide range of inherited telomere lengths at birth (Kappei & Londoño-
Vallejo 2008). In cetaceans, there is an additional problem in that 'telomeric' repeat sequences
occur in non-telomeric regions (Dunshea et al. 2011). The only molecular method currently
available for age estimation of live humpback whales is lipid profile analysis (Herman et al.
2009).
Biological ageing is a combination of programmed processes (Berdasco & Esteller 2012;
Horvath 2013) and accumulated changes caused by unrepaired environmental damage
(Kujoth et al. 2005). Recent evidence suggests that epigenetic changes are both directing the
process of ageing and being caused by it (Maegawa et al. 2010; Koch et al. 2011; Winnefeld
& Lyko 2012; Hannum et al. 2013; Horvath 2013). The best studied class of epigenetic
Acc
epte
d A
rtic
le
This article is protected by copyright. All rights reserved.
change in vertebrates is methyl group presence or absence at the C5 position of Cytosine
residues that are adjacent to Guanidine residues ('CpG sites'). Clusters of CpG sites are
common in the 5' regulatory region of vertebrate genes (Hannum et al. 2013). CpG
methylation levels play an important role in control of gene expression, where higher
methylation levels (‘hypermethylation’) generally reduce gene transcription rate. Methylation
changes at specific CpGs have been linked to age in mice (Maegawa et al. 2010) and humans
(Christensen et al. 2009; Grönniger et al. 2010; Bocklandt et al. 2011; Koch & Wagner 2011;
Hannum et al. 2013). Epidermal methylation changes in some genes that relate to age have
been shown to affect a set of CpG sites distinct from the sites that change in relation to
environmental impacts such as sun exposure (Grönniger et al. 2010). This suggests that some
CpG sites are linked to genetically programmed ageing and are less influenced by
environmental variables. Identification of epigenetic changes in tissues that can be sampled
relatively non-invasively such as blood (Koch et al. 2011), skin (Grönniger et al. 2010) and
buccal cells (Bocklandt et al. 2011) provide opportunities for development of epigenetic age
assays for live animals. Several recent studies have used epigenetic assays to estimate the age
of humans or human tissues (Bocklandt et al. 2011; Koch & Wagner 2011; Garagnani et al.
2012; Hannum et al. 2013; Horvath 2013).
We developed an epigenetic method for estimating humpback whale age with DNA purified
from skin biopsy samples, hereafter referred to as the HEAA (Humpback Epigenetic Age
Assay). We identified three CpG sites in the 5' regulatory regions of three humpback whale
genes with cytosine methylation levels that have a strong age relationship. We measured
methylation levels in 45 whales of known ages ranging from < 1 to 30 years to characterise
the statistical properties of the HEAA including its precision and accuracy. We also
specifically explored the ability of the HEAA to determine which of a pair of humpback

Acc
epte
d A
rtic
le
This article is protected by copyright. All rights reserved.
whales is older and which is younger (ordinal age estimation) because this has a specific
application in close-kin population size estimation. The HEAA was then used to estimate the
age profile for a sample of 63 humpback whales of unknown age off Australia. This age
profile was compared to profiles from the same population 47-57 years earlier as an example
of one application of this technique. Finally, we applied the methylation assays used in the
HEAA to sperm whale DNA to explore cross-species application of age assays based on
DNA methylation.
Materials and Methods
Sample collection and processing
Skin samples were collected from humpback whales by punch biopsy darts fired from
crossbows or modified rifles. Samples were preserved in 75% ethanol or frozen and later
transferred to RNA later – ICE (Qiagen). DNA was purified by CTAB extraction (Stewart &
Via 1993). Three populations of humpback whales were sampled at three sites: the Gulf of
Maine off eastern North America (43° N, 68° W) from May to August in 2007-2011; Evans
Head in eastern Australia (29° S, 153° E) from June to July 2009; and Exmouth, Western
Australia (22° S, 114° E) in September 2009. The sex of the whale associated with each
sample was determined with a qPCR assay (Morin et al. 2005).
Three sample sets were assembled. The 'calibration' samples were chosen to represent an
even distribution of ages within the available range from photo-identification studies (a few
weeks to 30 years) and to evenly represent both sexes. They consisted of 45 DNA samples
purified from skin biopsies, 40 from the Gulf of Maine; one known-age adult from Evans
Head; and three calves from Exmouth. There were 21 samples from females and 24 from
Acc
epte
d A
rtic
le
This article is protected by copyright. All rights reserved.
males. The 24 'mother-calf pair' samples consisted of six pairs from Exmouth, two from
Evans Head and four from the Gulf of Maine. The 'test' samples were purified from 63 skin
biopsies collected off Evans Head, 50 of which were males and 13 female.
Age determination for 'calibration' population whales
The age of 40 humpbacks from the Gulf of Maine was determined by resighting of
individuals first seen as dependent calves. Biopsies taken in the Gulf of Maine were linked in
the field to identifying fluke photographs. Identity and year of birth was confirmed against a
photographic identification catalog curated by the Center for Coastal Studies. The age of one
humpback sampled near Evans Head, Australia was also known as it has been repeatedly
resighted since it was a calf (Polanowski et al. 2011). Samples of four calves from near
Exmouth, west Australia were estimated to be 4 – 6 weeks old based on size.
Identification of age-related epigenetic markers in humpbacks
Genes with age related-epigenetic changes in humans and mice were identified through
literature searches. The genes tested and the studies demonstrating their age-related
methylation are given in Table 1. Candidate 5' regulatory region sequences were taken from
GenBank and used as queries for BLASTn (Altschul et al. 1990) searches of cetacean
sequences in GenBank; and BLAT searches of the dolphin (Tursiops truncatus) genome
(Vollmer & Rosel 2012). Where candidate genes had a clearly orthologous 5' regulatory
regions in the T. truncatus genome, primers for amplification of humpback sequences were
designed by eye based on all available homologous cetacean sequences. Humpback gene
regions were amplified in 10 uL PCR reactions containing 5 uL 2 x Phusion HF (NEB)
master mix, 1 uM of each amplification primer, 10 ng of humpback whale DNA and milli-Q
Acc
epte
d A
rtic
le
This article is protected by copyright. All rights reserved.
H20 with thermal cycling conditions appropriate to each primer set and predicted amplicon.
The fragments were purified with Ampure magnetic beads (Agencourt) and bi-directionally
sequenced by dye terminator v 3.1 chemistry on an ABI 3100 Sanger sequencer (Applied
Biosystems).
Measurement of cytosine methylation levels
Cytosine methylation levels were measured with Qiagen PyroMark assays. The
pyrosequencing assays were designed using PyroMark Assay Design Software (Version 2.0.1,
Qiagen). Humpback DNA was converted using the Epitect Bisulphite Conversion Kit
(Qiagen). The assay regions were PCR amplified using a biotin labelled, HPLC purified
primer and standard sequencing grade primer (Table S1). Amplification reactions consisted
of 12.5 uL PyroMark mastermix, 2.5 uL Coral Load, 1 uL each of 5 uM forward and 5 uM
reverse primers, 2 uL of bisulphite converted template DNA and 6 uL of water.
Thermocycling conditions were 15 min at 95°C followed by 45 cycles of 30 s at 95°C, 30 s at
56°C and 30 s at 72°C and a final extension step of 10 min at 72°C. Pyrosequencing was
performed on a PyroMark 24 Pyrosequencing System (Qiagen). The PyroMark Q24 software
gave percentage methylation values for each CpG site.
Selection of sites for the HEAA
Cytosine methylation percentages for 37 CpG sites were compared to the ages of the 45
whales in the 'calibration' sample set. Linear regression was used to show how much of the
variation in CpG methylation was explained by age differences. To correct p values for
multiple age-methylation comparisons, a Bonferroni-Holm correction procedure was applied
(Holland & Copenhaver 1987). The CpG sites that had significant relationships with age were

Acc
epte
d A
rtic
le
This article is protected by copyright. All rights reserved.
considered for incorporation into the HEAA. Twenty different combinations of either two or
three CpG sites that were found in separate gene regions were combined into multiple linear
regression models. The combination of sites that produced a multiple regression with
maximum predictive power was selected by scores for the Akaike Information Criterion (AIC)
(Table S2).
Measurement of HEAA accuracy and precision
The accuracy of the HEAA was assessed with multiple linear regression. The overall
precision of the HEAA was assessed with a Leave One Out Cross Validation (LOOCV)
(Picard & Cook 1984). For each of the 45 samples in the 'calibration' set, age was estimated
with the model using the other 44 samples to calculate the multiple linear regression. The
difference between the known and estimated age value was recorded for each sample. The
distribution of these residuals was assessed for normality; and an assessment of leverage of
individual points made.
An estimate of the proportion of assay error that could be attributed to the PyroMark assay
was made by repeated measurement of CpG methylation levels in the same DNA samples.
Four samples with known ages of 0.4, 5.5, 7.5 and 22.3 years were assayed six times each.
The mean standard deviation for all 24 measurements was calculated from differences
between known and estimated age.
Estimate of whale ages in a test population
The age distribution estimated by the HEAA for the 63 Evan's Head whales (21% female,
Acc
epte
d A
rtic
le
This article is protected by copyright. All rights reserved.
79% male) was compared to age distributions determined by ear plug GLG counts and
ovarian measurement for east coast Australian humpbacks in 1952-1962 (Chittleborough
1965). These age estimates were doubled to conform to more recent evidence that one ear
plug GLG accrues annually (Gabriele et al. 2010). The numbers of animals with age
estimates for 1952-1962 were, respectively 598, 696, 718, 720, 723, 720, 800, 810, 732, 173
and 88. The sex ratio was 32% female and 68% male. For comparison to the 2009 HEAA age
estimates, ages were grouped into four year categories starting at age 2.
Estimates of ordinal age differentiation performance
The performance of the HEAA in correctly determining the age order of whales was
estimated for a range of age differences. The exact ages for the older and younger age were
converted into estimates that the HEAA might produce by selecting a value at random from a
normal distribution centered on the exact age with a standard deviation of 2.991 as estimated
with LOOCV. This was done 10,000 times for all age differences from 0 to 100 (Figure S1A).
To estimate how often age order in parents and offspring in a real population would be
correct, population age distributions were simulated as negative exponential distributions
with the λ parameter estimated from the mean age of the 2009 HEAA results for a growing
population (λ = 1 / 10.01 = 0.0999) and from mean age recorded in 1952 (Chittleborough
1965) for the same population (λ = 1 / 21.8 = 0.0459) (Figure S1B). 10,000 parental ages
were selected at random from the portion of these distributions greater than the minimum
parturition age for humpbacks of five years. An offspring age was also selected at random
with a maximum age limit of the parental age minus five years. This gave the distribution of
different age intervals present in the population (Figure S1C). These were multiplied by the
Acc
epte
d A
rtic
le
This article is protected by copyright. All rights reserved.
proportion that would be correctly aged and the results integrated across all ages to give an
overall proportion that would be correctly age ordered.
The HEAA's ordinal age estimation performance was tested empirically on twelve samples
from mothers and calves. The pairs were initially identified visually as mothers with
dependent young and their relationship confirmed by microsatellite genotyping following
previously published methods (Schmitt et al. 2013). The four mother-calf pairs collected
from the Gulf of Maine (real ages 17.4 + 0.4, 10.3 + 2.5, 25.3 + 3.6, 25.8 + 2.2) had their age
estimated with the HEAA calibrated with the other 44 (total n – 1) samples in the calibration
sample set as for the LOOCV analysis, where all other pairs used the full HEAA calibration.
Test of HEAA assays on sperm whale DNA
Samples of sperm whale (Physeter catodon) skin and teeth were collected from whales that
died in mass strandings at Perkins Island off northern Tasmania, Australia (42°2 S, 145°14 E)
in December 2004 and January 2009. Ages were estimated at zero years for a foetus, one year
for a calf and 15, 20, 28 and 38 years for four individuals by standard tooth growth ring
counting methods (Evans & Hindell 2004). The HEAA was applied to these samples as for
humpbacks.
Results
Development of the HEAA
Humpback whale 5' regulatory regions were isolated for eight genes that had evidence of
CpG methylation changes in other mammals. 37 CpGs in these genes were assayed for
Acc
epte
d A
rtic
le
This article is protected by copyright. All rights reserved.
correspondence between CpG methylation levels and age (Table 1). CpG sites considered for
the HEAA were selected from the seven CpG sites that had a significant regression
relationship with age. Multiple linear regression models were made for all 20 combinations of
CpG sites that were not from the same gene region. The models were ranked by Akaike
Information Criterion (AIC) score to identify which combination of two or three sites had the
best ability to predict age, as shown in Table S3. The model with the best AIC score had the
sites TET2_CpG+31, CDKN2A_CpG+297 and GRIA2_CpG+202. These three sites were
also those with the strongest regression relationship with age (Table 1). The regressions of
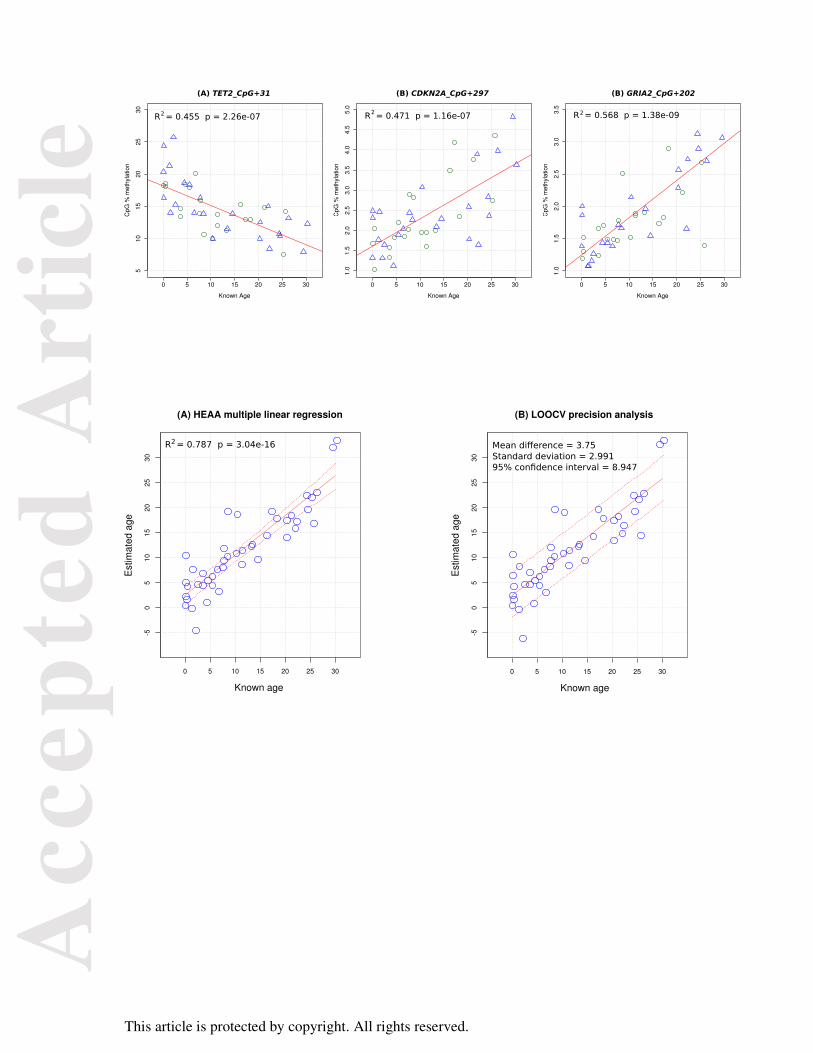
age and CpG methylation levels in the three sites selected for the assay are shown in Figure 1.
There was no significant difference in the regressions for female and male CpG levels and
age (analysis of covariance p > 0.05 in all cases). This was also true for the other four sites
that had significant relationships between age and CpG methylation.
The main reason for selecting only one CpG site from each gene was that sites within the
same region that have been methylated or demethylated as part of the same process would not
provide independent biological age estimates. Concerted methylation changes are often found
among CpG sites in the same human gene regions (Grönniger et al. 2010; Koch & Wagner
2011) and we found this in all sites within the same regions of humpback TET2 and CDKN2A
(Figure S2 and Table S2). Sites from the same region would also be subject to similar
experimental error when assayed in the same PCR amplifications and PyroMark assays. This
strategy follows those taken for developing human epigenetic age assays (Bocklandt et al.
2011; Koch & Wagner 2011).

Acc
epte
d A
rtic
le
This article is protected by copyright. All rights reserved.
Characteristics of the HEAA
The accuracy of the HEAA can be assessed from the multiple linear regression for its three
CpG markers and known age shown in Figure 2A. The regression R2 of 0.787 indicates that
although most of the response can be attributed to age, there are other factors affecting CpG
levels at the HEAA sites. The significant y intercept of 2.395 means that young whales will
have their age slightly overestimated. The gradient of the HEAA regression shows that the
age of older whales will be slightly underestimated.
The precision of the HEAA as assessed by Leave One Out Cross Validation (LOOCV) is
shown in Figure 2B. The overall precision of the HEAA was estimated as the standard
deviation of the mean difference between known and estimated ages, which was 2.991 years.
The distribution of the differences in known and estimated age was approximately normally
distributed (Figure S3A). A Shapiro-Wilk normality test demonstrates that the difference
from normality is not significant (W = 0.984, p = 0.785) and this can be seen in a quantile-
quantile plot (Figure S3B). The differences in known and estimated age show little
heteroscedasticity, meaning that variance in the differences is similar throughout the range of
ages assayed (Figure S3C); and there is an even dispersion of these values around the mean
(Figure S3D). The leverage effect of outlying points on the multiple regression was only
minor, with all values for Cook's Distance < 0.5 (Figure S3E). The residuals of the 45
estimates had a mean of 3.575 years and the 95% confidence interval for age estimates was
8.947 years.
The precision of the PyroMark system alone was estimated from the standard deviation of six
repeated measurements of the same four DNA samples to be 2.205 years. This indicates that
Acc
epte
d A
rtic
le
This article is protected by copyright. All rights reserved.
a reasonably high proportion of the precision error is attributable to error in measurement of
methylation levels. This is likely to be because the percentage methylation differences
measured in the CDKN2A_CpG+297 and GRIA2_CpG+202 assays are small (Figure 1B and
1C).
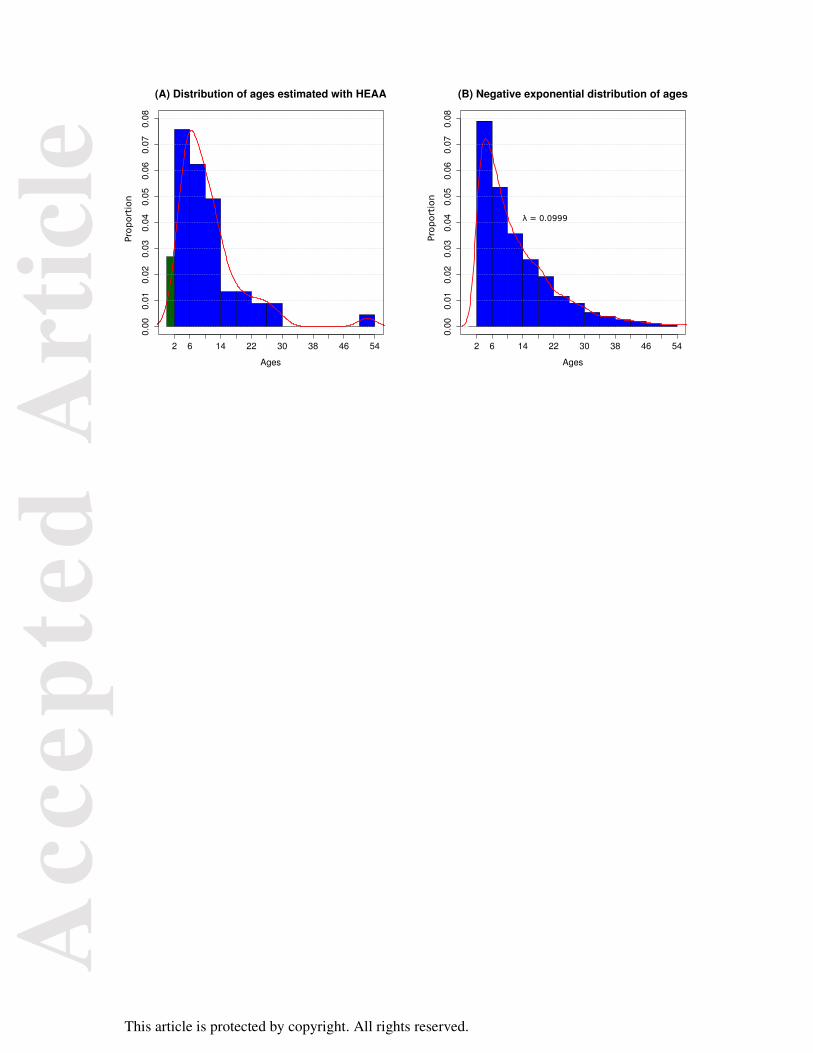
HEAA estimation of age in east coast Australian humpbacks
The ages of 63 humpbacks sampled near Evans Head on their northbound migration along the
east coast of Australia were measured with the HEAA. The results of these estimates are
summarised in Figure 3A. The estimates had a mean age of 10.01 and a range of 0 to 52. The
decreasing number of animals in each age class approximated a negative exponential
decrease (two sample Kolmogorov-Smirnov D = 0.141, p = 0.245). An equivalent negative
exponential distribution of ages with a λ rate parameter calculated by treating the observed
mean as the expected value of the distribution (λ = 1 / 10.01 = 0.0999) is shown in Figure 3B.
This indicates that the HEAA produces age distributions that are close to the distribution
expected for non-calf animals in a population where inter-annual fecundity is reasonably
constant and there is little difference in mortality rate among adult age classes (Beverton,
Holt, 1956). The proportion of the test population that was within the age range of the
calibration samples (0 – 30 years) was calculated from this distribution to be 95.6%.
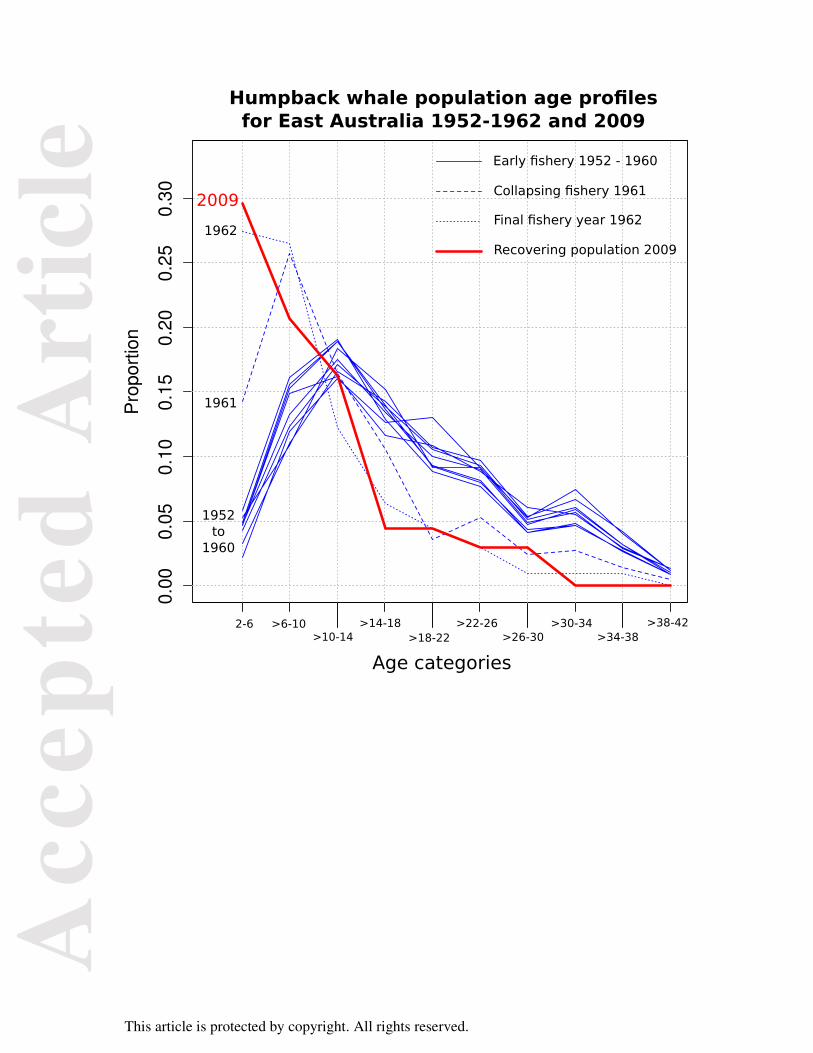
Ages estimated for east coast Australian humpbacks sampled in 2009 were compared to ages
for humpbacks recorded during the operation of the Byron Bay whaling station from 1952 to
1962 and estimated by measurement of ear plug GLGs and ovaries (Chittleborough, 1965) as
shown in Figure 4. The age structure from 1952 to 1960 represents an almost unexploited age
structure for migratory whales found in this region (Chittleborough, 1965), which is the same
Acc
epte
d A
rtic
le
This article is protected by copyright. All rights reserved.
region where the Evans Head samples were collected. The humpback fishery in this region
began to collapse in 1961 and 1962 was the final year of operations.
Parent-offspring ordinal age prediction
The ability of the HEAA to correctly order the age of a parent and its progeny was tested by
simulation. A negative exponential population age distribution was simulated for the 2009
east coast Australian humpback whales based on HEAA data (Figure 3B); and a distribution
also simulated from the 1952 data to provide an example distribution from an unexploited
population. Parent-offspring age intervals with a minimum of five years were estimated from
these distributions and the age estimate errors that would be produced by the HEAA
simulated from its standard deviation. In 10,000 estimates of parent-offspring age order, the
proportion in which the age order was correctly determined was 93.7% and 99.1% of cases
for the 2009 and 1952 age profiles, respectively (Figure S3).
An empirical test of HEAA ordinal age estimation was made with eight mother-calf pairs
from the 'test' sample set. The 'calibration' sample set also contained four mother-offspring
pairs, which had age order estimated with the LOOCV approach. In all twelve cases, the
correct mother-offspring age order was found.
Cross-species testing of the HEAA
We successfully assayed the three CpG sites in HEAA in six samples of Sperm Whale
(Physeter catodon) DNA with ages ranging from 0 to 38 years. Of the three HEAA sites, the
P. catodon orthologue of TET2_CpG+31 was the only one with a significant age-related
Acc
epte
d A
rtic
le
This article is protected by copyright. All rights reserved.
DNA methylation regression (R2 = 0.927, p = 0.0013). Increased age was associated with
hypomethylation, as found in humpbacks.
Discussion
Molecular methods for estimating animal age are improving as understanding of the
processes of biological ageing deepens. Telomere length assays are the most extensively
studied molecular ageing method for animals, but with a few exceptions, these have not
proven useful for population studies (Dunshea et al. 2011). In many animals, average
telomere length varies extensively at birth, so although changes in individuals can be tracked
over time, they are not useful for cross-sectional studies of population age (Kappei &
Londoño-Vallejo 2008; Karlsson et al. 2008). Other recent molecular age estimation methods
that have performed well are ' T Cell Receptor Excision Circle' (TREC) qPCR for humans
(Zubakov et al. 2010); changes in levels of specific mRNAs in mosquitos (Cook et al. 2006);
assays for specific CpG site methylation levels in humans (Bocklandt et al. 2011; Koch &
Wagner 2011; Garagnani et al. 2012); and accumulation of specific lipids in whale blubber
(Herman et al. 2009). All of these methods estimate a 'biological' age as the features they
measure do not change with an annual trigger, but change with constant biological processes
such as immunological insults in TREC qPCR (Zubakov et al. 2010); mRNA expression
relating to developmental stage (Cook et al. 2006); telomere length changes resulting from
number of mitotic cycles (Karlsson et al. 2008) or accumulation of dietary lipids in adipose
(Herman et al. 2009). There is almost always population-wide variability in correlation
between 'biological' age estimates and 'chronological' age because individuals within a
population have different genotypes and experience different life histories. Even an extremely
thorough age estimation assay such as genome-wide measurement of methylation at 70,387
Acc
epte
d A
rtic
le
This article is protected by copyright. All rights reserved.
age-related CpG sites (Hannum et al. 2013) results in an assay that has a standard deviation
in age prediction of approximately 5% of the lifespan of the animal (humans) which is similar
to the HEAA's standard deviation = 3.0 / lifespan of ~ 95 ≈ 3.1%. This indicates that the
underlying relationship between chronological age and proxy markers for age is the limiting
factor for achieving precision. Adding extra CpG sites to the HEAA would therefore not
necessarily improve its predictive ability. In fact, two of the human epigenetic age assays
used combinations of three CpG sites with the best relationships with age selected from a
large number of possible age-related sites (Bocklandt et al. 2011; Koch & Wagner 2011). The
differences in percentage methylation found in CDKN2A_CpG+297 and GRIA2_CpG+202
were quite small and repeated measurements of the same samples demonstrated that some of
the variation in age-related methylation change can be attributed to the measurement error of
the PyroMark system. Technologies for measuring DNA methylation are constantly
improving and this suggests that measurement of these sites with deeper sequencing or other
more accurate methodologies could further improve the precision of the HEAA.
Humpback whales are an excellent example of a species where age estimation is difficult.
The prevalent method for age estimation in this species during the commercial whaling era
was counting ear plug GLGs (Chittleborough 1959). However, there is measurement error in
this method (Chittleborough 1959) and historical lack of consensus on how many growth
layers accrue annually (Lockyer 1984). It was initially thought that two GLGs were produced
each year (Chittleborough 1959) but more recent evidence suggests only one group (Gabriele
et al. 2010), which is also consistent with the accrual rate in other baleen whales (Lockyer
1984; Gabriele et al. 2010) and odd-numbered ear plug GLG counts (Chittleborough 1965;
Gabriele et al. 2010). The most reliable method currently used to determine humpback age is
visual re-identification of individuals that were first seen as calves. This approach clearly

Acc
epte
d A
rtic
le
This article is protected by copyright. All rights reserved.
requires substantial effort and cannot be applied to populations without extensive records of
past sightings. The only available method for estimating the age of live, previously
unencountered humpback whales is analysis of blubber lipid profiles (Herman et al. 2009).
This method has a similar estimated precision (standard deviation = 3.1 to 5.3 in different
populations) to our HEAA (standard deviation = 3.0). A limitation of this approach is that it
requires calibration for each population as many of the accumulated lipids are derived from
dietary items that are not uniformly consumed in different places. The HEAA does not
require population specific calibration and may therefore be particularly useful for comparing
age data among populations.
Methods for measuring the age of long lived animals such as humpback whales are difficult
to calibrate for the older portion of their range because there are few data available for
validation. In this study, the oldest sample in the calibration set was from a 30 year old,
which approaches the span of photo-identification research but is only about a third of the
potential lifespan of the species. This relationship should be further evaluated for older
whales as validating data become available, but all of the age-methylation relationships
identified in other mammals so far are approximately linear (e.g. Maegawa et al., 2010;
Bocklandt et al. 2011; Koch & Wagner 2011) and the relationships shown in Figure 1 are
also, which suggests that age estimates outside the calibration range will be correct relative to
estimates within the calibration range. Even with currently available samples for calibration,
the age range over which the HEAA was calibrated was estimated to cover more than 95% of
humpbacks that will be encountered in the wild because older whales are expected to be rare
(see Figure 3).

Acc
epte
d A
rtic
le
This article is protected by copyright. All rights reserved.
The CpG sites that we use in the HEAA are in the first exons of humpback whale genes
homologous to genes with known functions in other mammals. TET2 (ten eleven
translocation 2) is a member of a multigene family that encodes DNA binding proteins. It is
involved in regulation of cytosine methylation of other genes and is a proto-oncogene
(Branco et al. 2012). In humans, TET2 becomes hypermethylated with age (Grönniger et al.
2010), so it was interesting to observe significant, concerted age-related hypomethylation in
humpback whales in four of the five CpG sites that we assayed; and hypomethylation in the
single sperm whale TET2 site assayed. CDKN2A (cyclin dependent kinase inhibitor 2A) is
part of a gene complex with various names (CDKN2A/CDKN2B, p16INK4a/p16INK4b, ARF) for
which there is also widespread evidence of age-related methylation changes (Gonzalez-
Zulueta et al. 1995; Maegawa et al. 2010; Koch et al. 2011; Horvath 2013). CDKN2A mRNA
expression levels have been proposed as a biomarker for human age, which is likely to be at
least partly regulated by CpG methylation (Krishnamurthy J, Ramsey MR, Ligon KL, Torrice
C, Koh A, et al. 2006). Glutamate receptors such as GRIA2 (glutamate receptor Ia2 / AMPA2)
are the predominant receptors in the mammalian brain and have a role in neuronal death
associated with ageing (Chakrabarti et al. 2001). GRIA2 shows strong age-associated
hypermethylation in humans (Koch & Wagner 2011).
As an example of the value of this technique, we estimated age structure for a suite of
samples of unknown age obtained off the east coast of Australia and compared those results
to historical whaling data. The population of humpbacks that migrate past the east coast of
Australia was largely unexploited before 1952, so the age profiles for that time give an
estimate of an unperturbed age structure (Chittleborough 1965). The fishery initially
produced consistent annual yields and from 1952 to 1960 the average hunting time required
to catch each whale was less than two hours. In 1961 this increased to 4.5 h and in 1962 it

Acc
epte
d A
rtic
le
This article is protected by copyright. All rights reserved.
had extended to 15 h as the fishery collapsed, ceasing to operate after 1962 (Chittleborough
1965) The population age structures for 1961 and 1962 reflect this depletion of adult whales.
The 2009 population age structure estimated with the HEAA from this region is more similar
to the age structures recorded in the final two years of the fishery than to those of the
population encountered at the commencement of whaling. Our results suggest that 47 years
after the cessation of whaling the east coast Australian humpback population has not yet
returned to a stable state. However, the modern sample size was small, the samples were not
obtained for this purpose and the sampling did not necessarily replicate that of historical
whaling operations. Biopsy samples were obtained during a portion of the northbound
migration and humpback whales exhibit seasonal variation in migratory timing that varies
with age, sex and reproductive status (Dawbin 1966). There may also been differences in
selectivity between biopsy sampling and historic whaling operations. Despite these caveats,
the strong bias toward young animals being represented and older ones being rare in our
results is interesting and warrants further study. This analysis is included as an example of the
sort of population comparisons that the HEAA allows, which will of course be more
informative with larger sample sizes that are collected with the intent of assessing age
structure. This population is growing rapidly (Chaloupka et al. 1999; Noad et al. 2011), so
the 2009 age structure has probably resulted from high fecundity and survival, in contrast to
the very similar age profiles for 1961 and 1962 that were caused by the size-dependent
mortality imposed by the whale fishery. This illustrates a limitation of single ‘snapshot’
population age profiles in estimating underlying demographic parameters such as mortality
and fecundity, as similar age profiles can result from changes in different parameters (De La
Mare 1985).
Acc
epte
d A
rtic
le
This article is protected by copyright. All rights reserved.
The HEAA is more useful for improving demographic analysis methods based on mark-
recapture or close-kin recognition. An assumption of many of the commonly used mark-
recapture models is that all animals have an equal chance of recapture (Seber, 1982). This
assumption will be violated in many populations where there is age-specific mortality. The
HEAA enables estimation of mortality rates in different age classes. Ordinal age
determination is especially useful for improving estimates of population size from close-kin
recognition analyses (Skaug et al. 2010). Parent-offspring pairs can be identified by
genotyping individuals with multiple markers such as microsatellites or SNPs, but it is often
not possible to know which individual is the parent and which the offspring. The power of
close-kin population size estimation is diminished when the order of age is not known (Skaug
et al. 2010). HEAA determination of age order from the same DNA sample that is used for
genotyping will be particularly useful in this application.
Cytosine methylation is reasonably chemically stable and has been successfully assayed in
ancient DNA purified from ~ 38,000 year old Neanderthal bones (Briggs et al. 2010) and ~
60,000 year old bison bones (Llamas et al. 2012). This suggests potential for epigenetic age
estimation from degraded DNA such as faecal samples, which would enable non-invasive
sampling for age-estimation material from whales or other vertebrates. Another clear
application is age estimation from deceased animals. Age-specific population mortality rates
could be derived from animals that die of natural causes (Sinclair 1977) as occurs in mass
strandings of whales. It is often not possible to generate baleen whale age estimates from
stranded whales by ear plug GLG measurement as this tissue typically degrades quickly
(Gabriele et al. 2010).
Acc
epte
d A
rtic
le
This article is protected by copyright. All rights reserved.
The approach we took to develop the HEAA is widely applicable. Targeted searches for
whale orthologues of genes with known age-related methylation patterns in other mammals
were quite successful with 19% (≈ 7 / 37) of CpG sites screened showing significant age-
related methylation. Epigenetic regulation mechanisms are not as highly conserved among
mammal species as their associated gene and regulatory region DNA sequences are (Horvath
2013), so we had to screen more sites than were included in the final assay. The conservation
of PCR priming sites in the sperm whale application of the HEAA, but only partial
conservation of age relationship in markers follows this pattern. However, this approach
should identify age-related CpG methylation in most vertebrates where 'calibration' samples
with known ages are available and it appears more efficient than a genome-wide search in
non-model animals. Genome-wide methylation has been shown to decrease with age in a bird
(Gryzinska et al. 2013), a reptile (Parrott et al. 2014) and a plant (Yuan et al. 2014), so it is
likely that specific CpG methylation in age-related sites can be identified for them as well.
Epigenetic age estimation has great potential for expanding the scope of molecular studies of
non model organisms.
Acknowledgements
This work was funded by Australian Antarctic Science grant 4014. We thank Bruce Deagle,
Mark Bravington, Bill De La Mare, Nick Gales, Peter Jarman, Phillip Zeigler and two
anonymous referees for comments that improved the manuscript. David Mattila, Scott Landry,
Christine McMillan, Amy Kennedy and Jennifer Tackaberry assisted with sample collection
in the Gulf of Maine. Dave Paton, Sarah Laverick and Simon Childerhouse helped collect
samples from near Evans Head. Curt Jenner provided samples from Exmouth. Sperm whale
samples and age estimates were provided by Rachael Alderman and Kris Carlyon and this
Acc
epte
d A
rtic
le
This article is protected by copyright. All rights reserved.
work was supported by the Princess Melikoff Trust Marine Mammal Conservation Program
of the Tasmanian DPIPWE.
Author contributions
AP performed experiments to develop the HEAA. JR collected samples for the calibration
population. DC performed the PyroMark assays. AP and SJ collected samples for the test
population and jointly developed the concept for the HEAA. SJ performed the data analyses.
All authors contributed to writing the paper.
References
Altschul SF, Gish W, Miller W, Myers EW, Lipman DJ (1990) Basic local alignment search
tool. Journal of molecular biology, 215, 403–410.
Baker CS, Clapham PJ (2004) Modelling the past and future of whales and whaling. Trends
in Ecology & Evolution, 19, 365–371.
Baker CS, Perry A, Bannister JL et al. (1993) Abundant mitochondrial DNA variation and
world-wide population structure in humpback whales. Proceedings of the National
Academy of Sciences, 90, 8239–8243.
Barlow J, Clapham PJ (1997) A new birth-interval approach to estimating demographic
parameters of humpback whales. Ecology, 78, 535–546.
Berdasco M, Esteller M (2012) Hot topics in epigenetic mechanisms of aging: 2011. Aging
Cell, 11, 181–186.
Bocklandt S, Lin W, Sehl ME et al. (2011) Epigenetic predictor of age. PLoS One, 6, e14821.
Branco MR, Ficz G, Reik W (2012) Uncovering the role of 5-hydroxymethylcytosine in the
epigenome. Nature Reviews Genetics, 13, 7–13.

Acc
epte
d A
rtic
le
This article is protected by copyright. All rights reserved.
Briggs AW, Stenzel U, Meyer M et al. (2010) Removal of deaminated cytosines and
detection of in vivo methylation in ancient DNA. Nucleic Acids Research, 38, e87–
e87.
Campana SE (2001) Accuracy, precision and quality control in age determination, including a
review of the use and abuse of age validation methods. Journal of Fish Biology, 59,
197–242.
Chakrabarti L, Bandyopadhyay BC, Poddar MK (2001) Is age-induced decline in immune
response associated with hypothalamic glutamate receptor density and dietary protein?
Nutritional neuroscience, 4, 375–387.
Chaloupka M, Osmond M, Kaufman G (1999) Estimating seasonal abundance trends and
survival probabilities of humpback whales in Hervey Bay (east coast Australia).
Marine Ecology Progress Series, 184, 291–301.
Chittleborough RG (1959) Determination of age in the humpback whale, Megaptera nodosa
(Bonnaterre). Marine and Freshwater Research, 10, 125–143.
Chittleborough R (1965) Dynamics of two populations of the humpback whale, Megaptera
novaeangliae (Borowski). Marine and Freshwater Research, 16, 33–128.
Christensen BC, Houseman EA, Marsit CJ et al. (2009) Aging and Environmental Exposures
Alter Tissue-Specific DNA Methylation Dependent upon CpG Island Context. PLoS
Genetics, 5, e1000602.
Clapham PJ (1992) Age at attainment of sexual maturity in humpback whales, Megaptera
novaeangliae. Canadian Journal of Zoology, 70, 1470–1472.
Cook PE, Hugo LE, Iturbe-Ormaetxe I et al. (2006) The use of transcriptional profiles to
predict adult mosquito age under field conditions. Proceedings of the National
Academy of Sciences, 103, 18060–18065.
Dawbin WH (1966) The seasonal migratory cycle of humpback whales. In: Whales, Dolphins
Acc
epte
d A
rtic
le
This article is protected by copyright. All rights reserved.
and Porpoises (Norris KS, ED), University of California Press, Berkeley, California.
De La Mare (1985) On the estimation of mortality rates from whale age data, with particular
reference to minke whales (Balaenoptera acutorostrata) in the Southern Hemisphere.
Rep. int. Whaling Commission, 35, 239–250.
Dennis C (2006) Conservation at a distance: A gentle way to age. Nature, 442, 507–508.
Dunshea G, Duffield D, Gales N et al. (2011) Telomeres as age markers in vertebrate
molecular ecology. Molecular Ecology Resources, 11, 225–235.
Evans K, Hindell MA (2004) The age structure and growth of female sperm whales (Physeter
macrocephalus) in southern Australian waters. Journal of Zoology, 263, 237–250.
Gabriele CM, Lockyer C, Straley JM, Jurasz CM, Kato H (2010) Sighting history of a
naturally marked humpback whale (Megaptera novaeangliae) suggests ear plug
growth layer groups are deposited annually. Marine Mammal Science, 26, 443–450.
Garagnani P, Bacalini MG, Pirazzini C et al. (2012) Methylation of ELOVL2 gene as a new
epigenetic marker of age. Aging Cell, 11, 1132–1134.
Gonzalez-Zulueta M, Bender CM, Yang AS et al. (1995) Methylation of the 5′ CpG island of
the p16/CDKN2 tumor suppressor gene in normal and transformed human tissues
correlates with gene silencing. Cancer research, 55, 4531–4535.
Grönniger E, Weber B, Heil O et al. (2010) Aging and Chronic Sun Exposure Cause Distinct
Epigenetic Changes in Human Skin (W Reik, Ed,). PLoS Genetics, 6, e1000971.
Gryzinska M, Blaszczak E, Strachecka A, Jezewska-Witkowska G (2013) Analysis of Age-
Related Global DNA Methylation in Chicken. Biochemical Genetics, 51, 554-63.
Hannum G, Guinney J, Zhao L et al. (2013) Genome-wide Methylation Profiles Reveal
Quantitative Views of Human Aging Rates. Molecular Cell, 49, 359–367.
Herman D, Ylitalo G, Robbins J et al. (2009) Age determination of humpback whales
Megaptera novaeangliae through blubber fatty acid compositions of biopsy samples.
Acc
epte
d A
rtic
le
This article is protected by copyright. All rights reserved.
Marine Ecology Progress Series, 392, 277–293.
Holland BS, Copenhaver MD (1987) An Improved Sequentially Rejective Bonferroni Test
Procedure. Biometrics, 43, 417.
Horvath S (2013) DNA methylation age of human tissues and cell types. Genome Biology, 14,
R115.
Kappei D, Londoño-Vallejo JA (2008) Telomere length inheritance and aging. Mechanisms
of Ageing and Development, 129, 17–26.
Karlsson AO, Svensson A, Marklund A, Holmlund G (2008) Estimating human age in
forensic samples by analysis of telomere repeats. Forensic Science International:
Genetics Supplement Series, 1, 569–571.
Koch CM, Suschek CV, Lin Q et al. (2011) Specific Age-Associated DNA Methylation
Changes in Human Dermal Fibroblasts. PLoS ONE, 6, e16679.
Koch CM, Wagner W (2011) Epigenetic-aging-signature to determine age in different tissues.
Aging, 3, 1018.
Krishnamurthy J, Ramsey MR, Ligon KL, Torrice C, Koh A, et al. (2006) p16INK4a induces
an age-dependent decline in islet regenerative potential. Nature, 443, 453–457.
Kujoth GC, Hiona A, Pugh TD et al. (2005) Mitochondrial DNA Mutations, Oxidative Stress,
and Apoptosis in Mammalian Aging. Science, 309, 481–484.
Llamas B, Holland ML, Chen K et al. (2012) High-resolution analysis of cytosine
methylation in ancient DNA. PloS one, 7, e30226.
Lockyer C (1984) Age determination by means of the earplug in baleen whales. Report of the
International Whaling Commission, 34, 692–696.
Maegawa S, Hinkal G, Kim HS et al. (2010) Widespread and tissue specific age-related DNA
methylation changes in mice. Genome Research, 20, 332–340.
Morin PA, Nestler A, Rubio-Cisneros NT, Robertson KM, Mesnick SL (2005) Interfamilial
Acc
epte
d A
rtic
le
This article is protected by copyright. All rights reserved.
characterization of a region of the ZFX and ZFY genes facilitates sex determination in
cetaceans and other mammals. Molecular Ecology, 14, 3275–3286.
Noad MJ, Dunlop RA, Paton D, Cato DH (2011) Absolute and relative abundance estimates
of Australian east coast humpback whales (Megaptera novaeangliae). Journal of
Cetacean Research and Management, Special Issue 3, 243-252.
Olsen MT, Bérubé M, Robbins J, Palsbøll PJ (2012) Empirical evaluation of humpback
whale telomere length estimates; quality control and factors causing variability in the
singleplex and multiplex qPCR methods. BMC Genetics, 13, 77.
Palsbøll PJ, Allen J, Bérubé M et al. (1997) Genetic tagging of humpback whales. Nature,
388, 767–769.
Parrott BB, Bowden JA, Kohno S, Cloy-McCoy JA, Hale MD, Bangma JT, Rainwater TR,
Wilkinson PM, Kucklick JR, Guillette LJ (2014) Influence of tissue, age, and
environmental quality on DNA methylation in Alligator mississippiensis.
Reproduction (Cambridge, England) in press.
Picard RR, Cook RD (1984) Cross-Validation of Regression Models. Journal of the
American Statistical Association, 79, 575–583.
Polanowski AM, Robinson-Laverick SM, Paton D, Jarman SN (2011) Variation in the
Tyrosinase Gene Associated with a White Humpback Whale (Megaptera
novaeangliae). Journal of Heredity, 103, 130–133.
Pomilla C, Rosenbaum HC (2005) Against the current: an inter-oceanic whale migration
event. Biology Letters, 1, 476–479.
Seber, GAF (1982). The estimation of animal abundance and related parameters. London,
Charles Griffin & Co.
Roman J, Palumbi SR (2003) Whales Before Whaling in the North Atlantic. Science, 301,
508–510.
Acc
epte
d A
rtic
le
This article is protected by copyright. All rights reserved.
Schmitt NT, Double MC, Jarman SN et al. (2013) Low levels of genetic differentiation
characterize Australian humpback whale (Megaptera novaeangliae) populations.
Marine Mammal Science, in press.
Sinclair A (1977) The African Buffalo. University of Chicago Press, Chicago, USA.
Skaug HJ, Bérubé M, Palsbøll PJ (2010) Detecting dyads of related individuals in large
collections of DNA-profiles by controlling the false discovery rate. Molecular
Ecology Resources, 10, 693–700.
Stewart CN Jr, Via LE (1993) A rapid CTAB DNA isolation technique useful for RAPD
fingerprinting and other PCR applications. BioTechniques, 14, 748–750.
Valsecchi E, Hale P, Corkeron P, Amos W (2002) Social structure in migrating humpback
whales (Megaptera novaeangliae). Molecular ecology, 11, 507–518.
Vollmer NL, Rosel PE (2012) Developing genomic resources for the common bottlenose
dolphin (Tursiops truncatus): isolation and characterization of 153 single nucleotide
polymorphisms and 53 genotyping assays. Molecular Ecology Resources, 12, 1124–
1132.
Winnefeld M, Lyko F (2012) The aging epigenome: DNA methylation from the cradle to the
grave. Genome Biology, 13, 165.
Yuan J-L, Sun H-M, Guo G-P, Yue J-J, Gu X-P (2014) Correlation between DNA
methylation and chronological age of Moso bamboo (Phyllostachys heterocycla var.
pubescens). Botanical Studies, 55, 4.
Zubakov D, Liu F, van Zelm MC et al. (2010) Estimating human age from T-cell DNA
rearrangements. Current Biology, 20, R970–R971.
Data Accessibility
All R scripts, DNA sequence data and CpG methylation data were deposited in the DRYAD

Acc
epte
d A
rtic
le
This article is protected by copyright. All rights reserved.
database archive for this study (doi:10.5061/dryad.h4b48). Megaptera novaengliae 5'
regulatory region sequences determined for six genes were deposited in GenBank and have
accessions KF791963 – KF791968 (Table 1).
Figure and Table legends
Figure 1
Regressions of CpG methylation and age at sites selected for the HEAA. CpG methylation
was measured at each site by a PyroMark assay in N = 45 whales. Females are shown by a
green circle and males by blue triangles. CpG sites shown were: (A) TET2_CpG+31, (B)
CDKN2A_CpG+297 and (C) GRIA2_CpG+202.
Figure 2
Accuracy and precision of the HEAA. (A) Multiple linear regressions for predicted ages of N
= 45 whales from measurement of CpG methylation at three CpG sites. 95% confidence
limits of the placement of the regression line are shown. (B) Results of 'Leave One Out Cross
Validation' (LOOCV) analysis. The estimated ages of every whale in the 'calibration'
population when the predictive model is based on data for the other N = 44 whales are plotted.
95% confidence limits for age prediction are shown.
Figure 3
Age estimates generated by the HEAA for east Australian humpback whales. (A) Population
age distribution estimated with the HEAA for N = 63 non-calf whales samples near Evans
Head. Ages are grouped into categories of four years. The mean observed age of 10.01 years
Acc
epte
d A
rtic
le
This article is protected by copyright. All rights reserved.
was used for estimation of the negative exponential distribution of age shown in (B). Whales
with an estimated age of < 2 years are indicated in green and were not included in this
comparison.
Figure 4
Population age profiles for humpback whales from east coast Australia. Ten profiles for each
year from 1952 to 1962 were produced from ear plug growth layer measurement. The HEAA
was used to estimate the profile for 2009.
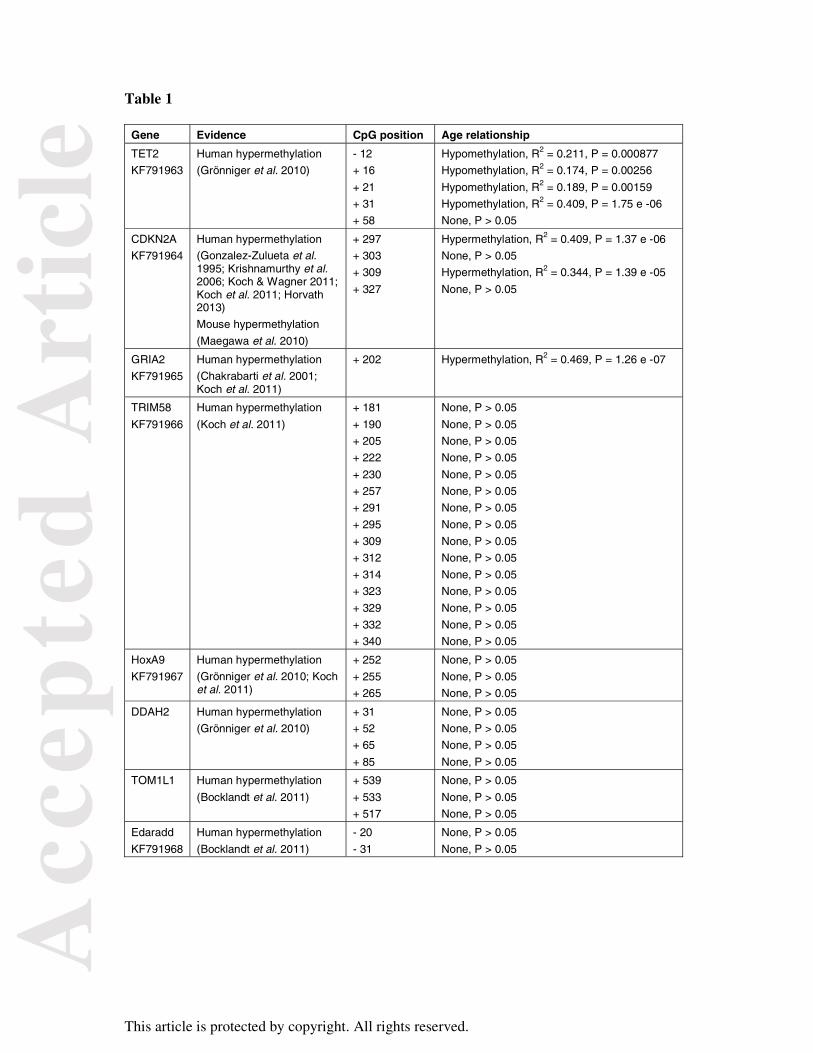
Table 1
CpG sites screened for age-related methylation in Megaptera novaengliae. Regressions of
CpG methylation with age for 37 CpG sites in eight Megaptera novaengliae genes. The name
of the homologous gene in humans is given and the accession number of the GenBank entry
for the M. novaengiae sequence produced in this study. GenBank entries for the M.
novaengiae DDAH2 and TOM1L1 sequences were not possible as these sequences were too
short to be accepted by GenBank. The source and nature of the evidence for age-related CpG
methylation in humans or mice is shown. The position of the 5' Cytosine of each CpG in each
humpback gene are indicated relative to the gene's start codon with negative values indicating
distance in base pairs to the 5' of the start codon and positive values 3' of the start codon. The
CpG and age regression R2 values are shown. All regression p values < 0.05 were significant
after Bonferroni-Holm correction.
Acc
epte
d A
rtic
le
This article is protected by copyright. All rights reserved.
Table 1
Gene Evidence CpG position Age relationship
TET2
KF791963
Human hypermethylation
(Grönniger et al. 2010)
- 12
+ 16
+ 21
+ 31
+ 58
Hypomethylation, R2 = 0.211, P = 0.000877
Hypomethylation, R2 = 0.174, P = 0.00256
Hypomethylation, R2 = 0.189, P = 0.00159
Hypomethylation, R2 = 0.409, P = 1.75 e -06
None, P > 0.05
CDKN2A
KF791964
Human hypermethylation
(Gonzalez-Zulueta et al. 1995; Krishnamurthy et al. 2006; Koch & Wagner 2011; Koch et al. 2011; Horvath 2013)
Mouse hypermethylation
(Maegawa et al. 2010)
+ 297
+ 303
+ 309
+ 327
Hypermethylation, R2 = 0.409, P = 1.37 e -06
None, P > 0.05
Hypermethylation, R2 = 0.344, P = 1.39 e -05
None, P > 0.05
GRIA2
KF791965
Human hypermethylation
(Chakrabarti et al. 2001; Koch et al. 2011)
+ 202 Hypermethylation, R2 = 0.469, P = 1.26 e -07
TRIM58
KF791966
Human hypermethylation
(Koch et al. 2011)
+ 181
+ 190
+ 205
+ 222
+ 230
+ 257
+ 291
+ 295
+ 309
+ 312
+ 314
+ 323
+ 329
+ 332
+ 340
None, P > 0.05
None, P > 0.05
None, P > 0.05
None, P > 0.05
None, P > 0.05
None, P > 0.05
None, P > 0.05
None, P > 0.05
None, P > 0.05
None, P > 0.05
None, P > 0.05
None, P > 0.05
None, P > 0.05
None, P > 0.05
None, P > 0.05
HoxA9
KF791967
Human hypermethylation
(Grönniger et al. 2010; Koch et al. 2011)
+ 252
+ 255
+ 265
None, P > 0.05
None, P > 0.05
None, P > 0.05
DDAH2 Human hypermethylation
(Grönniger et al. 2010)
+ 31
+ 52
+ 65
+ 85
None, P > 0.05
None, P > 0.05
None, P > 0.05
None, P > 0.05
TOM1L1 Human hypermethylation
(Bocklandt et al. 2011)
+ 539
+ 533
+ 517
None, P > 0.05
None, P > 0.05
None, P > 0.05
Edaradd
KF791968
Human hypermethylation
(Bocklandt et al. 2011)
- 20
- 31
None, P > 0.05
None, P > 0.05
Acc
epte
d A
rtic
le
This article is protected by copyright. All rights reserved.
(A) TET2_CpG+31 (B) CDKN2A_CpG+297
R = 0.455 p = 2.26e-07 R = 0.471 p = 1.16e-07 R = 0.568 p = 1.38e-09222
(B) GRIA2_CpG+202
R = 0.787 p = 3.04e-162 Mean difference = 3.75Standard deviation = 2.99195% confidence interval = 8.947
Acc
epte
d A
rtic
le
This article is protected by copyright. All rights reserved.
λ = 0.0999
Prop
ortio
n
Prop
ortio
n
Acc
epte
d A
rtic
le
This article is protected by copyright. All rights reserved.
Age categories
>14-18 >22-26>18-22
>6-10>10-14 >26-30
>30-34>34-38
>38-42
1961
1962
1952to
1960
2009
2-6
Collapsing fishery 1961
Final fishery year 1962
Recovering population 2009
Early fishery 1952 - 1960
Humpback whale population age profiles for East Australia 1952-1962 and 2009