Embed Size (px)
Citation preview

EPIGENETIC REGULATION OF A GENE, MS-1, IN CELLS OF DIFFERENT METASTATIC POTENTIAL
A Thesis Submitted to the College of
Graduate Studies and Research
in Partial Fulfillment of the Requirements
for the Degree of Master of Science
in the Department of Microbiology and Immunology
University of Saskatchewan
Saskatoon
By
Natasha Alexsis Thiessen
© Copyright Natasha Alexsis Thiessen, October 2005. All rights reserved.

PERMISSION TO USE
In presenting this thesis in partial fulfilment of the requirements for a
Postgraduate degree from the University of Saskatchewan, I agree that the Libraries of
this University may make it freely available for inspection. I further agree that
permission for copying of this thesis in any manner, in whole or in part, for scholarly
purposes may be granted by the professor or professors who supervised my thesis work
or, in their absence, by the Head of the Department or the Dean of the College in which
my thesis work was done. It is understood that any copying or publication or use of this
thesis or parts thereof for financial gain shall not be allowed without my written
permission. It is also understood that due recognition shall be given to me and to the
University of Saskatchewan in any scholarly use which may be made of any material in
my thesis.
Requests for permission to copy or to make other use of material in this thesis in
whole or part should be addressed to:
Head of the Department of Microbiology and Immunology
University of Saskatchewan
Saskatoon, Saskatchewan S7N 0W0
i

ABSTRACT
Breast cancer is the most common malignancy and a major cause of cancer-
related death among Canadian women. Although treatment of primary breast tumours is
highly successful through surgery, metastatic breast cancer is difficult to treat. Cancer
progression and metastasis require the accumulation of numerous genetic and epigenetic
alterations. Normal cells that acquire such alterations can transform into cancer cells,
resulting in primary tumour formation. Primary tumours are a heterogeneous population,
containing cells of various metastatic potentials. Cells that acquire a high potential for
metastasis can spread to secondary locations. Our model system consists of two
subpopulations, with different metastatic potential, derived from the same rat mammary
adenocarcinoma. Using this model, a differentially expressed novel gene, termed MS-1,
was discovered. Due to significant expression of this gene in the poorly metastatic
subpopulation and lack of expression in the highly metastatic subpopulation, MS-1 may
have involvement in metastasis suppression. Several breast cancer metastasis suppressor
genes have been identified on the basis that they are down-regulated during the
progression of metastasis. Epigenetic mechanisms, such as DNA methylation, account
for loss of expression in several of these genes. Hypermethylation of CpG islands within
gene promoters results in deacetylation of histone proteins and produces a compact
chromatin structure that is unfavourable for transcription. A CpG island spans the 5’
untranslated region, exon 1 and part of intron 1 of the MS-1 gene. Our data reveal
ii

aberrant methylation patterns of this CpG island between the cell lines of different
metastatic potential in our model. Also, MS-1 expression was partially induced by both
DNA methylation and histone deacetylation inhibitors. Following a screen of several
cancer cell lines of varying metastatic potential, it appears that the presence of DNA
methylation in the CpG island of MS-1 correlates with the lack of MS-1 expression.
Therefore, these results suggest that MS-1 may be silenced in cells of high metastatic
potential through epigenetic mechanisms.
iii

ACKNOWLEDGEMENTS
The research presented in this thesis could not have been completed without the
significant contributions made by my supervisor, Dr. Svein Carlsen. I also thank my lab
companions: Arnie Senger, Leah Deibert and Lindsey Johnson for their cherished support
and friendship. I recognize the members of my Advisory Committee: Dr. Vikram Misra,
Dr. Keith Bonham, Dr. Wei Xiao, External Examiner: Dr. Rob Warrington and Advisory
Chair: Dr. Peter Bretscher.
I extend my appreciation to all members of the Cancer Research Unit of the
Saskatchewan Cancer Agency and the Department of Microbiology and Immunology of
the University of Saskatchewan.
This research was supported by a scholarship from the Natural Sciences and
Engineering Research Council of Canada and a grant from the Saskatchewan Cancer
Ageny.
iv

Several changes have occurred in my life throughout the duration of this research endeavor. My mother Merrilee and her courageous struggle with cancer gave me the strength to fight my own battles and the realization of what truly matters. The new-found love between my father Jerald and step-mother Shelley inspired me to believe that your dreams will come true if you face life with open arms. I also dedicate this work to my long-time friend Danielle, who is the sister I never had, and my brother Jeremy, who is so much more than that.
v

TABLE OF CONTENTS
PERMISSION TO USE i
ABSTRACT ii
ACKNOWLEDGEMENTS iv
DEDICATION v
LIST OF TABLES ix
LIST OF FIGURES x
ABBREVIATIONS xi
1.0 LITERATURE REVIEW 1
1.1 Breast Cancer and Metastasis ................................................................................... 1
1.2 Epigenetics................................................................................................................ 3
1.2.1 Epigenetic Code 3
1.2.2 Chromatin Structure 3
1.2.3 CpG Islands 4
1.2.4 DNA Methylation 5
1.2.5 Histone Modification 8
1.2.6 Transcriptional Repression 11
1.2.7 DNA Methylation and Tumourigenesis 15
1.3 Metastasis Suppressor Genes.................................................................................. 18
1.4 Relevance................................................................................................................ 22
1.5 Introduction to MS-1 ............................................................................................... 26
1.5.1 R3230AC Model System 26
1.5.2 MS-1 Identification and Differential Expression 27
1.5.3 Old Astrocyte Specifically Induced Substance (OASIS) 29
vi

1.5.4 Role of MS-1 30
1.6 Objectives ............................................................................................................... 32
2.0 MATERIALS AND METHODS 34
2.1 Materials ................................................................................................................. 34
2.1.1 Cell Lines 34
2.1.2 Bacterial Strains and Growth Conditions 35
2.1.3 Plasmids 36
2.1.4 Reagents and Supplies 36
2.2 Methods .................................................................................................................. 36
2.2.1 Tissue Culture Media and Techniques 36
2.2.1.2 Drug Treatments 37
2.2.2 RNA Methods 38
2.2.2.1 Total RNA Isolation 38
2.2.2.2 Northern Gel Electrophoresis and Transfer 38
2.2.2.3 Northern Blot Hybridization 40
2.2.2.4 Northern Blot Stripping 41
2.2.3 DNA Methods 41
2.2.3.1 Genomic DNA Isolation 41
2.2.3.2 Sodium Bisulfite Modification 42
2.2.3.3 PCR and Vector Construction 42
2.2.3.4 Bacterial Cell Transformation 44
2.2.3.5 Plasmid DNA Isolation 45
2.2.3.6 DNA Sequencing 46
2.2.3.7 Combined Bisulfite Restriction Analysis (COBRA) 46
vii

3.0 RESULTS 48
3.1 MS-1 Comparative Genomics ................................................................................. 48
3.2 Induction of MS-1 Expression ................................................................................ 50
3.2.1 MS-1 Induction following DAC and TSA Treatment 50
3.2.2 MS-1 Induction following SAM Treatment 54
3.3 Methylation Profiles of MS-1 CpG Islands............................................................. 56
3.3.1 Methylation of CpG Islands in Cells that do not express MS-1 56
3.3.2 Screening Various Cancer Cell Lines for Methylation 60
4.0 DISCUSSION 64
4.1 MS-1 Expression in Cells of Different Metastatic Potential .................................. 64
4.2 Epigenetic Regulation............................................................................................. 66
4.3 Inhibition of DNA Methyltransferase and Histone Deacetylase Activity .............. 67
4.4 Inhibition of Demethylase Activity ........................................................................ 69
4.5 Conclusions............................................................................................................. 72
4.6 Future Directions .................................................................................................... 73
5.0 REFERENCES 75
viii

LIST OF TABLES
2.1 PCR primers and annealing temperatures 43
3.1 Triplicate bisulfite sequencing analysis of rMS-1 and hMS-1 CpG islands 57
ix

LIST OF FIGURES
1.1 Schematic of epigenetic gene silencing 13
1.2 Schematic of DNMT, HDAC and DNA demethylase inhibition 14
1.3 Northern analysis demonstrating the differential expression of rMS-1 28
1.4 Northern analysis demonstrating the differential expression of hMS-1 29
3.1 MS-1 gene 48
3.2 Aligned rMS-1 and hMS-1 mRNA sequences 49
3.3 DAC and TSA induced rMS-1 expression 52
3.4 DAC and TSA induced hMS-1 expression 53
3.5 SAM induced rMS-1 expression 55
3.6 SAM induced hMS-1 expression 55
3.7 Methylation profiles of rMS-1 CpG Island 58 and hMS-1 CpG Island 51 58
3.8 Representative sequences of the MS-1 CpG islands 59
3.9 Restriction maps of rMS-1 CpG Island 58 and hMS-1 CpG Island 51 61
3.10 Comined Bisulfite Restriction Analysis of rMS-1 CpG Island 58 62
3.11 Comined Bisulfite Restriction Analysis of hMS-1 CpG Island 51 63
x

LIST OF ABBREVIATIONS
ADP Adenosine diphosphate
α-MEM Alpha-minimal essential medium
APL Acute promyelocytic leukemia
ATCC American Type Culture Collection
ATF Activating transcription factor
BCS Bovine calf serum
BRCA1 Breast cancer susceptibility protein 1
BRMS1 Breast cancer metastasis suppressor 1
bZIP Basic leucine zipper
CAb Complement antibody
cAMP Cyclic adenosine monophosphate
CBP CREB binding protein
cDNA Complementary deoxyribonucleic acid
CGBP Unmethylated-CpG-binding protein
COBRA Combined bisulfite restriction analysis
CpG Cytosine-phosphate-Guanine
CRE Cyclic AMP-response element
CREB cAMP-response element binding protein
CREB3L1 cAMP-response element binding protein 3-like 1
DAC 5-aza-2’-deoxycytidine
DAPK Death-associated protein kinase
dATP Deoxyadenosine triphophate
dCTP Deoxycytidine triphosphate
xi

DEPC Diethyl pyrocarbonate
DMEM Dulbecco’s modified eagles medium
DMH Differential methylation hybridization
DMSO Dimethylsulfoxide
DNA Deoxyribonucleic acid
DNMT DNA methyltransferase
ds Double stranded
DTT Dithiothreitol
ECIST Expressed CpG island sequence tag
EDTA Ethylenediamine tetraacetic acid
EGFR Epidermal growth factor receptor
ER Endoplasmic reticulum
ERSE ER stress-response element
EST Expressed sequence tag
FBS Fetal bovine serum
GAPD Glyceraldehyde-3-phosphate dehydrogenase
HAT Histone acetyltransferase
HDAC Histone deacetylase
hMS-1 Human MS-1
HMT Histone methyltransferase
HP1 Heterochromatin protein 1
iGb4Cer Isoglobotetraosylceramide, isogloboside
KAI1 Kangai protein1
LB Luria-Bertani
LG3 Lung three
xii

LN4 Lymph node four
LOH Loss of heterozygosity
MBD Methyl-CpG-binding domain protein
MDM2 Mouse double minute
MeCP2 Methyl-CpG-binding protein
MGMT O6-methylguanine-DNA methyltransferase
MKK4 Mitogen-activated protein kinase 4
MOPS 3-[N-mopholino] propane sulfonic acid
mRNA Messenger ribonucleic acid
MSP Methylation-specific PCR
MTA 5’-methylthioadenosine
MTA1 Metastasis-associated protein 1
MTHFR Methylene-tetrahydrofolate reductase
NCBI National Center for Biotechnology Information
NCoR Nuclear hormone receptor corepressor
NuRD Nucleosome remodeling histone deacetylase
OASIS Old Astrocyte Specifically Induced Substance
ORF Open reading frame
PBI Plant Biotechnology Institute
PBS Phosphate-buffered saline
PCR Polymerase chain reaction
PML Promyelocytic leukemia protein
RAR Retinoic acid receptor
Rb Retinoblastoma protein
RBP1 Rb-binding protein 1
xiii

RIP Regulated intramembrane proteolysis
rMS-1 Rat MS-1
RNA Ribonucleic acid
RNase Ribonuclease
RP58 Repressor protein 58
RT Room temperature
S1P Site-1 protease
S2P Site-2 protease
SAM S-adenosylmethionine
SDS Sodium dodecyl sulfate
SMRT Silencing mediator of retinoid and thyroid hormone receptor
ss Single stranded
SSC Standard saline citrate
TAE Tris-Acetic acid-EDTA
TE Tris-EDTA
TSA Trichostatin A
uPA Urokinase plasminogen activator
UPR Unfolded protein response
UV Ultraviolet
XBP1 X-box binding protein 1
X-gal 5-Bromo-4-chloro-3-indolyl-β-D-galactopyranoside
xiv

1.0 LITERATURE REVIEW
1.1 Breast Cancer and Metastasis
Breast cancer is the most common malignancy and a major cause of cancer-
related death among Canadian women. One in nine women is expected to develop breast
cancer during her lifetime and one in 27 will die of it [1]. Most women succumb to
breast cancer if tumours metastasize but cure rates exceed 90% if breast carcinomas
remain confined to breast tissue [2]. However, 5-year survival rates fall below 20% if
secondary metastases form [3]. Statistics show that early detection is essential for
optimal success in the treatment of breast cancer. However, a better understanding of the
metastatic process in human breast cancer should translate into substantial improvements
in therapeutic outcome for breast cancer patients [2].
Further understanding could lead to the identification of markers on cells with a
high probability of causing macroscopic metastases. Genetic markers could be used for
diagnosis of tumour type, grade and maybe disease stage, including prediction of
metastases location. Also, a better understanding of metastasis could result in identifying
gene targets for gene therapy, which may be used as an alternative to chemotherapy [4].
The identification of genes involved in metastasis could be exploited to alter the
metastatic cascade. For example, a mimetic could be developed either to prevent the

establishment of new metastases or to block the growth of metastases and possibly induce
regression of the metastases [3].
The characteristics of transformed cells include being anchorage-independent,
contact-uninhibited, immortal and having a several-fold decrease of genomic stability
compared to normal cells. Genomic instability appears to be the driving force for the
accumulation of genetic defects required for cells to become fully tumourigenic [2].
Tumour progression is the evolution of already tumourigenic cells towards increasing
malignancy. Malignancy is characterized by pathologists on the bases of morphologic
attributes, including less differentiated cytology, vascularity, necrosis, mitotic index, and
aneuploidy. Hallmarks of malignancy include invasion of cells through the basement
membrane and/or metastasis [3].
Metastasis is the progressive growth of cells at a site that is discontinuous from
the primary tumour [3]. Malignant cells invade adjacent tissues and penetrate the
lymphatic and/or circulatory systems. Cells can travel independently or as emboli that
are composed of tumour cells only (homotypic) or of tumour cells and normal cells
(heterotypic). Cells or emboli arrest at a secondary site either due to a physical limitation
or to binding specific molecules in particular organs or tissues. Tumour cells then
proliferate in the vasculature or extravasate into surrounding tissue [2]. Cells are able to
spread through the blood vasculature, lymphatics or within body cavities. Primary
tumours contain a heterogeneous population of cells with various metastatic potentials
[3]. Metastatic potential increases with the acquired the ability to complete each step of
the metastatic cascade. Low metastatic potential may be due to inherent deficiencies in
2

the tumour cells themselves caused by genetic alterations or to defective responses to the
host environment as a result of epigenetic regulation [3].
1.2 Epigenetics
1.2.1 Epigenetic Code
Epigenetics is the inheritance of information based on gene expression levels,
whereas genetics is the transmission of information based on gene sequences [5].
Epigenetic codes are potentially heritable but can be modified [6]. An epigenetic trait is
inherited during DNA replication and cell division but is independent of the DNA
nucleotide sequence itself [7] [8] [9]. Variations in DNA methylation and histone
modifications constitute a distinct epigenetic code that regulates gene expression. For
example, methylated DNA, deacetylated histones, some methylated histone forms and
condensed chromatin are associated with inaccessible DNA and repressed or silenced
gene expression whereas unmethylated DNA, some acetylated histone forms and open
chromatin are associated with active or potential gene expression [6].
1.2.2 Chromatin Structure
Chromatin is the complex of DNA and proteins in which the genetic material is
packaged inside the nucleus. It is organized into condensed heterochromatin and open
euchromatin. The nucleosome core particle includes ~145 bp of DNA wrapped around a
histone octamer core [10] [11]. Histones are the basic protein components of chromatin.
The nucleosome core particle consists of two copies each of histones H2A, H2B, H3 and
3

H4 [7] [11]. The basic unit of DNA structure is the nucleosome. Nucleosomes are
connected by ~10-80 bp of DNA, and are compacted by the linker histone H1 into
chromatin fibres of ~30 nm in diameter [6]. The complex of the histone octamer, linker
histone, and 166 bp of nucleosomal DNA is termed the chromatosome [11]. The DNA
wound around the histone octamer is accessible to regulatory proteins. The histone tails
are also accessible, and enzymes can chemically modify them to promote nucleosome
movement and unwinding [7].
There is considerable evidence to suggest that histones are not merely packaging
factors, but function to regulate gene expression. Histones facilitate gene activation by
promoting specific structural interactions between distal sequences and facilitate
repression by blocking the binding sites for transcription activators. The rate-limiting
biochemical response that leads to activation of gene expression involves alterations in
chromatin structure. The most compact form is inaccessible and provides a poor template
for biochemical reactions. There are several ways the chromatin structure can be altered:
the histones of the nucleosome can be covalently modified or histone variants can replace
the core histones [7].
1.2.3 CpG Islands
DNA methylation occurs at carbon 5 of cytosine residues 5’ to guanine residues,
or CpG dinucleotides. The CpG dinucleotide has been progressively depleted from the
eukaryotic genome during evolution due to spontaneous deamination of the unstable base
5-methylcytosine to uracil [12]. Methylated cytosine accounts for ~1% of the total DNA
bases; however, ~70% of all CpG dinucleotides are methylated [13]. Regions in the
4
genome that contain a high frequency of CpG dinucleotides are referred to as CpG
islands if they meet the following criteria: size ranging from 0.2 to 5 kb, occurring
approximately every 100 kb, GC-rich (60-70%) and having a CpG/GC ratio greater than
0.6 [12]. The human genome contains ~29,000 CpG islands [13]. They generally span
the 5’ end of some genes, including the promoter, untranslated region and exon 1 [14].
Most CpG islands remain unmethylated and are associated with highly active genes, such
as housekeeping genes [13] [15].
The transcription of genes is favourable when the appropriate transcription factors
are available, the histones are acetylated and unmethylated, and the cytosines in the CpG
island, if present, remain unmethylated [14]. CpG islands are generally protected from
methylation. Fully methylated CpG islands are found mostly in promoters of
retroviruses, transposons, silenced alleles, such as imprinted autosomal genes and genes
on the inactivated X-chromosome of females [13]. Normal protection of CpG islands
from methylation is mediated by certain transcription factors. For example, binding sites
for the transcription factor Sp1 appear to be critical for protection from methylation [8].
1.2.4 DNA Methylation
Genome stability and normal gene expression are maintained by a fixed and
predetermined pattern of DNA methylation [14]. DNA methylation protects the genome
from invading foreign DNA elements [6]. DNA methylation is mediated by two classes
of DNA methyltransferases (DNMTs). The methylated state of the parent DNA strand is
maintained in the daughter strands by DNMT1, a maintenance methyltransferase.
5

DNMT1 recognizes the hemimethylated site and methylates the unmethylated cytosine,
restoring the symmetrically methylated CpG dinucleotide pair [16].
DNMT3a and DNMT3b are responsible for de novo methylation. DNMT3a and
DNMT3b do not have a preference for hemimethylated CpG sites and can methylate
unmodified CpG sites as well [6]. DNMT3a and DNMT3b are structurally similar to
DNMT1 but with a regulatory region attached to the catalytic domain. The regulatory
region binds a variety of transcriptional repressors [17]. De novo methylation usually
occurs outside of a promoter CpG island and progressively spreads to the center of the
island. There are sequences in the promoter region that serve as a docking site for
repression complexes including histone deacetylases (HDACs), methyl-CpG-binding
proteins (MBDs), DNMTs and other proteins [18].
DNA methylation involves the addition of a methyl group to the DNA. A
cysteine SH group from the active site of the DNMT initiates nucleophilic attack at the
C6 position of the target cytosine by transient protonation of the cytosine ring at the
endocyclic nitrogen, N3, creating cytosine-4,5-enamine. This structure attacks the
sulphonium linked methyl group of S-adenosylmethionine (SAM). Following methyl
transfer, a proton is abstracted from C5, allowing reformation of the 5,6 double bond [9].
5-aza-2’-deoxycytidine (DAC) is a cytosine analogue that sequesters DNMT after its
incorporation into genomic DNA and therefore, functions as a DNMT inhibitor [18].
DNMTs methylate a specific target cytosine within a DNA molecule. To achieve
this specificity the enzyme needs to bring the target cytosine to its catalytic pocket. The
target cytosine is rotated on its sugar-phosphate backbone so that the target base is
6

flipped out into a typically concave active site pocket. This base-flipping phenomenon is
observed in several DNA methyltransferases [9].
Other mechanisms for DNMT specificity exist. Eukaryotic DNMTs exhibit no
sequence specificity other than the CpG dinucleotide. Other factors are likely required to
mediate the regional genomic specificity they exhibit. Targeting of DNMTs to particular
genomic regions may occur through protein-protein interactions. For example, DNMT1
is able to bind Rb, the retinoblastoma tumour suppressor protein, which is targeted to a
specific set of genes through interaction with the sequence-specific DNA-binding factor
E2F [17]. Methyl-CpG-binding protein, MeCP2, forms complexes with hemimethylated
as well as fully methylated DNA. DNMT1 associates with MeCP2 in order to perform
maintenance methylation [9]. DNMT3a binds RP58, a DNA-binding transcriptional
repressor, leading to methylation independent repression of the gene at an RP58-
responsive promoter [17]. DNMT3a also associates with HDAC1, leading to histone
deacetylase-mediated gene silencing [9]. DNMT3a co-localizes with HP1, a
heterochromatin protein, which binds to methylated histones. This association could be
important in directing DNA methylation to chromatin that contains methylated histones,
leading to long-term silencing [17].
Since DNA can be methylated, it is not surprising that it can also be
demethylated. Demethylation occurs during DNA replication. Mechanisms include the
loss of fidelity in DNMT1 maintenance methylation, exclusion of DNMT1 from
replication complexes and limiting DNMT1 levels. The result is that DNA methylation
patterns are not accurately copied to daughter strand DNA, generating hemimethylated
CpG sites that can become fully demethylated after rounds of DNA synthesis. The lack
7

of methylation in CpG islands appears to be passive, either through protection from
methylation machinery or by the displacement of such machinery. For example,
transcription factor Sp1 can bind to a methylated site and sterically exclude
methyltransferases [6]. It has been shown that SAM actively inhibits demethylase
activity and can inhibit expression of urokinase plasminogen activator (uPA), a
metastasis-promoting gene, through induction of methylation-dependent silencing [19].
The balance between methylation and demethylation is proposed as a mechanism for
switching the transcription of genes on or off [9].
1.2.5 Histone Modification
Tails of histone amino acids protrude from the nucleosome and are sites of post-
translational modification such as acetylation, methylation, phosphorylation, sumoylation
and ubiquitination [20]. Possible histone modifications represent a complex set of
epigenetic information with combinatorial potential known as the histone code. Histone
interactions with DNA and other proteins are affected by these modifications. Chemical
modifications, whether on the histone tails extending from the nucleosome surface or
within the body of the octamer, serve as signals for the binding of specific proteins [6].
The N-terminal tails on core histones are substrates for reversible lysine
acetylation [21]. Histone acetyltransferases (HATs) and histone deacetylases (HDACs)
govern the acetylation state of histones. HDACs remove the acetyl group from histones
using a charge-relay mechanism consisting of two adjacent histidine residues, two
aspartate residues and one tyrosine residue, and crucial for this charge-relay system is a
8

Zn2+ ion, which binds deep in the pocket of the enzyme. Inhibitors such as Trichostatin
A (TSA), function by displacing the zinc atom [10].
There are 19 deacetylase enzymes in humans, divided into three classes based on
differences in structure and function. The functions of these enzymes include:
controlling gene expression through targeted and non-targeted chromatin deacetylation,
promotion of transcriptional repression, and deacetylation of other non-histone proteins
including transcription factors [21]. Transcriptional activators are often associated with
HATs, and repressors often interact with HDACs [22].
The most studied group of HDACs are those of mammalian class I including
HDAC1, HDAC2, HDAC3 and HDAC8. HDAC1/2/3-containing complexes serve as
corepressors for many chromatin and transcriptional regulators. For example, these
HDACs collaborate with ATP-dependent chromatin remodelers. The HDAC1/2 complex
associates with DNMTs, which are also recruited by transcriptional regulators to repress
transcription, and histone methyltransferases (HMTs). HDAC1 interacts with
topoisomerase II, an enzyme that is essential for chromosome condensation and may be
involved in gene silencing [21].
There are three main mechanisms of histone deacetylase regulation: subcellular
compartmentalization, post-translational modification and formation of multisubunit
deacetylase complexes [21]. Association of certain proteins lead to cytoplasmic
localization of deacetylases by enhancing nuclear export whereas binding of other
chaperones stimulates nuclear localization. Increased phosphorylation of HDAC1/2
disrupts their complexes but specific phosphorylation stabilizes their complexes and
stimulates deacetylase activity. Sumoylation of HDAC1 is required for inducing cell-
9

cycle arrest and apoptotic responses. HDACs and their components are also targeted for
proteolytic processing by ubiquitin-dependent degradation. Interaction of HDACs with
certain transcriptional factors dictates targeting specificity to distinct genes or chromatin
domains [21]. For example, DNA-binding factors recruit the Sin3-HDAC complex and
result in histone deacetylation, leading to gene silencing [22].
The Sin3 complex is comprised of at least seven subunits, including HDAC1/2
and Sin3. There is an extensive list of mammalian proteins that repress transcription
through use of the Sin3 complex [22]. Nuclear hormone receptor binds to specific
promoters in the absence of hormone to repress transcription. Hormone binding produces
a conformational change in the complex, converting it to a transcriptional activator with
help from other recruited proteins. Unliganded retinoic acid receptor and thyroid
hormone receptor interact with corepressor proteins SMRT (silencing mediator of
retinoid and thyroid hormone receptor) and NCoR (nuclear hormone receptor
corepressor). SMRT and NCoR lead to transcriptional repression by recruiting the Sin3-
HDAC complex. Also, the methyl-CpG-binding protein MeCP2 is able to recruit the
Sin3-HDAC complex to methylated DNA.
The mammalian NuRD (nucleosome remodelling histone deacetylase) complex
also has seven subunits including: HDAC1/2, MTA2 and MBD3. MTA2 is related to
MTA1 (metastasis-associated protein 1), which is highly expressed in metastatic cells.
MBD3 (methyl-CpG-binding-domain protein 3) involvement suggests that nucleosome
remodelling and histone deacetylation abilities of the NuRD complex are targeted to
methylated regions of the genome [22].
10

There are several possible mechanisms for repression by histone deacetylation.
Histone deacetylation may specifically prevent the assembly of the transcription initiation
complex [22]. Localized histone deacetylation may stabilize nucleosomal structure and
internucleosomal histone-histone interactions to inhibit the DNA accessibility of
transcriptional activators and transcriptional machinery [21]. Normally, there is a strong
association between negatively-charged DNA and the positively-charged histones.
Acetylation neutralizes the charge on lysine residues within the histone tail, weakening
the DNA-histone association and allowing the binding of transcription machinery.
Deacetylation restabilizes this interaction. Acetyl-lysine residues may serve as a signal
for transcriptional regulators and removal of this signal by deacetylation might impair the
assembly or recruitment of transcriptional activators [22].
Deacetylation specific factors can inhibit RNA Polymerase I-dependent
transcription, suggesting that transcription machinery may be directly targeted [21].
Acetylation of sequence-specific transcriptional activators has been found to alter their
DNA-binding ability, activation potential, stability, nuclear localization and coactivator
interaction. Histone deacetylation neutralizes these effects. Histone deacetylation
removes acetyl groups and thereby promotes the association of silencers [21].
1.2.6 Transcriptional Repression
Maintenance and de novo DNA methylation are associated with the silencing of
gene expression through direct and indirect mechanisms. DNA-binding proteins can
directly target DNMTs to promoter regions, introducing hypermethylation and repressing
transcription. For example, the PML-RAR fusion protein induces gene hypermethylation
and silencing by recruiting DNMT1 and DNMT3a to target the RARβ2 promoter [9].
11

Indirect mechanisms involve the binding of methyl-CpG-binding proteins to methylated
promoters. Methyl-CpG-binding proteins can compete with or displace other DNA-
binding proteins and repress transcription of methylated promoters. A methyl-CpG-
binding protein can repress transcription through the recruitment of histone-modifying
complexes to methylated cytosines, which induces the formation of compact chromatin
and renders the locus less accessible to necessary transcription factors [6] (Figure 1.1).
Methyl-CpG-binding protein MeCP2 and methyl-CpG-binding domain proteins MBD2
and MBD3 contain histone deacetylases HDAC1 and HDAC2 and other transcriptional
co-repressors. MBD3 also resides in a complex with Mi2, a chromatin remodelling
protein. Therefore, methyl-CpG-binding proteins serve as a bridge between the two
major epigenetic mechanisms, DNA methylation and histone modification [17].
12

Transcription
Ac Ac Ac Ac Ac Ac Ac Ac Ac Ac
Ac Ac Ac Ac Ac
MBP MBP
MBP MBP
MBP
HDAC
DNA methylation
Methyl-CpG-binding protein
Histone deacetylase
Ac
Ac Ac
HDAC HDAC
HDAC HDAC
Repression
Figure 1.1 Schematic of epigenetic gene silencing.
The promoters of most actively transcribed genes may be occupied by both
activating and repressing protein complexes. Gene expression levels are then determined
by cellular signals influencing the amount of these complexes and post-translational
modifications of proteins in these complexes [8].
The possibility that DNA methylation patterns might be controlled by the
methylation status of histones emerged from genetic studies. A gene of Arabidopsis,
Kryptonite, is required for the maintenance of CpG methylation at silenced reporter
constructs and also encodes a histone methyltransferase [20]. It is possible to replace the
acetyl group at H3 Lys9 with one to three methyl groups. This was shown to be essential
13

for DNA methylation in fungus, suggesting that histone methylation may provide a signal
for DNA methylation [7]. Also, mutations in a putative histone methyltransferase result
in loss of CpG methylation, suggesting that histone methylation precedes DNA
methylation [18].
DNMT DNMT
DNMT DNMT
TSA DAC
Transcription
DAC
TSA
DAC
DNMT
Demethylase SAM
Ac Ac Ac Ac Ac Ac Ac Ac Ac Ac
Ac Ac Ac Ac Ac
Demethylase
SAM
HAT
HDAC
HDAC HDAC
HDAC HDAC
Figure 1.2 Schematic of DNMT, HDAC and DNA demethylase inhibition.
Evidence shows that pre-treatment of cells with DNMT inhibiting agents allows
greater reactivation of silenced genes by treatment with histone deacetylase inhibitors
(Figure 1.2). These results indicate that DNA methylation works in concert with methyl-
CpG-binding proteins and histone deacetylases in epigenetic transcriptional silencing of
genes [8]. Since DNA methyl-CpG-binding domain proteins and DNMT1 recruit
HDACs to methylated promoters and MBD-containing corepressors associate with
14

methylated CpG islands, it has been suggested that histone acetylation is secondary to
DNA methylation [18].
1.2.7 DNA Methylation and Tumourigenesis
Point mutations, deletions and insertions are present throughout the genome of a
neoplastic cell. However, a malignant cell has also acquired a different epigenotype [5].
Epigenetically mediated loss of gene function precedes and appears to be essential for
several genetic events that drive tumour progression [8].
A normal cell has to acquire several novel capabilities in order to become a bona
fide cancer cell: limitless replicative potential, self-sufficiency in growth signals,
insensitivity to growth-inhibitory signals, evasion of programmed cell death, sustained
angiogenesis and tissue invasion and metastasis [16]. A cancer cell acquires its unique
characteristics through a stepwise accumulation of heritable changes in the content of
proto-oncogenes, tumour suppressor genes, metastasis-promoting genes and metastasis
suppressor genes. While gain, loss and mutation of genetic information commonly
contribute to tumourigenesis, epigenetic mechanisms play an equally important role.
Methylation of CpG islands in promoter regions of tumour suppressor genes lead to
transcriptional silencing via histone deacetylation and chromatin remodelling,
representing a tumourigenic event functionally equivalent to genetic changes like
mutation and deletion. The two alleles of a tumour suppressor gene may be inactivated
by any combination of genetic and epigenetic events [13].
The process of CpG hypermethylation is probably progressive, consisting of
several steps of deregulated methylation. Cancer methylation may spread from normal
15
methylation centers surrounding the methylation-free CpG island. Certain CpG
dinucleotides may become methylated as a result of basal methylation, creating a focus
for further methylation [5]. Normally unmethylated CpG islands may become
methylated in cancer cells [18]. This may occur if hypermethylation confers a selective
advantage for the survival of that particular cancer cell [5]. DNA hypermethylation
events may cause the inactivation of genes involved in the cellular response to
chemotherapy, inactivation of ‘caretaker’ genes such as those involved in DNA repair
and protecting cells from carcinogenic agents [13].
Loss of cell cycle control resulting in unrestrained cell proliferation is a classic
event in tumourigenesis. Increased cell proliferation may required for epigenetic changes
in cancer cells, since CpG islands are not remethylated in non-dividing cells suggesting
that de novo CpG island methylation occurs only in dividing cells. Overexpression of
DNMTs in normal cells can produce aberrant de novo methylation of CpG islands and
promote cellular transformation. DNMT mRNA levels are regulated during the cell
cycle. Improper DNMT expression during the cell cycle can contribute to methylation
alterations in cancer cells. Hypermethylated CpG islands leave molecular footprints from
which the event of epigenetic progression can be reconstructed during tumourigenesis
[18].
Many cancer-related genes harbour dense methylation in normally unmethylated
promoter CpG islands, which affects most cellular pathways with many consequences [8]
[14]. For example, genes involved in DNA repair (MGMT), drug resistance, cell cycle
regulation (p16INK4a, p15INK4b, p14ARF), growth, differentiation, apoptosis (DAPK),
signalling, hormonal regulation (RARβ2), angiogenesis, cell adherence (CDH1),
16
metastasis and invasion, are associated with methylation-regulated gene silencing in
different tumour types [15] [12] [5].
The DAPK gene was isolated as a positive mediator of interferon-γ-induced
apoptosis. It also has a role in the activation of a p19ARF/p53 cell cycle checkpoint.
The loss of DAPK expression or methylation of its associated CpG island may
characterize highly invasive or metastatic tumours. Therefore, methylation or loss of
expression could be associated with a metastatic phenotype [15].
Hypermethylation of the cell-cycle inhibitor gene, p16INK4a, enables cancer cells
to escape senescence and begin to proliferate [14]. p53 is inactivated through
methylation-mediated silencing of the tumour suppressor gene p14ARF, which normally
inhibits MDM2, an oncogenic protein that induces p53 degradation. p73, a p53
homologue, is shown to be hypermethylated in leukemia [14]. DNA methylation affects
repair pathways by silencing DNA mismatch repair genes, hypermethylation of mitotic
checkpoint genes and preventing repair of DNA double-strand breaks [14].
In cancer, promoter hypermethylation is often associated with wide spread loss of
methylation throughout the genome and modest increases in expression of all three DNA
methyltransferases [16]. DNA from breast carcinomas is generally hypomethylated.
Global hypomethylation contributes to carcinogenesis through chromosomal instability,
reactivation of transposable elements and loss of imprinting [14] [13].
It appears that some genes are predisposed to CpG island hypermethylation.
Genes with the highest incidence of dense promoter hypermethylation in colon cancer
appear predisposed to this change by aging. Promoter CpG islands of these genes are
17

slightly methylated in the normal colon of young individuals. The density of methylation
increases with age and is highest in cancer [8].
Epigenetic alterations are among the most common molecular alterations in
human neoplasia, resulting in a revision of Knudson’s two-hit hypothesis. In addition to
the traditional two possibilities: loss of heterozygosity or homozygous deletion, a third
possibility can disable tumour suppressor genes: epigenetic silencing by DNA
methylation and histone deacetylation within promoter regions [16].
1.3 Metastasis Suppressor Genes
Metastasis suppressor genes are defined as genes responsible for suppressing
metastasis without affecting primary tumour growth [4]. Restoration of metastatic
suppressor gene expression would yield cells that are still tumourigenic but are no longer
metastatic. On the other hand, tumour suppressor genes suppress primary tumour growth
and, by default, suppress metastasis. Metastasis genes can be identified through
comparison of cell lines different in metastatic potential. Differential display, subtractive
hybridization and microarray technologies are all methods of measuring differential gene
expression. Identification of metastasis suppressors is much less complicated than of
metastasis-promoting genes, since many genes are required for the progression of
metastasis but the expression of only a single novel gene may suppress this progression
[4].
There are several examples whereby the expression of metastasis suppressor
genes is lost, not through conventional mutations, but via alternative epigenetic
mechanisms for loss-of-function [4]. Prostatin is a serine protease that decreases
18

invasiveness in vitro. Both prostatin mRNA and protein are detected in normal breast
cells, poorly invasive and nonmetastatic breast carcinoma cell lines but are not detected
in highly invasive or metastatic breast carcinoma cells. Demethylation coupled with
histone deacetylase inhibition mediated the reactivation of prostatin gene expression in
highly invasive, metastatic cell lines. Induced expression resulted in a 50% reduction of
in vitro invasiveness of these cells [16].
At least eight metastasis suppressor genes have been identified that show
involvement in breast cancer progression [4]. The first of these is E-cadherin, which is a
calcium-dependent mediator of cell-cell interactions [4]. Invasion and metastasis
involves changes in the physical coupling of cells to their microenvironment and
activation of extracellular processes. Epithelial cells maintain contact with their
neighbours through adherens junctions. Cadherins traverse the membrane, associating
with cadherins on adjacent cells [16]. Exogenous E-cadherin expression, via transfection,
decreases motility and invasiveness. High E-cadherin levels inhibit shedding of tumour
cells from the primary tumour and thus, E-cadherin is considered a metastasis suppressor
[3]. The E-cadherin gene (CDH1) is located on chromosome 16q22.1, a region
associated with loss of heterozygosity in cancer. However, gene loss may not solely be
responsible for CDH1 loss-of-function. Differential methylation patterns have been
identified in the CpG islands of the CDH1 promoter regions. In one study, promoter
methylation was not evident in normal breast epithelium but was evident in some breast
carcinomas. Hypomethylation of the CDH1 promoter correlates with increased gene
expression [4]. Direct involvement of hypermethylation in CDH1 gene suppression was
supported by the observation that its expression can be reactivated by DAC treatment [8].
19

Tissue inhibitors of metalloproteinases (TIMPs) inhibit the activity of matrix
proteinases by forming strong noncovalent complexes. Decreased matrix proteinase
activity results in less invasive cells and thus, inhibits metastasis [23]. TIMP-2 promoter
hypermethylation was detected in several leukemia and lymphoma cell lines and is
associated with transcriptional repression. Treatment with the demethylating agent DAC
resulted in TIMP-2 upregulation in these cell lines [24].
Nm23 was the first novel metastasis gene discovered. The human gene, NME1,
maps to chromosome 17q21 [4]. NME1 is a bona fide metastasis suppressor gene in
human breast carcinoma since transfection of metastatic MDA-MD-435 cells with NME1
suppressed metastasis [3]. Expression of NME1 was down-regulated in late-stage,
metastatic breast, endometrial, ovarian, melanoma and colon cancer. NME1 promoter
hypomethylation was associated with increased expression, suggesting epigenetic
mechanisms may regulate this gene [4]. The nm23 gene family exhibits metastasis
suppressor activity in breast cancer in vivo. Two CpG islands are present in the nm23-HI
promoter. Bisulfite sequencing of these CpG islands in a panel of cell lines and in 20
infiltrating ductal carcinomas revealed that one island exhibited infrequent differential
methylation. Treatment with DAC increased the nm23-HI expression in 5 of 11 human
breast carcinoma cell lines in vitro, including all three metastatically competent cell lines.
Increased nm23-HI expression was accompanied by a reduction in motility in vitro, with
minimal effect on proliferation [16].
Maspin is a member of the serpin family of serine protease inhibitors and is
located on chromosome 18q21.3-q23. In one study, six of seven mammary carcinoma
cells lines that did not express maspin exhibited aberrant methylation of the maspin
20

promoter. Maspin expression can be restored in these cell lines by treatment with the
hypomethylating agent, DAC [25].
Kai1 encodes an adhesion molecule that maps to chromosome 11p11.2, a region
commonly associated with breast cancer progression [2]. Transfection of Kai1 into
MDA-MB-435 cells suppressed metastasis from the mammary fat pad [3]. Kai1
expression inversely correlates with aggressive behaviour in breast cell lines. Survival of
patients with Kai1-negative tumours is significantly lower than of those with Kai1-
positive tumours. As with NME1 and maspin, the Kai1 promoter exhibits aberrant
methylation patterns [26].
KiSS1 is located on chromosome 1q32. Studies have shown an inverse
correlation of KiSS1 expression with melanoma metastatic potential [4]. KiSS1
expression is lost as melanoma cells convert from radial to vertical growth phase (benign
to malignant transformation). Transfection of KiSS1 into MDA-MD-435, which has no
endogenous KiSS1 expression, resulted in suppression of metastasis from the mammary
fat pad of athymic mice [3].
Introduction of a portion of chromosome 17 significantly suppresses the
metastatic ability of rat prostate AT6.1 cancer cells. MKK4 was identified in this region.
Transfection of a MKK4/SEK1 expression construct into AT6.1 significantly suppressed
metastasis without affecting primary tumour growth [3]. Studies on KiSS1 and MKK4
revealed that tumour cells defective for these two genes are able to complete every step
of the metastatic cascade except growth at the secondary site, implying that these genes
are metastasis suppressors [4].
21

The breast cancer metastasis suppressor 1 (BRMS1) gene is located on
chromosome 11q13.1-13.2, a region commonly altered in late-stage breast carcinomas
[2]. Transfection of BRMS1 into MDA-MB-435 and MDA-MB-231 breast carcinoma
cell lines suppressed metastasis without affecting tumourigenicity [3]. The BRMS1
protein is located in the nucleus, contains a glutamate-rich domain, an imperfect leucine
zipper and coiled-coil domains, suggesting that it may be part of a transcription complex
[4]. BRMS1 suppresses metastasis of multiple human and murine cancer cells without
inhibiting tumourigenicity. It was found to interact with retinoblastoma binding protein 1
and seven members of the HDAC complex using yeast two-hybrid and co-
immunoprecipitation techniques. BRMS1 was shown to be a component of an HDAC
complex, contributing to transcriptional repression [27].
1.4 Relevance
While genetic mutations confer a fixed irreversible state of gene inactivation,
epigenetic events do not interfere with the information content of the affected genes and
are potentially reversible. Epigenetic silencing can be alleviated by two mechanisms:
inhibition of DNA methylation and inhibition of histone deacetylation [13]. However,
drugs used to inhibit DNMTs can also cause global hypomethylation. Lower doses of
DAC combined with inhibitors of histone deacetylases such as TSA, depsipeptide,
suberoylanilide hydroxamic acid and sodium butyrate may reactivate epigenetically
silenced genes [14]. TSA was one of the first HDAC inhibitors identified as an anti-
proliferative agent, and although it has never progressed as a clinical candidate, it has
been a valuable tool in validating HDAC enzymes as potential anti-cancer targets [10].
22

A promising clinical scenario for the use of epigenetic therapy is acute
promyelocytic leukemia (APL), which is caused by transcriptional disruption induced by
the PML-RARα translocation. Inhibitors of histone deacetylases, inhibitors of DNA
methylation and differentiating factors have achieved success in APL patients [14].
Inhibitors of class I/II HDACs and DNMTs are currently in clinical trials for cancer
treatment. Research on these enzymes may improve the therapeutic potential of
deacetylase and DNMT inhibitors in ‘transcription therapy’ of human diseases, including
cancer [21].
CpG islands are mostly unmethylated in normal tissues but are methylated to
varying degrees in human cancers, including breast cancer [16]. DNA methylation serves
as a more useful tumour biomarker compared to other DNA alterations because there are
usually no interindividual variations in the methylation pattern of a particular gene. The
use of DNA methylation as a marker allows the establishment of highly sensitive and
universally applicable assays via methylation-specific PCR. A novel microarray
technique, differential methylation hybridization (DMH), allows for global analysis of
DNA methylation in cancer. In ovarian cancer, this approach has revealed tumour groups
with distinct methylation patterns that respond differently to chemotherapy. The use of
expressed CpG island sequence tags (ECISTs) has further refined DMH. GC-rich
regions of ECISTs are used to screen for methylated CpG sites in cancer cells and exon-
containing fragments of ECISTs are used to measure levels of gene expression [18].
Tumour-specific DNA is easily obtained from sputum of lung cancer patients, urine from
prostate cancer patients and serum of cancer patients to facilitate DMH screening [13].
23

Promoter hypermethylation of CpG islands in tumour suppressor genes occurs
early in tumourigenesis, implicating the possibility of early detection in cancer via DMH
screening [14]. Promoter hypermethylation is frequently associated with BRCA1
silencing in non-inherited breast and ovarian carcinomas [8]. Therefore, a DNA-based
approach to screening for breast cancer may complement the current mammography-
based approach [16].
Genes that are inactivated by promoter hypermethylation can be used as
prognostic factors. Methylation-associated silencing affects many genes in most cellular
pathways. Hypermethylation of DAPK and p16INK4a have been linked with poor
prognosis in colorectal cancer. Other possible aberrantly methylated genes awaiting
analysis for their relation to metastatic or angiogenic activity in primary tumours include
those encoding E-cadherin, H-cadherin and thrombospondin 1 [14].
Products of genes that are silenced by DNA methylation can be used as
biomarkers of response to therapy. The lack of effectiveness of antisteroidal drugs is a
consequence of methylation-mediated silencing of their respective cellular receptors.
Premalignant lesions become insensitive to retinoids because of epigenetic silencing of
genes that are crucial to the retinoid response, particularly the retinoic acid receptor. The
DNA repair gene MGMT, encoding protein O6-methylguanine-DNA methyltransferase,
undergoes transcriptional repression as a result of methylation-associated silencing.
MGMT is responsible for repairing the addition of alkyl groups to guanine. Tumours that
lost MGMT due to hypermethylation would be more sensitive to the action of alkylating
agents since their DNA lesions could not be repaired in the cancer cell [5]. Although
silencing of this gene alone is a poor prognostic factor because patients acquire more
24

mutations, hypermethylation of this enzyme’s promoter was indicative of a good
response to chemotherapy, greater overall survival and longer time in remission [14].
Hypermethylation of CpG islands occurs in conjunction with the action of
methyl-CpG-binding proteins, histone hypoacetylation and histone methylation, which all
contribute to formation of a closed chromatin state and transcriptional silencing. Several
pharmaceutical and biotechnology companies are using novel approaches such as
antisense constructs, ribozymes and RNA interference to target these elements of the
methylation machinery. Some companies are investigating the use of gene-therapy-like
strategies to reactivate specific methylated genes [14].
Chemoresistance is a major hindrance of effective chemotherapy. There are
several cellular and molecular mechanisms resulting in chemoresistance. The expression
of genes conferring chemoresistance can be reversibly turned off by DNA methylation.
Chemotherapy destroys cancer cells by inducing apoptosis, or programmed cell death.
Deregulation of genes involved in the activation or execution of apoptosis may serve as a
mechanism for chemoresistance. For example, loss of caspase-8 expression, an
apoptosis-related protein, resulted in resistance to cytotoxic drugs like doxorubicin and
cisplatin. Treatment of cells containing caspase-8 promoter hypermethylation with a
demethylating agent led to re-expression of caspase-8 and restored chemosensitivity [13].
25

1.5 Introduction to MS-1
1.5.1 R3230AC Model System
A rat mammary adenocarcinoma cell line was used to isolate two subpopulations
differing in metastatic phenotype in order to investigate properties unique to these
populations. The poorly metastasizing R3230AC rat mammary adenocarcinoma was
cyclically enriched for metastasizing cells to derive the highly metastatic LN4
subpopulation [28]. Briefly, female Fischer 344 rats were injected with 106 R3230AC
cells in the hind footpad, which is drained by the popliteal lymph node. These cells
metastasize initially through the lymphatic system making this a good model for many
human tumours, such as breast cancer, which metastasize initially through the
lymphatics. Infrequent lymph node metastases (10% of injected animals showed
evidence of metastases) were excised, the tumour cells grown in culture and subsequently
reinjected into another series of rats. The proportion of animals bearing lymph node
metastases progressively increased with sequential enrichments. After three (LN3) or
four (LN4) enrichments, the frequency of lymphatic metastasis increased to 100% of
injected animals [28].
An increased percentage of cells binding high levels of the lectin soybean
agglutinin (SBA) was observed with each enrichment cycle, and showed a strong
correlation with the metastatic potential of these cell populations [28]. The SBA binding
component on the surface of these cells was found to be a neutral glycosphingolipid,
identified as isoglobotetraosylceramide (iGb4Cer) [29] [30]. An R3230AC-LG3 cell line,
enriched for lung colony formation, also showed enrichment for iGb4Cer expression [30].
26

Depletion of the subpopulation of cells containing this cell surface marker within the
R3230AC-LN4 cell line by antibody-dependent complement-mediated cytolysis using the
anti-iGb4Cer monoclonal antibody 3E9 resulted in a cell population (CAb) with a
substantially decreased metastatic potential without significantly altering the primary
tumour growth rate [29]. Similarly, depletion of iGb4Cer expressing cells within the
R3230AC-LG3 cell line with antibody-dependent complement-mediated cytolysis
significantly reduced lung colony formation [30]. Blocking the iGb4Cer on the surface of
LG3 cells with the monoclonal antibody 3E9 or its Fab fragments greatly decreased lung
colony formation, suggesting it may play a direct role in the metastatic process [30].
1.5.2 MS-1 Identification and Differential Expression
The LN4 and CAb subpopulations of our model system have many similar
characteristics, such as tumourigenicity, but allow for the identification of genes that are
differentially expressed and that may be involved in generating the metastatic phenotype.
The production of iGb4Cer in metastatic cells was found to be associated with the loss of
the sialyltransferase enzyme GM3 synthase, which competes for a common intermediate
in iGb4Cer biosynthesis [31]. GM3 synthase was expressed in CAb cells but not in the
iGb4Cer-producing LN4 cell line. During attempts to isolate the GM3 synthase cDNA,
genes differentially expressed between the CAb and LN4 cells were isolated. A unique 1
kb sequence was isolated that hybridized to a 2.8 kb mRNA in the CAb subpopulation
but was undetectable in metastatic LN4 cells (Figure 1.3). This mRNA was distinct from
the reported rat GM3 synthase cDNA [32]. This differentially expressed novel gene was
termed MS-1 [33] [34]. The relationship between metastatic phenotype and expression of
27

rat MS-1 (rMS-1) was also seen in a Dunning rat prostate adenocarcinoma system (Figure
1.3). The poorly metastatic AT1 subpopulation showed high levels of rMS-1 while there
was no detectable rMS-1 expression in malignant MAT-LyLu cells [33].
rMS-1
GAPDH
LN4 CAb
2.7 kb
MAT-LyLu AT1
Figure 1.3 Northern analysis demonstrating the differential expression of rMS-1. A total of 10 μg of total RNA was loaded in each lane, transferred and probed with a 565 bp rMS-1 specific cDNA probe or 452 bp GAPD rat specific cDNA probe. (n>2) The observation that MS-1 expression varied in a number of rat cell lines led to
cloning and characterization of a human homologue of rMS-1. Northern analysis was
used to screen human breast tumour cell lines for MS-1 expression (Figure 1.4).
Hs578Bst, Hs578T and WiDr cells were positive for MS-1 expression, MDA-MB-231
cells were weakly positive for MS-1 expression, while MCF-7, MDA-MB-435, T-47D,
HEY, SW480 and SW620 cells were negative [34]. The information provided by ATCC
indicates that MDA-MB-231, MDA-MB-435, MCF-7 and T-47D were cell lines derived
from pleural effusion samples from female patients with advanced breast cancer. The
SW480 cell line was established from a primary adenocarcinoma of the colon and the
SW620 cell line was established from a lymph node metastasis taken from the same
patient one year later. The WiDr cell line was established from a colon adenocarcinoma.
28

The malignant ovarian epithelial cell line, HEY, was established from a human ovarian
carcinoma. Hs578T cells were recovered from a primary tumour of a breast cancer
patient and the Hs578Bst cell line was established from normal tissue peripheral to this
tumour. The majority of these results support our previous observation that MS-1
expression is limited to cells of low metastatic potential.
WiD
r
hMS-1
GAPDH
2.4 kb
Hs5
78B
st
Hs5
78T
MD
A-M
B-2
31
MD
A-M
B-4
35
T-4
7D
MC
F-7
WiD
r
HE
Y
SW62
0
SW48
0 Figure 1.4 Northern analysis demonstrating the differential expression of hMS-1. A total of 15µg total RNA was loaded in each lane, transferred and probed with a 558 bp hMS-1 cDNA specific probe or 452 bp GAPD human specific cDNA probe. (n>2)
1.5.3 Old Astrocyte Specifically Induced Substance (OASIS)
The murine homologue of MS-1, OASIS (Old Astrocyte Specifically Induced
Substance), was identified and characterized [35]. It was specifically induced in long-
term cultured mouse astrocytes, an in vitro model of gliosis. Gliosis, the injury response
of astrocytes in the central nervous system, is characterized by the phenotypic
modification, proliferation and migration of reactive astrocytes [36]. OASIS expression
29

was induced in gliotic tissues following cryo-injury of the cerebral cortex or spinal cord
injury, suggesting it may play a role in gliotic events [35] [37].
OASIS was strongly expressed in embryonic tissues including salivary gland,
tooth germs, bone and cartilage [35] [37]. OASIS showed transient upregulation in the
mouse brain during the two weeks postnatal and weaker expression in the adult,
suggesting it to be a developmentally regulated gene [35]. Other suggested roles include
involvement in osteogenesis, as OASIS expression overlapped several osteogenesis
markers. Expression patterns of OASIS throughout development of bone and cartilage
were similar to expression of the gene encoding X-box binding protein, XBP1, another
basic leucine zipper (bZIP) transcription factor [37].
It was shown by Nikaido et al. that the OASIS protein could specifically bind the
cAMP response element (CRE) consensus sequence, consistent with other CREB family
members [38]. A transcriptional activation domain was identified at the amino-terminus
of OASIS [37] [39]. Fusion proteins with the Gal4 DNA binding domain and OASIS
were able to activate transcription of luciferase reporter constructs. The minimum region
of CREB3L1 required for this transcriptional activation was identified between amino
acids 1 and 60 [39].
1.5.4 Role of MS-1
The evolutionary conservation of MS-1 illustrated by sequence homology
between the human, rat and mouse genomes implies a functional requirement. The
widespread expression of MS-1 in tissues of all three species, including embryonic
tissues, suggests that it is a normally expressed factor that may be involved in
30

development. Expression profiles of OASIS suggest roles in gliosis, salivary gland
development and osteogenesis.
The MS-1 protein contains a transactivation domain, basic region, leucine zipper
and transmembrane domain. Immunofluorescence analysis determined the subcellular
localization of MS-1 to be within the cytosol in the vicinity of Rhodamine B-stained
endoplasmic reticulum (ER). Truncation of the carboxy-terminus, which contains the
transmembrane domain, altered localization to the nucleus in addition to the cytosol [34].
MS-1 is a novel CREB/ATF family transcription factor that seems to be involved in
signal transduction from the ER to the nucleus. Studies indicate MS-1 is cleaved by
regulated intramembrane proteolysis (RIP), producing the truncated, active MS-1
transcription factor [34]. RIP is a process that allows cells to respond quickly to
physiological crises by activating pre-made transcription factors [40]. MS-1 undergoes
RIP following treatment with chemical inducers of ER stress [34].
Studies on OASIS reveal that the protein is cleaved in response to ER stress and
that mutations at site-1 and site-2 protease sites prevents this cleavage. Also, OASIS
mRNA is induced in astrocytes following treatment with various ER stressors. OASIS
has been characterized as an ER-stress transducer for the unfolded protein response
(UPR). Endogenous OASIS binds to CRE and ER response element (ERSE) sequences
within the BiP promoter, inducing its expression, in response to ER stress. BiP is a UPR
target gene that functions as a cytoprotective protein in stress cells. It was proposed that
OASIS could protect cells from ER stress. Studies showed that OASIS-transfected cells
had a higher resistance to ER stress-induced cell death and that knockdown of OASIS
expression caused cells to undergo apoptosis [40].
31

The inverse relationship between the metastatic phenotype and MS-1 expression
presents the possibility that the MS-1 protein may have a role in suppressing metastasis.
As primary tumours grow in size, the cancer cells experience hypoxia, nutrient starvation
and acidosis, which hinders cell proliferation and can result in cell death [41]. Cells may
adapt to this ischemic environment by producing pro-angiogenic factors that initiate the
formation of new blood vessels to the tumour, and allow the tumour cells to enter the
bloodstream and metastasize. However, conditions within the tumour microenvironment
also result in ER stress and gene expression changes through the UPR signalling pathway
[41]. ER stress results in RIP cleavage of MS-1, which was shown to induce BiP
expression and protect cells from ER stress-induced apoptosis. Therefore, it is possible
that MS-1 protects primary tumour cells from undergoing apoptosis, even under ischemic
conditions, eliminating both the requirement for angiogenesis and the opportunity for
metastasis. In the absence of MS-1 there would be no induction of BiP and thus, no
protection from ER stress-induced apoptosis. Tumour cells lacking MS-1 expression
would require angiogenesis for survival. It has been shown that following nutrient
deprivation, hypoxia and ER stress, pro-angiogenic factors are induced in metastatic
breast cancer cell lines MCF-7 and T-47D, which do not express MS-1 [41].
If MS-1 is shown to be involved in suppressing metastasis, it may play future
roles as a marker for diagnosis and in the treatment of metastatic breast cancer.
1.6 Objectives
The study of epigenetic gene regulation has presented a relatively novel model for
understanding the control of gene expression in the progression of various diseases,
32

including cancer metastasis. A number of genes appear to inhibit the metastatic process.
Such genes are commonly identified on the basis that they are lost or down regulated
during the progression of metastasis. The discovery of a novel gene, MS-1, whose
expression appears limited to cells of low metastatic potential, led to the suggestion that
this gene may play a role in metastasis. The presence of a CpG island in the 5’ region of
MS-1 promoted an investigation of epigenetic silencing of MS-1 in highly metastatic
cells. The purpose of the following research was to investigate the mechanism by which
MS-1 expression is down regulated in cells of high metastatic potential. This research
identified different methylation profiles of the MS-1 CpG island in cells of different
metastatic potential. It also uncovered possible mechanisms by which this methylation
profile may be altered via reversal of epigenetic silencing mechanisms. This evidence
presents a novel application for demethylating agents, which are currently in clinical
trials, and provides reasoning to further research on epigenetic therapy as a possibility in
cancer treatment.
33

2.0 MATERIALS AND METHODS
2.1 Materials
2.1.1 Cell Lines
LN4.D6 is a clone of the highly metastatic LN4 subpopulation of the rat mammary
adenocarcinoma R3230AC, selected by cyclic enrichment of increased metastatic ability
[28]. These cells were found to specifically express high levels of the neutral glycolipid,
isoglobotetraosylceramide. CAb.D5 is a clone selected from the poorly metastatic
subpopulation (CAb), which was selected from the highly metastatic LN4 subpopulation
by depletion of cells expressing this glycolipid marker by treatment with complement and
antibody against this glycolipid surface marker [29].
Both AT1 and MAT-LyLu sublines were derived from the original spontaneous
dorsal prostatic adenocarcinoma tumour R3327 initially discovered in 1961 by W.F.
Dunning in a 22-month-old inbred Copenhagen male rat [42]. The AT1 subline was
serially passaged and rarely produced distant metastases [43]. MAT-LyLu is the
metastatic subline derived from successive in vivo passages of the AT1 tumour [44].
MAT-LyLu readily formed metastases in the lymph nodes and the lungs. Both cell lines
were obtained from the European Collection of Cell Cultures.
34

Hs578T cells were derived from a human breast carcinoma. The Hs578Bst cell
line was established from normal tissue peripheral to this tumour [45]. MDA-MB-231,
MDA-MB-435, T-47D, and MCF-7 cell lines were isolated from the pleural effusions of
patients with breast carcinoma [46] [47] [48]. All human breast cancer cells were
obtained from the American Type Culture Collection (ATCC) except MDA-MB-435
cells, which were kindly supplied by Dr. J. Price (MD Anderson Cancer Center, Texas).
The SW480 cell line was established from a primary adenocarcinoma of the colon and
the SW620 cell line was established from a lymph node metastasis taken from the same
patient one year later. The WiDr cell line was established from a colon adenocarcinoma.
SW480, SW620 and WiDr cell lines were kindly supplied by Dr. K. Bonham (Saskatoon
Cancer Centre). The malignant ovarian epithelial cell line, HEY, was established from a
human ovarian carcinoma and kindly provided by Dr. R. Hickie (University of
Saskatchewan).
2.1.2 Bacterial Strains and Growth Conditions
Escherichia coli (E. coli) strain INVαF’ [F’ endA1 recA1 hsdR17 (rk-, mk
+)
supE44 thi-1 gyrA96 relA1 Φ80lacZΔM15 Δ(lacZYA-argF)U169 λ-] (Invitrogen) was
grown in Luria-Bertani Broth (LB, Difco laboratories) containing 1.0% (w/v) bacto-
tryptone, 0.5% (w/v) bacto-yeast extract and 1.0% (w/v) NaCl pH 7.0. The LB
ingredients were dissolved in deionized water and autoclaved for 20 min at 120ºC. For
selective growth of transformed bacteria 100 μg/mL of ampicillin was added and all
cultures were grown at 37°C while shaking at 300 rpm.
35

2.1.3 Plasmids
The plasmid pCR2.1 (Invitrogen) was used for direct cloning and sequencing of
PCR purified amplifications of either rMS-1 or hMS-1 CpG islands.
2.1.4 Reagents and Supplies
All chemicals and enzymes used were of analytical grade or higher, and were
purchased from BDH, Sigma, or VWR unless otherwise stated.
2.2 Methods
2.2.1 Tissue Culture Media and Techniques
Rat cell lines LN4.D6, CAb.D5, MAT-LyLu and AT1 were cultured in RPMI
1640 (Invitrogen) supplemented with 10% bovine calf serum (BCS, HyClone
Laboratories, Logan, Utah, U.S.A), 100 U/mL penicillin, and 100 μg/mL streptomycin.
MAT-LyLu and AT1 media was supplemented with 2 mM L-glutamine, and 250 μM
dexamethasone. All media for human cells contained 10 % fetal bovine serum (FBS,
Cansera), 100 U/mL penicillin, and 100 μg/mL streptomycin. Hs578Bst cells were
maintained in Hybri-care medium (ATCC) with 30 ng/mL epidermal growth factor.
MCF-7 cells were grown in alpha-minimal essential medium (α-MEM, Invitrogen).
SW480 and SW620 cells were maintained in Dulbecco’s modified eagles medium
(DMEM, Invitrogen). WiDr cells were grown in minimal essential medium (MEM,
Invitrogen). Hs578T, T-47D, MDA-MB-231, MDA-MB-435 and HEY cells were
cultured in RPMI 1640 (Invitrogen). Hs578T and T-47D media was supplemented with
36

0.2 U/mL Humulin-R insulin (Lilly), as well as 2 mM L-glutamine for Hs578T cells.
Cultures were maintained at 37˚C with 5% CO2 and 100% relative humidity.
To remove all adherent cells, the existing media was removed and cells were
covered in a citrate saline (pH 7.8) solution containing 0.25% (w/v) trypsin (Gibco) for
15-30 seconds before the excess solution was decanted. A thin layer of trypsin solution
was left on the cells until adequate dissociation was achieved. To block the proteolytic
action of the trypsin, an excess of media containing serum was added, the cells were
resuspended and transferred to a 15 mL conical centrifuge tube for harvesting by
centrifugation at 500 x g for 5 min. Cell pellets were resuspended in complete media,
and an aliquot of the cells was seeded into a new flask containing complete media.
To appropriately store cells for later use, cells in a 175 cm2 flask of approximately
70% confluence were harvested, as described above, and resuspended in 5 mL complete
media with 10% (v/v) dimethyl sulfoxide (DMSO). Approximately 1.5 mL of cell
suspension was added to 1.8 mL Cryotube™ vials (NUNC Brand Products), and the
tubes were immediately placed at –70°C, and if required, transferred to liquid nitrogen
the next day.
2.2.1.2 Drug Treatments
CAb, LN4, Hs578T and MDA-MB-435 cells were grown to 60-70% confluence in
10 cm2 plates with complete media and standard environmental conditions. Cells were
treated with either 1 μM 5-aza-2’-deoxycytidine (DAC) for 96 hours and/or 1 μM
trichostatin A (TSA) for 3, 6, 12 or 24 hours, and incubated at standard environmental
conditions. Six day treatments with 100 μM S-adenosylmethionine (SAM) began at 20-
37

30% confluency. Cells were then removed from the plates, total RNA isolated and
Northern analysis performed or genomic DNA isolated as described below.
2.2.2 RNA Methods
2.2.2.1 Total RNA Isolation
Total RNA was isolated using an RNeasy Kit (Qiagen). Cells were grown to
approximately 80% confluency in complete media in a 15 cm2 plate as described above.
The media was removed from the plate and the cells were rinsed with phosphate-buffered
saline (PBS). Cells were lysed directly in the culture dish in Buffer RLT, 4 mL for
Qiagen’s RNeasy Midi Kit and 400 μL for Qiagen’s RNeasy Mini Kit. Total RNA was
isolated according to the manufacturer’s instructions for total RNA isolation from animal
cells.
RNA concentrations were determined by measuring the absorbance of the RNA
samples at wavelength of 260 nm using a Pharmacia Biotech Ultraspec 3000 UV/Visible
spectrophotometer. Samples were stored at –70°C.
2.2.2.2 Northern Gel Electrophoresis and Transfer
A 1.2% agarose gel was prepared with 2.4 g agarose, 20 mL 10X MOPS solution
(42% (w/v) 3-[N-Morpholino] propane sulfonic acid (MOPS), 0.05 M sodium acetate, pH
7.0, 0.01M Ethylenediamine tetraactetic acid (EDTA)), 170 mL DEPC water and 10.8
mL formaldehyde, and the gel was cast in a Model H5 Horizontal Gel Electrophoresis
System stand (Life Technologies). The samples for electrophoresis were prepared by
38

combining the appropriate quantity of RNA sample with Northern blotting buffer (48 %
v/v formamide, 11% v/v 10X MOPS, 17% v/v 37% formaldehyde, 12% v/v DEPC water,
7 % v/v 80% glycerol, 5% v/v 0.25% bromophenol blue solution) for a total volume of 30
μL. Each sample was heated at 65°C for 1-2 min and placed on ice for an equivalent
amount of time.
The gel was run in 1X MOPS buffer for 3 hr at 70 V. To confirm the presence
and stability of the RNA, the gel was washed 6 times with distilled water for 5 min each
and stained with 0.33 μg/mL ethidium bromide in distilled water for 5 min. The ethidium
stain was removed by 3 distilled water washes of 7-10 min each. The RNA gel was then
photographed before the markers were imprinted on the gel using Pelikan Drawing ink Z
(Pelikan AG, Germany).
The RNA was hydrolyzed for 15 min in 50 mM NaOH, followed by a 15 min
rinse in distilled water, and neutralized in 100 mM Tris-HCl, pH 8.0 for 15 min. A final
15 min rinse with distilled water was performed before membrane transfer. Transfer to a
positively charged nylon membrane (Gene Screen Plus, Perkin Elmer) was achieved
using the sandwich setup [49]. The membrane and 3MM papers were soaked in 50 mM
sodium phosphate, pH 6.7 prior to apparatus assembly. The transfer was carried out
overnight in the presence of excess 50 mM sodium phosphate, pH 6.7.
The transfer apparatus was disassembled the following day, and the RNA size
markers were impressed on the membrane for later reference. The transferred RNA was
permanently associated to the membrane by UV cross-linking with 1.2 x 10⁵ μJoules (UV
Stratalinker 2400). The membrane was rinsed in 2 x SSC (300 mM NaCl, 30 mM
sodium citrate) before being placed in a hybridization bag and stored at –20°C.
39

2.2.2.3 Northern Blot Hybridization
Probes used for hybridization were amplified from either rat or human cDNA
using standard PCR conditions (described below). Table 1 outlines the primers and
annealing temperatures specific for each cDNA probe. Due to high sequence homology,
the same primer set can be used to amplify the GAPDH probe from either rat or human
cDNA. To prepare a cDNA probe for Northern blot hybridization, 50 ng of double
stranded cDNA was resuspended in TE (10 mM Tris HCl, pH 8.0, 1 mM EDTA) buffer
to a final volume of 45 μL. The DNA was denatured by heating it for 5 min at 95°C, and
snap cooled on ice for 5 min. The cDNA was added to the reaction tube (Amersham
Biosciences RediprimeTM II Random Prime Labelling System) with 50 μCi α [32P]-dCTP,
and mixed. The reaction was incubated at 37°C for 10 min.
The Northern membrane, as previously described, was thawed and rinsed in 0.5%
SDS solution for 5 min. Prehybridization of the membrane was performed by incubating
in 20-30 mL Express-hyb solution (Clontech) for a minimum of 30 min at 68°C.
The labelling reaction was stopped by adding 5 μL of 0.2 M EDTA to the
reaction. The dscDNA radiolabeled probe was denatured in a boiling water bath for 5
min, snap cooled on ice for 5 min, and added to the hybridization tube containing 20-30
mL of Express-Hyb solution. The hybridization reaction was performed at 68°C for 17-
22 hr. All hybridizations and subsequent washes were performed in a HYBAID Midi
Oven (BIO/CAN Scientific).
Membranes were washed 3 times in wash solution #1 [2X SSC, 0.05% sodium
dodecyl sulfate (SDS)] for 5-10 min each at 68°C. Each membrane was then washed 2
times in wash solution #2 (0.1X SSC, 0.1% SDS) for 20 min each at 50°C. Upon
40

completion, the membranes were exposed to an Imaging Screen K (Kodak) for use in a
Molecular Imager FX phosphor imager (Bio-Rad). The expression of MS-1 was
standardized to the expression of a control, GAPDH, by densitometric analysis using
Quantity One version 4.3.1 software.
2.2.2.4 Northern Blot Stripping
In order to probe a previously hybridized membrane, the cDNA probe was first
removed by stripping the membrane. Membranes were soaked in approximately 1 L of
boiling stripping solution (0.1% SDS, 0.1X SSC) for 20-30 min followed by 5 min in 2X
SSC at 60°C. Membranes were exposed to autoradiographic film or phosphor imager
screen for 2-18 hr to confirm successful removal of the previous cDNA radiolabelled
probe. Once adequate stripping was achieved, all membranes were stored at –20°C.
2.2.3 DNA Methods
2.2.3.1 Genomic DNA Isolation
A QIAamp DNA Mini Kit (Qiagen) was used to extract genomic DNA from cells.
A 175 cm2 flask of each cell line of interest was grown to confluence. The cells were
harvested as previously described and washed once with PBS. They were resuspended in
200 µL PBS and 20 µL of both RNase A and proteinase K was added. The genomic
DNA was extracted following the manufacturer’s instructions.
The DNA concentrations were determined by measuring absorbance at 260 nm
using a Pharmacia Biotech Ultraspec 3000 UV/Visible spectrophotometer.
41

2.2.3.2 Sodium Bisulfite Modification
An EZ DNA Methylation Kit™ (Zymo Research) was used to sodium bisulfite
modify isolated genomic DNA, following manufacturer’s instructions. In brief, after
genomic DNA isolation and purification, 2 µg of genomic DNA were treated with sodium
bisulfite for 16 h. After purification, a 2-µl aliquot was used as a template for PCR using
ambiguous primers specific for neither methylated nor unmethylated DNA.
2.2.3.3 PCR and Vector Construction
Different primer sets were designed to amplify either the rMS-1 or hMS-1 CpG
island from a genomic DNA template using polymerase chain reaction (PCR) (see Table
2). Generally, 2 μL of genomic DNA was mixed in a 50 μL reaction containing 200 nM
of each primer, 0.8 mM dNTPs, 1X PCR buffer (Qiagen), and 2.5 units of either Taq
DNA Polymerase (Qiagen) for untreated templates or HotStarTaq DNA Polymerase
(Qiagen) for sodium bisulfite modified templates in thin-walled PCR tubes. The contents
were mixed thoroughly and placed into a thermocycler (Perkin-Elmer 2400). Reactions
containing untreated templates were denatured for 5 min at 96°C, followed by 35 cycles
with a denaturation period of 1 min at 98°C, 30 seconds for annealing (See Table 1 for
annealing temperatures), and a 72°C extension interval for 2 min. Cycles were followed
by a 7 min hold at 72°C and a final hold at 4ºC. Reactions containing sodium bisulfite
modified templates were denatured for 15 min at 96ºC, followed by the profile described
above. Nested PCR was performed using 2 μL of the primary PCR product as a template.
To verify that the fragment of interest had been specifically amplified, the product
was mixed with DNA running buffer (3.7 % (w/v) EDTA, 1% (w/v) SDS, 0.1% (w/v)
42

bromophenol blue, 4% (v/v) glycerol), then separated on a 1% TAE (24.2 % w/v Tris, 5.7
% v/v glacial acetic acid, 0.05 M EDTA, pH 8.0) agarose gel along with a DNA marker
(generally Fermentas 100 bp DNA step ladder or 1 kb marker). The gel was stained with
ethidium bromide to facilitate visualization of the DNA. All DNA gels were run in 1X
TAE buffer for 30-50 min at 90 V. Agarose gels were photographed using a UV
transilluminator/Gel documentation system (Bio-Rad).
Table 2.1 PCR primers and annealing temperatures.
Primer Name (annealing temp ˚C)
Resulting Product (bp)
Primer Sequence (5’ to 3’)
SAC-223 SAC-224 (60)
1º rMS-1 CpG58 in untreated DNA (1345)
TGGGGATTGGTGTCTTGTTAGTTC GGTTTACTTCAGGGTTTAGTGCC
SAC-225 SAC-226 (59)
Nested rMS-1 CpG58 in untreated DNA (980)
GAAGCCAGAGACCAATGTG GTTTCCAGGATAGTTTTGCC
SAC-265 SAC-266 (51)
1º rMS-1 CpG58 in modified DNA (1263)
TGGTGTATTTGATAGAGGTAAGGGG CRAAAACCCCCRACCCCTCCTTATC
SAC-267 SAC-257 (48)
Nested rMS-1 CpG58 in modified DNA (995)
CCTTGTGCTTTGTTCTGGTGCTGGGC TGCCAGGTGAGGGTCAGGTAGTCC
SAC-131 SAC-302 (62)
1º hMS-1 CpG51 in untreated DNA (1202)
GGAGACGCAGAGACAGAGGAGAG TAGGGAGAGGGAGAAAGTCAGC
SAC-134 SAC-303 (63)
Nested hMS-1 CpG51 in untreated DNA (946)
GAGGTGGAGTCGGCTGAATGC ATCACCCTATGTTGCCCTGACC
SAC-304 SAC-305 (50)
1º hMS-1 CpG51 in modified DNA (960)
AGTTGTGTTTTAGGAGGAGTAGG TTACCCTAACCRCCTCTTCC
43

SAC-306 SAC-307 (50)
Nested hMS-1 CpG51 in modified DNA (856)
GTYGGTTGAATGTTTAYGGTG TCCCTAAAACTACCAAAATAACAC
SAC-60 SAC-68 (59)
rMS-1 cDNA probe (565)
CTTGGGAGACCTGAATGAGTCG TGCTGGGGGGTGTTGGAGGCATC
SAC-84 SAC-85 (63)
hMS-1 cDNA probe (558)
GCACTTTCCTGAGCACCTGGACCACTTTA TGGGAGCCGTCGCTGTCACTGC
SAC-140 SAC-141 (58)
GAPDH cDNA probe (452)
ACCACAGTCCATGCCATCAC TCCACCACCCTGTTGCTGTA
SAC-323 pCR2.1 Sequencing (forward)
GTAAAACGACGGCCAG
SAC-324 pCR2.1 Sequencing (reverse)
CAGGAAACAGCTATGAC
For future ligation into the pCR2.1 vector (Invitrogen), 2.5 units of Taq
polymerase (Qiagen) was added to the reaction tube which was incubated at 37°C for 20
min and 72°C for 20 min. This resulted in the addition of dATP to the 3’ end of the PCR
products for direct ligation into pCR2.1, which has a single 5’ thymidine overhang. The
fragment was ligated into pCR2.1 in a 10 µL reaction containing 1X ligation buffer (TA
Cloning Kit, Invitrogen), ~50 ng pCR2.1 vector, ~10 ng fresh PCR product and 4 Weiss
units of Quickligase (Invitrogen). The contents were incubated at room temperature for
10 min and stored at -20ºC.
2.2.3.4 Bacterial Cell Transformation
For transformations, an aliquot of frozen INVaF’ competent cells was thawed on
ice. The ligation reaction (3 μL) was added to the cells and placed on ice for 30 min
followed by a 30 sec heat shock at 42°C. The reaction vial was placed on ice for 2 min
44

before 250 μL of pre-warmed SOC (2.0% tryptone, 0.5% yeast extract, 10 mM NaCl, 2.5
mM KCl, 10 mM MgCl2-6H2O, 20 mM glucose) medium was added. The cells were
shaken at 37°C for 1 hr at 225 rpm in a gyratory shaker.
To ensure that isolated colonies would be formed, 100 μL and 150 μL of
transformed competent cells were plated on 100 mm diameter plates of LB agar
containing 100 μg/mL ampicillin and 40 μL of 20 mg/mL X-gal (5-Bromo-4-chloro-3-
indolyl-β-D-galactopyranoside) from Invitrogen. The plates were incubated at 37°C
overnight. Cells transformed with a successfully ligated pCR2.1 construct formed white
colonies, while those that retained the uninterrupted lacZα gene fragment formed blue
colonies. Several white colonies were streaked on additional LB agar plates containing
100 μg/mL ampicillin for further analysis.
2.2.3.5 Plasmid DNA Isolation
A 2-5 mL LB broth (+100 μg/mL amp) culture was inoculated with a wire loop of
bacterial transformant and incubated overnight in a shaker at 300 rpm and 37°C. The
following day, 1.5-3.0 mL of bacterial culture was centrifuged at 9600 x g for 30-60 sec.
The supernatant was aspirated off and the pellet was resuspended in QIA mini-prep-kit
buffer P1 (Qiagen). Plasmid DNA was isolated according to the manufacturer’s
instructions.
For storage of bacterial stocks for later use, 0.75 mL of bacterial culture was
combined with 0.75 mL of glycerol, mixed by inversion and stored at –70°C.
To determine if the isolated plasmid DNA contained the insert of interest, it was
digested with the restriction enzyme, EcoRI. In a 0.5 mL microfuge tube, 4 μL of the
45

mini-prep DNA was mixed with 5-10 U of the appropriate restriction enzyme, and the
compatible quantity of 10 X One-Phor-All Plus (100 mM Tris-acetate, pH 7.5, 100 mM
magnesium acetate, 500 mM potassium acetate) (Amersham Pharmacia) buffer in a final
volume of 10 µL. The digestion reaction was incubated at 37°C for a minimum of 1 hr,
after which the entire reaction volume was mixed with DNA running buffer and
electrophoresed on a 1% TAE agarose gel accompanied by a DNA marker.
2.2.3.6 DNA Sequencing
All DNA sequencing was performed at the National Research Council (NRC)
Plant Biotechnology Institute (PBI) DNA Technologies Unit using an automated ABI
Prism sequencing apparatus.
2.2.3.7 Combined Bisulfite Restriction Analysis (COBRA)
Methylation profiles were determined using bisulfite-PCR followed by restriction
digestion. Ambiguous primers were used to amplify the CpG island in sodium bisulfite
modified DNA. The PCR products were purified using the QIAquick PCR Purification
Kit (Qiagen). The amplified fragments were digested with restriction enzymes that digest
DNA only if the CpG sites in their recognition sequences are methylated: HpyCH4IV or
BstUI (New England Biolabs). Digestion with an enzyme that digests DNA only if
sodium bisulfite modification of the DNA is incomplete was used as a control: CviAII
(New England Biolabs). Universally methylated human DNA (Chemicon International)
or rat DNA, methylated in vitro by CpG methylase (SssI; New England Biolabs) was used
as a positive control. In a 0.5 mL microfuge tube, 500-700 ng DNA was mixed with 2.5-5
46

U of the appropriate enzyme and 5 μL of the compatible 10X enzyme buffer in a final
reaction volume of 50 μL. NEBuffer 1 (10 mM Bis Tris Propane-HCl, 10 mM MgCl2, 1
mM dithiothreitol, pH 7.0) was used with HpyCH4IV, NEBuffer 2 (50 mM NaCl, 10 mM
Tris-HCl, 10 mM MgCl2, 1 mM dithiothreitol, pH 7.9) was used with BstUI, and
NEBuffer 4 (50 mM potassium acetate, 20 mM Tris acetate, 10 mM magnesium acetate,
1 mM dithiothreitol, pH 7.9) was used with CviAII. Digestions were carried out for 1 hr
at 25º, 37º and 60º for CviAII, HpyCH4IV and BstUI, respectively. The reaction products
were separated electrophoretically on a 2% TAE agarose gel and stained with ethidium
bromide. The proportion of methylated versus unmethylated product (digested versus
undigested) was quantitated by densitometric analysis, determining the density of
methylation. Densitometric analysis was performed using a Bio-Rad Geldoc digital
analyzer equipped with Quantity One version 4.3.1 software.
47

3.0 RESULTS
3.1 MS-1 Comparative Genomics
The rMS-1 gene is located on chromosome 3q24 of the rat genome, whereas the
hMS-1 gene is located on chromosome 11p11.2 of the human genome. The rMS-1 and
hMS-1 genes both have two CpG islands in the 5’ region, one surrounding the first exon
and one between the first and second exons. Due to its location in the promoter region,
the upstream CpG island was investigated for involvement in epigenetic regulation. This
CpG island in rMS-1 is 644 bp in length and contains 58 CpG dinucleotides, whereas the
hMS-1 CpG island is 671 bp in length and contains 51 CpG dinucleotides. The rMS-1
gene generates a 2672 bp mRNA transcript while the hMS-1 gene generates a 2370 bp
mRNA transcript, both consist of twelve exons. The mRNA sequence of rMS-1 shares
75% of its sequence with the mRNA of hMS-1 (Figure 3.2). The ORF of rMS-1 encodes
a 520 amino acid protein, whereas the ORF of hMS-1 encodes a 519 amino acid protein.
intro
n
CpG island CpG island
exon
2
exon
3
exon
4
exon
5
exon
6ex
on 7
exon
8
exon
9
exon
10
exon
11
exon
12
3’ U
TR
Figure 3.1 MS-1 gene. The promoter region is highlighted in yellow, untranslated regions are purple, exons are green, introns are white, CpG islands are highlighted in blue, the putative transcriptional start site is indicated by a red arrow and the translational start site by a black arrow.
prom
ot
5’ U
TR
exon
1
er
~500 bp
intro
n
CpG island CpG island
exon
2
exon
3
exon
4
exon
5
exon
6ex
on 7
exon
8
exon
9
exon
10
exon
11
exon
12
3’ U
TR
mot
5’ U
TR
exon
1
erpr
o
~500 bp
intro
n
CpG island CpG island
exon
2
exon
3
exon
4
exon
5
exon
6ex
on 7
exon
8
exon
9
exon
10
exon
11
exon
12
3’ U
TR
mot
5’ U
TR
exon
1
erpr
o
~500 bp
48

Figure 3.2 Aligned rMS-1 and hMS-1 mRNA sequences. Regions of homology are highlighted.
49

3.2 Induction of MS-1 Expression
3.2.1 MS-1 Induction following DAC and TSA Treatment
The mechanism by which MS-1 expression is lost in cells of high metastatic
potential was unclear. Southern analyses indicate the presence of the MS-1 gene in all rat
and human cell lines investigated, suggesting that regulation mechanisms and not LOH
are responsible for differential expression [34]. The presence of a CpG island
surrounding the first exon of MS-1 points to epigenetic mechanisms as possible modes of
regulation. DNMT and HDAC inhibitors can be used to reverse epigenetic gene
silencing. Previously obtained data suggest gene expression may be induced in LN4 or
MDA-MB-435 cells by treatment with a DNMT inhibitor and a histone deacetylase
inhibitor [33] [34].
5-aza-2’-deoxycytidine (DAC) inhibits DNA methyltransferases (DNMTs), which
are responsible for transferring the methylation profile of parental strands to daughter
strands during DNA replication. Therefore, DAC requires 96 hours to fully deplete the
DNA of methylation. Trichostatin A (TSA) is a histone deacetylase inhibitor. HDACs
are responsible for removing acetyl groups from histone proteins. Acetyl groups are
important for retaining a loose chromatin structure necessary for transcription.
To investigate the possible role of epigenetics in the regulation of MS-1, highly
(LN4, MDA-MB-435) and poorly (CAb, Hs578T) metastatic rat and human cell line pairs
were treated with 1 µM DAC for 96 hrs followed by 1 µM TSA for 0, 3, 6, 12 or 24 hrs.
Following drug treatments, total RNA was isolated from the cells and gel electrophoresis
and Northern blotting was performed to detect the level of MS-1 expression. Quantitation
50

using a phosphor imager revealed that, although treatment for 96h with DAC or 24h with
TSA alone caused an average induction of rMS-1 expression in LN4 cells 4-fold and 3-
fold, respectively, the greatest average induction, 12-fold, occurred when both drugs were
used in conjunction (Figure 3.3). On average, hMS-1 expression was induced 4-fold in
MDA.MB.435 cells at 96h DAC plus 24h TSA (Figure 3.4). These observations suggest
that both DNA methylation and histone deacetylation may be involved in epigenetically
silencing the MS-1 gene in highly metastatic LN4 and MDA-MB-435 cells. In order to
validate this observation, a more extensive examination of the methylation status of the
MS-1 CpG islands was carried out.
51

96h
DA
C +
24h
TSA
rMS-1
GAPDH
CA
b
LN4
96h
DA
C +
3h
TSA
96h
DA
C +
6h
TSA
3h T
SA6h
TSA
12h
TSA
96h
DA
C
24h
TSA
96h
DA
C +
12h
TSA
96h
DA
C +
3h
TSA
96h
DA
C +
6h
TSA
3h T
SA6h
TSA
12h
TSA
96h
DA
C
24h
TSA
96h
DA
C +
12h
TSA
96h
DA
C +
24h
TSAA
96h
DA
C +
24h
TSA
rMS-1
GAPDH
CA
b
LN4
96h
DA
C +
3h
TSA
96h
DA
C +
6h
TSA
3h T
SA6h
TSA
12h
TSA
96h
DA
C
24h
TSA
96h
DA
C +
12h
TSA
96h
DA
C +
3h
TSA
96h
DA
C +
6h
TSA
3h T
SA6h
TSA
12h
TSA
96h
DA
C
24h
TSA
96h
DA
C +
12h
TSA
96h
DA
C +
24h
TSAA
Effects of DAC and TSA on MS-1 Gene Expression
0369
121518
untreated
3h TSA
6h TSA
12h TSA24h TSA
96h DAC
96h DAC + 3h TSA
96h DAC + 6h TSA
96h DAC + 12h TSA
96h DAC + 24h TSA
Fold Induction
LN4 1 LN4 2 LN4 3 CAb 1 CAb 2 CAb 3
B
Figure 3.3 DAC and TSA induced rMS-1 expression. A. CAb and LN4 cells were treated with 1 μM 5-aza-2’-deoxycytidine (DAC) and/or 1 μM Trichostatin A (TSA). A total of 10 μg of total RNA was loaded in each lane, transferred and probed with a 565 bp rMS-1 specific cDNA probe or rat GAPDH specific cDNA probe. B. Graphical overview of triplicate Northern analyses. Each bar represents a single experiment (n=3).
52

hMS-1
GAPDH
Hs5
78T
MD
A-M
B-4
35
96h
DA
C +
3h
TSA
96h
DA
C +
6h
TSA
3h T
SA6h
TSA
12h
TSA
96h
DA
C
24h
TSA
96h
DA
C +
12h
TSA
96h
DA
C +
24h
TSA
96h
DA
C +
3h
TSA
96h
DA
C +
6h
TSA
3h T
SA6h
TSA
12h
TSA
96h
DA
C
24h
TSA
96h
DA
C +
12h
TSA
96h
DA
C +
24h
TSAA
hMS-1
GAPDH
Hs5
78T
MD
A-M
B-4
35
96h
DA
C +
3h
TSA
96h
DA
C +
6h
TSA
3h T
SA6h
TSA
12h
TSA
96h
DA
C
24h
TSA
96h
DA
C +
12h
TSA
96h
DA
C +
24h
TSA
96h
DA
C +
3h
TSA
96h
DA
C +
6h
TSA
3h T
SA6h
TSA
12h
TSA
96h
DA
C
24h
TSA
96h
DA
C +
12h
TSA
96h
DA
C +
24h
TSAA
Effects of DAC and TSA on MS-1 Gene Expression
0123456
untreated3h TSA
6h TSA12h TSA
24h TSA96h D
AC
96h DAC + 3h
TSA
96h DAC + 6h
TSA
96h DAC + 12h
TSA
96h DAC + 24h
TSA
Fold Induction
MDA-MB-435 1 MDA-MB-435 2 MDA-MB-435 3 Hs578T 1 Hs578T 2 Hs578T 3
B
Figure 3.4 DAC and TSA induced hMS-1 expression. A. Hs578T and MDA-MB-435 cells were treated with 1 μM 5-aza-2’-deoxycytidine (DAC) and/or 1 μM Trichostatin A (TSA). A total of 10 μg of total RNA was loaded in each lane, transferred and probed with a 558 bp hMS-1 cDNA specific probe or 452 bp human GAPDH specific cDNA probe. B. Graphical overview of triplicate Northern analyses. Each bar represents a single experiment (n=3).
53

3.2.2 MS-1 Induction following SAM Treatment
Since the methylation profile of a CpG island is determined by a balance between
DNMT and demethylase activity, inhibition of demethylase should increase CpG
methylation and reduce expression of genes with normally unmethylated promoter
regions. It has been shown that S-adenosylmethionine (SAM) actively inhibits
demethylase and can reduce expression of the metastasis-promoting gene urokinase
plasminogen activator (uPA) [1], and has been proposed as a potential anti-cancer
treatment [19]. To investigate the specificity of SAM, both rat and human highly (LN4,
MDA-MB-435) and poorly (CAb, Hs578T) metastatic cell line pairs were treated for 6
days with 0.1 mM SAM, total RNA extracted and Northern analysis was performed.
Quantitation using a phosphor imager revealed an induction, not reduction, of MS-1
expression in already expressing, poorly metastatic cells. An average 3-fold induction of
rMS-1 was observed in CAb cells (Figure 3.5) and an average 2-fold induction of hMS-1
in Hs578T human cells (Figure 3.6). These results suggest that SAM treatment may alter
gene expression by mechanisms other than inhibiting demethylase actively. In order to
shed light on whether the induction of MS-1 expression is methylation-independent, a
more extensive investigation of the methylation status of the CpG islands following SAM
treatment was carried out.
54

Figure 3.5 SAM induced rMS-1 expression. A. CAb and LN4 cells were treated with 0.1mM S-adenosylmethionine (SAM) for 6 days. A total of 10 μg of total RNA was loaded in each lane, transferred and probed with a 565 bp rat MS-1 specific cDNA probe or 452 bp rat GAPDH specific cDNA probe. B. Graphical overview of triplicate Northern analysis. Each bar represents a single experiment (n=3).
Figure 3.6 SAM induced hMS-1 expression. A. Hs578T and MDA-MB-435 cells were treated with 0.1mM S-adenosylmethionine (SAM) for 6 days. A total of 10 μg of total RNA was loaded in each lane, transferred and probed with a 558 bp human MS-1 cDNA specific probe or 452 bp human GAPDH specific cDNA probe. B. Graphical overview of triplicate Northern analysis. Each bar represents a single experiment (n=3).
Effects of SAM on MS-1 Gene Expression
0.0
1.0
2.0
3.0
4.0
5.0
untreated SAM
Fold Induction
MDA-MB-435 1 MDA-MB-435 2 MDA-MB-435 3 Hs578T 1 Hs578T 2 Hs578T 3
Effects of SAM on MS-1 Gene Expression
0
1
2
3
4
untreated SAM
Fold Induction
LN4 1 LN4 2 LN4 3 CAb 1 CAb 2 CAb 3
B
B
rMS-1
GAPDH
CA
b
LN4
CA
b 0.
1mM
SA
MA
rMS-1
PDH
CA
b
LN4
GA
CA
b 0.
1mM
SA
MA
hMS-1
GAPDH
Hs5
78T
0.1m
M S
AM
MD
A-M
B-4
35
0.1m
M S
AM
A
55

3.3 Methylation Profiles of MS-1 CpG Islands
3.3.1 Methylation of CpG Islands in Cells that do not express MS-1
Two methods were utilized to investigate the methylation profiles of the CpG
islands of MS-1 in various cell lines: combined bisulfite restriction analysis and bisulfite
sequencing. The first method used was bisulfite sequencing. Sodium bisulfite
deaminates unmethylated cytosines but does not modify methylated cytosine bases,
discriminating between methylated and unmethylated cytosines of CpG islands. The
outside and nested primers designed to amplify modified DNA were ambiguous,
selecting for neither methylated nor unmethylated DNA. Primer sets SAC-265/266 and
SAC-267/257 amplified the CpG island of rMS-1, while SAC-304/305 and SAC-306/307
amplified the CpG island of hMS-1 (Table 2.1). The PCR products were purified, cloned
into the vector pCR2.1, and three clones were sequenced. The number of deaminated
nonCpG cytosines divided by the total number of nonCpG cytosines gave a percent of
modification in each sample. The number of CpG cytosines protected from deamination
by a methyl group divided by the total number of CpG dinucleotides gave a percent of
methylation in each sample. The percent methylation was then multiplied by the percent
modification to give a standardized percent methylation.
All samples, except those from LN4 DNA, showed 97-100% modification,
indicating that the sodium bisulfite had deaminated nearly all nonCpG cytosines and the
treatment had gone to near completion. After several attempts, LN4 DNA was, at most,
64-71% modified by sodium bisulfite, for unknown reasons. For MS-1 expressing cell
lines CAb and Hs578T, the CpG islands revealed an average standardized methylation of
56

2.8% and 0%, respectively. The CpG islands of the cell lines that did not express MS-1,
LN4 and MDA-MB-435, showed an average standardized methylation of 38.7% and
69.2%, respectively. Following treatment with DAC and TSA, the average standardized
methylation fell to 19.5% and 33.1% in the CpG islands of LN4 and MDA-MB-435,
respectively. These data indicate a correlation between hypermethylation of the CpG
island and lack of MS-1 expression. Also, DNMT and HDAC inhibition resulted in a
significant depletion in the methylation of these CpG islands.
Table 3.1 Triplicate bisulfite sequencing analysis of rMS-1 and hMS-1 CpG islands. Sample Percent
Modification Percent Methylation
Standard % Methylation
Average
CAb 1 99 0 0 CAb 2 97 8.6 8.4 2.8 CAb 3 99 0 0 LN4 1 64 53.5 34.4 LN4 2 65 53.5 35.0 38.7 LN4 3 71 65.5 46.6 LN4 DAC+TSA 1 100 0 0 LN4 DAC+TSA 2 100 29.3 29.3 19.5 LN4 DAC+TSA 3 100 29.3 29.3 Hs578T 1 100 0 0 Hs578T 2 100 0 0 0 Hs578T 3 100 0 0 MDA-MB-435 1 100 62.8 62.8 MDA-MB-435 2 100 74.5 74.5 69.2 MDA-MB-435 3 100 70.6 70.6 435 DAC+TSA 1 98.9 27.5 27.2 435 DAC+TSA 2 99.5 7.8 7.8 33.1 435 DAC+TSA 3 99.5 64.7 64.4
57
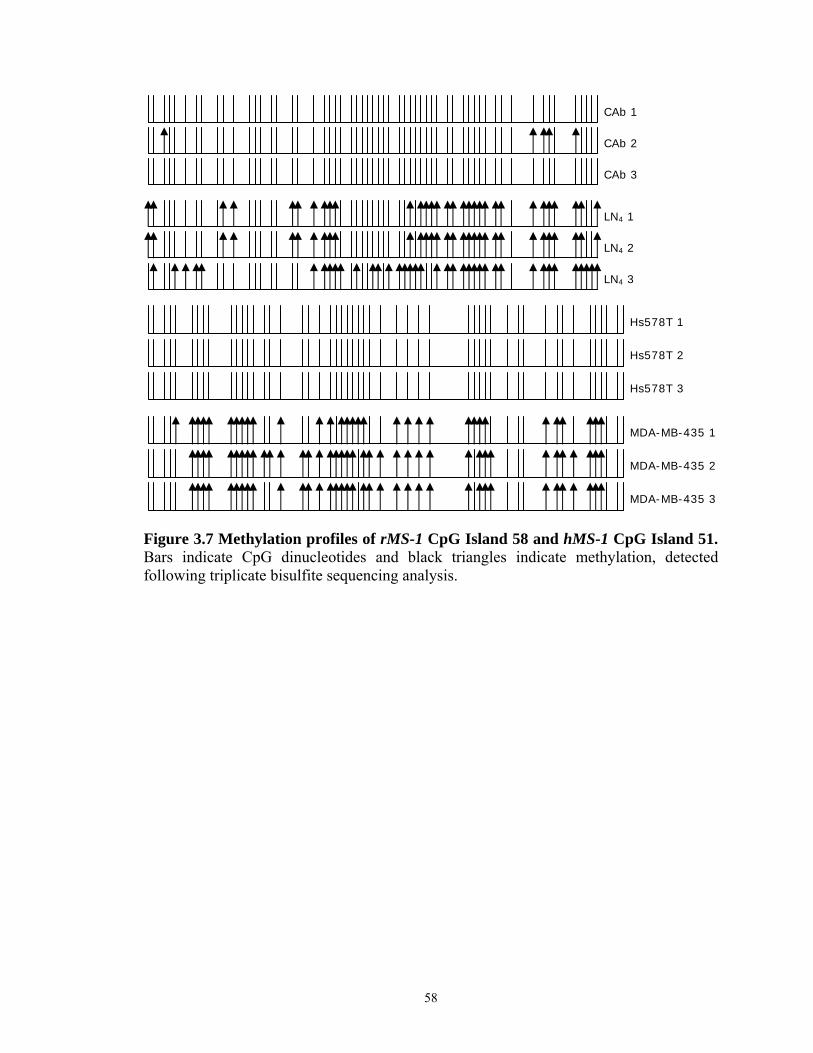
CAb 1
CAb 2
CAb 3
LN4 1
LN4 2
LN4 3
Hs578T 1
Hs578T 2
Hs578T 3
MDA-MB-435 1
MDA-MB-435 2
MDA-MB-435 3
Figure 3.7 Methylation profiles of rMS-1 CpG Island 58 and hMS-1 CpG Island 51. Bars indicate CpG dinucleotides and black triangles indicate methylation, detected following triplicate bisulfite sequencing analysis.
58

LN4
CAb
LN4 DAC + TSA
A
LN4
CAb
LN4 DAC + TSA
A
435 DAC + TSA
Hs578T
MDA-MB-435
B
435 DAC + TSA
Hs578T
MDA-MB-435
B
MS-1 CpG Island Methylation
0102030405060708090
100
Ave % Modification Ave % Methylation Ave St % Methylation
LN4 LN4 DAC+TSA CAbMDA-MB-435 435 DAC+TSA Hs578T
C
Figure 3.8 Representative sequences of the MS-1 CpG islands. A. rMS-1 sequence analysis. B. hMS-1 sequence analysis. C. Graphical overview of the average bisulfite sequencing results from three individually cloned PCR products.
59
3.3.2 Screening Various Cancer Cell Lines for Methylation
The second method used to investigate the methylation profiles of the MS-1 CpG
islands was combined bisulfite restriction analysis. The same primers used to amplify the
rMS-1 and hMS-1 CpG islands for bisulfite sequencing were also used for restriction
analysis (Table 2.1). Restriction digestion was performed using a control enzyme,
CviAII, which cuts at CATG sites. Following bisulfite modification these sites should be
eliminated, and only unmodified DNA will be digested. Therefore, the proportion of
DNA undigested versus digested by this enzyme was used to calculate the percent
modification for each sample. Enzymes HpyCH4IV and BstUI cut at ACGT and CGCG
sites, respectively, and thus digest only unmodified DNA and methylated DNA following
bisulfite modification. The proportion of DNA digested versus undigested by these
enzymes was quantitated by densitometric analysis in order to determine the density of
methylation. The results from enzymes HpyCH4IV and BstUI were combined to give an
average percent methylation of the CpG islands from each sample.
COBRA was performed on both rat and human poorly and highly metastatic
cancer cell lines in order to determine the CpG island methylation profiles. Of the rat cell
lines, CAb and AT1 are both poorly metastatic, MS-1 expressing cell lines, whereas LN4
and MAT-LyLu are highly metastatic cell lines that do not express MS-1 (Figure 1.3).
SssI CpG methylase treated CAb DNA was included as a positive control. Of the human
cell lines, Hs578Bst, Hs578T, WiDr and MDA-MB-231 expressed MS-1, although
MDA-MB-231 was a low expresser, whereas MDA-MB-435, MCF-7, T-47D, HEY,
SW480 and SW620 did not express MS-1 (Figure 1.4). Universally methylated human
DNA (Chemicon International) was included as a positive control.
60

The CpG islands from SssI CAb, LN4, LN4 DAC + TSA, LN4 SAM and MAT-
LyLu showed an average methylation of 59.3%, 58.6%, 28.7%, 33.0% and 13.5%,
respectively. The CpG islands of CAb, CAb DAC + TSA, CAb SAM and AT1 contained
an average methylation of 7.6%, 5.1%, 3.4% and 2.0%, respectively (Figure 3.10). The
CpG islands from universally methylated human DNA, MDA-MB-435, 435 DAC +
TSA, 435 SAM, MCF-7, HEY, SW480 and SW620 showed an average methylation of
92.7%, 75.1%, 16.4%, 65.8%, 41.0%, 45.3%, 15.5% and 28.8%, respectively. The CpG
islands of Hs578T, Hs578T DAC + TSA, Hs578T SAM, Hs578Bst, MDA-MB-231, T-
47D and WiDr all contained an average of 0.3-1.7% methylation (Figure 3.11). In all
DNA samples, excluding T-47D, methylation within the CpG island corresponds to a
lack of MS-1 expression.
Following treatment with DAC and TSA, a decrease in methylation of the CpG
islands in both LN4 and MDA.MB.435 cell lines was observed. These results suggest
that inhibition of DNMTs and HDACs can reduce the amount of methylation within a
CpG island. However, treatment with SAM resulted in no change of methylation in the
CpG island of CAb or Hs578T cells. It was predicted that SAM inhibition of
demethylase would increase methylation of CpG islands and reduce expression of MS-1.
However, from Northern analysis an increase in MS-1 expression was observed in CAb
and Hs578T cell lines. Together, these data suggest that the induction of MS-1
expression by SAM treatment resulted from a methylation-independent mechanism.
Figure 3.9 Restriction maps of rMS-1 CpG Island 58 and hMS-1 CpG Island 51. 856 bp
C HHHBBBB B BB995bp
C CH HB B B BrMS-1
hMS-1
HB
856 bp
C HHHBBBB B BB995bp
C CH HB B B B HB
995bp
C CH HB B B BrMS-1
hMS-1
HB
Restriction sites for CviAII (C), HpyCH4IV (H) and BstUI (B) are indicated.
61

900 bp
500 bp
900 bp
500 bp
900 bp
500 bp
CA
b
CA
b D
AC
+TSA
LN4
LN4
DA
C+T
SA
AT1
MA
T-Ly
Lu
Posi
tive
Unm
odno
dig
est
Unm
od
Mod
no
dige
st
CA
b SA
M
LN4
SAM
CviAII
HpyCH4IV
BstUI
A
900 bp
500 bp
900 bp
500 bp
900 bp
500 bp
CA
b
CA
b D
AC
+TSA
LN4
LN4
DA
C+T
SA
AT1
MA
T-Ly
Lu
Posi
tive
Unm
odno
dig
est
Unm
od
Mod
no
dige
st
CA
b SA
M
LN4
SAM
CviAII
HpyCH4IV
BstUI
A
rMS-1 CpG Island Methylation
0102030405060708090
100
% Modification HpyCH4 IV %Methylation
BstU I % Methylation Ave % Methylation
Positive CAb LN4 CAb DAC+TSA LN4 DAC+TSA
CAb SAM LN4 SAM AT1 MAT-LyLu
B
Figure 3.10 Combined Bisulfite Restriction Analysis of rMS-1 CpG Island 58. A. Restriction digests of 500-700 ng DNA with 2.5-5 U of each enzyme for 1 hr at the appropriate temperature. Reaction products were separated electrophoretically on a 2% TAE agarose gel and stained with ethidium bromide. Densitometric analysis was performed using a Bio-Rad Geldoc digital analyzer equipped with Quantity One version 4.3.1 software. B. Graphical overview of COBRA.
62

500 bp
900 bp
500 bp
900 bp
500 bp
900 bp
Hs5
78T
Hs5
78T
DA
C+T
SA
MD
A-M
B-4
35
435
DA
C+T
SA
Hs5
78Bs
t
MC
F-7
MD
A-M
B-2
31
T-47
D
Posi
tive
HE
Y
WiD
r
SW48
0
SW62
0
Unm
odno
dig
est
Unm
od
Mod
no
dige
st
Hs5
78T
SAM
435
SAM
CviAII
HpyCH4IV
BstUI
A
500 bp
900 bp
500 bp
900 bp
500 bp
900 bp
Hs5
78T
Hs5
78T
DA
C+T
SA
MD
A-M
B-4
35
435
DA
C+T
SA
Hs5
78Bs
t
MC
F-7
MD
A-M
B-2
31
T-47
D
Posi
tive
HE
Y
WiD
r
SW48
0
SW62
0
Unm
odno
dig
est
Unm
od
Mod
no
dige
st
Hs5
78T
SAM
435
SAM
CviAII
HpyCH4IV
BstUI
A
hMS-1 CpG Island Methylation
0
10
20
30
40
50
60
70
80
90
100
% Modification HpyCH4 IV %Methylation
BstU I % Methylation Ave % Methylation
Positive Hs578T MDA-MB-435 Hs578T DAC+TSA435 DAC+TSA Hs578T SAM 435 SAM Hs578BstMDA-MB-231 MCF-7 T-47D HEYWiDr SW480 SW620
B
Figure 3.11 Combined Bisulfite Restriction Analysis of hMS-1 CpG Island 51. A. Restriction digests of 500-700 ng DNA with 2.5-5 U of each enzyme for 1 hr at the appropriate temperature. Reaction products were separated electrophoretically on a 2% TAE agarose gel and stained with ethidium bromide. Densitometric analysis was performed using a Bio-Rad Geldoc digital analyzer equipped with Quantity One version 4.3.1 software. B. Graphical overview of COBRA.
63

4.0 DISCUSSION
4.1 MS-1 Expression in Cells of Different Metastatic Potential
Highly metastatic and poorly metastatic subpopulations derived from the same
tumour allow for the identification of genes that are differentially expressed between the
subpopulations and thus, may be involved in the metastatic phenotype. A highly
metastatic subpopulation, LN4, and poorly metastatic subpopulation, CAb were derived
from the R3230AC rat mammary adenocarcinoma. A novel gene, termed MS-1, was
found to be differentially expressed between these two cell subpopulations. Although
high expression was observed in the poorly metastatic CAb subpopulation, LN4 cells
showed no expression of this gene [33].
Upon examination of other rat and human, highly and poorly metastatic cell lines,
a similar pattern of expression was observed. Highly metastatic rat prostate cells, MAT-
LyLu, did not express MS-1 but the poorly metastatic counterpart, AT1, showed high
expression [33]. MS-1 expression was undetectable in human mammary adenocarcinoma
cell lines T-47D, MCF-7 and MDA-MB-435, and was observed at low levels in the
MDA-MB-231, which were all developed from metastatic pleural effusions. MS-1
expression was also not observed in the human ovarian cancer cell line, HEY, highly
metastatic human colon cancer cell line, SW620, or its poorly metastatic counterpart,
SW480. MS-1 expression was detected in a human normal mammary cell line,
64

Hs578Bst, the corresponding primary ductal carcinoma cell line, Hs578T and a poorly
metastatic human colon cancer cell line, WiDr [34].
In most cell lines examined, MS-1 expression appears to correlate with a poorly
metastatic phenotype, implicating a possible role for MS-1 in suppressing metastasis.
Metastasis suppressor gene BRMS1 is located on chromosome 11q13.1-13.2, a region
commonly altered in late-stage breast carcinomas [4]. Metastasis suppressor gene Kai1 is
located on chromosome 11p11.2, a region commonly associated with breast cancer
progression [4]. Introduction of human chromosome 11 into rat prostate cancer cells of
high metastatic potential resulted in metastasis suppression without affecting growth rate
or tumourigenicity [50]. The region between 11p11.2-13 was determined to be the
minimal portion of human chromosome 11 capable of suppressing metastasis [51]. The
location of the hMS-1 gene on chromosome 11p11.2 of the human genome is consistent
with the possibility that it may play a role in metastasis suppression. However, any
evidence supporting the involvement of MS-1 in metastasis, if any, remains to be
determined.
The mechanism by which MS-1 expression is lost or down-regulated in cells of
high metastatic potential is unknown. Although its expression was not observed in
MDA-MB-435, MCF-7 and T-47D cells following Northern analysis, Southern analysis
revealed that these cell lines all retained both copies of the hMS-1 gene [34]. Therefore,
LOH does not appear to be the mechanism by which MS-1 expression was lost.
65

4.2 Epigenetic Regulation
A common mechanism for gene silencing is DNA methylation and chromatin
remodelling. Methylated DNA, deacetylated histones, some methylated histone forms
and condensed chromatin are associated with inaccessible DNA and repressed or silenced
gene expression. However, unmethylated DNA, acetylated histone forms and open
chromatin are associated with active or potential gene expression [6]. DNA methylation
occurs at cytosine residues of CpG dinucleotides. The CpG dinucleotide has been
progressively depleted from the eukaryotic genome and is found at 1/5 of the expected
frequency. Remaining CpG dinucleotides outside of CpG islands have a high incidence,
~70%, of methylation [8] [13]. Small stretches in the genome (0.5 to 2kb) contain the
expected frequency of CpGs (G/C content of 50% or higher and an observed
CpG/expected CpG of 0.60 or higher), and are referred to as CpG islands [8] [15]. The
presence of a CpG island in the 5’ region of the MS-1 gene suggests that epigenetic
mechanisms may be involved in MS-1 gene silencing.
An investigation of the methylation status of the 5’ MS-1 CpG islands was carried
out to determine a role of methylation in epigenetic regulation of this gene. Bisulfite
sequencing revealed that the CpG islands of MS-1 expressing cell lines, CAb and
Hs578T, contained no significant methylation. Only the CpG islands of MS-1 in the cell
lines that show no expression, LN4 and MDA-MB-435, were significantly methylated
(Table 3.1 and Figure 3.8). Combined bisulfite restriction analysis was performed to
screen CpG islands from several rat and human cancer cell lines. Again, the CpG islands
of MS-1 in expressing cell lines, CAb, AT1, Hs578T, Hs578Bst, MDA-MB-231 and
WiDr, were not significantly methylated. However, the CpG islands of MS-1 in cell lines
66

that show no expression, LN4, MAT-LyLu, MDA-MB-435, MCF-7, HEY, SW480 and
SW620, contained significant methylation (Figures 3.10 and 3.11). With the exception of
T-47D, which does not express MS-1 but whose CpG island was unmethylated, these data
indicate a correlation between hypermethylation of the CpG island and lack of MS-1
expression in various cancer cell lines.
It has been hypothesized that methylation is a third pathway, in addition to
intragenic mutations and loss of chromosomal material, for complete inactivation of a
gene [52]. Although Southern analysis ruled out LOH as reason for MS-1 gene
inactivation, it is possible that mutations may contribute to loss of MS-1 gene expression.
Perhaps in the T-47D cell line intragenic mutations, without promoter methylation, are
responsible for MS-1 gene inactivation.
4.3 Inhibition of DNA Methyltransferase and Histone Deacetylase Activity
Demethylation and histone deacetylase inhibition can be induced by the addition
of epigenetic regulators to cells in vitro. The DNA methyltransferase inhibitor, DAC,
and histone deacetylase inhibitor, TSA, can be used to reverse epigenetic silencing.
Although treatment with DAC or TSA alone can induce expression of rMS-1 in LN4 cells
4-fold and 3-fold, respectively, the greatest average induction occurs when both drugs are
used in conjunction, 12-fold (Figure 3.3). hMS-1 expression is induced 4-fold in MDA-
MB-435 cells following treatment with DAC plus TSA (Figure 3.4). These results
indicate that DNA methylation and histone deacetylation may play individual roles in the
process of epigenetic silencing but that there exists a link between the two mechanisms,
allowing them to work in concert. Methyl-CpG-binding proteins can recruit histone-
67

modifying complexes to methylated cytosines, inducing the formation of compact
chromatin and rendering the locus less accessible to necessary transcription factors [6].
Therefore, it has been proposed that methyl-CpG-binding proteins serve as a bridge
between the two major epigenetic mechanisms, DNA methylation and histone
modification [17].
The induction of MS-1 expression by DAC and TSA as shown in Figures 3.4 and
3.5 supports the hypothesis that both DNA methylation and histone deacetylation may be
involved in epigenetically regulating the MS-1 gene in highly metastatic LN4 and MDA-
MB-435 cells. Examination of the methylation status of the MS-1 CpG islands following
inhibition of DNA methyltransferase and histone deacetylase activities was used to verify
whether changes in methylation are responsible for the changes in expression.
Bisulfite sequencing revealed that, following treatment with DAC and TSA, the
average methylation of the MS-1 CpG islands was reduced by 50% in the highly
metastatic cells, LN4 and MDA-MB-435 (Figure 3.8). These observations validate that
the induction of MS-1 expression by DNA methyltransferase and histone deacetylase
inhibition occurred alongside a significant depletion in the methylation of the MS-1 CpG
islands. The results obtained from the combined bisulfite restriction analysis confirmed
the observations made from bisulfite sequencing and Northern analysis. Following
treatment with DAC and TSA, a 50% or greater decrease in methylation of the CpG
islands in both LN4 and MDA-MB-435 cell lines was seen (Figures 3.10 and 3.11).
Together, these results support the hypothesis that inhibition of DNA methyltransferase
and histone deacetylase activity reduces the amount of methylation within the MS-1 CpG
islands, resulting in MS-1 expression.
68

4.4 Inhibition of Demethylase Activity
Since the methylation profile of a CpG island may result from a balance between
DNMT and demethylase activity, inhibition of demethylase may increase CpG
methylation and reduce expression of genes with normally unmethylated promoter
regions. This was demonstrated with the pro-metastatic gene, urokinase Plasminogen
activator (uPA) [1]. It was predicted that SAM inhibition of demethylase would increase
methylation of CpG islands and reduce expression of MS-1 in expressing cell lines, CAb
and Hs578T. However, it was demonstrated through combined bisulfite restriction
analysis that treatment with SAM resulted in no significant change of methylation in the
CpG island of CAb or Hs578T cells (Figures 3.10 and 3.11). Also, Northern analysis
indicated an average 3-fold and 2-fold induction of MS-1 in CAb and Hs578T cell lines,
respectively (Figures 3.5 and 3.6). Together, these data suggest that the induction of MS-
1 expression by SAM treatment was caused by a methylation-independent mechanism.
The methylation-independent induction of MS-1 by SAM, observed in CAb and
Hs578T cells, contradicts the role of SAM as a demethylase inhibitor. However, other
examples exist where drugs used for epigenetic therapy contradict the traditional model
for epigenetic silencing. The mechanism by which HDAC inhibitors bring about changes
in gene expression is poorly understood but is generally assumed to result from local
changes in histone acetylation status. The observation that many common co-activators
such as p300 have intrinsic HAT activity, while repressor complexes such as Sin3 are
associated with HDAC activity, has strengthened this model [53]. Following this model,
TSA, a known histone deacetylase inhibitor, contributes to alleviating the compact
chromatin structure of transcriptionally silent genes. However, this does not fully explain
69

its role in regulating gene expression. It has been well characterized that treatment with
TSA leads to the induction of p21WAF1, which mediates cell cycle arrest, and to the
inhibition of c-myc, which mediates proliferation and differentiation. Treatment with
TSA also represses expression of c-Src, a known oncogene, in various cell lines including
T-47D, a human breast cancer cell line [53].
Histone deacetylase inhibitors are described as having anti-cancer activity,
inducing cell cycle arrest, differentiation and apoptosis. These properties are presumed to
result from highly selective gene expression changes. It has been shown through
microarray and differential display analysis that TSA acts on only a small subset (~2%)
of genes [54]. Therefore, in contrast to the idea of HDACs as master and global
regulators of transcription, it appears that inhibition of HDAC leads to a fairly restricted
alteration of gene expression profile which, in turn, may explain the apparent low toxicity
seen in clinical trials. To date, genes which are modulated by HDAC inhibitors suggest a
pleiotropic effect on key pathways involved with proliferation, apoptosis, tumour
suppressors, DNA synthesis and repair, and protein turnover [10].
Although local acetylation changes can explain the induction of genes via histone
deacetylase inhibitors, it is more difficult to explain the mechanism of gene repression by
this treatment. Since histone acetyltransferases (HATs) are capable of acetylating non-
histone proteins, it has been presumed that HDAC inhibitors can mediate the down-
regulation of genes in a histone acetylation/deacetylation-independent manner [53]. To
support this, studies have shown that the induction of specific serine/threonine
phosphatases were required for the repression of c-myc by an HDAC inhibitor.
70

Therefore, a revised model of how HDAC inhibitors alter gene expression may include
phosphorylation events as well as histone modifications [53].
Likewise, the traditional model of epigenetic silencing defines SAM as a methyl
donor and inhibitor of active demethylation [1]. Studies on the pro-metastatic gene, uPA,
shows that SAM treatment causes hypermethylation of the gene’s promoter region,
inhibition of the gene’s expression and decreased invasiveness of normally metastatic
breast cancer cells, MDA-MB-231 [1]. However, microarray analysis has shown that
SAM treatment induced Bcl-xS expression, a pro-apoptotic factor. Just as HDAC
inhibitor TSA is defined both by its role in epigenetics and by its anti-cancer properties,
demethylase inhibitor SAM is defined by its role in epigenetics and by anti-cancer
characteristics. There are extensive data from animal as well as some human data that
suggests dietary intake of folates, which are required for the synthesis of SAM, can
influence cancer progression. It was shown in animal studies that low methyl diets could
induce liver cancer. Human studies suggest that low folate intake combined with high
alcohol intake could result in an increased risk of colorectal cancer. There is also some
evidence that folate metabolism and the resultant supply of methyl moieties might play a
role in breast cancer since pre-menopausal women with the polymorphism in methylene-
tetrahydrofolate reductase (MTHFR), an enzyme required for the synthesis of
methionine, a precursor of SAM, had a three-fold increased breast cancer risk. SAM was
shown to be chemoprotective for liver cancer in chemically induced rat liver cancer [1].
Also, just as TSA utilizes both acetylation/deacetylation-dependent and
acetylation/deacetylation-independent mechanisms to regulate gene expression, SAM can
alter gene expression via methylation-dependent and methylation-independent
71

mechanisms. Recent evidence suggests that in the liver, SAM has critical functions in
modulating growth and apoptotic responses, some of which are independent of
methylation because they can be mimicked by 5’-methylthioadenosine (MTA), which is
not a methyl donor. Both SAM and MTA selectively up-regulated Bcl-xS expression in a
time- and dose-dependent fashion, with the effective dose for MTA lower than that for
SAM, suggesting that the effect of SAM may be mediated in part by MTA [55].
Although MTA is a metabolite of SAM, it can also be converted back to SAM via
methionine. However, blocking this conversion did not prevent the induction of Bcl-xS
expression by MTA, supporting the notion that MTA exerts its action directly. Inhibitors
of histone deacetylase and DNA methylation also had no effect on the induction of Bcl-xS
expression by SAM and MTA, thereby excluding their involvement [55].
Finally, just as the induction of specific serine/threonine phosphatases is required
for the repression of c-myc by an HDAC inhibitor, inhibition of specific serine/threonine
phosphatases nullifies SAM and MTA induction of Bcl-xS [55]. Therefore, a revised
model of how demethylase inhibitors specifically alter gene expression may include
phosphorylation events to induce anti-cancer factors as well as DNA modifications to
repress genes involved in cancer and metastasis progression.
4.5 Conclusions
An inverse relationship exists between the expression of MS-1 and metastatic
phenotype in most cell lines studied. Data from bisulfite sequencing and combined
bisulfite restriction analysis confirmed that hypermethylation of the rMS-1 and hMS-1
CpG islands correlates with the lack of MS-1 expression. MS-1 expression can be
72

induced in non-expressing cells of high metastatic potential following DNA
methyltransferase and histone deacetylase inhibition. This induction occurred following
hypomethylation of the CpG islands, confirmed by bisulfite sequencing and combined
bisulfite restriction analysis. Therefore, epigenetic silencing via DNA methylation and
histone deacetylation is one of the mechanisms involved in down-regulating MS-1
expression in cells of high metastatic potential.
MS-1 expression can also be induced in expressing cell lines of low metastatic
potential following treatment with a demethylase inhibitor. Data from combined bisulfite
restriction analysis determined that this induction resulted from no change in the
methylation status of the CpG island. Therefore, although inhibiting demethylase with S-
adenosylmethionine can reduce expression of a metastasis-promoting gene in a
methylation-dependent manner [1], treatment with this drug can also induce gene
expression of a putative metastasis suppressor through methylation-independent
mechanism.
4.6 Future Directions
The ability to induce MS-1 expression through inhibition of DNMTs presents a
possible role in breast cancer treatment. Decitabine, the commercial name for the DNA
methylation inhibitor DAC, is currently in phase II clinical trials for the treatment of
patients with chronic myelogenous leukemia [56]. However, the mere observation of an
inverse relationship between MS-1 expression and metastatic potential does not warrant
the use of this drug to treat metastatic cancer. It is extremely important that the role of
MS-1, if any, in metastasis suppression be identified. Animal studies are required to
73

determine if the expression of MS-1 can prevent metastasis. It then needs to be
determined if the inhibition of DNMTs and HDACs via drug treatments are able to
induce MS-1 expression in an animal model to the level required to carry out a
suppressive role. The expression of MS-1 and/or pro-angiogenic factors needs to be
investigated in breast cancer cell lines of high and low metastatic potential following ER
stress to evaluate if the role of MS-1 in the UPR relates to metastasis. The possible role
of MS-1 as a transcription factor leads to the hypothesis that the induction of its
expression may have a complex impact on many cellular functions, which need to be
examined.
74

5.0 REFERENCES
1. Szyf, M., P. Pakneshan, and S.A. Rabbani, DNA methylation and breast cancer. Biochem Pharmacol, 2004. 68(6): p. 1187-97.
2. Welch, D.R.a.W., L.L, Genetic and epigenetic regulation of human breast cancer progression and metastasis. Endocr Relat Cancer, 1998. 5: p. 155-197.
3. Welch, D.R., P.S. Steeg, and C.W. Rinker-Schaeffer, Molecular biology of breast cancer metastasis. Genetic regulation of human breast carcinoma metastasis. Breast Cancer Res, 2000. 2(6): p. 408-16.
4. Debies, M.T. and D.R. Welch, Genetic basis of human breast cancer metastasis. J Mammary Gland Biol Neoplasia, 2001. 6(4): p. 441-51.
5. Esteller, M., Profiling aberrant DNA methylation in hematologic neoplasms: a view from the tip of the iceberg. Clin Immunol, 2003. 109(1): p. 80-8.
6. Fitzpatrick, D.R. and C.B. Wilson, Methylation and demethylation in the regulation of genes, cells, and responses in the immune system. Clin Immunol, 2003. 109(1): p. 37-45.
7. Felsenfeld, G. and M. Groudine, Controlling the double helix. Nature, 2003. 421(6921): p. 448-53.
8. Baylin, S.B. and J.G. Herman, DNA hypermethylation in tumorigenesis: epigenetics joins genetics. Trends Genet, 2000. 16(4): p. 168-74.
9. Pradhan, S. and P.O. Esteve, Mammalian DNA (cytosine-5) methyltransferases and their expression. Clin Immunol, 2003. 109(1): p. 6-16.
10. McLaughlin, F. and N.B. La Thangue, Histone deacetylase inhibitors open new doors in cancer therapy. Biochem Pharmacol, 2004. 68(6): p. 1139-44.
11. Claudet, C., et al., Histone octamer instability under single molecule experiment conditions. J Biol Chem, 2005. 280(20): p. 19958-65.
12. Claus, R. and M. Lubbert, Epigenetic targets in hematopoietic malignancies. Oncogene, 2003. 22(42): p. 6489-96.
13. Worm, J. and P. Guldberg, DNA methylation: an epigenetic pathway to cancer and a promising target for anticancer therapy. J Oral Pathol Med, 2002. 31(8): p. 443-9.
14. Esteller, M., Relevance of DNA methylation in the management of cancer. Lancet Oncol, 2003. 4(6): p. 351-8.
15. Farrell, W.E. and R.N. Clayton, Epigenetic change in pituitary tumorigenesis. Endocr Relat Cancer, 2003. 10(2): p. 323-30.
16. Widschwendter, M. and P.A. Jones, DNA methylation and breast carcinogenesis. Oncogene, 2002. 21(35): p. 5462-82.
17. Burgers, W.A., F. Fuks, and T. Kouzarides, DNA methyltransferases get connected to chromatin. Trends Genet, 2002. 18(6): p. 275-7.
18. Nephew, K.P. and T.H. Huang, Epigenetic gene silencing in cancer initiation and progression. Cancer Lett, 2003. 190(2): p. 125-33.
19. Detich, N., et al., The methyl donor S-Adenosylmethionine inhibits active demethylation of DNA: a candidate novel mechanism for the pharmacological effects of S-Adenosylmethionine. J Biol Chem, 2003. 278(23): p. 20812-20.
75
20. Goll, M.G. and T.H. Bestor, Histone modification and replacement in chromatin activation. Genes Dev, 2002. 16(14): p. 1739-42.
21. Yang, X.J. and E. Seto, Collaborative spirit of histone deacetylases in regulating chromatin structure and gene expression. Curr Opin Genet Dev, 2003. 13(2): p. 143-53.
22. Ng, H.H. and A. Bird, Histone deacetylases: silencers for hire. Trends Biochem Sci, 2000. 25(3): p. 121-6.
23. Toi, M., S. Ishigaki, and T. Tominaga, Metalloproteinases and tissue inhibitors of metalloproteinases. Breast Cancer Res Treat, 1998. 52(1-3): p. 113-24.
24. Galm, O., et al., Inactivation of the tissue inhibitor of metalloproteinases-2 gene by promoter hypermethylation in lymphoid malignancies. Oncogene, 2005. 24(30): p. 4799-805.
25. Sager, R., et al., Maspin: a tumor suppressing serpin. Curr Top Microbiol Immunol, 1996. 213 ( Pt 1): p. 51-64.
26. Jackson, P., et al., Methylation of a CpG island within the promoter region of the KAI1 metastasis suppressor gene is not responsible for down-regulation of KAI1 expression in invasive cancers or cancer cell lines. Cancer Lett, 2000. 157(2): p. 169-76.
27. Meehan, W.J., et al., Breast cancer metastasis suppressor 1 (BRMS1) forms complexes with retinoblastoma-binding protein 1 (RBP1) and the mSin3 histone deacetylase complex and represses transcription. J Biol Chem, 2004. 279(2): p. 1562-9.
28. Buckley, N.D. and S.A. Carlsen, Involvement of soybean agglutinin binding cells in the lymphatic metastasis of the R3230AC rat mammary adenocarcinoma. Cancer Res, 1988. 48(6): p. 1451-5.
29. Carlsen, S.A., M. Barry, and K. Newton, The identification of a neutral glycosphingolipid antigenic marker for metastatic cells in the R3230AC rat mammary adenocarcinoma. Clin Exp Metastasis, 1990. 8(2): p. 141-51.
30. Carlsen, S.A., et al., Isoglobotetraosylceramide is a marker for highly metastatic cells in rat mammary adenocarcinomas. Cancer Res, 1993. 53(12): p. 2906-11.
31. Dumonceaux, T. and S.A. Carlsen, Isogloboside biosynthesis in metastatic R3230AC cells results from a decreased GM3 synthase activity. Arch Biochem Biophys, 2001. 389(2): p. 187-94.
32. Ishii, A., et al., Expression cloning and functional characterization of human cDNA for ganglioside GM3 synthase. J Biol Chem, 1998. 273(48): p. 31652-5.
33. Calvert, B., Identification and characterization of a novel rat gene, MS-1, expressed in poorly metastatic rat mammary and prostate adenocarcinomas, in Microbiology and Immunology. 2002, University of Saskatchewan: Saskatoon.
34. Deibert, L., Cloning and characterization of the human homologue of a novel transcription factor, MS-1, discovered in an R3230AC rat model system, in Microbiology and Immunology. 2004, University of Saskatchewan: Saskatoon.
35. Honma, Y., et al., Identification of a novel gene, OASIS, which encodes for a putative CREB/ATF family transcription factor in the long-term cultured astrocytes and gliotic tissue. Brain Res Mol Brain Res, 1999. 69(1): p. 93-103.
36. Malhotra, S.K., T.K. Shnitka, and J. Elbrink, Reactive astrocytes--a review. Cytobios, 1990. 61(246-247): p. 133-60.
76

37. Nikaido, T., et al., Expression of OASIS, a CREB/ATF family transcription factor, in CNS lesion and its transcriptional activity. Brain Res Mol Brain Res, 2002. 108(1-2): p. 129-38.
38. Roesler, W.J., G.R. Vandenbark, and R.W. Hanson, Cyclic AMP and the induction of eukaryotic gene transcription. J Biol Chem, 1988. 263(19): p. 9063-6.
39. Omori, Y., et al., OASIS is a transcriptional activator of CREB/ATF family with a transmembrane domain. Biochem Biophys Res Commun, 2002. 293(1): p. 470-7.
40. Kondo, S., et al., OASIS, a CREB/ATF-family member, modulates UPR signalling in astrocytes. Nat Cell Biol, 2005. 7(2): p. 186-94.
41. Marjon, P.L., E.V. Bobrovnikova-Marjon, and S.F. Abcouwer, Expression of the pro-angiogenic factors vascular endothelial growth factor and interleukin-8/CXCL8 by human breast carcinomas is responsive to nutrient deprivation and endoplasmic reticulum stress. Mol Cancer, 2004. 3: p. 4.
42. Dunning, W.F., Prostate Cancer in the Rat. Natl Cancer Inst Monogr, 1963. 12: p. 351-69.
43. Isaacs, J.T., et al., Genetic instability coupled to clonal selection as a mechanism for tumor progression in the Dunning R-3327 rat prostatic adenocarcinoma system. Cancer Res, 1982. 42(6): p. 2353-71.
44. Isaacs, J.T., G.W. Yu, and D.S. Coffey, The characterization of a newly identified, highly metastatic variety of Dunning R 3327 rat prostatic adenocarcinoma system: the MAT LyLu tumor. Invest Urol, 1981. 19(1): p. 20-3.
45. Hackett, A.J., et al., Two syngeneic cell lines from human breast tissue: the aneuploid mammary epithelial (Hs578T) and the diploid myoepithelial (Hs578Bst) cell lines. J Natl Cancer Inst, 1977. 58(6): p. 1795-806.
46. Cailleau, R., et al., Breast tumor cell lines from pleural effusions. J Natl Cancer Inst, 1974. 53(3): p. 661-74.
47. Cailleau, R., M. Olive, and Q.V. Cruciger, Long-term human breast carcinoma cell lines of metastatic origin: preliminary characterization. In Vitro, 1978. 14(11): p. 911-5.
48. Keydar, I., et al., Detection of viral proteins in mouse mammary tumors by immunoperoxidase staining of paraffin sections. Proc Natl Acad Sci U S A, 1978. 75(3): p. 1524-8.
49. Southern, E.M., Detection of specific sequences among DNA fragments separated by gel electrophoresis. J Mol Biol, 1975. 98(3): p. 503-17.
50. Ichikawa, T., et al., Localization of metastasis suppressor gene(s) for prostatic cancer to the short arm of human chromosome 11. Cancer Res, 1992. 52(12): p. 3486-90.
51. Dong, J.T., et al., KAI1, a metastasis suppressor gene for prostate cancer on human chromosome 11p11.2. Science, 1995. 268(5212): p. 884-6.
52. Jones, P.A. and P.W. Laird, Cancer epigenetics comes of age. Nat Genet, 1999. 21(2): p. 163-7.
53. Kostyniuk, C.L., et al., The ubiquitous and tissue specific promoters of the human SRC gene are repressed by inhibitors of histone deacetylases. Oncogene, 2002. 21(41): p. 6340-7.
77

54. Dehm, S.M. and K. Bonham, SRC gene expression in human cancer: the role of transcriptional activation. Biochem Cell Biol, 2004. 82(2): p. 263-74.
55. Yang, H., et al., S-adenosylmethionine and its metabolite induce apoptosis in HepG2 cells: Role of protein phosphatase 1 and Bcl-x(S). Hepatology, 2004. 40(1): p. 221-31.
56. Issa, J.P., et al., Phase II study of low-dose decitabine in patients with chronic myelogenous leukemia resistant to imatinib mesylate. J Clin Oncol, 2005. 23(17): p. 3948-56.
78