Embed Size (px)
Citation preview
Epilepsy: Error of Scales?Ann Arbor, MI 2007
Theoden Netoff
University of Minnesota, BME
Homeostasis and Epilepsy
• Neurons are in constant state of flux
• There is no single solution of ion channel densities to achieve a particular behavior
• There are many changes in response to an event like a seizure:– Changes in ion channel densities– Changes in neuronal dynamics– Changes in network coupling
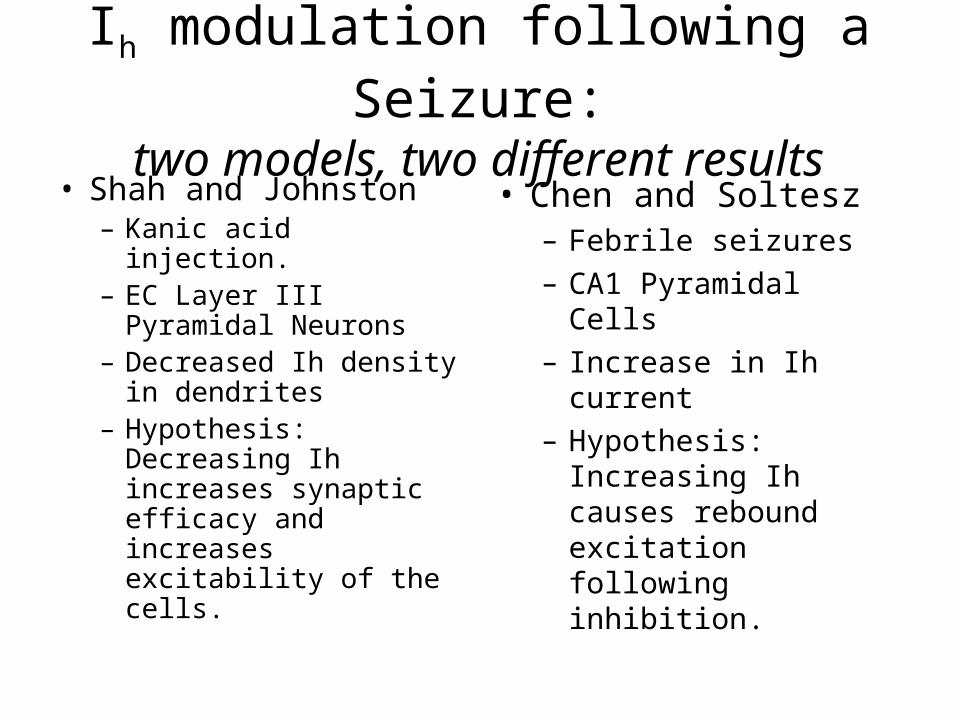
Ih modulation following a Seizure:two models, two different results
• Shah and Johnston– Kanic acid injection.– EC Layer III Pyramidal
Neurons– Decreased Ih density
in dendrites– Hypothesis:
Decreasing Ih increases synaptic efficacy and increases excitability of the cells.
• Chen and Soltesz– Febrile seizures– CA1 Pyramidal Cells– Increase in Ih current– Hypothesis: Increasing
Ih causes rebound excitation following inhibition.
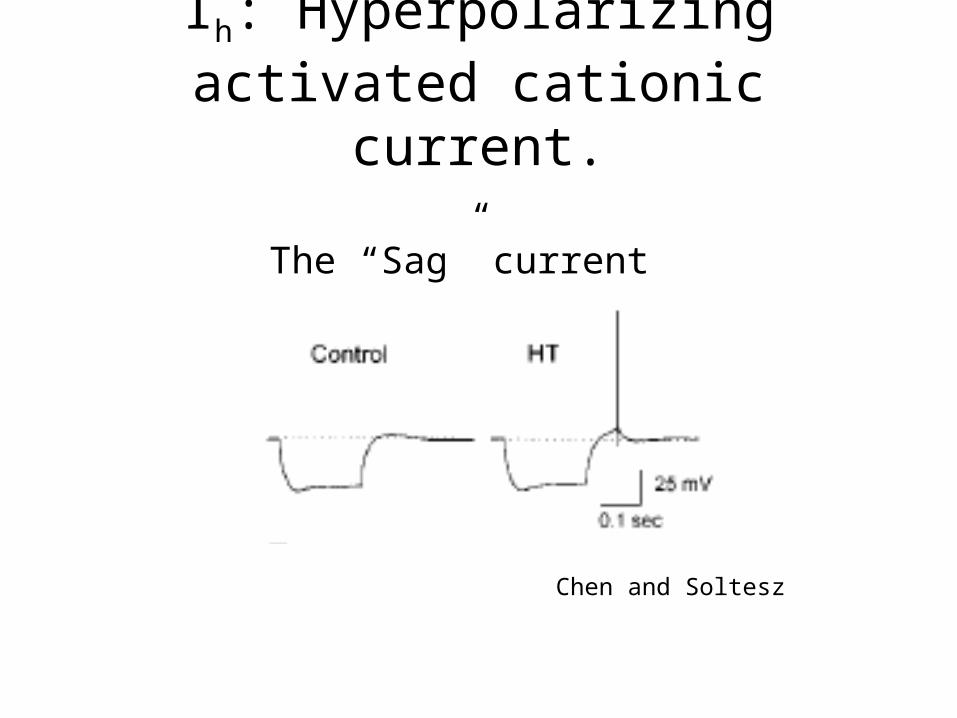
Ih: Hyperpolarizing activated cationic current.
Chen and Soltesz
The “Sag” current
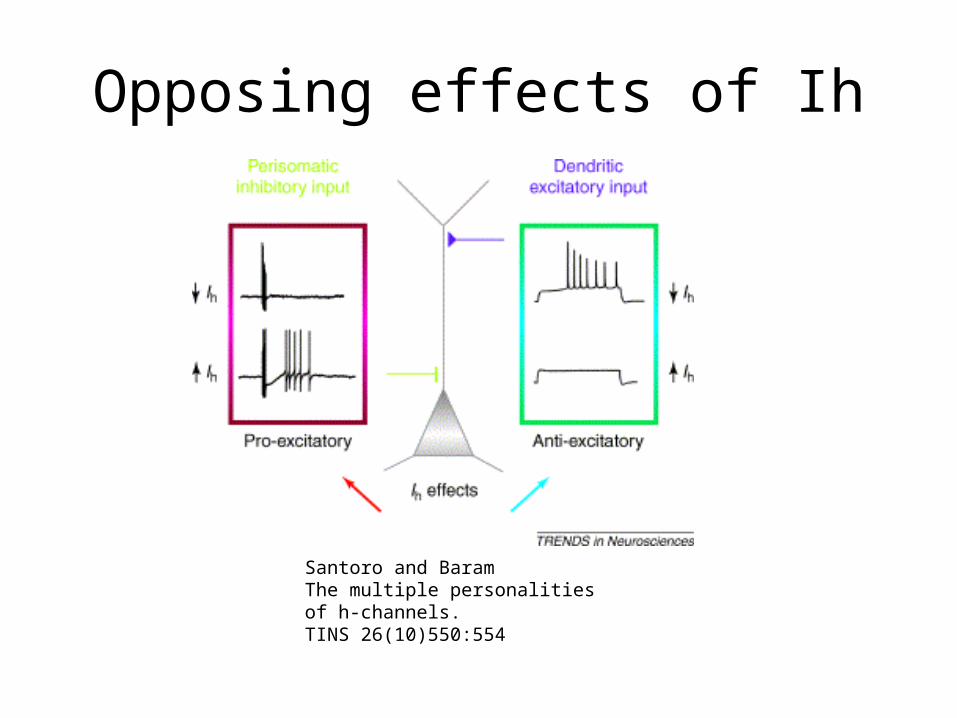
Opposing effects of Ih
Santoro and BaramThe multiple personalities of h-channels. TINS 26(10)550:554
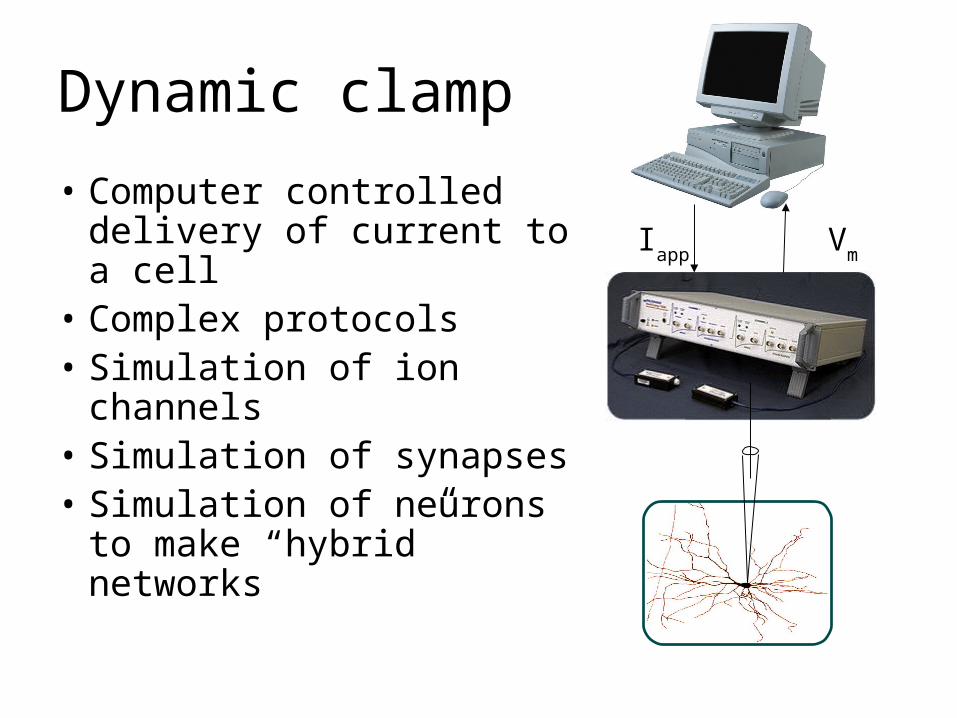
Dynamic clamp
• Computer controlled delivery of current to a cell
• Complex protocols• Simulation of ion
channels• Simulation of synapses• Simulation of neurons to
make “hybrid” networks
Vm
Iapp
Iapp
Vm
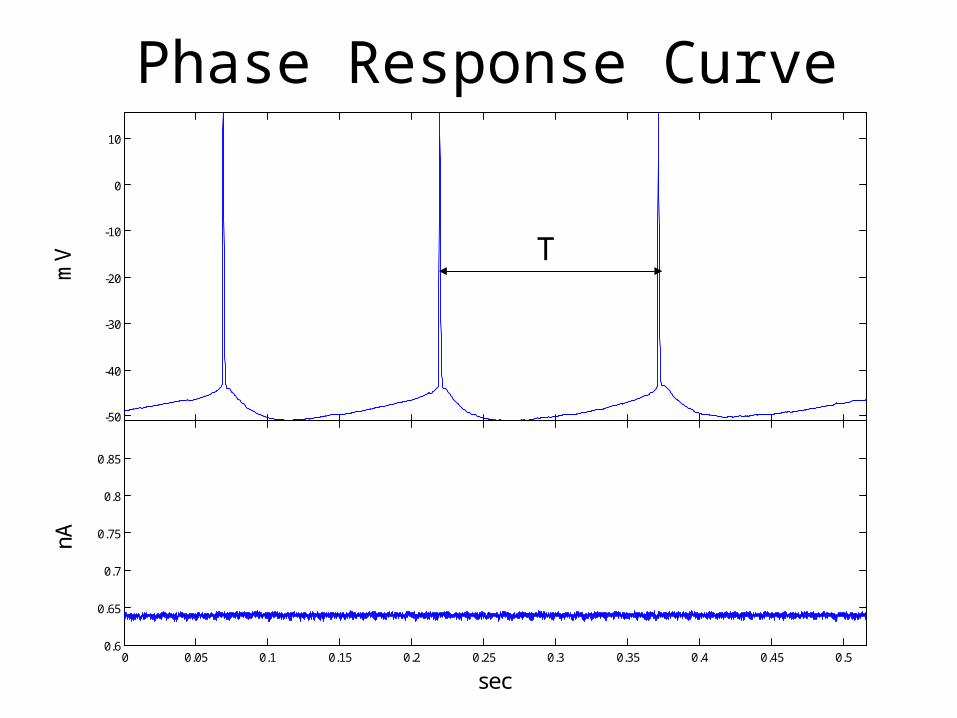
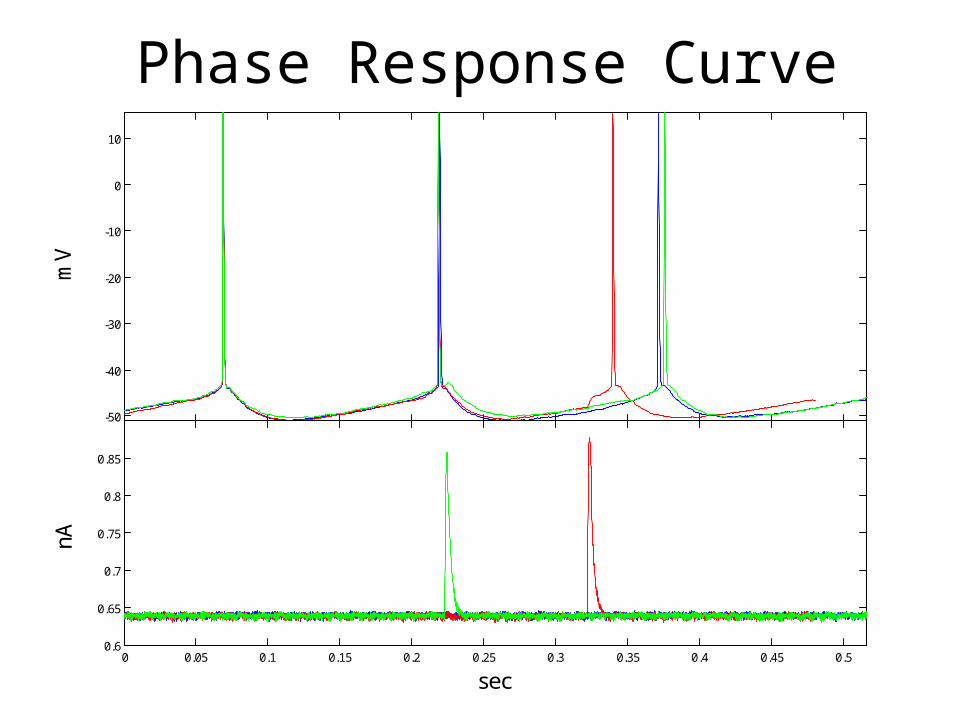
Phase Response Curve
500 1000 1500 2000 2500 3000 3500 4000 4500 5000-50
-40
-30
-20
-10
0
10
mV
0 0.05 0.1 0.15 0.2 0.25 0.3 0.35 0.4 0.45 0.50.6
0.65
0.7
0.75
0.8
0.85
sec
nA
T
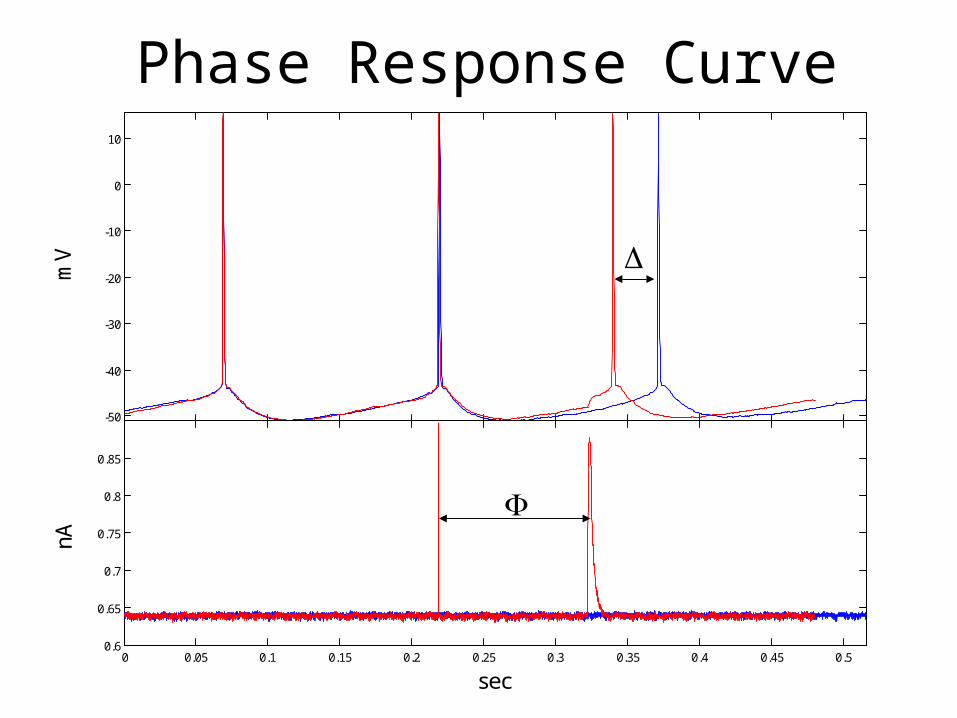
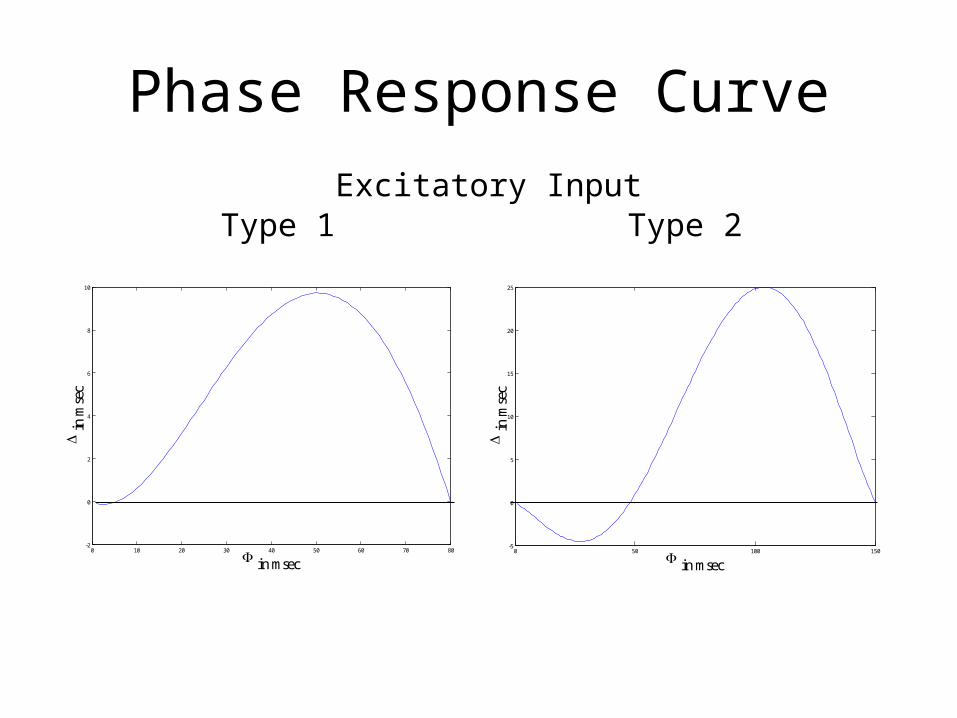
Phase Response Curve
500 1000 1500 2000 2500 3000 3500 4000 4500 5000-50
-40
-30
-20
-10
0
10
mV
0 0.05 0.1 0.15 0.2 0.25 0.3 0.35 0.4 0.45 0.50.6
0.65
0.7
0.75
0.8
0.85
sec
nA
Phase Response Curve
500 1000 1500 2000 2500 3000 3500 4000 4500 5000-50
-40
-30
-20
-10
0
10
mV
0 0.05 0.1 0.15 0.2 0.25 0.3 0.35 0.4 0.45 0.50.6
0.65
0.7
0.75
0.8
0.85
sec
nA
Phase Response Curve
0 50 100 150-5
0
5
10
15
20
25
in
mse
c
in msec0 10 20 30 40 50 60 70 80
-2
0
2
4
6
8
10
in
mse
c
in msec
Type 1 Type 2Excitatory Input
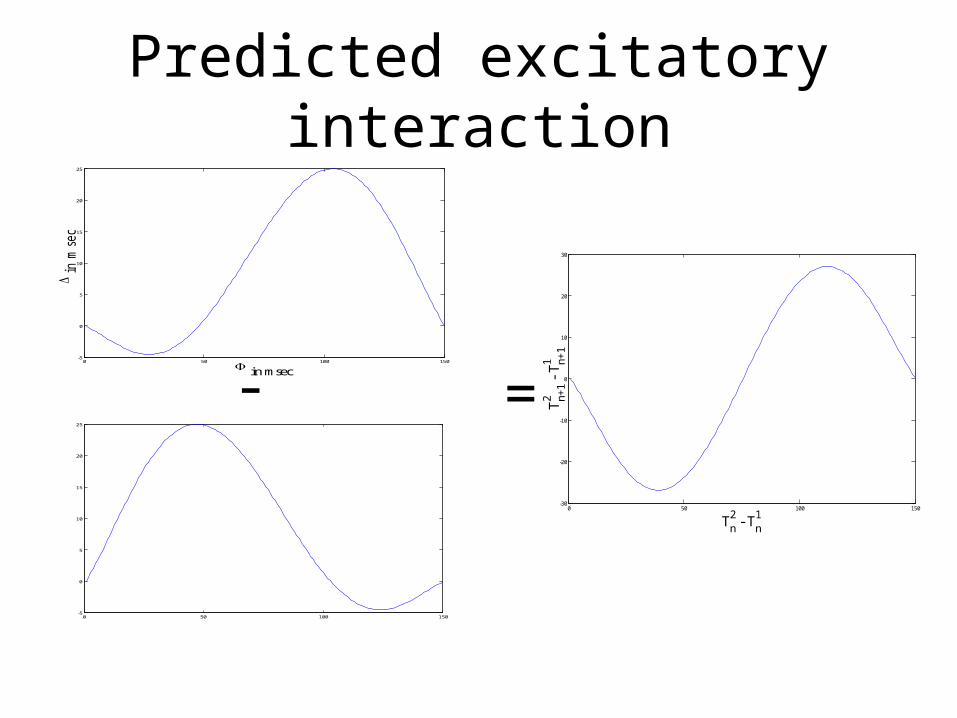
Predicted excitatory interaction
0 50 100 150-5
0
5
10
15
20
25
0 50 100 150-5
0
5
10
15
20
25
i
n m
sec
in msec
- =
0 50 100 150-30
-20
-10
0
10
20
30
Tn2 - T
n1
Tn+
12
- T
n+1
1
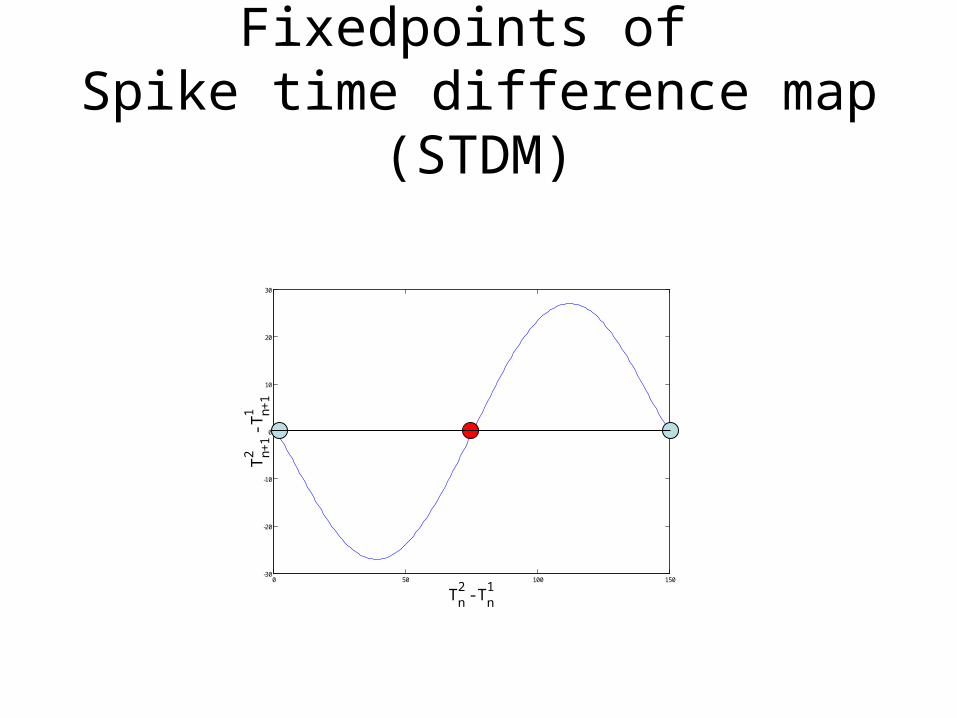
Fixedpoints of Spike time difference map (STDM)
0 50 100 150-30
-20
-10
0
10
20
30
Tn2 - T
n1
Tn+
12
- T
n+1
1
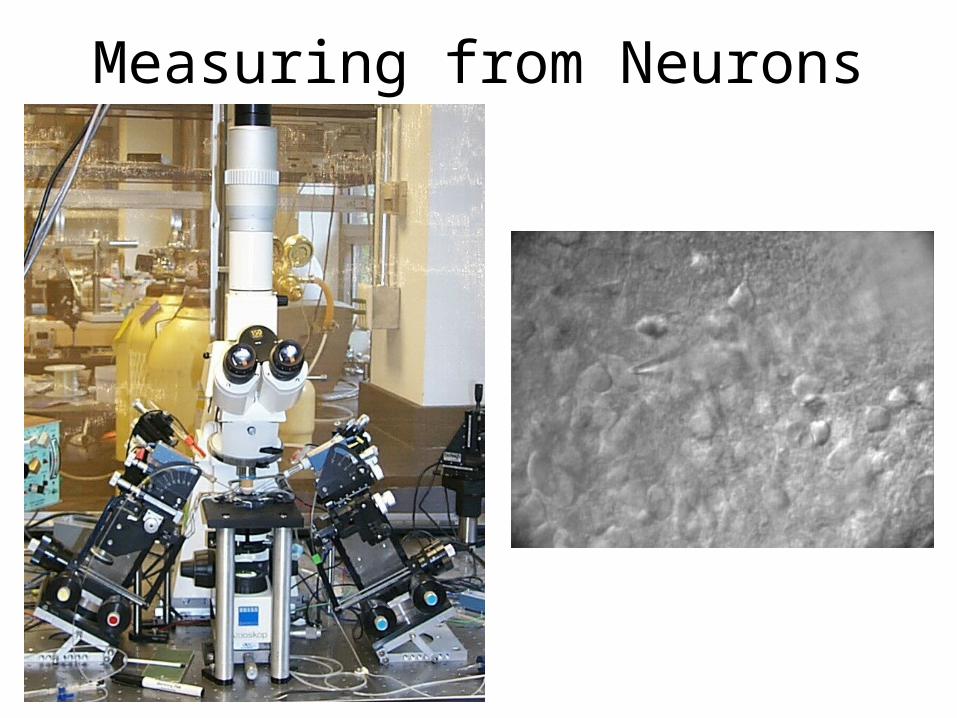
Measuring from Neurons
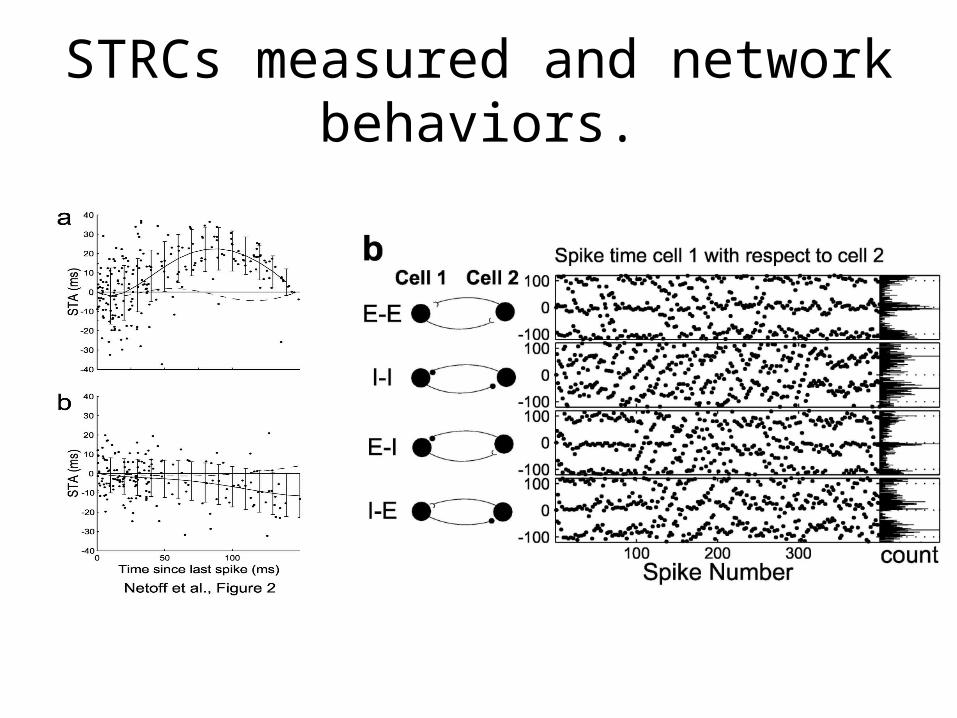
STRCs measured and network behaviors.
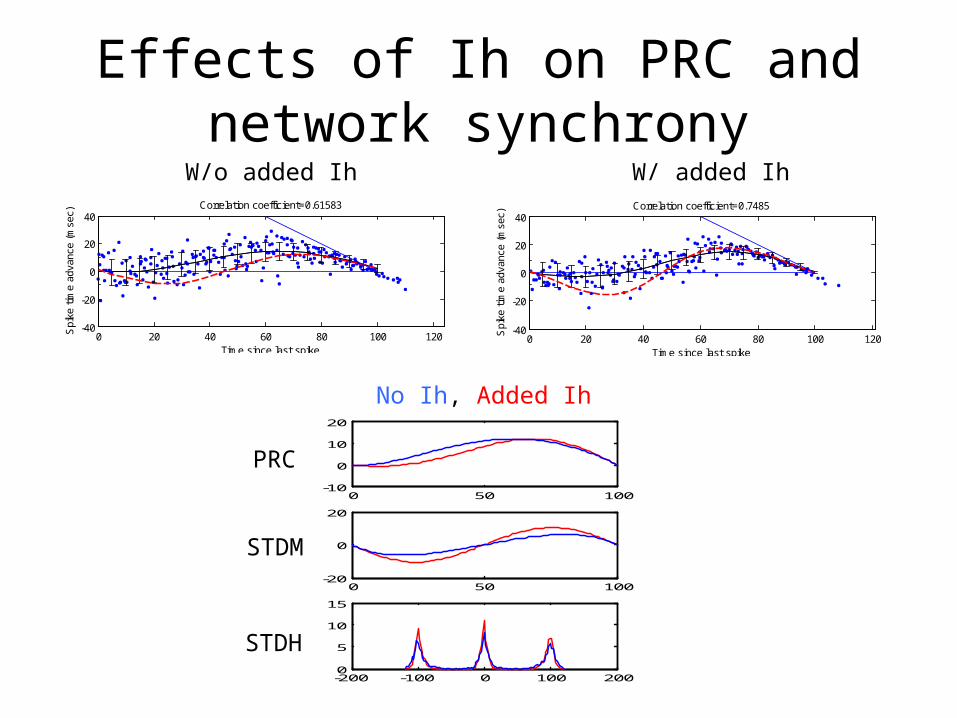
Effects of Ih on PRC and network synchrony
0 20 40 60 80 100 120-40
-20
0
20
40
Spi
ke t
ime
adva
nce
(mse
c)
Time since last spike
Correlation coefficient=0.7485
50
100
150
ISI
pert
urbe
d0 50 100 150 200 250
80
100
120
ISI
un-p
ertu
rbed
Spike num
0 20 40 60 80 100 120-40
-20
0
20
40
Spi
ke t
ime
adva
nce
(mse
c)
Time since last spike
Correlation coefficient=0.61583
50
100
150
ISI
pert
urbe
d
0 50 100 150 200 25050
100
150
ISI
un-p
ertu
rbed
Spike num0 50 100
-10
0
10
20
0 50 100-20
0
20
0 50 100-10
0
10
20
0 50 100-20
0
20
-200 -100 0 100 2000
5
10
15
-200 -100 0 100 2000
10
20
W/o added Ih W/ added Ih
No Ih, Added Ih
PRC
STDM
STDH
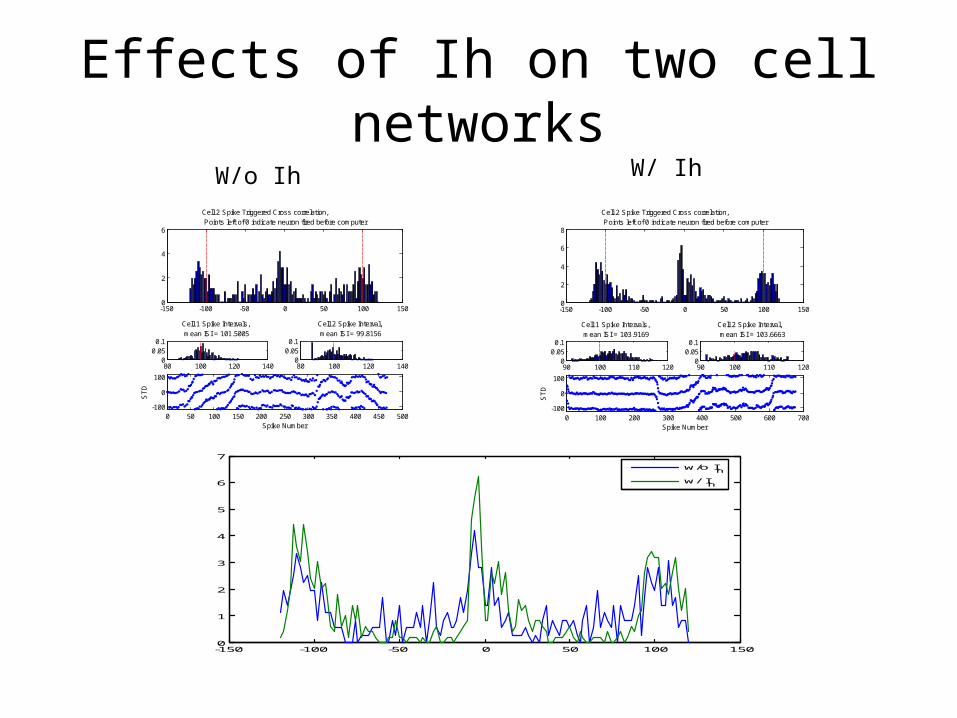
Effects of Ih on two cell networks
-150 -100 -50 0 50 100 1500
2
4
6
Cell 2 Spike Triggered Cross correlation, Points left of 0 indicate neuron fired before computer
80 100 120 1400
0.050.1
Cell 1 Spike Intervals, mean ISI = 101.5005
80 100 120 1400
0.050.1
Cell 2 Spike Interval, mean ISI = 99.8156
0 50 100 150 200 250 300 350 400 450 500-100
0
100
Spike Number
ST
D
-150 -100 -50 0 50 100 1500
2
4
6
8
Cell 2 Spike Triggered Cross correlation, Points left of 0 indicate neuron fired before computer
90 100 110 1200
0.050.1
Cell 1 Spike Intervals, mean ISI = 103.9169
90 100 110 1200
0.050.1
Cell 2 Spike Interval, mean ISI = 103.6663
0 100 200 300 400 500 600 700-100
0
100
Spike Number
ST
D
-150 -100 -50 0 50 100 1500
1
2
3
4
5
6
7
w/o Ih
w/ Ih
W/o Ih W/ Ih
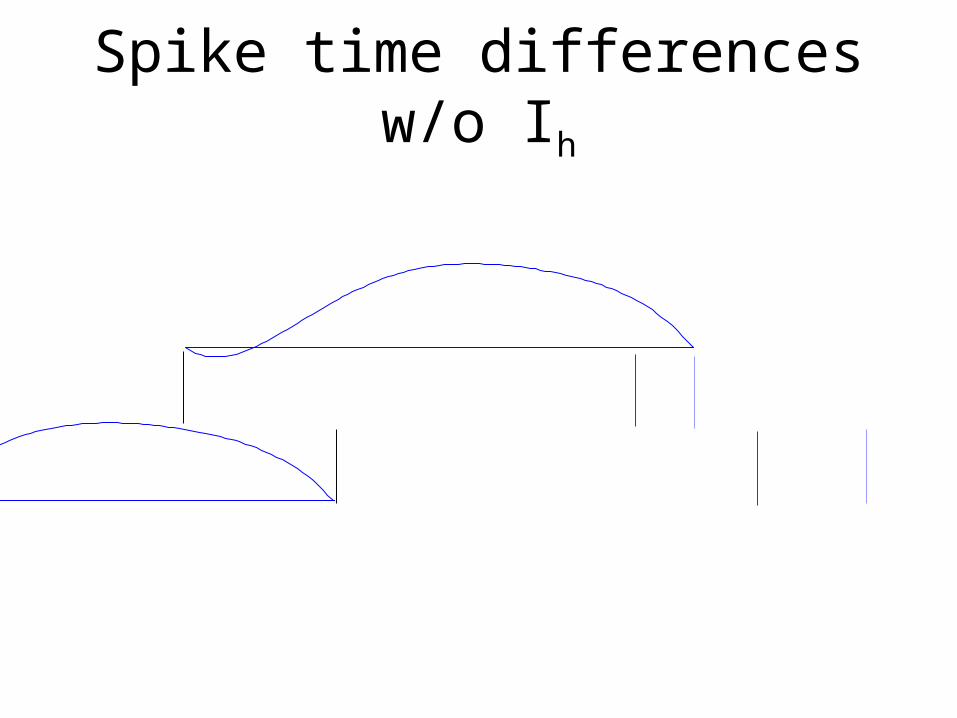
Spike time differences w/o Ih
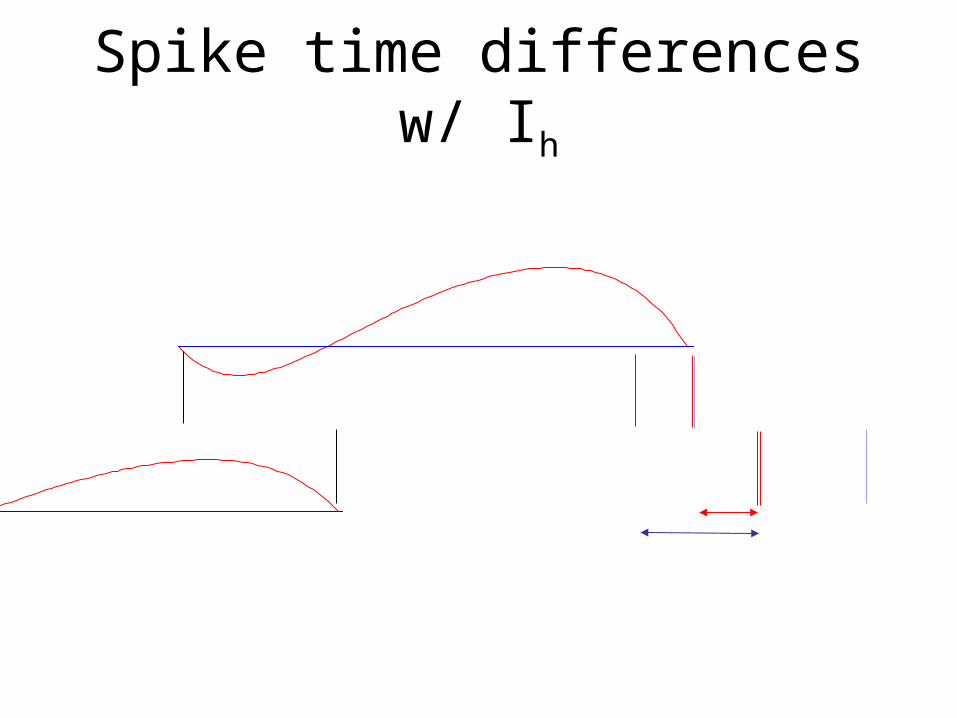
Spike time differences w/ Ih
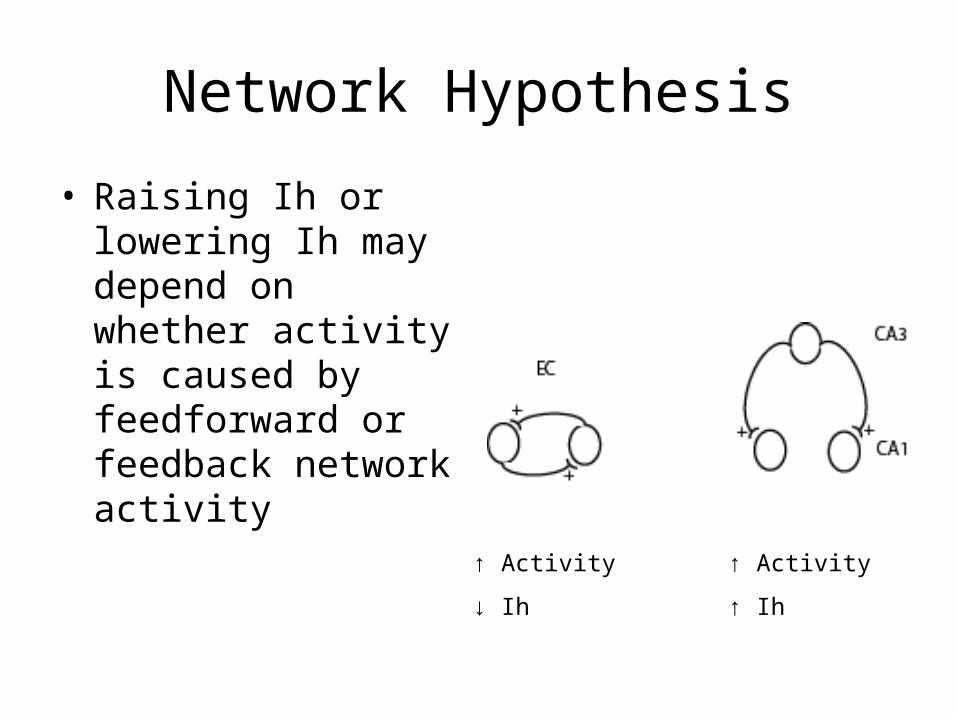
Network Hypothesis
• Raising Ih or lowering Ih may depend on whether activity is caused by feedforward or feedback network activity
↑ Activity
↓ Ih
↑ Activity
↑ Ih
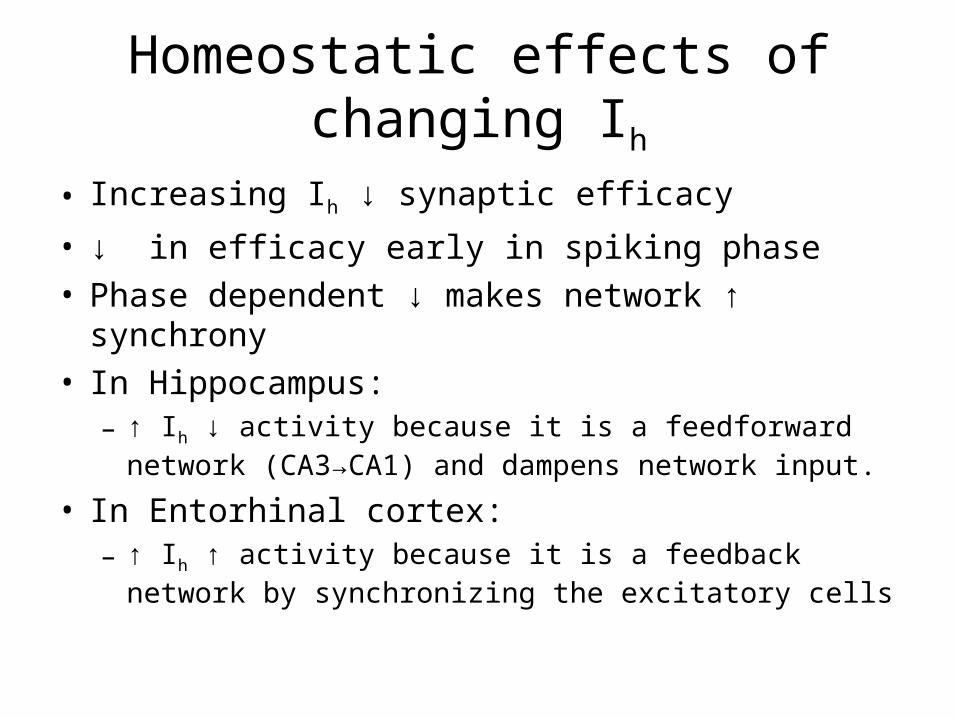
Homeostatic effects of changing Ih
• Increasing Ih ↓ synaptic efficacy
• ↓ in efficacy early in spiking phase• Phase dependent ↓ makes network ↑ synchrony• In Hippocampus:
– ↑ Ih ↓ activity because it is a feedforward network (CA3→CA1) and dampens network input.
• In Entorhinal cortex:– ↑ Ih ↑ activity because it is a feedback network by
synchronizing the excitatory cells
Question:
Homeostatic mechanisms work at the level of the individual neuron.
Is epilepsy be caused by discrepancies between homeostatic mechanisms at the cellular and their actions at a network scale?

Acknowledgements
John WhiteNancy KopellJonathan BettencourtAlan DorvalBrian Burton
Grants:Postdoctoral NRSA:
5F32MH066555-02
Fellowships:Center for BioDynamics (Boston University)