Embed Size (px)
Citation preview

VOL. 17, NO. 10 n THE AMERICAN JOURNAL OF MANAGED CARE n e383
n managerial n
© Managed Care &Healthcare Communications, LLC
T he Affordable Care Act includes a number of payment and delivery system reform pilots and initiatives that have already spurred various provider organizations across the country to
launch quality and cost improvement efforts.1 Similarly, private sector health plans are using the opportunity presented by the legislation to work collaboratively with providers on payment reform initiatives.2
One of the many challenges providers and payers face as they launch these efforts is to clearly identify the clinical domains in which they can improve performance in order to reduce variation in care that can lead to excessive costs.3 As these payers and providers move away from fee-for-service payment, the current emphasis in maximizing the vol-ume of services delivered shifts to improving the overall value derived from a given volume of services.4,5 For example, under most forms of episode-of-care bundled payments,6 global payments, or gain-sharing, providers are at financial risk for costs that exceed a specified budget. Analyzing and understanding the costs that comprise these budgets will enable provider and payer organizations to manage their respec-tive financial risks. However, the ability to identify the root cause of variation and justification for the costs of treating a patient’s episode of medical care has remained elusive. That’s because there are at least 4 primary sources of variation in total cost of an episode of medical care: 1) the unit cost of each service, 2) the mix and frequency of routine or typical services, 3) the severity of the patient’s condition, and 4) the competence of the providers in prudently managing the patient. Teas-ing out the contribution of each source has proved to be a significant challenge.
We analyzed the costs of 2 chronic episodes (chronic obstructive pul-monary disease [COPD] and diabetes), an acute medical episode (acute myocardial infarction [AMI]), and 2 procedural episodes (percutane-ous coronary intervention [PCI] and colonoscopy) in several payer data sets. The analysis illustrates the degree to which each source of varia-tion might be identified, and potentially help risk-bearing organizations, whether health plan or accountable care organizations (ACOs), to bet-ter manage prospectively set budgets.
METHODSWe used the code definitions
from an SAS-based analyti-cal program developed for the
Episode of Care Analysis Reveals Sources of Variations in Costs
Francois de Brantes, MS, MBA; Amita Rastogi, MD, MHA;
and Christina M. Soerensen, MPH
Objectives: To understand and reveal the underlying sources of inter and intraplan variation in a selected number of chronic and procedural episodes.
Study Design: Analysis of allowed claims from 9 regional health plans covering commercially insured populations in different areas of the United States.
Methods: Use of the PROMETHEUS EvidenceInformed Case Rates analytics to 1) calculate total plan costs and cost of specific episodes, 2) create price and severity adjustments, and 3) determine coefficients of variation.
Results: The interplan coefficients of variation for total per member per year costs and per episode costs vary from 0.1 to 0.55, while the intraplan coefficients of variation vary from 0.4 to 5.5. In both analyses, the coefficients of variation for potentially avoidable complications (PACs) were higher than the coefficients of variation for typical costs.
Conclusions: There is significant variation in episode costs within a plan, and PACs have significantly more variation than typical costs. Plans and accountable care organizations would benefit from understanding the source of variation of their episode costs in order to improve overall cost of care.
(Am J Manag Care. 2011;17(10):e383-e392)
For author information and disclosures, see end of text.
In this article TakeAway Points / e384 Published as a Web exclusive www.ajmc.com

e384 n www.ajmc.com n OCTObER 2011
n managerial n
PROMETHEUS Payment model to run medical and pharma-cy claims data of 9 different health plans.7 These plans were selected based on geographic diversity and the completeness of their data sets. Only commercially insured plan members between the ages of 18 and 65 years were retained for inclu-sion in the analysis. The claims included allowed amounts paid in 2008 and 2009 for each member (Table) for plan member counts and average per member per year (PMPY) costs. While allowed amounts provide a level playing field relative to intra- and interplan variations in benefit design, we could not account for the potential effects of benefit design on patient compliance.8
All claims relevant for each episode were filtered through several steps in order to ensure that the episodes analyzed were complete and could be used to build the statistical mod-els needed for severity adjustment. In particular, the process included removing claims with outlier costs (under $10 and over $1,000,000),9 removing claims with invalid or missing service dates, and removing those outside of the study peri-od.10 Patients also had to meet a continuous enrollment cri-terion, with no enrollment gap greater than 30 days. Finally, patients with complex comorbid conditions (eg, patients with HIV, cancer, or end stage renal disease) were excluded from the final analysis.
We used a set of core services for each chronic care epi-sode11 to calculate the base cost of that episode in each of the databases studied to determine the core price of 1 year of COPD or diabetes care in a given health plan’s database. The core price value is used to adjust for unit price differences in the different health plan populations and thus normalize each plan’s relative price effect.
The cost of each episode was calculated as the sum of costs for all relevant services, which included services for routine and customary care, other diagnostic and minor therapeutic services, pharmacy costs, plus care for potentially avoidable complications (PACs) such as emergency department admis-sions, hospitalizations, and other acute complications. The PROMETHEUS-defined PACs for chronic and acute episodes have been recently endorsed by the National Quality Forum12
and are understood to be potentially pre-ventable services that could be avoided to some extent if patients were prudently and optimally managed by their treating providers. The average relevant cost of each episode was thus subdivided into 2 component parts, those related to typical care and those related to PACs. by con-vention, pharmacy costs are primarily assigned to typical costs. These costs are then adjusted by the core price for the
health plan to account for some of the differences caused by average negotiated fee schedules. The costs of acute inpatient and procedural episodes were not price adjusted because ne-gotiated fees for inpatient stays are difficult to estimate given the bundling of services in a single stay claim.
The analytic package computes a severity-adjusted ex-pected cost for typical care for each patient independently for each episode using an automated log-linear regression model that runs a bootstrap validation 200 times to identify variables that are significant cost drivers, and assigns weights to each of the variables that are finally retained in the model.13 A plan level average severity score for each episode is derived by ag-gregating the average weights in the final model for each pa-tient based on the risk factors that were actually present. The severity index, in turn, was derived from the severity score in-dexed to a reference severity score set at 1 from a benchmark database. The severity index thus calculated gives a reference value to determine if the population in a given database is of a higher or lower severity than in another database.14 For example, the severity scores for COPD for each of the 9 plans were 0.82, 0.72, 0.55, 0.50, 0.84, 1.11, 0.50, 0.55, and 0.55, respectively, illustrating the significant difference in severity of the underlying patients in each data set. The average sever-ity index for members with COPD episodes in these 9 plans is 0.68 and the adjustment factor to adjust the average episode costs for each plan relative to the overall plans’ average was computed by dividing the average index by each plan’s index. For example, Plan 1’s adjustment factor for COPD episode cost would be 0.68/0.82 or 0.83 and Plan 4’s adjustment factor for COPD would be 0.68/0.5 or 1.36. The cost of typical care was then adjusted for the severity of the patient’s condition while PAC cost was only adjusted for price.
The effect of the adjustments can be quite significant. For example, Plan 1’s unadjusted average cost for COPD was $3608 compared with the adjusted cost of $3267 as reported in Table 1. The adjustments were also consistent across epi-sodes; plans with a higher severity index in COPD also had higher severity indices in the other studied episodes. This consistency provides some validation of the methodology
Take-Away PointsCosts of potentially avoidable complications (PACs) have significantly more variation than costs of typical care in selected chronic and procedural episodes.
n Total episode costs conceal the variation in potentially avoidable costs of each episode, and plans or accountable care organizations (ACOs) should understand the contribution of typical and PAC costs for each episode and create strategies to address each.
n Interplan variation in per member per year and total average episode costs is much smaller than intraplan variation, and employers comparing plans or ACOs should understand the magnitude of the variation in costs within the plan or ACO.
n Total episode costs could be reduced if the variation in PAC costs were reduced.

VOL. 17, NO. 10 n THE AMERICAN JOURNAL OF MANAGED CARE n e385
analysis reveals Variations in Costs
Figure 2 summarizes the average typical and PAC cost of each episode across the 9 plans studied. The proportion of PAC cost to relevant episode cost varied by episode, from a high of 47% for COPD to a low of 14% for colonoscopy (see appendices a through D).
Using diabetes as an example, Figure 3 shows the aver-age adjusted episode cost for 12 months of diabetes care, split between the average typical and PAC cost for each plan, and the average across plans.
Although the average adjusted relevant costs vary little across plans, there was a lot of variability in each component of the costs within each plan. Figure 4 shows the coefficients of variation for the typical, PAC, and relevant costs of an episode of diabetes for each plan studied, as well as for the average of the 9 plans. The coefficient of variation for typical care ranged from 0.9 to 1.7, while the coefficient of variation for PAC cost (which represents about 30% of total episode cost for diabetes) ranged from 3.9 to 5.4, and was generally 3 times greater than that of typical care. Coefficients of varia-tion for average relevant episode cost ranged from 1.3 to 2.4, and tracked the coefficients of variation for typical costs.
A similar detailed comparison of average episode cost for COPD and colonoscopy and its breakdown into typical and PAC cost, as well as their respective coefficients of variation, can be found in the Appendices.
used. Similarly, plans with a higher unit price of services in COPD also had a higher unit price of services in diabetes, which is to be expected given that plan contracts apply to all care delivered by network providers.
Coefficients of variation were then calculated for each plan’s episodes, for adjusted PAC and typical costs, as well as their sum, and average relevant episode costs. Coefficients of variation were also calculated to compare the differences between plans in episode costs.
RESULTSAfter adjusting for the differences in severity and price,
the overall coefficient of variation between plans, as measured by each plan’s PMPY costs, was 0.21, and the coefficients of variation for the studied episodes varied from a low of 0.11 for diabetes to a high of 0.49 for AMI. The average coefficient of variation within each plan (intraplan) for each of the episode costs was higher than the interplan (between plans) variation and ranged from 0.77 for colonoscopy to 2.40 for COPD.
As seen in the Table and Figure 1, for all studied episodes, the coefficients of variation for PAC costs were 2 to 3 times higher than for typical costs, and the coefficients of variation for typical costs both tracked and were within a close range of the coefficients for average relevant episode costs.
n Table. Total Members and Average Costs per Member per Year and per Episode
Total Members
With Claims
PMPY for
All Claims
COPD
Diabetes
AMI
PCI
Colonoscopy
Total Patients 5,864,692 73,711 176,141 6045 8322 289,112
Plan 1 – Northeast 99,217 $3092 $3267 $3887 $18,067 $25,467 $1634
Plan 2 – Northeast 356,032 $2605 $4438 $4736 $25,038 $25,082 $1855
Plan 3 – Northeast 108,335 $2265 $3045 $4073 $30,578 $33,692 $2600
Plan 4 – Midwest 298,870 $2410 $3253 $4534 $30,322 $43,047 $2420
Plan 5 – Midwest 442,408 $2432 $2376 $3532 $20,998 $21,540 $1854
Plan 6 – Northeast 1,965,583 $3824 $3616 $4682 $20,401 $25,819 $2310
Plan 7 – West 719,802 $2032 $2755 $4086 $68,363 $59,207 $2358
Plan 8 – West 681,997 $2394 $3044 $4337 $30,265 $36,707 $1973
Plan 9 – Northeast 1,192,448 $3028 $4251 $5019 $37,435 $39,650 $2655
Average $2676 $3338 $4321 $31,274 $34,468 $2184
Standard deviation $549 $668 $469 $15,220 $11,880 $364
Interplan coef of var average relevant 0.21 0.20 0.11 0.49 0.34 0.17
Intraplan coef of var average relevant 2.40 1.71 0.91 0.79 0.77
Coef of var typical 1.99 1.17 0.82 0.60 0.57
Coef of var PACs 4.19 4.49 2.45 1.92 2.85
AMI indicates acute myocardial infarction; coef of var, coefficient of variation; COPD, chronic obstructive pulmonary disease; PAC, potentially avoid-able complication; PCI, percutaneous coronary intervention; PMPY, per member per year.

e386 n www.ajmc.com n OCTObER 2011
n managerial n
DISCUSSIONWe used a standardized episode of care method to shed
light on the sources of variation observed between and with-in plans for a selected number of episodes of care. Sources of potential variation in the total cost of an episode include: 1) unit price per service, as determined by fee schedules or contracted rates; 2) severity of the patient’s condition—pa-
tients with a greater number of comorbidities require more resources to manage their condition; 3) provider practice patterns, evidenced by the frequency and mix of services pro-vided for routine or typical care; and 4) provider performance in the management of their patients, illustrated here by the frequency and cost of PACs.
There is another source of variation related to patient compliance that we could not account for nor explain using
n Figure 1. Average of the PlanSpecific (Intraplan) Coefficients of Variation for Each Episode, for Typical, PAC, and Relevant Costs
n Figure 2. Average Typical and PAC Costs for Each Episode Across All Studied Plans, and Relative Weight of Typical and PAC as Percent of Relevant Costs
AMI indicates acute myocardial infarction; coef of var PACs, coefficient of variation for costs associated with PACs; coef of var rel, coefficient of varia-tion for relevant costs (relevant costs = typical costs + PAC costs); coef of var typ, coefficient of variation for typical costs; COPD, chronic obstructive pulmonary disease; PAC, potentially avoidable complication; PCI, percutaneous coronary intervention.
AMI indicates acute myocardial infarction; avg PAC, average costs associated with PACs (relevant costs = typical costs + PAC costs); avg typ, average typical costs; COPD, chronic obstructive pulmonary disease; PAC, potentially avoidable complication; PCI, percutaneous coronary intervention.
5.0
4.5
4.0
3.5
3.0
2.5
2.0
1.5
1.0
0.5
0COPD Diabetes AMI PCI Colonoscopy
Pla
n-S
pec
ific
Co
effi
cien
ts o
f Var
iati
on
2.0
4.24.5
2.5
1.9
2.9
1.2
0.80.6 0.6
Coef of Var Typ
Coef of Var PACs
Coef of Var Rel
100
90
80
70
60
50
40
30
20
10
0COPD Diabetes AMI PCI Colonoscopy
Perc
enta
ge o
f R
elev
ant
Co
sts
$1561
Severity Adjusted Avg Typ Avg PAC
$1777 $2989 $23,333 $25,181 $1886
$1332 $7942 $9287 $298

VOL. 17, NO. 10 n THE AMERICAN JOURNAL OF MANAGED CARE n e387
analysis reveals Variations in Costs
administrative claims data. For the purpose of this discussion, we have to assume that lack of patient compliance would be captured in the error term of the models and contribute to the unexplained variation within each plan. Additionally, while the plan membership for the selected plans is com-posed only of patients commercially insured under the age of 65 years, we did not adjust for potential socioeconomic dif-
ferences between plan members, such as income. The adjust-ment for severity of patients’ condition, however, did adjust for differences in age and gender.
As we move from a PMPY view of plan costs to a per-episode cost, the relative performance of each plan changes. For example, while Plan 6’s PMPY cost was the highest, the average relevant cost of each studied episode was close to the
n Figure 3. Average Relevant Costs of a Diabetes Episode, Split Between PAC and Typical, by Plan and the Average for All Plans Studied
n Figure 4. Coefficients of Variation for Typical, PAC, and Relevant Costs of a Diabetes Episode by Plan, and the Average for All Plans Studied
Avg typ indicates average typical costs; avg PACs, average costs associated with PACs (relevant costs = typical costs + PAC costs); PAC, potentially avoidable complication.
Coef of var PACs indicates coefficient of variation for costs associated with PACs; coef of var rel, coefficient of variation for relevant costs (relevant costs = typical costs + PAC costs); coef of var typ, coefficient of variation for typical costs; PAC, potentially avoidable complication.
6000
5000
4000
3000
2000
1000
0Average Plan 1 Plan 2 Plan 3 Plan 4 Plan 5 Plan 6 Plan 7 Plan 8 Plan 9
Rel
evan
t C
ost
s, $
Severity and Price Adjusted Avg Typ Price adjusted Avg PACs
6.0
5.0
4.0
3.0
2.0
1.0
0Average Plan 1 Plan 2 Plan 3 Plan 4 Plan 5 Plan 6 Plan 7 Plan 8 Plan 9
Pla
n-S
pec
ific
Co
effi
cien
ts o
f Var
iati
on
Coef of Var Typ
Coef of Var PACs
Coef of Var Rel
1.2
4.5
0.9
4.2
1.0
4.9
1.0
4.1
1.4
5.4
1.1
4.7
1.1
3.9
1.4
4.6
1.2
4.3
1.7
4.3

e388 n www.ajmc.com n OCTObER 2011
n managerial n
average of all plans, and some of the episode costs were among the lowest. And as we move from average relevant episode cost to the average for PAC and typical cost, and the variation in their respective parts, the picture changes yet again. For ex-ample, Figure 3 shows that Plan 5’s average cost of a diabetes episode was the lowest of the plans studied. However, as seen in Figure 4, that same plan’s coefficient of variation for PAC cost is one of the highest, which means that an individual plan member is far more likely to incur a PAC cost that is dif-ferent than the average for other plans. And given the skewed episode costs, the variation means that a patient is likely to incur higher PAC costs than the average.
by separating the total cost of each episode into typical and PAC cost we can better understand the differences be-tween warranted and unwarranted cost of care, and the coef-ficients of variation for each episode within each plan provide insights into the intrinsic variation of each cost component.15 However, the coefficients of variation have to be examined in conjunction with the magnitude of their effect. For example, in episodes such as diabetes where PACs constitute a signifi-cant proportion (30%) of average relevant cost of the episode, the dollar impact of the PAC cost variation on total episode cost is much higher than in episodes such as colonoscopy, for which PAC costs are a much smaller portion of relevant epi-sode costs (14%).
Understanding both the weight of typical and PAC cost in total episode cost and their respective coefficients of variation can lead to different tactics in cost reduction. For example, episodes with high PAC rates and high PAC coefficients of variation should be targeted for aggressive PAC reductions. Alternatively, episodes with a high proportion of typical costs are candidates for targeted reductions in duplicated tests or some greater harmonization in the type and frequency of typi-cal services.
These insights can create an early road map for risk-bearing organizations, whether health plans or ACOs.16,17 To reduce variation in its total cost of care, a risk-bearing organization must first understand the costs of its underlying episodes of care; the amount of variation in costs that is caused by dif-ferences in practice patterns (from severity-adjusted typical costs); and the variation caused by the frequency of PACs (related to provider performance). With that analysis done, it can look to implement specific interventions. For example, a central component of ACOs is clinical integration, which presumes the use of standard clinical protocols in the man-agement of patients. Those guidelines should help reduce the variation caused by differences in practice patterns. Another goal of ACOs is to reduce the frequency of hospitalizations and emergency department visits by patients as a means to reduce the total cost of caring for that population.18 Reducing
PACs and their variability will help ACOs accomplish that goal.
Total PMPY costs, and even average episode costs, do not reveal the extent and source of variation in costs that exist within risk-bearing organizations. Despite the limitation of our analysis to account for the effect of patient compliance or socioeconomic differences on total variation, our study shows that the variation between plans is relatively small, and cer-tainly far lower than the observed variation within each plan. As risk-bearing shifts to ACOs, employers and plans should require far more information on the source of variation in cost than would be apparent by comparing the total per member cost of each episode or of total costs.
Author Affiliations: From Health Care Incentives Improvement Institute, Inc (Fdb, AR, CMS), Newton, CT.
Funding Source: None.
Author Disclosures: Mr de brantes, Dr Rastogi, and Ms Soerensen report employment with Health Care Incentives Improvement Institute, Inc, which developed the PROMETHEUS Payment model used in this study to run medi-cal and pharmacy claims.
Authorship Information: Concept and design (Fdb, AR); acquisition of data (Fdb, AR); analysis and interpretation of data (Fdb, AR, CMS); drafting of the manuscript (Fdb, AR, CMS); critical revision of the manuscript for important intellectual content (Fdb, AR, CMS); statistical analysis (Fdb, AR, CMS); and supervision (Fdb).
Address correspondence to: Francois de brantes, MS, MbA, Health Care Incentives Improvement Institute, Inc, 13 Sugar St, Newton, CT 06470. E-mail: [email protected].
REFERENCES1. Orszag PR, Emanuel EJ. Health care reform and cost control. N Engl J Med. 2010;363(7):601603.
2. Ginsburg PB. Rapidly evolving physicianpayment policy – more than the SGR. N Engl J Med. 2011;364(2):172176.
3. Rosenthal J, Gauthier A, Arons A. State strategies to improve quality and efficiency: making the most of opportunities in national health reform. http://www.commonwealthfund.org/Publications/FundReports/ 2010/Dec/StateStrategiestoImproveQualityandEfficiency.aspx. Accessed February 28, 2011.
4. de Brantes F, Rosenthal MB, Painter M. Building a bridge from fragmentation to accountability —the Prometheus Payment model. N Engl J Med. 2009;361(11):10331036.
5. Yong PL, Saunders RS, Olsen LA, eds. The Healthcare Imperative: Lowering Costs and Improving Outcomes. Workshop Series Summary. Washington DC: The National Academies Press; 2010.
6. Antos J, Bertko J, Chernew M, et al. Bending the curve through health reform implementation. Am J Manag Care. 2010;16(11):804812.
7. Health Care Incentives, Improvement Institute. www.hci3.org Prometheus Payment. Accessed February 28, 2011.
8. Choudhry N, Rosenthal MB, Milstein A. Assessing the evidence for valuebased insurance design. Health Aff. 2010;29(11):19881994.
9. Quality Alliance Steering Committee. Costofcare measurement development. http://www.healthqualityalliance.org/hvhcproject/costcaremeasurementdevelopment. Accessed June 29, 2011.
10. Rastogi A, Mohr B, Williams J, Soobader M, de Brantes F. Prometheus payment model: application to hip and knee replacement surgery. Clin Orthrop Relat Res. 2009;467(10):25872597.
11. de Brantes F, Camillus J. Evidenceinformed case rates: a new health care payment model. http://www.commonwealthfund.org/Publications/FundReports/2007/Apr/EvidenceInformedCaseRatesANewHealthCarePaymentModel.aspx. Accessed February 28, 2011.

VOL. 17, NO. 10 n THE AMERICAN JOURNAL OF MANAGED CARE n e389
analysis reveals Variations in Costs
12. National Quality Forum. NQF endorses additional outcome measures for highimpact areas. http://qualityforum.org/News_And_Resources/Press_Releases/2011/NQF_Endorses_Additional_Outcome_Measures_for_HighImpact_Areas.aspx. Accessed March 28, 2011.
13. de Brantes F, Rastogi A. Evidenceinformed case rates: paying for safer, more reliable care. http://www.commonwealthfund.org/Publications/FundReports/2007/Apr/EvidenceInformedCaseRatesANewHealthCarePaymentModel.aspx. Accessed February 28, 2011.
14. Duncan I. Provider efficiency assessment and reimbutsement using risk adjustment. In: Healthcare Risk Adjustment and Predictive Model-ing. Winsted, CT: ACTEX Publications, Inc; 2011:263267.
15. de Brantes F, Rastogi A, Painter M. Reducing potentially avoidable complications in patients with chronic diseases: the Prometheus Payment approach. Health Serv Res. 2010:45(6, pt 2):18541871.16. Kocher R, Sahni NR. Physicians versus hospitals as leaders of accountable care organizations. N Engl J Med. 2010;363(27):25792582.17. Berwick DM. Launching accountable care organizations – the proposed rule for the Medicare Shared Savings Program [published online ahead of print March 31, 2011]. N Engl J Med. 2011;364(16):e32. 18. HealthCare.gov. Accountable care organizations: improving care coordination for people with Medicare. http://www.healthcare.gov/news/factsheets/accountablecare03312011a.html. Accessed April 10, 2011. n

e390 n www.ajmc.com n OCTObER 2011
n managerial n
n Appendix A. Interplan Variation by Episode
COPD Diabetes AMI PCI Colonoscopy
Adjusted Typical $1777 $2989 $23,333 $25,181 $1886
Avg PACs $1561 $1332 $7942 $9287 $298
Avg relevant $3338 $4321 $31,274 $34,468 $2184
Coef of var typ 0.18 0.10 0.55 0.44 0.20
Coef of var PACs 0.33 0.19 0.44 0.30 0.45
Coef of var rel 0.20 0.11 0.49 0.34 0.17
AMI indicates acute myocardial infarction; avg PACs, average costs asociated with PACs; coef of var PACs, coefficient of variation for costs associated with PACs; coef of var rel, coefficient of variation for relevant costs (relevant costs = typical costs + PAC costs); coef of var typ, coefficient of variation for typical costs; COPD, chronic obstructive pulmo-nary disease; PAC, potentially avoidable complication; PCI, percutaneous coronary intervention.
n Appendix B. Coefficients of Variation Across Plans (Interplan) for Typical, PAC, and Total Relevant Costs by Episode
5.00
4.00
3.00
2.00
1.00
0COPD Diabetes AMI PCI Colonoscopy
Pla
n-S
pec
ific
Co
effi
cien
ts o
f Var
iati
on
Coef of Var Typ
Coef of Var PACs
Coef of Var Rel4.5
AMI indicates acute myocardial infarction; coef of var PACs, coefficient of variation for costs associated with PACs; coef of var rel, coefficient of variation for relevant costs (relevant costs = typical costs + PAC costs); coef of var typ, coefficient of variation for typical costs; COPD, chronic obstructive pulmonary disease; PAC, potentially avoidable complication; PCI, percutaneous coronary intervention.
VOL. 17, NO. 10 n THE AMERICAN JOURNAL OF MANAGED CARE n e391
analysis reveals Variations in Costs
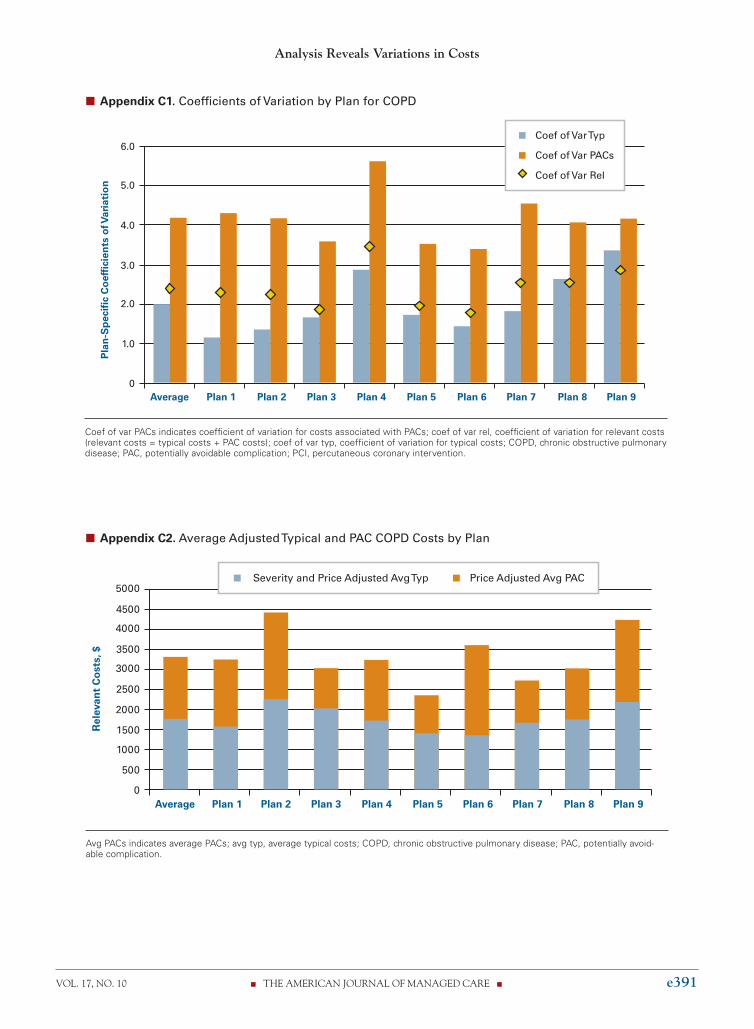
n Appendix C1. Coefficients of Variation by Plan for COPD
n Appendix C2. Average Adjusted Typical and PAC COPD Costs by Plan
Coef of var PACs indicates coefficient of variation for costs associated with PACs; coef of var rel, coefficient of variation for relevant costs (relevant costs = typical costs + PAC costs); coef of var typ, coefficient of variation for typical costs; COPD, chronic obstructive pulmonary disease; PAC, potentially avoidable complication; PCI, percutaneous coronary intervention.
Avg PACs indicates average PACs; avg typ, average typical costs; COPD, chronic obstructive pulmonary disease; PAC, potentially avoid-able complication.
6.0
5.0
4.0
3.0
2.0
1.0
0Average Plan 1 Plan 2 Plan 3 Plan 4 Plan 5 Plan 6 Plan 7 Plan 8 Plan 9
Pla
n-S
pec
ific
Co
effi
cien
ts o
f Var
iati
on
Coef of Var Typ
Coef of Var PACs
Coef of Var Rel
3000
2000
1000
1500
2500
4000
3500
5000
4500
500
0Average Plan 1 Plan 2 Plan 3 Plan 4 Plan 5 Plan 6 Plan 7 Plan 8 Plan 9
Rel
evan
t C
ost
s, $
Severity and Price Adjusted Avg Typ Price Adjusted Avg PAC

e392 n www.ajmc.com n OCTObER 2011
n managerial n
n Appendix D1. Coefficients of Variation by Plan for Colonoscopy
n Appendix D2. Average Adjusted Typical and PAC Colonoscopy Costs by Plan
Coef of var PACs indicates coefficient of variation for costs associated with PACs; Coef of var rel, coefficient of variation for relevant costs (relevant costs = typical costs + PAC costs); coef of var typ, coefficient of variation for typical costs; PAC, potentially avoidable complication.
Avg PACs indicates average PACs; avg typ, average typical costs; PAC, potentially avoidable complication.
4.0
3.5
2.5
1.5
0.5
3.0
2.0
1.0
0Average Plan 1 Plan 2 Plan 3 Plan 4 Plan 5 Plan 6 Plan 7 Plan 8 Plan 9
Pla
n-S
pec
ific
Co
effi
cien
ts o
f Var
iati
on
Coef of Var Typ
Coef of Var PACs
Coef of Var Rel
3000
2000
1000
1500
2500
500
0Average Plan 1 Plan 2 Plan 3 Plan 4 Plan 5 Plan 6 Plan 7 Plan 8 Plan 9
Rel
evan
t C
ost
s, $
Severity and Price Adjusted Avg Typ Price adjusted Avg PACs


![EPISODE — GRETCHEN RUBIN - lauracoe.com · AOA Transcript EPISODE — GRETCHEN RUBIN [INTRODUCTION] [0:00:18.0] LC: Welcome to this week’s episode of the Art of Authenticity,](https://img.pdfslide.net/doc/110x75/5b5e2e9d7f8b9a310a8bee04/episode-gretchen-rubin-aoa-transcript-episode-gretchen-rubin-introduction.jpg)