Embed Size (px)
Citation preview

Matt Bradford 1
Epoch of Reionization Tomography with the CSO
Wide-field C+ spectral mapping and correlation with HI
Matt Bradford
CSO NSF visit: October 12, 2011
CSO NSF visit October 13, 2011

Matt Bradford 2
Epoch of Reionization
First UV sources turn on and reionize the HI. Quasars + WMAP => redshift ~20 to 6 (0.3-1 Gyr after the Big
Bang) Details not clear. Ionizing sources? Pop III stars and/or AGN, Pop II
stars. In terms of galaxy counts, reionization dominated by sources at the low-luminosity end of the distribution, at or below threshold in current or JWST surveys.
CSO NSF visit October 13, 2011
Matt Bradford 3
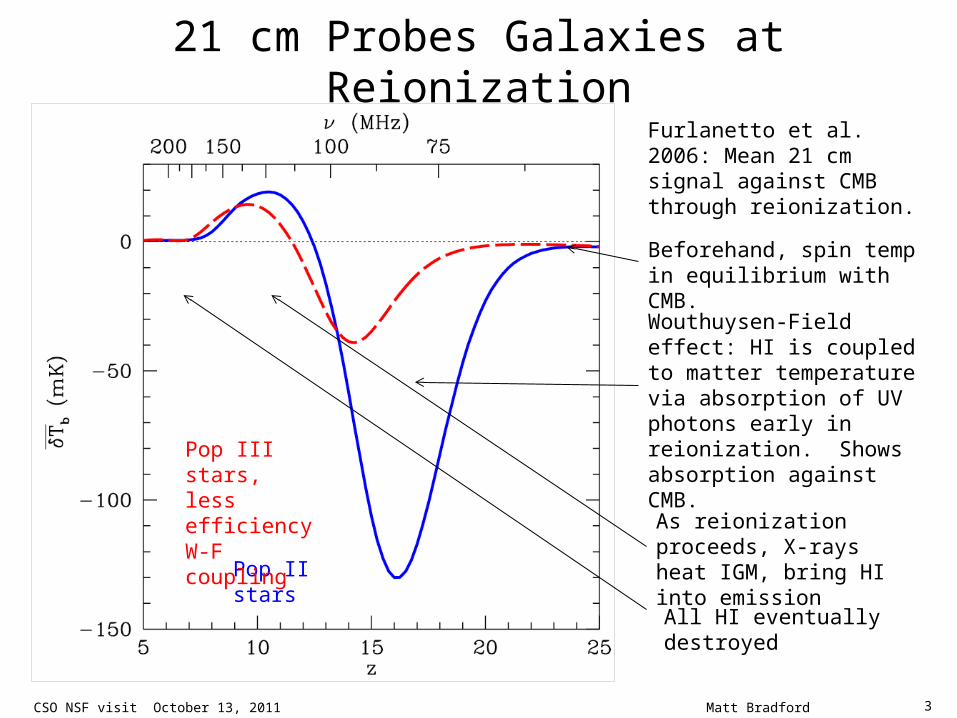
21 cm Probes Galaxies at Reionization
CSO NSF visit October 13, 2011
Shapiro et al., 2008
Wouthuysen-Field effect: HI is coupled to matter temperature via absorption of UV photons early in reionization. Shows absorption against CMB.
Furlanetto et al. 2006: Mean 21 cm signal against CMB through reionization.
As reionization proceeds, X-rays heat IGM, bring HI into emissionPop II stars
Pop III stars, less efficiency W-F coupling
Beforehand, spin temp in equilibrium with CMB.
All HI eventually destroyed

Matt Bradford 4
But mean absolute spectrum is hard to measure -> look at fluctuations
Reionization maps in HI, 94 comoving Mpc across at z=7.7. McQuinn et al. 2007. Ionized (white) and neutral (black) gas via 21 cm. Patch sizes related to ionizing source sizes (large or small galaxies).
CSO NSF visit October 13, 2011
PAPER: http://astro.berkeley.edu/~dbacker/eor/ MWA: http://www.mwatelescope.org/

Matt Bradford 5
Tomography in C+Y. Gong, A. Cooray, et al.
CSO NSF visit October 13, 2011
First-principles calculation of mean intensity of C+ as a function of redshift under various assumptions, including painting on to numerical sims (DeLucia and Blaizot (2007).
Matches with simple scalings form star formation history estimates.arxiv.org/1107.3553v1

Matt Bradford 6
Tomography in C+
CSO NSF visit October 13, 2011
Background-limited sensitivity relative to the mean intensity.
This gets much harder at earlier times.
Power spectrum measurement requires only fractional SNR in each spatial-spectral bin (voxel)
Lower-redshift measurement in 650, 850 micron windows a first step.

Matt Bradford 7
Tomography in C+: Power SpectraY. Gong, A. Cooray, et al.
CSO NSF visit October 13, 2011
The aggregate glow of undetected small galaxies. Shot-noise dominates, but clustering enters at low k.
Error bars based on Z-Spec like instrument scaled up to 64 spatial pixels, and R=700 with 312 spectral pixels -> 20,000 total detectors.
Need integral field on-chip spectrometers.
Assume mapping 16 square degrees with 4000 hours total.
Basic sensitivity independent of aperture; for z=7, SNR per spectral / spatial voxel is ~5e-3 in 1 h
arxiv.org/1107.3553v1

Matt Bradford 8
Cross correlation C+ with HIY. Gong, A. Cooray, et al.
CSO NSF visit October 13, 2011
Basic C+ sensitivity independent of aperture, but would like to probe angular scales which show inversion of correlation with HI.
Large scales: HI anticorrelated with galaxies which produce reionizing photons.Anti-correlation disappears on scales of the ionizing bubble size.
arxiv.org/1107.3553v1
10m aperture for C+ is well-suited to comparison with 21-cm experiments.a potential long-term future CSO experiment: automated, low overhead, if
the instrumentation can be developed.