Embed Size (px)
Citation preview
1
Eponymous Entrepreneurs
Sharon Belenzon1
Fuqua School of Business
Duke University
100 Fuqua Drive, Box 90120
Durham, NC 27708
Aaron K. Chatterji
Fuqua School of Business
Duke University
100 Fuqua Drive, Box 90120
Durham, NC 27708
Abstract When launching new ventures, entrepreneurs make important strategic choices to overcome information asymmetries and the “liability of newness.” We explore a specific strategic choice that every entrepreneur must make: choosing the name of their venture. We link this decision to the pursuit of a competitive position in an industry. We argue that eponymy (naming the firm after the owner) is one mechanism by which entrepreneurs can communicate unique skills and commitment, in support of a differentiated competitive position. Using a dataset of over 180,000 European firms, we find that eponymous ventures are more profitable, but that they grow more slowly, consistent with occupying a differentiated competitive position. Our results are particularly pronounced for young firms, for firms that operate in industries where performance is more heterogeneous, and for owners with rare names. Keywords: Entrepreneurship, New Venture Strategy, Competitive Positioning
1. Introduction
Understanding how firms establish and maintain competitive positions is a fundamental question in the study of
business strategy (Caves & Porter 1977; Porter 1980, 1985, 1991; White 1986). In the emerging literature on
entrepreneurial strategy, however, we have fewer insights into how new firms overcome information asymmetries
(Akerlof 1970) and the “liability of newness” (Stinchcombe 1965; Pfeffer & Salancik 1978; Freeman et al. 1983; Singh et
al. 1986) in the pursuit of sustainable competitive positions, particularly in segments where differentiation is crucial. In
this paper, we argue that eponymy, or naming the firm after the founder, is one mechanism by which entrepreneurs can
communicate unique skills and commitment to stakeholders in pursuit of a differentiated competitive position. Examples
of now well-known companies bearing the names of their founders include Dow Chemical, Gucci, Guinness, Hewlett
Packard, Hess, Johnson & Johnson, Kroger, Porsche, Proctor & Gamble, Ryanair, Walgreens, and many others. 1 Corresponding author

2
Why would a new business owner name a firm after himself? Interestingly, one point of consensus across
practitioner guides is that naming the firm after the founder is not advisable, since it indicates a lack of creativity and
reduces resale value.2
Using novel data on over 180,000 private companies from Europe, we find evidence consistent with the idea that
eponymy can be used to support a differentiated competitive position. Eponymous entrepreneurs have ventures that are
more profitable but grow more slowly in terms of sales. These results are strongest early in the life cycle of the firm, when
reputations are less developed. We also perform several other analyses to address concerns about unobserved
heterogeneity and find that the results are uniquely consistent with our theoretical arguments. In accordance with our
explanations for eponymy, the empirical relationships we document are more apparent in industries where tasks are more
complex and there is more variation in firm performance. These are the conditions under which unique skills are most
important and the scope for differentiation is greatest. Moreover, as our theory would predict, our results are strongest for
business owners with rare last names. These owners have fewer barriers than owners with common names in terms of
communicating idiosyncratic skills and commitment. We also check the sensitivity of our main results with numerous
robustness checks, including accounting for differences in ownership structure and the ethnic background of business
owners.
In contrast, we argue that eponymy can be an effective strategy under specific conditions. When an
entrepreneur seeks to enter the high end of a particular market, his ability to charge a premium price hinges on (1) his
unique skills and (2) his commitment not to behave opportunistically. Simply put, the entrepreneur needs to convince
stakeholders that he can and will provide a differentiated good or service. Especially for firms that are less likely to have
existing reputations, this is a difficult task to accomplish. We contend that eponymous entrepreneurs are able to use their
names to communicate skills and commitment to key stakeholders, allowing the firm to occupy a differentiated
(“boutique”) position in their industry. A differentiated competitive position is typically characterized by higher
profitability but lower sales volume, particularly for new, small firms. While the firm can charge a higher price for a
premium good or service, it is more difficult to scale since the skills of the entrepreneur are so closely identified with the
firm. We thus predict that eponymous ventures will be more profitable but have lower sales growth. We do not attempt to
demonstrate that any particular naming strategy has a causal impact on firm performance. Rather, we document a
systematic relationship, motivated by theory, between names and competitive positions.
This work makes several key contributions to the literature on entrepreneurship and new venture strategy. First,
we build on seminal work by Michael Porter (1980, 1985, 1991) on competitive positioning and suggest one mechanism
by which firms establish and maintain positions in their industry. These ideas are also consistent with theoretical work on
endogenous market segmentation in economics (Bagwell & Riordan 1991; Kim, forthcoming), where firms endogenously
sort into different competitive positions, without relying on signaling or screening mechanisms. We also shed new light on
how entrepreneurial ventures enter at the differentiated or high end of the market, in contrast to prior work that
documented entry at the low end (Greenstein 2005).
2 See, for example, http://www.businessnamingbasics.com/namedevelopment/naming-business-oneself-easy/ (Last accessed April 13th, 2012).
3
Despite a growing literature on entrepreneurship and findings that prior experience (e.g., Chatterji 2009) and
prominent affiliations (Stuart et al. 1999) are positively associated with superior performance, Hsu and Ziedonis (2012)
point out that there is much less evidence on strategic actions new firms can take in the absence of these endowments,
which, after all, are costly to acquire. One particularly novel contribution of our work is that we explore a fundamental
choice that every entrepreneur faces and focus on a resource, the name, that every entrepreneur has available. Finally, we
add to a small but influential literature on names (Bertrand & Mullainathan 2004; Fryer Jr. & Levitt 2004; Simcoe &
Waguespack 2011), and firm names in particular (Ingram 1996; Tadelis 1999, 2002; Glynn & Abzug 2002), by providing
strong empirical evidence that firm names offer valuable information to customers and other stakeholders.
In the next section, we build our theoretical argument, drawing insights from economics, sociology, and strategic
management. We then discuss the data and empirical methods. Next, we address several competing explanations for our
results through a series of robustness checks. Finally, we conclude the paper with implications for future research.
2. Theoretical Background
2.1. Incomplete Markets and the Liability of Newness
What factors make entrepreneurship so challenging? Economists, sociologists, and strategic management scholars
who study entrepreneurship have offered complementary explanations. Starting with George Akerlof’s (1970) classic
paper, economists have argued that market failures can occur when buyers and sellers do not have full information. In the
case of entrepreneurship, this problem is especially pernicious. For example, an entrepreneur who founds a new business
will likely have a difficult time attracting investment if there is no mechanism by which to transmit information about his
skills and his commitment not to behave opportunistically (Amit et al. 1990; Shane & Cable 2002).
To overcome these kind of market failures and facilitate exchange, market participants can develop reputations
(Spence 1974), which represent the likelihood they will act in a particular manner (Shapiro 1983; Tadelis 1999).
However, entrepreneurs and their new businesses typically lack strong organizational reputations (Fombrun & Shanley
1990), making it more difficult to secure suppliers, attract investments, and acquire customers.
Thus, in the presence of incomplete markets and underdeveloped organizational reputations, it is not surprising
that entrepreneurs face significant challenges in starting and growing their businesses, becoming profitable, and surviving.
Sociologists and strategic management scholars have advanced the complementary notion that there is a “liability of
newness” for new ventures (Stinchcombe 1965; Pfeffer & Salancik 1978; Freeman et al. 1983; Singh et al. 1986), driven
in part by a lack of social acceptance or legitimacy (DiMaggio & Powell 1983). This lack of legitimacy makes it difficult
for entrepreneurs to build ties with important exchange partners, who could provide financial and managerial resources,
and thus new organizations will have higher failure rates (Stinchcombe 1965; Pfeffer & Salancik 1978). While there are
important differences between these various scholarly perspectives, for our purposes they share a common prediction that
new ventures will face significant barriers to acquiring customers, finding suppliers, and raising capital.
What can entrepreneurs do in the face of these challenges? Scholars have argued that communicating information
across the market can be especially important. In economic theory, signaling is one mechanism to overcome information
asymmetry and incomplete markets (Spence 1973, 1974; Milgrom & Roberts 1986; Bagwell & Riordan 1991). In a
4
similar spirit, sociologists and strategic management scholars have explored strategic choices and activities aimed at
acquiring social legitimacy. Significant prior work has argued that entrepreneurs and their new ventures can take actions
to gain social acceptance (DiMaggio & Powell 1983); in turn, increased legitimacy can help them acquire other valuable
resources such as financial capital (Aldrich & Fiol 1994; Zimmerman & Zeitz 2002).
With regard to new ventures, there are several examples of these activities in practice, including the appointment
of a board of directors with strong reputations (Certo 2003; Deutsch & Ross 2003), interorganizational alliances with
high-status individuals or organizations (Stuart et al. 1999), and the level of involvement of angel investors, venture
capitalists, and the founder himself in the new business (Elitzur & Gavious 2003; Busenitz et al. 2005). Stuart et al. (1999)
point out that observable characteristics like these are thought to be correlated with underlying quality, which is difficult
to observe.
2.2. Naming the Firm
In contrast to most of the prior literature discussed above, we chose to explore a different kind of strategic choice
that occurs very early in the life of a firm—choosing a business name. Choosing the name of a new business is an
important decision. As memorably stated in a Wall Street Journal article, “(f)or entrepreneurs, the importance of picking
the right name for a company may rank second only to naming a child. (And it’s a lot more expensive to change.)”3
There is small but notable literature on firm names across several different disciplines. Some of this work argues
that naming the firm is an important strategic choice that can help the nascent organization gain social acceptance
(Ashforth & Gibbs 1990; Glynn & Abzug 2002). Other work explores how variation in naming strategies is related to firm
performance. For example, Ingram (1996) finds that some hotel chains name all of their properties after the corporate
parent (i.e., Marriott) while others customize property names according to the local environment (i.e., the Big Apple
Hotel). The author argues that naming all properties after the corporate parent is a mechanism to establish a credible
commitment to quality service, one example of the use of a name to send a signal to customers. He finds that the firms
that use this naming strategy survive longer than their competitors. Similarly, McDevitt (2012) argues that plumbers name
their firms to signal quality, with low-quality plumbers using names that appear early in the alphabet to attract customers
who are not willing to invest much time in searching for the right contractor.
Not
only is there a proliferation of practitioner guides for choosing a business names, an entire industry of naming consultants
exists solely to help businesses choose names.
A significant portion of the literature concerns itself with name changes and the market for names. Tadelis (1999)
describes the theoretical conditions that must be present for a market for names to exist. McDevitt (2011) finds that low-
performing plumbing firms are more likely to change their names, while Phillips and Kim (2009) find that firms
distributing jazz recordings in the 1920s used pseudonyms to preserve their social identities. Furthermore, a set of papers
in the marketing and finance literature explore whether value is created from firm name changes (for a summary, see
3 Bounds, Wendy. “How to Choose a Company Name: A 12-Point Test,” The Wall Street Journal, June 5th, 2008 (http://blogs.wsj.com/independentstreet/2008/06/05/how-to-choose-a-company-name-a-12-point-test).
5
Cooper et al. 2001), and there is some evidence that names can influence stock prices (Horsky 1987; Cooper et al. 2001;
Lee 2001) and mutual fund inflows (Cooper et al. 2005).
2.3. The Eponymous Entrepreneur and Competitive Positioning
Building on this emerging literature on firm names, we explore a new naming strategy, eponymous ventures
(firms named after the owner). To our knowledge, this strategy has not been addressed in previous academic studies,
though numerous well-known businesses carry their owner’s name.4
Understanding how firms establish and maintain competitive positions is a fundamental research area in strategic
management. Porter (1980, 1985, 1991) proposes that firms can occupy various competitive positions to mitigate
industry-level factors constraining profitability. He identifies three generic business strategies—overall cost leadership,
differentiation, and focus—to establish and maintain these competitive positions (Porter 1980). As White (1986) explains
when comparing the two “pure” strategies of cost leadership and differentiation, differentiated firms aim to offer
consumers a unique product, typically produced at higher cost, in exchange for a higher price. In contrast, the strategy for
cost leaders is to drive greater sales volume through lower prices.
What explains this particular naming strategy?
Bringing together insights from the literature discussed above, we argue that under certain conditions, entrepreneurs can
use eponymy to support a differentiated competitive position. Given that entrepreneurs are less likely to have existing
reputations than incumbent firms, eponymy is one way to communicate their unique skills and demonstrate a commitment
not to act opportunistically. Below, we briefly summarize the research on competitive positioning and explain the logic
behind our predictions.
To establish and maintain these positions, firms must possess a competitive advantage in producing at low cost or
in commanding a premium price for their product (Porter 1991). In addition, any new entrant must be able to persuade
stakeholders, including potential customers, that it will honor its promises and not behave opportunistically. These two
requirements map to the hidden information and hidden action problem in economics (Arrow 1984). Along these
dimensions, we argue that there are at least two key differences between the low cost and differentiated positions that will
influence the impact of eponymy. First, in comparison to low-end segments, high-end segments are more likely to require
that the producer have unique skills. Second, the outputs in high-end segments are harder to verify, increasing the scope
for opportunistic behavior.
For example, in the premium segments of industries such as architecture, clothing and accessories, consulting, or
hairstyling, the presumed skill of the particular service provider can be critical to acquiring new business. In these
instances, the customer may choose to patronize a business because he believes that the entrepreneur will be delivering the
service himself. Marvin Bower, an early employee of the eponymous McKinsey & Company, remarked that clients were
4 Our dataset of 180,000 firms finds that nearly 8% are named after the owner. For a partial and unverified list of firms named after people see http://en.wikipedia.org/wiki/List_of_companies_named_after_people (Last accessed July 14th, 2012). Note that not all of these firms are eponymous ventures.
6
known to say “We assume Mr. McKinsey will be working on this study personally.”5
Similarly, consider the differences between purchasing a shirt at a boutique versus at a low-cost retailer. It is far
easier to observe the salient attributes of a shirt sold at the low-cost retailer, given its low price. On the other hand, the
boutique is asking the consumer to pay much more for attributes that are much harder to observe, perhaps the quality of
materials or alignment with the latest fashion trends. In this case, the scope for opportunistic behavior is much greater.
An eponymous venture suggests
that the skilled entrepreneur will be deeply involved in the production of the good or provision of the service.
These differences between competitive positions imply that eponymy will be most useful for communicating
unique skills and commitment in the provision of differentiated goods or services. Thus, we expect eponymous
entrepreneurs to be more profitable than other firms due to higher margins gained from differentiation. Furthermore, if our
explanations for this result are correct, eponymy will be most important in industries where the goods and services
provided require a high degree of individual discretion, the completion of complex tasks using intangible knowledge, and
“creative flair” (Porter 1980:41). In industries where differentiation is difficult and tasks are routine, the impact of
eponymy is likely to be minimal.
In addition, various factors that impact the entrepreneur’s ability to communicate his idiosyncratic skills will also
influence our predictions. For example, in industries where there is little variation in firm performance, eponymy should
matter less. In contrast, in industries where labor turnover is generally high, the assurances by the entrepreneur that he will
personally provide the good or service should matter more since employees come and go rapidly. Furthermore, variation
in the commonality of names, as we discuss in our empirical section, will also impact the value of eponymy. Those with
rare names should find fewer barriers to using eponymy to communicate unique skills and demonstrate a commitment not
to behave opportunistically.
Still, even in the most favorable conditions, there are clear trade-offs involved when the owner of the business is
so closely tied to the firm. Marvin Bower of McKinsey & Company explicitly chose not to put his own name on the firm
after the death of Mr. McKinsey. He noted that “I didn’t want anybody dictating to me how I was going to spend my time.
So I had no interest in calling it Bower & Co., or even McKinsey-Bower. I wanted my freedom.”6
The notion that an eponymous entrepreneur might have to spend disproportionate time on particular projects to
meet client expectations reveals a key trade-off. Differentiated positions often imply a trade-off between sales volume and
margins. The greater the extent to which clients expect the entrepreneur to directly perform the service or make the
product themselves, the more difficult it will be to initially scale the business. Moreover, it may be more difficult to attract
talented and ambitious employees who are looking to build their own reputation within the firm. Of course, this is
particularly true in the early years of a business, before the name itself becomes a brand that customers recognize, as
McKinsey & Company would later become. The upshot is that our prediction implies that eponymous ventures will not
simply have higher profitability but will also grow more slowly.
This trade-off between communicating unique skills on one hand while risking slower growth on the other
illustrates why firms choose different strategies. We can readily observe these differences in businesses as diverse as 5 Huey, John. “How McKinsey Does It,” Fortune, November 1st, 1993. 6 Huey, John. “How McKinsey Does It,” Fortune, November 1st, 1993.
7
management consulting, populated by eponymous firms like McKinsey and Bain along with competitors such as the
Boston Consulting Group, to hairdressing, where boutique firms are often named after the founder but other firms like
“Cost Cutters” or “The Hair Cuttery” build their business through high-volume, low-margin service.
Thus, we do not expect all firms to be eponymous. Prior work indicates that there can be multiple rent-producing
positions in the same industry (Porter, 1980). Moreover, recent work in economics has demonstrated that in incomplete
markets, firms can endogenously segment into market positions to respond to customers, without signaling and screening
mechanisms (Kim, forthcoming). It is important to note that our predictions do not require eponymy to be a costly signal
in the spirit of Spence (1973, 1974) or necessitate a direct causal link between eponymy and specific performance
outcomes. Instead, our arguments provide insights into one way new firms can establish competitive positions in their
industry.
There are alternative explanations for an observed relationship between eponymous entrepreneurs and various
performance outcomes. Nearly all of these alternatives can be viewed as concerns about unobserved heterogeneity among
entrepreneurs. For example, an egotistical individual or a family business may be more likely to name firms after
themselves. If egotistical entrepreneurs and family businesses experience superior performance, we risk inferring that the
name is driving performance rather than these other factors. However, this explanation, and others like it, would not imply
systematically slower growth for eponymous ventures as we predict above. Below, we will comprehensively address these
concerns and demonstrate a pattern of results that is consistent with our arguments.
3. Data
We use data from Amadeus, a database maintained by Bureau van Dijk (BvD), which contains ownership,
management, and financial information for European firms. BvD obtains its data from regulatory filings, third-party
vendors, and its own proprietary sources. Amadeus includes both private and public firms in its data collection, allowing
for an in-depth examination of new firms. It also contains detailed ownership information, including the names of each
shareholder, the number and type of shares held, and information on the board of directors and management of each firm.
We build our base sample from firms located in Western European countries. 47% of our sample is from France,
16% from Great Britain, and 34% from Spain. German firms are excluded from our sample because small German firms
are not required to disclose balance sheet information, making it impossible to calculate financial performance outcomes
such as return on assets (ROA).7
We retain only those firms for which we have ownership information, and we exclude firms for which we are
unable to identify at least 90% of reported shareholders and those whose annual sales are not reported. Our final
estimation sample includes 182,582 firms and a total of 1,001,267 firm-year observations for the period 1997–2006.
The main variable of interest in this paper is whether an entrepreneur names the firm after himself. To code this
variable, we need to check for matches in our dataset between the name of the firm’s owners and the name of the firm. For
7 If we examine profit margins (profits over sales) instead of ROA, our results hold even when including German firms. However, because ROA is a more widely used performance measure in the literature, we choose to exclude Germany from the estimation sample.
8
each firm, we consider only the majority owners as indicated by equity shares. To determine whether it is an eponymous
venture, we use a string matching algorithm that matches last name of the majority owner to the firm name. The
automated process compares both names, assigns a matching score, and identifies matches if the matching score meets a
certain threshold. 8
To refine our match, we compared the normalized matching scores across different thresholds. After extensive
manual checks and iteration we chose the optimal threshold of 0.68, as it produced the most accurate matches. This
matching process goes beyond simple direct matching and can identify last names that are used in combination with other
words or that are partially embedded with other words. For instance, the algorithm we employ would classify a match
whether the last name “Johnson” appears in “Johnson Consulting” or “Johnsontown.” We create a dummy for owner
name that receives the value of one for firms where the name of owner is included in the name of the firm (eponymous
ventures), and zero for all other firms. In our discussion of the results, we refer to these firms as eponymous ventures and
the coefficient of interest is labeled “eponymous.” 13% of the firms in our sample share their name with their owner.
Next, we present two examples of eponymous entrepreneurs from our dataset to provide more context for our
empirical tests. The first is Pianegonda SRL (http://www.francopianegonda.net/en/), a jewelry company founded by
eponymous entrepreneur Franco Pianegonda. The company describes its mission as creating “art for a lifestyle of natural
luxury.” The company website features the founder prominently and emphasizes his unique skills and creativity. The
second firm is Sutcliffe Play (www.sutcliffeplay.co.uk), a designer of children’s playground equipment chaired by Robin
Sutcliffe. While this corporate website does not feature the eponymous entrepreneur as prominently, it describes the
business as being driven by “creativity, innovation and conviction.” Most interestingly, by calling the firm “the experts in
play,” this firm is trying to communicate a message about unique skills. While representing only two firms out of more
than 180,000 in our study, these corporate websites do demonstrate how we believe eponymy is related to competitive
positioning. While many firms probably use similar words to characterize their businesses, we expect that eponymous
firms will be more likely to occupy differentiated competitive positions, as measures by profitability and sales. Below, we
explore this prediction more systematically.
3.1. Descriptive Statistics Table 1 presents summary statistics for the main variables in our sample. The average firm has an ROA (profits
over assets) of 0.14 (a median of 0.11) and profit margin (profits over sales) of 0.08 (a median of 0.06), grows at an
annual rate of 28% (a median of 11%), generates $2.4 million in annual sales (a median of $0.8 million), holds $1.6
million in assets (a median of $0.4 million), is 9 years old (a median of 8), and has 18 employees (a median of 7).
Table 2 presents mean comparison tests for differences in main characteristics between eponymous ventures and
other companies. Eponymous ventures appear to have higher returns on assets, grow more slowly, and are more likely to
survive. There are no substantial differences in age or assets between the two types of firms. For example, eponymous
8 The matching score is obtained by first calculating the Levenshtein distance score between two strings or vectors of strings for each pair of affiliate names, which is defined as the minimum number of insertions, deletions, and substitutions necessary to change one string into the other.
9
firms hold on average $1.594 million in assets, as compared to $1.572 million for non-eponymous firms. The number of
employees is effectively the same across these two types of firms.
Firms in our sample are drawn from a wide industry distribution. For ease of presentation, we aggregate the three-
digit SIC codes to broad industry-level categories. Details on the classification of SIC codes to main industry categories
are available upon request. Table 3 presents the distribution of firms by industry. The most represented industries in our
sample are construction contracting (31,461 firms) and food stores and restaurants (17,835 firms). Other common
industries include professional and personal services (16,593 firms), metal (7,297 firms), and general retail (9,072 firms).
25% of the firms operate in the services industries, and the remaining firms operate in manufacturing. The share of
eponymous firms varies substantially across industries, from a high of 21.5% in heavy construction, to a low of 6.6% in
the hotel industry. In the econometric specification we pool together firms from different industries, but due to the high
variation in the firm types by industry, we always control for three-digit SIC codes. Also, we estimate our specifications
separately for different industry grouping to identify those industries where the name-performance relationship is the
strongest.
4. Econometric Specifications
Our main interest is in the relationship between eponymous ventures and ROA, profit margin, sales growth, and
survival. Sales growth and ROA are common performance variables in the finance literature and also in studies of
competitive positioning (see, for example, White 1986). We estimate the following specification for the relationship
between eponymous ventures and ROA (i indexes firms and t index years):
tictiiititit cEponymousAgeSalesROA ετηααα ++++++= − 3211 ln (4.1)
ROA is return on assets, defined as EBITDA over total assets (we also examine profit margins, defined as
EBITDA over sales), Sales is annual sales lagged by one period. Age is years from date of incorporation and is included
to control for firm-life-cycle effects. η , τ , and c are complete sets of three-digit SIC codes, country, and year dummies. ε
is an iid error term. Standard errors are clustered by firms. Our main interest is the coefficients 3α . Consistent with the
view that eponymy communicates differentiated competitive positioning, we expect 03 >α .
We also estimate specification (4.1) for a secondary measure of firm profitability: profit margin, which is defined
as profits over sales.
Next, we estimate the equivalent specification for sales growth:
tictiiititit cEponymousAgeSalesSales ετηβββ ++++++=∆ − 3211 ln)ln( (4.2)
Δln(Sales) is the difference between ln(Sales) in year t and in year t-1. Again, our interest is in the coefficient 3β .
Consistent with the view that eponymy is communicates differentiated competitive positioning, we expect 03 <β .
In addition, we explore the relationship between eponymy and survival. While the prior literature on positioning
yields no clear prediction on which competitive positions (differentiated versus cost leadership) will be associated with
10
greater rates of survival, we consider this outcome here both for completeness and because of its importance in the
literature on entrepreneurship. We estimate the following survival equation:
itctiiititit cEponymousAgeSalesSurvival ετηγγγ ++++++== − 3211 ln)1Pr( (4.3)
As a robustness check, we experiment with different measures of survival. We create three different variables that
capture survival likelihood: one-year, three-year, and five-year survival dummies. These variables receive the value of
unity if we observe the firm in each different year cohorts (for example, one-year survival receives the value of unity for
firms that are observed in the data for two consecutive periods and zero for firms that drop out of the sample from year t
to year t+1). In addition to the extreme event of dropping out of the sample, we also experiment with an alternative
survival measure where we classify a firm as “dying” if its sales drop by more than 30 percent in a single year (the bottom
5% of the sales growth distribution). For simplicity and ease of interpretation we estimate all survival specifications with a
linear probability model. All results are robust to alternative estimation models such as Probit or Logit.
4.1. Empirical Strategy and Interpreting Empirical Results An important issue in our analysis is how to interpret the eponymy-performance relationship. There are at least
two competing views. We argue that eponymy is used to communicate differentiated market position to stakeholders, and
that higher ROA, increased chance of survival, and slower growth are consistent with this competitive position.
Alternatively, a different interpretation of the eponymy-performance relationship relates to omitted variables which are
correlated both with naming the firm and performance. For example, the ownership structure of the firm could be driving
variation in performance. It might be that eponymous ventures are more likely when the firm is owned by a single owner,
or by multiple owners who are part of the same family. If single-shareholder or family-owned firms differ from other firm
types where owners are not family-related, our estimates would be biased if we did not account for these omitted
variables. A recent paper by Belenzon and Zarutskie (2012) suggests that such differences across firm types are likely. We
test this concern by repeating the main estimations separately for each firm type. This allows us to rule out the possibility
that our effects are driven by different ownership structures or family business.
Another alternative explanation in the same spirit has to do with the underlying quality of the venture. Suppose
that the initial quality of the venture is observed by both the owner and outside stakeholders, but it is not observed by the
econometrician. Further suppose that owners transfer their names only to high-quality ventures, so as to associate
themselves only with successful projects. If this phenomenon were common, it would imply that finding a positive
relationship between eponymy and firm performance may simply be explained by heterogeneity in initial venture quality,
which we are not able to properly control for. However, we argue that this interpretation is not consistent with our results
for several reasons. First, we argue for and document a trade-off to eponymy, rather than asserting that eponymy
dominates other naming strategies. While unobserved quality may explain why eponymy ventures generate higher ROA
than non-eponymy ventures, it does not explain why eponymy ventures also grow more slowly. Moreover, the
performance differences between the different firm types are strong only for very young firms, as detailed below. As firms
11
mature, we find the performance differences significantly decline. However, if eponymy simply captures an unobserved
quality “fixed effect,” we would expect performance differences to persist as firms age.
To further address potential alternative explanations, we also explore how the eponymy-performance relationship
varies across two exogenous dimensions: how common the owner name is and industry characteristics. Our competitive
positioning argument implies that if the connection between the owner and the firm is hampered due by a very common
name, the relationship between eponymy and performance should be weaker. Once again, unobserved heterogeneity
arguments would not predict any systematic variation in the eponymy-performance relationship by owner name
commonality. Similarly, our argument relies on the entrepreneur having unique skills and a competitive advantage and
would thus suggest a stronger relationship between eponymy and firm performance in industries where creativity is more
important. The alternative explanations which rely on unobserved heterogeneity would imply no industry variation.
Building on this logic, our empirical strategy will be to first document the relationship between eponymy and
performance outcomes and then perform numerous robustness checks to assess whether the pattern of results is more
consistent with our argument or the alternative explanations.
5. Estimation Results
5.1. Baseline Results Table 4 presents the estimation results for the relationship between eponymy and ROA. The general pattern of
results confirms the non-parametric pattern shown in Table 2. Eponymous ventures generate on average 0.015 in higher
ROA, which account for 11% of the sample mean (column 1). Computed at the sample average, this difference in ROA is
associated with $24,000 additional profits, which account for 15% of average profits.
Columns 2–9 present the breakdown of the eponymy effect by industry. First, columns 2 and 3 split the sample by
service and manufacturing industries. Eponymy is more strongly related to ROA in services (coefficient estimates of
0.019 versus 0.005), which is consistent with the notion that communicating unique skills is more important in industries
where individual discretion and personal reputation matter more.
Next, if eponymy is related for performance because it communicates information about owner skills, we would
expect the relationship between names and ROA to be especially strong in industries where tasks are on average less
routine and more complex. To test this prediction, we collect data on the complexity of tasks at the industry level. We
then follow Costinot et al. (2009) and rank industries according to their level of task routineness. We use data from the
U.S. Department of Labor’s Occupational Information Network (O*NET), and measure the level of task routineness by
the extent to which the task involves “making decisions and solving problems.” The exact formulation of industry routine
is ∑−=τ
ττα )(),(1 PtRoutine , where α(τ,t) is employment share of six-digit occupation τ in task t, and P(t) is the score
for “making decisions and solving problems” in O*NET. Columns 4 and 5 split the sample by what we call “high artisan”
and “low artisan” industries. Industries are classified as high artisan if their index of task routineness falls in the lowest
quartile of the industry routine distribution, and as low artisan if their measure of task routineness is at the highest industry
12
routine quartile. The results are consistent with our theory. We find a much larger eponymy effect in the high artisan
industries (0.023) than in the low artisan industries (0.012).
Third, columns 6–9 provide examples of specific services industries. There is a substantial variation even within
the services industries. Eponymy is not related to ROA in food stores and restaurants—a dominant industry in our
sample—but is strongly related to ROA in construction engineering and professional services. Table 5 presents very
similar patterns using profit margin as the dependent variable.
Table 6 presents the estimation results for sales growth. We find a strong negative effect of eponymy on growth.
As shown in column 1, the coefficient estimate on the eponymous dummy is -0.034 (a standard error of 0.002). This
estimate implies a lower growth rate of 12% relative to the sample average growth rate. The negative relationship is
stronger for services than for manufacturing industries, but there is no difference in the effect between high and low
artisan industries. Similar to ROA, the eponymy effect is effectively muted in food stores and restaurants, but is highly
evident in heavy construction engineering and professional services.
Thus far, our evidence suggests that eponymy is associated with a trade-off of higher short-term profitability and
lower growth rates. This trade-off is more apparent in industries where owner skills and reputation presumably plays a
more important role. We proceed to further investigate the conditions under which this trade-off is more pronounced and
assess whether the results are consistent with our theoretical arguments.
Table 7 presents the estimation results on eponymy and firm survival. The pattern of results shows a positive and
significant relationship between survival and eponymy. In columns 1 to 3 the dependent variable is a dummy variable for
whether the firm survives. We use three survival lags: one-year, three-year, and five-year. In all cases the estimate on the
coefficient on the eponymous dummy is positive and significant. However, the effect is not large. In the three-year
survival specification model, for example, the coefficient estimate on eponymous is only 0.012, relative to a sample
average survival rate of 0.76. This estimate means that eponymous firms are associated with only 2% higher survival
probability than other firms, evaluated at the sample mean.
In columns 4 and 5 we use a less restrictive definition of exit. Instead of examining whether a firm dropped from
the sample, we create a dummy variable that receives the value of unity for firms that experienced a substantial drop in
sales. Our cutoff of extreme drop in sales is a negative growth rate of 30%, which is the 10 percentile value of the annual
firm growth distribution. We use annual and biannual measures for an extreme drop in sales. In both cases we find that
eponymous firms are less likely to experience extreme sales drop; however, the implied effects are quite small.
In columns 6 to 9 we investigate the robustness of the survival results across industries. We do not find any
meaningful variation between manufacturing and service industries (columns 6 and 7), or between high and low artisan
industries (columns 8 and 9).
5.2. Firm Life Cycle Our arguments imply that communicating unique skills and competitive advantage should matter much more
early in the firm’s life. As discussed above, young firms are typically associated with high uncertainty about future
performance and survival, and lack strong reputations. Examining how the eponymy effect varies by firm age is also
13
important for testing whether the observed differences in ROA between eponymous ventures and other firms are driven by
unobserved quality differences. As discussed above, if unobserved heterogeneity is driving our results, we would not
expect our results to weaken as the firm grows older. Table 8 examines how the relationships between eponymy and
ROA, growth, and survival vary by firm age.
We find a striking decline in the effect of eponymy on firm performance. Columns 1 to 5 present the estimation
results for ROA. Breaking up the sample by age quartiles shows a clear pattern of a eponymy name effect. For firms
below 5 years of age (column 1, 25th percentile of the sample age distribution), the coefficient estimate on name dummy
is 0.033 (a standard error of 0.002). This estimate drops to 0.004 (a standard error of 0.001) for firms above 12 years of
age (column 4). Including an interaction term between name and age yields the same pattern (column 5). The coefficient
estimate on the interaction term between eponymy and age is negative and is highly significant. This estimate implies that
the name effect completely disappears when the firm reaches the age of 16 (0.031/0.002).
The same pattern of results holds for growth, as shown in columns 6 to 10. The coefficient estimate on name for
firms below 5 years of age is -0.078, and it is only -0.011 for firms above 12 years of age. Adding an interaction term
between eponymy and age (column 10) shows that the negative effect of eponymy on growth completely disappears as the
firm reaches the age of 12.
Next, we report the age effect for survival. We find the same pattern of a declining name effect. For very young
firms (column 11), the coefficient estimate for eponymy is 0.020. This estimate drops to zero for firms of age 12 or above
(column 14). The same pattern holds when we include an interaction between eponymy and age (column 15). In sum, the
pattern of results is consistent with our argument, which implies that the eponymy-performance relationship is most likely
to hold for young firms.
It is important to emphasize that our firm age analysis is based on comparing the difference in ROA and growth
between eponymous ventures and other firms at different firm ages. An alternative explanation for our results is that the
convergence in performance between eponymous firms and other firms is driven by different exit patterns. If low-quality
non-eponymous firms are more likely to exit the sample than low-quality eponymous firms, the same age effects would
persist. However, while eponymous firms are more likely to survive than other firms, the differences in survival rates are
very small (Table 7), and thus survival differences between the two types of firms are not likely to driving the observed
age effects.
5.3. Using Exogenous Variation to Interpret our Results To further test the competitive positioning view of eponymy, we explore how the relationship between eponymy
with ROA and growth varies by industry conditions. We identify industry characteristics where, consistent with the theory
of competitive positioning, we expect the eponymy-performance relationship to be especially strong. In addition, we
exploit variation in the name commonality of owners. Consistent with the competitive positioning interpretation of our
results, we expect the eponymy-performance relationship to be stronger where owner name is less common. In these
cases, communicating idiosyncratic skills and competitive advantage through eponymy would be easier and more likely to
be effective. If exogenous industry characteristics and the commonality of name impact our results in the way we predict,
14
our interpretation of the eponymy-performance relationship will be strengthened relative to the alternative explanations
discussed above.
5.3.1. Industry characteristics First, we investigate how the relationship between eponymy with ROA and growth varies by industry conditions
where we expect unique skills to be more important for capturing the differentiated or high-end “boutique” market
position. These industry characteristics include industry growth dispersion, Tobin’s Q, and labor turnover. Table 9
presents the estimation results.
The first industry measure that we examine is labor productivity dispersion. We expect owner skills to matter
more in industries where there is a larger variation in ex-post firm performance. In such industries, firm idiosyncratic
capabilities are likely to matter more (Acemoglu et al. 2007). Thus, if eponymy is used to communicate high-end skills,
we expect its relationship with ROA and growth to be stronger in industries where the variation in firm ex-post
performance is greater. In other words, in industries where firms are more homogenous (that is, there is only limited
variation in firm performance), the scope for differentiation is more limited—thus using the owner’s name to capture a
“boutique” market position should be less effective. We measure industry growth dispersion as the difference in labor
productivity growth between the highest and lowest growing firms. We construct two versions of this measure: difference
between the 99th and 1st percentile of labor productivity growth, and difference between the 95th and 5th percentile. We use
the complete Amadeus database over the years 1996–2006 to compute these measures.
Columns 1 and 2, and 5 and 6, present the estimation results for industry growth dispersion. The results support
our competitive positioning argument. Columns 1 and 2 report results from estimations where ROA is the dependent
variable. As expected, the interaction between industry dispersion and eponymous is positive and highly significant.
Based on the estimate from column 1, moving from the 25th to the 75th percentile of dispersion raises the coefficient
estimate on eponymous from 0.013 to 0.019. The same magnitude holds for using the estimates from column 2. A similar
pattern of results holds for sales growth, where the coefficient estimates of the interaction terms between industry
dispersion and eponymous are negative and highly significant.
The next industry characteristic we examine is the average ratio between firm value and the book value of
assets—Tobin’s Q. If eponymy is used to communicate intangible skills, such as talent or artisanal ability, we would
expect the relationship between eponymy and performance to be especially strong in industries where intangible assets
represent a larger part of firm value—i.e., industries where Tobin’s Q is higher.
Firm value is calculated as the sum of the values of common stock, preferred stock, and total debt net of current
assets. The book value of capital includes net plant, property and equipment, inventories, investments in unconsolidated
subsidiaries, and intangibles other than R&D. Tobin’s Q is calculated using American Compustat firms over the period
1980–1996 (which is prior our estimation sample, 1997–2006).
Columns 3 and 7 present the estimation results for Tobin’s Q. The results strongly support the competitive
positioning view. The interaction between eponymy and Tobin’s Q is positive and significant in the ROA specification,
and is negative and significant in the sales growth specification. The effects are large. For instance, moving from the 25th
15
to the 75th percentile of Tobin’s Q raises the coefficient estimate on eponymous in the ROA specification from 0.012 to
0.018.
Our last industry measure is labor turnover. If eponymy is effective in communicating competitive advantage and
suggesting that the provision of service or product will be conducted by the skilled individual, we expect this effect to be
largest in industries where labor turnover is high. In these industries, the individual that performs any given task is less
likely to stay with the firm compared to other industries. In such cases, acquiring unique skills and establishing a
differentiated competitive position is likely to be more difficult, which should make eponymy matter more.
To test this argument, we construct the labor turnover measure for each industry using annual establishment-level
employment data from the U.S. Bureau of Labor Statistics’ Current Employment Statistics Survey (1977–2003).
Following Autor et al. (2007), we calculate firm-level labor turnover rate as the average of the absolute change in annual
employment at the firm divided by the average firm employment across two years. The industry labor turnover measure is
the average of the firm turnover rate in each two-digit SIC industry. Industries with highest labor turnover include Apparel
(SIC 23) with 0.087 and Transportation Services (SIC 42) with 0.079; industries ranked with lowest turnover rates include
Paper Products (SIC 26) with 0.019 and Printing and Publishing (SIC 27) with 0.020.
Columns 4 and 8 present the estimation results, which are consistent with our expectation that the relationship
between eponymy and performance is stronger in industries with high labor turnover. The coefficient estimate on the
interaction term between labor turnover and eponymy is positive and significant in the ROA specification, and is negative
and significant in the growth specification. The effects are very large. For instance, in the ROA specification, moving
from the 25th percentile to the 75th percentile of industry labor turnover raises the coefficient estimate on eponymous from
0.012 to 0.026.
5.3.2. Name commonality Thus far we have established a set of robust associations between eponymy and firm performance. In this section,
we take an additional step to test our proposed mechanism. Our strategy is to examine how the eponymy-performance
relationship varies in relation to how common the name of the owner is. Presumably, the prevalence of a given name is
exogenous to the performance of firms. As the name becomes more common, it should become more difficult for an
owner to communicate his skills to capture a differentiated market position. To explore this idea, for each owner we
compute the ratio between the number of firm owners that have the same last name in the same city where the firm is
registered and the total number of owners in the city. A higher ratio implies that the name is more common.
Table 10 presents the estimation results. The results are consistent with our interpretation of eponymy: the
relationship between eponymy and performance (ROA, growth, and survival) declines as the owner name becomes more
common. Columns 1 to 5 present the results for ROA. Column 1 includes only firms with owners who have a very rare
name (lowest 5% of the name frequency distribution). The coefficient estimate on eponymous is large and significant for
this firm sample (0.037). In column 2, we include firms with highly common owner names (highest 5% of the name
frequency distribution). There is no effect of eponymy for this set of firms (a coefficient estimate of 0.003). This result is
16
consistent with the idea that as the association between the identity of owner and firm weakens, the benefits of eponymy
are effectively eliminated. In columns 3 to 5 we further divide the sample by the commonality of owner names. As the
owner name becomes more common, the eponymous-ROA performance weakens.
In columns 6 to 10 we repeat the same analysis for growth. We find the same pattern of results. As owner name
becomes more common, the negative relationship between eponymy and growth weakens. Finally, in columns 11 to 15
we repeat the analysis for the firm three-year survival rate and the results support the same general conclusion.
Other mechanisms may explain why the eponymy-performance relationship weakens as the name of the owner
becomes more common. For instance, name commonality may capture the size of the city where the firm operates. An
individual name is likely to be more common in small cities where there are fewer firm owners. If firms in smaller cities
outperform firms in larger cities in terms of ROA, and grow more slowly and are more likely to survive, we may be
confounding name commonality with city size effects. We perform three tests to examine this concern. First, we include a
complete set of city dummies and repeat the estimations presented in Table 9. The same pattern of results continues to
hold, as it does when controlling for city fixed-effects. Second, to check the sensitivity of our results to the unit of
aggregation, we also calculate owner name frequency at the region (one-digit NUTS code) and country levels. The same
pattern of results continues to hold. Third, we repeat the above estimations separately for regions with high and low GDP,
population, and size. By splitting the sample by region size, we ensure that our estimates are not simply picking up
differences between large and small regions in the pooled regressions. The same pattern of results continues to hold across
all of these robustness checks.
An additional concern relates to owners from minority ethnic groups. Minority owners are likely to have
relatively rare names in their region, almost by definition. Thus, our results exploiting variation in how common names
are might be confounded by minority business patterns. To test this concern we collect new data on the ethnicity of
owners by matching owners’ last names to a specialized database owned by OriginsInfo (a subsidiary of Experian).
OriginsInfo relies on a database that can identify the likely cultural origin of over 1,800,000 family names and 700,000
personal names. Using this data, we attach a unique ethnic background to each owner in our sample based on his last
name. We then classify owners as an ethnic minority using several different methods. First, we classify owners as ethnic
minorities if their ethnicity is different from the country where the firm is incorporated (for example, an owner of Italian
ethnicity in France). Second, we classify owners as ethnic minorities if their ethnicity is not Western European. Third, we
classify Indian, other South Asians, and Chinese as ethnic minorities. For each of these cases we exclude minority owners
from the sample. Our results are not sensitive to these exclusions, as in all cases the same pattern of results continues to
hold.
5.4. Additional Robustness Checks 5.4.1. Non-parametric estimation
We performed other robustness checks to comprehensively address alternative explanations. Table 11 presents the
estimation results for a two-stage propensity score matching estimation. The estimation is cross-sectional and includes the
most recent year information is available for each firm. In the first stage, the dependent variable is a dummy for
17
eponymous venture. The first stage specification includes sales, age, and a complete set of dummies for three-digit SIC
industry code, and country. The non-parametric estimates are higher (in absolute value) than the parametric estimates. For
example, the non-parametric estimate of the effect of names on ROA is 0.023, as compared to the parametric estimate of
0.015 (Table 4, column 1). For growth, the non-parametric name effect is -0.046, as compared to a parametric estimate of
-0.034.
We also examine how the non-parametric estimates vary by name commonality. We find the same pattern of
results as in the parametric specifications. For ROA, the name effect for uncommon names (1st quartile of name
commonality distribution) is 0.041, which is substantially higher than the name effect for common names (4th quartile of
name commonality distribution) which is estimated at 0.014. For growth, we also find a stronger name effect when
comparing uncommon to common names (-0.053 versus -0.039).
5.4.2. Family businesses
Some of the relationships documented in this paper could be related to variation in the ownership structure of
firms (Belenzon & Zarutskie 2012). First, firms with single owners might be more likely to be eponymous than firms with
multiple owners, and ownership structure might impact performance. Next, eponymy is likely to be more common in
firms that are owned by related owners, relative to firms that are owned by unrelated owners. If family-owned firms differ
from non-family firms across the dimensions documented here, we may incorrectly attribute an ownership effect to
eponymy. To test the ownership structure concern, Table 12 presents the results of estimating the eponymy-performance
relationship separately for different ownership structures. Columns 1–6 estimate the effect of eponymy on ROA. Columns
1 and 2 separately estimate the effect of eponymy for single- and multiple-owner firms. The coefficient estimate on
eponymous is effectively the same for the two subsamples (0.016 and 0.015). In columns 3 and 4 we include only multi-
owner firms and distinguish between owners that are family-related and owners that are not. The results are very similar
for the two subsamples. Columns 5–8 present a similar pattern for growth.
5.4.3. Other naming strategies
While we focus on one binary naming strategy (eponymous or not), there could be other naming strategies which
can be used to establish and maintain competitive positions. A full treatment of all possible naming strategies is beyond
the scope of this paper, but we conducted additional analyses on other kinds of firm names that could potentially be used
to establish competitive positions. We concentrate on names that might be related to quality or low cost. The most
common quality-related terms in firm names include: “luxury”, “best”, “quality”, “top”, “premier”, and “superior”. For
low cost, the most common terms in firm names include: “cheap”, “budget”, “economy”, “value”, “discount”, and “price”.
We translated these terms into the native languages of each country in our data and cross checked the list against every
firm name in our data. 6,175 firms include a quality–related term in their name and 1,046 firms include a low cost-related
term in their name.
Table 13 presents the estimation results for including dummies for firms that include quality- or low cost-related
terms in their names. The results strongly show that these firms, even those that include quality-related terms in their
18
name, appear to be positioned in the lower-end of the market. Columns 1 to 8 show that such firms have lower ROA and
profit margin compared to eponymous firms, and Columns 6-8 show that these firms grow faster than eponymous firms.
Columns 11-13 show modest differences in the likelihood of survival across different firm types.
These results suggest that eponymy may have unique attributes related to the establishment and maintenance of
differentiated competitive positions. As expected, firm names that communicate “low cost” are indeed associated with
low-profit, high-growth firms, consistent with a cost leadership position. However, we find the same result for firms that
communicate “quality” in their name as well. Future research could explore additional naming strategies and their
relationship to various competitive positions more systematically.
5.4.4. Name changes and founding owner
Another complexity in our empirical method involves the potential of firm name changes. The ownership and
firm name data we use are cross-sectional for 2007, but the estimation covers the years 1997–2006. This distinction could
be problematic if a firm changed its name prior to 2006, because we would assign the 2006 name to the complete sample
period. We check the sensitivity of our results to this potential measurement error in owner names by using historical
cross-sectional snap-shots of firm names for the period 1999–2006. These historical data are found in past publications of
Amadeus, which we acquired separately. The results are not sensitive to name changes. The coefficient estimate of the
eponymous indicator for a sample that includes only firms that did not change their name between 1999 and 2007 is 0.016
(a standard error of 0.001). Furthermore, because firms may have changed their names prior to 1999, we restrict the
estimation sample only to firms that were incorporated in or after 1999 and did not change their name from their year of
incorporation. The results continue to hold. In this sample, the coefficient estimate of the eponymous indicator is 0.038 (a
standard error of 0.003). This higher estimate is for a sample of 202,907 very young firms. We do not include a table with
these results but it is available upon request.
5.4.5. Length of firm name
An additional robustness check relates to the length of firm name and how this might be interacting with eponymy
and performance. Perhaps eponymous firm names are systematically longer or shorter and the length of names is related
to performance. To test the robustness of our results to firm name length, we counted the number of words that are
included in the name of each firm. This number ranges from 1 to 7, with a median of 3 and an average of 3.1 words. The
results do not appear to vary by firm name length. For firms whose names include 3 or fewer words, the coefficient
estimate on eponymous is 0.014 (a standard error of 0.001). For firms whose names include more than 3 words, the
coefficient estimate is 0.020 (a standard error of 0.003). We do not include a table with these results but it is available
upon request.
6. Conclusion
A burgeoning academic literature is developing insights for new venture strategy. Prior work has found that new
venture survival and performance are hamstrung by incomplete information and the liability of newness. We propose the

19
name of the firm as one mechanism for entrepreneurs to communicate unique skills and demonstrate a commitment not to
act opportunistically, supporting a differentiated competitive position. This strategy will be most useful in industries
where discretion and creativity are important and where there is significant variation in firm performance. However,
eponymous entrepreneurs will not scale their ventures as quickly because artisanal and complex production tasks are more
difficult to delegate than more routine tasks. As a result, eponymous entrepreneurs will be more profitable, but grow more
slowly than other ventures. We find empirical support for our arguments and several robustness checks, including
consideration of exogenous variation in the commonality of names and industry characteristics, confirm our findings.
This paper suggests several avenues for future research and also has important limitations. First, future work
should consider the influence of pre-founding experience on naming strategies. For example, serial entrepreneurs who
have already used their name once might be forced to create a new name for the next business. Similar to other papers on
competitive positioning, we do not explore the origins of the unique skills possessed by entrepreneurs. Exploring pre-
founding experience might provide useful insights on the origins of these skills (e.g., Chatterji 2009). In addition, while
we focus much of our analysis on young firms and carefully consider the role of family business, there may be other kinds
of existing reputations that we cannot observe in our data. In general, a more systematic treatment of prior experience and
market reputations of entrepreneurs can only enrich our understanding of new venture strategy and the role of firm names.
Finally, while we have presented evidence consistent with the notion that the name of the firm is communicating
valuable information to a broad group of stakeholders, future work can also more comprehensively consider who exactly
the intended recipient of this information is. In some industries, such as professional services, the intended audience will
likely be clients and potential employees. In other industries, such as biotechnology, the intended audience could be
potential partners and investors. In addition, our large dataset covers a wide variety of industries, some which are likely
characterized by more traditional “mom-and-pop” businesses and others that contain “high-growth” entrepreneurs. While
we use differences in firm age to focus our arguments on eponymous “entrepreneurs,” there is still much to learn about
eponymous ventures as they grow older. Follow-up research could focus more narrowly on a single industry and shed
light on how the arguments in this paper apply across diverse kinds of new businesses at different stages of their life
cycle. In sum, understanding the conditions under which naming strategies are most useful is a topic worthy of further
study.
Our findings make key contributions to the literature on entrepreneurship and new venture strategy. First, we
build on insights from the economics, sociology and strategic management literatures to explain one way that new
ventures can establish and maintain competitive positions. While scholars have documented examples of firms like
Toyota and Samsung entering at the low end of the market (Greenstein 2005), we have far fewer examples of how new
entrants can establish and maintain differentiated market positions, especially when they do not have existing reputations.
Further exploration of the positioning of new ventures could yield new insights and unleash a significant new research
stream. In addition, while considerable work has aimed to explore the causal impact of strategic choices by entrepreneurs
on performance, we adopt a distinct but related approach in this paper. Our argument is that eponymy enables the
competitive position which accounts for the performance patterns in our data. This general approach to investigating
entrepreneurial strategy might also be useful in future studies.
20
Our findings are relevant for other important papers in strategy and entrepreneurship. In particular, our results
relate to a seminal entrepreneurship paper by Jovanovic (1982). The Jovanovic model predicts that as new firms learn
about the quality of their venture, they adjust their growth and survival decisions. Firms with positive-quality “draws” are
more likely to survive and grow faster, while firms with negative-quality “draws” grow more slowly and are more likely
to fail. Our argument is that there may be trade-offs between survival and growth and that pure selection arguments might
not explain all aspects of entrepreneurial performance. A similar distinction can be drawn between our work and
Zimmerman and Zeitz (2002), who find that increased social legitimacy is associated with growth. Much in the spirit of
Yao (1988), our approach is to explain how firm strategies develop in incomplete markets and relate to firm performance.
In doing so, we aim to lay a foundation for more research on new venture strategies and a deeper understanding of the
entrepreneur.
References
Acemoglu, D., P. Aghion, C. Lelarge, J. Van Reenen, and F. Zilibotti. (2007). Technology, information, and the decentralization of the firm. Quarterly Journal of Economics, 122(4): 1759–1799.
Akerlof, G. (1970). The market for “lemons”: Quality uncertainty and the market mechanism. Quarterly Journal of Economics, 84: 488–500.
Aldrich, H. E. and C. M. Fiol. (1994). Fools rush in? The institutional context of industry creation. The Academy of Management Review, 19(4): 645–670.
Amit, R., L. Glosten, and E. Muller. (1990). Entrepreneurial ability, venture investments, and risk sharing. Management Science, 38(10): 1232–1245.
Arrow, K. J. (1984). “The Economics of Agency.” Stanford University IMSSS Technical Report No. 451.
Ashforth, B. E. and B. W. Gibbs. (1990). The double-edge of organizational legitimation. Organization Science, 1: 177–194.
Autor, D. H., W. R. Kerr, and A. D. Kugler. (2007). Does employment protection reduce productivity? Evidence from U.S. states. The Economic Journal, 117(521): F189–F217.
Bagwell, K. and M. Riordan. (1991). High and declining prices signal product quality. The American Economic Review, 81(1): 224–239.
Belenzon, S. and R. Zarutskie. (2012). Married to the Firm? Family Ownership, Performance, and Financing in Private Firms. Working paper.
Bertrand, M. and S. Mullainathan. (2004). Are Emily and Greg more employable than Lakisha and Jamal? A field experiment on labor market discrimination. American Economic Review, 94(4): 991–1013.
Busenitz, L. W., J. O. Fiet, and D. D. Moesel. (2005). Signaling in venture capitalist–new venture team funding decisions: Does it indicate long-term venture outcomes? Entrepreneurship Theory and Practice, 29(1): 1–12.
Caves, R. E. and M. E. Porter. (1977). From entry barriers to mobility barriers: Conjectural decisions and contrived deterrence to new competition. The Quarterly Journal of Economics, 91(2): 241–261.
Certo, S. T. (2003). Influencing IPO investors with prestige: Signaling with board structures. Academy of Management Review, 28: 432–446.
Chatterji, A. (2009). Spawned with a silver spoon? Entrepreneurial performance and innovation in the medical device industry. Strategic Management Journal, 30: 185–206.
Cooper, M. J., O. Dimitrov, and P. R. Rau. (2001). A rose.com by any other name. The Journal of Finance, 56(6): 2371–2388.

21
Cooper, M. J., H. Gulen, and P. R. Rau. (2005). Changing names with style: Mutual fund name changes and their effects on fund flows. The Journal of Finance, 60(6): 2825–2858.
Costinot, A., L. Oldenski, and J. Rauch. 2011. Adaptation and the boundary of multinational firms. Review of Economics and Statistics, 93:1, 298–308.
Deutsch, Y. and T. W. Ross. (2003). You are known by the directors you keep: Reputable directors as a signaling mechanism for young firms. Management Science, 49(8): 1003–1017.
DiMaggio, P. J. and W. W. Powell. (1983). The iron cage revisited: Institutional isomorphism and collective rationality in organizational fields. American Sociological Review, 48(2): 147–160.
Elitzur, R. and A. Gavious. (2003). Contracting, signaling, and moral hazard: A model of entrepreneurs, angels, and venture capitalists. Journal of Business Venturing, 18(6): 709–725.
Fombrun, C. and M. Shanley. (1990). What’s in a name? Reputation building and corporate strategy. The Academy of Management Journal, 33(2): 233–258.
Freeman, J., G. R. Carroll, and M. T. Hannan. (1983). The liability of newness: Age dependence in organizational death rates. American Sociological Review, 48(5): 692–710.
Fryer Jr., R. and S. Levitt (2004). The causes and consequences of distinctively black names. Quarterly Journal of Economics, 119(3): 767–805.
Glynn, M. A. and R. Abzug (2002). Institutionalizing identity: Symbolic isomorphism and organizational names. The Academy of Management Journal, 45(1): 267–280.
Greenstein, S. (2005). Outsourcing and climbing a value chain. IEEE computer society, Sep–Oct.
Horsky, D. P. S. (1987). Does it pay to change your company’s name? Marketing Science, 6: 320–325.
Hsu, D. and R. Ziedonis (2012). Patents as Quality Signals for Entrepreneurial Ventures. Unpublished Manuscript.
Ingram, P. (1996). Organizational form as a solution to the problem of credible commitment: The evolution of naming strategies among U.S. hotel chains, 1896–1980. Strategic Management Journal, 17(S1): 85–98.
Jovanovic, B. (1982). Selection and the evolution of industry. Econometrica, 50(3): 649–670.
Kim, K. (2012) Endogenous market segmentation for lemons. RAND Journal of Economics, forthcoming.
Lee, P. M. (2001). What’s in a name.com?: The effects of ‘.com’ name changes on stock prices and trading activity. Strategic Management Journal, 22(8): 793–804.
McDevitt, R. (2011). Names and reputations: An empirical analysis. American Economic Journal: Microeconomics, 3(3): 193–209.
McDevitt, R. C. (2012). “A” Business by Any Other Name: Firm Name Choice as a Signal of Firm Quality. Unpublished Manuscript.
Milgrom, P. and J. Roberts. (1986). Price and advertising signals of product quality. Journal of Political Economy, 94(4): 796–821.
Pfeffer, J. and G. R. Salancik. (1978). The external control of organizations: A resource dependence perspective. New York, Harper & Row.
Phillips, D. J. and Y.-K. Kim. (2009). Why pseudonyms? Deception as identity preservation among jazz record companies, 1920–1929. Organization Science, 20(3): 481–499.
Porter, M. (1980). Competitive strategy. New York, Free Press.
Porter, M. (1985). Competitive advantage: Creating and sustaining superior advantage. New York, Free Press.
Porter, M. E. (1991). Towards a dynamic theory of strategy. Strategic Management Journal, 12: 95–117.
Shane, S. and D. Cable. (2002). Network ties, reputation, and the financing of new ventures. Management Science, 48(3): 364–381.
22
Shapiro, C. (1983). Premiums for high quality products as returns to reputations. Quarterly Journal of Economics, 98: 659–679.
Simcoe, T. S. and D. M. Waguespack. (2011). Status, quality, and attention: What’s in a (missing) name? Management Science, 57(2): 274–290.
Singh, J. V., D. J. Tucker, and R. J. House. (1986). Organizational legitimacy and the liability of newness. Administrative Science Quarterly, 31(2): 171–193.
Spence, M. (1973). Job market signaling. Quarterly Journal of Economics, 87(3): 355–374.
Spence, A. M. (1974). Market signaling: Informational transfer in hiring and related screening processes. Cambridge, MA, Harvard University Press.
Stinchcombe, A. L. (1965). Organizations and social structure. In J. G. March (Ed.), Handbook of Organizations. Chicago, IL, Rand McNally.
Stuart, T. E., H. Hoang, and R.C. Hybels. (1999). Interorganizational endorsements and the performance of entrepreneurial ventures. Administrative Science Quarterly, 44(2): 315–349.
Tadelis, S. (1999). What’s in a name? Reputation as a tradeable asset. The American Economic Review, 89(3): 548–563.
Tadelis, S. (2002). The market for reputations as an incentive mechanism. Journal of Political Economy, 110(4): 854–882.
White, R. E. (1986). "Generic business strategies, organizational context and performance: An empirical investigation." Strategic Management Journal 7(3): 217-231.
Yao, D. (1988). Beyond the reach of the invisible hand: Impediments to economic activity, market failures, and profitability. Strategic Management Journal, 9: 59–70.
Zimmerman, M. A. and G. J. Zeitz. (2002). Beyond survival: Achieving new venture growth by building legitimacy. The Academy of Management Review, 27(3): 414–431.
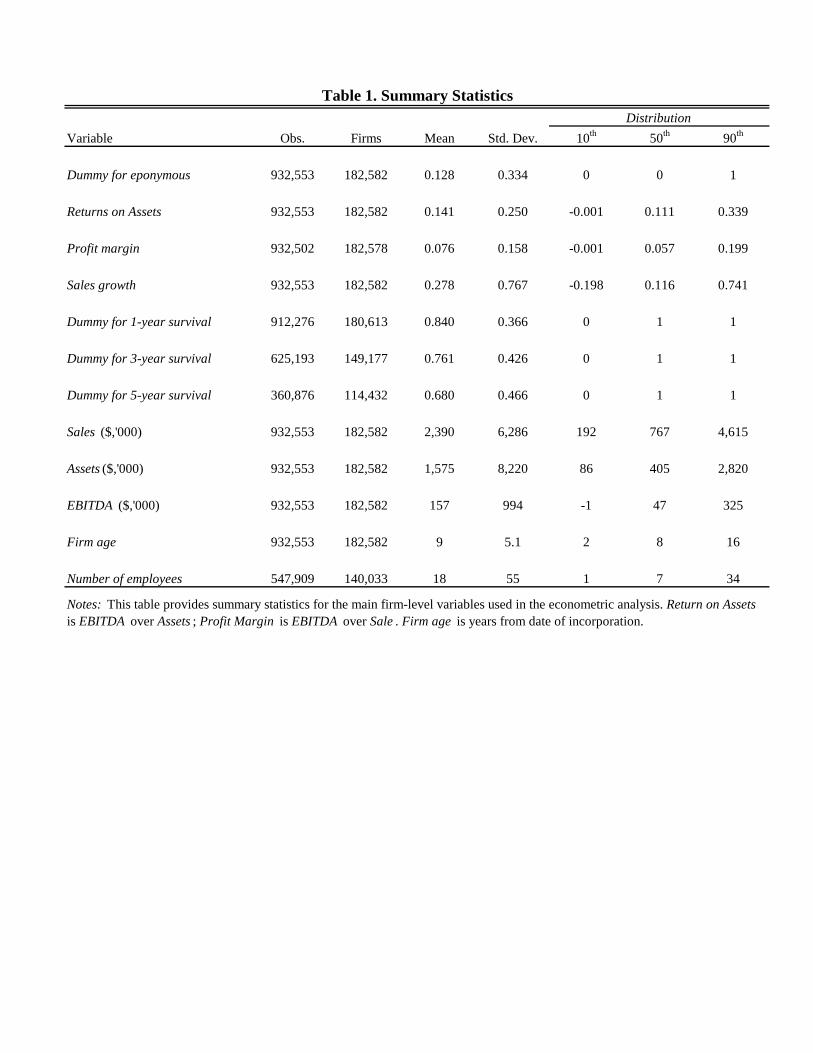
Variable Obs. Firms Mean Std. Dev. 10th 50th 90th
Dummy for eponymous 932,553 182,582 0.128 0.334 0 0 1
Returns on Assets 932,553 182,582 0.141 0.250 -0.001 0.111 0.339
Profit margin 932,502 182,578 0.076 0.158 -0.001 0.057 0.199
Sales growth 932,553 182,582 0.278 0.767 -0.198 0.116 0.741
Dummy for 1-year survival 912,276 180,613 0.840 0.366 0 1 1
Dummy for 3-year survival 625,193 149,177 0.761 0.426 0 1 1
Dummy for 5-year survival 360,876 114,432 0.680 0.466 0 1 1
Sales ($,'000) 932,553 182,582 2,390 6,286 192 767 4,615
Assets ($,'000) 932,553 182,582 1,575 8,220 86 405 2,820
EBITDA ($,'000) 932,553 182,582 157 994 -1 47 325
Firm age 932,553 182,582 9 5.1 2 8 16
Number of employees 547,909 140,033 18 55 1 7 34
Table 1. Summary StatisticsDistribution
Notes: This table provides summary statistics for the main firm-level variables used in the econometric analysis. Return on Assets is EBITDA over Assets ; Profit Margin is EBITDA over Sale . Firm age is years from date of incorporation.
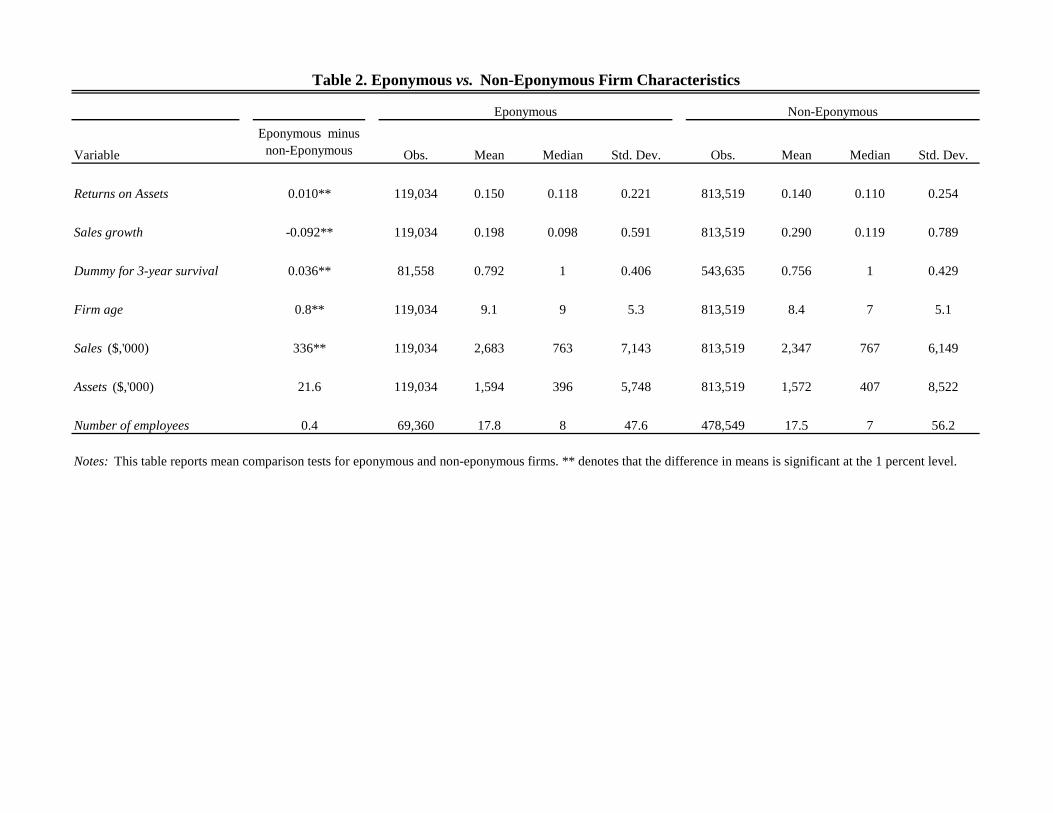
VariableEponymous minus
non-Eponymous Obs. Mean Median Std. Dev. Obs. Mean Median Std. Dev.
Returns on Assets 0.010** 119,034 0.150 0.118 0.221 813,519 0.140 0.110 0.254
Sales growth -0.092** 119,034 0.198 0.098 0.591 813,519 0.290 0.119 0.789
Dummy for 3-year survival 0.036** 81,558 0.792 1 0.406 543,635 0.756 1 0.429
Firm age 0.8** 119,034 9.1 9 5.3 813,519 8.4 7 5.1
Sales ($,'000) 336** 119,034 2,683 763 7,143 813,519 2,347 767 6,149
Assets ($,'000) 21.6 119,034 1,594 396 5,748 813,519 1,572 407 8,522
Number of employees 0.4 69,360 17.8 8 47.6 478,549 17.5 7 56.2
Table 2. Eponymous vs. Non-Eponymous Firm Characteristics
Eponymous Non-Eponymous
Notes: This table reports mean comparison tests for eponymous and non-eponymous firms. ** denotes that the difference in means is significant at the 1 percent level.
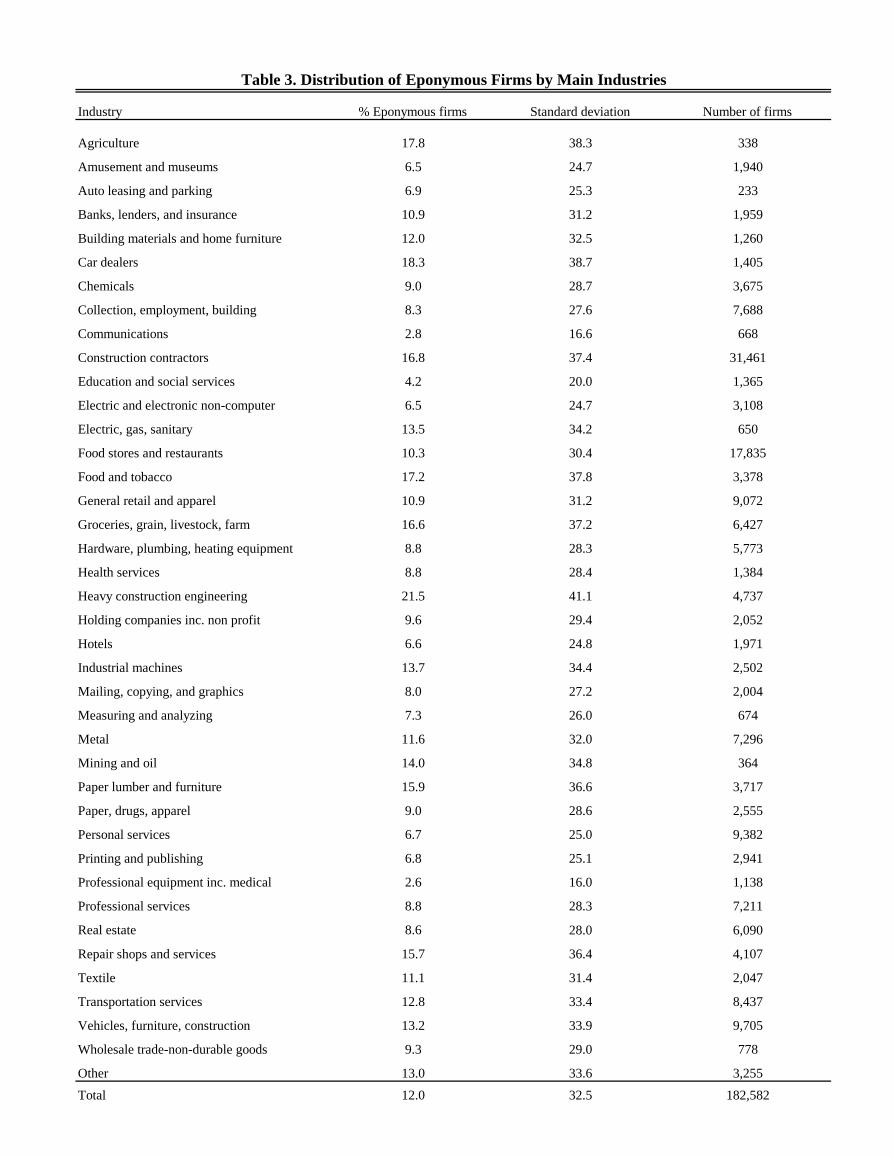
Industry % Eponymous firms Standard deviation Number of firms
Agriculture 17.8 38.3 338
Amusement and museums 6.5 24.7 1,940
Auto leasing and parking 6.9 25.3 233
Banks, lenders, and insurance 10.9 31.2 1,959
Building materials and home furniture 12.0 32.5 1,260
Car dealers 18.3 38.7 1,405
Chemicals 9.0 28.7 3,675
Collection, employment, building 8.3 27.6 7,688
Communications 2.8 16.6 668
Construction contractors 16.8 37.4 31,461
Education and social services 4.2 20.0 1,365
Electric and electronic non-computer 6.5 24.7 3,108
Electric, gas, sanitary 13.5 34.2 650
Food stores and restaurants 10.3 30.4 17,835
Food and tobacco 17.2 37.8 3,378
General retail and apparel 10.9 31.2 9,072
Groceries, grain, livestock, farm 16.6 37.2 6,427
Hardware, plumbing, heating equipment 8.8 28.3 5,773
Health services 8.8 28.4 1,384
Heavy construction engineering 21.5 41.1 4,737
Holding companies inc. non profit 9.6 29.4 2,052
Hotels 6.6 24.8 1,971
Industrial machines 13.7 34.4 2,502
Mailing, copying, and graphics 8.0 27.2 2,004
Measuring and analyzing 7.3 26.0 674
Metal 11.6 32.0 7,296
Mining and oil 14.0 34.8 364
Paper lumber and furniture 15.9 36.6 3,717
Paper, drugs, apparel 9.0 28.6 2,555
Personal services 6.7 25.0 9,382
Printing and publishing 6.8 25.1 2,941
Professional equipment inc. medical 2.6 16.0 1,138
Professional services 8.8 28.3 7,211
Real estate 8.6 28.0 6,090
Repair shops and services 15.7 36.4 4,107
Textile 11.1 31.4 2,047
Transportation services 12.8 33.4 8,437
Vehicles, furniture, construction 13.2 33.9 9,705
Wholesale trade-non-durable goods 9.3 29.0 778
Other 13.0 33.6 3,255
Total 12.0 32.5 182,582
Table 3. Distribution of Eponymous Firms by Main Industries
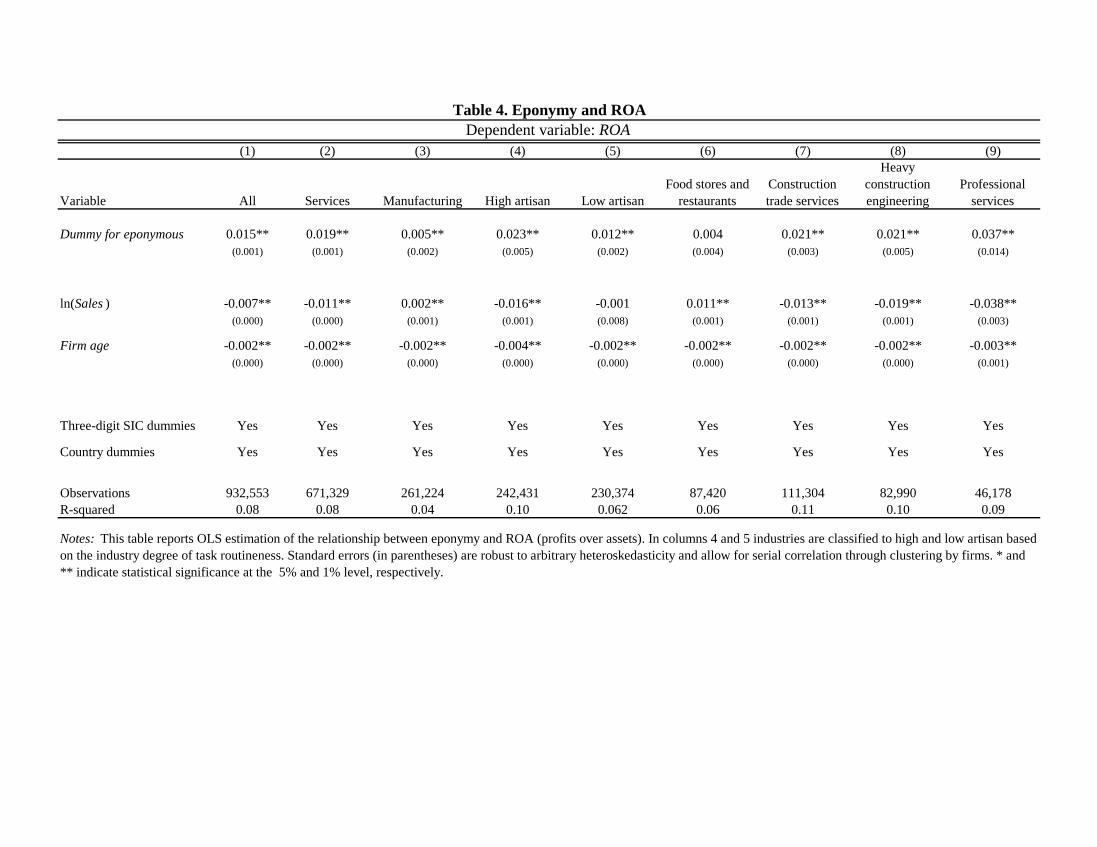
(1) (2) (3) (4) (5) (6) (7) (8) (9)
Variable All Services Manufacturing High artisan Low artisanFood stores and
restaurantsConstruction trade services
Heavy construction engineering
Professional services
Dummy for eponymous 0.015** 0.019** 0.005** 0.023** 0.012** 0.004 0.021** 0.021** 0.037**(0.001) (0.001) (0.002) (0.005) (0.002) (0.004) (0.003) (0.005) (0.014)
ln(Sales ) -0.007** -0.011** 0.002** -0.016** -0.001 0.011** -0.013** -0.019** -0.038**(0.000) (0.000) (0.001) (0.001) (0.008) (0.001) (0.001) (0.001) (0.003)
Firm age -0.002** -0.002** -0.002** -0.004** -0.002** -0.002** -0.002** -0.002** -0.003**(0.000) (0.000) (0.000) (0.000) (0.000) (0.000) (0.000) (0.000) (0.001)
Three-digit SIC dummies Yes Yes Yes Yes Yes Yes Yes Yes Yes
Country dummies Yes Yes Yes Yes Yes Yes Yes Yes Yes
Observations 932,553 671,329 261,224 242,431 230,374 87,420 111,304 82,990 46,178R-squared 0.08 0.08 0.04 0.10 0.062 0.06 0.11 0.10 0.09
Dependent variable: ROATable 4. Eponymy and ROA
Notes: This table reports OLS estimation of the relationship between eponymy and ROA (profits over assets). In columns 4 and 5 industries are classified to high and low artisan based on the industry degree of task routineness. Standard errors (in parentheses) are robust to arbitrary heteroskedasticity and allow for serial correlation through clustering by firms. * and ** indicate statistical significance at the 5% and 1% level, respectively.
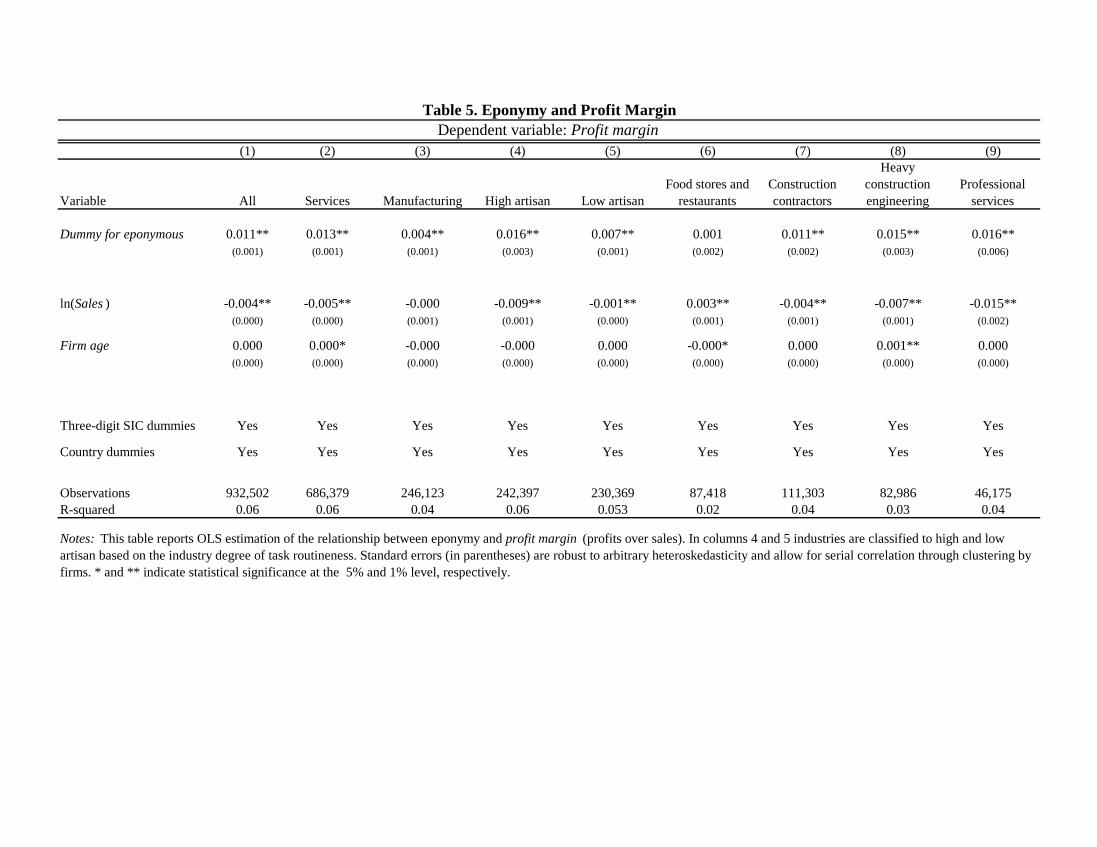
(1) (2) (3) (4) (5) (6) (7) (8) (9)
Variable All Services Manufacturing High artisan Low artisanFood stores and
restaurantsConstruction contractors
Heavy construction engineering
Professional services
Dummy for eponymous 0.011** 0.013** 0.004** 0.016** 0.007** 0.001 0.011** 0.015** 0.016**(0.001) (0.001) (0.001) (0.003) (0.001) (0.002) (0.002) (0.003) (0.006)
ln(Sales ) -0.004** -0.005** -0.000 -0.009** -0.001** 0.003** -0.004** -0.007** -0.015**(0.000) (0.000) (0.001) (0.001) (0.000) (0.001) (0.001) (0.001) (0.002)
Firm age 0.000 0.000* -0.000 -0.000 0.000 -0.000* 0.000 0.001** 0.000(0.000) (0.000) (0.000) (0.000) (0.000) (0.000) (0.000) (0.000) (0.000)
Three-digit SIC dummies Yes Yes Yes Yes Yes Yes Yes Yes Yes
Country dummies Yes Yes Yes Yes Yes Yes Yes Yes Yes
Observations 932,502 686,379 246,123 242,397 230,369 87,418 111,303 82,986 46,175R-squared 0.06 0.06 0.04 0.06 0.053 0.02 0.04 0.03 0.04
Table 5. Eponymy and Profit MarginDependent variable: Profit margin
Notes: This table reports OLS estimation of the relationship between eponymy and profit margin (profits over sales). In columns 4 and 5 industries are classified to high and low artisan based on the industry degree of task routineness. Standard errors (in parentheses) are robust to arbitrary heteroskedasticity and allow for serial correlation through clustering by firms. * and ** indicate statistical significance at the 5% and 1% level, respectively.

(1) (2) (3) (4) (5) (6) (7) (8) (9)
Variable All Services Manufacturing High artisan Low artisanFood stores and
restaurantsConstruction trade services
Heavy construction engineering
Professional services
Dummy for eponymous -0.034** -0.038** -0.024** -0.043** -0.043** -0.019* -0.055** -0.091** -0.041**(0.002) (0.003) (0.004) (0.008) (0.005) (0.009) (0.006) (0.012) (0.016)
ln(Sales ) -0.206** -0.221** -0.165** -0.244** -0.177** -0.172** -0.198** -0.293** -0.219**(0.001) (0.002) (0.002) (0.003) (0.003) (0.005) (0.004) (0.005) (0.006)
Firm age -0.017** -0.016** -0.018** -0.018** -0.015** -0.015** -0.015** -0.015** -0.020**(0.000) (0.000) (0.000) (0.000) (0.000) (0.001) (0.000) (0.001) (0.001)
Three-digit SIC dummies Yes Yes Yes Yes Yes Yes Yes Yes Yes
Country dummies Yes Yes Yes Yes Yes Yes Yes Yes Yes
Observations 932,553 671,329 261,224 242,431 230,374 87,420 111,304 82,990 46,178R-squared 0.08 0.08 0.04 0.20 0.18 0.17 0.18 0.21 0.19
Table 6. Eponymy and Sales GrowthDependent variable: Sales growth
Notes: This table reports OLS estimation of the relationship between eponymy and sales growth. In columns 4 and 5 industries are classified to high and low-artisan based on the industry degree of task routineness. Standard errors (in parentheses) are robust to arbitrary heteroskedasticity and allow for serial correlation through clustering by firms. * and ** indicate statistical significance at the 5% and 1% level, respectively.
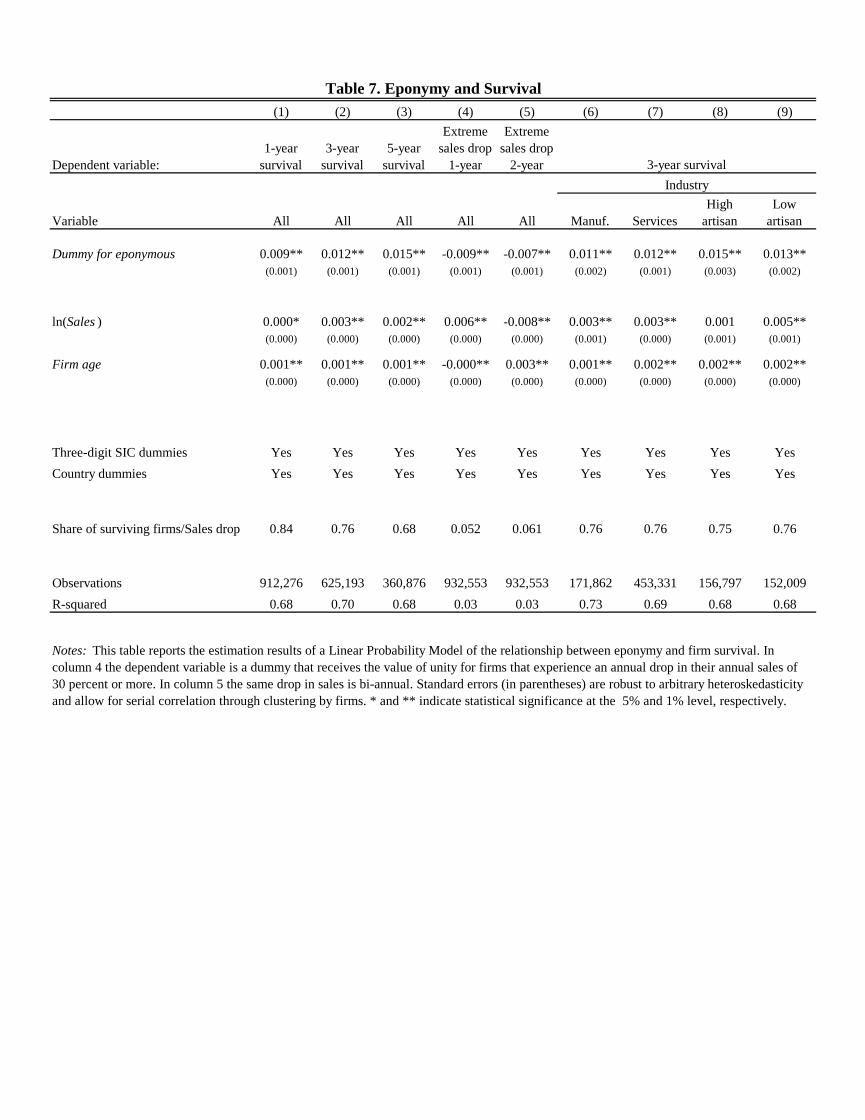
(1) (2) (3) (4) (5) (6) (7) (8) (9)
Dependent variable:1-year
survival3-year
survival5-year
survival
Extreme sales drop
1-year
Extreme sales drop
2-year
Variable All All All All All Manuf. Services High
artisanLow
artisan
Dummy for eponymous 0.009** 0.012** 0.015** -0.009** -0.007** 0.011** 0.012** 0.015** 0.013**(0.001) (0.001) (0.001) (0.001) (0.001) (0.002) (0.001) (0.003) (0.002)
ln(Sales ) 0.000* 0.003** 0.002** 0.006** -0.008** 0.003** 0.003** 0.001 0.005**(0.000) (0.000) (0.000) (0.000) (0.000) (0.001) (0.000) (0.001) (0.001)
Firm age 0.001** 0.001** 0.001** -0.000** 0.003** 0.001** 0.002** 0.002** 0.002**(0.000) (0.000) (0.000) (0.000) (0.000) (0.000) (0.000) (0.000) (0.000)
Three-digit SIC dummies Yes Yes Yes Yes Yes Yes Yes Yes YesCountry dummies Yes Yes Yes Yes Yes Yes Yes Yes Yes
Share of surviving firms/Sales drop 0.84 0.76 0.68 0.052 0.061 0.76 0.76 0.75 0.76
Observations 912,276 625,193 360,876 932,553 932,553 171,862 453,331 156,797 152,009R-squared 0.68 0.70 0.68 0.03 0.03 0.73 0.69 0.68 0.68
Table 7. Eponymy and Survival
Notes: This table reports the estimation results of a Linear Probability Model of the relationship between eponymy and firm survival. In column 4 the dependent variable is a dummy that receives the value of unity for firms that experience an annual drop in their annual sales of 30 percent or more. In column 5 the same drop in sales is bi-annual. Standard errors (in parentheses) are robust to arbitrary heteroskedasticity and allow for serial correlation through clustering by firms. * and ** indicate statistical significance at the 5% and 1% level, respectively.
3-year survivalIndustry
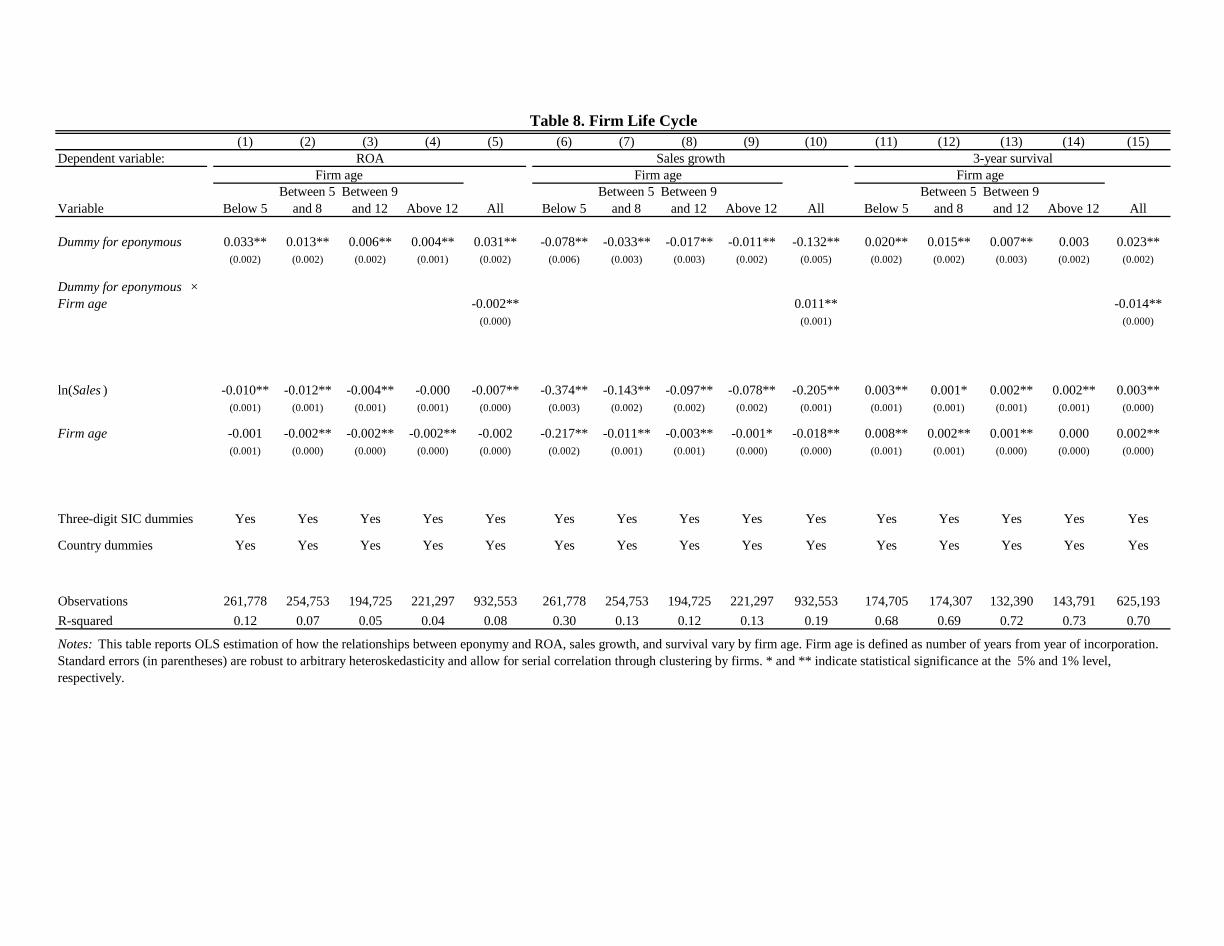
(1) (2) (3) (4) (5) (6) (7) (8) (9) (10) (11) (12) (13) (14) (15)Dependent variable:
Variable Below 5Between 5
and 8Between 9
and 12 Above 12 All Below 5Between 5
and 8Between 9
and 12 Above 12 All Below 5Between 5
and 8Between 9
and 12 Above 12 All
Dummy for eponymous 0.033** 0.013** 0.006** 0.004** 0.031** -0.078** -0.033** -0.017** -0.011** -0.132** 0.020** 0.015** 0.007** 0.003 0.023**(0.002) (0.002) (0.002) (0.001) (0.002) (0.006) (0.003) (0.003) (0.002) (0.005) (0.002) (0.002) (0.003) (0.002) (0.002)
Dummy for eponymous × Firm age -0.002** 0.011** -0.014**
(0.000) (0.001) (0.000)
ln(Sales ) -0.010** -0.012** -0.004** -0.000 -0.007** -0.374** -0.143** -0.097** -0.078** -0.205** 0.003** 0.001* 0.002** 0.002** 0.003**(0.001) (0.001) (0.001) (0.001) (0.000) (0.003) (0.002) (0.002) (0.002) (0.001) (0.001) (0.001) (0.001) (0.001) (0.000)
Firm age -0.001 -0.002** -0.002** -0.002** -0.002 -0.217** -0.011** -0.003** -0.001* -0.018** 0.008** 0.002** 0.001** 0.000 0.002**(0.001) (0.000) (0.000) (0.000) (0.000) (0.002) (0.001) (0.001) (0.000) (0.000) (0.001) (0.001) (0.000) (0.000) (0.000)
Three-digit SIC dummies Yes Yes Yes Yes Yes Yes Yes Yes Yes Yes Yes Yes Yes Yes Yes
Country dummies Yes Yes Yes Yes Yes Yes Yes Yes Yes Yes Yes Yes Yes Yes Yes
Observations 261,778 254,753 194,725 221,297 932,553 261,778 254,753 194,725 221,297 932,553 174,705 174,307 132,390 143,791 625,193R-squared 0.12 0.07 0.05 0.04 0.08 0.30 0.13 0.12 0.13 0.19 0.68 0.69 0.72 0.73 0.70
Notes: This table reports OLS estimation of how the relationships between eponymy and ROA, sales growth, and survival vary by firm age. Firm age is defined as number of years from year of incorporation. Standard errors (in parentheses) are robust to arbitrary heteroskedasticity and allow for serial correlation through clustering by firms. * and ** indicate statistical significance at the 5% and 1% level, respectively.
Table 8. Firm Life Cycle
Firm age Firm ageROA 3-year survivalSales growth
Firm age
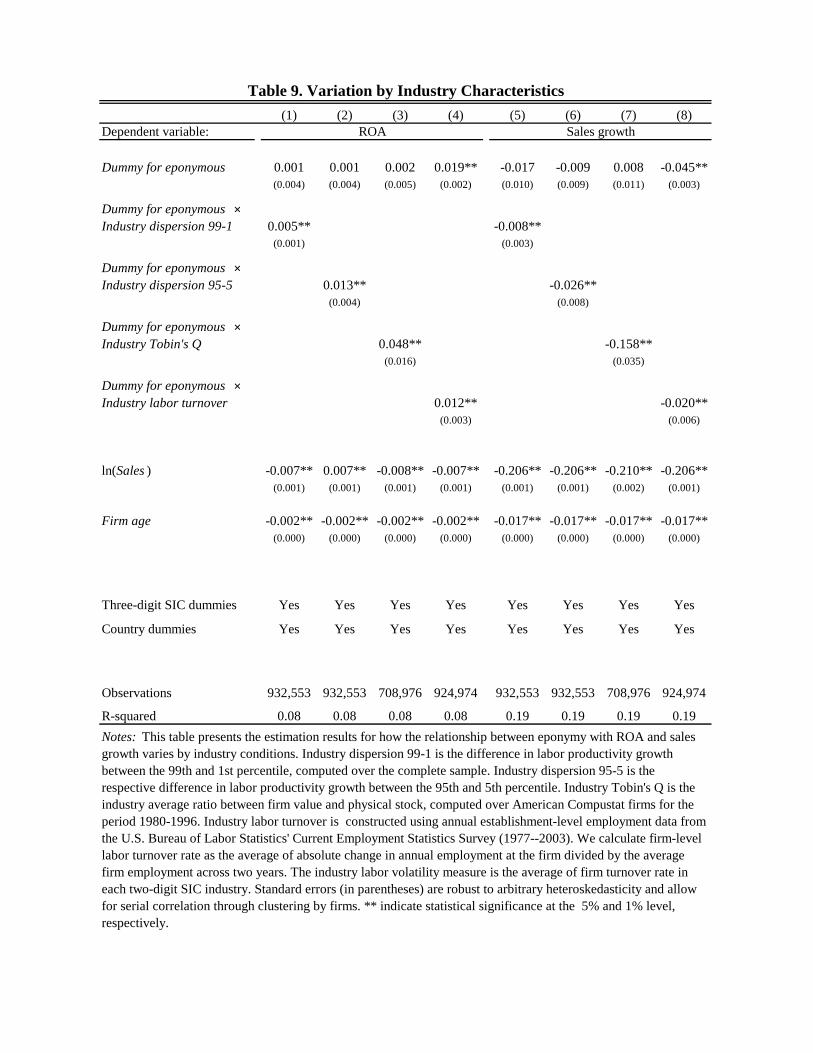
(1) (2) (3) (4) (5) (6) (7) (8)Dependent variable:
Dummy for eponymous 0.001 0.001 0.002 0.019** -0.017 -0.009 0.008 -0.045**(0.004) (0.004) (0.005) (0.002) (0.010) (0.009) (0.011) (0.003)
Dummy for eponymous × Industry dispersion 99-1 0.005** -0.008**
(0.001) (0.003)
Dummy for eponymous × Industry dispersion 95-5 0.013** -0.026**
(0.004) (0.008)
Dummy for eponymous × Industry Tobin's Q 0.048** -0.158**
(0.016) (0.035)
Dummy for eponymous × Industry labor turnover 0.012** -0.020**
(0.003) (0.006)
ln(Sales ) -0.007** 0.007** -0.008** -0.007** -0.206** -0.206** -0.210** -0.206**(0.001) (0.001) (0.001) (0.001) (0.001) (0.001) (0.002) (0.001)
Firm age -0.002** -0.002** -0.002** -0.002** -0.017** -0.017** -0.017** -0.017**(0.000) (0.000) (0.000) (0.000) (0.000) (0.000) (0.000) (0.000)
Three-digit SIC dummies Yes Yes Yes Yes Yes Yes Yes Yes
Country dummies Yes Yes Yes Yes Yes Yes Yes Yes
Observations 932,553 932,553 708,976 924,974 932,553 932,553 708,976 924,974
R-squared 0.08 0.08 0.08 0.08 0.19 0.19 0.19 0.19
Table 9. Variation by Industry Characteristics
ROA Sales growth
Notes: This table presents the estimation results for how the relationship between eponymy with ROA and sales growth varies by industry conditions. Industry dispersion 99-1 is the difference in labor productivity growth between the 99th and 1st percentile, computed over the complete sample. Industry dispersion 95-5 is the respective difference in labor productivity growth between the 95th and 5th percentile. Industry Tobin's Q is the industry average ratio between firm value and physical stock, computed over American Compustat firms for the period 1980-1996. Industry labor turnover is constructed using annual establishment-level employment data from the U.S. Bureau of Labor Statistics' Current Employment Statistics Survey (1977--2003). We calculate firm-level labor turnover rate as the average of absolute change in annual employment at the firm divided by the average firm employment across two years. The industry labor volatility measure is the average of firm turnover rate in each two-digit SIC industry. Standard errors (in parentheses) are robust to arbitrary heteroskedasticity and allow for serial correlation through clustering by firms. ** indicate statistical significance at the 5% and 1% level, respectively.
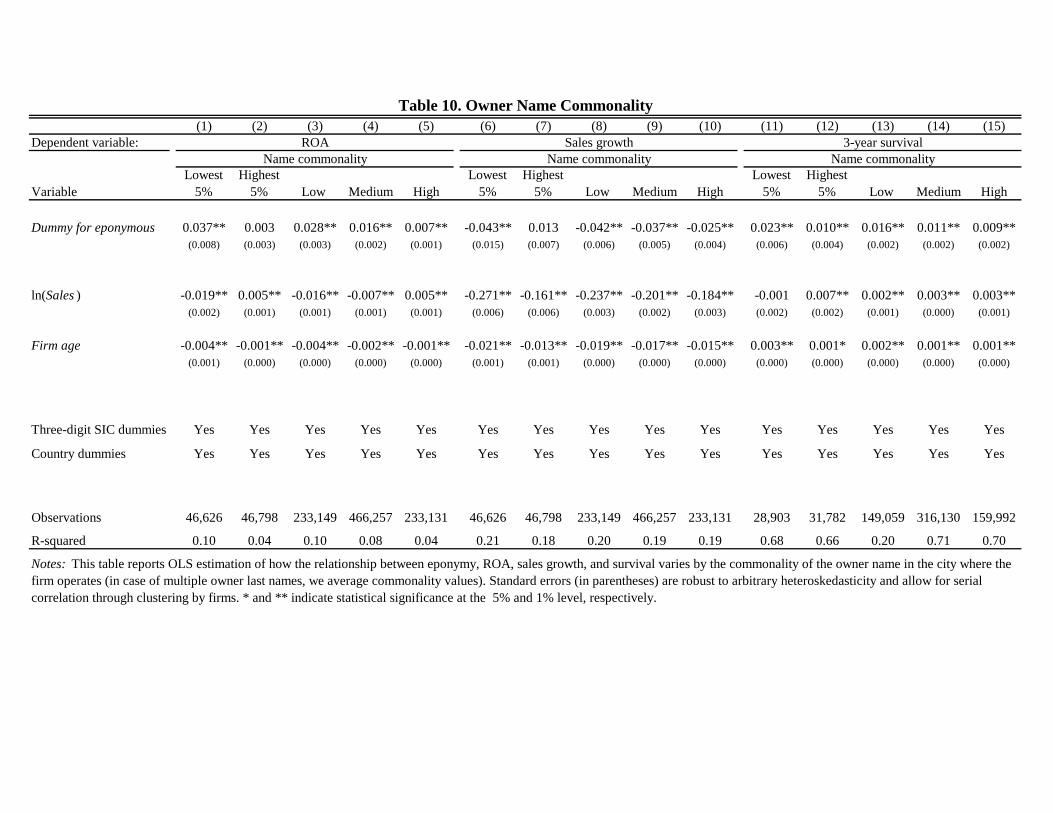
(1) (2) (3) (4) (5) (6) (7) (8) (9) (10) (11) (12) (13) (14) (15)Dependent variable:
VariableLowest
5%Highest
5% Low Medium HighLowest
5%Highest
5% Low Medium HighLowest
5%Highest
5% Low Medium High
Dummy for eponymous 0.037** 0.003 0.028** 0.016** 0.007** -0.043** 0.013 -0.042** -0.037** -0.025** 0.023** 0.010** 0.016** 0.011** 0.009**(0.008) (0.003) (0.003) (0.002) (0.001) (0.015) (0.007) (0.006) (0.005) (0.004) (0.006) (0.004) (0.002) (0.002) (0.002)
ln(Sales ) -0.019** 0.005** -0.016** -0.007** 0.005** -0.271** -0.161** -0.237** -0.201** -0.184** -0.001 0.007** 0.002** 0.003** 0.003**(0.002) (0.001) (0.001) (0.001) (0.001) (0.006) (0.006) (0.003) (0.002) (0.003) (0.002) (0.002) (0.001) (0.000) (0.001)
Firm age -0.004** -0.001** -0.004** -0.002** -0.001** -0.021** -0.013** -0.019** -0.017** -0.015** 0.003** 0.001* 0.002** 0.001** 0.001**(0.001) (0.000) (0.000) (0.000) (0.000) (0.001) (0.001) (0.000) (0.000) (0.000) (0.000) (0.000) (0.000) (0.000) (0.000)
Three-digit SIC dummies Yes Yes Yes Yes Yes Yes Yes Yes Yes Yes Yes Yes Yes Yes Yes
Country dummies Yes Yes Yes Yes Yes Yes Yes Yes Yes Yes Yes Yes Yes Yes Yes
Observations 46,626 46,798 233,149 466,257 233,131 46,626 46,798 233,149 466,257 233,131 28,903 31,782 149,059 316,130 159,992
R-squared 0.10 0.04 0.10 0.08 0.04 0.21 0.18 0.20 0.19 0.19 0.68 0.66 0.20 0.71 0.70
Notes: This table reports OLS estimation of how the relationship between eponymy, ROA, sales growth, and survival varies by the commonality of the owner name in the city where the firm operates (in case of multiple owner last names, we average commonality values). Standard errors (in parentheses) are robust to arbitrary heteroskedasticity and allow for serial correlation through clustering by firms. * and ** indicate statistical significance at the 5% and 1% level, respectively.
Table 10. Owner Name Commonality
ROA Sales growth 3-year survivalName commonalityName commonalityName commonality
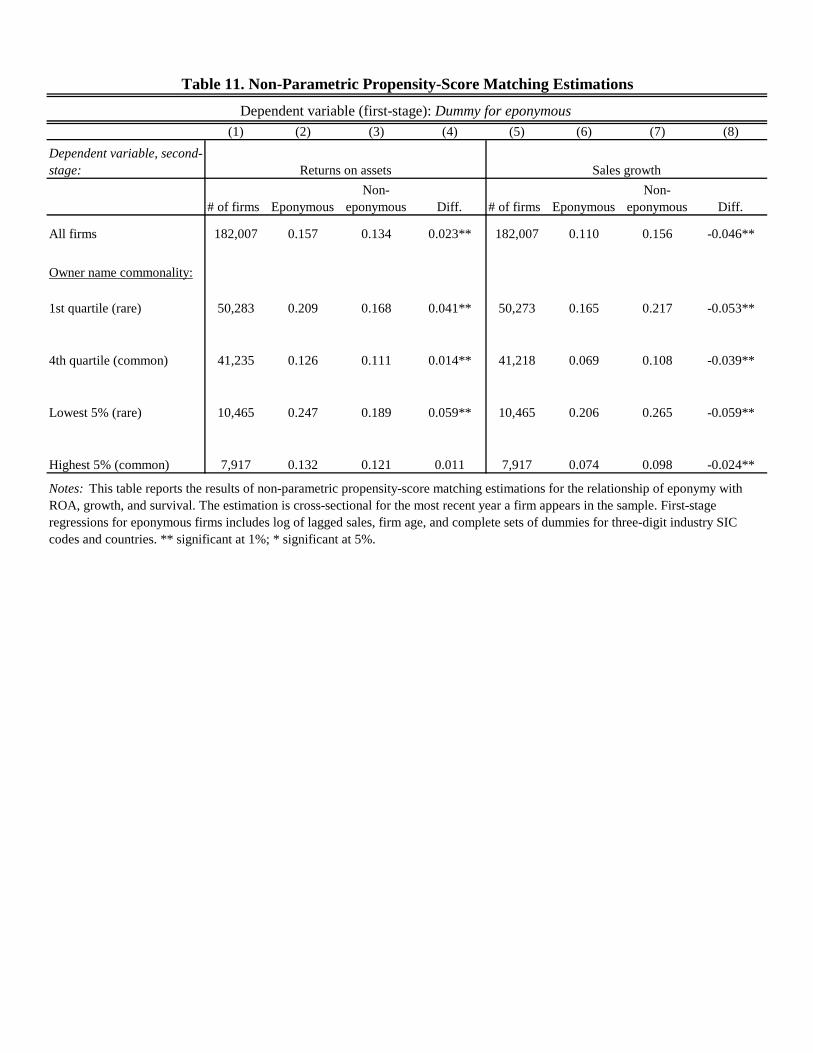
(1) (2) (3) (4) (5) (6) (7) (8)Dependent variable, second-stage:
# of firms Eponymous Non-
eponymous Diff. # of firms Eponymous Non-
eponymous Diff.
All firms 182,007 0.157 0.134 0.023** 182,007 0.110 0.156 -0.046**
Owner name commonality:
1st quartile (rare) 50,283 0.209 0.168 0.041** 50,273 0.165 0.217 -0.053**
4th quartile (common) 41,235 0.126 0.111 0.014** 41,218 0.069 0.108 -0.039**
Lowest 5% (rare) 10,465 0.247 0.189 0.059** 10,465 0.206 0.265 -0.059**
Highest 5% (common) 7,917 0.132 0.121 0.011 7,917 0.074 0.098 -0.024**
Notes: This table reports the results of non-parametric propensity-score matching estimations for the relationship of eponymy with ROA, growth, and survival. The estimation is cross-sectional for the most recent year a firm appears in the sample. First-stage regressions for eponymous firms includes log of lagged sales, firm age, and complete sets of dummies for three-digit industry SIC codes and countries. ** significant at 1%; * significant at 5%.
Returns on assets Sales growth
Table 11. Non-Parametric Propensity-Score Matching EstimationsDependent variable (first-stage): Dummy for eponymous
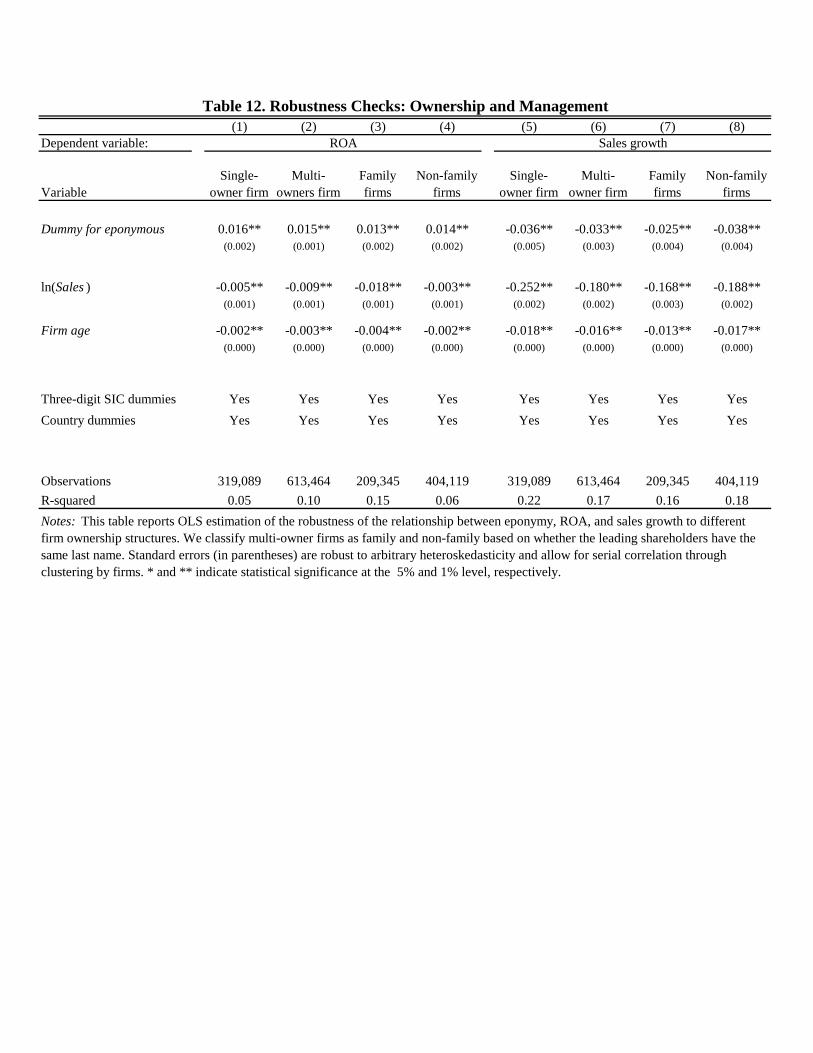
(1) (2) (3) (4) (5) (6) (7) (8)Dependent variable:
VariableSingle-
owner firmMulti-
owners firmFamily firms
Non-family firms
Single-owner firm
Multi-owner firm
Family firms
Non-family firms
Dummy for eponymous 0.016** 0.015** 0.013** 0.014** -0.036** -0.033** -0.025** -0.038**(0.002) (0.001) (0.002) (0.002) (0.005) (0.003) (0.004) (0.004)
ln(Sales ) -0.005** -0.009** -0.018** -0.003** -0.252** -0.180** -0.168** -0.188**(0.001) (0.001) (0.001) (0.001) (0.002) (0.002) (0.003) (0.002)
Firm age -0.002** -0.003** -0.004** -0.002** -0.018** -0.016** -0.013** -0.017**(0.000) (0.000) (0.000) (0.000) (0.000) (0.000) (0.000) (0.000)
Three-digit SIC dummies Yes Yes Yes Yes Yes Yes Yes YesCountry dummies Yes Yes Yes Yes Yes Yes Yes Yes
Observations 319,089 613,464 209,345 404,119 319,089 613,464 209,345 404,119R-squared 0.05 0.10 0.15 0.06 0.22 0.17 0.16 0.18
Table 12. Robustness Checks: Ownership and Management
Notes: This table reports OLS estimation of the robustness of the relationship between eponymy, ROA, and sales growth to different firm ownership structures. We classify multi-owner firms as family and non-family based on whether the leading shareholders have the same last name. Standard errors (in parentheses) are robust to arbitrary heteroskedasticity and allow for serial correlation through clustering by firms. * and ** indicate statistical significance at the 5% and 1% level, respectively.
ROA Sales growth
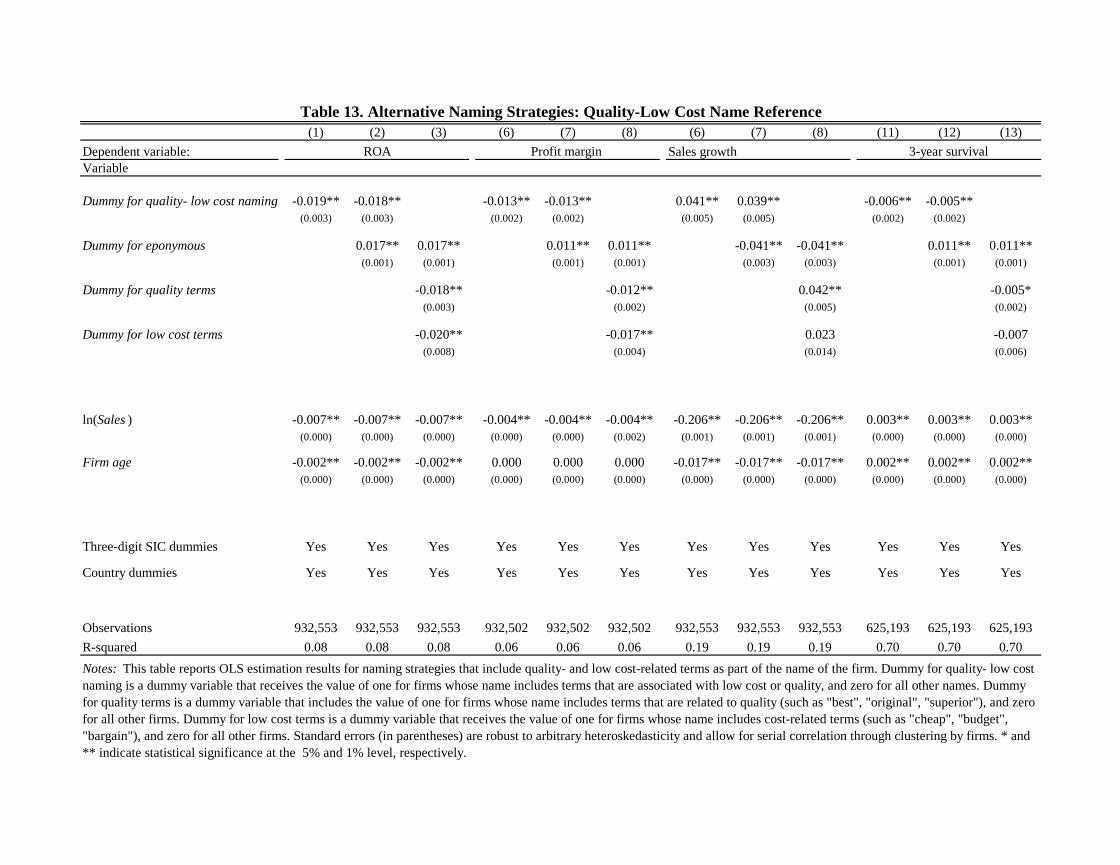
(1) (2) (3) (6) (7) (8) (6) (7) (8) (11) (12) (13)Dependent variable: Sales growthVariable
Dummy for quality- low cost naming -0.019** -0.018** -0.013** -0.013** 0.041** 0.039** -0.006** -0.005**(0.003) (0.003) (0.002) (0.002) (0.005) (0.005) (0.002) (0.002)
Dummy for eponymous 0.017** 0.017** 0.011** 0.011** -0.041** -0.041** 0.011** 0.011**(0.001) (0.001) (0.001) (0.001) (0.003) (0.003) (0.001) (0.001)
Dummy for quality terms -0.018** -0.012** 0.042** -0.005*(0.003) (0.002) (0.005) (0.002)
Dummy for low cost terms -0.020** -0.017** 0.023 -0.007(0.008) (0.004) (0.014) (0.006)
ln(Sales ) -0.007** -0.007** -0.007** -0.004** -0.004** -0.004** -0.206** -0.206** -0.206** 0.003** 0.003** 0.003**(0.000) (0.000) (0.000) (0.000) (0.000) (0.002) (0.001) (0.001) (0.001) (0.000) (0.000) (0.000)
Firm age -0.002** -0.002** -0.002** 0.000 0.000 0.000 -0.017** -0.017** -0.017** 0.002** 0.002** 0.002**(0.000) (0.000) (0.000) (0.000) (0.000) (0.000) (0.000) (0.000) (0.000) (0.000) (0.000) (0.000)
Three-digit SIC dummies Yes Yes Yes Yes Yes Yes Yes Yes Yes Yes Yes Yes
Country dummies Yes Yes Yes Yes Yes Yes Yes Yes Yes Yes Yes Yes
Observations 932,553 932,553 932,553 932,502 932,502 932,502 932,553 932,553 932,553 625,193 625,193 625,193R-squared 0.08 0.08 0.08 0.06 0.06 0.06 0.19 0.19 0.19 0.70 0.70 0.70
ROA Profit margin 3-year survival
Notes: This table reports OLS estimation results for naming strategies that include quality- and low cost-related terms as part of the name of the firm. Dummy for quality- low cost naming is a dummy variable that receives the value of one for firms whose name includes terms that are associated with low cost or quality, and zero for all other names. Dummy for quality terms is a dummy variable that includes the value of one for firms whose name includes terms that are related to quality (such as "best", "original", "superior"), and zero for all other firms. Dummy for low cost terms is a dummy variable that receives the value of one for firms whose name includes cost-related terms (such as "cheap", "budget", "bargain"), and zero for all other firms. Standard errors (in parentheses) are robust to arbitrary heteroskedasticity and allow for serial correlation through clustering by firms. * and ** indicate statistical significance at the 5% and 1% level, respectively.
Table 13. Alternative Naming Strategies: Quality-Low Cost Name Reference