Embed Size (px)
Citation preview

1
EPR, optical absorption and photoluminescence properties of MnO2 doped 23B2O3-5ZnO-72Bi2O3 glasses
Shiv Prakash Singha, R. P. S. Chakradhara, J. L. Raob, Basudeb Karmakara*
a Glass Technology Laboratory, Glass Division,
Central Glass and Ceramic Research Institute (CSIR), Kolkata-700031, India b Department of Physics, Sri Venkateswara University, Tirupati- 517 502, India.
_____________________________________________________________ Abstract
Electron paramagnetic resonance (EPR), Transmission electron microscopy
(TEM), optical absorption and photoluminescence (PL) spectroscopic measurements are
performed on Mn2+ doped high bismuth containing zinc-bismuth-borate glasses. TEM
images reveal homogeneously dispersed Bio nanopoarticles (NPs) of spherical shape with
size about to 5 nm. EPR spectra exhibit predominant signals at g 2.0 and g 4.3 with a
sextet hyperfine structure. The resonance signal at g 2.0 is due to Mn2+ ions in an
environment close to octahedral symmetry; where as the resonance at g 4.3 is attributed
to the rhombic surroundings of the Mn2+ ions. The hyperfine splitting constant (A)
indicates that Mn2+ ions in these glasses are moderately covalent in nature. The zero-
field splitting parameter D has been calculated from the allowed hyperfine lines. The
optical absorption spectrum exhibits a single broad band centered around 518 nm (19305
cm-1) was assigned to the 6Alg(S) 4Tlg(G) transition of Mn2+ ions. The visible and near
infrared (NIR) luminescence bands at 548, 652 nm, and 804 nm has been observed when
excited at 400 and 530 nm respectively. These luminescence centers are supposed to be
caused by the lower valence state of bismuth, such as Bi2+ and Bi+ ions, generated during
melting process.
Keywords: Glasses; Mn2+ ions; EPR; TEM; Optical absorption; Photoluminescence
* Corresponding author. Tel.: +91 33 2473 3496; fax: +91 33 2473 0957.
E-mail address: [email protected]

2
1. Introduction Now-a-days, heavy metal oxide (HMO) based glasses such as bismuth oxide
based glasses have attracted the scientific community due to its important applications of
thermal and mechanical sensors, reflecting windows, glass ceramics etc. [1-4]. Bi2O3
possess high refractive index, and exhibit high optical basicity, large polarizibilty and
large optical susceptibility values [5-7] which make them ideal candidates for
applications as infrared transmission components, ultra fast optical switches, and
photonic devices. Moreover, the HMO such as lead or bismuth oxide containing glasses
shows extremely high radioactive resistance because of their high density and atomic
number. Bismuth oxide alone cannot be considered as network former due to small field
strength (z/a2 = 0.53, where z = formal valency and a = internuclear distance) of Bi3+ ion
[8]. However, in combination with other glass formers, the glass formation is possible in
a relatively larger composition range [9].
As a part of our programme on bismuth borate glasses, the authors are
interested to prepare high bismuth containing zinc-bismuth-borate glasses. Zinc oxide
based glasses/ceramics have special applications in the area of varistors, dielectric layers
and transparent dielectric and barrier ribs in plasma display panels [10, 11]. We have
undertaken the present work to analyze the influence of MnO2 on the structure and
optical properties of the zinc bismuth borate glasses. Among all the transition metal ions,
manganese (Mn) ion is particularly interesting because it exists in different valence states
in different glass matrices [12-15]. With the composition of the glass, the local
environment of the transition metal (TM) ion incorporated into the glass network can be
3
changed, leading to local ligand field in homogeneities. The study of such glasses with
various spectroscopic techniques will give valuable information on these systems.
2. Experimental
The starting chemicals used in the present study were bismuth trioxide, Bi2O3
(Loba Chemie), boric acid, H3BO3 (Loba Chemie), zinc oxide, ZnO (Loba Chemie) and
manganese dioxide, MnO2 (Loba Chemie) as raw materials to prepare glasses. The glass
of 25 g batch with composition wt % 23B2O3-5ZnO-72Bi2O3-xMnO2 (where x = 0,
0.0012, 0.003 and 0.0058 atom % in excess) were melted in a 60 ml platinum crucible at
1150oC in air for 30 min. with intermittent stirring for 0.5 min. in the electrical furnace.
The molten glass was casted onto a carbon plate and annealed at 420oC for 2h to release
the internal stresses. The samples are identified as (a), (b), (c), and (d) with the value of x
= 0, 0.0012, 0.003 and 0.0058 atom % respectively. The samples of about 2 0.01 mm
thickness were prepared by cutting, grinding and polishing for optical measurements.
The Transmission Electron Microscopy (TEM) and Selected Area Electron
Diffraction (SAED) images were taken using a FEI instrument (Tehnai-30, ST G2)
operating at an accelerating voltage of 300 kV. The EPR spectra were recorded on a EPR
spectrometer (JEOL-FE-1X) operating at the X-band frequency ( 9.200 GHz) with a
fields modulation frequency of 100 kHz. The magnetic field was scanned from 0 to 500
mT and the microwave power used was 5 mW. A powdered glass sample of 100 mg was
taken in a quartz tube for EPR measurements. The UV-Vis absorption spectra in the
range of 400-1100 nm were recorded using a double beam UV-visible spectrophotometer
(Lambda 20, Perkin-Elmer) at an error of +0.1 nm. The fluorescence spectra were
4
measured at an error of +0.2 nm with a fluorescence spectrophotometer (Fluorolog 2,
Spex) using a 150 W Xe lamp as the excitation source and a photomultiplier tube (PMT)
as detector. The excitation slit (1.25 mm) and emission slit (0.5 mm) were kept uniform
for luminescence measurement of all the samples.
3. Results and discussion 3.1 Transmission Electron Microscopy studies
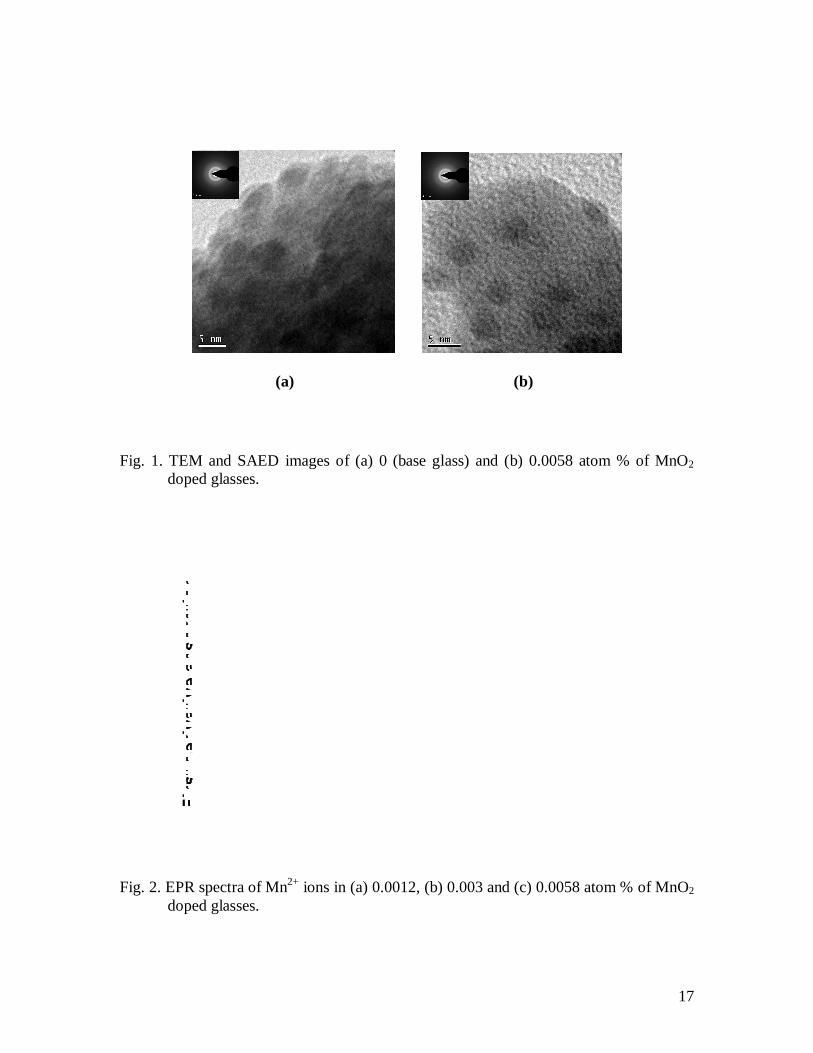
The TEM images of samples (a) and (d) are shown in the Fig 1. It clearly reveals
homogeneously dispersed Bio nanoparticles (NPs) of spherical shape with size about to
5 nm. The particle size of the Bio NPs in base glass (sample a) and MnO2 doped glass
(sample d) show similar size (about 5 nm). But the sample (d) showing less dense than
the sample (a) because it restricted the further formation of bismuth NPs effectively due
to MnO2 has higher reduction potential Mn4+/Mn2+ (Eo = 1.224 V) than that of Bi3+/Bio
(Eo = 0.308 V) [16]. Therefore, MnO2 doped glass has not shown densely embedded
bismuth NPs. The SAED images of the samples (a) and (d) in Fig. 1 have not shown any
distinct spots. This indicates that the particle sizes are very small.
3.2 Electron Paramagnetic Resonance studies
Fig. 2 shows the EPR spectra of 23B2O3-5ZnO-72Bi2O3-xMnO2 (where, x =
0.0012, 0.003 and 0.0058 atom %, in excess) glass samples at room temperature. All the
samples exhibit two resonance signals at g ≈ 2.0 and g ≈ 4.3. Interestingly, the resonance
signals observed at g ≈ 2.0 and g ≈ 4.3 show predominant six line hyperfine structure
(hfs) due to interaction of electron spin (S = 5/2) of Mn2+ ions with nuclear spin I = 5/2.
5
The EPR spectrum of powder sample was analyzed in order to obtain spin-Hamiltonian
parameters. The following spin-Hamiltonian has been taken into account [17].
H = ßB.g.S + D [Sz2
– {S (S+1) / 3}] + I.A.S (1)
where the first term represents the electronic Zeeman term, second term
characterize the zero-field splitting of the sextet ground state and the third term represents
the hyperfine interaction.
In oxide glasses, the hyperfine structure at g ≈ 4.3 resonance was detected only in
a few cases [18-20]. In binary borate glasses, it has been reported that only g ≈ 2.0
resonance was well resolved whereas the resonance at g ≈ 4.3 is less intense and is not
resolved [21-24]. In these glasses, B2O3 is glass former which allows the Mn2+ to enter in
the matrix mostly in high symmetry sites there by showing only g ≈ 2.0 resonance.
In case of d5 metal ions, it is known that the axial distortion of octahedral
symmetry gives rise to three Kramers doublets│± 5/2 >, │± 3/2 > and│± 1/2 > [17]. An
application of Zeeman field will split the spin degeneracy of the Kramers doublets. As
the crystal field splitting is normally much greater than the Zeeman field, the resonances
observed are due to transitions within the Kramers doublets split by the Zeeman field.
The resonance at g = 4.3 are attributed to the rhombic surroundings of the Mn2+ ions and
arise from transitions between the energy levels of the middle Kramers doublet│± 3/2 >.
The resonance at g ≈ 2.0 is due to Mn2+ ions in an environment close to an octahedral
symmetry and is known to arise from the transition between the energy levels of the
lower doublet│± 1/2>.
6
In the present study, we have prepared zinc bismuth borate glasses which impose
much more complicated structure compared to binary borate glasses thereby the Mn2+
ions structures its vicinity in a constrained space subjected to closer impact with the
neighbors. The manganese ions entering in the glass matrix revealed isolated ions
ordering their vicinity in regular configuration in distorted sites subjected to high crystal
field effects, giving g ≈ 4.3 resonance signals. These sites are ordered well enough to
allow the hyperfine structure good resolution. In addition, the less ordered configurations
of Mn2+ ion vicinity also revealed the sites with g ≈ 2.0 resonance signals. The high
degree of ordering in the Mn2+ ions neighborhood is attested by the good resolution of the
hyperfine structure observed at g ≈ 4.3 resonance signals.
The ability to observe the 55Mn hyperfine structure has two tangible benefits. (1)
It generally allows unambiguous assignments of positions of complex resonance lines to
manganese; (2) the magnitude of hyperfine splitting constant provides a measure of
bonding between Mn2+ ion and its surrounding ligands [25, 26]. Their relative intensity
varies with the glass structure and composition.
The values of hyperfine splitting constant, A, were determined from the average
value of hyperfine splitting of successive allowed hyperfine lines of the central sextet
observed for g ≈ 4.3 and g ≈ 2.0 resonances. It is apparent from different average values
of A measured from peak to peak (App) and trough to trough (Att), that the individual lines
are strain broadened, leading to an asymmetry in the absorption spectrum [27]. The first
derivative spectrum as a consequence, shows larger values of A, when measured trough
to trough, rather than peak to peak. An overall average was calculated for both g 2.0
and g 4.3 resonances from

7
Aavg = [ (Opp+ Ott ) / 5 + (Mpp+ Mtt ) / 3 + (Ipp+ Itt ) ] / 6 (2)
where Opp and Ott represent the differences between the first and sixth peak positions,
measured peak to peak and trough to trough respectively. Mpp and Mtt represents
difference in positions between second and fifth peaks and Ipp and Itt between second
and third peaks respectively. It is interesting to note that, in all the samples, Opp /5
Mpp /3 Ipp and Ott / 5 Mtt / 3 Itt .
The strength of the hyperfine splitting (A) depends on the matrix into which the
ion is dissolved and is mainly determined by the electronegativity of the neighbours. This
means a qualitative measure of the covalency of the bonding in the matrix which can be
determined from the value of A; the smaller the splitting, the more covalent the bonding
of the anion. The hyperfine splitting (A) evaluated for the resonance signals at g ≈ 4.3 and
g ≈ 2.0 with composition is given in parenthesis. For g ≈ 4.3 resonance, the hyperfine
splitting (A) for 0.0012 atom % of Mn (85 G), 0.003 atom % of Mn (83 G), 0.0058 atom
% of Mn (81 G); for the resonance signal at g ≈ 2.0, the hyperfine splitting (A) for 0.0012
atom % of Mn (84 G), 0.003 atom % of Mn (90 G), 0.0058 atom % of Mn (91 G). It is
interesting to find that, the hyperfine splitting constant (A) for the resonance signal at g ≈
4.3 decreases from 85 to 81 gauss with increase of Mn content whereas for g ≈ 2.0
resonance signal it has increased from 84 G to 91 G which in turn reflect that there is an
increase of covalence character with Mn doping around g = 4.3 and decrease of
covalence character around g = 2.0. These changes are due to ligand field fluctuations
around Mn ions, which are strongly dependent on the composition. The magnitude of the
hyperfine splitting constant (A) in the present study indicates that there exists a
moderately covalent bonding between Mn2+ ions and the surrounding ligands.
8
3.3 Calculation of the zero-field splitting parameter (D) from EPR spectra
The intensity of hyperfine lines can be used to calculate the zero-field splitting
parameter (D) from the ratio of allowed hyperfine lines (corresponding to the selection
rule mI = 0) using the formula [28].
mI 2
4
224
2
22
2
2
2
22 43520843514.35334.52
435Hg
mDHg
mDHg
DHg
mA
(3)
where m is the nuclear spin magnetic quantum number, Im is the intensity of the mth
allowed hyperfine (HF) line, A is the HF splitting constant, D is the zero-field splitting
parameter and the rest of the symbols have their usual meaning.
The authors have calculated D values for 23B2O3-5ZnO-72Bi2O3-xMnO2 (where, x
= 0.0012, 0.003 and 0.0058 atom %, in excess) glass samples at room temperature from
the ratio of 5/2 5/2 hyperfine line intensity to that of the 3/2 3/2 hyperfine line for
the resonance signal at g ≈ 2.0. It is observed that the D values are found to decrease from
270 G, 246 G and 234 G when the concentration of manganese increases from (0.0012,
0.003 and 0.0058 atom % respectively. The D values obtained from the ratio of the
allowed hyperfine line intensities is of the same order for as the D values of Mn2+ ions
reported in literature [28,29].
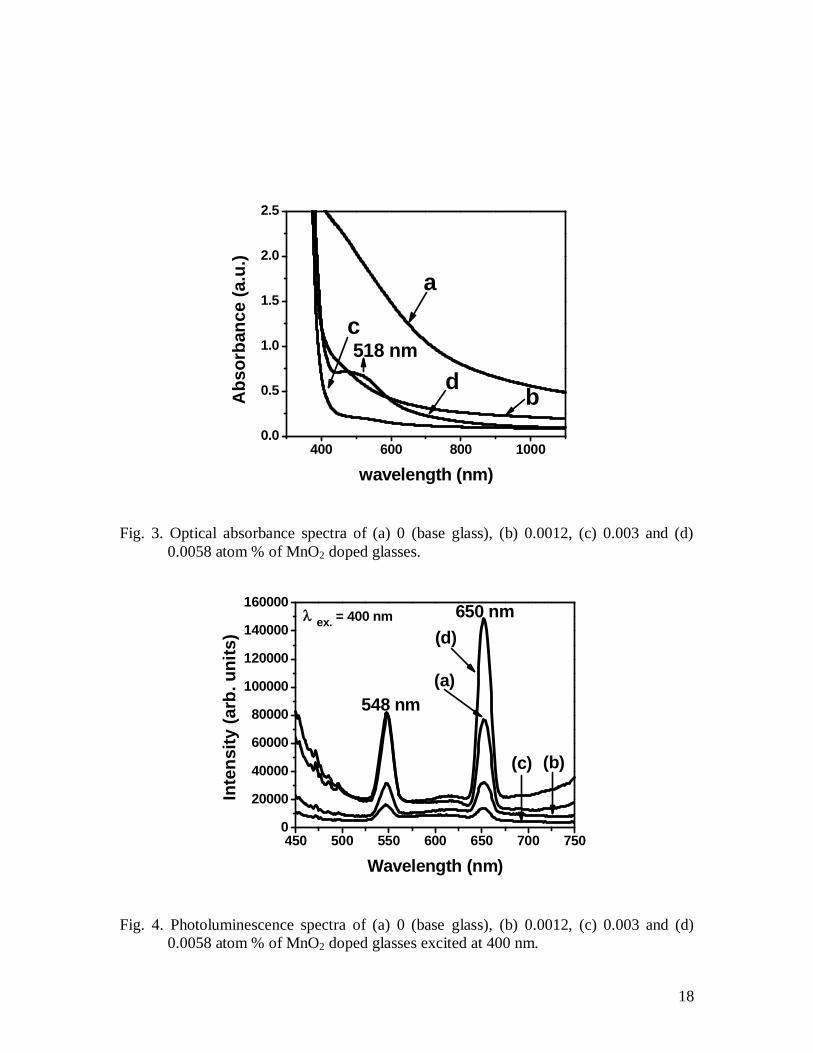
3.4. UV-VIS-NIR Absorption Studies The color of the as prepared glass changes gradually as MnO2 concentration
increases in the glass. The as prepared base glass which is deep black in color, after
addition of 0.0012, 0.003 and 0.0058 atom % of MnO2 the glass color changes to brown,
light brown and brick red respectively. The measured UV–Vis optical spectra of the
undoped and 0.0012, 0.003 and 0.0058 atom % of MnO2 doped in 23B2O3-5ZnO-
9
72Bi2O3 (wt. %) glasses reveal spectral changes. The undoped 23B2O3-5ZnO-72Bi2O3
(wt. %) glass system and low content (0.0012 atom %) of MnO2 doped glass has not
shown any absorption peaks from 400–1100 nm (Fig. 3). But a weak absorption band at
518 nm begins to appear when MnO2 concentration is 0.003 atom %. The glass doped
with 0.0058 atom % of MnO2 reveals (Fig. 3) distinct visible broad absorption at about
518 nm (19305 cm-1). This band is assigned to the 6A1g(S)4T1g(G) transition of Mn2+
ions [30]. The Mn2+ ion has a ground state of 6A1g in octahedral symmetry, which is
lowest according to Hund’s rule. Since all the excited states of the Mn2+ ion (d5
configuration) will be either quartets or doublets, the optical absorption spectra of Mn2+
ions will have only spin forbidden transitions. On progressively increase in concentration
of MnO2, the broad absorption bands gradually form and prominently distinct at 0.0058
atom % concentration. From EPR and optical absorption studies it is evident that the
manganese ions in these glasses are in 2+ valence states. Mn2+ ions are generated from
MnO2 through a redox reaction with Bi2+ and Bi+ originated from Bi2O3 at the melting
temperature of glass (as discussed in later section) as follows:
Mn4+ + 2Bi2+ → Mn2+ + 2Bi3+ (4)
Mn4+ + Bi+ → Mn2+ + Bi3+ (5)
Since the glasses (b), (c) and (d) containing low concentration of MnO2 do not import
blackening due to Bio formation (as in earlier discussion) and exhibit comparatively more
transparency than that of base glass (0 atom % of MnO2). This fact is also evidenced
from transmission electron microscopy (TEM) shown in Fig. 1. Therefore, addition of

10
MnO2 is found effective for removing blackening or browning color of high bismuth
glasses.
3.5 Photoluminescence studies
During the melting process the Bi3+ ion of Bi2O3 molecule disproportionate to its
lower valence state by auto thermal reduction as follow [31, 32]
Bi3+ Bi2+ Bi+ Bio (6)
Therefore, in the bismuth glass, various valence states of Bi ions may be present.
The photoluminescence measurement was carried out for base glass (sample a) and MnO2
doped glasses (samples b, c and d). Three emission peaks were observed at 548, 650 nm,
and at 804 nm when excited at 400 and 530 nm respectively. Zhou et al. [33] explained
the various energy levels of Bi ions such as Bi3+, Bi2+ and Bi+. In the present study, the
observed emission bands are attributed to Bi2+ and Bi+ ions by considering the energy
matching condition with the Zhou et al. [33]. In Bi2+ ion a single electron is available in
the outer 6p orbital and it is split by spin orbit coupling interaction into 2P1/2 and 2P3/2 in
order of increasing energy. According to the energy level diagram proposed by Zhou
et al. [33], the energy level at 2P3/2 is further split into two crystal field terms; i.e., 2P3/2
(1) and 2P3/2 (2). The excitation at 400 nm is attributed to 2P1/2 → 2P3/2 (2) transition. The
emission bands at 548 nm can be ascribed to 2P3/2 (1) → 2P1/2 transition. The red emission
band at 650 nm can also be attributed to Bi2+ ion as Hamstra et al. [34] have found Bi2+
emission band at 625 nm in alkaline-earth-metal sulphates.

11
The ground state configuration of Bi+ (6s26p2) is split by spin-orbit coupling
interaction into the ground state 3P0 and the excited states 1S0, 1D2 and 3P2. When the
sample is excited at 530 nm, which arises due to 3P0 → 1S0 transition, an emission band
observed in the infrared region at 804 nm. According to energy level diagram of Zhou
et al. [33] and Meng et al. [35] this emission band is attributed to 3P2 → 3P0 transition
based on the energy matching conditions.
The intensity of the peak at 650 nm and 548 nm in Fig. 4 decreases with increase
in MnO2 concentration from 0.0012 to 0.003 atom %. But, intensity increases in 0.0058
atom % of MnO2 doped glass of sample (d). The intensity of the both the peaks (548 and
650 nm) is almost same for samples (a), (b) and (c) but in case of the sample (d), the
emission peak at 548 nm shows less intensity than that of 650 nm peak. This happened
because the sample (d) shows an absorption peak at 518 nm for which the intensity might
be decreased due to the absorption of energy by the active ion center. The intensity of the
peak at 804 nm in Fig. 5 increases with the increase in concentration of MnO2 up to 0.003
atom %. But it decreases with the maximum concentration (0.0058 atom % of MnO2).
This may be due to strong absorption band appeared at 518 nm of Mn2+ ions by the
sample (d), indicating that the excitation energy losses due to absorption of the energy by
the Mn2+ ion.
4. Conclusions The TEM images of the investigated samples reveal the formation of Bi
nanometals in the glass. The EPR spectra exhibits sextet hyperfine structure (hfs)
centered at g 2.0 and g 4.3. The resonance signal at g 2.0 is due to Mn2+ ions in an
environment close to octahedral symmetry, whereas the resonances at g 4.3 are
12
attributed to the rhombic surroundings of the Mn2+ ions. The UV-Vis absorption spectra
show a characteristic absorption band of Mn2+ at 518 nm which is due to
6A1g(S)4T1g(G) transition. When the glass samples were excited at 400 nm, the
photoluminescence centered at 548 and 650 nm was observed which may be due to Bi2+
ion. The intensity of the emission peaks is gradually decreases with the increase of MnO2
concentration up to 0.003 atom % but the intensity increases at highest concentration
(0.0058 atom %). The luminescence centered at 804 nm was observed when excited at
530 nm, which may be attributed to Bi+ ion. The intensity of the Bi+ emission band
increases up to 0.003 atom % concentration of MnO2 and with further addition of MnO2
(0.0058 atom %) in the glass matrix its intensity decreases. This indicates that the
addition of MnO2 affects the luminescence properties due to redox reaction with the
various valence states of bismuth ions.
Acknowledgements
The authors gratefully acknowledge the financial support of NMITLI, CSIR, New
Delhi. They gratefully thank Dr. H. S. Maiti, Director of the institute for his keen interest
and kind permission to publish this paper. The technical support provided for TEM by the
Electron Microscope Division of this Institute is also thankfully acknowledged.
13
References [1] C. Stehle, C Vira, D. Vira, D. Hogan, S. Feller, M. Affatigato, Phys. Chem. Glasses
39 (1998) 83.
[2] R. Luciana, P. Kassab, H. Sonia Tatumi, C.M.S. Mendes, Lilia C. Courrol, Niklaus U.
Wetter, Opt. Express 6 (2000) 104.
[3] Y. Cheng, H. Xiao, W. Guo, Mater. Sci. Eng. A 480 (2008) 56.
[4] A.A. Ali, M.H. Shaaban, Physica B 403 (2008) 2461.
[5] V. Dimitrov, T. Komatsu, J. Non-Cryst. Solids 249 (1999) 160.
[6] S. Sindhu, S. Sanghi, A. Agarwal, V.P. Seth, N. Kishore, Mater. Chem. Phys. 90
(2005) 83.
[7] X. Zhao, X. Wang, H. Lin, Z. Wang, Phisica B, 390 (2007) 293.
[8] M. B. Volf, Chemical Approach to Glass, Elsevier, Amsterdam,1984, p.118.
[9] K. Gerth, C. Russel, J. Non-Cryst. Solids 221 (1997) 10.
[10] A. Lagrange, in B. C. H. Steele (Ed.), Electronic Ceramics : Present and Future of
Zinc Oxide Varistors, Elsevier, Cambridge, 1991. p.1.
[11] M. Busio, O Steigelmann, Glastech. Ber. Glass Sci. Technol. 73 (2000) 319.
[12] J.D. Lee, Concise Inorganic Chemistry, Blackwell Scientific, Oxford, 1996.
[13] A. Van Die, A. C. H. I. Leenaers, G. Blasse,W.F. Van Der Weg, J. Non-Cryst.
Solids 99 (1988) 32.
[14] A. V. Ziel, Solid State Physical Electronics, Prentice-Hall of India, New Delhi,
1971.
[15] A. Margaryan, A. Margaryan, J. H. Choi, F. G. Shi, Appl. Phys. B 78 (2004) 409.
14
[16] A. P. Vanýsek, Electrochemical Series, CRC Hand Book of Chemistry and Physics,
Edited by D. R. Lide, CRC Press, London,1994, p. 22.
[17] A. Abragam and B. Bleaney, Electron Paramagnetic Resonance of Transition Ions,
Oxford, Clarendon, 1970.
[18] D. Toloman, L. M. Giurgiu, I. Ardelean, Physica B (2009),
doi:10.1016/j.physb.2009.07.187 (in press).
[19] J. W. H. Shreurs, J. Chem. Phys. 69 (1978) 2151.
[20] I. Ardelean, M. Peteanu, Gh. Ilonca, phys. status solidi A 58 (1986) 433.
[21] D. L. Griscom, R. E. Griscom, J. Chem. Phys. 47 (1967) 2711.
[22] P. C. Taylor, P. J. Bray, J. Phys. Chem. Solids 33 (1972) 43.
[23] I. Ardelean, Gh. Ilonca, M. Peteanu, Solid State Commun. 52 (1984) 147.
[24] I. Ardelean, M. Flora, J. Mater. Sci.: Mater. in Electronics 13 (2002) 357.
[25] J. S. Van Wieringen, Discuss. Faraday Soc. 19 (1955) 118.
[26] F. D. Tsay and L. Helmholz, J. Chem. Phys. 50 (1969) 2642.
[27] J. R. Pilbrow, Bull.Magn. Reson. 9 (1987) 32.
[28] B. T. Allen, J. Chem. Phys., 43 (1965) 3820.
[29] R. Dayal, D. Ramachandra Rao and P. Venkateswarlu, Can. J. Phys. 56 (1978)
1175.
[30] H. Togashi, N. Kojima, T. Ban, I. Tsujikawa, Bull. Chem. Soc. Jpn. 61 (1988) 1903.
[31] O. Sanz, E. Haro-Poniatowski, J. Gonzalo, J. M. Fernández Navarro. J. Non-Cryst.
Solids 352 (2006) 761.
[32] Y. Zhang, Y. Yang, J. Zheng, W. Hua, G. Chen, J. Am. Ceram. Soc. 91 (2008) 3410.

15
[33] S. Zhou, N. Jiang, B. Zhu, H. Yang, S. Ye, G. Laksminarayana, J. Hao, J. Qiu,
Adv. Funct. Mater. 18 (2008) 1407.
[34] M. A. Hamstra, H. F. Folkerts, G. Blasse, J. Mater. Chem. 4 (1994) 1349.
[35] X. G. Meng, J. R.. Qiu, M. Y. Peng, D. P. Chen, Q. Z. Zhao, X. W. Jiang, C. S. Zhu,
Opt. Express 13 (2005) 1635.

16
Figure Captions
Fig. 1. TEM and SAED images of (a) 0 (base glass) and (b) 0.0058 atom % of MnO2
doped glasses.
Fig. 2. EPR spectra of Mn2+ ions in (a) 0.0012, (b) 0.003 and (c) 0.0058 atom % of MnO2
doped glasses.
Fig. 3. Optical absorbance spectra of (a) 0 (base glass), (b) 0.0012, (c) 0.003 and (d)
0.0058 atom % of MnO2 doped glasses.
Fig. 4. Photoluminescence spectra of (a) 0 (base glass), (b) 0.0012, (c) 0.003 and (d)
0.0058 atom % of MnO2 doped glasses excited at 400 nm.
Fig. 5. Photoluminescence spectra of (a) 0 (base glass), (b) 0.0012, (c) 0.003 and (d)
0.0058 atom % of MnO2 doped glasses excited at 530 nm.
17
(a) (b)
Fig. 1. TEM and SAED images of (a) 0 (base glass) and (b) 0.0058 atom % of MnO2
doped glasses.
Fig. 2. EPR spectra of Mn2+ ions in (a) 0.0012, (b) 0.003 and (c) 0.0058 atom % of MnO2
doped glasses.
18
400 600 800 10000.0
0.5
1.0
1.5
2.0
2.5
a
d
c
b
Abs
orba
nce
(a.u
.)
wavelength (nm)
518 nm
Fig. 3. Optical absorbance spectra of (a) 0 (base glass), (b) 0.0012, (c) 0.003 and (d) 0.0058 atom % of MnO2 doped glasses.
450 500 550 600 650 700 7500
20000
40000
60000
80000
100000
120000
140000
160000
(d)
(c) (b)
(a)
Inte
nsity
(arb
. uni
ts)
Wavelength (nm)
ex. = 400 nm
548 nm
650 nm
Fig. 4. Photoluminescence spectra of (a) 0 (base glass), (b) 0.0012, (c) 0.003 and (d) 0.0058 atom % of MnO2 doped glasses excited at 400 nm.

19
700 750 800 850 9000
5000
10000
15000
20000
25000
(a)(d) (c)
(b)
804 nmex. = 530 nm
Inte
nsity
(arb
. uni
ts)
wavelength (nm)
Fig. 5. Photoluminescence spectra of (a) 0 (base glass), (b) 0.0012, (c) 0.003 and (d)
0.0058 atom % of MnO2 doped glasses excited at 530 nm.