Embed Size (px)
Citation preview
Characterisation and modelling of diglycidyl ether of bisphenol-A epoxy cured with aliphatic liquid amines
Nicola T. Guest,1,2 David A. Tilbrook,1 Stephen L. Ogin,2 Paul A. Smith2
1Hexcel Composites, Ickleton Road, Duxford, Cambridge, Cambridgeshire, CB22 4QD, UK
2Department of Mechanical Engineering Sciences, University of Surrey, Guildford, Surrey, GU2 7XH, UK
Correspondence to: N. T. Guest (E-mail: [email protected])
ABSTRACT
The characterisation by DMA and compressive stress-strain behaviour of an epoxy resin cured with a number of liquid amines is studied in this work along with predictions of the associated properties using Group Interaction Modelling (GIM). A number of different methods are used to assign two of the input parameters for GIM, and the effect on the predictions investigated. Excellent predictions are made for the glass transition temperature, along with good predictions for the beta transition temperature and modulus for the majority of resins tested. Predictions for the compressive yield stress and strain are less accurate, due to a number of factors, but still show reasonable correlation with the experimental data.
KEYWORDS Group interaction modelling, Epoxy resins, Liquid amines, Dynamic mechanical analysis, Compressive stress-strain behaviour
INTRODUCTION
High performance polymer composites are used widely in the aerospace industry, even in
safety critical primary structures. At present, development methods for these materials rely on
a time consuming and costly process starting with the identification of raw materials and resin
formulation stages through to the qualification of the composite parts. With the ever increasing
demands being placed on this class of materials, it is desirable to have a deeper understanding
of the mechanical and viscoelastic properties of thermosets. Group Interaction Modelling (GIM)
has recently been identified as a useful tool to link the chemical structure to the macroscopic
1
material properties of thermoset matrices, and could, therefore, be useful to assist in the
development process for polymer composites.
Developed initially by Porter1 for linear amorphous thermoplastics, GIM has been extended2 to
predict the properties of highly cross-linked thermosets as a function of temperature and strain
rate. It uses a mean field approach to define a constitutive equation of state for an amorphous
polymer using multiple molecular input parameters, such as the cohesive energy, number of
degrees of freedom, van der Waals volume, chain stiffness, degree of conversion and activation
energy. Most of these parameters can be derived from group contribution tables published by
Porter1 or using molecular modelling techniques.
So far, published work2-15 on the validation of GIM has been completed on number of
thermoplastic and thermosetting polymers, with a significant amount of work being done on
multifunctional epoxy resins cured with aromatic amines. Of most notable of the papers dealing
with GIM predictions of thermoplastic polymers, was that by Porter and Gould,3 which
extended GIM to include relationships for the post-yield strain softening and hardening effects,
validated by experimental data on polycarbonate (PC) and polymethyl methacrylate (PMMA).
Work done on epoxy resins using the GIM methodology began with Gumen et al.7 which
focussed on predicting the glass transition temperatures of a range of epoxies containing
tetraglycidyl 4,4’ diaminodiphenylmethane (TGDDM), triglycidyl p-aminophenol (TGPAP), 4,4’
diaminodiphenylsulfone (4,4’-DDS) and dicyandiamide (DICY), which combine to form Hexcel’s
924 resin system. In this work, a number of different reaction mechanisms were theorised, with
the results highlighting that the accuracy of GIM predictions depends on good knowledge of the 2
reaction chemistry. Liu et al.8 used GIM to predict the glass transition temperature of nine
stoichiometric resins, namely TGDDM, TGPAP and DGEBA (diglycidyl ether of bisphenol-A)
cured with 4,4’-DDS, DEDTA (diethyltoluenediamine) and DMTDA
(dimethylthiotoluenediamine), along with four non-stoichiometric mixes of TGDDM and 4,4’-
DDS. Here the moieties of each epoxy/amine were calculated using a Monte Carlo simulation
before the percentage of each was used in the GIM predictions, with the results showing that a
difference in structure has a significant impact on the Tg predictions.
A significant amount of work has been carried out by Foreman et al.2,9-13 on the validation of
GIM for epoxy resins focussing on TGDDM, TGPAP and 4,4’-DDS. Foreman et al.2 extends
previous validation to include a wider range of properties including the stress-strain response,
glass and beta transitions, density and linear thermal expansion coefficient of TGDDM/4,4’-DDS,
giving predictions that are in excellent agreement with experimental data. This work was
extended,12 to predict a number of properties of TGDDM/4,4’-DDS and TGPAP/4,4’-DDS as a
function of strain rate and temperature, which show good agreement with experimental data.
Further work by Foreman et al.13 included predictions for the same resins as well as a 50:50
blend of both TGDDM and TGPAP cured with 4,4’-DDS. In this work the effect on yield stress
and modulus of changing from 4,4-DDS to 3,3-DDS, along with changing the central functional
group in a Bisphenol epoxy, is also investigated.
Work by Ersoy et al.14-15 further extends the work by Foreman et al.9-11 by using GIM predictions
for the stress-strain response of Hexcel 8552 resin in FEA models, to predict the modulus and
other properties of AS4/8552 composite, with good agreement against literature values.
3
This study extends the validation of GIM to a different range of network structures, dealing with
DGEBA, in the form of Epikote 828, cured with a number of aliphatic and cycloaliphatic liquid
amines in their ideal stoichiometric ratio (i.e. one mole of active hydrogen to one mole epoxy
ring). These liquid amines are Jeffamines D-230, D-400, T-403 and EDR-176, along with IPDA
(isophorone diamine), PACM (bis p-aminocyclohexyl methane) and a 50:50 mix by weight of
IPDA and TTD (4,7,10-trioxatridecane-1,13-diamine). In this work, experimental data
determined from dynamic mechanical analysis (DMA) and compressive stress-strain tests are
compared with the results from GIM predictions. An attempt is made to see if accurate
predictions using GIM for this group of resins can be made, based on simple assumptions of
network structure, without the need for more complex modelling, such as that employed by Liu
et al. 8 A significant part of this work is the characterisation and modelling of the sub-ambient
beta transition seen on the tan-delta DMA curves, and the assignment of an activation energy
which GIM uses to predict the peak value of this beta transition.
GROUP INTERACTION MODELLING
Theory
GIM uses the intermolecular energy of interaction between groups of atoms in adjacent
polymer chains as a basis for its predictions. It combines the Lennard-Jones potential function
for non-bonded chain interaction and a thermodynamic balance of the different energy
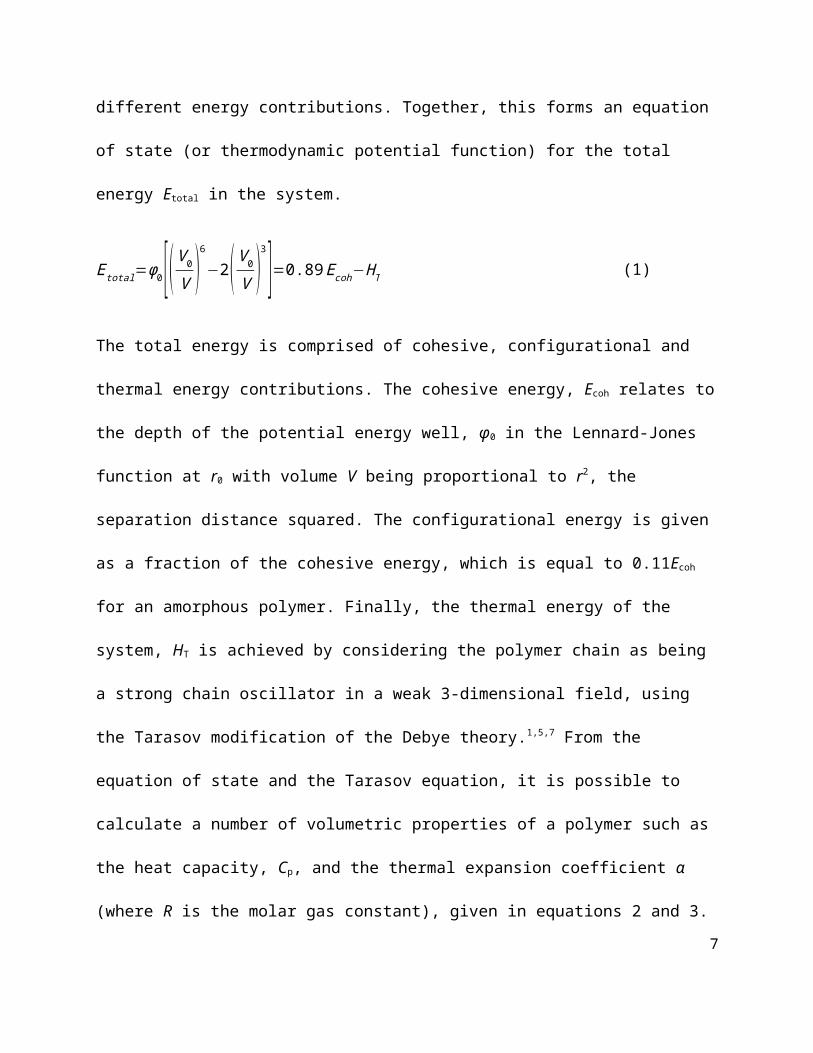
contributions. Together, this forms an equation of state (or thermodynamic potential function)
for the total energy Etotal in the system.
4
Etotal=ϕ0[(V 0
V )6
−2(V 0
V )3]=0.89Ecoh−HT (1)
The total energy is comprised of cohesive, configurational and thermal energy contributions.
The cohesive energy, Ecoh relates to the depth of the potential energy well, φ0 in the Lennard-
Jones function at r0 with volume V being proportional to r2, the separation distance squared.
The configurational energy is given as a fraction of the cohesive energy, which is equal to
0.11Ecoh for an amorphous polymer. Finally, the thermal energy of the system, HT is achieved by
considering the polymer chain as being a strong chain oscillator in a weak 3-dimensional field,
using the Tarasov modification of the Debye theory.1,5,7 From the equation of state and the
Tarasov equation, it is possible to calculate a number of volumetric properties of a polymer
such as the heat capacity, Cp, and the thermal expansion coefficient α (where R is the molar gas
constant), given in equations 2 and 3.
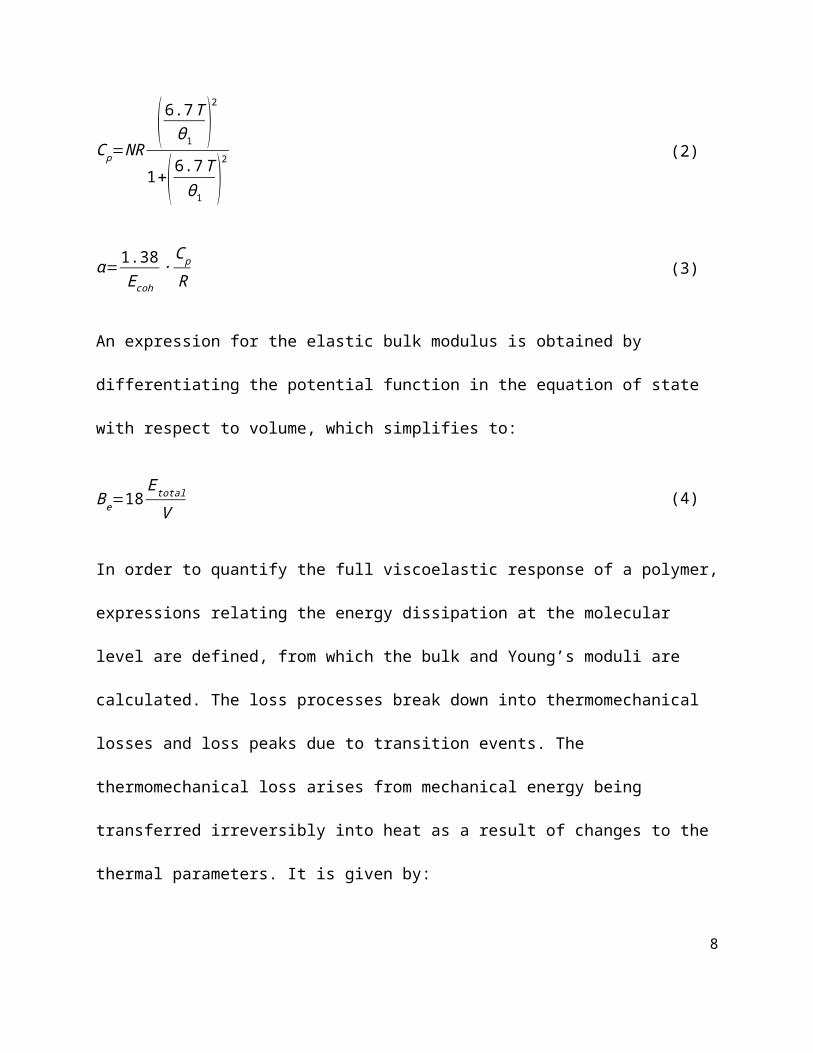
C p=NR(6.7Tθ1 )
2
1+( 6.7Tθ1 )2 (2)
α=1.38E coh
∙C p
R(3)
An expression for the elastic bulk modulus is obtained by differentiating the potential function
in the equation of state with respect to volume, which simplifies to:
Be=18E total
V(4)
5
In order to quantify the full viscoelastic response of a polymer, expressions relating the energy
dissipation at the molecular level are defined, from which the bulk and Young’s moduli are
calculated. The loss processes break down into thermomechanical losses and loss peaks due to
transition events. The thermomechanical loss arises from mechanical energy being transferred
irreversibly into heat as a result of changes to the thermal parameters. It is given by:
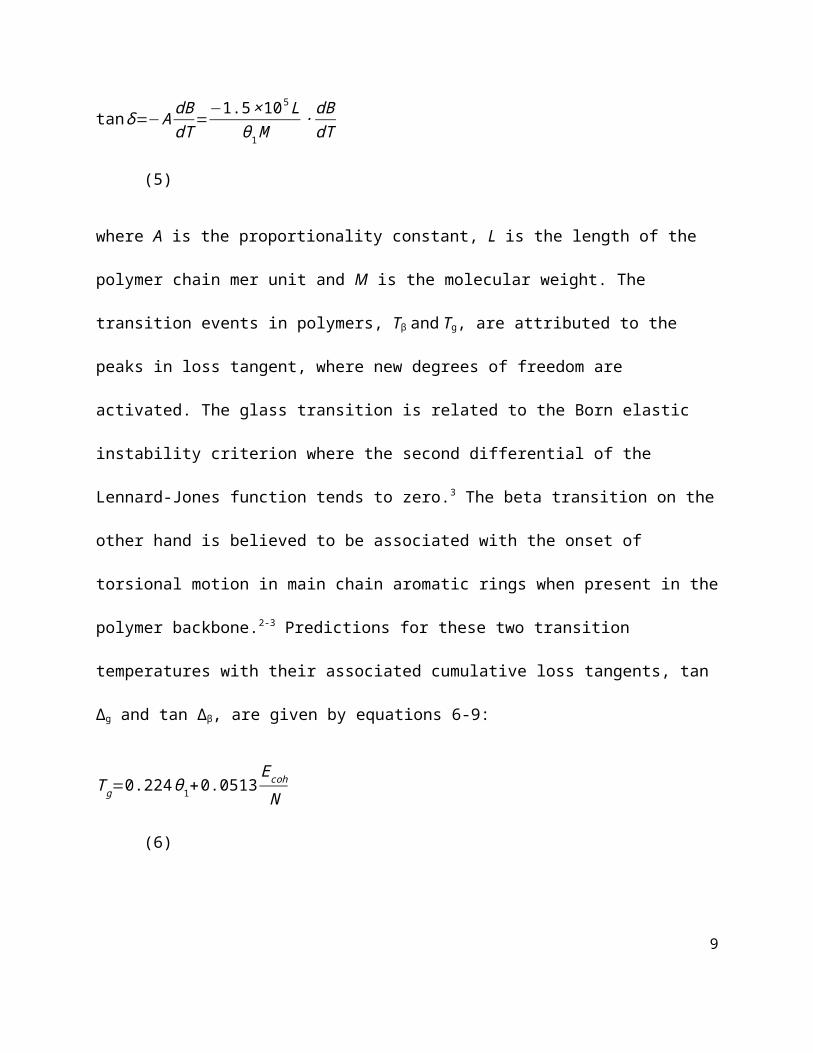
tan δ=−A dBdT
=−1.5×10⁵Lθ1M
∙ dBdT
(5)
where A is the proportionality constant, L is the length of the polymer chain mer unit and M is
the molecular weight. The transition events in polymers, Tβ and Tg, are attributed to the peaks
in loss tangent, where new degrees of freedom are activated. The glass transition is related to
the Born elastic instability criterion where the second differential of the Lennard-Jones function
tends to zero.3 The beta transition on the other hand is believed to be associated with the onset
of torsional motion in main chain aromatic rings when present in the polymer backbone.2-3
Predictions for these two transition temperatures with their associated cumulative loss
tangents, tan Δg and tan Δβ, are given by equations 6-9:
T g=0.224θ1+0.0513Ecoh
N(6)
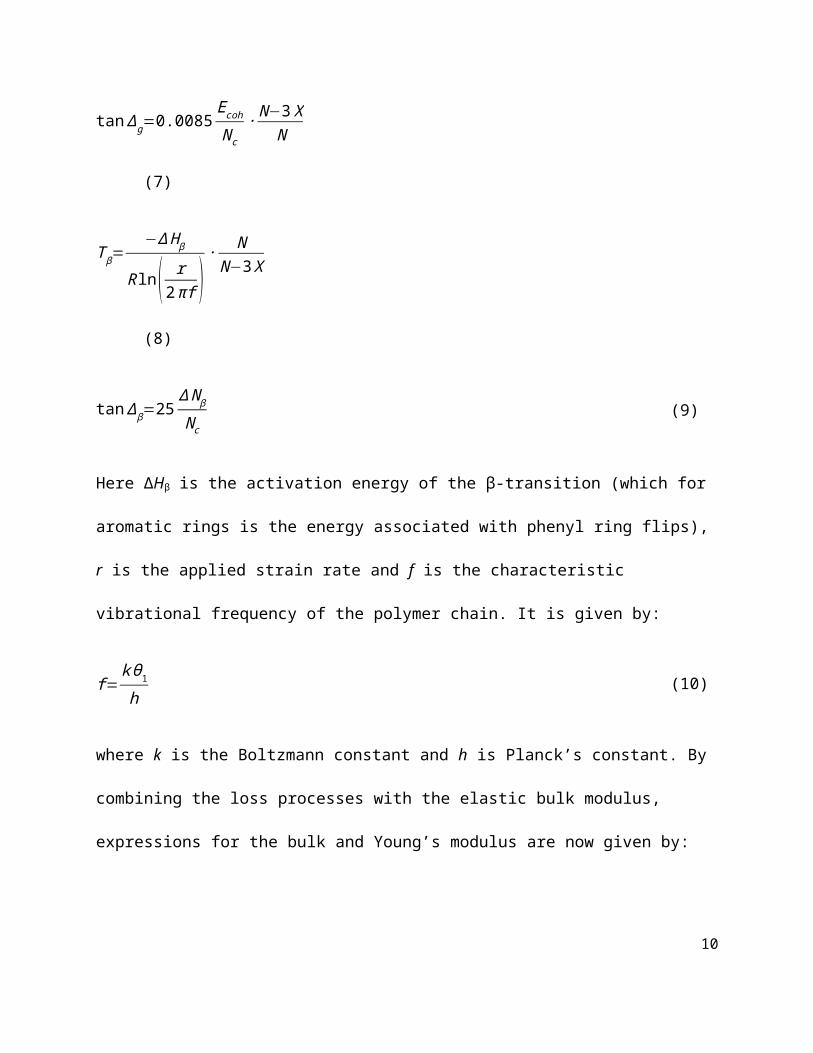
tan∆g=0.0085E coh
N c∙ N−3 X
N(7)
6
T β=−∆ Hβ
R ln( r2πf )
∙ NN−3 X
(8)
tan∆β=25∆ N β
N c(9)
Here ΔHβ is the activation energy of the β-transition (which for aromatic rings is the energy
associated with phenyl ring flips), r is the applied strain rate and f is the characteristic
vibrational frequency of the polymer chain. It is given by:
f=k θ1h
(10)
where k is the Boltzmann constant and h is Planck’s constant. By combining the loss processes
with the elastic bulk modulus, expressions for the bulk and Young’s modulus are now given by:
B=Be (1−∆ N β (T )N c
)(1−∆ N g (T )N ) (11)
Eβ=B e ∙exp (−∫0T
tan δ βdT
A ∙Be) (12)
E=Eβ
(1+∫0
T
tan δ gdT )2 (13)
7
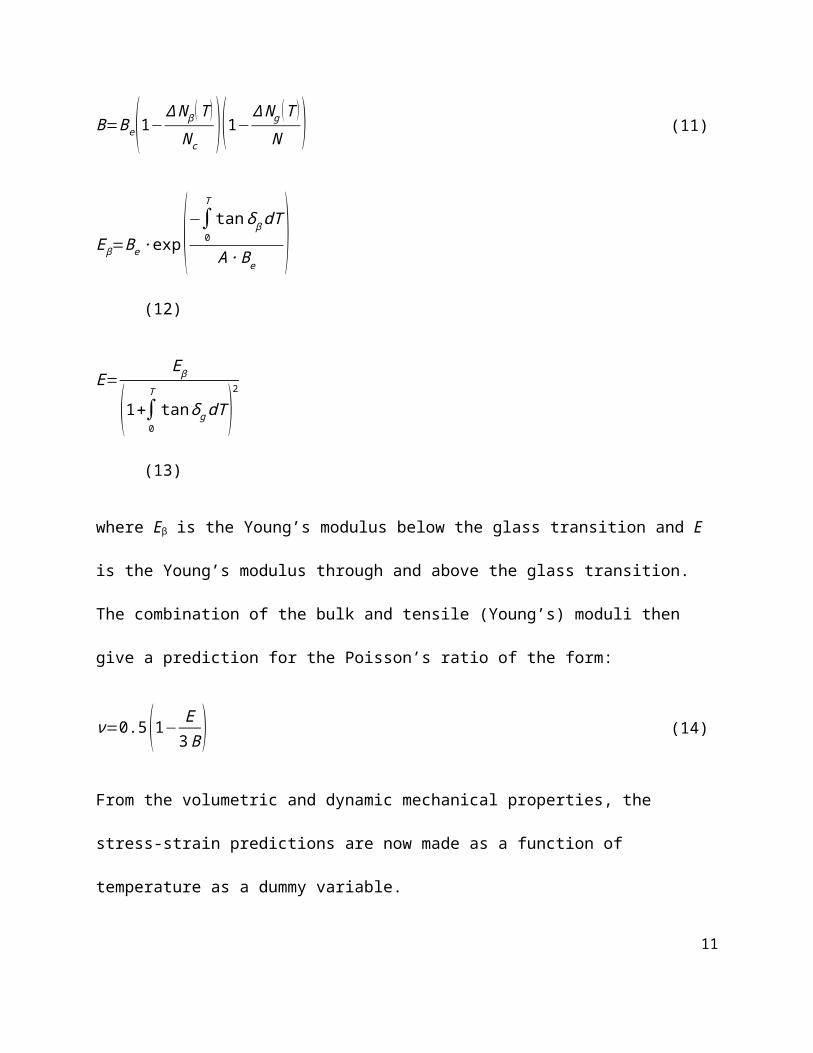
where Eβ is the Young’s modulus below the glass transition and E is the Young’s modulus
through and above the glass transition. The combination of the bulk and tensile (Young’s)
moduli then give a prediction for the Poisson’s ratio of the form:
ν=0.5(1− E3 B ) (14)
From the volumetric and dynamic mechanical properties, the stress-strain predictions are now
made as a function of temperature as a dummy variable.
ε=∫T0
T
α σdT (15)
σ t=∫T0
T
Eσα σdT (16)
σ c=σ t
2 νσ(17)
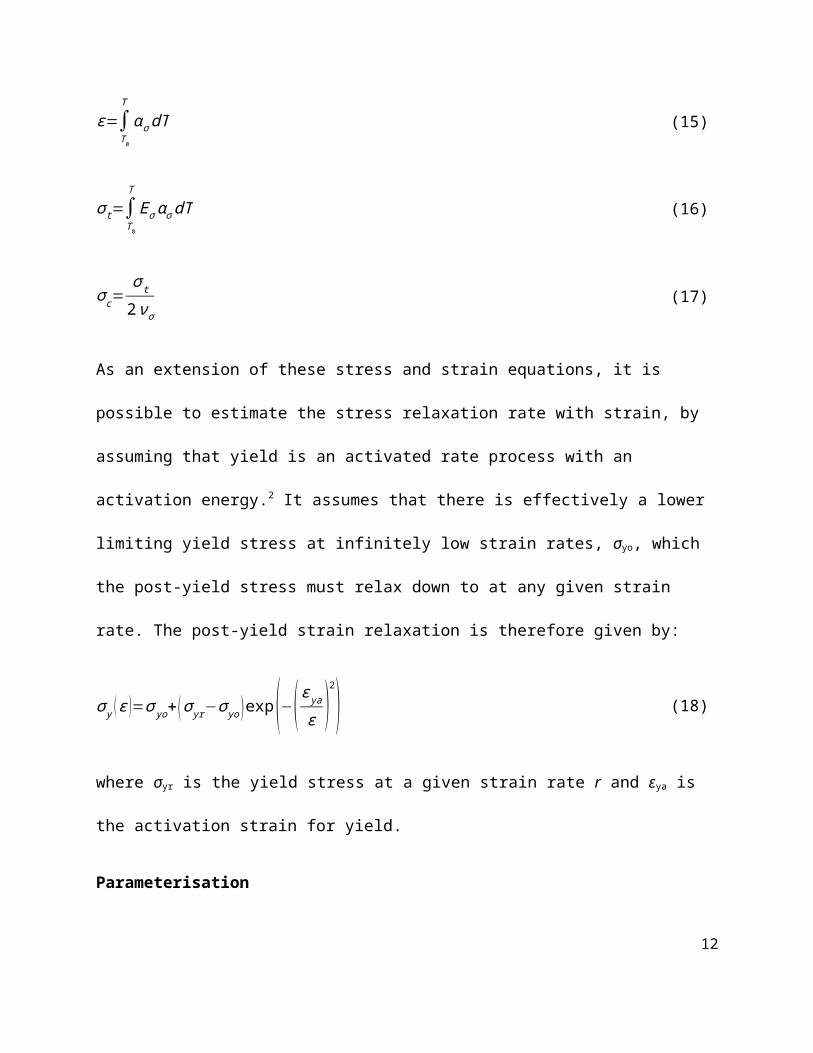
As an extension of these stress and strain equations, it is possible to estimate the stress
relaxation rate with strain, by assuming that yield is an activated rate process with an activation
energy.2 It assumes that there is effectively a lower limiting yield stress at infinitely low strain
rates, σyo, which the post-yield stress must relax down to at any given strain rate. The post-yield
strain relaxation is therefore given by:
σ y ( ε )=σ yo+(σ yr−σ yo )exp(−( ε ya
ε )2
) (18)
where σyr is the yield stress at a given strain rate r and εya is the activation strain for yield.8
Parameterisation
As indicated above, GIM requires a number of input parameters which must be assigned based
on a reasonable assumption of the chemical structure of the polymer being modelled.1-3 For
simple linear polymers this is a straightforward task as the structure is known, whereas for
thermosetting polymers, knowledge of the reaction mechanisms and crosslink density are
required to estimate the likely network structure. For epoxy resins, the epoxy and amine
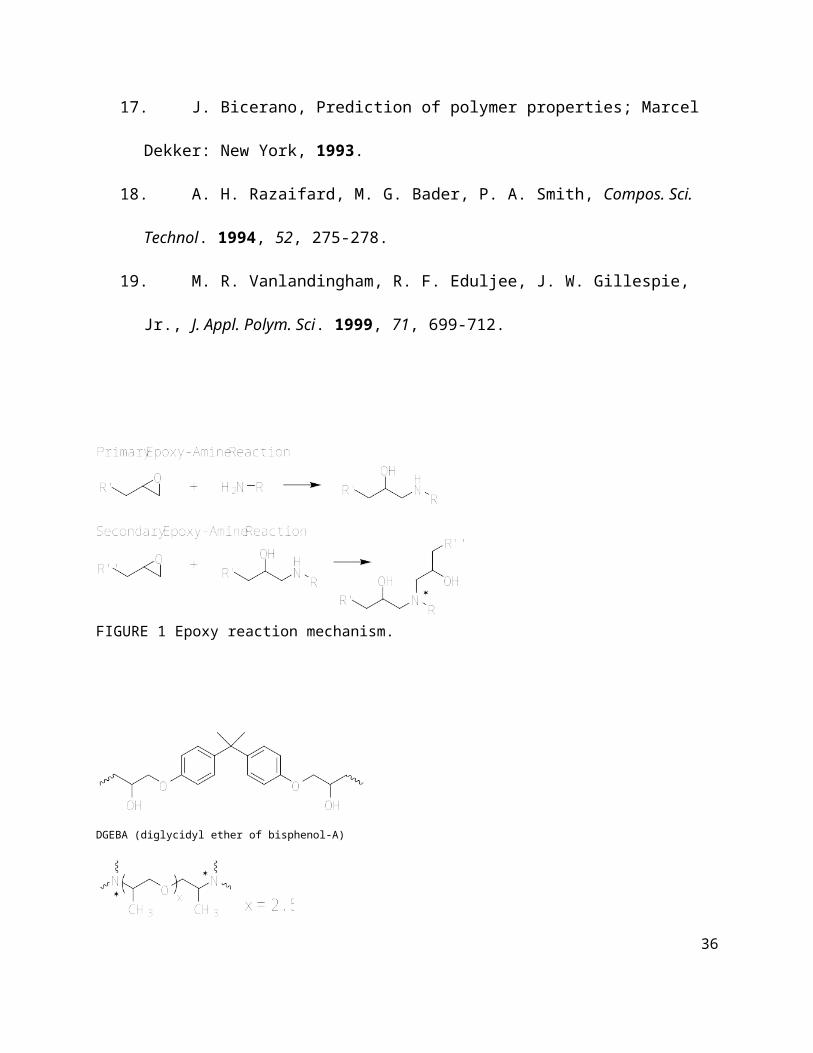
monomers typically react to form a three dimensional polymer network via two main reactions.
The first reaction is a primary amine reacting with an epoxy ring and the second reaction is
when the resultant secondary amine reacts with another epoxy ring. Both reactions can be seen
in Figure 1.
For the purpose of this study, and as a first approximation, the network structure has been
assumed to be the result of total consumption of reactive hydrogen to form an ideal 100 %
crosslinked network, to compare with fully cured experimental specimens. The GIM parameters
are therefore assigned for the ring opened form of the DGEBA epoxy along with the amines
used in this study, with the network structures shown in Figure 2. The required parameters for
GIM predictions are:1
• Molar mass, M
• Cohesive energy, Ecoh
• Van der Waals volume, Vw
• Degrees of freedom, N
• Degrees of freedom in chain axis, Nc
9
• Degrees of freedom active in the beta transition, Nβ
• Length of mer unit, L
• Debye temperature parallel to the chain axis (chain stiffness), θ1
• Activation energy, ΔHβ
• Theoretical maximum number of cross-links, X
Table 1 shows all of the parameters for the epoxy and amine network fragments. The
parameters M, Ecoh, Vw and N are assigned using group contribution tables outlined by Porter,1
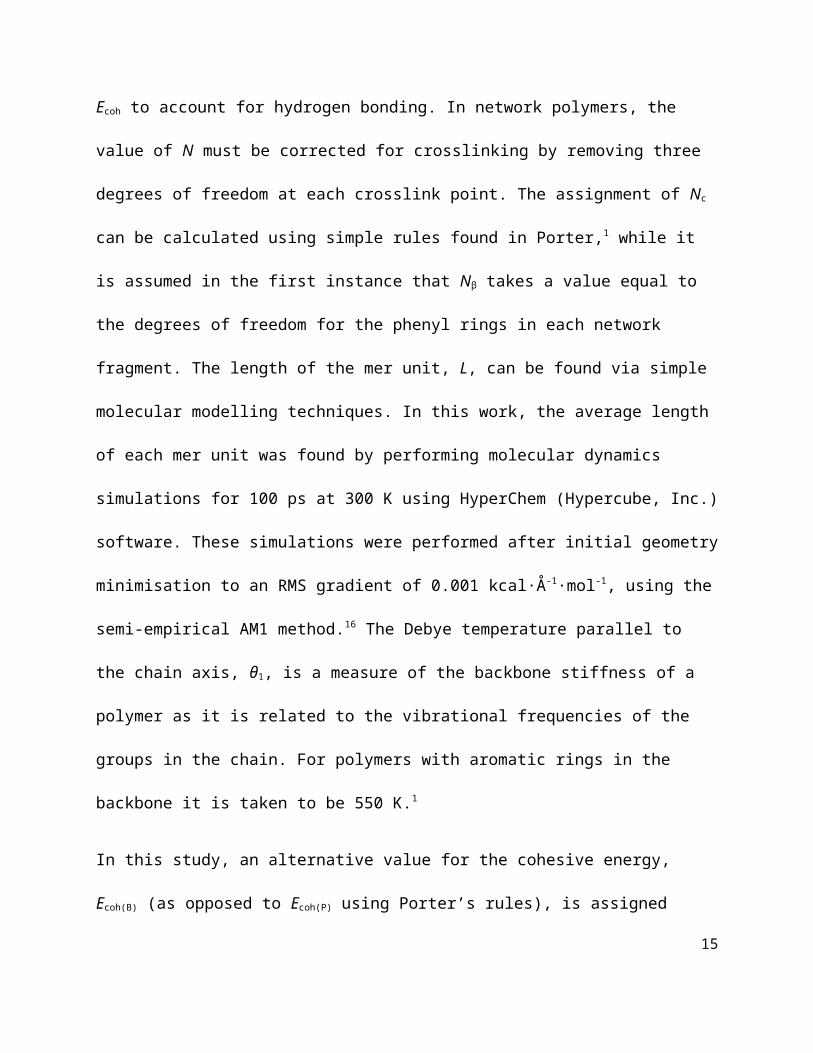
with the exception of the –CH(OH)– segment found in DGEBA. For this structural unit, the
refined parameters for Ecoh and N proposed by Foreman et al.2 were used, which includes a
10 kJ·mol-1 increment in Ecoh to account for hydrogen bonding. In network polymers, the value
of N must be corrected for crosslinking by removing three degrees of freedom at each crosslink
point. The assignment of Nc can be calculated using simple rules found in Porter,1 while it is
assumed in the first instance that Nβ takes a value equal to the degrees of freedom for the
phenyl rings in each network fragment. The length of the mer unit, L, can be found via simple
molecular modelling techniques. In this work, the average length of each mer unit was found by
performing molecular dynamics simulations for 100 ps at 300 K using HyperChem (Hypercube,
Inc.) software. These simulations were performed after initial geometry minimisation to an RMS
gradient of 0.001 kcal·Å-1·mol-1, using the semi-empirical AM1 method.16 The Debye
temperature parallel to the chain axis, θ1, is a measure of the backbone stiffness of a polymer
as it is related to the vibrational frequencies of the groups in the chain. For polymers with
aromatic rings in the backbone it is taken to be 550 K.1
10
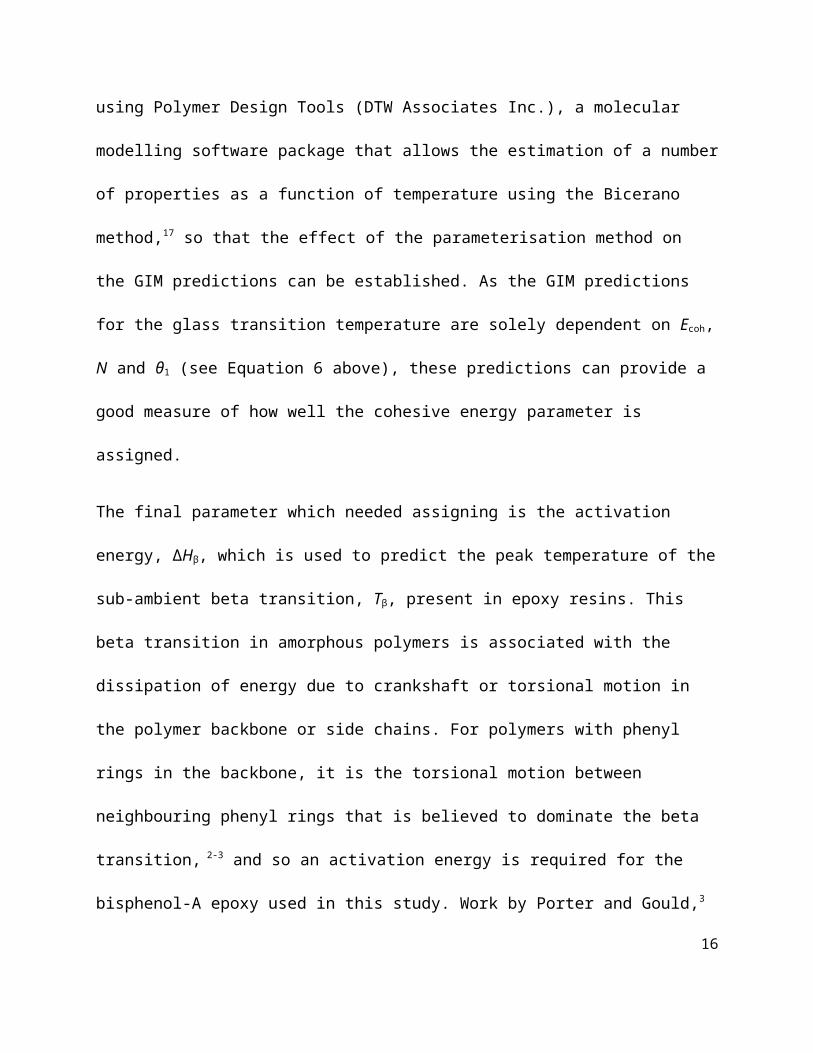
In this study, an alternative value for the cohesive energy, Ecoh(B) (as opposed to Ecoh(P) using
Porter’s rules), is assigned using Polymer Design Tools (DTW Associates Inc.), a molecular
modelling software package that allows the estimation of a number of properties as a function
of temperature using the Bicerano method,17 so that the effect of the parameterisation method
on the GIM predictions can be established. As the GIM predictions for the glass transition
temperature are solely dependent on Ecoh, N and θ1 (see Equation 6 above), these predictions
can provide a good measure of how well the cohesive energy parameter is assigned.
The final parameter which needed assigning is the activation energy, ΔHβ, which is used to
predict the peak temperature of the sub-ambient beta transition, Tβ, present in epoxy resins.
This beta transition in amorphous polymers is associated with the dissipation of energy due to
crankshaft or torsional motion in the polymer backbone or side chains. For polymers with
phenyl rings in the backbone, it is the torsional motion between neighbouring phenyl rings that
is believed to dominate the beta transition, 2-3 and so an activation energy is required for the
bisphenol-A epoxy used in this study. Work by Porter and Gould,3 and Foreman et al.2 both used
a value of 44 kJ·mol-1 for ΔHβ for structures with a bisphenol-A backbone; an attempt is made
here to determine whether this value is the best for the resins used in this work, or whether a
different value is more suitable for the specific environments of the resins used here. An
empirical value for the activation energy is also derived with the aid of experimental multi-
frequency DMA test results and compared with the assumed values.
EXPERIMENTAL
11
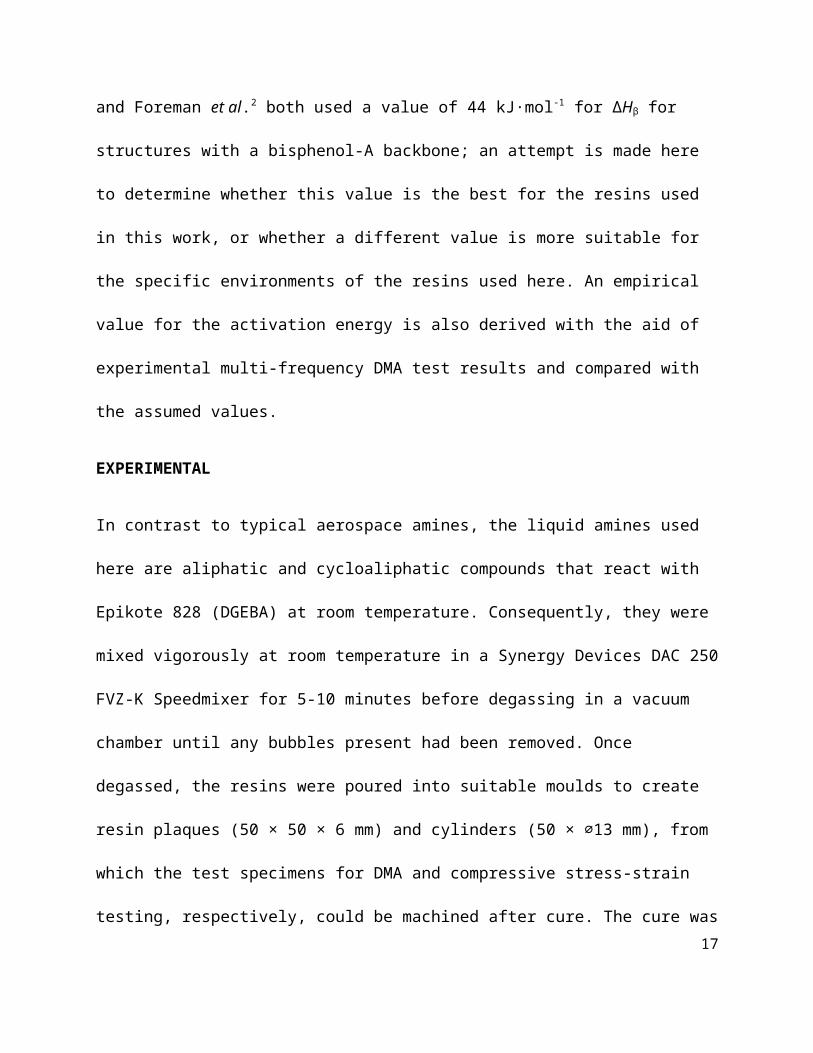
In contrast to typical aerospace amines, the liquid amines used here are aliphatic and
cycloaliphatic compounds that react with Epikote 828 (DGEBA) at room temperature.
Consequently, they were mixed vigorously at room temperature in a Synergy Devices DAC 250
FVZ-K Speedmixer for 5-10 minutes before degassing in a vacuum chamber until any bubbles
present had been removed. Once degassed, the resins were poured into suitable moulds to
create resin plaques (50 × 50 × 6 mm) and cylinders (50 × ⌀13 mm), from which the test
specimens for DMA and compressive stress-strain testing, respectively, could be machined after
cure. The cure was performed at room temperature (295 K) for 3 days followed by a 2 hour
postcure, with an initial ramp rate of 1 K·min-1, at 373 K (100 °C) for the Jeffamines and 423 K
(150 °C) for IPDA, PACM and IPDA+TTD.
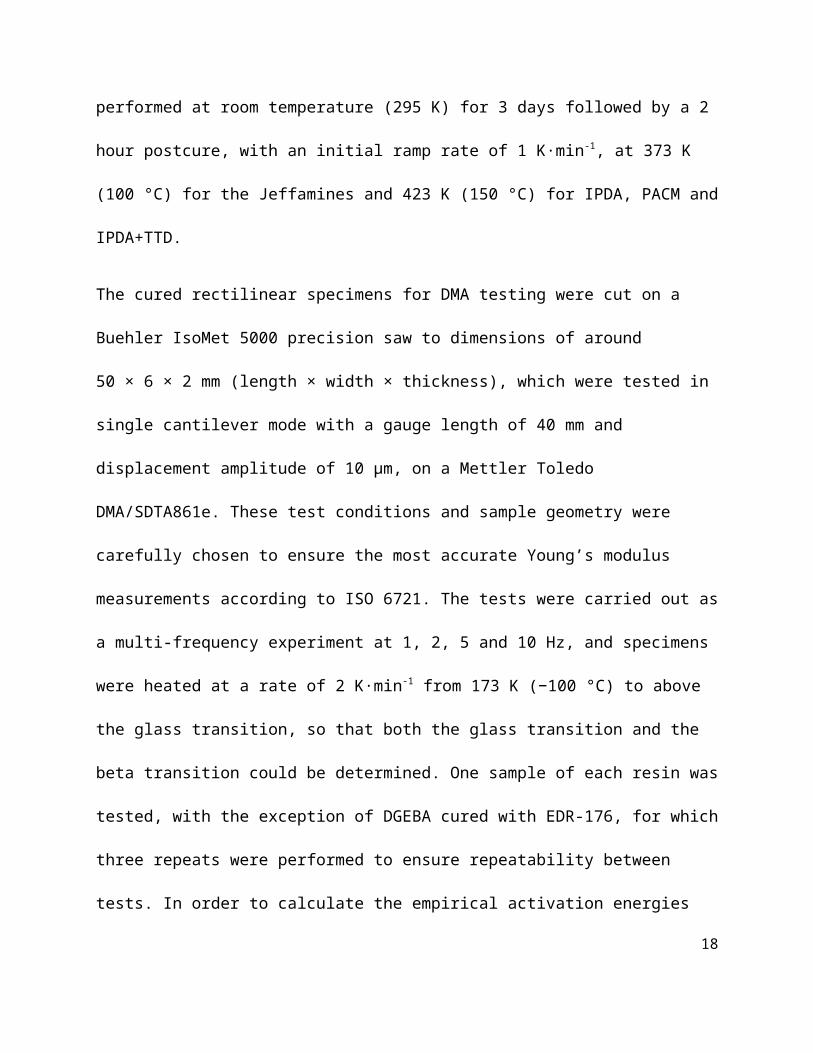
The cured rectilinear specimens for DMA testing were cut on a Buehler IsoMet 5000 precision
saw to dimensions of around 50 × 6 × 2 mm (length × width × thickness), which were tested in
single cantilever mode with a gauge length of 40 mm and displacement amplitude of 10 μm, on
a Mettler Toledo DMA/SDTA861e. These test conditions and sample geometry were carefully
chosen to ensure the most accurate Young’s modulus measurements according to ISO 6721.
The tests were carried out as a multi-frequency experiment at 1, 2, 5 and 10 Hz, and specimens
were heated at a rate of 2 K·min-1 from 173 K (−100 °C) to above the glass transition, so that
both the glass transition and the beta transition could be determined. One sample of each resin
was tested, with the exception of DGEBA cured with EDR-176, for which three repeats were
performed to ensure repeatability between tests. In order to calculate the empirical activation
12
energies from the experimental multi-frequency DMA tests, the Arrhenius equation defined
below can be used as the beta transition is a frequency dependent, thermal event.
ln f=ln A−∆ Hβ
RT β(19)
Here the activation energy, ΔHβ, is measured from an Arrhenius plot of ln f versus 1/Tβ, where f
is the frequency of the DMA experiment, Tβ is the peak temperature of the beta transition, R is
the molar gas constant and ln A is the pre-exponential factor and the y-intercept; the activation
energy is calculated from the gradient of the plot. Figure 3 shows an example Arrhenius plot for
DGEBA cured with D-230.
The cured cylindrical specimens, for the compressive stress-strain characterisation, were
machined on a lathe to a nominal diameter of 12 mm and length of 18 mm, giving a length to‐ ‐
diameter ratio of 3:2. This length to diameter ratio was chosen to minimise the possibility of ‐ ‐
buckling and/or the effects of frictional constraint, which occur at high and low aspect ratios
respectively.18 One 2 mm uniaxial strain gauge was bonded along the length of each of the
cylindrical specimens, so that the axial strain could be measured and recorded using a data
logger. Three specimens of each resin were tested through yield using an Instron 5582 testing
machine with a load cell of 100 kN at a cross-head displacement rate of 1 mm·min-1 at room
temperature, to ensure repeatability. When analysing the results, yield was defined as the point
of maximum stress (or the point of inflexion for DGEBA cured with PACM as it does not go
through a maximum).
13
In addition to the DMA and compressive stress-strain testing, all cured and uncured specimens
were analysed by differential scanning calorimetry (DSC) to establish the degree of cure so that
this empirical value could be used in the GIM predictions for each resin system. It was found
that there were no residual exotherms for all of the cured specimens, and therefore the degree
of cure used in the GIM predictions was taken to be 100 % to match this.
RESULTS AND DISCUSSION
Dynamic Mechanical Analysis
The results for the peak glass transition temperature, at a frequency of 1 Hz, for the liquid
amine cured resins, as measured experimentally from the tan-delta DMA curve, and the
predicted values using GIM are shown in Table 2 and illustrated in Figures 4 and 5. It can be
seen that there is a strong correlation between the experimental results and both sets of
predictions using Ecoh(P) and Ecoh(B) respectively. There is also less than 4 % difference between all
predicted and experimental values, with only small differences in the predicted values.
However, when comparing the experimental data for the peak beta transition temperature
with the GIM predictions, at a frequency of 1 Hz, assuming an activation energy of 44 kJ·mol-1,2-3
it can be seen that the experimental values do not agree with the GIM predictions, with the
experimentally measured temperatures being significantly higher than the GIM predictions (see
Table 3 and Figure 6). It was therefore decided to investigate if a different value for the
activation energy could be used for all resin systems, or whether it was possible to use
14
empirically calculated activation energies from the multi-frequency DMA experiments, to give
predictions that more closely match the experimental data.
To determine a single activation energy that could be used for the seven resins in this study, the
experimental Tβ values were used in GIM to back-calculate what the required GIM activation
energies were, with the results shown in Table 4. These results show a small variation in the
required activation energies from 48 to 53 kJ·mol-1 with a mean value and standard deviation of
50 ± 2 kJ·mol-1. This value of average activation energy has been used in the GIM predictions
(rather than the 44 kJ·mol-1 value), with the experimental and GIM predicted values shown in
Figure 7. Using this method, predictions for all resins are within 6 % of the experimental values,
which can be seen in Table 3 along with the predictions using both 44 kJ·mol-1 and the
empirically calculated activation energies.
The experimental results for Tβ plotted against the GIM predictions using these empirically
derived activation energies are shown in Figure 8. There appears to be a reasonably good
correlation between the GIM predictions and the experimental data for three of the resins,
namely DGEBA cured with T-403, D-230 and PACM, where predictions are within 4 % of the
experimental values. There is, however, a much poorer correlation between predictions and
experimental data for DGEBA cured with D-400 and EDR-176, and little or no agreement for
IPDA and IPDA+TTD, which suggests that there is a problem with IPDA. It is possible that this
relates to the rather compact nature of the chemical structure of IPDA compared to the other
amines used in this study, which are typically long and flexible. This could make it more difficult
15
for IPDA to fully react, as once partially reacted, its mobility will be greatly reduced making it
difficult to meet an unreacted epoxy group.
Interrogation of the experimental data for DGEBA cured with EDR-176, found that for a set of
three repeats, there was a relatively large variation in the calculated activation energy, between
51 and 64 kJ·mol-1 with a mean of 57 kJ·mol-1, as can be seen from the Arrhenius plot in Figure
9. Using these different, empirically-determined activation energies in the GIM predictions, it
was found that an increase of just 1 kJ·mol-1 in ΔHβ gives a predicted increase of 4.3 K in Tβ for
DGEBA cured with EDR-176, meaning the GIM predictions using these upper and lower
activation energies will vary over as much as 64 K. This highlighted the sensitivity of the GIM Tβ
predictions to the activation energy, and prompted further investigation into the derivation of
the empirically-determined activation energies.
With moisture known to affect the transition temperatures of polymers, it was decided to
perform a set of five repeat experiments for this resin system after drying in a vacuum oven at
343 K (70 °C) until constant weight, to see if this influenced the results. These new results,
shown in Figure 10, gave an average Tβ peak temperature of 235 ± 1 K at a frequency of 1 Hz
which can be compared with the value of 225 ± 1 K for the previous set, along with an average
activation energy of 79 kJ·mol-1 compared to the previous value of 57 kJ·mol-1. Using this new
activation energy has the result of increasing the GIM predicted Tβ peak at 1 Hz from 248 to
345 K, which is much further away from the experimental value of 225 K. Furthermore, there
was still a 15 kJ·mol-1 range of calculated activation energies from this carefully dried set of
DGEBA cured with EDR-176. It is possible that this variation could be reduced by increasing the
16
range of frequencies tested by one or two orders of magnitude, as current tests were limited to
frequencies between 1 and 10 Hz.
In addition to this large variation in empirically calculated activation energies for a single resin
system, it is possible that there is an effect due to thermal history on the measured activation
energies. It can be seen that the effect of drying EDR-176 specimens at elevated temperature
has caused an increase in the empirically calculated activation energy of 22 kJ·mol-1. When
referring back to Table 4 it can be seen that two out of the three resins (namely DGEBA cured
with IPDA and IPDA+TTD) cured at the higher temperature of 423 K, as opposed to 373 K for the
Jeffamines, have much higher empirically calculated activation energies. It is possible that the
higher temperatures these resins have seen have induced a higher level of strain into the
experimental specimens affecting the relaxation process, and ultimately the empirically
calculated activation energies.
Due to the shortcomings of the empirically calculated activation energies, comparisons of the
predicted DMA curves with the experimental data at a frequency of 1 Hz are shown in Figure
11, using the average activation energy of 50 kJ·mol-1 for these predictions, for which Tβ is
predicted reasonably well. It can be seen that, in general, there is very good agreement
between the predictions and the experimental data for the majority of these resins, for both
modulus and tan-delta curves. There are, however, significant discrepancies between the
experimental and predicted modulus values for DGEBA cured with EDR-176 and PACM (Figures
11(c) and (f)). Work by Vanlandingham et al.19 on DGEBA cured with PACM found that this resin
system exhibits a two-phase microstructure consisting of a hard microgel phase and a soft
17
phase of unreacted and/or partially reacted material. This could explain the reason for the
experimental modulus of this resin system being significantly lower than the GIM prediction,
and it is possible that EDR-176 may behave in a similar fashion. It is clear that in both cases, the
model predictions with the assumptions made on network structure do not match what is
observed experimentally, and therefore further insight into the network structure of these
resins is needed for accurate predictions to be made in terms of modulus.
Compressive Stress-Strain Response
A comparison between experimental data and the GIM predictions for the compressive yield
stress and strain are tabulated in Tables 5 and 6 and shown graphically in Figures 12 and 13 (for
predictions using Ecoh(P)). The GIM predictions were made using the average activation energy of
50 kJ·mol-1, to match the comparative results given in Figure 11 for the DMA traces.
It can be seen that for the yield stress there is a reasonable correlation between experimental
and predicted data using Porter’s Ecoh, although the GIM does, however, over-predict the yield
stress values by an average of 49 %. When the cohesive energy was assigned using the
molecular modelling techniques of Bicerano17 instead of using the group contribution tables in
Porter,1 the predicted yield stress values were typically lower and closer to the experimental
data, although still higher by an average of 31 %. The reason for this general over-prediction of
the yield stress could be due to a number of factors. Firstly, the epoxy used in this study is
Epikote 828, which contains a proportion of oligomers and dimers, which will act as plasticisers
in the cured resin, therefore lowering the experimental yield stress. Another possibility for the
over-prediction of the yield stress is due to the GIM predictions being based on the assumption 18
of a 100 % crosslinked network, with full consumption of epoxy and amine groups, to match
degree of cure data generated by DSC. In reality, it is well known that epoxy resins only cure to
around 90 %, as beyond this, the network structure is constrained with little mobility, making it
difficult to reach full conversion. While the DSC traces showed no residual exotherm for all the
resins tested in this work, this means is that there were no unreacted epoxy and amine groups
with close enough proximity to react, but there could be a number of unreacted groups in the
network, acting as plasticisers.
While the yield stress predictions are generally over-predicted, it is clear that the GIM
predictions for the yield strains appear to be restricted to a very small range of values between
0.075 and 0.097. This is in contrast to the experimental values for this class of resins, which
cover a much broader range from 0.029 to 0.100. There is however a linear relationship with
very good correlation between the predicted and experimental data as shown in Figure 13.
These results indicate that there is either a limitation in the GIM predictions or the
experimental measurement, or possibly a combination of the two. In terms of the GIM
predictions it is possible there is a free volume effect that is not correctly accounted for in the
GIM model at present. With regards to the experimental data, it is likely that the low yield
strains seen could be due to slight barrelling of the specimens, where the centre of the
specimen (which the strain gauge was bonded to) was around 300 μm (~2.5 %) thicker in
diameter than either end, causing a small amount of localised rather than general deformation.
When looking more closely at the experimental data, it can be seen that the resins cured with
the amines with long backbones, such as Jeffamine D-400, have very low yield strains due to the
19
large amount of flexibility allowing for the re-ordering of network segments at low strains.
Resins cured with IPDA and PACM however give much higher yield strains which can be
attributed to the more compact nature of these amines, allowing less movement of network
segments at low strain levels.
While the comparisons between the GIM predictions and experimental data for the yield
characteristics of these resins have some limitations, it can be seen from the compressive
stress-strain curves that the predictions are typically in good agreement with the experimental
results for the low strain portions of the stress-strain curves (see Figure 14). For this region of
the stress-strain curves, only the predictions for DGEBA cured with EDR-176 and PACM do not
agree well with the experimental data for any region of the stress-strain curves. It can also be
seen from the comparison of the predicted and experimental DMA modulus curves that these
two resin systems also have larger variation between experimental and predicted modulus
values. This suggests that the assumptions made on network structure when assigning the GIM
parameters for these two resins does not accurately match what is obtained experimentally, as
discussed in the results for the DMA curves. It should be noted that the stress-strain predictions
in GIM, particularly for yield, are complex and dependent on the majority of input parameters,
and so accurate predictions can be difficult to obtain when making assumptions on network
structure. This is in contrast to the predictions for the glass transition temperature, which for
aromatic resins, where θ1 is a constant, is only dependent on Ecoh and N.
CONCLUSIONS
20
The results of the characterisation of a number of liquid amine cured epoxy resins by DMA and
compressive stress-strain tests, have been compared to predictions made using GIM, with
varying degrees of success. In this work, broad assumptions for the predictions, based on the
formation of a 100 % crosslinked network were made, to see if accurate predictions could be
made without the need for more complex modelling of individual moieties, such as that
employed by Liu et al. 8
Comparative results for Tg are excellent, with the predictions agreeing very well with the
experimental data, using two different methods for the assignment of the cohesive energy. For
the Tβ predictions, the initial value of 44 kJ·mol-1 for the activation energy used in GIM, which
was taken from previous literature, was found to under-predict Tβ, suggesting these liquid
amine cured epoxies required a higher activation energy. The revised value of 50 kJ·mol-1 gave
predictions that agree well with experimental data. Attempts were also made to calculate
empirical activation energies for these resins from multi-frequency DMA tests, although there
appeared to be too much variation in these measured activation energies and potentially too
much influence from experimental factors such as thermal history affecting these results.
In terms of the stress-strain characteristics, the yield stress is generally over-predicted, which
can be attributed to the assumption of a 100 % crosslinked network, which in reality is likely to
be closer to 90 %, along with the presence of oligomers and dimers in the Epikote 828 resin,
which act to reduce the yield stress by plasticising the network. Comparative data for the yield
strain on the other hand show a strong correlation, but there is a much broader range of yield
strains seen experimentally than predicted.
21
The overriding conclusions from this work are twofold. Firstly, the GIM predictions can be very
sensitive to certain parameters, where small differences in these inputs can result in large
differences in the predictions, such as the effect of cohesive energy on yield stress. As a result,
it is necessary to be conscious of which parameters drive the predictions for each property.
Secondly, it is important to have a more in depth knowledge of the network structure of the
resins being modelled as basic assumptions are not generally adequate enough for accurate
predictions of complex properties such as the stress-strain characteristics, although they are
good enough for the glass transition temperature. For the resins used in this study, this is
particularly the case for DGEBA cured with EDR-176 and PACM, for which the Tg predictions are
good and the stress-strain predictions poor in comparison to the experimental data.
ACKNOWLEDGEMENTS
This work was carried out as part of the University of Surrey Engineering Doctorate (EngD)
Programme in Micro- and NanoMaterials and Technologies with Hexcel Composites as the
sponsoring company and funded by the EPSRC.
REFERENCES
1. D. Porter, Group interaction modelling of polymer properties; Marcel Dekker: New York,
1995.
2. J. P. Foreman, D. Porter, S. Behzadi, F. R. Jones, Polym. 2008, 45, 5588-5595.
3. D. Porter, P. J. Gould, Int. J. Solids Struct. 2009, 46, 1981-1993.
4. D. Porter, Advanced Performance Materials. 1996, 3, 309-324.
22
5. D. A. Tilbrook, G. J. Pearson, M. Braden, P. V. Coveney, J. Polym. Sci. Part B: Polym. Phys.
2003, 41, 528-548.
6. D. Porter, P. J. Gould, J. Phys. IV. 2006, 134, 373-378.
7. V. R. Gumen, F. R. Jones, D. Attwood, Polym. 2001, 42, 5717-5725.
8. H. Liu, A. Uhlherr, M. K. Bannister, Polym. 2004, 45, 2051–2060.
9. J. P. Foreman, D. Porter, S. Behzadi, K. P. Travis, F. R. Jones, J. Mat. Sci. 2006, 41, 6631-
6638.
10. J. P. Foreman, S. Behzadi, D. Porter, P. T. Curtis, F. R. Jones, J. Mat. Sci. 2008, 43, 6642-
6650.
11. J. P. Foreman, S. Behzadi, S. A. Tsampas, D. Porter, P. T. Curtis, F. R. Jones, Plast. Rubber
Compos. 2009, 38, 67-71.
12. J. P. Foreman, D. Porter, S. Behzadi, P. T. Curtis, F. R. Jones, Compos. Part A-Appl. S.
2010, 41, 1072-1076.
13. J. P. Foreman, S. Behzadi, D. Porter, F. R. Jones, Phil. Mag. 2010, 90, 4227-4244.
14. N. Ersoy, T. Garstka, K. Potter, M. R. Wisnom, D. Porter, M. Clegg, G. Stringer, Compos.
Part A-Appl. S. 2010, 41, 401-409.
15. N. Ersoy, T. Garstka, K. Potter, M. R. Wisnom, D. Porter, G. Stringer, Compos. Part A-
Appl. S. 2010, 41, 410-418.
16. M. J. S. Dewar, E. G. Zoebisch, E. F. Healy, J. J. P. Stewart, J. Am. Chem. Soc. 1985, 107,
3902-3909.
17. J. Bicerano, Prediction of polymer properties; Marcel Dekker: New York, 1993.
18. A. H. Razaifard, M. G. Bader, P. A. Smith, Compos. Sci. Technol. 1994, 52, 275-278.23
19. M. R. Vanlandingham, R. F. Eduljee, J. W. Gillespie, Jr., J. Appl. Polym. Sci. 1999, 71, 699-
712.
FIGURE 1 Epoxy reaction mechanism.
DGEBA (diglycidyl ether of bisphenol-A)
Jeffamine D-230
Jeffamine D-400
24
Jeffamine T-403
Jeffamine EDR-176
IPDA (isophorone diamine)
PACM (bis p-aminocyclohexyl methane)
TTD (4,7,10-trioxatridecane-1,13-diamine)
FIGURE 2 Cured chemical structures of DGEBA and the liquid amines used in this study. Here * denotes a cross-link point.
25
0.00425 0.0043 0.00435 0.0044 0.00445 0.0045 0.00455 0.0046 0.00465 0.00470.0
0.5
1.0
1.5
2.0
2.5
f(x) = − 6188.13936639972 x + 28.8139052178079R² = 0.992929886907856
Series2 Linear (Series2)
1/Tβ (K-1)
ln f
FIGURE 3 Example Arrhenius plot for calculating the activation energies of DGEBA cured with D-230.
325 350 375 400 425 450325
345
365
385
405
425
445 f(x) = 1.08356779379129 x − 35.2974376866313R² = 0.972372340636385
f(x) = NaN x + NaNR² = 0
Tg Peak
x=y
T-403
Linear (T-403)
D-230
D-400
EDR-176
IPDA
PACM
IPDA+TTD
GIM Prediction (K)
Expe
rimen
tal (K
)
FIGURE 4 Experimental results plotted against GIM predictions for the peak glass transition temperature using Ecoh determined by group contribution tables in Porter,1 at a frequency of 1 Hz. Dashed line shows x=y.
26
325 345 365 385 405 425 445325
345
365
385
405
425
445 f(x) = 1.06625405020136 x − 18.1203441430031R² = 0.968458269864531
f(x) = NaN x + NaNR² = 0
Tg Peak
x=y
T-403
Linear (T-403)
D-230
D-400
EDR-176
IPDA
PACM
IPDA+TTD
GIM Prediction (K)
Expe
rimen
tal (K
)
FIGURE 5 Experimental results plotted against GIM predictions for the peak glass transition temperature using Ecoh determined by the Bicerano method,17 at a frequency of 1 Hz. Dashed line shows x=y.
160 180 200 220 240 260 280 300 320 340160
180
200
220
240
260
280
300
320
340
f(x) = 2.05537878987452 x − 175.77208178084R² = 0.397108849330577
f(x) = NaN x + NaNR² = 0 Tβ Peak: Literature ΔHβ (44 kJ·mol-1)
x=y
T-403
Linear (T-403)
D-230
D-400
EDR-176
IPDA
PACM
IPDA+TTD
GIM Prediction (K)
Expe
rimen
tal (K
)
FIGURE 6 Experimental results plotted against GIM predictions for the beta transition temperature using a literature value of 44 kJ·mol-1 for activation energy,3 at a frequency of 1 Hz. Dashed line shows x=y.
27
160 180 200 220 240 260 280 300 320 340160
180
200
220
240
260
280
300
320
340
f(x) = 1.78965602970616 x − 173.323578805412R² = 0.397596966447117
f(x) = NaN x + NaNR² = 0 Tβ Peak: Average ΔHβ (50 kJ·mol-1)
x=y
T-403
Linear (T-403)
D-230
D-400
EDR-176
IPDA
PACM
IPDA+TTD
GIM Prediction (K)
Expe
rimen
tal (K
)
FIGURE 7 Experimental results plotted against GIM predictions for the beta transition temperature using an average required value in GIM of 50 kJ·mol-1, at a frequency of 1 Hz. Dashed line shows x=y.
160 180 200 220 240 260 280 300 320 340160
180
200
220
240
260
280
300
320
340
f(x) = NaN x + NaNR² = 0 Tβ Peak: Empirical ΔHβ
x=y
T-403
Linear (T-403)
D-230
D-400
EDR-176
IPDA
PACM
IPDA+TTD
GIM Prediction (K)
Expe
rimen
tal (K
)
FIGURE 8 Experimental results plotted against GIM predictions for the beta transition temperature using the empirically derived activation energies from the experimental multi-frequency DMA experiments, at a frequency of 1 Hz. Dashed line shows x=y.
28
0.00405 0.0041 0.00415 0.0042 0.00425 0.0043 0.00435 0.0044 0.00445 0.00450.0
0.5
1.0
1.5
2.0
2.5
f(x) = − 6859.91164613525 x + 30.4914740612456R² = 0.981437519635742
60 kJ/mol Linear (60 kJ/mol)
51 kJ/mol Linear (51 kJ/mol)
64 kJ/mol Linear (64 kJ/mol)
1/Tβ (K-1)
ln f
FIGURE 9 Arrhenius plot for calculating the activation energies of 3 repeats of DGEBA cured with EDR-176.
0.00390000000000001 0.00400000000000001 0.00410000000000001 0.00420000000000001 0.004300000000000010.0
0.5
1.0
1.5
2.0
2.5f(x) = − 9539.24023178497 x + 40.5383044977191R² = 0.976944805329067
84 kJ/mol Linear (84 kJ /mol)
85 kJ/mol Linear (85 kJ /mol)
72 kJ/mol Linear (72 kJ /mol)
87 kJ/mol Linear (87 kJ /mol)
75 kJ/mol Linear (75 kJ /mol)
1/Tβ (K-1)
ln f
FIGURE 10 Arrhenius plot for calculating the activation energies of 5 repeats of DGEBA cured with EDR-176 after drying in a vacuum oven at 343 K until constant weight.
120 170 220 270 320 370 420 4700
1000
2000
3000
4000
5000
6000
7000
0.001
0.01
0.1
1
10(a) D-230
GIM Modulus
Exp. Modulus
GIM Tan Delta
Exp. Tan Delta
Temperature, T (K)
Youn
g's M
odulu
s, E
(MPa
)
Tan D
elta
120 170 220 270 320 370 420 4700
1000
2000
3000
4000
5000
6000
7000
0.001
0.01
0.1
1
10(b) D-400
GIM Modulus
Exp. Modulus
GIM Tan Delta
Exp. Tan Delta
Temperature, T (K)
Youn
g's M
odulu
s, E
(MPa
)
Tan D
elta
29
120 170 220 270 320 370 420 4700
1000
2000
3000
4000
5000
6000
7000
0.001
0.01
0.1
1
10(c) EDR-176
GIM Modulus
Exp. Modulus
GIM Tan Delta
Exp. Tan Delta
Temperature, T (K)
Youn
g's M
odulu
s, E
(MPa
)
Tan D
elta
120 170 220 270 320 370 420 4700
1000
2000
3000
4000
5000
6000
7000
0.001
0.01
0.1
1
10(d) T-403
GIM Modulus
Exp. Modulus
GIM Tan Delta
Exp. Tan Delta
Temperature, T (K)
Youn
g's M
odulu
s, E
(MPa
) Tan D
elta
120 170 220 270 320 370 420 4700
1000
2000
3000
4000
5000
6000
7000
0.001
0.01
0.1
1
10(e) IPDA
GIM Modulus
Exp. Modulus
GIM Tan Delta
Exp. Tan Delta
Temperature, T (K)
Youn
g's M
odulu
s, E
(MPa
)
Tan D
elta
120 170 220 270 320 370 420 4700
1000
2000
3000
4000
5000
6000
7000
0.001
0.01
0.1
1
10(f) PACM
GIM Modulus
Exp. Modulus
GIM Tan Delta
Exp. Tan Delta
Temperature, T (K)
Youn
g's M
odulu
s, E
(MPa
)
Tan D
elta
120 170 220 270 320 370 420 4700
1000
2000
3000
4000
5000
6000
7000
0.001
0.01
0.1
1
10(g) IPDA+TTD
GIM Modulus
Exp. Modulus
GIM Tan Delta
Exp. Tan Delta
Temperature, T (K)
Youn
g's M
odulu
s, E
(MPa
)
Tan D
elta
FIGURE 11 Overlays of the experimental DMA curves with the GIM predictions using an activation energy of 50 kJ·mol-1, at a frequency of 1 Hz, for DGEBA cured with (a) D-230; (b) D-400; (c) EDR-176; (d) T-403; (e) IPDA; (f) PACM; and (g) IPDA+TTD.
30
0 20 40 60 80 100 120 140 160 180 2000
50
100
150
200
f(x) = 0.554130497796073 x + 16.7727596825266R² = 0.509630165153043
Yield Stress, σy
x=y
T-403
D-230
D-400
EDR-176
IPDA
PACM
IPDA+TTD
GIM Prediction (MPa)
Expe
rimen
tal (M
Pa)
FIGURE 12 GIM predicted versus experimental data for the compressive yield stress at a strain rate of 0.001 s-1, using Ecoh(P). Dashed line shows x=y.
0 0.05 0.1 0.150
0.05
0.1
0.15
f(x) = 3.10184226024932 x − 0.207981103439032R² = 0.846971098671873
Yield Strain, εy
x=y
T-403
D-230
D-400
EDR-176
IPDA
PACM
IPDA+TTD
GIM Prediction
Expe
rimen
tal
FIGURE 13 GIM predicted versus experimental data for the compressive yield strain at a strain rate of 0.001 s-1, using Ecoh(P). Dashed line shows x=y.
31
0.00 0.02 0.04 0.06 0.08 0.10 0.120
20
40
60
80
100
120
140
160
180(a) D-230
GIM (B)
GIM (P)
Ex perimental
Strain, ε
Comp
ress
ive S
tress
, σ (M
Pa)
0.00 0.02 0.04 0.06 0.08 0.10 0.120
20
40
60
80
100
120
140
160
180(b) D-400
GIM (B)
GIM (P)
Experimental
Strain, ε
Comp
ress
ive S
tress
, σ (M
Pa)
0.00 0.02 0.04 0.06 0.08 0.10 0.120
20
40
60
80
100
120
140
160
180(c) EDR-176
GIM (B)
GIM (P)
Ex perimental
Strain, ε
Comp
ress
ive S
tress
, σ (M
Pa)
0.00 0.02 0.04 0.06 0.08 0.10 0.120
20
40
60
80
100
120
140
160
180(d) T-403
GIM (B)
GIM (P)
Experimental
Strain, ε
Comp
ress
ive S
tress
, σ (M
Pa)
0.00 0.02 0.04 0.06 0.08 0.10 0.120
20
40
60
80
100
120
140
160
180(e) IPDA
GIM (B)
GIM (P)
Ex perimental
Strain, ε
Comp
ress
ive S
tress
, σ (M
Pa)
0.00 0.02 0.04 0.06 0.08 0.10 0.120
20
40
60
80
100
120
140
160
180(f) PACM
GIM (B)
GIM (P)
Experimental
Strain, ε
Comp
ress
ive S
tress
, σ (M
Pa)
32
0.00 0.02 0.04 0.06 0.08 0.10 0.120
20
40
60
80
100
120
140
160
180(g) IPDA+TTD
GIM (B)
GIM (P)
Experimental
Strain, ε
Comp
ress
ive S
tress
, σ (M
Pa)
FIGURE 14 Overlays of the experimental compressive stress-strain curves with the two GIM predictions using Ecoh(P) and Ecoh(B) and an activation energy of 50 kJ·mol-1, at a strain rate of 0.001 s-1, for DGEBA cured with (a) D-230; (b) D-400; (c) EDR-176; (d) T-403; (e) IPDA; (f) PACM; and (g) IPDA+TTD.
TABLE 1 GIM parameters for the cured epoxy and amine mer units.
Mer Unit N Ecoh(P)
(J·mol-1)Ecoh(B)
(J·mol-1)Vw
(cc·mol-1)M L
(Å)Nc Nβ X-links
DGEBA 24 135700 n/a 192.92 342 15.48 46 6 0
D-230 30 81000 66858 130.26 226 11.40 30 0 2
D-400 58.8 152280 129879 261.16 426 23.90 58.8 0 2
T-403 61 162900 138143 270.35 434 15.35 41.33 0 4
EDR-176 24 66600 56811 99.84 172 14.46 24 0 2
IPDA 12 59000 46783 104.23 164 6.90 24 0 2
PACM 14 68500 60006 124.83 206 10.50 42 0 2
IPDA+TTD 21 70450 58939 159.77 190 11.87 27 0 2
TABLE 2 Values of Tg experimental and GIM predictions using 2 different methods of assigning the cohesive energy.
Resin Exp. Tg
(K)
GIM Tg Prediction(K)
Using Ecoh(P) Using Ecoh(B)
DGEBA / D-230 367 365 354
DGEBA / D-400 369 374 364
DGEBA / T-403 331 339 327
33
DGEBA / EDR-176 371 386 378
DGEBA / IPDA 434 437 425
DGEBA / PACM 441 434 427
DGEBA / IPDA+TTD 404 401 392
Pearson’s r - 0.986 0.985
p-value - <0.001 <0.001
TABLE 3 Comparisons between experimental Tβ and GIM predictions using three different methods of assigning the activation energy; the literature value of 44 kJ·mol-1,3 the average calculated 50 kJ·mol-1
and the empirically calculated activation energies.
Resin Exp. Tβ
(K)
GIM Tβ Prediction using different ΔHβ
(K)
44kJ·mol-1
50kJ·mol-1
Emp.ΔHβ
DGEBA / D-230 214 190 217 222
DGEBA / D-400 205 186 212 232
DGEBA / T-403 211 193 220 209
DGEBA / EDR-176 225 191 218 248
DGEBA / IPDA 217 195 222 310
DGEBA / PACM 235 194 222 245
DGEBA / IPDA+TTD 220 192 219 330
Pearson’s r - 0.588 0.656 0.308
p-value - 0.165 0.110 0.502
TABLE 4 Required GIM activation energies to give the correct Tβ predictions along with the empirically calculated activation energies from the multi-frequency DMA experiments.
Resin Required ΔHβ
(kJ·mol-1)Empirical ΔHβ
(kJ·mol-1)
DGEBA / D-230 50 51
DGEBA / D-400 48 55
DGEBA / T-403 49 48
DGEBA / EDR-176 52 57
DGEBA / IPDA 49 70
DGEBA / PACM 53 56
DGEBA / IPDA+TTD 50 76
34
TABLE 5 Values of yield stress from experimental and GIM predictions using two different methods of assigning the cohesive energy, with all predictions made using the average activation energy of 50 kJ·mol-1.
Resin
Experimental σy
(MPa)GIM σy Prediction
(MPa)
#1 #2 #3 Ave. Using Ecoh(P) Using Ecoh(B)
DGEBA / D-230 87 87 84 86 125 108
DGEBA / D-400 64 64 64 64 107 85
DGEBA / T-403 80 80 80 80 99 83
DGEBA / EDR-176 74 75 75 75 148 135
DGEBA / IPDA 116 116 117 116 151 135
DGEBA / PACM 115 115 114 115 170 158
DGEBA / IPDA+TTD 95 94 94 94 124 111
Pearson’s r - 0.724 0.733
p-value - 0.066 0.061
TABLE 6 Values of yield strain from experimental and GIM predictions using two different methods of assigning the cohesive energy, with all predictions made using the average activation energy of 50 kJ·mol-1.
ResinExperimental εy GIM εy Prediction
#1 #2 #3 Ave. Using Ecoh(P) Using Ecoh(B)
DGEBA / D-230 0.051 0.048 0.044 0.048 0.084 0.085
DGEBA / D-400 0.033 0.025 0.029 0.029 0.079 0.075
DGEBA / T-403 0.057 0.050 0.047 0.052 0.080 0.081
DGEBA / EDR-176 0.061 0.063 0.067 0.063 0.087 0.086
DGEBA / IPDA 0.081 0.088 0.080 0.083 0.097 0.095
DGEBA / PACM 0.101 0.103 0.097 0.100 0.095 0.095
DGEBA / IPDA+TTD 0.073 0.068 0.080 0.073 0.091 0.088
Pearson’s r - 0.922 0.951
p-value - 0.003 0.001
35
GRAPHICAL ABSTRACT
Nicola T. Guest,1,2 David A. Tilbrook,1 Stephen L. Ogin,2 Paul A. Smith2
CHARACTERISATION AND MODELLING OF AN EPOXY RESIN CURED WITH LIQUID AMINES
Group Interaction Modelling (GIM) has been identified as a useful tool to predict the material properties of polymers from parameters based on their chemical structure, and could, therefore, be useful to assist in the development process for polymer composites. GIM is used in this research to predict the properties of a number of epoxy resins with the results compared to experimental data.
120 295 470
0
1000
2000
3000
4000
5000
6000
7000
0.001
0.01
0.1
1
10
Temperature (K)
Young'
s Modu
lus (M
Pa)
Tan De
lta
36