Embed Size (px)
Citation preview
EQAO’s Technical Report for the 2015–2016 Assessments
Assessments of Reading, Writing and Mathematics,Primary Division (Grades 1–3) and Junior Division (Grades 4–6);Grade 9 Assessment of Mathematics andOntario Secondary School Literacy Test
About the Education Quality and Accountability Office
The Education Quality and Accountability Office (EQAO) is an independent provincial agency funded by the Government
of Ontario. EQAO’s mandate is to conduct province-wide tests at key points in every student’s primary, junior and
secondary education and report the results to educators, parents and the public.
EQAO acts as a catalyst for increasing the success of Ontario students by measuring their achievement in reading,
writing and mathematics in relation to Ontario Curriculum expectations. The resulting data provide a gauge of quality
and accountability in the Ontario education system.
The objective and reliable assessment results are evidence that adds to current knowledge about student learning and
serves as an important tool for improvement at all levels: for individual students, schools, boards and the province.
EQAO’s Technical Report for the 2014–2015 Assessments: Assessments of Reading, Writing and Mathematics, Primary Division (Grades 1–3) and Junior Division (Grades 4–6); Grade 9 Assessment of Mathematics and Ontario Secondary School Literacy Test
2 Carlton Street, Suite 1200, Toronto ON M5B 2M9
Telephone: 1-888-327-7377 Web site: www.eqao.com
ISBN 978-1-4868-0110-7, ISSN 1927-7105
© 2017 Queen’s Printer for Ontario I Ctrc_report_ne_0617
i
TABLE OF CONTENTS
CHAPTER 1: OVERVIEW OF THE ASSESSMENT PROGRAMS ..................................... 1 THE EQAO ASSESSMENT PROGRAM: PRIMARY (GRADES 1–3), JUNIOR (GRADES 4–6), GRADE 9 AND THE ONTARIO
SECONDARY SCHOOL LITERACY TEST ............................................................................................................. 1 CHAPTER 2: ASSESSMENT DESIGN AND DEVELOPMENT ........................................... 3
ASSESSMENT FRAMEWORKS ............................................................................................................................ 3 ASSESSMENT BLUEPRINTS ............................................................................................................................... 3 TEST CONSTRUCTION: SELECTING ITEMS FOR THE OPERATIONAL FORM ......................................................... 3 ITEM DEVELOPMENT ........................................................................................................................................ 3
Item Developers ....................................................................................................................................... 4 Training for Item Developers ................................................................................................................... 4 EQAO Education Officer Review ............................................................................................................ 5 Item Tryouts ............................................................................................................................................. 5
THE ASSESSMENT DEVELOPMENT AND SENSITIVITY REVIEW COMMITTEES .................................................... 5 The EQAO Assessment Development Committees ................................................................................. 5 The EQAO Sensitivity Committee ........................................................................................................... 6
FIELD TESTING ................................................................................................................................................. 6 QUESTIONNAIRES ............................................................................................................................................. 7
CHAPTER 3: TEST ADMINISTRATION AND PARTICIPATION ..................................... 8 ASSESSMENT ADMINISTRATION ....................................................................................................................... 8
The Administration Guides ...................................................................................................................... 8 Support for Students with Special Education Needs and English Language Learners: The Guides for
Accommodations and Special Provisions ................................................................................................ 8 EQAO Policies and Procedures ................................................................................................................ 9
QUALITY ASSURANCE .................................................................................................................................... 10 ASSESSMENT PARTICIPATION ......................................................................................................................... 10
CHAPTER 4: SCORING ........................................................................................................... 11 SCORING IN TRANSITION ................................................................................................................................ 11 THE RANGE-FINDING PROCESS ...................................................................................................................... 11
Pre-Range Finding ................................................................................................................................. 12 Range Finding ........................................................................................................................................ 12 Overview of the Range-Finding Process ................................................................................................ 13
PREPARING TRAINING MATERIALS FOR ONLINE SCORING ............................................................................. 13 FIELD-TEST SCORING ..................................................................................................................................... 13
Training Field-Test Scoring ................................................................................................................... 14 Scoring Open-Response Field-Test Items .............................................................................................. 14 Developing Additional Scorer-Training Materials Before Scoring Operational Items .......................... 14
SCORING OPEN-RESPONSE OPERATIONAL ITEMS ........................................................................................... 14 Online Scoring Open-Response Operational Items ................................................................................ 15 Training for Scoring Open-Response Operational Items ....................................................................... 16 Training of Scoring Leaders and Scoring Supervisors for Scoring Open-Response Operational Items 16 Training of Scorers for Scoring Open-Response Operational Items ...................................................... 16
PROCEDURES AT THE ONLINE SCORING HEADQUARTERS .............................................................................. 17 Students at Risk ...................................................................................................................................... 17 Inappropriate Content, Cheating and Other Issues ................................................................................. 18 Ongoing Daily Training ......................................................................................................................... 18 Daily Scoring Headquarters Reports for Monitoring the Quality of Open-Response Item Scoring....... 18
Required Actions: Consequences of the Review and Analysis of Daily Online Scoring Headquarters Data Reports ................................................................................................................................................... 20 Auditing ................................................................................................................................................. 20
SCORER VALIDITY AND RELIABILITY ............................................................................................................. 20 Scoring Validity ..................................................................................................................................... 21 Scorer Reliability (for OSSLT only) ...................................................................................................... 22
CHAPTER 5: EQUATING ........................................................................................................ 23
ii
IRT MODELS .................................................................................................................................................. 23 EQUATING DESIGN ......................................................................................................................................... 24 CALIBRATION AND EQUATING SAMPLES ........................................................................................................ 24 CALIBRATION ................................................................................................................................................. 25 IDENTIFICATION OF ITEMS TO BE EXCLUDED FROM EQUATING ...................................................................... 25 THE ASSESSMENTS OF READING, WRITING AND MATHEMATICS: PRIMARY AND JUNIOR DIVISIONS ............. 26
Description of the IRT Model ................................................................................................................ 26 Equating Sample: Exclusion Rules ........................................................................................................ 26 Equating Steps ........................................................................................................................................ 27 Eliminating Items and Collapsing of Score Categories .......................................................................... 27 Equating Results ..................................................................................................................................... 28
THE GRADE 9 ASSESSMENT OF MATHEMATICS .............................................................................................. 30 Description of the IRT Model ................................................................................................................ 30 Equating Sample .................................................................................................................................... 30 Equating Steps ........................................................................................................................................ 31 Eliminating Items and the Collapsing of Score Categories .................................................................... 31 Equating Results ..................................................................................................................................... 32
THE ONTARIO SECONDARY SCHOOL LITERACY TEST (OSSLT) .................................................................... 32 Description of the IRT Model ................................................................................................................ 32 Equating Sample .................................................................................................................................... 33 Equating Steps ........................................................................................................................................ 33 Scale Score ............................................................................................................................................. 33 Eliminating Items and Collapsing of Score Categories .......................................................................... 33 Equating Results ..................................................................................................................................... 34
REFERENCES .................................................................................................................................................. 34 CHAPTER 6: REPORTING RESULTS .................................................................................. 35
REPORTING THE RESULTS OF THE ASSESSMENTS OF READING, WRITING AND MATHEMATICS: PRIMARY AND JUNIOR
DIVISIONS ...................................................................................................................................................... 36 REPORTING THE RESULTS OF THE GRADE 9 ASSESSMENT OF MATHEMATICS ................................................ 37 REPORTING THE RESULTS OF THE OSSLT ...................................................................................................... 37 INTERPRETATION GUIDES .............................................................................................................................. 38
CHAPTER 7: STATISTICAL AND PSYCHOMETRIC SUMMARIES ............................. 39 THE ASSESSMENTS OF READING, WRITING AND MATHEMATICS: PRIMARY AND JUNIOR DIVISIONS ............. 39
Classical Test Theory (CTT) Analysis ................................................................................................... 39 Item Response Theory (IRT) Analysis ................................................................................................... 40 Descriptive Item Statistics for Classical Test Theory (CTT) and Item Response Theory (IRT) ............ 54
THE GRADE 9 ASSESSMENT OF MATHEMATICS .............................................................................................. 56 Classical Test Theory (CTT) Analysis ................................................................................................... 56 Item Response Theory (IRT) Analysis ................................................................................................... 56 Descriptive Item Statistics for Classical Test Theory (CTT) and Item Response Theory (IRT) ............ 62
THE ONTARIO SECONDARY SCHOOL LITERACY TEST (OSSLT) .................................................................... 63 Classical Test Theory (CTT) Analysis ................................................................................................... 63 Item Response Theory (IRT) Analysis ................................................................................................... 64 Descriptive Item Statistics for Classical Test Theory (CTT) and Item Response Theory (IRT) ............ 67
DIFFERENTIAL ITEM FUNCTIONING (DIF) ...................................................................................................... 67 The Primary- and Junior-Division Assessments .................................................................................... 69 The Grade 9 Mathematics Assessment................................................................................................... 71 The OSSLT ............................................................................................................................................ 73
DECISION ACCURACY AND CONSISTENCY ..................................................................................................... 74 Accuracy ................................................................................................................................................ 74 Consistency ............................................................................................................................................ 75 Estimation from One Test Form ............................................................................................................. 76 The Primary and Junior Assessments ..................................................................................................... 77 The Grade 9 Assessment of Mathematics .............................................................................................. 77 The OSSLT ............................................................................................................................................ 78
REFERENCES .................................................................................................................................................. 78 CHAPTER 8: VALIDITY EVIDENCE.................................................................................... 80
INTRODUCTION .............................................................................................................................................. 80
iii
The Purposes of EQAO Assessments .................................................................................................... 80 Conceptual Framework for the Validity Argument ................................................................................ 80
VALIDITY EVIDENCE BASED ON THE CONTENT OF THE ASSESSMENTS AND THE ASSESSMENT PROCESSES ... 81 Test Specifications for EQAO Assessments .......................................................................................... 81 Appropriateness of Test Items ................................................................................................................ 81 Quality Assurance in Administration ..................................................................................................... 82 Scoring of Open-Response Items ........................................................................................................... 82 Equating ................................................................................................................................................. 83
VALIDITY EVIDENCE BASED ON THE TEST CONSTRUCTS AND INTERNAL STRUCTURE ................................... 83 Test Dimensionality ............................................................................................................................... 83 Technical Quality of the Assessments .................................................................................................... 84
VALIDITY EVIDENCE BASED ON EXTERNAL ASSESSMENT DATA ................................................................... 84 Linkages to International Assessment Programs .................................................................................... 84
VALIDITY EVIDENCE SUPPORTING APPROPRIATE INTERPRETATIONS OF RESULTS ......................................... 85 Setting Standards .................................................................................................................................... 85 Reporting ................................................................................................................................................ 85
CONCLUSION .................................................................................................................................................. 86 REFERENCES .................................................................................................................................................. 86
APPENDIX 4.1: SCORING VALIDITY FOR ALL ASSESSMENTS AND INTERRATER RELIABILITY FOR OSSLT .................................................................................................... 88
APPENDIX 7.1: SCORE DISTRIBUTIONS AND ITEM STATISTICS ............................. 98
1
CHAPTER 1: OVERVIEW OF THE ASSESSMENT PROGRAMS
The EQAO Assessment Program: Primary (Grades 1–3), Junior (Grades 4–6), Grade 9 and the Ontario Secondary School Literacy Test
In order to fulfill its mandate, EQAO conducts four province-wide assessments: the Assessments of Reading, Writing and Mathematics, Primary and Junior Divisions; the Grade 9 Assessment of Mathematics (academic and applied); and the Ontario Secondary School Literacy Test (OSSLT). All four assessments are conducted annually and involve all students in the specified grades in all publicly funded schools in Ontario, as well as a number of students in private schools that use The Ontario Curriculum. For example, students enrolled in inspected private schools are among those who write the OSSLT, as it is a graduation requirement for all students who wish to receive the Ontario Secondary School Diploma (OSSD).
EQAO assessments are developed in keeping with the Principles for Fair Student Assessment Practices for Education in Canada (1993), a document widely endorsed by Canada’s psychometric and education communities. The assessments measure how well students are achieving selected expectations outlined in The Ontario Curriculum. The assessments contain performance-based tasks requiring written responses to open-response items as well as multiple-choice items, through which students demonstrate what they know and can do in relation to the curriculum expectations measured. One version of each assessment is developed for English-language students, and another version is developed for French-language students. Both versions have the same number of items and kinds of tasks, but reflect variations in the curricula for the two languages. Since the tests are not identical, one should avoid making comparisons between the language groups.
The assessments provide individual student, school, school board and province-wide results on student achievement of selected Ontario Curriculum expectations. Every year, EQAO posts school and board results on its Web site (www.eqao.com) for public access. EQAO publishes annual provincial reports in English and in French for education stakeholders and the general public, which are available on its Web site. The assessment results provide valuable information that supports improvement planning by schools, school boards and the Ontario Ministry of Education.
The annual Assessments of Reading, Writing and Mathematics, Primary and Junior Divisions, measure how well elementary school students have met the reading, writing and mathematics curriculum expectations assessed by EQAO and outlined in The Ontario Curriculum, Grades 1–8: Language (revised 2006) and The Ontario Curriculum, Grades 1–8: Mathematics (revised 2005). The reading component assesses students on their skill at understanding explicit and implicit information and ideas in a variety of text types required by the curriculum. The reading component also requires students to make connections between what they read and their own personal knowledge and experience. The writing component assesses students on their skill at organizing main ideas and supporting details using correct spelling, grammar and punctuation in a variety of written communication forms required by the curriculum. The mathematics component assesses students on their knowledge and skill across the five mathematical strands in the curriculum: number sense and numeration, measurement, geometry and spatial sense, patterning and algebra, and data management and probability.
EQAO develops separate versions of the Grade 9 Assessment of Mathematics for students in academic and applied courses. The applied and academic versions of the Grade 9 Assessment of Mathematics measure how well students have met the expectations outlined in The Ontario
2
Curriculum, Grades 9 and 10: Mathematics (revised 2005). Students in Grade 9 academic mathematics are assessed on their knowledge and skill across the four mathematical strands in the curriculum: number sense and algebra, linear relations, analytic geometry, and measurement and geometry. Students in Grade 9 applied mathematics are assessed on their knowledge and skill across the three mathematical strands in the curriculum: number sense and algebra, linear relations, and measurement and geometry.
The OSSLT is administered annually and assesses Grade 10 students’ literacy skills based on reading and writing curriculum expectations across all subjects in The Ontario Curriculum up to the end of Grade 9. The reading component assesses students on their skill at understanding explicit and implicit information and ideas in a variety of text types required by the curriculum. It also assesses students on their ability to make connections between what they read and their own personal knowledge and experience. The writing component assesses students on their skill at organizing main ideas and supporting details using correct spelling, grammar and punctuation for communication in written forms required by the curriculum. Successful completion of the OSSLT is one of the 32 requirements for the OSSD.
EQAO education officers involve educators across the province in most aspects of EQAO assessments, including design and development of items and item-specific scoring rubrics; review of items for curriculum content and sensitivity; administration of the assessments in schools; scoring student responses to open-response items and reporting assessment results. Educators are selected to participate in EQAO activities based on the following criteria: diversity (cultural) and geographic location (to represent the northern, southern, eastern and
western parts of the province); representation of rural and urban regions; current elementary and secondary experience (teachers, administrators, subject experts and
consultants) and expertise in assessment, evaluation and large-scale assessment.
3
CHAPTER 2: ASSESSMENT DESIGN AND DEVELOPMENT
Assessment Frameworks
EQAO posts the current framework for each large-scale assessment on its Web site to provide educators, students, parents and the general public with a detailed description of the assessment, including an explanation of how it relates to Ontario Curriculum expectations. The English-language and French-language frameworks for the EQAO assessments can be found at www.eqao.com.
Assessment Blueprints
EQAO assessment blueprints are used to develop multiple-choice and open-response items for each assessment, so that each year the assessment has the same characteristics. This consistency in assessment design ensures that the number and types of items, the relationship to Ontario Curriculum expectations (or “curriculum coverage”) and the difficulty of the assessments are comparable each year. It should be noted that not all expectations can be measured in a large-scale assessment. Measurable curriculum expectations are clustered by topic, and items are then mapped to these clusters of expectations. Not all of the measurable expectations in a cluster are measured in any one assessment; however, over a five-year cycle, all measurable expectations in a cluster are assessed.
The blueprints can be found in EQAO’s assessment frameworks. A more detailed version of the blueprints is provided to item developers.
Test Construction: Selecting Items for the Operational Form
Operational items are selected from the items that have been field tested in previous assessments. The collected operational items in an assessment constitute the operational form (or “operational assessment” or “operational test”). The operational form contains the items that are scored for inclusion in the reporting of student results. Field-test items do not count toward a student’s result. Several important factors are taken into consideration when items are selected for an operational form: Data: The data for individual items, groups of items and test characteristic curves (based on
selected items) need to indicate that the assessment items are fair and comparable in difficulty to those on previous assessments.
Educator Perspective: The items selected for an assessment are reviewed to ensure that they reflect the blueprint for the assessment and are balanced for aspects such as subject content, gender representations and provincial demographics (e.g., urban or rural, north or south).
Curriculum Coverage: It is important to note that while items are mapped to clusters of curriculum expectations, not all expectations within a cluster are measured in any one assessment. Over time, all measurable expectations in a cluster are included on an assessment.
Sample assessments are available at www.eqao.com.
Item Development
New items are developed and field tested each year before becoming operational items in future assessments. Educators from across the province assist EQAO with all aspects of the development of the assessments, including finding or developing reading selections appropriate for the applicable grade levels; developing multiple-choice and open-response reading and writing or mathematics items and
item-specific scoring rubrics for open-response items;

4
trying out items as they are being developed and reviewing reading selections, items and item-specific scoring rubrics for curriculum content
and possible bias for or against subgroups of students (e.g., students with special education needs, English language learners, students of a particular gender or ethnic or racial background).
Item Developers EQAO recruits and trains experienced educators in English and French language (reading and writing) and mathematics to participate in its item-writing committees. The item-writing committee for each assessment comprises 10–20 educators who serve for terms of one to five years. Committee members meet once to twice a year to write and revise items, discuss results of item tryouts and review items that will be considered for use in subsequent operational assessments.
Item developers construct multiple-choice items in reading and writing or mathematics; open-response items in reading or mathematics; and open-response writing prompts for short- and long-writing tasks. All items are referenced to Ontario Curriculum expectations and matched to the blueprints for the individual assessments. Item developers are provided with a copy of the Development Specifications Guide for EQAO Assessments to assist them in the development of multiple-choice and open-response items and writing prompts.
Item writers for EQAO assessments are selected based on their expert knowledge and recent classroom experience in English and French language (reading
and writing) or mathematics education; familiarity with and knowledge of the elementary or secondary school curricula in Ontario
(especially in language or mathematics); familiarity with the cross-curricular literacy requirements for elementary and secondary
education in Ontario (especially for the OSSLT); expertise and experience in the application of elementary and secondary literacy and
mathematics rubrics based on the achievement charts in The Ontario Curriculum (to identify varying levels of student performance);
excellent written communication skills; comfort using computer software (and, for writers of mathematics items, mathematics
software); experience in writing instructional or assessment materials for students; proven track record of working collaboratively with others and accepting instruction and
feedback and access to grade and subject classrooms to conduct item tryouts.
Training for Item Developers The field-test materials for 2015–2016 were developed by EQAO in partnership with educators from across Ontario. EQAO led a one- or two-day workshop either remotely or at a designated location for item developers and spent approximately half a day training using a myriad of modalities, such as introducing item developers to the criteria for item writing. EQAO provided an overview of the assessments, including a description of the frameworks, and provided details on the elements of effective item writing. The remaining time involved a guided item-writing session structured by EQAO education officers. Each item developer was assigned to write items based on the blueprint for the specific assessment.

5
EQAO Education Officer Review When the first draft of the items and item-specific scoring rubrics is developed by the item developers, the items and rubrics are reviewed by EQAO education officers. The education officers ensure that each item is referenced correctly in terms of curriculum expectations and difficulty levels. For the multiple-choice items, the education officers consider the clarity and completeness of the stem, the integrity of the correct answer and the plausibility of the three incorrect options. For the open-response items, the education officers consider the correspondence between the items and their scoring rubrics to determine if the items will elicit the range of responses expected and determine the scorability of the items.
Item Tryouts After the initial review of first-draft items by the education officers, item writers try out the items they have developed in their own classes. These item tryouts allow item writers to see if their items are working as intended. The student responses are used to inform the editing and refining of stems of multiple-choice items, multiple-choice options, open-response items and item-specific scoring rubrics for open-response items. The results of these item tryouts are provided to EQAO education officers to help them review, revise and edit the items. Further item reviews are conducted by external experts prior to the final revisions by the education officers and prior to Assessment Development and Sensitivity Committee reviews.
The Assessment Development and Sensitivity Review Committees
EQAO recruits and trains Ontario educators with expertise in English and French language, mathematics and equity issues to participate in its Assessment Development and Sensitivity Committees. All field-test and operational assessment materials that appear on EQAO assessments are reviewed by these committees.
The goal of these committees is to ensure that items on the Assessments of Reading, Writing and Mathematics, Primary and Junior Divisions; the Grade 9 Assessment of Mathematics; and the OSSLT assess literacy and mathematics standards based on Ontario Curriculum expectations and that these items are appropriate, fair and accessible to the broadest range of students in Ontario.
The EQAO Assessment Development Committees The Assessment Development Committee for each subject in each assessment comprises 8–1210–12 Ontario educators who serve for terms of one to five years. Members meet once a year to provide expert advice from a specialized content and assessment perspective on the quality and fairness of materials being proposed for EQAO assessments and to ensure that all field-test and operational items appropriately assess standards of literacy and mathematics based on Ontario Curriculum expectations.
The members of the Assessment Development Committee possess expertise in and current experience with the curriculum and students in at least one of the subjects in the grade being assessed: language or mathematics in the primary division (Grades 1–3) for the primary assessment,
administered in Grade 3; language or mathematics in the junior division (Grades 4–6) for the junior assessment,
administered in Grade 6; mathematics in the intermediate division (Grades 7–10) for the Grade 9 assessment,
administered in Grade 9 or literacy across the curriculum to the end of Grade 9 for the OSSLT, administered in Grade 10.
6
The members of the Assessment Development Committee work collaboratively under the guidance of EQAO education officers to ensure that the materials (e.g., reading selections; reading, writing and mathematics items; and writing prompts) for a particular assessment are appropriate to the age and grade of the students, the curriculum expectations being measured and the purpose of the assessment. They make suggestions for the inclusion, exclusion or revision of items.
The EQAO Sensitivity Committee The Sensitivity Committee, which considers all four EQAO assessments, comprises 8–12 8–10 Ontario educators who serve for terms of one to five years. About 4–8 members meet in focused subgroups once a year to make recommendations that will assist EQAO in ensuring the fairness of all field-test and operational items being proposed for its assessments. They provide expert advice from a specialized equity perspective to ensure that assessment materials are fair for a wide range of students. The members of the Sensitivity Committee possess expertise in and current experience with equity issues in education (issues related to the diversity of Ontario students, students with special education needs and English language learners).
The members of the Sensitivity Committee work collaboratively under the guidance of EQAO education officers to review assessment materials (e.g., reading selections, items) in various stages of development to ensure that no particular group of students is unfairly advantaged or disadvantaged on any item. They make suggestions for the inclusion, exclusion or revision of items.
Field Testing
Field testing of assessment materials ensures that assessment items selected for future operational assessments are psychometrically sound and fair for all students. Field testing also provides data to equate each year’s assessment with the previous year’s assessment, so assessment results can be validly compared over time. Only items found to be acceptable based on field-test results are used operationally in EQAO assessments.
EQAO uses a matrix-sample design in which newly developed items are embedded as field-test items in each assessment. Scores on the field-test items are not used in determining student, school, school board or provincial results. The field-test items are arranged in the student booklets according to psychometric principles to ensure that valid and reliable data are obtained for each field-test item. The field-test items are divided into subsets that are inserted into each assessment, among the operational items, to ensure that they are attempted by a representative sample of students. Since the field-test items are like the operational items, the students do not know whether they are responding to a field-test item or an operational item. This similarity is meant to counter the low motivation that students may feel when they know that items are field-test items and therefore do not count toward their score. No more than 20% of the items in an assessment are field-test items.
All items, except for the long-writing tasks on the primary- and junior-division assessments and the OSSLT, are field tested this way. Because of the length of time required to complete long-writing tasks, they are not embedded as field-test items with operational items. Long-writing prompts go through a rigorous process of committee reviews, and, for the OSSLT, field trials are conducted as part of the item development process to ensure their appropriateness. Long-writing tasks are not used for equating.
7
Questionnaires
EQAO develops Student, Teacher and Principal Questionnaires to collect information on factors inside and outside the classroom that affect student achievement, so that EQAO results can be used to make recommendations to improve student learning.
The Assessments of Reading, Writing and Mathematics, Primary and Junior Divisions, include Student, Teacher and Principal Questionnaires. The Student Questionnaires include questions about the following: student engagement in reading, writing and mathematics (attitudes, perceptions of performance/confidence, learning strategies, reading and writing outside school); use of instructional resources in the classroom (e.g., use of calculator, computer, Internet, dictionaries); home environment (e.g., time spent doing extra-curricular activities; “screen time,” language(s) spoken at home by students and by others); parental engagement (home discussion, participation in child’s education) and the number of schools attended.
The Teacher Questionnaires include questions about the following: school learning environment (e.g., staff collaboration, school improvement planning); use of EQAO resources and data; use of resources in the classroom (e.g., use of calculator, computer and Internet by students and use of diverse materials by teacher); parental engagement in student learning (e.g., frequency and purposes of communication with parents); teacher’s information (e.g., background, experience, professional development) and classroom demographics (e.g., size and grade levels in class). The Principal Questionnaire includes questions about the following: principal’s information (e.g., gender, experience and teaching assignment); the school learning environment (e.g., staff collaboration, school improvement planning); use of EQAO data; parental engagement in student learning (e.g., communication with parents and parental participation) and school demographics (grades taught, enrolment, average percentage of students absent per day).
The Grade 9 Assessment of Mathematics also includes Student and Teacher Questionnaires. The Student Questionnaires include questions on student engagement in mathematics (attitudes, perceptions of performance/confidence, learning goals and learning strategies; time spent on mathematics homework; home environment (e.g., time spent doing extra-curricular activities, language(s) spoken at home by student); and the number of elementary schools attended.
The Teacher Questionnaire includes questions about the school learning environment (e.g., staff collaboration, school improvement planning); use of EQAO resources and data; use and availability of resources in the classroom (e.g., use of calculator, computer and Internet by students); use of instructional practices in the classroom; parental engagement in student learning (e.g., frequency and purposes of communication with parents) and teacher’s information (e.g., background, experience, professional development).
Beginning in 2010, questions about the use of EQAO Grade 9 mathematics results as part of students’ course marks were added to the Student and Teacher Questionnaires.
The OSSLT includes a Student Questionnaire that asks students about their access to a computer at home; the amount of time spent reading in English or French outside school and the different types of materials read outside school; their access to reading materials and the language spoken at home; and the time spent writing in English or French outside school and on the different forms of writing they do outside of school.

8
CHAPTER 3: TEST ADMINISTRATION AND PARTICIPATION
Assessment Administration
To ensure consistent and fair practice across the province in the administration of the assessments, EQAO publishes an administration guide and a guide for accommodations and special provisions annually for each assessment. The guides can be found at www.eqao.com.
The Administration Guides The administration guide for each EQAO assessment describes in detail the administration procedures that principals and teachers must follow to ensure that the administration of the assessment is consistent and fair for all students in the province. Each school is sent copies of the English- or French-language administration guide for training teachers to administer the assessment, which are also available for download. The guide outlines in detail what is expected of educators involved in the administration, including the procedures to follow (e.g., preparation of materials for distribution to students, proper
administration procedures); what to say to students (e.g., instructions for presenting the assessment) and the professional responsibilities of all school staff involved in the assessment.
During the assessment, students answer multiple-choice items and write their responses to open-response items. Students must work independently in a quiet environment and be supervised at all times.
Support for Students with Special Education Needs and English Language Learners: The Guides for Accommodations and Special Provisions The guide for each assessment provides information and directions to assist principals and teachers in making decisions about accommodations for students with special education needs; special provisions for English language learners and the exemption (primary, junior and OSSLT only) or deferral (OSSLT only) of students.
Students with special education needs are allowed accommodations, and English language learners are provided with special provisions, to ensure that they can participate in the assessment and demonstrate the full extent of their skills. In cases where the list of accommodations and special provisions does not address a student’s needs, exemption from participation in an assessment is allowed (primary and junior only); for the OSSLT, the test can be deferred to a later year for some students. Each year, EQAO reviews and updates these accommodations and provisions to ensure that they reflect Ministry of Education guidelines and new developments in the support available for students.
The guides for accommodations and special provisions also clarify the expectations for the documentation of accommodations, special provisions, exemptions and deferrals for students receiving them. The guides are based on four Ontario Ministry of Education policy documents: Individual Education Plans: Standards for Development, Program Planning, and Implementation (2000); English Language Learners / ESL and ELD Programs and Services: Policies and Procedures for Ontario Elementary and Secondary Schools, Kindergarten to Grade 12 (2007); Growing Success: Assessment, Evaluation, and Reporting in Ontario Schools, First Edition, Covering Grades 1 to 12 (2010) and Ontario Schools, Kindergarten to Grade 12: Policy and Program Requirements (2011), available at www.edu.gov.on.ca. The various administration and accommodation guides may be found on EQAO’s Web site, www.eqao.com.

9
Definition of “Accommodations” Accommodations are defined in the accommodation guides (modified from Ontario Schools, Kindergarten to Grade 12: Policy and Program Requirements [2011]) as follows:
“Accommodations” are supports and services that enable students with special education needs to demonstrate their competencies in the skills being measured by the assessment. Accommodations change only the way in which the assessment is administered or the way in which a student responds to the components of the assessment. It is expected that accommodations will not alter the content of the assessment or affect its validity or reliability.
On the other hand, “modifications,” which are not allowed, are changes to content and to performance criteria. Modifications are not permitted, because they affect the validity and reliability of the assessment results.
Clarification of instructions for all students is permitted prior to the assessment. Clarification of items during the assessment (e.g., rewording or explaining) is not allowed.
Special Version Assessments for Accommodated Students EQAO provides the following special versions of the assessments to accommodate the special education needs of students: sign language or oral interpreter contracted, uncontracted and Unified English Braille versions plus a set of regular-print
booklets for the scribe’s use large-print version—white paper large-print version—blue, green or yellow paper regular-print version—blue, green or yellow paper MP3 audio version plus a set of regular-print booklets MP3 audio version plus a set of large-print booklets
EQAO Policies and Procedures This document outlines EQAO’s policies and procedures related to the assessments (e.g., Consistency and Fairness, Student Participation, Absences and Lateness, School Emergency, Teacher Absences, Marking of Student Work by Classroom Teachers [Grade 9 only] and Request for a Student to Write at an Alternative Location).
Special Provisions for English Language Learners “Special provisions” are adjustments for English language learners to the setting or timing of an assessment. These provisions do not affect the validity or reliability of the assessment results for these students.
Exemptions (Primary, Junior and OSSLT Only) If a Grade 3 or 6 student is unable to participate in all or part of an assessment, even given accommodations or special provisions, the student may be exempted at the discretion of his or her school principal and school team in collaboration with parents. A Grade 3 or 6 student must be exempted, however, if for reading, a teacher or another adult must read to him or her and, for mathematics, if mathematics terms have to be defined for him or her.
All students working toward a Grade 9 academic- or applied-level mathematics credit must participate in the Grade 9 assessment.
10
If a student’s Individual Education Plan (IEP) states that he or she is not working toward an OSSD, the student may be exempted from the OSSLT.
Deferrals (OSSLT Only) All Ontario secondary school students are expected to write the OSSLT in their Grade 10 year. However, this requirement can be deferred for one year (every year until graduation) when a student is working toward the OSSD, if one of the following applies: the student has been identified as exceptional by an Identification, Placement and Review
Committee (IPRC) and is not able to participate in the assessment, even with the permitted accommodations;
the student has not yet acquired the reading and writing skills appropriate for Grade 9; the student is an English language learner and has not yet acquired a level of proficiency
sufficient to participate in the test or the student is new to the board and requires accommodations that cannot yet be provided.
All deferred students who wish to graduate with the OSSD must eventually complete the OSSLT requirement.
If a student has attempted and has been unsuccessful at least once in the OSSLT, the principal has the discretion to allow the student to take the Ontario Secondary School Literacy Course (OSSLC).
Quality Assurance
EQAO has established quality-assurance procedures to help ensure that its assessments are administered consistently and fairly across the province and that the data produced is valid and reliable. EQAO follows a number of procedures to ensure that parents, educators and the public have confidence in the validity and reliability of the results reported: Quality assurance monitors: EQAO contracts quality-assurance monitors to visit and observe
the administration of the assessments (in a random sample of schools) to determine the extent to which EQAO guidelines are being followed.
Database analyses: EQAO conducts statistical analyses of student response data to identify student response patterns to multiple-choice items that suggest the possibility of collusion between two or more students.
Examination of test materials: Following each assessment, EQAO looks for evidence of possible irregularities in its administration. This is done through an examination of test materials from a random sample of schools prior to scoring.
Assessment Participation
The year of 20152016 was atypical in regard to the administration of EQAO assessments. The administration of the OSSLT and Grade 9 proceeded as planned, but in the spring of 20162015, the Toronto Catholic District School Board did not participate in the Primary and Junior Assessments of Reading, Writing and Mathematics due to labour disruptions. Elementary school students in the remaining English Catholic, English Public, French Public and French Catholic systems participated in the assessments as usual. Students in English-language Provincial schools, Private schools, First Nations schools, as well as international schools, also participated. There were some reporting implications as a result of these labour actions.
11
CHAPTER 4: SCORING
EQAO follows rigorous scoring procedures to ensure that its assessment results are valid and reliable. All responses to open-response field-test and operational reading and mathematics items, as well as writing prompts, are scored by trained scorers. The responses to multiple-choice items are captured by a scanner.
Item-specific, generic scoring rubrics and anchors are the key tools used for scoring open-response reading, writing and mathematics items. Anchors illustrate the descriptors for each code in the rubrics. In order to maintain consistency across items and years, item-specific rubrics for open-response items are based on generic rubrics. EQAO scoring rubrics describe work at different codes or score points; each code represents a different quality of student performance. The anchors are chosen and validated by educators from across the province during the range-finding process, under the supervision of EQAO staff. Each student response to an open-response item is scored according to its best match with one of the code descriptors in the rubric for the item and its anchors. Scorers are trained to refer constantly to the anchors to ensure consistent scoring. The rubric codes are related to, but do not correspond to, the levels of achievement outlined in the achievement charts in the Ministry of Education curriculum documents.
The generic rubrics used to create item-specific rubrics for each assessment are included in each framework document at www.eqao.com.
Scoring in Transition
EQAO is moving toward online scoring for all of its assessments. In 2015–2016, the OSSLT followed the traditional paper-based approach to scoring; the primary, junior and Grade 9 assessments employed online scoring. Online scoring was conducted in a distributed fashion, in that scorers coded student work from home; scoring supervisors, under EQAO direction, oversaw the scoring process from a central location in downtown Toronto. Online scoring incorporated all of the rigorous procedures used in paper-based scoring but included many enhancements (e.g., real time monitoring of validity and productivity).
Following is a description of the traditional paper-based scoring process formerly used for all EQAO assessments (only the OSSLT in 2016). The main stages of the scoring process are outlined below.
The Range-Finding Process
Range finding is used to define the range of acceptable performances for each code or score point in each scoring rubric. (Examples of unacceptable responses are also selected for training purposes.) The process is completed in two stages: pre-range finding and range finding.
Range finding for open-response reading and mathematics items and short-writing prompts uses student field-test responses and occurs prior to field-test scoring. Field-test scoring follows operational scoring for the primary, junior and Grade 9 assessments. Field-test scoring for the OSSLT occurs during the summer, after operational scoring has finished.
The long-writing prompts on the OSSLT are pilot tested with a limited number of students. As a result, range finding for long-writing tasks uses student responses to operational items and occurs just prior to operational scoring.
12
Pre-Range Finding During pre-range finding, practising educators work with EQAO staff to select responses that represent the full range of codes or score points for each item or prompt. These responses are used by the range-finding committee. An overview of the process is provided below, though a few minor variations of this process occur across assessments and between field-test and operational range finding: 1. EQAO education officers are responsible for pre-range finding. 2. Once student booklets arrive at EQAO from schools, a purposeful, demographically
representative sample of about 500 student responses for each open-response field-test reading or mathematics item, short-writing task and operational long-writing task is set aside for pre-range finding.
3. Education officers read through 250 booklets or images (or more if necessary) to see if there is a range of responses and if the item or prompt worked with students. The pre-range finding process for items or tasks does not proceed unless there is a range of responses.
4. Typically, booklets are sorted into four piles based on the range of responses: approximately 20 low, 20 medium, 20 high and 25 of mixed range. The Online student responses booklets chosen for the piles represent the full range of student responses, including off-topic, incorrect, typical and unusual responses. The mixed pile is determined after the other three piles.
5. Items and tasks that have been left unanswered (“blanks”) or that are difficult to read due to poor handwriting or light ink are not selected for pre-range finding.
6. A cover sheet for each range, showing item, task and booklet numbers, is printed and labelled “high,” “medium,” “low” or “mixed.”
Range Finding During the range-finding process, subject experts from the Ontario education system, under the supervision of EQAO staff, meet to make recommendations about high-quality scoring tools and training materials for scorers, in order to ensure the accurate and consistent scoring of open-response items on EQAO assessments. These experts select representative samples of student responses to define and illustrate the range of student performance within the scoring rubric codes and to provide consensus on the coding of student responses used to train scorers of open-response items.
Range-finding committees consisting of 8–25 Ontario educators meet one or two times a year to make recommendations about student responses that will be used as anchors during scoring. They also discuss other possible responses to be used as training materials for scorers (e.g., as validity papers, qualifying test papers and possible papers for training calibration activities).
The qualifications for range-finding committee members include expertise and experience in the application of rubrics based on the achievement charts in The
Ontario Curriculum (to identify varying levels of student performance in language and mathematics);
the ability to explain clearly and concisely the reasons why a student response is at one of the codes in a rubric and
expertise in and current experience with the curriculum and the grades being assessed.
Members of the range-finding committees use their scoring expertise to assign the appropriate generic rubric or item-specific rubric
codes to a set of student responses for each group of assessment items; shared the codes they have assigned with the other members of the committees;
13
work collaboratively with the other members of the committees, under the guidance of an EQAO education officer, to reach consensus on appropriate codes for each student response used to train scorers;
make recommendations for refinements to the item-specific rubrics and suggest wording for the annotations explaining the codes assigned.
Overview of the Range-Finding Process 1. Range-finding committee members (including subject experts and current classroom teachers)
are recruited and selected for each assessment. 2. Range-finding committee meetings are facilitated by EQAO education officers. After
thorough training, the committees are often divided into groups of three or four members. 3. Each group discusses a set of items, prompts and associated item-specific and generic scoring
rubrics and recommends appropriate responses to be used as anchors, training papers and qualifying test items to train scorers for each task. The discussions focus on the content and requirements of each item or task; group agreement on the scores/codes for student responses and scoring rules, as required, to ensure consistent scoring of each item or task.
Preparing Training Materials for Online Scoring
EQAO education officers prepare materials to train scorers for scoring both field-test and operational open-response items. They consider all recommendations and scoring decisions reached during the range-finding process and make final decisions about which student responses will be used for anchors, scorer training, qualifying tests and monitoring the validity (accuracy) and reliability (consistency) of scoring.
Training and online materials include introductory video for online scoring generic and/or item-specific rubrics; anchors that are a good (or “solid”) representation of the codes in the scoring rubrics; training papers that represent both solid score-point responses and unusual responses (e.g.,
shorter than average, atypical approaches, a mix of very low and very high attributes); annotations for each anchor and training paper used; solid score-point responses for one or more qualifying tests; responses to be used for ongoing training during the daily calibration activity (operational
scoring only) and solid responses used for monitoring real time validity (operational scoring only).
Field-Test Scoring
Field-test scoring generally follows operational scoring. Since field-test items are to be used in future assessments, they are scored according to the same high standards applied to the scoring of operational items. To ensure the consistency of year-to-year scoring and to reduce the time required for training, the most reliable and productive scoring leaders and scorers of operational items are selected to score field-test items similar to the operational items they have already scored. Education officers arrange for sufficient copies of materials to train the scorers of field-test items. All training materials are kept secure.
14
Training Field-Test Scoring Field-test scorers and leaders are trained on the scoring requirements of field-test items, tasks, and generic and item-specific rubrics in order to produce valid and reliable item- and task-specific data for operational test construction.
Education Officers train scorers for each task, designated according to open-response reading and mathematics items and short-writing tasks. Training includes an introduction to the purpose of field-test scoring; an explanation of the need to report suspected abuse to the Children’s Aid Society; a grounding in field-test scoring procedures (using the first item or task and its scoring rubric,
anchors and training papers); a qualifying test on the first item or task (when field-test scoring does not immediately follow
operational scoring) and an introduction to subsequent items and tasks and their scoring rubrics, anchors and training
papers prior to scoring them.
Standards for passing the qualifying test are the same as those for scoring operational items.
Scoring Open-Response Field-Test Items A sample of approximately 1200 demographically representative English- and 500 French-language student responses for each field-test item or prompt is scored. One exception is the Grade 9 French-language mathematics assessment, for which an average of 50 to 350 French-language student responses for each field-test item is scored. The number of French Grade 9 mathematics field-test items scored varies according to the number of students enrolled in the applied and academic courses.
In-depth training for the first item or prompt is provided to scorers by their scoring leader. For the OSSLT, when field-test scoring does not immediately follow operational scoring, scorers write a qualifying test on the first item or prompt before scoring begins. Qualifying tests are also developed for each open-response and short-writing item for scoring of field-test items. Scorers are trained on each item and complete the scoring of one item before proceeding to the next.
Item-analysis statistical reports are prepared following field-test scoring. These reports, together with scorer comments related to field-test item performance, are used to inform test construction.
Developing Additional Scorer-Training Materials Before Scoring Operational Items When the full range of training materials has not been used for field-test scoring of open-response reading or mathematics items, or writing tasks, EQAO develops additional scoring materials using the original range-finding data or field-test scoring data. In the latter case, education officers collect student responses in bundles of high, medium, low and mixed range, so that range finders can select additional scorer-training materials (e.g., anchors, training papers or qualifying tests) for operational scoring.
Education officers are responsible for arranging all of the materials required to train the scorers who are to score operational items.
Scoring Open-Response Operational Items
EQAO has rigorous policies and procedures for the scoring of operational assessment items and tasks to ensure the reliability of assessment results.
15
The primary, junior and Grade 9 assessments are scored by qualified Ontario educators. The primary and junior assessments are scored by educators representing all the primary and junior grades. The Grade 9 Assessment of Mathematics is scored by educators with expertise in mathematics and experience working with Grade 9 students. Scoring provides teachers with valuable professional development in the area of understanding curriculum expectations and assessing student achievement.
The OSSLT is scored before the end of the school year. EQAO recruits as many teacher-scorers (i.e., members of the Ontario College of Teachers) as possible and fills the complement of required scorers with retired educators and qualified non-educators (or “other-degree scorers”). As part of the initial screening process administered by the contractor that recruits the other-degree scorers, applicants write a test to ensure that they have sufficient proficiency in English or French to score the test effectively.
Online Scoring Open-Response Operational Items
Education Officers prepare all scoring materials for each open-response. Scoring Leaders and Supervisors are trained by Education Officer.
Operational assessment items are scored under the leadership of Education Officers, Leaders, and Supervisors. All scorers are trained to use the EQAO scoring guide (rubrics and anchors) for each item they score. Following training, scorers must pass a qualifying test. The validity (accuracy) and reliability (consistency) of scoring is tracked daily at the scoring site, and retraining occurs when required. All scoring procedures are conducted under the supervision of EQAO’s program managers and education officers. See sample Day 1 and 2 below:
Day 1: Leaders/Supervisors review all training materials to familiarize themselves with the assigned item(s); qualify to score by completing the qualifying test; work individually or with partners and EO’s to begin validity selection by scoring student responses. The Education Officer approves all selected validity. Validity selection may continue throughout the scoring session depending on the item and completion date.
Day 2: Education Officers facilitate group sessions with Leaders/Supervisors about roles and expectations, sharing of experiences and preparation of general messaging to help ensure consistent communication with scorers once scoring begins on Day 3.
Day 3: Online scoring begins. Scorers independently review all scoring modules from a remote location and have two opportunities to pass the qualifying test. They can communicate and ask questions via the chat function with Supervisors/Leaders. Once scorers have passed the qualifying test, they begin scoring student responses. Productivity and Validity is regularly monitored daily. Interventions take place to maintain reliability and to meet metric standards.
Scorers work remotely and score individually. Scorers can dialogue with their Supervisor/Leader/Education Officer through the Chat and Note functions for any queries on anomalous responses.
Operational open-response reading, writing and mathematics items for the primary and junior assessments and operational mathematics items for the Grade 9 assessment are single scored.
Each open-response reading item and writing task on the OSSLT is scored by two trained scorers independently, using the same rubric. A “blind scoring” model is used: that is, scorers do not
16
know what score has been assigned by the other scorer. The routing system automatically ensures that responses are read by two different scorers. If the two scores are in exact agreement, that score is assigned to the student. If the two scores are adjacent, the higher score (for reading and short-writing tasks) or the average of the two scores (for news reports and paragraphs expressing an opinion) is assigned to the student. If the two scores are non-adjacent, the response is scored again by an expert scorer, to determine the correct score for the student. This rigour ensures that parents, students and teachers can be confident that all students have received valid scores.
Training for Scoring Open-Response Operational Items The purpose of training is to develop a clear and common understanding of the scoring materials so that each scoring leader, scoring supervisor and scorer applies the scoring materials in the same way, resulting in valid (accurate) and reliable (consistent) student scores.
Training of Scoring Leaders and Scoring Supervisors for Scoring Open-Response Operational Items Scoring leaders must have subject expertise and be, first and foremost, effective teachers of adults. They must encourage scorers to abandon preconceived notions about scoring procedures and align their thinking and judgment to the procedures and scoring materials for the items being scored. The responsibilities of scoring leaders include training all scoring supervisors and scorers for the designated item(s); overseeing the scoring of items; ensuring that scoring materials are applied consistently and resolving issues that arise during scoring.
Scoring leaders, in collaboration with supervisors, are also responsible for reviewing and analyzing daily data reports to ensure that a high quality of scoring occurs for their designated item(s).
Scoring supervisors are selected from a pool of experienced and proficient EQAO scorers. Scoring supervisors assist scoring leaders and ensure that their assigned scorers are qualified and are scoring accurately.
The training for scoring leaders and scoring supervisors is conducted before scoring begins. EQAO education officers train scoring leaders and oversee the training of scoring supervisors. Supervisor training is substantially similar to the training and qualifying for scorers. The only difference is that supervisors receive additional training regarding scoring materials, item-management and issues that may arise during scoring.
Following training and prior to scoring, scoring leaders and scoring supervisors must pass a qualifying test that involves scoring 14–20 student responses for the items they will be assigned to score. The items included in the qualifying test are selected during the range-finding process. Scoring leaders and supervisors must attain at least an 80% exact and a 100% exact-plus-adjacent match with the expertly assigned scores. Scoring leaders or supervisors who fail the qualifying test may not continue in the role of leader or supervisor.
Training of Scorers for Scoring Open-Response Operational Items The purpose of training for open-response operational items is to ensure that all scorers become experts in scoring specific items or subsets of items. All operational items require a complete set of scoring materials: generic or item-specific rubrics, anchors (real student responses illustrating work at each code in the rubric) and their annotations, training papers, a qualifying test, validity
17
papers (primary, junior, OSSLT) or validity booklets (Grade 9) and items for the daily calibration activity.
To obtain high levels of validity (accuracy) and reliability (consistency) during scoring, EQAO adheres to stringent criteria for selecting, training and qualifying scorers. Various other quality control procedures, as outlined below, are used during the scoring process to identify scorers who need to be retrained or dismissed from scoring.
All the scorers are trained to score the same items using the same scoring materials. These scoring materials are approved by EQAO and cannot be altered. During training, scorers are told they may have to adjust their thinking about scoring student performance in a classroom setting in order to accept EQAO’s standards and practices for its assessments.
Training for scorers takes approximately half a day and includes general instructions about the security, confidentiality and suitability of the scoring materials; instructions on entering scores used to collect scoring data; a thorough review and discussion of the scoring materials for each item to be scored (the item,
generic or item-specific rubrics, anchors and their annotations): o emphasis is placed on the scorer’s understanding of how the responses differ in incremental
quality and how each response reflects the description of its code on the rubric and o the anchors consist of responses that are typical of each score code (rather than unusual or
uncommon) and solid (rather than controversial or “borderline”) and the scoring of a series of validity papers or validity booklets (Grade 9), consisting of selected,
expertly-scored student responses. Scorers are also trained to read responses in their entirety prior to making any scoring decisions; view responses as a whole rather than focusing on particular details such as spelling; remain objective and fair and view the whole response through the filter of the rubric and score all responses in the same way, to avoid adjusting their scoring to take into account a
characteristic they assume about a student (e.g., special education needs, being an English language learner).
Following training and prior to scoring, scorers must pass a qualifying test consisting of 14–20 student responses to all the items they will be assigned to score. These items are selected during the range-finding process as examples of solid score points for rubrics. Scorers must attain at least a 70% exact match with the expertly assigned score. This ensures that scorers have understood and can apply the information they received during training. Scorers who fail the qualifying test the first time may undergo further training and write the test a second time. Scorers who fail to pass the qualifying test a second time are dismissed.
Procedures at the Online Scoring Headquarters
Students at Risk On occasion, a student’s response to an open-response item will contain evidence that he or she may be at risk (e.g., response contains content that states or implies threats of violence to oneself or others, or possible abuse or neglect). Copies of student responses that raise concerns are sent to the student’s local Children’s Aid Society. It is the legal responsibility and duty of scorers, in consultation with the online scoring headquarters manager, to inform the Children’s Aid Society of such cases.
18
Inappropriate Content, Cheating and Other Issues Student responses to open-response items occasionally contain inappropriate content or evidence of possible teacher interference or other issues. Booklets containing any such issues are sent to the exceptions room to be resolved by an EQAO staff member. The resolution may involve contact with a school to seek clarification.
Offensive Content Obscene, racist or sexist content in student response booklets is reviewed by EQAO staff to determine whether the school should be contacted. If the offensive content warrants it, EQAO will notify the school.
Cheating When there is any evidence in a booklet that may indicate some form of irregularity (e.g., many changed answers, teacher interference), the booklet is reviewed by EQAO staff to determine whether the school should be notified. In cases where cheating is confirmed, no scores are provided for the student.
Damaged or Misprinted Booklets In very few cases, booklets given to students are torn, stapled incorrectly or have missing pages or a defaced barcode that cannot be scanned. In such cases, students are not penalized. These damaged booklets/images are further reviewed by EQAO staff to determine whether the results in these booklets should be pro-rated based on the results in booklets unaffected by such problems.
Ongoing Daily Training Scoring leaders provide clarification on scoring of specific items and key elements of item-specific rubrics dailyin their scoring rooms. EQAO conducts morning and afternoon training to refresh scorers’ understanding of the scoring materials and to ensure that they apply the scoring materials accurately and consistently from one day to the next, and before and after lunch breaks.
Daily Morning Review of Anchors Scoring leaders ask scorers to begin each day with a review of all or a portion of the rubrics and anchors. The purpose of the review is to refocus scorers and highlight any section of the rubrics that require attention. This review is more comprehensive after a weekend break (or following any extended break).
Daily Scoring Headquarters Reports for Monitoring the Quality of Open-Response Item Scoring Scoring leaders and supervisors receive daily data reports showing daily and cumulative validity, reliability and productivity data for individual scorers and for groups of scorers assigned to their item(s). These data reports are described below.
Daily and Cumulative Validity During scoring, EQAO tracks the validity (accuracy) of scorers through the use of validity papers, which were identified during range finding and were scored by an expert. Scorers score a percentage of validity papers each day. Their scores are compared to the scores assigned by the expert. The validity papers ensure that scorers are giving correct and accurate scores that compare to those assigned during the range-finding process. Scoring leaders and supervisors use the results of the comparisons to determine whether scorers are drifting from the scoring standards (established during scorer training) and whether any retraining is required. During scoring, all scorers are expected to maintain a minimum accuracy rate on the validity papers. The target accuracy rates are as follows: 75% exact and 95% adjacent for three-point rubrics, 70%

19
exact and 95% exact-plus-adjacent agreement for four-point rubrics, 65% exact and 95% exact-plus-adjacent agreement for five-point rubrics and 60% exact and 95% exact-plus-adjacent agreement for six-point rubrics.
“Exact agreement” means that the code or score point assigned to an open-response item by a pair of scorers is exactly the same. “Adjacent” means that there is a difference of one score point between the codes assigned to an open-response item by a pair of scorers. “Non-adjacent” means that there is a difference of more than one score point between the codes assigned to an open-response item by a pair of scorers. The data reports summarize daily and cumulative levels of agreement (exact, adjacent, and high or low non-adjacent agreement) on validity papers with pre-set scores.
The reports also include a cumulative-trend review and are summarized by item or item set, rubric, group and scorer. Scorers are listed from low to high validity. Scorers not meeting the exact-agreement requirement are highlighted in the report.
Accuracy is measured primarily by the use of validity metrics. The daily data reports for scorers who pass the qualifying test after retraining are carefully monitored to ensure that the scorers continue to meet standards. If, after a minimum of 10 validity items, a scorer falls below the required exact-plus-adjacent-agreement standards, the scorer receives retraining (including a careful review of the anchors). If retraining does not correct the situation, the scorer may be dismissed. The scores of dismissed scorers are audited and, if necessary, re-scored.
Daily and Cumulative Mean-Score and Score-Point Distribution Daily and cumulative mean-score and score-point distribution data reports are used to monitor individual scorer drift. They confirm validity and guide ongoing training (based on calibration items) at both the individual and item group levels.
These reports identify and summarize (by item or item set, group, rubric and scorer) the daily and cumulative mean score and the distribution of assigned score points.
Daily and Cumulative Reliability (for OSSLT only) All open-response OSSLT items are routed for a second scoring, which is used to monitor interrater reliability. The reports identify and summarize daily and cumulative levels of interrater agreement, including exact, adjacent, and high and low non-adjacent agreement. The reports are summarized by item or item set, group, rubric and scorer, and scorers are listed from low to high reliability. Scorers not meeting the exact-agreement requirements (which are the same as those for scoring validity) are highlighted in the report.
Daily and Cumulative Productivity During scoring, EQAO tracks the online scoring headquarters productivity and monitors progress through daily productivity reports to ensure that all scoring will be completed during the scoring session. The reports show the number and percentage of responses for which the scoring is complete. These reports, which are provided to scoring leaders and supervisors, report daily and cumulative productivity. The reports also track the productivity of each scorer to ensure that daily targets and minimums are met. Productivity targets and minimums are set for each item, taking into consideration the subset of items being scored.
The reports are summarized by group and individual scorer and include the daily and cumulative number of student responses scored and a cumulative-trend review. The reports list scorers from low to high productivity. Scorers not meeting the minimum productivity rate for the same item

20
are highlighted in the report. Scoring leaders and supervisors review the data highlighted in this report to determine whether retraining is required for any scorer.
Scoring completion reports also compare, on a daily and cumulative basis, the number of scorings completed with completion targets for each item.
Aggregated Daily and Cumulative Individual Scorer Data These reports combine validity data with secondary data for each scorer. The aggregated daily and cumulative individual scorer data reports include daily and cumulative validity data, daily and cumulative reliability (for the OSSLT only), mean score and productivity data. The reports list scorers from low to high validity. Scorers not meeting the exact-agreement requirement of 75% on three-point rubrics, 70% on four-point rubrics, 65% on five-point rubrics or 60% on six-point rubrics are highlighted in this report. As such, this report assists the scoring leaders in identifying the scorers that require retraining.
Required Actions: Consequences of the Review and Analysis of Daily Online Scoring Headquarters Data Reports Scoring leaders are responsible for the daily review and analysis of all scoring headquarters data reports to ensure the quality of the scoring. EQAO personnel (the chief assessment officer, director of assessment and reporting, and education officers) also review the daily reports and work with scoring leaders to identify individual scorers who need retraining, groups of scorers who need retraining, calibration items that will ensure quality scoring, issues arising that require additional training for scorers scoring the same item and productivity issues.
Scoring leaders share the data and discuss data-related issues with the appropriate scoring supervisors so that interventions can be planned. The following occurs when a scorer is not meeting the validity metrics: The scorer is retrained and re-qualified if the exact-plus-adjacent standard is not met. The scorer is retrained and participates in recalibration if the exact-agreement requirement is
not met.
Scorers, as well as their leaders and supervisors, are required to demonstrate their ability to score student responses accurately and consistently throughout training, qualification and scoring. Scoring supervisors and scorers must meet EQAO standards for validity and productivity in order to continue. If a scoring supervisor or scorer does not meet one or more of these standards, he or she will receive retraining. If his or her scoring does not improve, the scoring supervisor or scorer may be dismissed. Scoring leaders and supervisors document all retraining as well as decisions about retention or dismissal of a scorer.
Auditing EQAO audits individual student score sheets (i.e., student records showing the scores assigned to selected open-response items) for inconsistencies that may indicate incomplete scoring. Any booklet scored entirely blank is rerouted for a second scoring.
Scorer Validity and Reliability
The procedures used for estimating the validity and reliability of EQAO assessments are summarized below. The estimates of validity and interrater reliability are presented in Appendix
21
4.1. Two sets of results are reported for each writing prompt: one for topic development and one for conventions.
Scoring Validity As described earlier in this chapter, scoring validity is assessed by having scorers assign scores to validity papers and validity booklets, which are student responses that have been scored by an expert panel. For the primary and junior assessments and for the OSSLT, a set of five validity papers is prepared, copied and distributed to all scorers each morning and afternoon. In addition, the original student booklets that these validity papers were copied from are used as blind validity booklets and circulated to provide additional validity material for the scorers. For Grade 9, only blind validity booklets are used, and they are circulated as frequently as possible so that most scorers can score at least 10 validity booklets per day. The sets of validity papers are not used for Grade 9 because high levels of scorer consistency have been achieved over the years through the use of the blind validity booklets only.
Validity is assessed by examining the agreement between the scores assigned by the scorers and those assigned by the expert panel. The following six indices are computed: percentage of exact agreement, percentage of exact-plus-adjacent agreement, percentage of adjacent agreement, percentage of adjacent-low agreement, percentage of adjacent-high agreement and percentage of non-adjacent agreement.
“Adjacent-low” means that the score assigned to a certain response by a scorer is one point below the score assigned by the expert panel. “Adjacent-high” means that the score is one point above the score given by the expert panel, and “non-adjacent” means that the difference between the scores assigned by the scorer and the expert panel is greater than one score point.
The Assessments of Reading, Writing and Mathematics: Primary and Junior Divisions There are 10, three and eight open-response items for the reading, writing and mathematics components of the assessments, respectively. Four-point scoring rubrics are used for reading and mathematics. For the writing components, there are two short-writing prompts and one long-writing prompt that are scored for topic development and use of conventions. A four-point scoring rubric is used for topic development and a three-point scoring rubric for conventions. The scoring validity estimates for reading, writing and mathematics for the primary and junior divisions are presented in Tables 4.1.1–4.1.12 of Appendix 4.1. The statistics are provided for each item and for the aggregate of the items for each assessment. For writing, the aggregate statistics for short-writing prompts, long-writing prompts and all prompts are provided separately.
In 2015-2016, the EQAO target of 95% exact-plus-adjacent agreement for validity was met for all items in reading, writing and mathematics. The aggregate validity estimates for exact-plus-adjacent agreement ranged from 98.8–99.6%.
The Grade 9 Assessment of Mathematics: Academic and Applied The Grade 9 Assessment of Mathematics has separate English-language and French-language versions for students enrolled in academic and applied courses. The assessment is administered in January for students in mathematics courses in the first semester and in June for students in second-semester and full-year courses. The scoring validity estimates for the Grade 9 Assessment of Mathematics are presented in Tables 4.1.13–4.1.16 of Appendix 4.1 for both administrations. The tables present statistics for each open-response item and the aggregate for open-response items for each administration. They also include aggregate statistics across the winter and spring administrations, because both were scored during the same scoring session in
22
July 2016. Seven items were scored for each administration using four-point rubrics for a total of 56 items across both administrations. The EQAO target of 95% exact-plus-adjacent agreement for validity was met for all but three items on the French-language applied assessment and four items on the French-language academic assessment. The aggregate validity estimates ranged from 94.9–99.6%.
The Ontario Secondary School Literacy Test (OSSLT) The scoring validity estimates for the OSSLT are reported in Tables 4.1.17–4.1.20 of Appendix 4.1. For each test, four reading items were scored with three-point rubrics, and two long-writing prompts were scored with a six-point rubric for topic development and a four-point rubric for conventions. Two short-writing prompts were scored with a three-point rubric for topic development and a two-point rubric for conventions, which were combined into a five-point rubric for the purposes of validity statistics. Aggregate statistics are provided separately for reading items, short-writing prompts, long-writing prompts and all writing prompts. In 2015–2016, the EQAO target of 95% exact-plus-adjacent agreement for validity was met for all but one item. The aggregate validity estimates ranged from 96.5–99.4%.
Scorer Reliability (for OSSLT only)
Test reliability is affected by different sources of measurement error. In the case of open-response items, inconsistency in scoring is the source of error. To determine the reliability of open-response scoring for the OSSLT, all student responses to open-response items are scored automatically by at least two scorers. Scoring reliability is determined from the scores assigned by the two independent scorers for each student response.
The percentage of agreement between the scores awarded by a pair of scorers is known as the interrater reliability. Four indices are used to identify the interrater reliability: percentage of exact agreement, percentage of exact-plus-adjacent agreement, percentage of adjacent agreement and percentage of non-adjacent agreement. Scoring reliability estimates for the OSSLT are presented in Tables 4.1.21–4.1.24 of Appendix 4.1. The EQAO target of 95% exact-plus-adjacent agreement for interrater reliability was met for all but one reading item, for none of the short-writing prompts and for three of the long-writing prompts. The aggregate reliability estimates ranged from 92.3–98.1%.
23
CHAPTER 5: EQUATING
For security purposes, EQAO constructs different assessments every year while ensuring that content and statistical specifications are similar to those of the assessments from previous years. Despite such efforts to ensure similarity, assessments from year to year may differ somewhat in their difficulty. To account for this, EQAO uses a process called equating, which adjusts for differences in difficulty between assessments from year to year (Kolen & Brennan, 2004). Equating ensures that students in one year are not given an unfair advantage over students in another and that reported changes in achievement levels are due to differences in student performance and not to differences in assessment difficulty. The equating processes conducted by EQAO staff are replicated by an external contractor to ensure accuracy.
From time to time, the Ministry of Education makes modifications to The Ontario Curriculum, and EQAO assessments are modified accordingly in content and length. The new assessments differ in content and statistical specifications from those constructed in previous years, prior to the curriculum revisions. In such cases, EQAO uses a process called scaling to link the previous years’ assessments with the current year’s modified ones.
The processes used in equating and scaling are similar, but their purposes are different. Equating is used to adjust for differences in difficulty among assessments that are similar in content and statistical specifications. Scaling is used to link two assessments that are different in content and statistical specifications (Kolen & Brennan, 2004). Since there were no significant changes to the test specifications from 2014–2015 to 2015–2016, only equating procedures were used in 2015–2016.
The following sections describe the Item Response Theory (IRT) models, equating design, equating samples and calibration procedures used during the 2015–2016 school year for the various EQAO assessments.
IRT Models
Item-response models define the relationship between an unobserved construct or proficiency (, or theta) and the probability (P) of a student correctly answering a dichotomously scored item. For polytomously scored items, the models define the relationship between an unobserved construct or proficiency and the probability of a student receiving a particular score on the item. The Three-Parameter Logistic (3PL) model and the Generalized Partial Credit (GPC) model are the general models used by EQAO to estimate the parameters of multiple-choice and open-response items and the proficiency parameters. The 3PL model (see Yen & Fitzpatrick, 2006, for example) is given by Equation 1:
)(
)(
exp1
exp)1()(
ii
ii
bDa
bDa
iii ccP
, (1)
where )(iP is the probability of a student with proficiency answering item i correctly;
ai is the slope parameter for item i; bi is the difficulty parameter for item i;
ic is the pseudo-guessing parameter for item i and
D is a scaling constant equal to 1.7.
24
The GPC model (Muraki, 1997) is given by Equation 2:
iM
c
c
vhii
h
vhii
ih
dbDa
dbDa
P
0 0
0
)(exp
)(exp
)(
, h = 0, 1, …, Mi, (2)
where )(ihP is the probability of a student with proficiency choosing the hth score
category for item i;
ia is the slope parameter for item i;
ib is the difficulty parameter for item i;
hd is the category parameter for category h of item i;
D is a scaling constant equal to 1.7 and
iM is the maximum score on item i.
Equating Design
The fixed common-item-parameter non-equivalent group design is used to equate EQAO assessments over different years. Common items are sets of items that are identical in two assessments and are used to create a common scale for all the items in the assessments. These common items are selected from the field-test items administered in one year and used as operational items in the next. The following steps are used in equating for the EQAO assessments: 1. Operational item parameters in the current year’s assessments are calibrated. 2. Operational items and field-test items from the previous year are brought forward to the
current year’s assessments and recalibrated: This is done by fixing the parameters of the items common to the two years at the values
obtained in Step 1. This process places the item parameters from the two years on the same scale.
3. Recalibrated parameters for the operational items from the previous year are then used to rescore the corresponding equating sample: For the OSSLT, the theta value of the cut point (corresponding to the percentage of
successful students in the previous year) is then identified and applied to the current year’s test-score distribution to obtain the percentage of successful and unsuccessful students for the current year.
For the primary, junior and Grade 9 assessments, the theta values of the cut points (corresponding to the percentage of students at each performance level) are identified and then applied to the current year’s test-score distribution to obtain the percentage of students at each performance level for the current year.
Calibration and Equating Samples
For each assessment, EQAO uses a set of exclusion rules to select calibration and equating samples. The exclusion rules ensure that the samples are representative of the population of students who wrote the assessment under typical administration conditions. While the exclusion rules are similar for all assessments, there are some differences. Therefore, the exclusion rules are provided below in the description of the equating conducted for each assessment. The equating and calibration samples are identical for the current assessment year; for the previous
25
year, the calibration sample was reduced further by excluding students who did not answer any of the field-test items that were brought forward to the operational test for the current year.
Calibration
Calibration is the process of estimating the item parameters that determine the relationship between proficiency and the probability of answering a multiple-choice item correctly or receiving a particular score on a polytomously scored open-response item. For each assessment, the calibration of the items for the English-language and the French-language populations is conducted separately. The calibrations are conducted using the program PARSCALE 4.1 (Muraki & Bock, 2003).
Identification of Items to be Excluded from Equating
A key assumption in the common-item non-equivalent groups design is that the common items should behave similarly from field testing (FT) to operational testing (OP). In order to determine which items did not behave similarly, and thus should be excluded from equating, a four-step process is followed for each assessment. This process relies on judgment, as Kolen and Brennan (2004) stated: “removal of items that appear to be outliers is clearly a judgmental process” (p. 188).
First, scatter plots are produced to compare the common-item parameter estimates (both discrimination estimates and difficulty estimates, including item-category difficulty estimates of OR items) from FT to OP. Ninety-five-percent confidence intervals are constructed for both FT- and OP-item parameter estimates, and the best-fit line is also estimated. An item is flagged as an outlier if neither its FT confidence interval nor its OP confidence interval crosses the best-fit line. For each open-response item, an individual plot is constructed of its OP- and FT-category difficulty estimates. If the category difficulty estimates are not monotonically increasing and/or they are not far off the best-line line, then this open-response item is also flagged for further analysis.
Second, in order to determine which of the outlying items identified in the first step to focus on for further investigation, several additional factors are considered: whether an item is flagged by both the OP-FT difficulty and OP-FT discrimination plots, whether it has a large difference between OP and FT classical item statistics and whether there is a large change in its position in the booklets from FT to OP.
Third, once it is decided which outliers to focus on, these items are excluded from the common-item set, and sensitivity analyses are conducted to evaluate the impact on equating results. The resulting theta cut scores and percentages at each achievement level are compared with those from the initial round of equating, when no item was excluded from equating. The resulting achievement levels of students are compared with their initial levels.
Finally, another factor that informs the final decision making concerns the slopes of the best-fit lines in the plots of the parameter estimates. Theoretically, the slope of the best-fit line in the plot of item-difficulty estimates should be the reciprocal of that in the plot of item-discrimination estimates (see Kolen & Brennan, 2004, for example), so these slopes are examined with and without excluding an outlier to see in which case the reciprocal relationship holds.
When it comes to excluding items from equating, the overarching principle is to be conservative. That is, a common item should not be excluded from equating unless there is strong evidence to
26
support exclusion. A common item is part of an equating link, and generally, the larger the number of common items, the stronger the link.
The Assessments of Reading, Writing and Mathematics: Primary and Junior Divisions
Description of the IRT Model A modified 3PL model (Equation 1) is used for multiple-choice items on the primary- and junior-division assessments, with the pseudo-guessing parameter fixed at 0.20 [ )1/(1 k , where k is the number of options] to reflect the possibility of students with very low proficiency to correctly answer an item. The GPC model (Equation 2) is used for open-response items.
Equating Sample: Exclusion Rules The following categories of students were excluded from the equating samples for 2014–2015 and 2015–2016: 1. students who were not attending a publicly funded school; 2. students who were home-schooled; 3. French Immersion students; 4. students who completed no work on an item (by booklet and item type); 5. students receiving accommodations; 6. students who were exempted and 7. students who did not attempt at least one item in each significant part of the test.
Using these exclusion rules, three student samples were obtained, as presented in Table 5.1: 1. students from the 2014–2015 population who responded to both the 2015–2016 operational-
test items and the field-test items that had been brought forward to form the 2015–2016 operational tests and who were not excluded by the rules stated above (calibration sample);
2. students from the 2014–2015 population who wrote the operational test and who were not excluded by the rules stated above (equating sample) and
3. students from the 2015–2016 population who wrote the operational test and who were not excluded by the rules stated above (calibration and equating samples).
Table 5.1 Number of Students in the Calibration and Equating Samples for the 2014–2015 and 2015–2016 Primary- and Junior-Division Assessments (English and French)
Assessment
Number of Students 2015–2016
Calibration and Equating Sample
2014–2015 Calibration Sample
2014–2015 Equating Sample
Primary Reading (English) 95 252 8 209 29 212 Junior Reading (English) 100 322 8 626 30 618
Primary Reading (French) 7 230 2 042 6 206 Junior Reading (French) 6 278 1 750 5 267
Primary Writing (English) 95 623 14 534 29 319 Junior Writing (English) 100 377 14 580 30 643
Primary Writing (French) 7 257 4 559 6 238 Junior Writing (French) 6 280 3 133 5 264
Primary Mathematics (English) 91 137 26 730 28 763 Junior Mathematics (English) 102 157 27 493 31 119
Primary Mathematics (French) 7 343 6 240 6 284 Junior Mathematics (French) 6 412 4 969 5 368
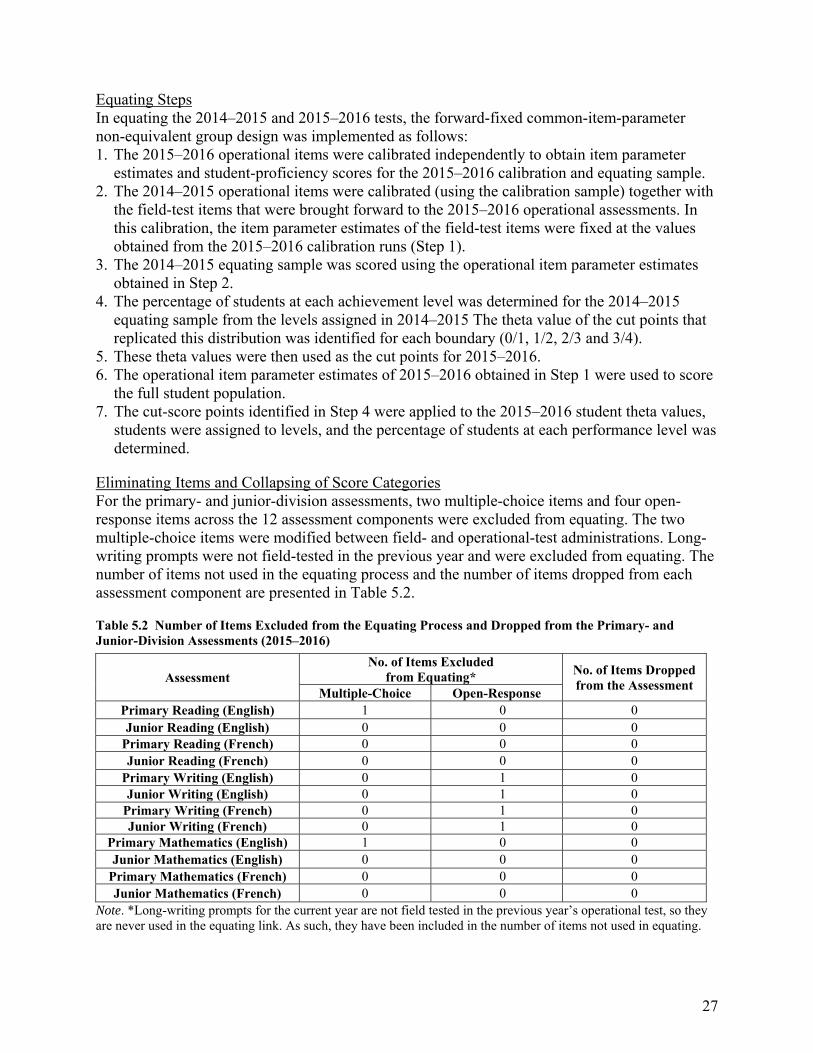
27
Equating Steps In equating the 2014–2015 and 2015–2016 tests, the forward-fixed common-item-parameter non-equivalent group design was implemented as follows: 1. The 2015–2016 operational items were calibrated independently to obtain item parameter
estimates and student-proficiency scores for the 2015–2016 calibration and equating sample. 2. The 2014–2015 operational items were calibrated (using the calibration sample) together with
the field-test items that were brought forward to the 2015–2016 operational assessments. In this calibration, the item parameter estimates of the field-test items were fixed at the values obtained from the 2015–2016 calibration runs (Step 1).
3. The 2014–2015 equating sample was scored using the operational item parameter estimates obtained in Step 2.
4. The percentage of students at each achievement level was determined for the 2014–2015 equating sample from the levels assigned in 2014–2015 The theta value of the cut points that replicated this distribution was identified for each boundary (0/1, 1/2, 2/3 and 3/4).
5. These theta values were then used as the cut points for 2015–2016. 6. The operational item parameter estimates of 2015–2016 obtained in Step 1 were used to score
the full student population. 7. The cut-score points identified in Step 4 were applied to the 2015–2016 student theta values,
students were assigned to levels, and the percentage of students at each performance level was determined.
Eliminating Items and Collapsing of Score Categories For the primary- and junior-division assessments, two multiple-choice items and four open-response items across the 12 assessment components were excluded from equating. The two multiple-choice items were modified between field- and operational-test administrations. Long-writing prompts were not field-tested in the previous year and were excluded from equating. The number of items not used in the equating process and the number of items dropped from each assessment component are presented in Table 5.2.
Table 5.2 Number of Items Excluded from the Equating Process and Dropped from the Primary- and Junior-Division Assessments (2015–2016)
Assessment No. of Items Excluded
from Equating* No. of Items Dropped from the Assessment
Multiple-Choice Open-Response Primary Reading (English) 1 0 0 Junior Reading (English) 0 0 0
Primary Reading (French) 0 0 0 Junior Reading (French) 0 0 0
Primary Writing (English) 0 1 0 Junior Writing (English) 0 1 0
Primary Writing (French) 0 1 0 Junior Writing (French) 0 1 0
Primary Mathematics (English) 1 0 0 Junior Mathematics (English) 0 0 0
Primary Mathematics (French) 0 0 0 Junior Mathematics (French) 0 0 0
Note. *Long-writing prompts for the current year are not field tested in the previous year’s operational test, so they are never used in the equating link. As such, they have been included in the number of items not used in equating.
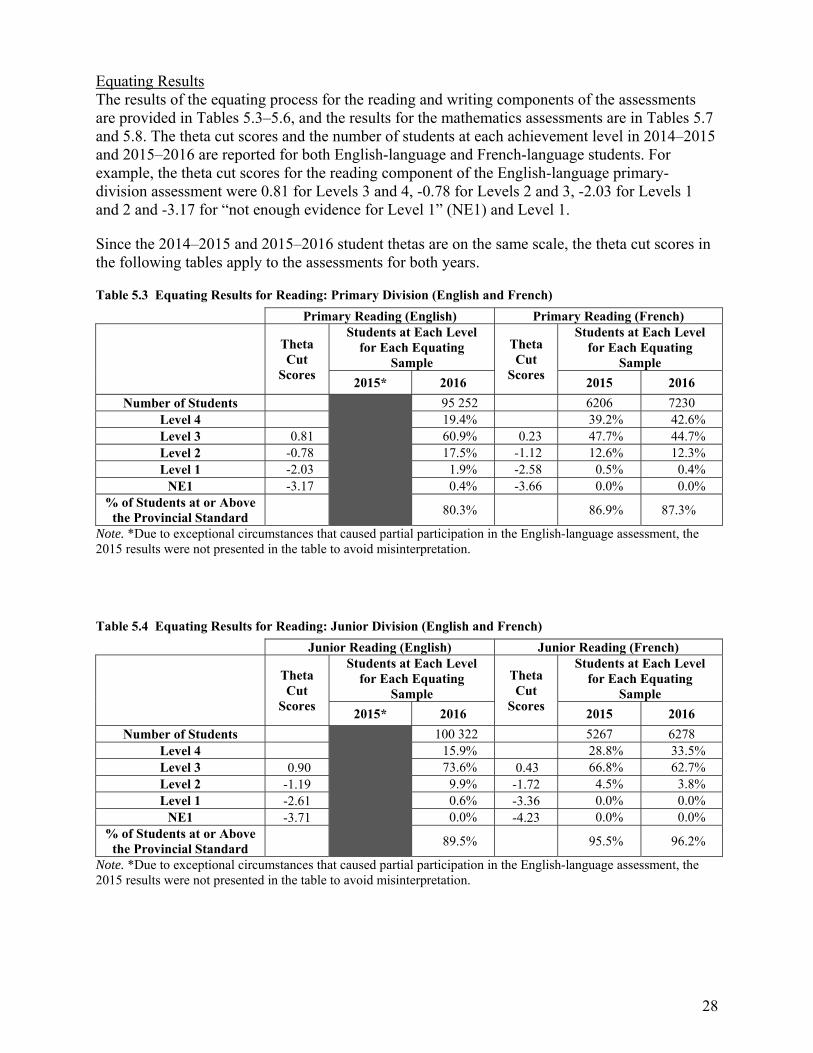
28
Equating Results The results of the equating process for the reading and writing components of the assessments are provided in Tables 5.3–5.6, and the results for the mathematics assessments are in Tables 5.7 and 5.8. The theta cut scores and the number of students at each achievement level in 2014–2015 and 2015–2016 are reported for both English-language and French-language students. For example, the theta cut scores for the reading component of the English-language primary-division assessment were 0.81 for Levels 3 and 4, -0.78 for Levels 2 and 3, -2.03 for Levels 1 and 2 and -3.17 for “not enough evidence for Level 1” (NE1) and Level 1.
Since the 2014–2015 and 2015–2016 student thetas are on the same scale, the theta cut scores in the following tables apply to the assessments for both years.
Table 5.3 Equating Results for Reading: Primary Division (English and French)
Primary Reading (English) Primary Reading (French)
Theta Cut
Scores
Students at Each Level for Each Equating
Sample
Theta Cut
Scores
Students at Each Level for Each Equating
Sample
2015* 2016 2015 2016
Number of Students
95 252 6206 7230 Level 4 19.4% 39.2% 42.6% Level 3 0.81 60.9% 0.23 47.7% 44.7% Level 2 -0.78 17.5% -1.12 12.6% 12.3% Level 1 -2.03 1.9% -2.58 0.5% 0.4%
NE1 -3.17 0.4% -3.66 0.0% 0.0% % of Students at or Above
the Provincial Standard 80.3% 86.9% 87.3%
Note. *Due to exceptional circumstances that caused partial participation in the English-language assessment, the 2015 results were not presented in the table to avoid misinterpretation.
Table 5.4 Equating Results for Reading: Junior Division (English and French)
Junior Reading (English) Junior Reading (French)
Theta Cut
Scores
Students at Each Level for Each Equating
Sample
Theta Cut
Scores
Students at Each Level for Each Equating
Sample
2015* 2016 2015 2016
Number of Students
100 322 5267 6278 Level 4 15.9% 28.8% 33.5% Level 3 0.90 73.6% 0.43 66.8% 62.7% Level 2 -1.19 9.9% -1.72 4.5% 3.8% Level 1 -2.61 0.6% -3.36 0.0% 0.0%
NE1 -3.71 0.0% -4.23 0.0% 0.0% % of Students at or Above
the Provincial Standard 89.5% 95.5% 96.2%
Note. *Due to exceptional circumstances that caused partial participation in the English-language assessment, the 2015 results were not presented in the table to avoid misinterpretation.
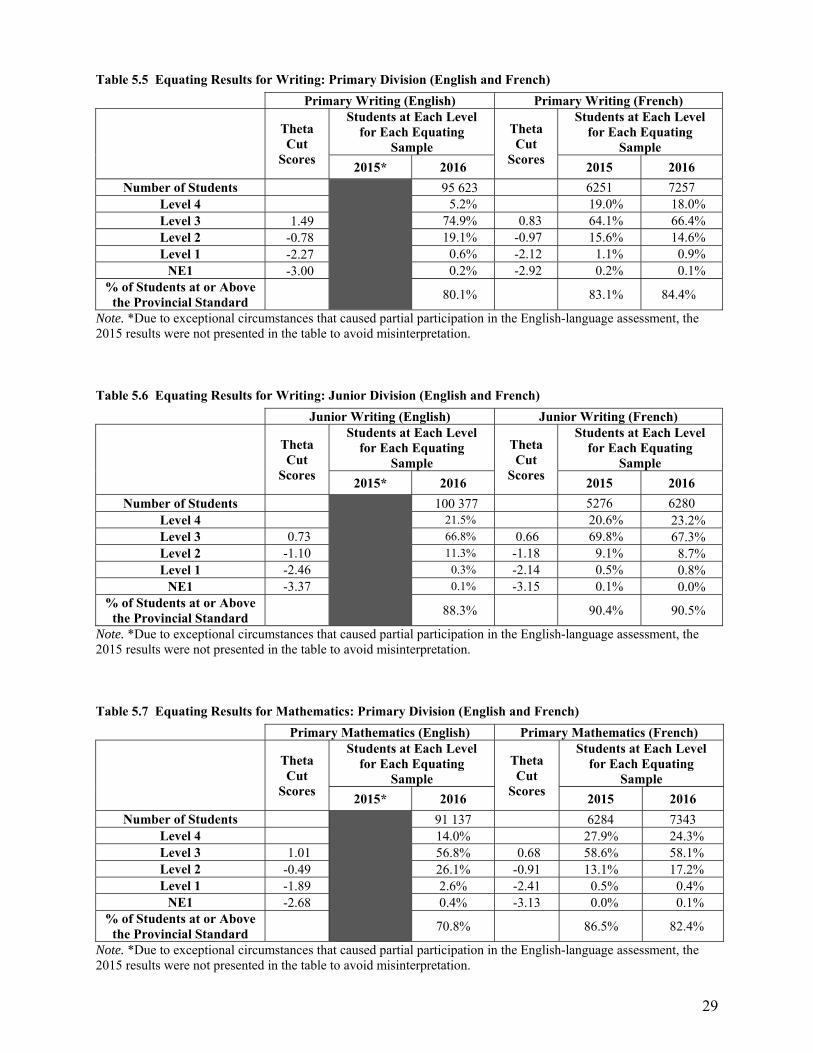
29
Table 5.5 Equating Results for Writing: Primary Division (English and French)
Primary Writing (English) Primary Writing (French)
Theta Cut
Scores
Students at Each Level for Each Equating
Sample
Theta Cut
Scores
Students at Each Level for Each Equating
Sample
2015* 2016 2015 2016
Number of Students
95 623 6251 7257 Level 4 5.2% 19.0% 18.0% Level 3 1.49 74.9% 0.83 64.1% 66.4% Level 2 -0.78 19.1% -0.97 15.6% 14.6% Level 1 -2.27 0.6% -2.12 1.1% 0.9%
NE1 -3.00 0.2% -2.92 0.2% 0.1% % of Students at or Above
the Provincial Standard 80.1% 83.1% 84.4%
Note. *Due to exceptional circumstances that caused partial participation in the English-language assessment, the 2015 results were not presented in the table to avoid misinterpretation.
Table 5.6 Equating Results for Writing: Junior Division (English and French)
Junior Writing (English) Junior Writing (French)
Theta Cut
Scores
Students at Each Level for Each Equating
Sample
Theta Cut
Scores
Students at Each Level for Each Equating
Sample
2015* 2016 2015 2016
Number of Students
100 377 5276 6280 Level 4 21.5% 20.6% 23.2% Level 3 0.73 66.8% 0.66 69.8% 67.3% Level 2 -1.10 11.3% -1.18 9.1% 8.7% Level 1 -2.46 0.3% -2.14 0.5% 0.8%
NE1 -3.37 0.1% -3.15 0.1% 0.0% % of Students at or Above
the Provincial Standard 88.3% 90.4% 90.5%
Note. *Due to exceptional circumstances that caused partial participation in the English-language assessment, the 2015 results were not presented in the table to avoid misinterpretation.
Table 5.7 Equating Results for Mathematics: Primary Division (English and French)
Primary Mathematics (English) Primary Mathematics (French)
Theta Cut
Scores
Students at Each Level for Each Equating
Sample
Theta Cut
Scores
Students at Each Level for Each Equating
Sample
2015* 2016 2015 2016
Number of Students
91 137 6284 7343 Level 4 14.0% 27.9% 24.3% Level 3 1.01 56.8% 0.68 58.6% 58.1% Level 2 -0.49 26.1% -0.91 13.1% 17.2% Level 1 -1.89 2.6% -2.41 0.5% 0.4%
NE1 -2.68 0.4% -3.13 0.0% 0.1% % of Students at or Above
the Provincial Standard 70.8% 86.5% 82.4%
Note. *Due to exceptional circumstances that caused partial participation in the English-language assessment, the 2015 results were not presented in the table to avoid misinterpretation.
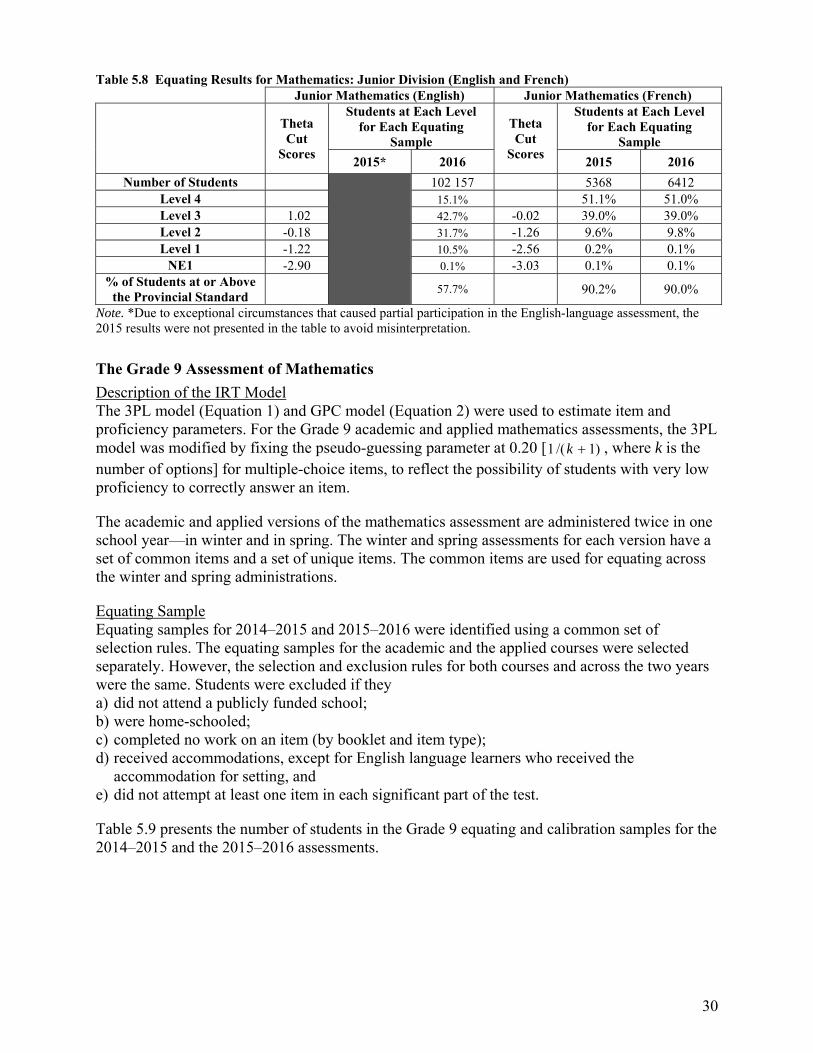
30
Table 5.8 Equating Results for Mathematics: Junior Division (English and French) Junior Mathematics (English) Junior Mathematics (French)
Theta Cut
Scores
Students at Each Level for Each Equating
Sample
Theta Cut
Scores
Students at Each Level for Each Equating
Sample
2015* 2016 2015 2016
Number of Students
102 157 5368 6412 Level 4 15.1% 51.1% 51.0% Level 3 1.02 42.7% -0.02 39.0% 39.0% Level 2 -0.18 31.7% -1.26 9.6% 9.8% Level 1 -1.22 10.5% -2.56 0.2% 0.1%
NE1 -2.90 0.1% -3.03 0.1% 0.1% % of Students at or Above
the Provincial Standard 57.7% 90.2% 90.0%
Note. *Due to exceptional circumstances that caused partial participation in the English-language assessment, the 2015 results were not presented in the table to avoid misinterpretation.
The Grade 9 Assessment of Mathematics
Description of the IRT Model The 3PL model (Equation 1) and GPC model (Equation 2) were used to estimate item and proficiency parameters. For the Grade 9 academic and applied mathematics assessments, the 3PL model was modified by fixing the pseudo-guessing parameter at 0.20 [ )1/(1 k , where k is the number of options] for multiple-choice items, to reflect the possibility of students with very low proficiency to correctly answer an item.
The academic and applied versions of the mathematics assessment are administered twice in one school year—in winter and in spring. The winter and spring assessments for each version have a set of common items and a set of unique items. The common items are used for equating across the winter and spring administrations.
Equating Sample Equating samples for 2014–2015 and 2015–2016 were identified using a common set of selection rules. The equating samples for the academic and the applied courses were selected separately. However, the selection and exclusion rules for both courses and across the two years were the same. Students were excluded if they a) did not attend a publicly funded school; b) were home-schooled; c) completed no work on an item (by booklet and item type); d) received accommodations, except for English language learners who received the
accommodation for setting, and e) did not attempt at least one item in each significant part of the test.
Table 5.9 presents the number of students in the Grade 9 equating and calibration samples for the 2014–2015 and the 2015–2016 assessments.
31
Table 5.9 Number of Grade 9 Students in the Equating Samples
Version
2014–2015 2015–2016 English French English French
Calibration Sample
Equating Sample
Calibration Sample
Equating Sample
Calibration and Equating Sample
Calibration and Equating Sample
Academic 79 862 85 229 3 860 3 861 95 144 4 181 Applied 28 075 28 259 1 011 1 086 32 034 1 213
Equating Steps The calibration and equating of the 2014–2015 and 2015–2016 assessments for the English-language and the French-language student populations in both the academic and applied courses were conducted using the following steps:
1. A concurrent calibration was conducted for the 2015–2016 winter and spring samples. 2. Calibration (concurrent) and equating were conducted for the 2014–2015 winter and spring
samples (including the field-test items that were brought forward to the 2015–2016 operational test). In this calibration, the item parameter estimates of the field-test items that were brought forward to the 2015–2016 operational tests were fixed at the values obtained from the 2015–2016 calibration runs (Step 1). The parameter estimates of the 2014–2015 operational items that were repeated on the 2015–2016 tests were also fixed at the values obtained from the 2015–2016 calibration runs (Step 1). The 2014–2015 equating samples (operational items only) were scored using the scaled 2014–2015 operational-item parameter estimates.
3. The percentage of students in each achievement level was determined for the 2014–2015 equating sample using the levels assigned in 2014–2015. The theta-value cut points that replicated this distribution were identified for each boundary (0/1, 1/2, 2/3 and 3/4).
4. These theta values were then used as the cut scores for the 2015–2016 assessments. 5. The parameter estimates for the 2015–2016 operational items obtained in Step 1 were used to
score the full student population. 6. The cut-score points identified in Step 4 were applied to the 2015–2016 student theta values to
classify students to achievement levels, and the percentage of students at each performance level was determined.
Eliminating Items and the Collapsing of Score Categories For the Grade 9 mathematics assessments, no item was excluded during the equating process (see Table 5.10).
Table 5.10 Number of Items Excluded from the Equating Process and Dropped: Grade 9 (2015–2016)
Assessment Version No. of Items Excluded from Equating No. of Items Dropped
from the Assessment Multiple-Choice Open-Response Applied, Winter (English) 0 0 0 Applied, Spring (English) 0 0 0
Academic, Winter (English) 0 0 0 Academic, Spring (English) 0 0 0 Applied, Winter (French) 0 0 0 Applied, Spring (French) 0 0 0
Academic, Winter (French) 0 0 0 Academic, Spring (French) 0 0 0
32
Equating Results The equating results for the applied version of the Grade 9 Assessment of Mathematics are summarized in Table 5.11. The results for the academic version are summarized in Table 5.12. The theta cut scores and percentage of students in 2014–2015 and 2015–2016 at each achievement level are reported for both the English-language and French-language students. For example, the equated cut scores for the English-language applied version of the assessment were 1.19 for Levels 3 and 4, 0.04 for Levels 2 and 3, -0.93 for Levels 1 and 2, and -1.64 for “below Level 1” and Level 1.
Table 5.11 Equating Results for the Grade 9 Applied Mathematics Assessment
English Applied French Applied
Theta Cut
Scores
Students at Each Level for Each Equating Sample
Theta Cut
Scores
Students at Each Level for Each Equating Sample
2015* 2016 2015 2016 Number of Students
28 259 1086 1213 Level 4 10.7% 8.2% 7.8% Level 3 1.19 37.5% 1.29 42.8% 45.2% Level 2 0.04 35.0% -0.06 38.8% 38.3% Level 1 -0.93 13.1% -1.32 8.7% 7.2%
Below Level 1 -1.64 3.7% -1.99 1.5% 1.5% % of Students at or Above
the Provincial Standard 48.2% 50.2% 53.0%
Note. *Due to exceptional circumstances that caused partial participation in the assessment in the English-language assessment, the 2015 results were not presented in the table to avoid misinterpretation.
Table 5.12 Equating Results for the Grade 9 Academic Mathematics Assessment
English Academic French Academic
Theta Cut
Scores
Students at Each Level for Each Equating Sample
Theta Cut
Scores
Students at Each Level for Each Equating Sample
2015* 2016 2015 2016 Number of Students 95 144 3861 4181
Level 4 10.9% 6.3% 7.4% Level 3 1.19 73.6% 1.40 76.7% 78.8% Level 2 -0.98 11.0% -1.04 12.7% 10.6% Level 1 -1.60 4.3% -1.70 4.2% 3.2%
Below Level 1 -2.65 0.1% -2.79 0.0% 0.0% % of Students at or Above
the Provincial Standard 84.6% 83.1% 86.2%
Note. *Due to exceptional circumstances that caused partial participation in the assessment in the English-language assessment, the 2015 results were not presented in the table to avoid misinterpretation.
The Ontario Secondary School Literacy Test (OSSLT)
Description of the IRT Model In contrast to the primary-division, junior-division and Grade 9 assessments, both the a-parameter and the c-parameter (see Equation 1) were fixed for the OSSLT, yielding a modified Rasch model for multiple-choice items. The a-parameter for all multiple-choice and open-response items was set at 0.588. The pseudo-guessing parameter for multiple-choice items was set at 0.20 [ )1/(1 k ], where k is the number of options that reflect the possibility of students with very low proficiency to correctly answer an item]. The GPC model (see Equation 2), with a
33
constant slope parameter of 0.588, was used to estimate the item and proficiency parameters for open-response items.
Equating Sample First-time eligible students from both publicly funded and private schools were selected for the 2014–2015 and 2015–2016 equating samples. The following categories of students were excluded from the equating samples: a) students with no work or incomplete work on a major section of the test; b) students receiving the following accommodations: assistive devices and technology, sign
language, Braille, an audio recording or verbatim reading of the test, a computer, audio- or video-recorded responses and scribing;
c) previously eligible students; d) students who were exempted, deferred or taking the Ontario Secondary School Literacy
Course (OSSLC) and e) students who were home-schooled.
Table 5.13 presents the number of first-time eligible students in the OSSLT equating samples for the 2014–2015 and 2015–2016 tests.
Table 5.13 Number of First-Time Eligible OSSLT Students in the Equating Samples
OSSLT 2015 2016
English French English French
First-Time Eligible 125 644 4 859 120 706 4 675
Equating Steps The following steps were implemented to calibrate and equate the 2015 and 2016 OSSLT: 1. The parameter estimates of the operational items administered in 2016 were calibrated using
the 2016 equating sample. 2. The operational items that formed the 2015 test and the field-test items brought forward to the
2016 test were recalibrated using the 2015 equating sample. In this calibration, the parameter estimates of the common items were fixed at the values obtained in Step 1.
3. The operational item parameter estimates of the 2015 test, obtained in Step 2, were used to score the 2015 equating sample data.
4. The percentage of successful students was determined for the 2015 equating sample from the student results reported in 2015. The theta-value cut point that replicated this percentage was identified for the distribution of scores in the 2015 equating sample.
5. This theta value was applied to student scores for the 2016 assessment to determine which students would be successful. The results are presented in Table 5.14.
Scale Score The reporting scale scores for the 2016 OSSLT, which range from 200 to 400, were generated using a linear transformation. The slope and intercept were obtained by fixing two points: the theta value −4.0 was fixed at the lowest value of the scale score (200), and the theta cut score obtained from the equating steps was fixed at the scale score of 300.
Eliminating Items and Collapsing of Score Categories One multiple-choice English-language and three multiple-choice French-language items were excluded from the equating process due to modifications made to the items between the 2015 field-test and the 2016 operational-test administrations.
34
The score 1.0 in the scoring rubric for long-writing prompts was collapsed with the score 1.5 for topic development and the use of conventions for both the English- and the French-language tests.
Equating Results The equating results based on the equating samples for the OSSLT are summarized in Table 5.14. The theta cut score and the percentages of successful and unsuccessful students in 2015 and 2016 are reported for English-language and French-language students. For example, the equated cut score for the English-language test was -0.70. The percentage of successful students in the equating samples was 84.7% in 2015 and 83.8% in 2016.
Table 5.14 Equating Results for the OSSLT
English-Language French-Language
Theta Cut Point
2015–2016
Equating Sample
2015
Equating Sample
2016
Theta Cut Point
2015–2016
Equating Sample
2015
Equating Sample
2016
No. of Students 125 644 120 706 4859 4675
% Successful -0.70 84.7% 83.8% -1.14 90.9% 92.7%
Unsuccessful 15.3% 16.2% 9.1% 7.3%
References Kolen, M. J. & Brennan, R. L. (2004). Test equating, scaling, and linking: Methods and
practices (2nd ed.). New York, NY: Springer-Verlag.
Muraki, E. (1997). A generalized partial credit model. In W. J. Van der Linden, & R. K. Hambleton (Eds.), Handbook of modern item response theory (pp. 153–164). New York, NY: Springer-Verlag.
Muraki, E. & Bock, R. D. (2003). PARSCALE: IRT item analysis and test scoring for rating-scale data. (Version 4.1) [Computer Software]. Chicago, IL: Scientific Software International.
Yen, W. M. & Fitzpatrick, A. R. (2006). Item response theory. In R. L. Brennan (Ed.), Educational measurement (4th ed.) (pp.111–153). Westport, CT: American Council on Education and Praeger Publishers.
35
CHAPTER 6: REPORTING RESULTS
EQAO assessment results are reported at the student, school, school board and provincial levels.
EQAO typically publishes annual provincial reports for education stakeholders and the general public. The reports for the 2015–2016 English-language assessments are available at www.eqao.com.
EQAO’s Provincial Elementary School Report: Results of the 2015–2016 Assessments of Reading, Writing and Mathematics, Primary Division (Grades 1–3) and Junior Division (Grades 4–6)
EQAO’s Provincial Secondary School Report: Results of the Grade 9 Assessment of Mathematics and the Ontario Secondary School Literacy Test, 2015–2016
Corresponding reports for the French-language assessments are also available.
EQAO posts school and board results at www.eqao.com for public access. However, EQAO does not publicly release school or board results when the number of students that wrote an assessment is small enough that individual students could be identified (i.e., fewer than 10 students for achievement results and fewer than six students for questionnaire results).
Two types of aggregate results are reported for schools, boards (where data is available) and the province: 1. percentages based on all students enrolled in Grades 3 and 6, students enrolled in Grade 9
academic and applied mathematics courses and students eligible to write the OSSLT and 2. percentages based on students who participated in each assessment.
More detailed school and board results are posted on the secure section of the EQAO Web site and are available only to school and school board personnel through user identification numbers and passwords. These reports include the results for small n-counts that are suppressed in the public reports and additional achievement results for sub-groups of the student population (i.e., English language learners, students with special education needs, French Immersion students in Grade 3). Results for male and female students are included in both the public and secure reports. In addition, schools and school boards receive data files with individual student achievement results for all their students and data files with aggregated results for each school, board and the province.
In 2012, EQAO introduced EQAO Reporting, an interactive Web-based reporting application that enables school principals to access their school’s EQAO data and to link achievement data to contextual and attitudinal data. This application was made available to elementary school principals in 2012 and to secondary school principals in 2013. Since all of the data previously provided in the detailed reports can be generated in EQAO Reporting, EQAO has phased out the secure detailed reports.
Directors of education are provided with graphs that show the number and percentage of schools with achievement levels in specified categories (e.g., 75% of their students having achieved the provincial standard) and access to the EQAO Reporting application, which enables them to view the results for all schools in the board and to link achievement data with demographic data. The directors also receive school lists with achievement results over time, for convenient reference.

36
Reporting the Results of the Assessments of Reading, Writing and Mathematics: Primary and Junior Divisions
The four achievement levels defined in The Ontario Curriculum are used by EQAO to report on student achievement in reading, writing and mathematics. Level 3 has been established as the provincial standard. Levels 1 and 2 indicate achievement below the provincial standard, and Level 4 indicates achievement above the provincial standard. There are three reporting categories in addition to the four performance levels: not enough evidence for Level 1 (NE1), no data and exempt.
Two sets of results are reported: those based on all students and those based on participating students. Students without data and exempted students are not included in the calculation of results for participating students. In EQAO Reporting, principals can generate the following types of data for the province, board and school: overall jurisdictional results for each component of an assessment; longitudinal data showing jurisdictional results over time; overall jurisdictional results for each assessment component by gender and other relevant
characteristics (e.g., English language learners, special education needs, French Immersion); results for sub-groups of students based on contextual, achievement or attitudinal data; areas of strength and areas for improvement with respect to sections of the curriculum; data for individual items and collections of items, with a link to the actual items; cohort-tracking results from Grade 3 to Grade 6; contextual data and student questionnaire results. Results for the teacher and principal questionnaires are reported at the board and provincial levels. Some results for the questionnaires are included in the provincial reports. Full results for all questionnaires are posted on EQAO’s public Web site, www.eqao.com.
In addition, schools receive the Item Information Report: Student Roster, which provides item results for each student who has completed each assessment and summary item statistics for the school, board and province. The data for individual students are also provided in data files. Results by exceptionality category and for students receiving each type of accommodation are provided for each school, board and province.
The Individual Student Report (ISR) for students in Grades 3 and 6 shows the overall achievement level for each component (reading, writing and mathematics) at one of five positions. For example, Level 1 includes the sub-categories 1.1, 1.3, 1.5, 1.7 and 1.9. The five sub-categories are created from the distribution of student theta scores. Through the equating process described in Chapter 5, four theta values are identified that define the cut points between adjacent achievement levels (i.e., NE1 and Level 1, Level 1 and Level 2, Level 2 and Level 3 and Level 3 and Level 4). The width of each sub-category in a given level is determined by the range of theta values represented in the level, divided by five. These results are designated in student data files accordingly as 1.1, 1.3, 1.5, 1.7, and so on, to 4.9. School, school board and provincial results are included on the ISR to provide a context for interpreting student results. For students in Grade 6, the assessment results they achieved in Grade 3, if available, are printed on their ISR. The ISR also includes a description of the student work typically provided by
37
students at each achievement level and suggestions for assisting students to progress beyond their achieved level.
Reporting the Results of the Grade 9 Assessment of Mathematics
Reporting for the Grade 9 mathematics assessment is very similar to that for the primary- and junior-division assessments. The same four achievement levels with five sub-categories are used to report student achievement.
However, there are some differences in the reports for the Grade 9 assessment. For instance, the option to exempt students from the Grade 9 mathematics assessment was removed in 2007. Moreover, the reporting category “not enough evidence for Level 1” is called “below Level 1” for the Grade 9 assessment. In addition to the disaggregations identified for the primary- and junior-division assessments, results for the Grade 9 mathematics assessment are reported for Semester 1, Semester 2 and the full year. Furthermore, there is no principal questionnaire for the Grade 9 assessment. Mathematics assessment results achieved in Grades 3 and 6, if available, are printed on the Grade 9 ISR.
The provincial, board and school reports provide the following: overall jurisdictional results for the academic and applied courses; longitudinal data showing jurisdictional results over time; overall jurisdictional results by gender and other relevant characteristics (e.g., English
language learners, special education needs, semester); results by exceptionality category and results for students receiving each type of
accommodation (board and province only); areas of strength and areas for improvement with respect to the curriculum expectations; cohort-tracking results from Grade 6 to Grade 9 (provincial results are provided for tracking
students from Grade 3 to Grade 6 to Grade 9); contextual data and student questionnaire results.
Reporting the Results of the OSSLT
For the OSSLT, EQAO reports only two levels of achievement: successful and unsuccessful. A successful result on the OSSLT (or the successful completion of the OSSLC) is required to meet the literacy requirement for graduation. Students must achieve a minimum theta score to receive a successful result on the OSSLT. The process for establishing this minimum score is described in Chapter 5. EQAO provides feedback to unsuccessful students to assist them in working to achieve the minimum score.
As with the other assessments, EQAO reports results for all students and for participating students. Students are considered to be “not participating” if they were deferred, opted to take the OSSLC or have no data for the current administration. Students who are not working toward the OSSD are exempt from the OSSLT and are not included in either reported population. Aggregated results are reported separately for first-time eligible students and previously eligible students. Previously eligible students are those who were unsuccessful on a previous administration, were deferred from a previous administration or arrived in an Ontario school during their Grade 11 or 12 year.
The OSSLT provincial, board and school reports provide the following: overall successful and unsuccessful jurisdictional results;
38
overall successful and unsuccessful jurisdictional results by gender and other characteristics (e.g., English language learners, special education needs);
results by exceptionality category and for students receiving each type of accommodation (board and province only);
results by type of English- or French-language course—academic, applied, locally developed, English as a second language (ESL) or English literacy development (ELD), “actualisation linguistique en français” (ALF) or “programme d’appui aux nouveaux arrivants” (PANA);
longitudinal data showing jurisdictional results over time; areas of strength with respect to the curriculum expectations; cohort-tracking results from Grade 3 to Grade 6 to the OSSLT and results for the student questionnaire and contextual data.
In addition, schools receive the student rosters, which provide item results for each student who completed the test and summary item statistics for the school, board and province.
The OSSLT ISR provides the following: the statement of a successful or unsuccessful result; the student’s scale score; the median scale score for the school and province; feedback for students on areas of strength and areas for improvement and the Grade 3 and Grade 6 reading and writing results for the student, if available.
Each unsuccessful student is informed that a successful result requires a scale score of 300.
Interpretation Guides
Guides for interpreting results are included in the school and board reports, and released test items and scoring guides are posted on the EQAO Web site. The Web-based EQAO Reporting application has a professional-development component built into it that provides directions on how to use the application and guidelines for using data for school improvement planning. EQAO delivers workshops on interpreting EQAO data and on using these data appropriately for school improvement planning. EQAO also produces the following resource document: “Guide to Using the Item Information Report: Student Roster.”
39
CHAPTER 7: STATISTICAL AND PSYCHOMETRIC SUMMARIES
A variety of statistical and psychometric analyses were conducted for the 2015–2016 assessments. The results from these analyses are summarized in this chapter, including results for Classical Test Theory (CTT), Item Response Theory (IRT), Differential Item Functioning (DIF) and decision accuracy and consistency. All IRT item parameter estimates were obtained from the calibration process used for the equating samples (described in Chapter 5). Detailed data for individual items appear in Appendix 7.1.
The Assessments of Reading, Writing and Mathematics: Primary and Junior Divisions
Classical Test Theory (CTT) Analysis
Table 7.1 presents descriptive statistics, Cronbach’s alpha estimates of test score reliability and the standard error of measurement (SEM) for the English-language and French-language versions of the primary and junior assessments. The test means (converted to percentages) ranged from 53.9% (for the reading component of the English-language primary-division assessment) to 67.8% (for the math component of the English-language primary-division assessment).
Reliability and the corresponding SEMs refer to the precision of test scores, with higher reliability coefficients and lower SEMs indicating higher levels of precision. For the primary and junior assessments, Cronbach’s alpha estimates range from 0.87 to 0.89 for reading, 0.81 to 0.82 for writing and 0.88 to 0.91 for mathematics. The corresponding standard errors of measurement range from 4.3% to 4.8% of the possible maximum score for reading, 6.6% to 7.6% of the possible maximum score for writing, and 6.0% to 6.1% of the possible maximum score for mathematics. The reliability coefficients for writing are a little lower than those for reading and mathematics. This is attributable, in part, to the smaller number of writing items and the subjectivity in scoring writing performance. Taking these two factors into account, the obtained reliability coefficients and standard errors of measurement are acceptable and indicate that the test scores from these assessments provide a satisfactory level of precision.
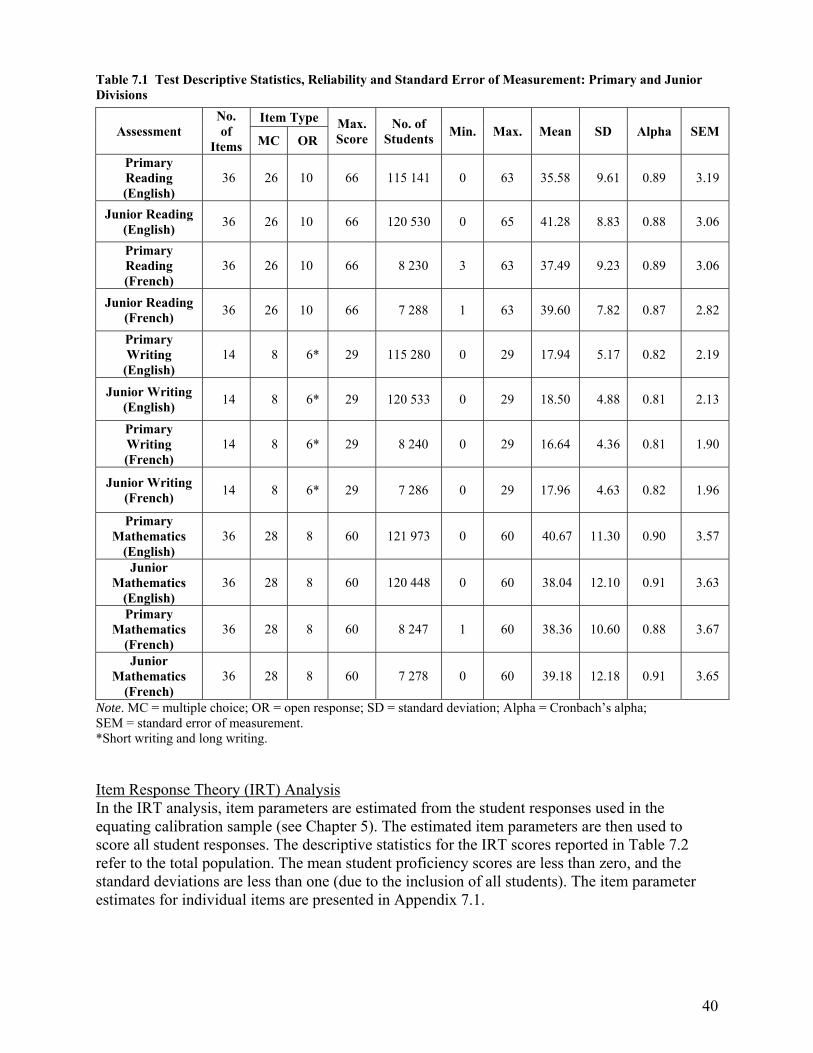
40
Table 7.1 Test Descriptive Statistics, Reliability and Standard Error of Measurement: Primary and Junior Divisions
Assessment No. of
Items
Item Type Max. Score
No. of Students
Min. Max. Mean SD Alpha SEM MC OR
Primary Reading (English)
36 26 10 66 115 141 0 63 35.58 9.61 0.89 3.19
Junior Reading (English)
36 26 10 66 120 530 0 65 41.28 8.83 0.88 3.06
Primary Reading (French)
36 26 10 66 8 230 3 63 37.49 9.23 0.89 3.06
Junior Reading (French)
36 26 10 66 7 288 1 63 39.60 7.82 0.87 2.82
Primary Writing
(English) 14 8 6* 29 115 280 0 29 17.94 5.17 0.82 2.19
Junior Writing (English)
14 8 6* 29 120 533 0 29 18.50 4.88 0.81 2.13
Primary Writing (French)
14 8 6* 29 8 240 0 29 16.64 4.36 0.81 1.90
Junior Writing (French)
14 8 6* 29 7 286 0 29 17.96 4.63 0.82 1.96
Primary Mathematics
(English) 36 28 8 60 121 973 0 60 40.67 11.30 0.90 3.57
Junior Mathematics
(English) 36 28 8 60 120 448 0 60 38.04 12.10 0.91 3.63
Primary Mathematics
(French) 36 28 8 60 8 247 1 60 38.36 10.60 0.88 3.67
Junior Mathematics
(French) 36 28 8 60 7 278 0 60 39.18 12.18 0.91 3.65
Note. MC = multiple choice; OR = open response; SD = standard deviation; Alpha = Cronbach’s alpha; SEM = standard error of measurement. *Short writing and long writing.
Item Response Theory (IRT) Analysis In the IRT analysis, item parameters are estimated from the student responses used in the equating calibration sample (see Chapter 5). The estimated item parameters are then used to score all student responses. The descriptive statistics for the IRT scores reported in Table 7.2 refer to the total population. The mean student proficiency scores are less than zero, and the standard deviations are less than one (due to the inclusion of all students). The item parameter estimates for individual items are presented in Appendix 7.1.
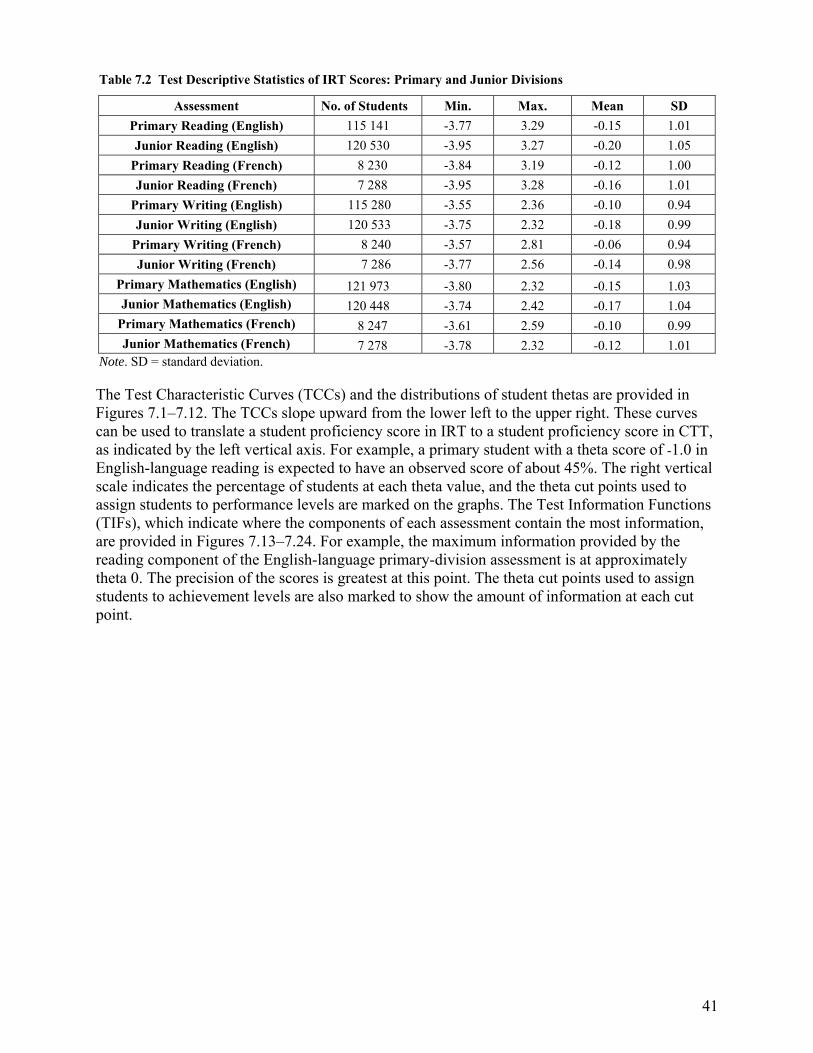
41
Table 7.2 Test Descriptive Statistics of IRT Scores: Primary and Junior Divisions
Note. SD = standard deviation.
The Test Characteristic Curves (TCCs) and the distributions of student thetas are provided in Figures 7.1–7.12. The TCCs slope upward from the lower left to the upper right. These curves can be used to translate a student proficiency score in IRT to a student proficiency score in CTT, as indicated by the left vertical axis. For example, a primary student with a theta score of -1.0 in English-language reading is expected to have an observed score of about 45%. The right vertical scale indicates the percentage of students at each theta value, and the theta cut points used to assign students to performance levels are marked on the graphs. The Test Information Functions (TIFs), which indicate where the components of each assessment contain the most information, are provided in Figures 7.13–7.24. For example, the maximum information provided by the reading component of the English-language primary-division assessment is at approximately theta 0. The precision of the scores is greatest at this point. The theta cut points used to assign students to achievement levels are also marked to show the amount of information at each cut point.
Assessment No. of Students Min. Max. Mean SD
Primary Reading (English) 115 141 -3.77 3.29 -0.15 1.01
Junior Reading (English) 120 530 -3.95 3.27 -0.20 1.05
Primary Reading (French) 8 230 -3.84 3.19 -0.12 1.00
Junior Reading (French) 7 288 -3.95 3.28 -0.16 1.01
Primary Writing (English) 115 280 -3.55 2.36 -0.10 0.94
Junior Writing (English) 120 533 -3.75 2.32 -0.18 0.99
Primary Writing (French) 8 240 -3.57 2.81 -0.06 0.94
Junior Writing (French) 7 286 -3.77 2.56 -0.14 0.98
Primary Mathematics (English) 121 973 -3.80 2.32 -0.15 1.03 Junior Mathematics (English) 120 448 -3.74 2.42 -0.17 1.04
Primary Mathematics (French) 8 247 -3.61 2.59 -0.10 0.99 Junior Mathematics (French) 7 278 -3.78 2.32 -0.12 1.01
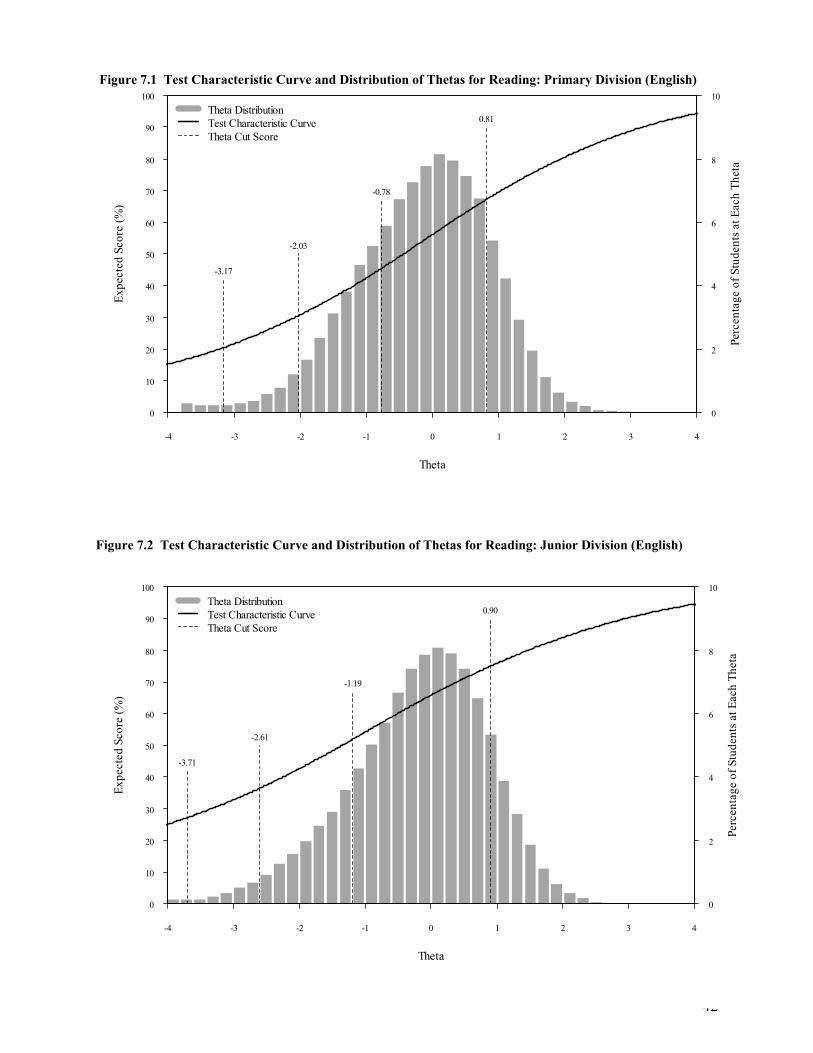
42
Figure 7.1 Test Characteristic Curve and Distribution of Thetas for Reading: Primary Division (English)
Figure 7.2 Test Characteristic Curve and Distribution of Thetas for Reading: Junior Division (English)
Perc
enta
ge o
f St
uden
ts a
t Eac
h T
heta
0
2
4
6
8
10
Theta
Exp
ecte
d Sc
ore
(%)
-4 -3 -2 -1 0 1 2 3 4
0
10
20
30
40
50
60
70
80
90
100
-3.17
-2.03
-0.78
0.81Theta DistributionTest Characteristic CurveTheta Cut Score
Perc
enta
ge o
f St
uden
ts a
t Eac
h T
heta
0
2
4
6
8
10
Theta
Exp
ecte
d Sc
ore
(%)
-4 -3 -2 -1 0 1 2 3 4
0
10
20
30
40
50
60
70
80
90
100
-3.71
-2.61
-1.19
0.90Theta DistributionTest Characteristic CurveTheta Cut Score
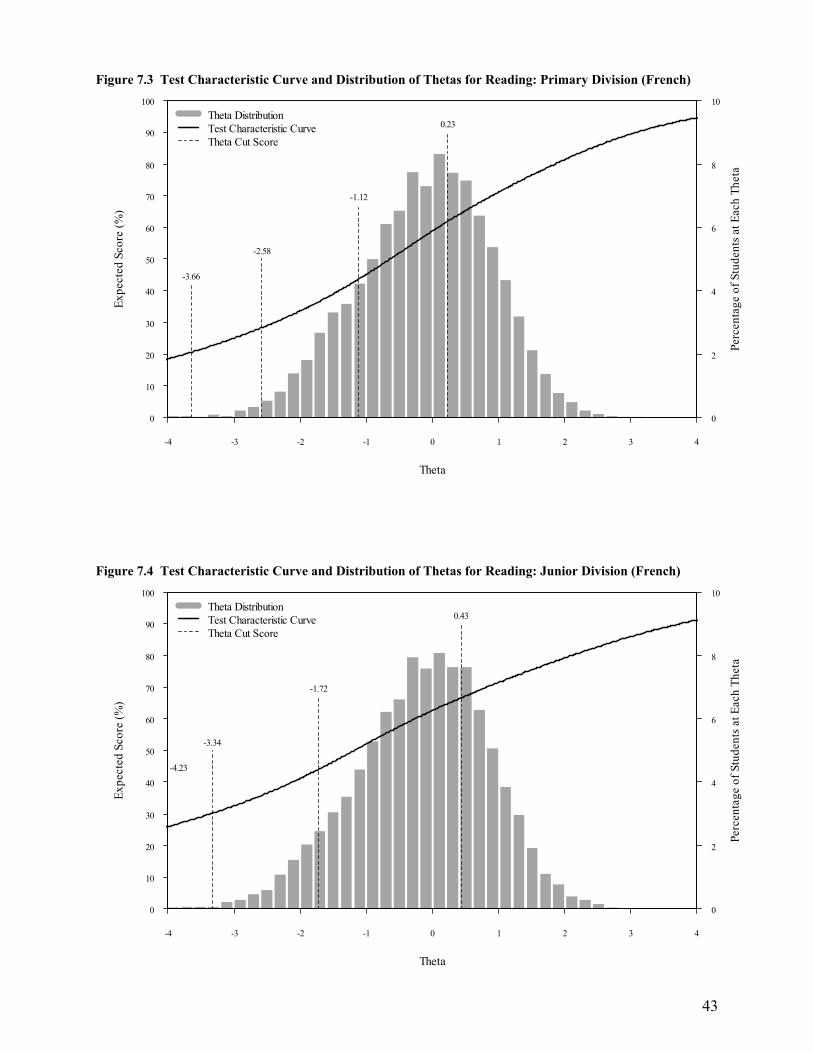
43
Figure 7.3 Test Characteristic Curve and Distribution of Thetas for Reading: Primary Division (French)
Figure 7.4 Test Characteristic Curve and Distribution of Thetas for Reading: Junior Division (French)
Perc
enta
ge o
f St
uden
ts a
t Eac
h T
heta
0
2
4
6
8
10
Theta
Exp
ecte
d Sc
ore
(%)
-4 -3 -2 -1 0 1 2 3 4
0
10
20
30
40
50
60
70
80
90
100
-3.66
-2.58
-1.12
0.23Theta DistributionTest Characteristic CurveTheta Cut Score
Perc
enta
ge o
f St
uden
ts a
t Eac
h T
heta
0
2
4
6
8
10
Theta
Exp
ecte
d Sc
ore
(%)
-4 -3 -2 -1 0 1 2 3 4
0
10
20
30
40
50
60
70
80
90
100
-4.23
-3.34
-1.72
0.43Theta DistributionTest Characteristic CurveTheta Cut Score
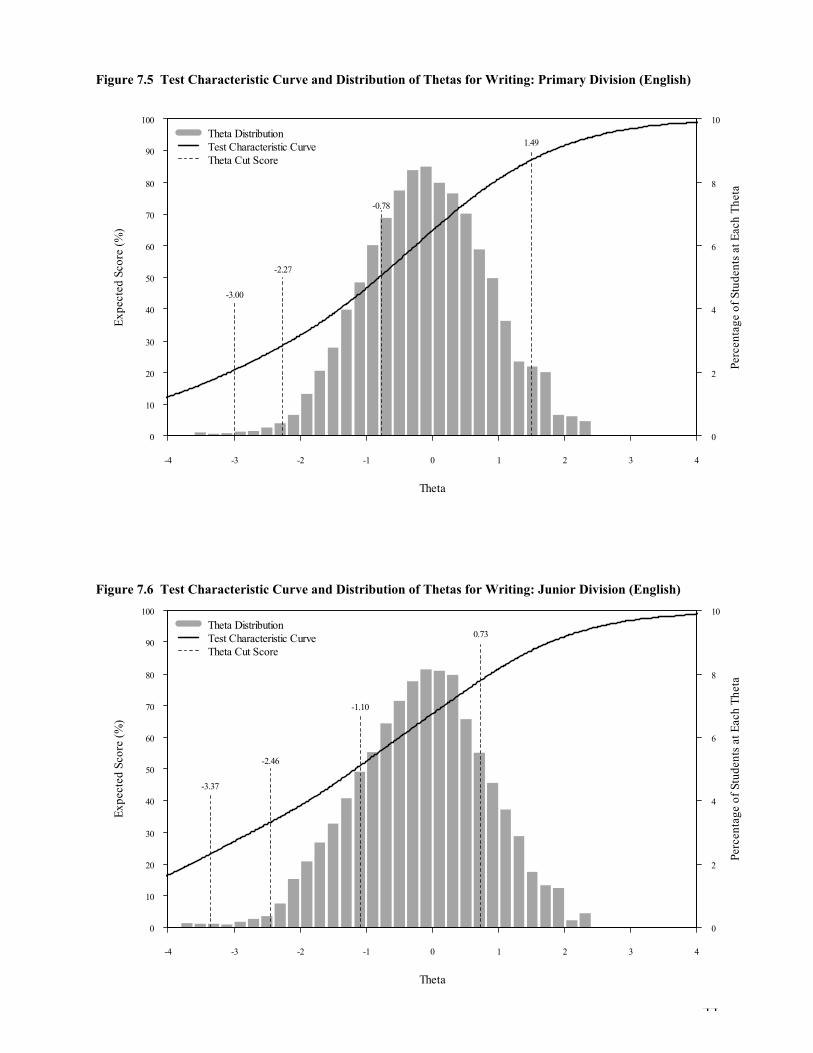
44
Figure 7.5 Test Characteristic Curve and Distribution of Thetas for Writing: Primary Division (English)
Figure 7.6 Test Characteristic Curve and Distribution of Thetas for Writing: Junior Division (English)
Perc
enta
ge o
f St
uden
ts a
t Eac
h T
heta
0
2
4
6
8
10
Theta
Exp
ecte
d Sc
ore
(%)
-4 -3 -2 -1 0 1 2 3 4
0
10
20
30
40
50
60
70
80
90
100
-3.00
-2.27
-0.78
1.49Theta DistributionTest Characteristic CurveTheta Cut Score
Perc
enta
ge o
f St
uden
ts a
t Eac
h T
heta
0
2
4
6
8
10
Theta
Exp
ecte
d Sc
ore
(%)
-4 -3 -2 -1 0 1 2 3 4
0
10
20
30
40
50
60
70
80
90
100
-3.37
-2.46
-1.10
0.73Theta DistributionTest Characteristic CurveTheta Cut Score
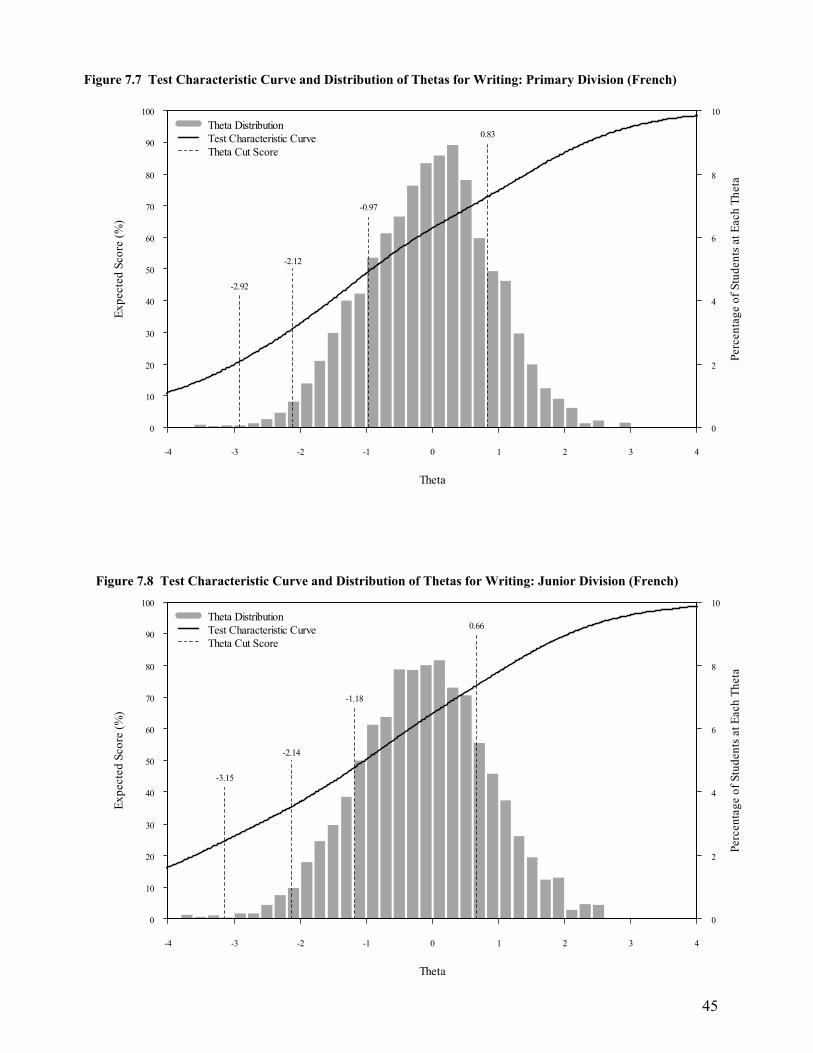
45
Figure 7.7 Test Characteristic Curve and Distribution of Thetas for Writing: Primary Division (French)
Figure 7.8 Test Characteristic Curve and Distribution of Thetas for Writing: Junior Division (French)
Perc
enta
ge o
f St
uden
ts a
t Eac
h T
heta
0
2
4
6
8
10
Theta
Exp
ecte
d Sc
ore
(%)
-4 -3 -2 -1 0 1 2 3 4
0
10
20
30
40
50
60
70
80
90
100
-2.92
-2.12
-0.97
0.83Theta DistributionTest Characteristic CurveTheta Cut Score
Perc
enta
ge o
f St
uden
ts a
t Eac
h T
heta
0
2
4
6
8
10
Theta
Exp
ecte
d Sc
ore
(%)
-4 -3 -2 -1 0 1 2 3 4
0
10
20
30
40
50
60
70
80
90
100
-3.15
-2.14
-1.18
0.66Theta DistributionTest Characteristic CurveTheta Cut Score
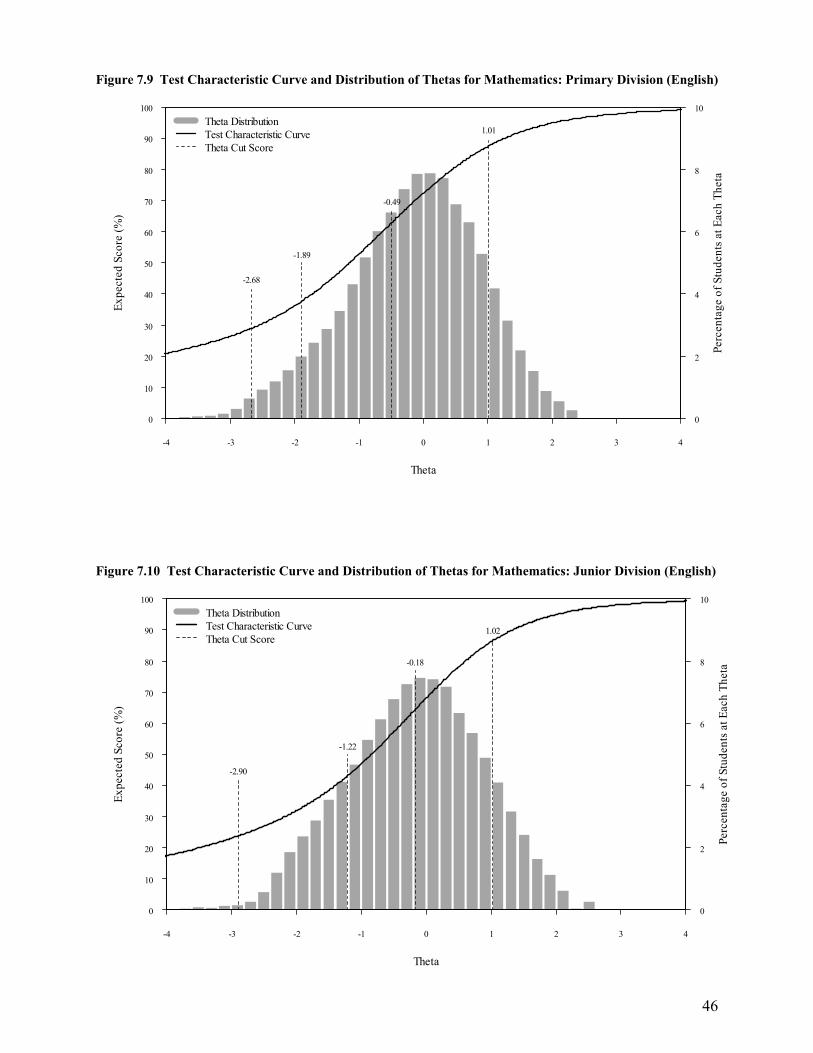
46
Figure 7.9 Test Characteristic Curve and Distribution of Thetas for Mathematics: Primary Division (English)
Figure 7.10 Test Characteristic Curve and Distribution of Thetas for Mathematics: Junior Division (English)
Perc
enta
ge o
f St
uden
ts a
t Eac
h T
heta
0
2
4
6
8
10
Theta
Exp
ecte
d Sc
ore
(%)
-4 -3 -2 -1 0 1 2 3 4
0
10
20
30
40
50
60
70
80
90
100
-2.68
-1.89
-0.49
1.01Theta DistributionTest Characteristic CurveTheta Cut Score
Perc
enta
ge o
f St
uden
ts a
t Eac
h T
heta
0
2
4
6
8
10
Theta
Exp
ecte
d Sc
ore
(%)
-4 -3 -2 -1 0 1 2 3 4
0
10
20
30
40
50
60
70
80
90
100
-2.90
-1.22
-0.18
1.02
Theta DistributionTest Characteristic CurveTheta Cut Score
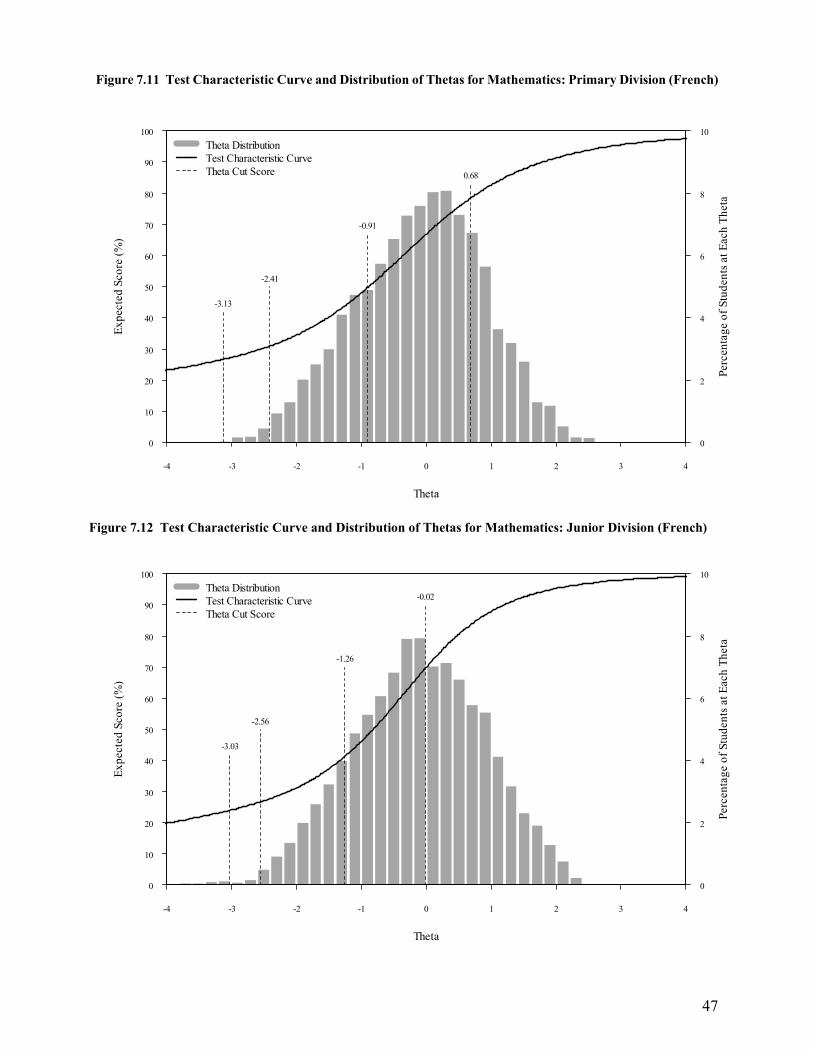
47
Figure 7.11 Test Characteristic Curve and Distribution of Thetas for Mathematics: Primary Division (French)
Figure 7.12 Test Characteristic Curve and Distribution of Thetas for Mathematics: Junior Division (French)
Perc
enta
ge o
f St
uden
ts a
t Eac
h T
heta
0
2
4
6
8
10
Theta
Exp
ecte
d Sc
ore
(%)
-4 -3 -2 -1 0 1 2 3 4
0
10
20
30
40
50
60
70
80
90
100
-3.13
-2.41
-0.91
0.68
Theta DistributionTest Characteristic CurveTheta Cut Score
Perc
enta
ge o
f St
uden
ts a
t Eac
h T
heta
0
2
4
6
8
10
Theta
Exp
ecte
d Sc
ore
(%)
-4 -3 -2 -1 0 1 2 3 4
0
10
20
30
40
50
60
70
80
90
100
-3.03
-2.56
-1.26
-0.02Theta DistributionTest Characteristic CurveTheta Cut Score
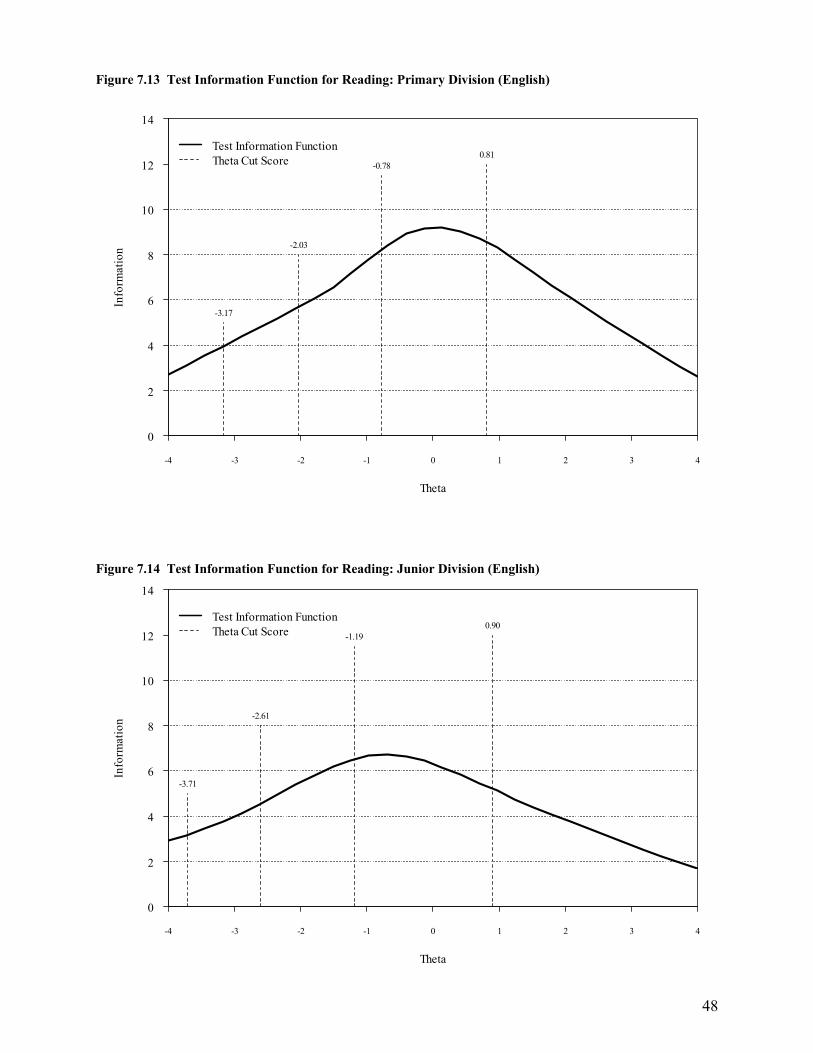
48
Figure 7.13 Test Information Function for Reading: Primary Division (English)
Figure 7.14 Test Information Function for Reading: Junior Division (English)
Theta
Info
rmat
ion
-4 -3 -2 -1 0 1 2 3 4
0
2
4
6
8
10
12
14
0.81-0.78
-2.03
-3.17
Test Information FunctionTheta Cut Score
Theta
Info
rmat
ion
-4 -3 -2 -1 0 1 2 3 4
0
2
4
6
8
10
12
14
0.90-1.19
-2.61
-3.71
Test Information FunctionTheta Cut Score
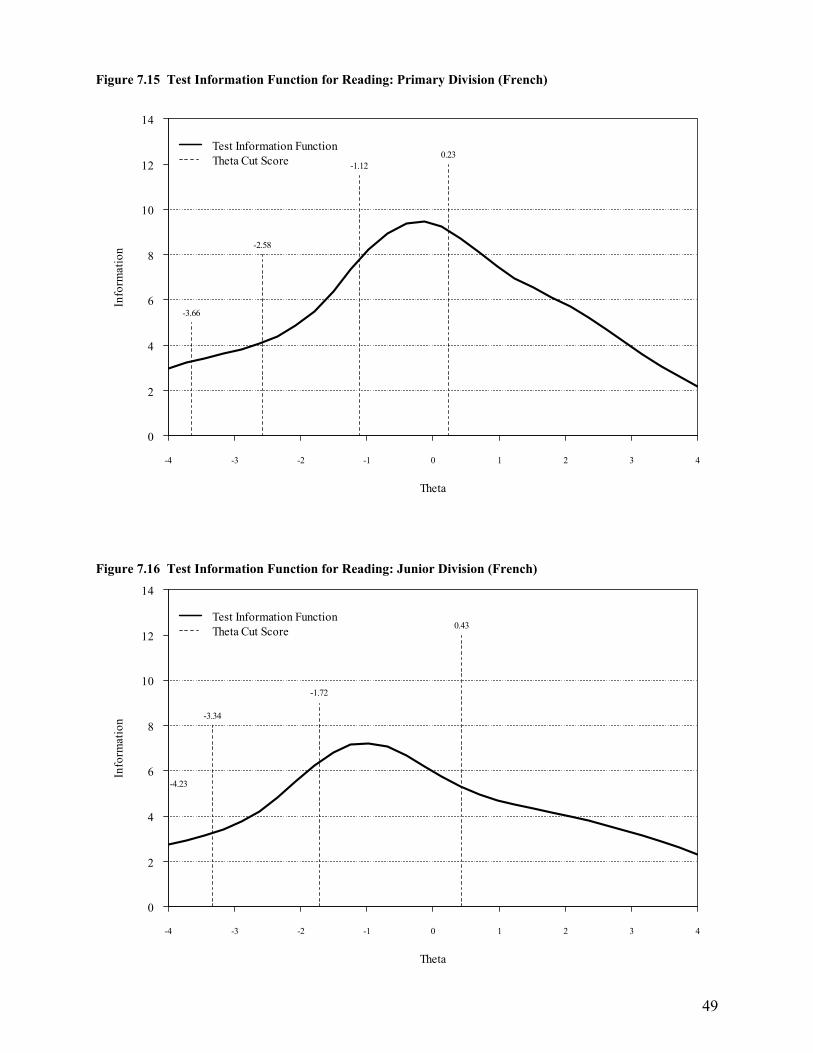
49
Figure 7.15 Test Information Function for Reading: Primary Division (French)
Figure 7.16 Test Information Function for Reading: Junior Division (French)
Theta
Info
rmat
ion
-4 -3 -2 -1 0 1 2 3 4
0
2
4
6
8
10
12
14
0.23-1.12
-2.58
-3.66
Test Information FunctionTheta Cut Score
Theta
Info
rmat
ion
-4 -3 -2 -1 0 1 2 3 4
0
2
4
6
8
10
12
14
0.43
-1.72
-3.34
-4.23
Test Information FunctionTheta Cut Score
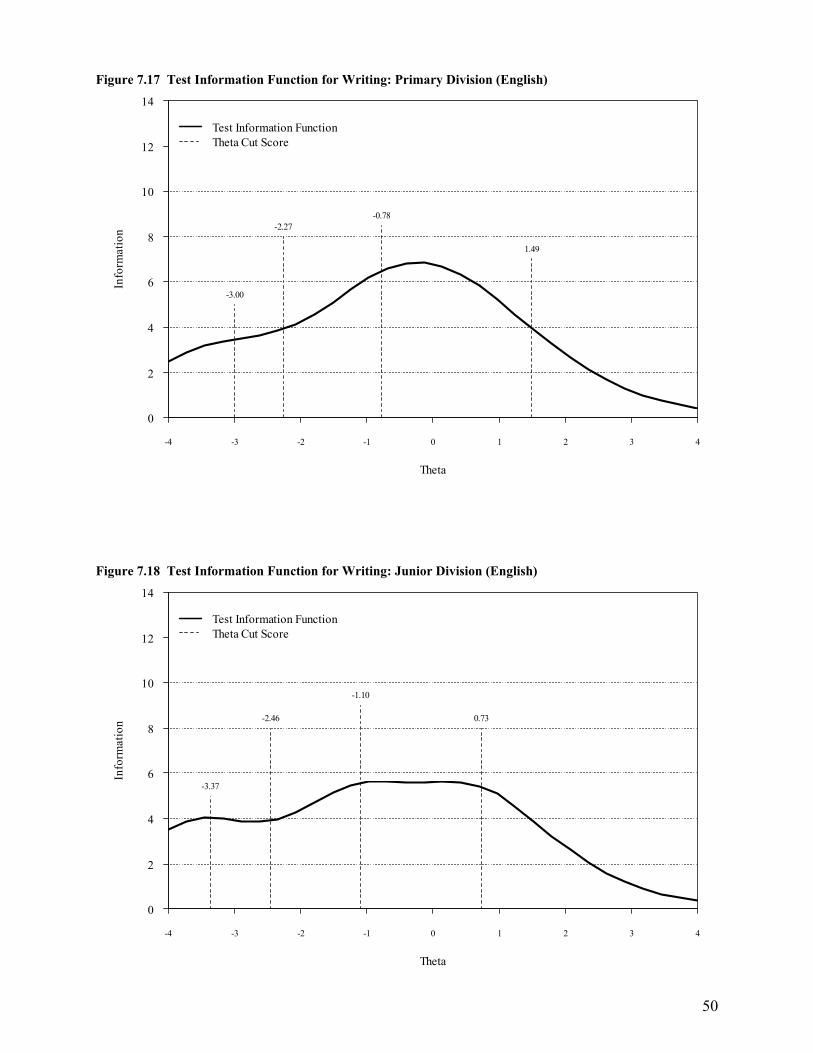
50
Figure 7.17 Test Information Function for Writing: Primary Division (English)
Figure 7.18 Test Information Function for Writing: Junior Division (English)
Theta
Info
rmat
ion
-4 -3 -2 -1 0 1 2 3 4
0
2
4
6
8
10
12
14
1.49
-0.78-2.27
-3.00
Test Information FunctionTheta Cut Score
Theta
Info
rmat
ion
-4 -3 -2 -1 0 1 2 3 4
0
2
4
6
8
10
12
14
0.73
-1.10
-2.46
-3.37
Test Information FunctionTheta Cut Score
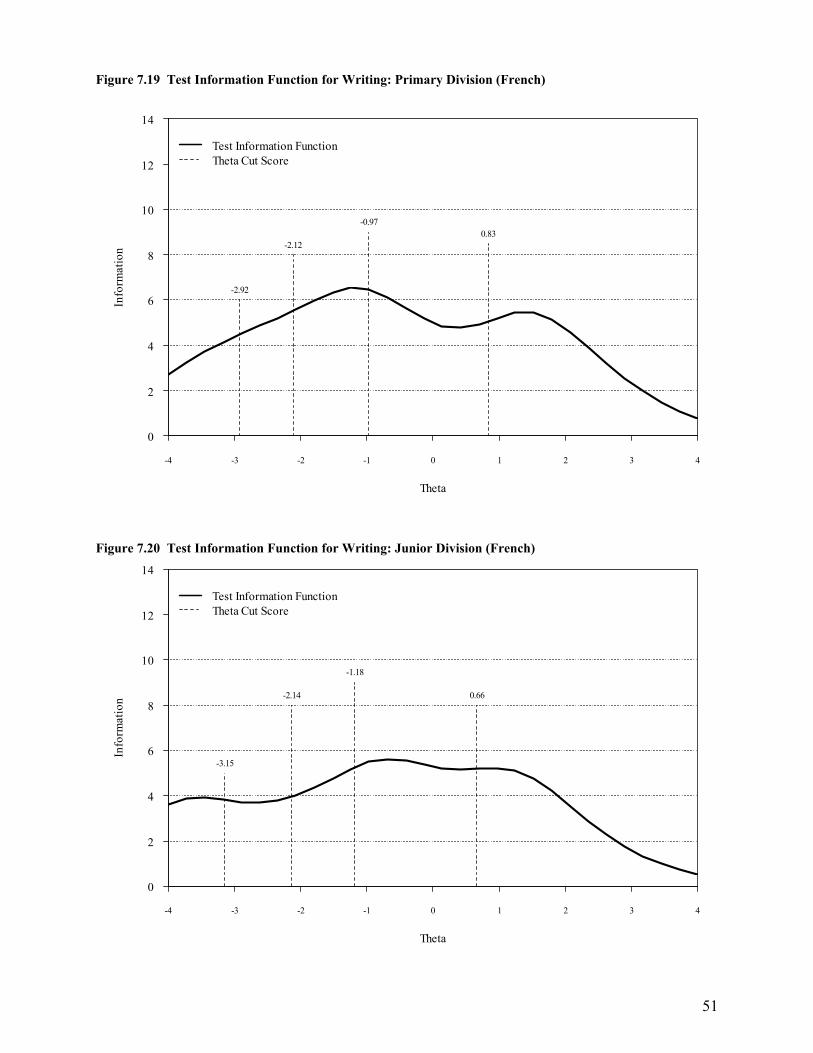
51
Figure 7.19 Test Information Function for Writing: Primary Division (French)
Figure 7.20 Test Information Function for Writing: Junior Division (French)
Theta
Info
rmat
ion
-4 -3 -2 -1 0 1 2 3 4
0
2
4
6
8
10
12
14
0.83-0.97
-2.12
-2.92
Test Information FunctionTheta Cut Score
Theta
Info
rmat
ion
-4 -3 -2 -1 0 1 2 3 4
0
2
4
6
8
10
12
14
0.66
-1.18
-2.14
-3.15
Test Information FunctionTheta Cut Score
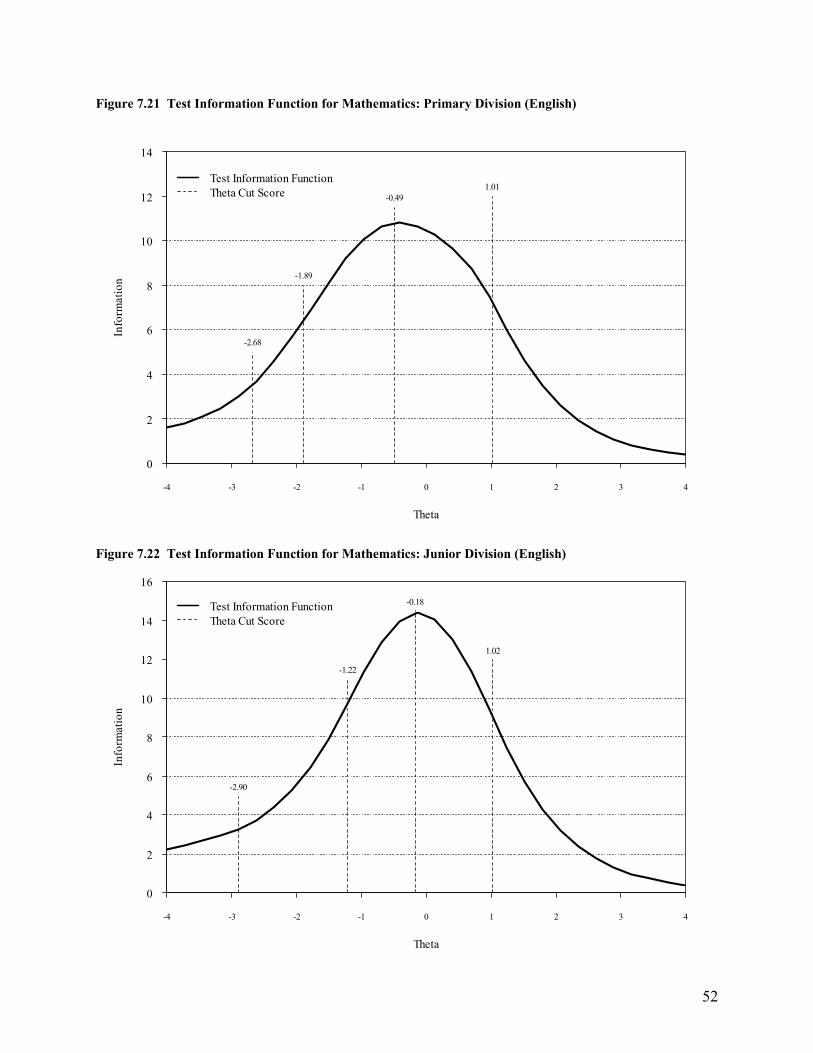
52
Figure 7.21 Test Information Function for Mathematics: Primary Division (English)
Figure 7.22 Test Information Function for Mathematics: Junior Division (English)
Theta
Info
rmat
ion
-4 -3 -2 -1 0 1 2 3 4
0
2
4
6
8
10
12
14
1.01-0.49
-1.89
-2.68
Test Information FunctionTheta Cut Score
Theta
Info
rmat
ion
-4 -3 -2 -1 0 1 2 3 4
0
2
4
6
8
10
12
14
16
1.02
-0.18
-1.22
-2.90
Test Information FunctionTheta Cut Score
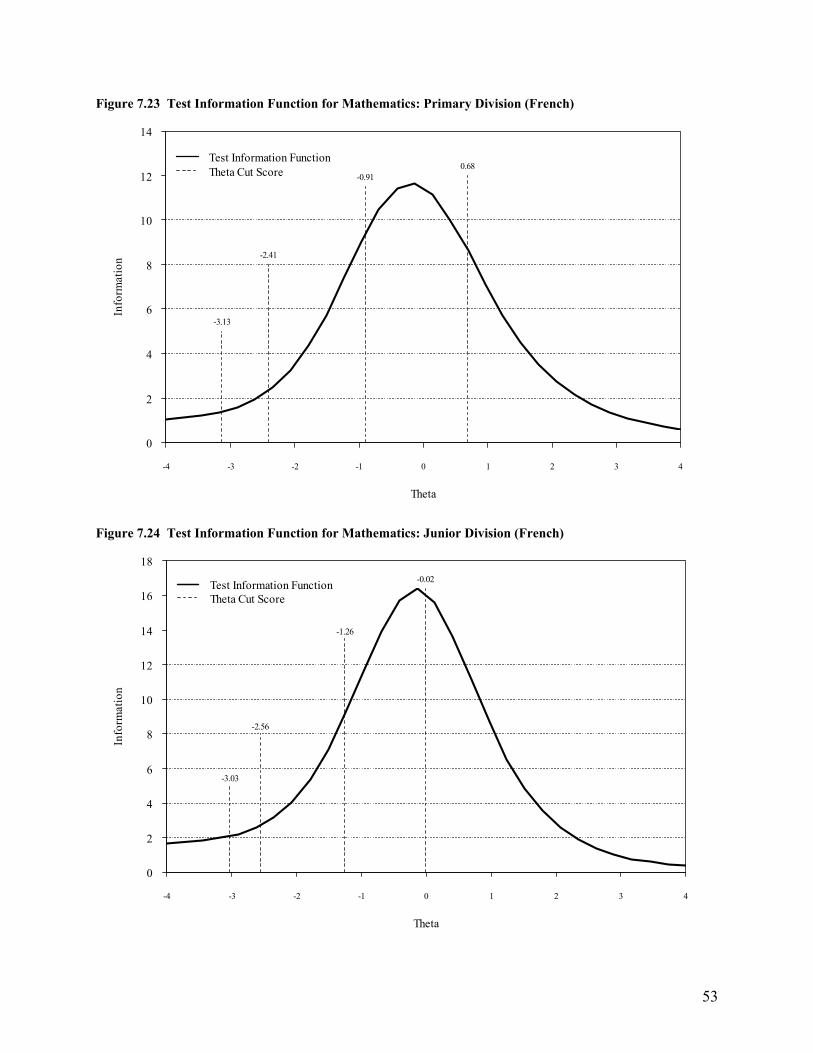
53
Figure 7.23 Test Information Function for Mathematics: Primary Division (French)
Figure 7.24 Test Information Function for Mathematics: Junior Division (French)
Theta
Info
rmat
ion
-4 -3 -2 -1 0 1 2 3 4
0
2
4
6
8
10
12
14
0.68-0.91
-2.41
-3.13
Test Information FunctionTheta Cut Score
Theta
Info
rmat
ion
-4 -3 -2 -1 0 1 2 3 4
0
2
4
6
8
10
12
14
16
18
-0.02
-1.26
-2.56
-3.03
Test Information FunctionTheta Cut Score
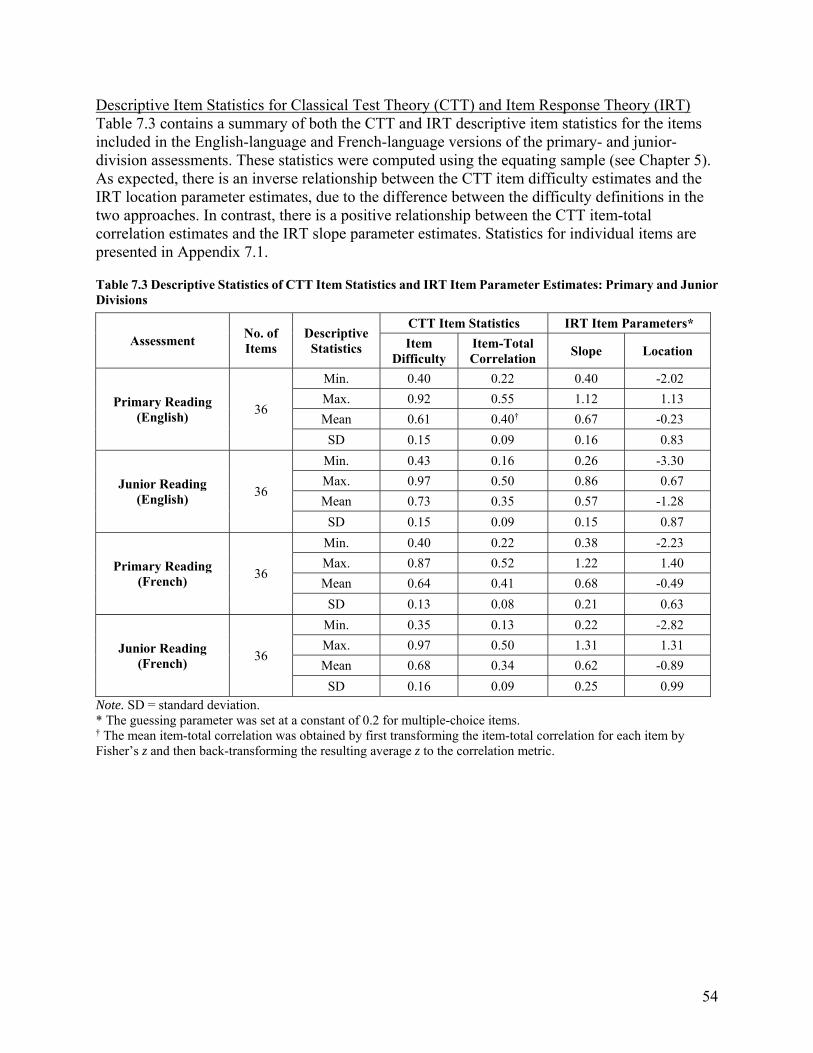
54
Descriptive Item Statistics for Classical Test Theory (CTT) and Item Response Theory (IRT) Table 7.3 contains a summary of both the CTT and IRT descriptive item statistics for the items included in the English-language and French-language versions of the primary- and junior-division assessments. These statistics were computed using the equating sample (see Chapter 5). As expected, there is an inverse relationship between the CTT item difficulty estimates and the IRT location parameter estimates, due to the difference between the difficulty definitions in the two approaches. In contrast, there is a positive relationship between the CTT item-total correlation estimates and the IRT slope parameter estimates. Statistics for individual items are presented in Appendix 7.1.
Table 7.3 Descriptive Statistics of CTT Item Statistics and IRT Item Parameter Estimates: Primary and Junior Divisions
Assessment No. of Items
Descriptive Statistics
CTT Item Statistics IRT Item Parameters*
Item Difficulty
Item-Total Correlation
Slope Location
Primary Reading (English)
36
Min. 0.40 0.22 0.40 -2.02
Max. 0.92 0.55 1.12 1.13
Mean 0.61 0.40† 0.67 -0.23
SD 0.15 0.09 0.16 0.83
Junior Reading (English)
36
Min. 0.43 0.16 0.26 -3.30
Max. 0.97 0.50 0.86 0.67
Mean 0.73 0.35 0.57 -1.28
SD 0.15 0.09 0.15 0.87
Primary Reading (French)
36
Min. 0.40 0.22 0.38 -2.23
Max. 0.87 0.52 1.22 1.40
Mean 0.64 0.41 0.68 -0.49
SD 0.13 0.08 0.21 0.63
Junior Reading (French)
36
Min. 0.35 0.13 0.22 -2.82
Max. 0.97 0.50 1.31 1.31
Mean 0.68 0.34 0.62 -0.89
SD 0.16 0.09 0.25 0.99
Note. SD = standard deviation. * The guessing parameter was set at a constant of 0.2 for multiple-choice items. † The mean item-total correlation was obtained by first transforming the item-total correlation for each item by Fisher’s z and then back-transforming the resulting average z to the correlation metric.
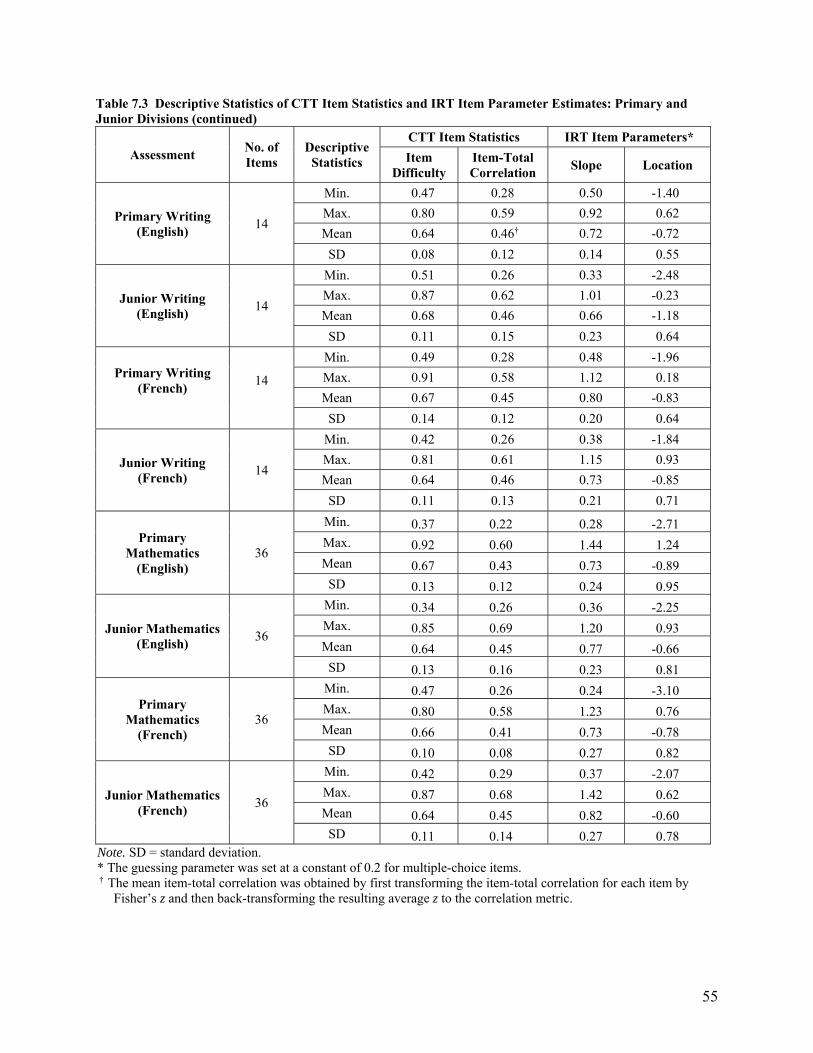
55
Table 7.3 Descriptive Statistics of CTT Item Statistics and IRT Item Parameter Estimates: Primary and Junior Divisions (continued)
Assessment No. of Items
Descriptive Statistics
CTT Item Statistics IRT Item Parameters*
Item Difficulty
Item-Total Correlation
Slope Location
Primary Writing (English)
14
Min. 0.47 0.28 0.50 -1.40
Max. 0.80 0.59 0.92 0.62
Mean 0.64 0.46† 0.72 -0.72
SD 0.08 0.12 0.14 0.55
Junior Writing (English)
14
Min. 0.51 0.26 0.33 -2.48
Max. 0.87 0.62 1.01 -0.23
Mean 0.68 0.46 0.66 -1.18
SD 0.11 0.15 0.23 0.64
Primary Writing (French)
14
Min. 0.49 0.28 0.48 -1.96
Max. 0.91 0.58 1.12 0.18
Mean 0.67 0.45 0.80 -0.83
SD 0.14 0.12 0.20 0.64
Junior Writing (French)
14
Min. 0.42 0.26 0.38 -1.84
Max. 0.81 0.61 1.15 0.93
Mean 0.64 0.46 0.73 -0.85
SD 0.11 0.13 0.21 0.71
Primary Mathematics
(English) 36
Min. 0.37 0.22 0.28 -2.71 Max. 0.92 0.60 1.44 1.24 Mean 0.67 0.43 0.73 -0.89 SD 0.13 0.12 0.24 0.95
Junior Mathematics (English)
36
Min. 0.34 0.26 0.36 -2.25 Max. 0.85 0.69 1.20 0.93 Mean 0.64 0.45 0.77 -0.66 SD 0.13 0.16 0.23 0.81
Primary Mathematics
(French) 36
Min. 0.47 0.26 0.24 -3.10 Max. 0.80 0.58 1.23 0.76 Mean 0.66 0.41 0.73 -0.78 SD 0.10 0.08 0.27 0.82
Junior Mathematics (French)
36
Min. 0.42 0.29 0.37 -2.07 Max. 0.87 0.68 1.42 0.62 Mean 0.64 0.45 0.82 -0.60 SD 0.11 0.14 0.27 0.78
Note. SD = standard deviation. * The guessing parameter was set at a constant of 0.2 for multiple-choice items. † The mean item-total correlation was obtained by first transforming the item-total correlation for each item by
Fisher’s z and then back-transforming the resulting average z to the correlation metric.
56
The Grade 9 Assessment of Mathematics
Classical Test Theory (CTT) Analysis Table 7.4 presents descriptive statistics, Cronbach’s alpha estimates of test score reliability and the SEM for the English-language and French-language applied and academic versions of the Grade 9 mathematics assessment. In 2015–2016 the mean percentages ranged from 57.19% (French, winter) to 58.48% (French, spring) for applied mathematics. The mean percentages ranged from 68.16% (French, winter) to 69.90% (French, spring) for academic mathematics.
Cronbach’s alpha estimates ranged from 0.85 to 0.86 across the assessments. The corresponding SEMs were likewise similar, ranging from 6.70% to 7.32% across the assessments. The obtained reliability coefficients and SEMs are acceptable, which indicates that the test scores from these assessments provide a satisfactory level of precision.
Table 7.4 Test Descriptive Statistics, Reliability and Standard Error of Measurement: Grade 9 Mathematics
Assessment No. of
Items
Item Type Possible Max. Score
No. of Students
Min. Max. Mean SD Alpha SEM MC OR
Applied, Winter
(English) 31 24 7 52 15 965 0 52 30.26 9.41 0.85 3.60
Applied, Spring
(English) 31 24 7 52 18 691 0 52 30.31 9.44 0.85 3.65
Academic, Winter
(English) 31 24 7 52 42 807 0 52 35.72 9.67 0.87 3.48
Academic, Spring
(English) 31 24 7 52 53 694 0 52 36.05 8.96 0.86 3.39
Applied, Winter
(French) 31 24 7 52 331 6 51 29.74 9.33 0.85 3.66
Applied, Spring
(French) 31 24 7 52 1 024 4 51 30.41 9.36 0.85 3.57
Academic, Winter
(French) 31 24 7 52 1 094 8 52 35.44 9.62 0.87 3.48
Academic, Spring
(French) 31 24 7 52 3 157 8 52 36.35 8.73 0.85 3.35
Note. MC = multiple choice; OR = open response; SD = standard deviation; SEM = standard error of measurement.
Item Response Theory (IRT) Analysis In the IRT analysis, item parameters were estimated from the student responses used in the equating calibration sample (see Chapter 5). The estimated item parameters were then used to score all the student responses. The descriptive statistics reported in Table 7.5 refer to the total population of students. The mean student ability scores range from −0.15 to −0.04 for the applied
57
version of the mathematics assessment and from –0.07 to 0.02 for the academic version of the assessment. The means that differ from zero and the standard deviations that differ from one are due to the inclusion of all students. The item parameter estimates for individual items are presented in Appendix 7.1.
Table 7.5 Descriptive Statistics of IRT Scores: Grade 9 Mathematics
Assessment No. of
Students Min. Max. Mean SD
Applied, Winter (English) 15 965 -3.41 2.73 -0.07 0.97 Applied, Spring (English) 18 691 -3.44 2.77 -0.04 0.98
Academic, Winter (English) 42 807 -3.66 2.15 -0.05 0.96 Academic, Spring (English) 53 694 -3.66 2.29 0.02 0.93 Applied, Winter (French) 331 -2.92 2.50 -0.15 0.97 Applied, Spring (French) 1 024 -3.25 2.49 -0.04 0.96
Academic, Winter (French) 1 094 -2.72 2.23 -0.03 0.97 Academic, Spring (French) 3 157 -3.01 2.30 -0.01 0.94
Note. SD = standard deviation.
The TCCs and the distribution of student thetas are displayed in Figures 7.25 to 7.28. The TCCs follow the expected S-shaped distribution. The right vertical scale indicates the percentage of students at each theta value, and the theta cut points for assigning students to performance levels are marked on all the graphs. The TCCs for the winter and spring administrations, which are displayed in Figures 7.25–7.28, are very similar to each other. This indicates that the winter and spring applied and academic versions of the assessment had the same difficulty level. The TIFs, which are displayed in Figures 7.29–7.32, indicate that each assessment version provided most of its information between the 2/3 and 3/4 cut points.
58
Figure 7.25 Test Characteristic Curves and Distributions of Thetas: Grade 9 Applied Math (English)
Figure 7.26 Test Characteristic Curves and Distributions of Thetas: Grade 9 Academic Math (English)
Theta
Exp
ecte
d Sc
ore
(%)
-4 -3 -2 -1 0 1 2 3 4
0
10
20
30
40
50
60
70
80
90
100
Winter
-1.64
-0.93
-0.04
1.19Theta DistributionTest Characteristic CurveTheta Cut Score
Perc
enta
ge o
f St
uden
ts a
t Eac
h T
heta
0
2
4
6
8
10
Theta
-4 -3 -2 -1 0 1 2 3 4
Spring
-1.64
-0.93
-0.04
1.19
Theta
Exp
ecte
d Sc
ore
(%)
-4 -3 -2 -1 0 1 2 3 4
0
10
20
30
40
50
60
70
80
90
100
Winter
-2.65
-1.60
-0.98
1.19Theta DistributionTest Characteristic CurveTheta Cut Score
Perc
enta
ge o
f St
uden
ts a
t Eac
h T
heta
0
2
4
6
8
10
Theta
-4 -3 -2 -1 0 1 2 3 4
Spring
-2.65
-1.60
-0.98
1.19
59
Figure 7.27 Test Characteristic Curves and Distributions of Thetas: Grade 9 Applied Math (French)
Figure 7.28 Test Characteristic Curves and Distributions of Thetas: Grade 9 Academic Math (French)
Theta
Exp
ecte
d Sc
ore
(%)
-4 -3 -2 -1 0 1 2 3 4
0
10
20
30
40
50
60
70
80
90
100
Winter
-1.99
-1.32
-0.06
1.29Theta DistributionTest Characteristic CurveTheta Cut Score
Perc
enta
ge o
f St
uden
ts a
t Eac
h T
heta
0
2
4
6
8
10
Theta
-4 -3 -2 -1 0 1 2 3 4
Spring
-1.99
-1.32
-0.06
1.29
Theta
Exp
ecte
d Sc
ore
(%)
-4 -3 -2 -1 0 1 2 3 4
0
10
20
30
40
50
60
70
80
90
100
Winter
-2.79
-1.70
-1.04
1.40Theta DistributionTest Characteristic CurveTheta Cut Score
Perc
enta
ge o
f St
uden
ts a
t Eac
h T
heta
0
2
4
6
8
10
Theta
-4 -3 -2 -1 0 1 2 3 4
Spring
-2.79
-1.70
-1.04
1.40
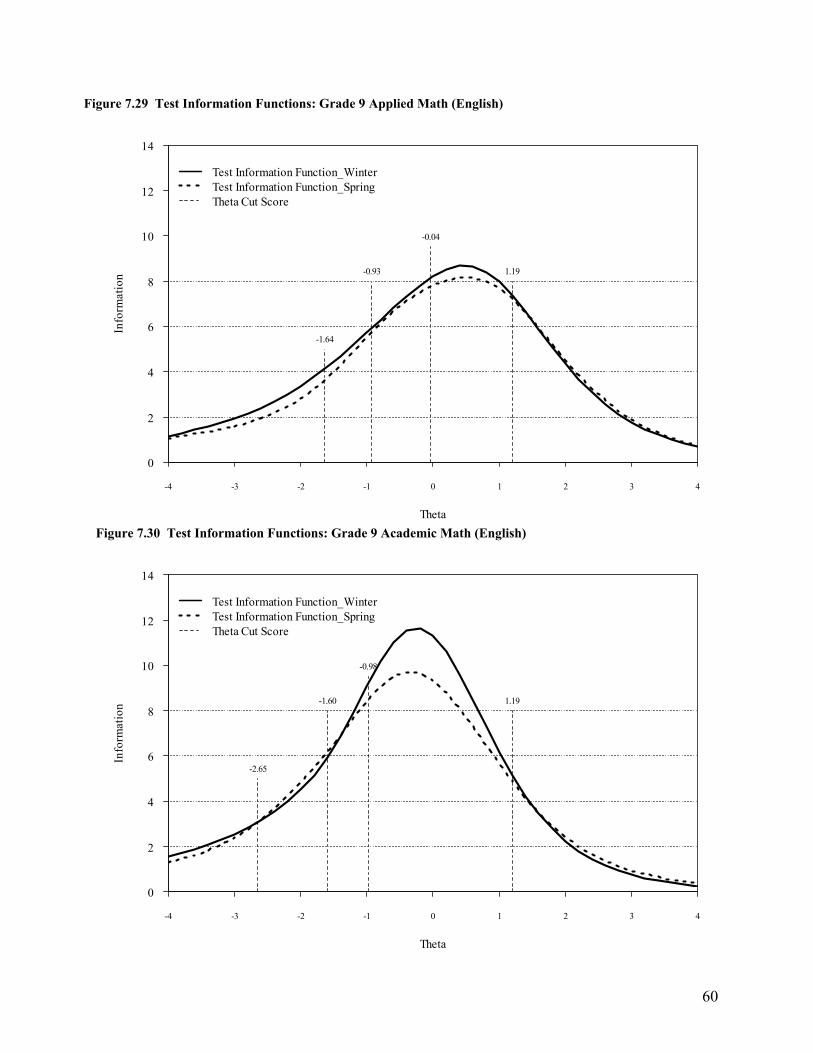
60
Figure 7.29 Test Information Functions: Grade 9 Applied Math (English)
Figure 7.30 Test Information Functions: Grade 9 Academic Math (English)
Theta
Info
rmat
ion
-4 -3 -2 -1 0 1 2 3 4
0
2
4
6
8
10
12
14
1.19
-0.04
-0.93
-1.64
Test Information Function_WinterTest Information Function_SpringTheta Cut Score
Theta
Info
rmat
ion
-4 -3 -2 -1 0 1 2 3 4
0
2
4
6
8
10
12
14
1.19
-0.98
-1.60
-2.65
Test Information Function_WinterTest Information Function_SpringTheta Cut Score
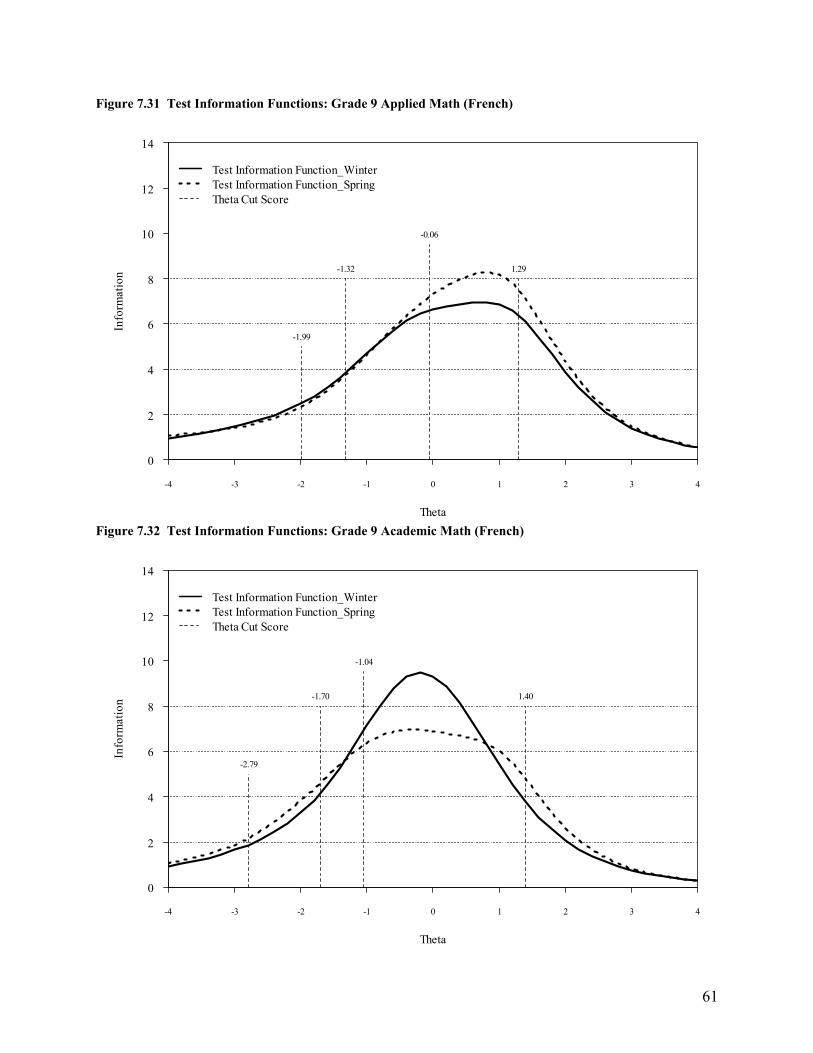
61
Figure 7.31 Test Information Functions: Grade 9 Applied Math (French)
Figure 7.32 Test Information Functions: Grade 9 Academic Math (French)
Theta
Info
rmat
ion
-4 -3 -2 -1 0 1 2 3 4
0
2
4
6
8
10
12
14
1.29
-0.06
-1.32
-1.99
Test Information Function_WinterTest Information Function_SpringTheta Cut Score
Theta
Info
rmat
ion
-4 -3 -2 -1 0 1 2 3 4
0
2
4
6
8
10
12
14
1.40
-1.04
-1.70
-2.79
Test Information Function_WinterTest Information Function_SpringTheta Cut Score
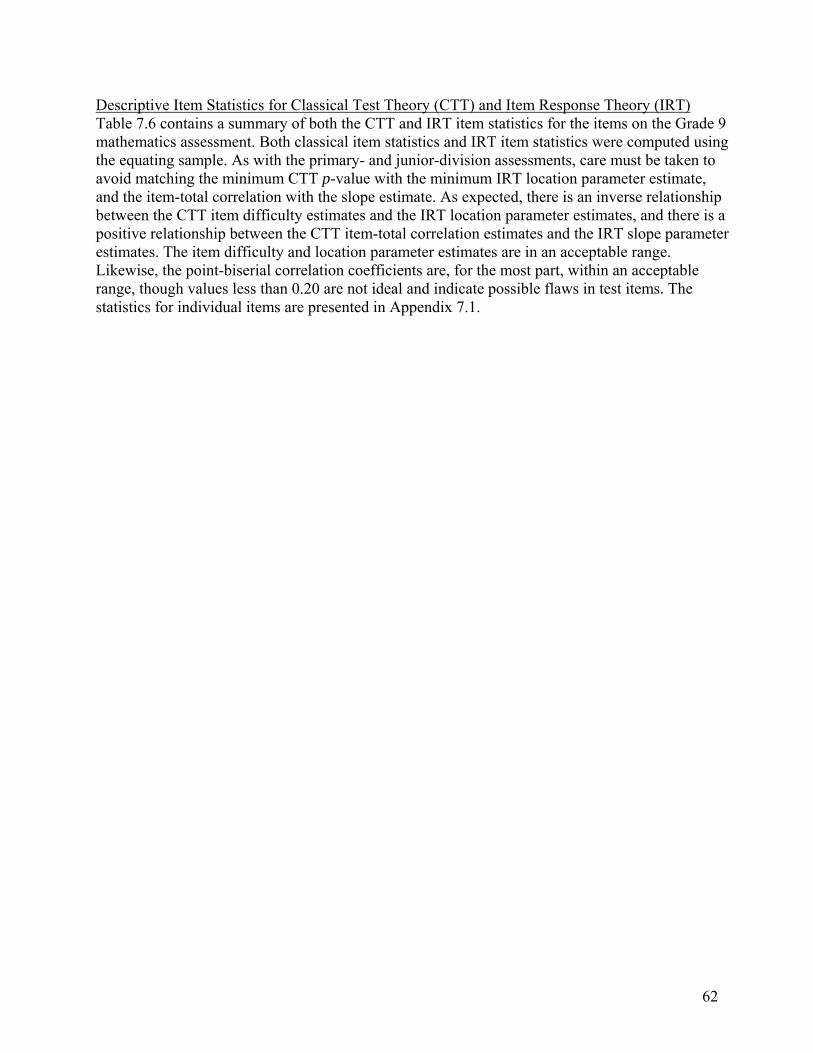
62
Descriptive Item Statistics for Classical Test Theory (CTT) and Item Response Theory (IRT) Table 7.6 contains a summary of both the CTT and IRT item statistics for the items on the Grade 9 mathematics assessment. Both classical item statistics and IRT item statistics were computed using the equating sample. As with the primary- and junior-division assessments, care must be taken to avoid matching the minimum CTT p-value with the minimum IRT location parameter estimate, and the item-total correlation with the slope estimate. As expected, there is an inverse relationship between the CTT item difficulty estimates and the IRT location parameter estimates, and there is a positive relationship between the CTT item-total correlation estimates and the IRT slope parameter estimates. The item difficulty and location parameter estimates are in an acceptable range. Likewise, the point-biserial correlation coefficients are, for the most part, within an acceptable range, though values less than 0.20 are not ideal and indicate possible flaws in test items. The statistics for individual items are presented in Appendix 7.1.
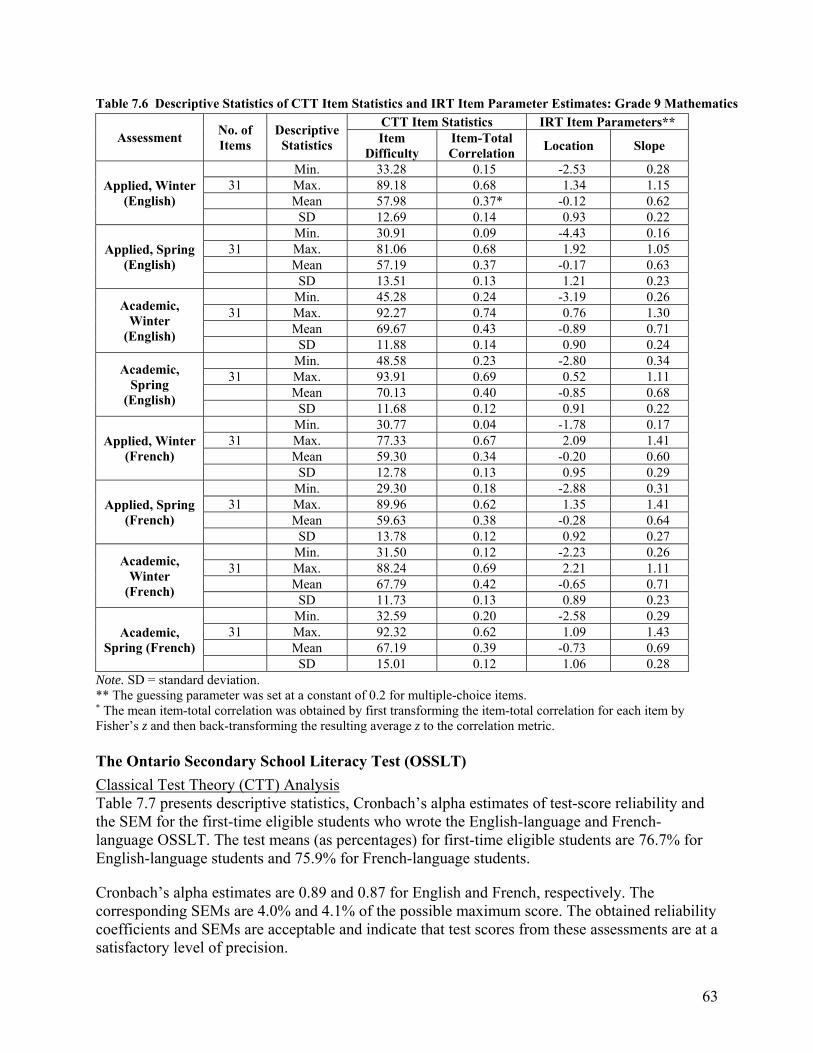
63
Table 7.6 Descriptive Statistics of CTT Item Statistics and IRT Item Parameter Estimates: Grade 9 Mathematics
Assessment No. of Items
Descriptive Statistics
CTT Item Statistics IRT Item Parameters** Item
Difficulty Item-Total Correlation
Location Slope
Applied, Winter (English)
Min. 33.28 0.15 -2.53 0.28 31 Max. 89.18 0.68 1.34 1.15
Mean 57.98 0.37* -0.12 0.62 SD 12.69 0.14 0.93 0.22
Applied, Spring (English)
Min. 30.91 0.09 -4.43 0.16 31 Max. 81.06 0.68 1.92 1.05
Mean 57.19 0.37 -0.17 0.63 SD 13.51 0.13 1.21 0.23
Academic, Winter
(English)
Min. 45.28 0.24 -3.19 0.26 31 Max. 92.27 0.74 0.76 1.30
Mean 69.67 0.43 -0.89 0.71 SD 11.88 0.14 0.90 0.24
Academic, Spring
(English)
Min. 48.58 0.23 -2.80 0.34 31 Max. 93.91 0.69 0.52 1.11
Mean 70.13 0.40 -0.85 0.68 SD 11.68 0.12 0.91 0.22
Applied, Winter (French)
Min. 30.77 0.04 -1.78 0.17 31 Max. 77.33 0.67 2.09 1.41
Mean 59.30 0.34 -0.20 0.60 SD 12.78 0.13 0.95 0.29
Applied, Spring (French)
Min. 29.30 0.18 -2.88 0.31 31 Max. 89.96 0.62 1.35 1.41
Mean 59.63 0.38 -0.28 0.64 SD 13.78 0.12 0.92 0.27
Academic, Winter
(French)
Min. 31.50 0.12 -2.23 0.26 31 Max. 88.24 0.69 2.21 1.11
Mean 67.79 0.42 -0.65 0.71 SD 11.73 0.13 0.89 0.23
Academic, Spring (French)
Min. 32.59 0.20 -2.58 0.29 31 Max. 92.32 0.62 1.09 1.43
Mean 67.19 0.39 -0.73 0.69 SD 15.01 0.12 1.06 0.28
Note. SD = standard deviation. ** The guessing parameter was set at a constant of 0.2 for multiple-choice items. * The mean item-total correlation was obtained by first transforming the item-total correlation for each item by Fisher’s z and then back-transforming the resulting average z to the correlation metric.
The Ontario Secondary School Literacy Test (OSSLT)
Classical Test Theory (CTT) Analysis Table 7.7 presents descriptive statistics, Cronbach’s alpha estimates of test-score reliability and the SEM for the first-time eligible students who wrote the English-language and French-language OSSLT. The test means (as percentages) for first-time eligible students are 76.7% for English-language students and 75.9% for French-language students.
Cronbach’s alpha estimates are 0.89 and 0.87 for English and French, respectively. The corresponding SEMs are 4.0% and 4.1% of the possible maximum score. The obtained reliability coefficients and SEMs are acceptable and indicate that test scores from these assessments are at a satisfactory level of precision.
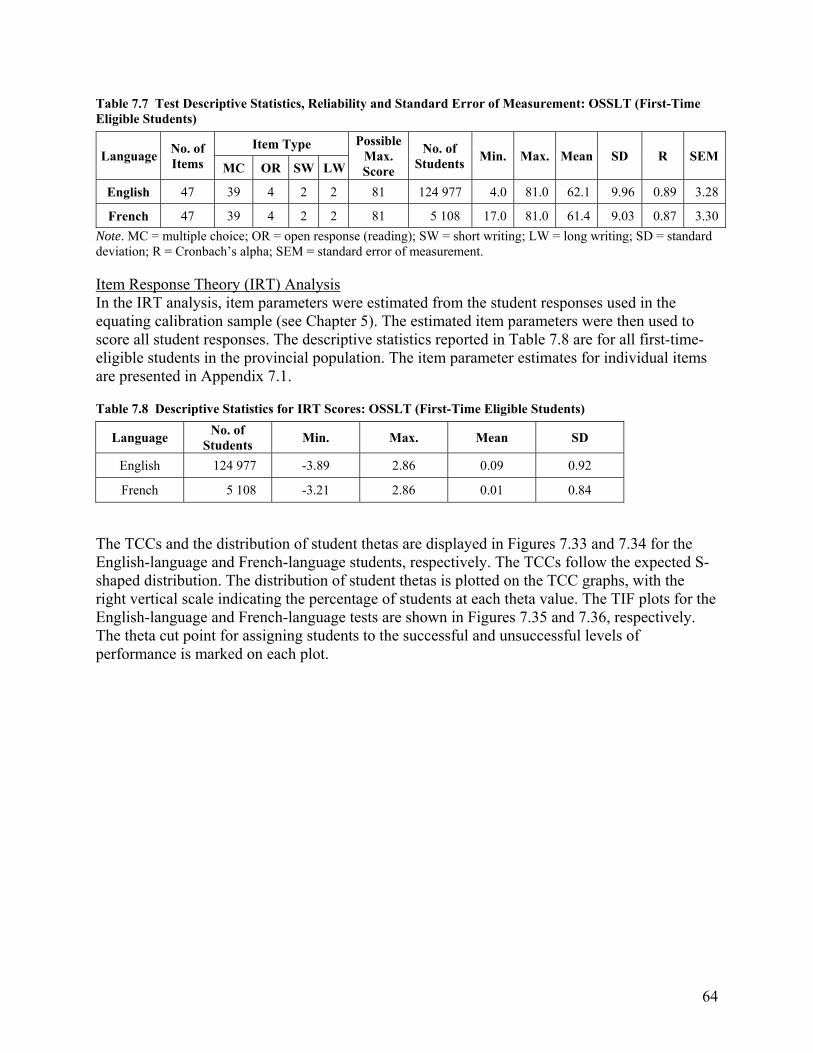
64
Table 7.7 Test Descriptive Statistics, Reliability and Standard Error of Measurement: OSSLT (First-Time Eligible Students)
Note. MC = multiple choice; OR = open response (reading); SW = short writing; LW = long writing; SD = standard deviation; R = Cronbach’s alpha; SEM = standard error of measurement.
Item Response Theory (IRT) Analysis In the IRT analysis, item parameters were estimated from the student responses used in the equating calibration sample (see Chapter 5). The estimated item parameters were then used to score all student responses. The descriptive statistics reported in Table 7.8 are for all first-time-eligible students in the provincial population. The item parameter estimates for individual items are presented in Appendix 7.1.
Table 7.8 Descriptive Statistics for IRT Scores: OSSLT (First-Time Eligible Students)
Language No. of
Students Min. Max. Mean SD
English 124 977 -3.89 2.86 0.09 0.92
French 5 108 -3.21 2.86 0.01 0.84
The TCCs and the distribution of student thetas are displayed in Figures 7.33 and 7.34 for the English-language and French-language students, respectively. The TCCs follow the expected S-shaped distribution. The distribution of student thetas is plotted on the TCC graphs, with the right vertical scale indicating the percentage of students at each theta value. The TIF plots for the English-language and French-language tests are shown in Figures 7.35 and 7.36, respectively. The theta cut point for assigning students to the successful and unsuccessful levels of performance is marked on each plot.
Language No. of Items
Item Type Possible Max. Score
No. of Students
Min. Max. Mean SD R SEM MC OR SW LW
English 47 39 4 2 2 81 124 977 4.0 81.0 62.1 9.96 0.89 3.28
French 47 39 4 2 2 81 5 108 17.0 81.0 61.4 9.03 0.87 3.30
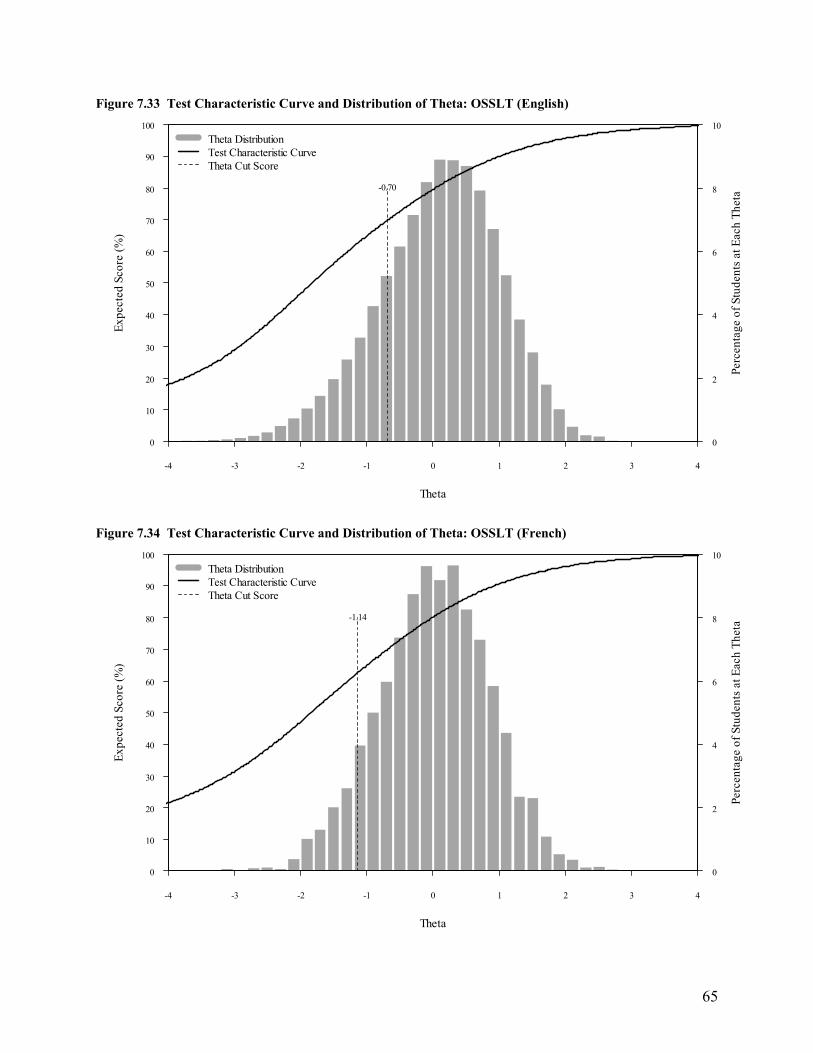
65
Figure 7.33 Test Characteristic Curve and Distribution of Theta: OSSLT (English)
Figure 7.34 Test Characteristic Curve and Distribution of Theta: OSSLT (French)
Perc
enta
ge o
f St
uden
ts a
t Eac
h T
heta
0
2
4
6
8
10
Theta
Exp
ecte
d Sc
ore
(%)
-4 -3 -2 -1 0 1 2 3 4
0
10
20
30
40
50
60
70
80
90
100
-0.70
Theta DistributionTest Characteristic CurveTheta Cut Score
Perc
enta
ge o
f St
uden
ts a
t Eac
h T
heta
0
2
4
6
8
10
Theta
Exp
ecte
d Sc
ore
(%)
-4 -3 -2 -1 0 1 2 3 4
0
10
20
30
40
50
60
70
80
90
100
-1.14
Theta DistributionTest Characteristic CurveTheta Cut Score
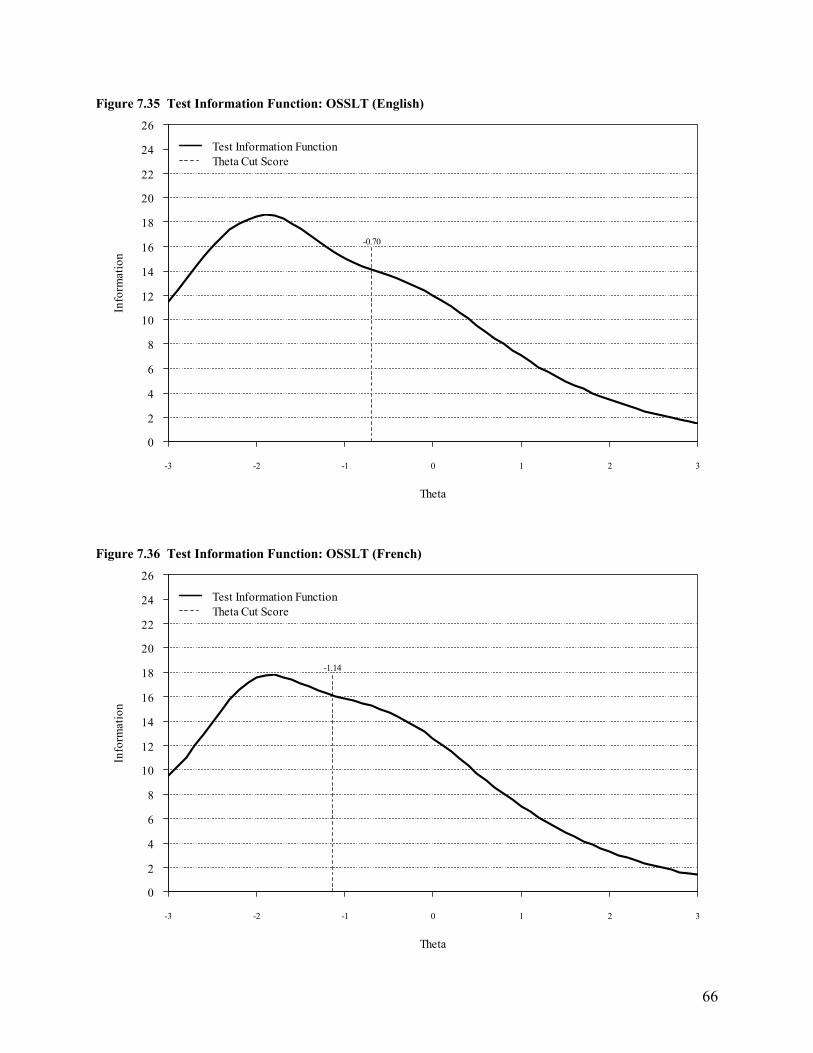
66
Figure 7.35 Test Information Function: OSSLT (English)
Figure 7.36 Test Information Function: OSSLT (French)
Theta
Info
rmat
ion
-3 -2 -1 0 1 2 3
0
2
4
6
8
10
12
14
16
18
20
22
24
26
-0.70
Test Information FunctionTheta Cut Score
Theta
Info
rmat
ion
-3 -2 -1 0 1 2 3
0
2
4
6
8
10
12
14
16
18
20
22
24
26
-1.14
Test Information FunctionTheta Cut Score
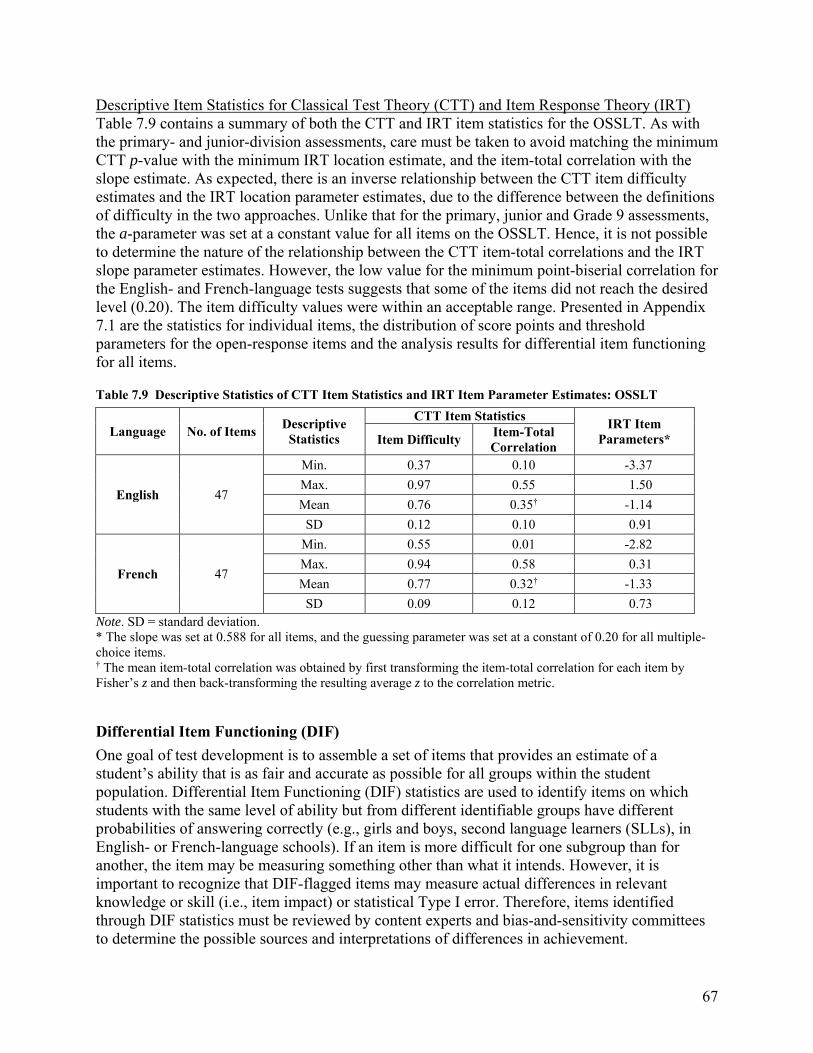
67
Descriptive Item Statistics for Classical Test Theory (CTT) and Item Response Theory (IRT) Table 7.9 contains a summary of both the CTT and IRT item statistics for the OSSLT. As with the primary- and junior-division assessments, care must be taken to avoid matching the minimum CTT p-value with the minimum IRT location estimate, and the item-total correlation with the slope estimate. As expected, there is an inverse relationship between the CTT item difficulty estimates and the IRT location parameter estimates, due to the difference between the definitions of difficulty in the two approaches. Unlike that for the primary, junior and Grade 9 assessments, the a-parameter was set at a constant value for all items on the OSSLT. Hence, it is not possible to determine the nature of the relationship between the CTT item-total correlations and the IRT slope parameter estimates. However, the low value for the minimum point-biserial correlation for the English- and French-language tests suggests that some of the items did not reach the desired level (0.20). The item difficulty values were within an acceptable range. Presented in Appendix 7.1 are the statistics for individual items, the distribution of score points and threshold parameters for the open-response items and the analysis results for differential item functioning for all items.
Table 7.9 Descriptive Statistics of CTT Item Statistics and IRT Item Parameter Estimates: OSSLT
Language No. of Items Descriptive
Statistics
CTT Item Statistics IRT Item
Parameters* Item Difficulty Item-Total Correlation
English 47
Min. 0.37 0.10 -3.37
Max. 0.97 0.55 1.50
Mean 0.76 0.35† -1.14
SD 0.12 0.10 0.91
French 47
Min. 0.55 0.01 -2.82
Max. 0.94 0.58 0.31
Mean 0.77 0.32† -1.33
SD 0.09 0.12 0.73 Note. SD = standard deviation. * The slope was set at 0.588 for all items, and the guessing parameter was set at a constant of 0.20 for all multiple-choice items. † The mean item-total correlation was obtained by first transforming the item-total correlation for each item by Fisher’s z and then back-transforming the resulting average z to the correlation metric.
Differential Item Functioning (DIF)
One goal of test development is to assemble a set of items that provides an estimate of a student’s ability that is as fair and accurate as possible for all groups within the student population. Differential Item Functioning (DIF) statistics are used to identify items on which students with the same level of ability but from different identifiable groups have different probabilities of answering correctly (e.g., girls and boys, second language learners (SLLs), in English- or French-language schools). If an item is more difficult for one subgroup than for another, the item may be measuring something other than what it intends. However, it is important to recognize that DIF-flagged items may measure actual differences in relevant knowledge or skill (i.e., item impact) or statistical Type I error. Therefore, items identified through DIF statistics must be reviewed by content experts and bias-and-sensitivity committees to determine the possible sources and interpretations of differences in achievement.
68
EQAO examined the 2015−2016 assessments for gender- and SLL-based DIF using the Mantel-Haenszel (MH) procedure (Mantel & Haenszel, 1959) for multiple-choice items and Mantel’s (1963) extension of the MH procedure, in conjunction with the standardized mean difference (SMD) (Dorans, 1989), for open-response items. In all analyses, males and non-SLLs were the reference group, and females and SLLs were the focal, or studied, group.
The MH test statistic was proposed as a method for detecting DIF by Holland and Thayer (1988). It examines whether an item shows DIF through the log of the ratio of the odds of a correct response for the reference group to the odds of a correct response for the focal group. With this procedure, examinees responding to a multiple-choice item are matched using the observed total score. The data for each item can be arranged in a 2 × 2 × K contingency table (see Table 7.10 for a slice of such a contingency table), where K is the number of possible total-score categories. The group of examinees is classified into two categories: the focal group and the reference group, and the item response is classified as correct or incorrect.
Table 7.10 2 × 2 Contingency Table for a Multiple-Choice Item for the kth Total-Test Score Category
Group Item score
Correct = 1 Incorrect = 0 Total
Reference group n11k n 12k n 1+k
Focal group n 21k n 22k n 2+k
Total group n +1k n +2k n ++k
An effect-size measure of DIF for a multiple-choice item is obtained as the MH odds ratio:
K
k kkk
K
k kkk
MH nnn
nnn
1 2112
1 2211
/
/ (3)
The MH odds ratio was transformed to the delta scale in Equation 4 (used at Educational Testing Service, Canada, or ETS), and the ETS guidelines (Zieky, 1993) for interpreting the delta effect sizes were used to classify items into three categories of DIF magnitude, as shown in Table 7.11.
MHMH 35.2 (4)
Table 7.11 DIF Classification Rules for Multiple-Choice Items
Category Description Criterion
A No or nominal DIF MH not significantly different from 0, or MH < 1
B Moderate DIF MH significantly different from 0 and 1 ≤ MH < 1.5, or
MH significantly different from 0 and MH ≥ 1 and MH not
significantly different from 1
C Strong DIF MH significantly greater than 1 and MH ≥ 1.5
69
For open-response items, the SMD between the reference and focal groups was used in conjunction with the MH approach. The SMD compares the means of the reference and focal groups, adjusting for the differences in the distribution of the reference- and focal-group members across the values of the matching variable. The SMD has the following form:
FkFkkRkFkkmpmpSMD , (5)
where FkFFk nnp / is the proportion of the focal group members who are at the kth level of
the matching variable, )].(/[1 t FtktFkFk nynm is the mean item score of the focal group
members at the kth level and Rk
m is the analogous value for the reference group. The SMD is
divided by the item standard deviation of the total group to obtain an effect size value for the SMD, and these effect sizes, in conjunction with Mantel’s (1963) extension of the MH chi-square (MH χ2), are used to classify OR items into three categories of DIF magnitude, as shown in Table 7.12.
Table 7.12 DIF Classification Rules for Open-Response Items
Category Description Criterion
A No or nominal DIF MH χ2 not significantly different from 0 or |Effect size| ≤ .17
B Moderate DIF MH χ2 significantly different from 0 and .17 < |Effect size| ≤ .25
C Strong DIF MH χ2 significantly different from 0 and |Effect size| > .25
For each assessment, except for the French-language Grade 9 version, two random samples of 2000 examinees were selected from the provincial student population. The samples were stratified according to gender or second-language-learner (SLL) status. The term “second language learner” is used to represent English language learners for the English-language assessments and students in the ALF/PANA program for the French-language assessments. The use of two samples provided an estimate of the stability of the results in a cross-validation process. Items that were identified as having B-level or C-level DIF in both samples were considered DIF items. In addition, if an item was flagged with B-level DIF in one sample and C-level DIF in the other sample, then this item was considered to have B-level DIF.
The item-level results are provided in Appendix 7.1. The results in each table are from two random samples and include the value of Δ for multiple-choice items, an effect size for open-response items and the significance level and the severity of DIF. Negative estimates of Δ and effect size indicate that the girls outperformed the boys or that the SLLs outperformed the non-SLLs; positive Δ and effect-size estimates indicate that the boys outperformed the girls or that the non-SLLs outperformed the SLLs.
The Primary- and Junior-Division Assessments For the reading, writing and mathematics components of the 2015−2016 primary- and junior-division assessments for both languages, the summaries of the number of items that showed statistically significant gender-based DIF with at least a B-level or C-level effect size in both the
70
two samples are reported in Tables 7.13 and 7.14, respectively. The numbers in the “boys” and “girls” columns indicate the number of DIF items favouring boys and girls.
Table 7.13 Number of B-Level Gender-Based DIF Items: Primary and Junior Assessments
Component Primary English Junior English Primary French Junior French
Boys Girls Boys Girls Boys Girls Boys Girls
Reading k = 36
0 (MC) 0 (OR)
0 (MC) 0 (OR)
0 (MC) 0 (OR)
0 (MC) 0 (OR)
0 (MC) 0 (OR)
0 (MC) 0 (OR)
1 (MC) 0 (OR)
0 (MC) 0 (OR)
Writing k = 14
0 (MC) 0 (OR)
0 (MC) 0 (OR)
0 (MC) 0 (OR)
1 (MC) 0 (OR)
0 (MC) 0 (OR)
0 (MC) 0 (OR)
0 (MC) 0 (OR)
1 (MC) 0 (OR)
Math k = 36
0 (MC) 0 (OR)
0 (MC) 0 (OR)
1 (MC) 0 (OR)
0 (MC) 0 (OR)
1 (MC) 0 (OR)
0 (MC) 0 (OR)
2(MC) 0 (OR)
0 (MC) 0 (OR)
Note. MC = multiple choice; OR = open response.
Table 7.14 Number of C-Level Gender-Based DIF Items: Primary and Junior Assessments
Component Primary English Junior English Primary French Junior French
Boys Girls Boys Girls Boys Girls Boys Girls
Reading k = 36
0 (MC) 0 (OR)
0 (MC) 0 (OR)
0 (MC) 0 (OR)
0 (MC) 0 (OR)
0 (MC) 0 (OR)
0 (MC) 0 (OR)
0 (MC) 0 (OR)
0 (MC) 0 (OR)
Writing k = 14
0 (MC) 0 (OR)
0 (MC) 0 (OR)
0 (MC) 0 (OR)
0 (MC) 0 (OR)
0 (MC) 0 (OR)
0 (MC) 0 (OR)
0 (MC) 0 (OR)
0 (MC) 0 (OR)
Math k = 36
0 (MC) 0 (OR)
0 (MC) 0 (OR)
0 (MC) 0 (OR)
0 (MC) 0 (OR)
0 (MC) 0 (OR)
0 (MC) 0 (OR)
0 (MC) 0 (OR)
0 (MC) 0 (OR)
Note. MC = multiple choice; OR = open response.
Of the 344 items comprising the primary- and junior-division assessments, seven items were found to have gender-based DIF. All of these items had B-level DIF, and all of them are multiple-choice items. Five items favoured the boys, while two favoured the girls. The mathematics component of the French-language junior-division assessment had the largest number of gender-based DIF items (two).
The summaries for SLL-based DIF are reported in Tables 7.15 and 7.16. Three out of the 344 items across all the assessments showed SLL-based DIF. One item had B-level DIF, and two items had C-level DIF. The one multiple-choice DIF item favoured non-SLL students, and the two open-response items favoured non-SLL students. The writing component of the English-language primary-division assessment was found to have the largest number of SLL-based DIF items (two).
71
Table 7.15 Number of B-Level SLL-Based DIF Items: Primary and Junior Assessments
Component Primary English Junior English Primary French Junior French
Non-SLLs SLLs Non-SLLs SLLs Non-SLLs SLLs Non-SLLs SLLs
Reading k = 36
0 (MC) 0 (OR)
0 (MC) 0 (OR)
1 (MC) 0 (OR)
0 (MC) 0 (OR)
0 (MC) 0 (OR)
0 (MC) 0 (OR)
0 (MC) 0 (OR)
0 (MC) 0 (OR)
Writing k = 14
0 (MC) 0 (OR)
0 (MC) 0 (OR)
0 (MC) 0 (OR)
0 (MC) 0 (OR)
0 (MC) 0 (OR)
0 (MC) 0 (OR)
0 (MC) 0 (OR)
0 (MC) 0 (OR)
Math k = 36
0 (MC) 0 (OR)
0 (MC) 0 (OR)
0(MC) 0 (OR)
0 (MC) 0 (OR)
0 (MC) 0 (OR)
0 (MC) 0 (OR)
0 (MC) 0 (OR)
0 (MC) 0 (OR)
Note. SLL = second-language learner; MC = multiple choice; OR = open response.
Table 7.16 Number of C-Level SLL-Based DIF Items: Primary and Junior Assessments
Component Primary English Junior English Primary French Junior French
Non-SLLs SLLs Non-SLLs SLLs Non-SLLs SLLs Non-SLLs SLLs
Reading k = 36
0 (MC) 0 (OR)
0 (MC) 0 (OR)
0 (MC) 0 (OR)
0 (MC) 0 (OR)
0 (MC) 0 (OR)
0 (MC) 0 (OR)
0 (MC) 0 (OR)
0 (MC) 0 (OR)
Writing k = 14
0 (MC) 2 (OR)
0 (MC) 0 (OR)
0 (MC) 0 (OR)
0 (MC) 0 (OR)
0 (MC) 0 (OR)
0 (MC) 0 (OR)
0 (MC) 0 (OR)
0 (MC) 0 (OR)
Math k = 36
0 (MC) 0 (OR)
0 (MC) 0 (OR)
0 (MC) 0 (OR)
0 (MC) 0 (OR)
0 (MC) 0 (OR)
0 (MC) 0 (OR)
0 (MC) 0 (OR)
0 (MC) 0 (OR)
Note. SLL = second language learner; MC = multiple choice; OR = open response. All items identified as having B-level or C-level DIF on the primary- and junior-division assessments were reviewed by the assessment team. Since the reviewers did not identify any apparent bias in the content of these items, they were not removed from the calibration, equating and scoring processes.
The Grade 9 Mathematics Assessment The gender- and SLL-based DIF (favouring boys or girls or SLL or non-SLL) results for the academic and applied versions of the Grade 9 assessment are provided in Tables 7.17–7.20. For gender-based DIF, it was not possible to have two random samples for the French-language academic and applied versions of the Grade 9 assessment, due to the small number of participating students. The number of participating French-language SLL students was also too small to conduct SLL-based DIF analysis.
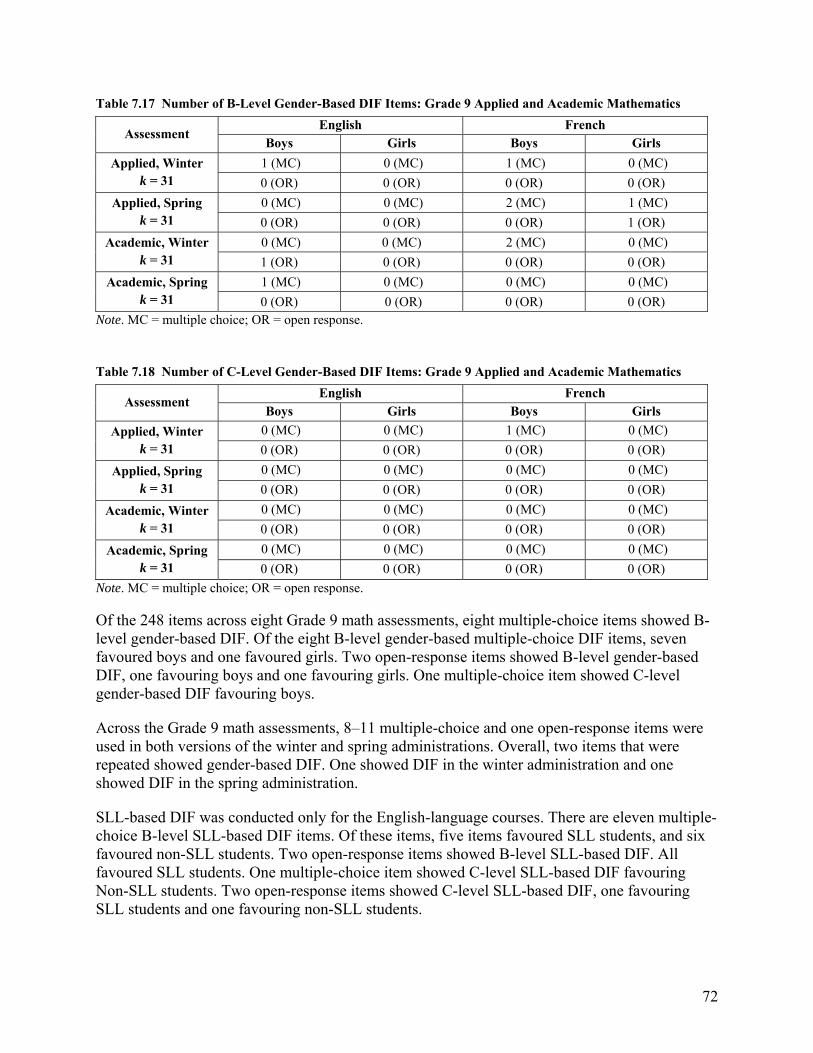
72
Table 7.17 Number of B-Level Gender-Based DIF Items: Grade 9 Applied and Academic Mathematics
Assessment English French
Boys Girls Boys Girls
Applied, Winter k = 31
1 (MC) 0 (MC) 1 (MC) 0 (MC)
0 (OR) 0 (OR) 0 (OR) 0 (OR)
Applied, Spring k = 31
0 (MC) 0 (MC) 2 (MC) 1 (MC)
0 (OR) 0 (OR) 0 (OR) 1 (OR)
Academic, Winter k = 31
0 (MC) 0 (MC) 2 (MC) 0 (MC)
1 (OR) 0 (OR) 0 (OR) 0 (OR)
Academic, Spring k = 31
1 (MC) 0 (MC) 0 (MC) 0 (MC)
0 (OR) 0 (OR) 0 (OR) 0 (OR) Note. MC = multiple choice; OR = open response.
Table 7.18 Number of C-Level Gender-Based DIF Items: Grade 9 Applied and Academic Mathematics
Assessment English French
Boys Girls Boys Girls
Applied, Winter k = 31
0 (MC) 0 (MC) 1 (MC) 0 (MC)
0 (OR) 0 (OR) 0 (OR) 0 (OR)
Applied, Spring k = 31
0 (MC) 0 (MC) 0 (MC) 0 (MC)
0 (OR) 0 (OR) 0 (OR) 0 (OR)
Academic, Winter k = 31
0 (MC) 0 (MC) 0 (MC) 0 (MC)
0 (OR) 0 (OR) 0 (OR) 0 (OR)
Academic, Spring k = 31
0 (MC) 0 (MC) 0 (MC) 0 (MC)
0 (OR) 0 (OR) 0 (OR) 0 (OR)
Note. MC = multiple choice; OR = open response. Of the 248 items across eight Grade 9 math assessments, eight multiple-choice items showed B-level gender-based DIF. Of the eight B-level gender-based multiple-choice DIF items, seven favoured boys and one favoured girls. Two open-response items showed B-level gender-based DIF, one favouring boys and one favouring girls. One multiple-choice item showed C-level gender-based DIF favouring boys.
Across the Grade 9 math assessments, 8–11 multiple-choice and one open-response items were used in both versions of the winter and spring administrations. Overall, two items that were repeated showed gender-based DIF. One showed DIF in the winter administration and one showed DIF in the spring administration.
SLL-based DIF was conducted only for the English-language courses. There are eleven multiple-choice B-level SLL-based DIF items. Of these items, five items favoured SLL students, and six favoured non-SLL students. Two open-response items showed B-level SLL-based DIF. All favoured SLL students. One multiple-choice item showed C-level SLL-based DIF favouring Non-SLL students. Two open-response items showed C-level SLL-based DIF, one favouring SLL students and one favouring non-SLL students.
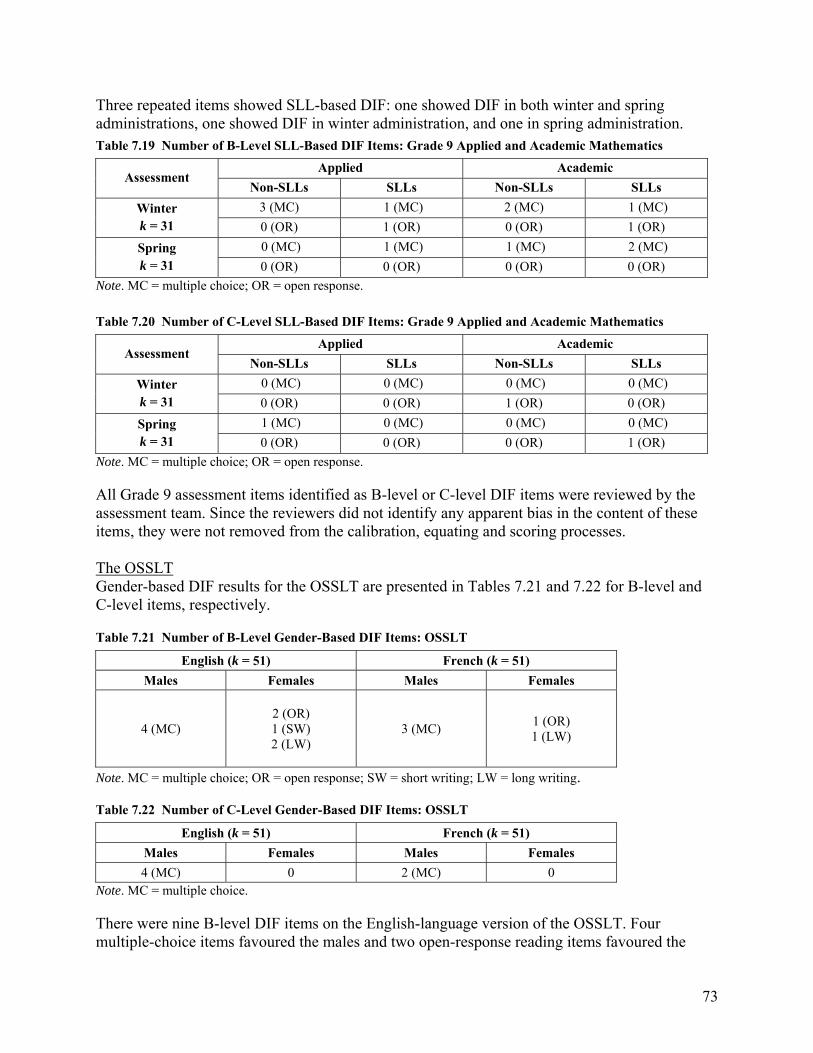
73
Three repeated items showed SLL-based DIF: one showed DIF in both winter and spring administrations, one showed DIF in winter administration, and one in spring administration. Table 7.19 Number of B-Level SLL-Based DIF Items: Grade 9 Applied and Academic Mathematics
Assessment Applied Academic
Non-SLLs SLLs Non-SLLs SLLs
Winter k = 31
3 (MC) 1 (MC) 2 (MC) 1 (MC)
0 (OR) 1 (OR) 0 (OR) 1 (OR)
Spring k = 31
0 (MC) 1 (MC) 1 (MC) 2 (MC)
0 (OR) 0 (OR) 0 (OR) 0 (OR)
Note. MC = multiple choice; OR = open response.
Table 7.20 Number of C-Level SLL-Based DIF Items: Grade 9 Applied and Academic Mathematics
Assessment Applied Academic
Non-SLLs SLLs Non-SLLs SLLs
Winter k = 31
0 (MC) 0 (MC) 0 (MC) 0 (MC)
0 (OR) 0 (OR) 1 (OR) 0 (OR)
Spring k = 31
1 (MC) 0 (MC) 0 (MC) 0 (MC)
0 (OR) 0 (OR) 0 (OR) 1 (OR)
Note. MC = multiple choice; OR = open response.
All Grade 9 assessment items identified as B-level or C-level DIF items were reviewed by the assessment team. Since the reviewers did not identify any apparent bias in the content of these items, they were not removed from the calibration, equating and scoring processes. The OSSLT Gender-based DIF results for the OSSLT are presented in Tables 7.21 and 7.22 for B-level and C-level items, respectively.
Table 7.21 Number of B-Level Gender-Based DIF Items: OSSLT
English (k = 51) French (k = 51)
Males Females Males Females
4 (MC)
2 (OR) 1 (SW) 2 (LW)
3 (MC)
1 (OR) 1 (LW)
Note. MC = multiple choice; OR = open response; SW = short writing; LW = long writing.
Table 7.22 Number of C-Level Gender-Based DIF Items: OSSLT
English (k = 51) French (k = 51)
Males Females Males Females
4 (MC) 0 2 (MC) 0 Note. MC = multiple choice.
There were nine B-level DIF items on the English-language version of the OSSLT. Four multiple-choice items favoured the males and two open-response reading items favoured the
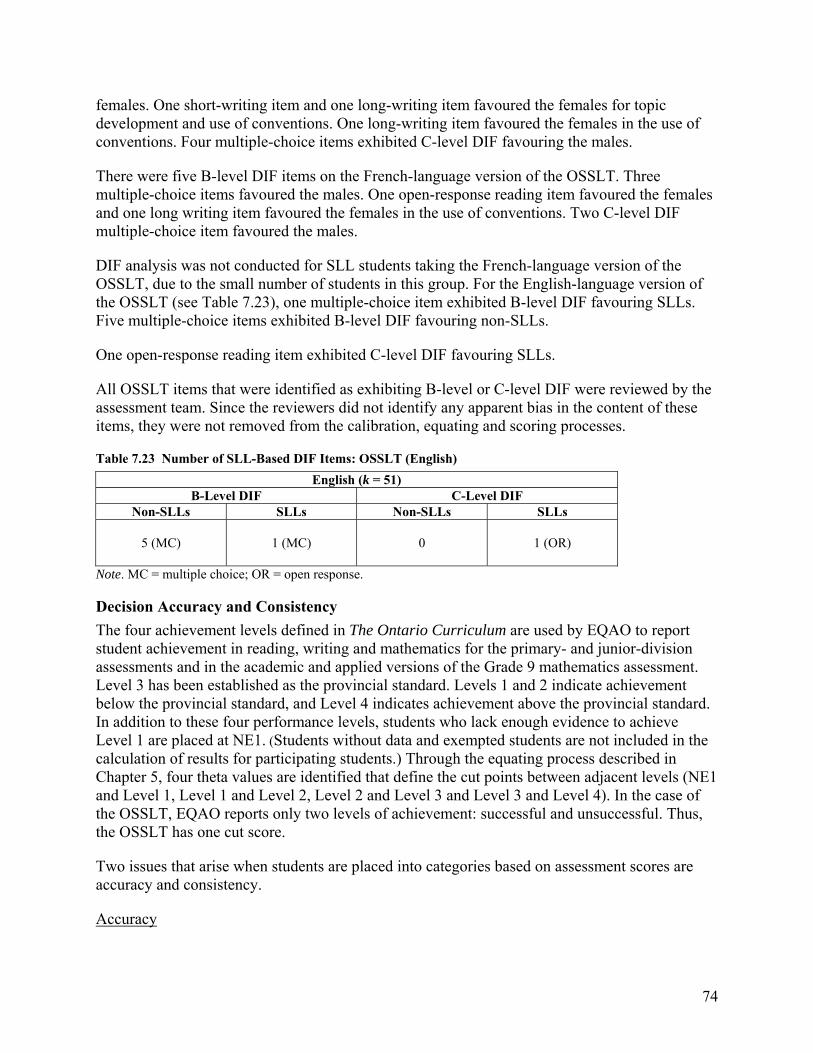
74
females. One short-writing item and one long-writing item favoured the females for topic development and use of conventions. One long-writing item favoured the females in the use of conventions. Four multiple-choice items exhibited C-level DIF favouring the males.
There were five B-level DIF items on the French-language version of the OSSLT. Three multiple-choice items favoured the males. One open-response reading item favoured the females and one long writing item favoured the females in the use of conventions. Two C-level DIF multiple-choice item favoured the males.
DIF analysis was not conducted for SLL students taking the French-language version of the OSSLT, due to the small number of students in this group. For the English-language version of the OSSLT (see Table 7.23), one multiple-choice item exhibited B-level DIF favouring SLLs. Five multiple-choice items exhibited B-level DIF favouring non-SLLs.
One open-response reading item exhibited C-level DIF favouring SLLs.
All OSSLT items that were identified as exhibiting B-level or C-level DIF were reviewed by the assessment team. Since the reviewers did not identify any apparent bias in the content of these items, they were not removed from the calibration, equating and scoring processes.
Table 7.23 Number of SLL-Based DIF Items: OSSLT (English)
English (k = 51) B-Level DIF C-Level DIF
Non-SLLs SLLs Non-SLLs SLLs
5 (MC)
1 (MC)
0 1 (OR)
Note. MC = multiple choice; OR = open response. Decision Accuracy and Consistency
The four achievement levels defined in The Ontario Curriculum are used by EQAO to report student achievement in reading, writing and mathematics for the primary- and junior-division assessments and in the academic and applied versions of the Grade 9 mathematics assessment. Level 3 has been established as the provincial standard. Levels 1 and 2 indicate achievement below the provincial standard, and Level 4 indicates achievement above the provincial standard. In addition to these four performance levels, students who lack enough evidence to achieve Level 1 are placed at NE1. (Students without data and exempted students are not included in the calculation of results for participating students.) Through the equating process described in Chapter 5, four theta values are identified that define the cut points between adjacent levels (NE1 and Level 1, Level 1 and Level 2, Level 2 and Level 3 and Level 3 and Level 4). In the case of the OSSLT, EQAO reports only two levels of achievement: successful and unsuccessful. Thus, the OSSLT has one cut score.
Two issues that arise when students are placed into categories based on assessment scores are accuracy and consistency.
Accuracy
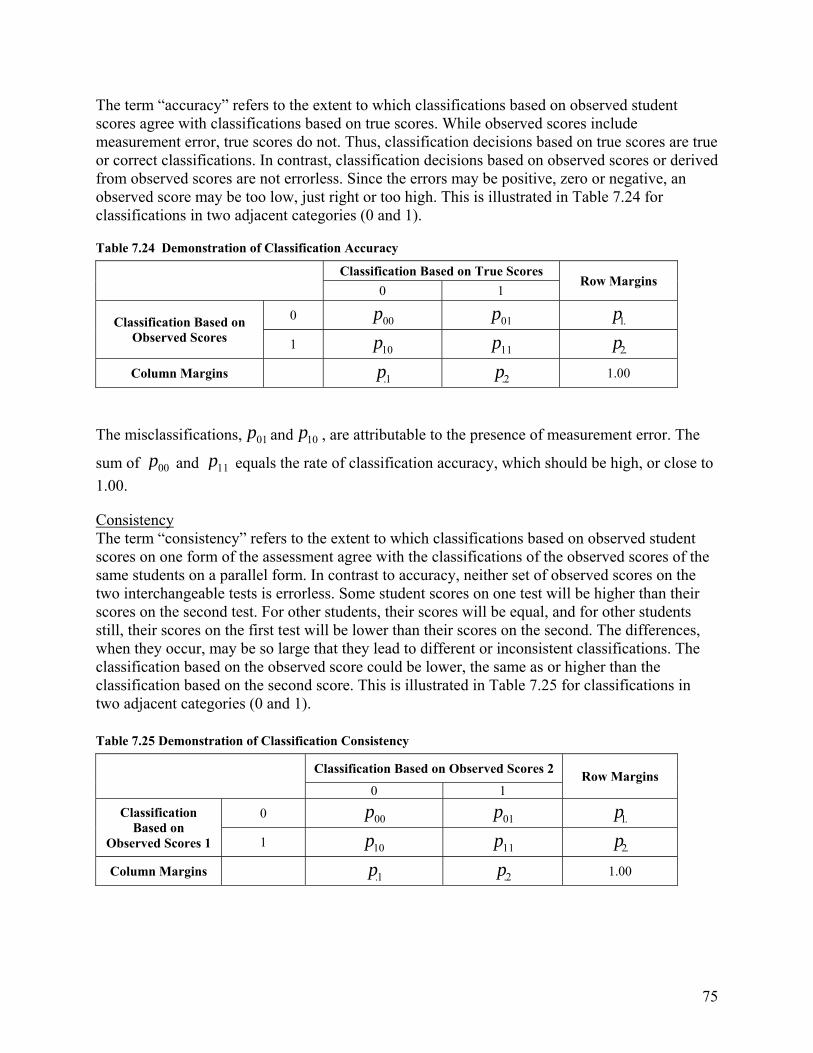
75
The term “accuracy” refers to the extent to which classifications based on observed student scores agree with classifications based on true scores. While observed scores include measurement error, true scores do not. Thus, classification decisions based on true scores are true or correct classifications. In contrast, classification decisions based on observed scores or derived from observed scores are not errorless. Since the errors may be positive, zero or negative, an observed score may be too low, just right or too high. This is illustrated in Table 7.24 for classifications in two adjacent categories (0 and 1).
Table 7.24 Demonstration of Classification Accuracy
Classification Based on True Scores Row Margins
0 1
Classification Based on Observed Scores
0 00p 01p 1.p
1 10p 11p 2.p
Column Margins .1p .2p 1.00
The misclassifications, 01p and 10p , are attributable to the presence of measurement error. The
sum of 00p and 11p equals the rate of classification accuracy, which should be high, or close to
1.00.
Consistency The term “consistency” refers to the extent to which classifications based on observed student scores on one form of the assessment agree with the classifications of the observed scores of the same students on a parallel form. In contrast to accuracy, neither set of observed scores on the two interchangeable tests is errorless. Some student scores on one test will be higher than their scores on the second test. For other students, their scores will be equal, and for other students still, their scores on the first test will be lower than their scores on the second. The differences, when they occur, may be so large that they lead to different or inconsistent classifications. The classification based on the observed score could be lower, the same as or higher than the classification based on the second score. This is illustrated in Table 7.25 for classifications in two adjacent categories (0 and 1).
Table 7.25 Demonstration of Classification Consistency
Classification Based on Observed Scores 2 Row Margins
0 1
Classification Based on
Observed Scores 1
0 00p 01p 1.p
1 10p 11p 2.p
Column Margins .1p .2p 1.00
76
The different classifications, 01p and 10p , are attributable to the presence of measurement error.
The sum of 00p and 11p equals the rate of classification consistency, which should be high or
close to 1.00.
Estimation from One Test Form There are several procedures for estimating decision accuracy and decision consistency. The procedure developed by Livingston & Lewis (1995) is used by EQAO because it yields estimates of both accuracy and consistency and allows for both multiple-choice and open-response items. Further, this procedure is commonly used in large-scale assessment programs.
The Livingston-Lewis procedure uses the classical true score,, to determine classification accuracy. The true score, corresponding to an observed score X, is expressed as a proportion on a scale of 0 to 1:
min
max min
( )fp
X X
X X
, (6)
where p is the proportional true score;
( )f X is the expected value of a student’s observed scores across f interchangeable forms and
minX and maxX are, respectively, the minimum and maximum observed scores.
Decision consistency is estimated using the joint distribution of reported performance-level classifications on the current test form and performance-level classifications on the alternate or parallel test form. In each case, the proportion of performance-level classifications with exact agreement is the sum of the entries shown in the diagonal of the contingency table representing the joint distribution.
The Livingston-Lewis procedure requires the creation of an effective test length to model the complex data. The effective test length is determined by the “number of discrete, dichotomously scored, locally independent, equally difficult test items necessary to produce total scores having the same precision as the scores being used to classify the test takers” (Livingston & Lewis, 1995, p. 180). The formula for determining the effective test length is
)1(ˆ
ˆ)ˆ)(ˆ(~2
2maxmin
XXX
XXXXX
r
rXXn
, (7)
where n~ is the effective test length rounded to the nearest integer; ˆ X is the mean of the observed scores;
2ˆ X is the unbiased estimator of the variance of the observed scores and
XXr is the reliability of the observed scores.
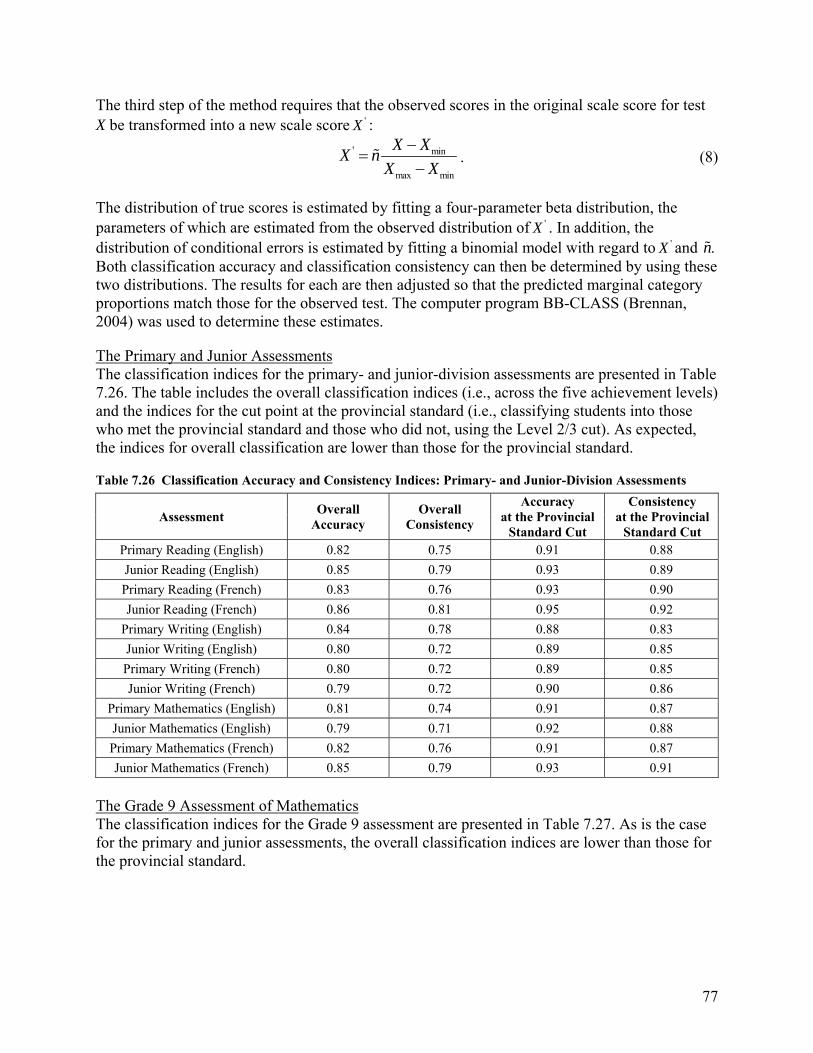
77
The third step of the method requires that the observed scores in the original scale score for test X be transformed into a new scale score 'X :
' min
max min
X XX n
X X
. (8)
The distribution of true scores is estimated by fitting a four-parameter beta distribution, the parameters of which are estimated from the observed distribution of 'X . In addition, the distribution of conditional errors is estimated by fitting a binomial model with regard to 'X and n. Both classification accuracy and classification consistency can then be determined by using these two distributions. The results for each are then adjusted so that the predicted marginal category proportions match those for the observed test. The computer program BB-CLASS (Brennan, 2004) was used to determine these estimates.
The Primary and Junior Assessments The classification indices for the primary- and junior-division assessments are presented in Table 7.26. The table includes the overall classification indices (i.e., across the five achievement levels) and the indices for the cut point at the provincial standard (i.e., classifying students into those who met the provincial standard and those who did not, using the Level 2/3 cut). As expected, the indices for overall classification are lower than those for the provincial standard.
Table 7.26 Classification Accuracy and Consistency Indices: Primary- and Junior-Division Assessments
Assessment Overall
Accuracy Overall
Consistency
Accuracy at the Provincial
Standard Cut
Consistency at the Provincial
Standard Cut Primary Reading (English) 0.82 0.75 0.91 0.88
Junior Reading (English) 0.85 0.79 0.93 0.89
Primary Reading (French) 0.83 0.76 0.93 0.90
Junior Reading (French) 0.86 0.81 0.95 0.92
Primary Writing (English) 0.84 0.78 0.88 0.83
Junior Writing (English) 0.80 0.72 0.89 0.85
Primary Writing (French) 0.80 0.72 0.89 0.85
Junior Writing (French) 0.79 0.72 0.90 0.86
Primary Mathematics (English) 0.81 0.74 0.91 0.87
Junior Mathematics (English) 0.79 0.71 0.92 0.88
Primary Mathematics (French) 0.82 0.76 0.91 0.87
Junior Mathematics (French) 0.85 0.79 0.93 0.91
The Grade 9 Assessment of Mathematics The classification indices for the Grade 9 assessment are presented in Table 7.27. As is the case for the primary and junior assessments, the overall classification indices are lower than those for the provincial standard.
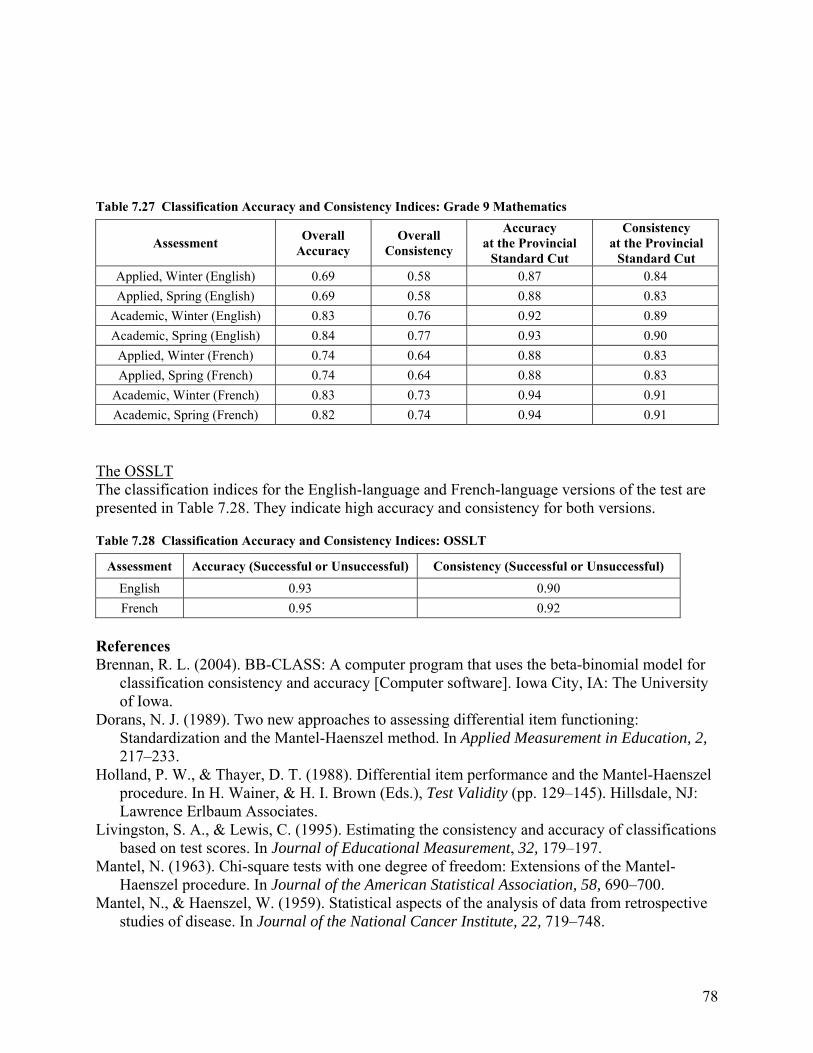
78
Table 7.27 Classification Accuracy and Consistency Indices: Grade 9 Mathematics
Assessment Overall
Accuracy Overall
Consistency
Accuracy at the Provincial
Standard Cut
Consistency at the Provincial
Standard Cut Applied, Winter (English) 0.69 0.58 0.87 0.84
Applied, Spring (English) 0.69 0.58 0.88 0.83
Academic, Winter (English) 0.83 0.76 0.92 0.89
Academic, Spring (English) 0.84 0.77 0.93 0.90
Applied, Winter (French) 0.74 0.64 0.88 0.83
Applied, Spring (French) 0.74 0.64 0.88 0.83
Academic, Winter (French) 0.83 0.73 0.94 0.91
Academic, Spring (French) 0.82 0.74 0.94 0.91
The OSSLT The classification indices for the English-language and French-language versions of the test are presented in Table 7.28. They indicate high accuracy and consistency for both versions.
Table 7.28 Classification Accuracy and Consistency Indices: OSSLT
Assessment Accuracy (Successful or Unsuccessful) Consistency (Successful or Unsuccessful)
English 0.93 0.90
French 0.95 0.92
References Brennan, R. L. (2004). BB-CLASS: A computer program that uses the beta-binomial model for
classification consistency and accuracy [Computer software]. Iowa City, IA: The University of Iowa.
Dorans, N. J. (1989). Two new approaches to assessing differential item functioning: Standardization and the Mantel-Haenszel method. In Applied Measurement in Education, 2, 217–233.
Holland, P. W., & Thayer, D. T. (1988). Differential item performance and the Mantel-Haenszel procedure. In H. Wainer, & H. I. Brown (Eds.), Test Validity (pp. 129–145). Hillsdale, NJ: Lawrence Erlbaum Associates.
Livingston, S. A., & Lewis, C. (1995). Estimating the consistency and accuracy of classifications based on test scores. In Journal of Educational Measurement, 32, 179–197.
Mantel, N. (1963). Chi-square tests with one degree of freedom: Extensions of the Mantel-Haenszel procedure. In Journal of the American Statistical Association, 58, 690–700.
Mantel, N., & Haenszel, W. (1959). Statistical aspects of the analysis of data from retrospective studies of disease. In Journal of the National Cancer Institute, 22, 719–748.

79
Zieky, M. (1993). Practical questions in the use of DIF statistics in test development. In P. W. Holland, & H. Wainer (Eds.), Differential item functioning (pp. 337–347). Hillsdale, NJ: Erlbaum.
80
CHAPTER 8: VALIDITY EVIDENCE
Introduction
Each of the previous chapters in this report contributes important information to the validity argument by addressing one or more of the following aspects of the EQAO assessments: test development, test alignment, test administration, scoring, equating, item analyses, reliability, achievement levels and reporting. The goal of the present chapter is to build the validity argument for the EQAO assessments by tying together the information presented in the previous chapters, as well as introducing new, relevant information.
The Purposes of EQAO Assessments EQAO assessments have the following general purposes:
1. To provide achievement data to evaluate the quality of the Ontario educational system for accountability purposes at the school, board and provincial levels, including monitoring changes in achievement across years.
2. To provide information to students and parents on students’ achievement of the curriculum expectations in reading, writing and mathematics at selected grade levels.
3. To provide information to be used for school improvement planning.
To meet these purposes, EQAO annually conducts four province-wide assessments in both English and French languages: the Assessments of Reading, Writing and Mathematics, Primary and Junior Divisions (Grades 3 and 6, respectively); the Grade 9 Assessment of Mathematics (academic and applied) and the Ontario Secondary School Literacy Test (OSSLT). These assessments measure how well students are achieving selected expectations as outlined in The Ontario Curriculum. The OSSLT is a graduation requirement and has been designed to ensure that students who graduate from Ontario high schools have achieved the minimum reading and writing skills defined in The Ontario Curriculum by the end of Grade 9.
Every year, the results are provided at the individual student, school, school board and provincial levels.
Conceptual Framework for the Validity Argument In the Standards for Educational and Psychological Testing (AERA, APA & NCME, 1999), validity is defined as “the degree to which evidence and theory support the interpretations of test scores entailed by proposed uses of tests” (p. 9). The closely related term “validation” is viewed as the process of “developing a scientifically sound validity argument” and of accumulating evidence “to support the intended interpretation of test scores and their relevance to the proposed use” (p. 9). As suggested by Kane (2006), “The test developer is expected to make a case for the validity of the proposed interpretations and uses, and it is appropriate to talk about their efforts to validate the claims being made” (p. 17).
The above references (AERA et al., 1999; Kane, 2006) provide a framework for describing sources of evidence that should be considered when constructing a validity argument. These sources of evidence include test content and response processes, internal structures, relationships to other variables and consequences of testing. These sources are not considered to be distinct types of validity. Instead, each contributes to a body of evidence about the validity of score interpretations and the actions taken on the basis of these interpretations. The usefulness of these

81
different types of evidence may vary from test to test. A sound validity argument should integrate all the available evidence relevant to the technical quality and utility of a testing system.
Validity Evidence Based on the Content of the Assessments and the Assessment Processes
Test Specifications for EQAO Assessments To fulfill the test purposes, the test specifications for EQAO assessments are based on curriculum content at the respective grades, in keeping with the Principles for Fair Student Assessment Practices for Education in Canada (1993). The Assessments of Reading, Writing and Mathematics, Primary and Junior Divisions, measure how well elementary-school students at Grades 3 and 6 have met the reading, writing and mathematics curriculum expectations as outlined in The Ontario Curriculum, Grades 1–8: Language (revised 2006) and The Ontario Curriculum, Grades 1–8: Mathematics (revised 2005). The Grade 9 Assessment of Mathematics measures how well students have met the expectations for Grade 9 as outlined in The Ontario Curriculum, Grades 9 and 10: Mathematics (revised 2005). The OSSLT assesses Grade 10 students’ literacy skills based on reading and writing curriculum expectations across all subjects in The Ontario Curriculum, up to the end of Grade 9. The test specifications are used in item development so that the number and types of items, as well as the coverage of expectations, are consistent across years. These specifications are presented in the EQAO framework documents, which define the construct measured by each assessment, identify the curriculum expectations covered by the assessment and present the target distribution of items across content and cognitive domains. The curriculum expectations covered by the assessments are limited to those that can be measured by paper-and-pencil tests.
Appropriateness of Test Items EQAO ensures the appropriateness of the test items to the age and grade of the students through the following two procedures in test development: involving Ontario educators as item writers and reviewers and field-testing all items prior to including them as operational items.
EQAO recruits and trains experienced Ontario educators as item writers and reviewers. The item-writing committee for each assessment consists of 10 to 20 educators who are selected because of their expert knowledge and recent classroom experience, familiarity with The Ontario Curriculum, expertise and experience in using scoring rubrics, written communication skills and experience in writing instructional or assessment materials for students. Workshops are conducted for training these item writers. After EQAO education officers review the items, item writers conduct cognitive labs in their own classes to try out the items. The results of the item tryouts help EQAO education officers review, revise and edit the items again.
EQAO also selects Ontario educators to serve on Assessment Development and Sensitivity Committees, based on their familiarity with The Ontario Curriculum, knowledge of and recent classroom experience in literacy education or mathematics education, experience with equity issues in education and experience with large-scale assessments. All items are reviewed by these committees. The goal of the Assessment Development Committee is to ensure that the items on EQAO assessments measure literacy and mathematics expectations in The Ontario Curriculum. The goal of the Sensitivity Committee is to ensure that these items are appropriate, fair and accessible to the broadest range of students in Ontario.
82
New items, except for the long-writing prompts on the primary- and junior-division assessments and on the OSSLT, are field tested each year, as non-scored items embedded within the operational tests, before they are used as operational items. Each field-test item is answered by a representative sample of students. This field testing ensures that items selected for future operational assessments are psychometrically sound and fair for all students. The items selected for the operational assessments match the blueprint and have desirable psychometric properties. Due to the amount of time required to field test long-writing prompts, these prompts are piloted only periodically, outside of the administration of the operational assessments.
Quality Assurance in Administration EQAO has established quality-assurance procedures to ensure both consistency and fairness in test administration and accuracy of results. These procedures include external quality-assurance monitors (visiting a random sample of schools to monitor whether EQAO guidelines are being followed), database analyses (examining the possibility of collusion between students and unusual changes in school performance) and examination of class sets of student booklets from a random sample of schools (looking for evidence of possible irregularities in the administration of assessments). EQAO also requires school boards to conduct thorough investigations of any reports of possible irregularities in the administration procedures.
Scoring of Open-Response Items To ensure accurate and reliable results, EQAO follows rigorous procedures when scoring open-response items. All open-response items are scored by trained scorers. For consistency across items and years, EQAO uses generic rubrics to develop specific scoring rubrics for each open-response item included in each year’s operational form. These item-specific scoring rubrics, together with anchors, are the key tools for scoring the open-response items. The anchors are chosen and validated by educators from across the province during range-finding. EQAO accesses the knowledge of subject experts from the Ontario education system in the process of preparing training materials for scorers. A range-finding committee, consisting of eight to 25 selected Ontario educators, is formed to make recommendations on training materials. EQAO education officers then consider the recommendations and make final decisions for the development of these materials.
To ensure consistent scoring, scorers are trained to use the rubrics and anchors. Following training, scorers must pass a qualifying test before they begin scoring student responses. EQAO also conducts daily reviews of scorer validity and interrater reliability and provides additional training where indicated. Scorers failing to meet validity expectations may be dismissed.
Field-test items are scored using the same scoring requirements as those for the operational items. Scorers for field-test items are selected from the scorers of operational items to ensure accurate and consistent scoring of both. The results for the field-test items are used to select the items for the operational test for the next year.
For the items that are used for equating, it is essential to have accurate and consistent scoring across two consecutive years. To eliminate any possible changes in scoring across two years and to ensure the consistency of provincial standards, the student field-test responses to the open-response equating items from the previous year are rescored during the scoring of the current operational responses.
83
Scoring validity is assessed by examining the agreement between the scores assigned by the scorers and those assigned by an expert panel. EQAO has established targets for exact agreement and exact-plus-adjacent agreement. For the primary and junior assessments, the EQAO target of 95% exact-plus-adjacent agreement was met for all but one item in the mathematics component and for all items in the reading and writing components. The aggregate exact-plus-adjacent validity estimates for the items in each component ranged from 95.8 to 100%. For Grade 9 mathematics, the EQAO target of 95% exact-plus-adjacent agreement was met for all but three items in the French-language applied assessment and four items in the French-language academic assessment; the aggregate validity estimates ranged from 71.2 to 100%. For the OSSLT, the EQAO target of 95% exact-plus-adjacent agreement was met for all but one item in the French-language assessment, and the aggregate validity estimates ranged from 89.6 to 99.8% (see Appendix 4.1).
In addition, for the paper-based scoring process, student responses to multiple-choice items are captured by optical-scan forms. EQAO also conducts a quality-assurance check to ensure that fields are captured with a 99.9% accuracy rate.
Equating The fixed-common-item-parameter (FCIP) procedure is used to equate EQAO tests over different years. Common items are sets of items that are identical in two tests and are used to create a common scale for all the items in the tests. These common items are selected from the field-test items administered in one year and used as operational items in the next year. EQAO uses state-of-the-art equating procedures to ensure comparability of results across years. A small number of field-test items are embedded in each operational form in positions that are not revealed to the students. For more details on the equating process, see Chapter 5.
These equating procedures enable EQAO to monitor changes in student achievement over time. Research conducted by EQAO on model selection (Xie, 2007) and on equating methods (Pang, Madera, Radwan & Zhang, 2010) showed that both the current IRT models and the FCIP equating method used by EQAO are appropriate and function well with the EQAO assessments. To ensure that analyses are correctly completed, the analyses conducted by EQAO staff are replicated by a qualified external contractor.
Validity Evidence Based on the Test Constructs and Internal Structure
Test Dimensionality An underlying assumption of IRT models for score interpretation is that there is a unidimensional structure underlying each assessment. A variation of the parallel analysis procedure was conducted for selected 2009 and 2010 EQAO operational assessments, and the results show that, although two or three dimensions were identified for the assessments, there is one dominant factor in each assessment (Zhang, Pang, Xu, Gu, Radwan, Madera, 2011). These results indicate that the IRT models would probably be robust with respect to the dimensionality of the assessments. This conclusion was also supported by EQAO research on the appropriateness of the IRT models used to calibrate assessment items, which included an examination of dimensionality (Xie, 2007).
84
Technical Quality of the Assessments When selecting items for the operational assessment forms, the goal is to have items with p-values within the 0.25 to 0.95 range and item-to-total-test correlations of 0.20 or higher. To meet the requirements of the test blueprints, it is sometimes necessary to include a small number of items with statistics outside these ranges. For each assessment, a target test information function (TIF) also guides the construction of its new operational test form. Based on the pool of operational items from previous assessments, a target TIF was developed for each assessment by taking test length and item format into consideration. The use of target TIFs reduces the potential of drift across years and of perpetuating test weaknesses from one year to the next, and helps to meet and maintain the desired level of precision at critical points on the score scale.
To assess the precision of the scores for the EQAO assessments, a variety of test statistics are computed, including Cronbach’s alpha reliability coefficient, the standard error of measurement, test characteristic curves, test information functions, differential item functioning statistics and classification accuracy and consistency. Overall, the results of these measures indicate that satisfactory levels of precision have been obtained. The reliability coefficients ranged from 0.81 to 0.90 for the primary and junior assessments, 0.85 to 0.88 for Grade 9 mathematics, and 0.88 to 0.89 for the OSSLT. The classification accuracy for students who were at or above the provincial standard for the primary, junior and Grade 9 assessments and who were successful on the OSSLT ranged from 0.89 to 0.95, indicating that about 90% of students were correctly classified.
As discussed above, a number of factors contributed to this level of precision: the quality of the individual assessment items, the accuracy and consistency of scoring and the interrelationships among the items. All items on the EQAO assessments are directly linked to expectations in the curriculum. For the operational assessments, EQAO selects items that are of an appropriate range of difficulty and that discriminate between students with high and low levels of achievement. As described above, a number of practices maintain and improve accuracy and consistency in scoring.
To further ensure that the assessments are well-designed and conducted according to current best practices, an External Psychometric Expert Panel (PEP) meets twice a year with officials from EQAO. The PEP responds to questions from EQAO staff and reviews the item and test statistics for all operational forms, the psychometric procedures used by EQAO and all the research projects on psychometric issues.
Validity Evidence Based on External Assessment Data
Linkages to International Assessment Programs EQAO commissioned research to compare the content and standards of the reading component of the primary and junior assessments with those of the Progress in International Reading Literacy Study (PIRLS) in Grade 4 (Peterson, 2007; Simon, Dionne, Simoneau & Dupuis, 2008). The conclusion of these studies was that the constructs, benchmarks and performance levels for the EQAO and PIRLS assessments were sufficiently similar to allow for reasonable comparisons of the overall findings and trends in student performance. The expectations corresponding to the high international benchmark (for PIRLS) and Level 3 (Ontario provincial standard) were comparable.
85
EQAO conducted research to examine literacy skills by linking performance on the OSSLT with performance on the reading component of the 2009 Programme for International Student Assessment (PISA). Both assessments were administered to the same group of students between April and May 2009.
The standard for a successful result on the OSSLT is comparable to the standard for Level 2 achievement on PISA, which is the achievement benchmark at which students begin to demonstrate the kind of knowledge and skills needed to use reading competencies effectively. The basic literacy competency defined for the OSSLT is consistent with this description of Level 2 literacy in PISA. The percentage of students achieving at or above Level 2 on PISA is slightly higher than the percentage of successful students on the OSSLT (Radwan & Xu, 2012).
Validity Evidence Supporting Appropriate Interpretations of Results
Setting Standards During the first administrations of the EQAO assessments in Grades 3 and 6, teachers assigned student achievement levels to each student based on an evaluation of the student’s body of work in a number of content and cognitive domains. A panel of educators reviewed the students’ work and selected anchor papers, which were assigned to each achievement level. These anchor papers represented the quality of work expected at each achievement level, based on the expert opinion of the panel. Since 2004, these standards have been maintained through equating.
When the Grade 9 Assessment of Mathematics and the OSSLT were introduced, standard-setting panels were convened to set cut points for each reporting category. A modified Angoff approach was used to set the cut points.
A second standard-setting session was conducted for the OSSLT in 2006, when a single literacy score was calculated to replace the separate reading and writing scores that had been used up to that point. For OSSLT, the purpose of the standard-setting session was to apply the standards that had already been set for writing and reading separately to the combined test. EQAO also conducted a linking study by creating a pseudo test from the 2004 items that resembled the structure, content and length of the 2006 test. A scaling-for-comparability analysis, using common items across the two years, was conducted to place the scores of the two tests on a common scale. This analysis used a fixed common-item-parameter non-equivalent group design. The decision on the cut point for the 2006 test was informed by both the standard-setting session and the scaling-for-comparability analysis.
A second standard-setting session for Grade 9 applied mathematics was conducted in 2007, when there was a substantial change to the provincial curriculum. This process established a new standard for this assessment.
Reporting EQAO employs a number of strategies to promote the appropriate interpretation of reported results. The Individual Student Report (ISR) presents student achievement according to levels that have been defined for the curriculum and used by teachers in determining report card marks. The ISR for the OSSLT identifies areas where a student has performed well and where a student should improve. The ISRs for the primary, junior and Grade 9 assessments include school, school board and provincial results that provide an external referent to further interpret
86
individual student results. The ISR for the OSSLT includes the median scale score for the school and province.
EQAO provides interpretation guides and workshops on the appropriate uses of assessment results in school improvement planning. The workshops are conducted by the members of the Outreach Team. These members have intimate knowledge of the full assessment process and the final results. As well, EQAO provides school success stories that are shared with all the schools in Ontario as a way of suggesting how school-based personnel can use the assessment results to improve student learning. EQAO also provides information to the media and the public on appropriate uses of the assessment results for schools. In particular, EQAO emphasizes that EQAO results must be interpreted in conjunction with a wide range of available information concerning student achievement and school success.
According to feedback collected by the Outreach Team and teacher responses on questionnaires, educators are finding the EQAO results useful.
Conclusion
This chapter follows the argument-based approach to validation, as specified in the Standards for Educational and Psychological Testing (AERA, APA & NCME, 1999) and by Kane (2006, 2013). With this approach, the claims about proposed interpretations or uses are stated, and then these claims are evaluated. Three purposes of the EQAO assessments are clearly given at the beginning of this chapter, and various sources of evidence are summarized in the previous sections to evaluate these purposes.
In order to provide data for accountability purposes, for informing individual students of their achievement and for school improvement planning, the assessments must be carefully constructed and closely aligned with curriculum expectations, the results must be reliable and based on accurate scaling, equating and standard setting, and there should be a convergent relationship between EQAO assessments and other assessments that measure a similar construct. The types of validity evidence presented in this chapter and throughout this technical report support these claims. It is always challenging to collect evidence based on consequences of testing, but several research projects have been proposed at EQAO to address the intended and unintended outcomes and the positive and negative systemic effects from the interpretations and uses of EQAO assessment results.
References American Educational Research Association, American Psychological Association, & National
Council on Measurement in Education. (1999). Standards for educational and psychological testing. Washington, DC: American Educational Research Association.
Kane, M. T. (2006). Validation. In R. L. Brennan (Ed.), Educational measurement (4th ed.) (pp. 17–64). Westport, CT: American Council on Education and Praeger Publishers.
Pang, X., Madera, E., Radwan, N. & Zhang, S. (2010). A comparison of four test equating methods. Retrieved November 8, 2011, from http://www.eqao.com/Research/pdf/E/Equating_Crp_cftem_ne_0410.pdf
87
Peterson, S. S. (2007). Linking Ontario provincial student assessment standards with those of the Progress in International Reading Literacy Study (PIRLS), 2006. Retrieved November 8, 2011, from http://www.eqao.com/Research/pdf/E/StandardsStudyReport_PIRLS2006E.pdf
Simon, M., Dionne, A., Simoneau, M. & Dupuis, J. (2008). Comparison des normes établies pour les évaluations provinciales en Ontario avec celles du Programme international de recherche en lecture scolaire (PIRLS), 2006. Retrieved November 8, 2011, from http://www.eqao.com/Research/pdf/F/StandardsStudyReport_PIRLS2006F.pdf
Radwan, N., Xu, Y. (2012). Comparison of the Performance of Ontario Students on the OSSLT/TPCL and the PISA 2009 Reading Assessment. Retrieved February 10, 2015, from http://www.eqao.com/en/research_data/Research_Reports/DMA-docs/comparison-OSSLT-PISA-2009.pdf
Working Group and Joint Advisory Committee. (1993). Principles for fair student assessment practices for education in Canada. Retrieved November 8, 2011, from http://www2.education.ualberta.ca/educ/psych/crame/files/eng_prin.pdf
Xie, Y. (2007). Model selection for the analysis of EQAO assessment data. Unpublished paper. Zhang, S., Pang, X., Xu, Y., Gu, Z., Radwan, N., & Madera, E. (2011). Multidimensional item
response theory (MIRT) for subscale scoring. Unpublished paper.
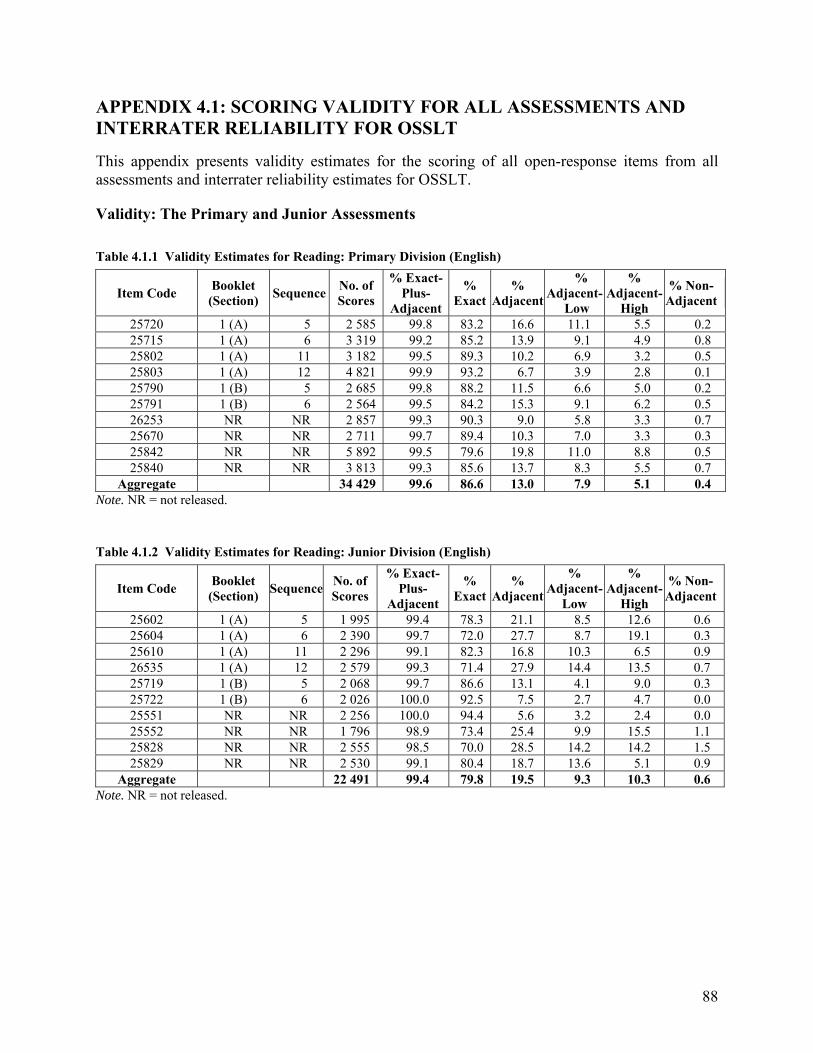
88
APPENDIX 4.1: SCORING VALIDITY FOR ALL ASSESSMENTS AND INTERRATER RELIABILITY FOR OSSLT
This appendix presents validity estimates for the scoring of all open-response items from all assessments and interrater reliability estimates for OSSLT.
Validity: The Primary and Junior Assessments
Table 4.1.1 Validity Estimates for Reading: Primary Division (English)
Item Code Booklet (Section)
Sequence No. of Scores
% Exact- Plus-
Adjacent
% Exact
% Adjacent
% Adjacent-
Low
% Adjacent-
High
% Non-Adjacent
25720 1 (A) 5 2 585 99.8 83.2 16.6 11.1 5.5 0.2 25715 1 (A) 6 3 319 99.2 85.2 13.9 9.1 4.9 0.8 25802 1 (A) 11 3 182 99.5 89.3 10.2 6.9 3.2 0.5 25803 1 (A) 12 4 821 99.9 93.2 6.7 3.9 2.8 0.1 25790 1 (B) 5 2 685 99.8 88.2 11.5 6.6 5.0 0.2 25791 1 (B) 6 2 564 99.5 84.2 15.3 9.1 6.2 0.5 26253 NR NR 2 857 99.3 90.3 9.0 5.8 3.3 0.7 25670 NR NR 2 711 99.7 89.4 10.3 7.0 3.3 0.3 25842 NR NR 5 892 99.5 79.6 19.8 11.0 8.8 0.5 25840 NR NR 3 813 99.3 85.6 13.7 8.3 5.5 0.7
Aggregate 34 429 99.6 86.6 13.0 7.9 5.1 0.4 Note. NR = not released. Table 4.1.2 Validity Estimates for Reading: Junior Division (English)
Item Code Booklet (Section)
SequenceNo. of Scores
% Exact- Plus-
Adjacent
% Exact
% Adjacent
% Adjacent-
Low
% Adjacent-
High
% Non-Adjacent
25602 1 (A) 5 1 995 99.4 78.3 21.1 8.5 12.6 0.6 25604 1 (A) 6 2 390 99.7 72.0 27.7 8.7 19.1 0.3 25610 1 (A) 11 2 296 99.1 82.3 16.8 10.3 6.5 0.9 26535 1 (A) 12 2 579 99.3 71.4 27.9 14.4 13.5 0.7 25719 1 (B) 5 2 068 99.7 86.6 13.1 4.1 9.0 0.3 25722 1 (B) 6 2 026 100.0 92.5 7.5 2.7 4.7 0.0 25551 NR NR 2 256 100.0 94.4 5.6 3.2 2.4 0.0 25552 NR NR 1 796 98.9 73.4 25.4 9.9 15.5 1.1 25828 NR NR 2 555 98.5 70.0 28.5 14.2 14.2 1.5 25829 NR NR 2 530 99.1 80.4 18.7 13.6 5.1 0.9
Aggregate 22 491 99.4 79.8 19.5 9.3 10.3 0.6 Note. NR = not released.
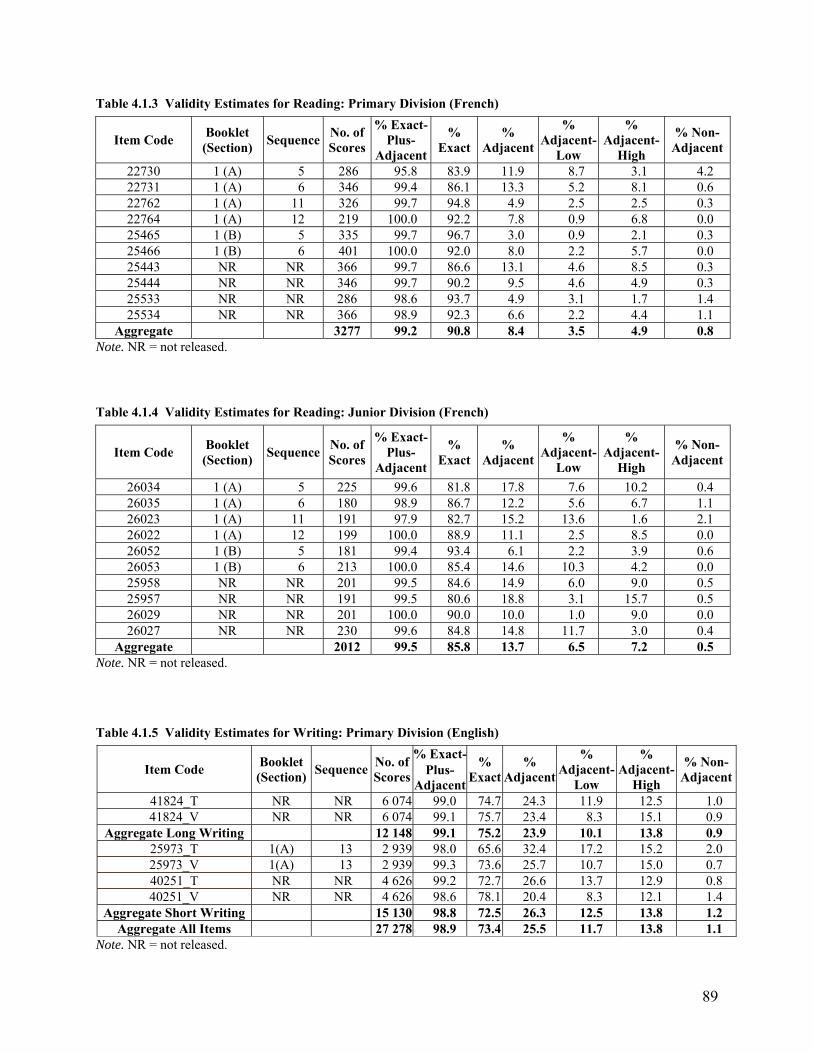
89
Table 4.1.3 Validity Estimates for Reading: Primary Division (French)
Item Code Booklet (Section)
Sequence No. of Scores
% Exact-Plus-
Adjacent
% Exact
% Adjacent
% Adjacent-
Low
% Adjacent-
High
% Non-Adjacent
22730 1 (A) 5 286 95.8 83.9 11.9 8.7 3.1 4.2 22731 1 (A) 6 346 99.4 86.1 13.3 5.2 8.1 0.6 22762 1 (A) 11 326 99.7 94.8 4.9 2.5 2.5 0.3 22764 1 (A) 12 219 100.0 92.2 7.8 0.9 6.8 0.0 25465 1 (B) 5 335 99.7 96.7 3.0 0.9 2.1 0.3 25466 1 (B) 6 401 100.0 92.0 8.0 2.2 5.7 0.0 25443 NR NR 366 99.7 86.6 13.1 4.6 8.5 0.3 25444 NR NR 346 99.7 90.2 9.5 4.6 4.9 0.3 25533 NR NR 286 98.6 93.7 4.9 3.1 1.7 1.4 25534 NR NR 366 98.9 92.3 6.6 2.2 4.4 1.1
Aggregate 3277 99.2 90.8 8.4 3.5 4.9 0.8 Note. NR = not released.
Table 4.1.4 Validity Estimates for Reading: Junior Division (French)
Item Code Booklet (Section)
Sequence No. of Scores
% Exact-Plus-
Adjacent
% Exact
% Adjacent
% Adjacent-
Low
% Adjacent-
High
% Non-Adjacent
26034 1 (A) 5 225 99.6 81.8 17.8 7.6 10.2 0.4 26035 1 (A) 6 180 98.9 86.7 12.2 5.6 6.7 1.1 26023 1 (A) 11 191 97.9 82.7 15.2 13.6 1.6 2.1 26022 1 (A) 12 199 100.0 88.9 11.1 2.5 8.5 0.0 26052 1 (B) 5 181 99.4 93.4 6.1 2.2 3.9 0.6 26053 1 (B) 6 213 100.0 85.4 14.6 10.3 4.2 0.0 25958 NR NR 201 99.5 84.6 14.9 6.0 9.0 0.5 25957 NR NR 191 99.5 80.6 18.8 3.1 15.7 0.5 26029 NR NR 201 100.0 90.0 10.0 1.0 9.0 0.0 26027 NR NR 230 99.6 84.8 14.8 11.7 3.0 0.4
Aggregate 2012 99.5 85.8 13.7 6.5 7.2 0.5 Note. NR = not released.
Table 4.1.5 Validity Estimates for Writing: Primary Division (English)
Item Code Booklet (Section)
SequenceNo. of Scores
% Exact-%
Exact%
Adjacent
% Adjacent-
Low
% Adjacent-
High
% Non-AdjacentPlus-
Adjacent41824_T NR NR 6 074 99.0 74.7 24.3 11.9 12.5 1.0 41824_V NR NR 6 074 99.1 75.7 23.4 8.3 15.1 0.9
Aggregate Long Writing 12 148 99.1 75.2 23.9 10.1 13.8 0.9 25973_T 1(A) 13 2 939 98.0 65.6 32.4 17.2 15.2 2.0 25973_V 1(A) 13 2 939 99.3 73.6 25.7 10.7 15.0 0.7 40251_T NR NR 4 626 99.2 72.7 26.6 13.7 12.9 0.8 40251_V NR NR 4 626 98.6 78.1 20.4 8.3 12.1 1.4
Aggregate Short Writing 15 130 98.8 72.5 26.3 12.5 13.8 1.2 Aggregate All Items 27 278 98.9 73.4 25.5 11.7 13.8 1.1
Note. NR = not released.
90
Table 4.1.6 Validity Estimates for Writing: Junior Division (English)
Item Code Booklet (Section)
SequenceNo. of Scores
% Exact-%
Exact%
Adjacent
% Adjacent-
Low
% Adjacent-
High
% Non-AdjacentPlus-
Adjacent40195_T NR NR 2 020 98.0 67.0 30.9 18.8 12.1 2.0 40195_V NR NR 2 020 99.2 68.9 30.2 20.4 9.8 0.8
Aggregate Long Writing 4 040 98.6 68.0 30.6 19.6 11.0 1.4 22695_T 1(A) 13 2 645 98.9 69.6 29.3 15.1 14.3 1.1 22695_V 1(A) 13 2 645 99.8 75.7 24.1 15.5 8.6 0.2 26008_T NR NR 2 190 97.2 65.9 31.3 14.3 17.0 2.8 26008_V NR NR 2 190 99.7 71.8 27.9 13.8 14.2 0.3
Aggregate Short Writing 9 670 98.9 70.7 28.2 14.7 13.5 1.1 Aggregate All Items 13 710 98.8 69.8 29.0 16.3 12.7 1.2
Note. NR = not released.
Table 4.1.7 Validity Estimates for Writing: Primary Division (French)
Item Code Booklet (Section)
SequenceNo. of Scores
% Exact-%
Exact%
Adjacent
% Adjacent-
Low
% Adjacent-
High
% Non-AdjacentPlus-
Adjacent41756_T NR NR 216 99.1 75.0 24.1 17.6 6.5 0.9 41756_V NR NR 216 100.0 73.6 26.4 2.3 24.1 0.0
Aggregate Long Writing 432 99.5 74.3 25.2 10.0 15.3 0.5 26473_T 1(A) 13 336 100.0 76.2 23.8 3.9 19.9 0.0 26473_V 1(A) 13 336 99.4 64.9 34.5 17.3 17.3 0.6 25855_T NR NR 383 99.5 73.9 25.6 7.6 18.0 0.5 25855_V NR NR 383 97.9 74.2 23.8 5.2 18.5 2.1
Aggregate Short Writing 1438 99.2 72.3 26.9 8.5 18.4 0.8 Aggregate All Items 1870 99.3 73.0 26.4 9.0 17.4 0.7
Note. NR = not released.
Table 4.1.8 Validity Estimates for Writing: Junior Division (French)
Item Code Booklet (Section)
SequenceNo. of Scores
% Exact-%
Exact%
Adjacent
% Adjacent-
Low
% Adjacent-
High
% Non-AdjacentPlus-
Adjacent29504_T NR NR 223 97.8 68.2 29.6 15.7 13.9 2.2 29504_V NR NR 223 100.0 81.2 18.8 9.4 9.4 0.0
Aggregate Long Writing 446 98.9 74.7 24.2 12.6 11.7 1.1 26087_T 1(A) 13 209 100.0 62.2 37.8 10.0 27.8 0.0 26087_V 1(A) 13 209 100.0 64.6 35.4 3.8 31.6 0.0 26171_T NR NR 175 98.9 86.9 12.0 7.4 4.6 1.1 26171_V NR NR 175 99.4 87.4 12.0 5.7 6.3 0.6
Aggregate Short Writing 768 99.6 75.3 24.3 6.8 17.5 0.4 Aggregate All Items 1214 99.3 75.1 24.3 8.7 15.6 0.7
Note. NR = not released.
91
Table 4.1.9 Validity Estimates for Mathematics: Primary Division (English)
Item Code Booklet (Section)
Sequence No. of Scores
% Exact-Plus-
Adjacent
% Exact
% Adjacent
% Adjacent-
Low
% Adjacent-
High
% Non-Adjacent
19573 NR NR 1 337 99.9 98.3 1.6 0.7 0.9 0.1 10736 3(1) 10 1 342 99.6 90.5 9.1 5.9 3.2 0.4 22253 NR NR 1 331 100.0 98.6 1.4 0.9 0.5 0.0 25407 NR NR 1 483 99.7 91.0 8.7 1.3 7.3 0.3 25405 3(2) 10 1 290 99.7 96.7 2.9 1.0 1.9 0.3 19256 3(2) 11 1 391 99.9 96.0 3.9 3.7 0.1 0.1 16682 3(2) 12 1 453 99.9 94.6 5.2 3.0 2.2 0.1 25227 NR NR 1 410 100.0 97.5 2.5 1.1 1.3 0.0
Aggregate 11 037 99.8 95.4 4.5 2.2 2.2 0.2 Note. NR = not released.
Table 4.1.10 Validity Estimates for Mathematics: Junior Division (English)
Item Code Booklet (Section)
Sequence No. of Scores
% Exact-Plus-
Adjacent
% Exact
% Adjacent
% Adjacent-
Low
% Adjacent-
High
% Non-Adjacent
22342 3(1) 8 1 495 100.0 97.2 2.8 0.8 2.0 0.0 22534 NR NR 1 535 99.9 98.0 2.0 0.8 1.2 0.1 25103 3(1) 11 3 943 99.6 93.8 5.8 3.8 2.0 0.4 25100 NR NR 1 531 100.0 98.8 1.2 0.6 0.7 0.0 22341 3(2) 10 1 925 99.5 93.1 6.3 2.8 3.6 0.5 27528 NR NR 3 443 99.6 94.8 4.8 3.1 1.7 0.4 25101 NR NR 1 520 99.9 97.4 2.5 1.6 0.9 0.1 25091 3(2) 13 6 146 100.0 97.2 2.8 1.2 1.6 0.0
Aggregate 21 538 99.8 96.0 3.8 2.0 1.7 0.2 Note. NR = not released.
Table 4.1.11 Validity Estimates for Mathematics: Primary Division (French)
Item Code Booklet (Section)
Sequence No. of Scores
% Exact-Plus-
Adjacent
% Exact
% Adjacent
% Adjacent-
Low
% Adjacent-
High
% Non-Adjacent
25290 NR NR 440 98.9 92.3 6.6 3.2 3.4 1.1 19821 NR NR 332 100.0 95.5 4.5 2.1 2.4 0.0 13255 3(1) 11 383 100.0 86.2 13.8 2.1 11.7 0.0 14632 3(1) 12 389 100.0 93.6 6.4 2.1 4.4 0.0 23426 NR NR 440 99.8 95.7 4.1 2.5 1.6 0.2 25341 3(2) 11 397 100.0 85.4 14.6 7.8 6.8 0.0 23429 NR NR 372 99.5 89.5 9.9 6.2 3.8 0.5 25288 3(2) 13 306 97.7 83.7 14.1 7.8 6.2 2.3
Aggregate 3059 99.5 90.4 9.1 4.1 5.0 0.5 Note. NR = not released.
92
Table 4.1.12 Validity Estimates for Mathematics: Junior Division (French)
Item Code Booklet (Section)
Sequence No. of Scores
% Exact-Plus-
Adjacent
% Exact
% Adjacent
% Adjacent-
Low
% Adjacent-
High
% Non-Adjacent
25383 NR NR 251 99.6 96.0 3.6 0.8 2.8 0.4 14687 NR NR 282 100.0 97.2 2.8 0.4 2.5 0.0 26448 NR NR 382 100.0 94.5 5.5 2.9 2.6 0.0 20165 NR NR 358 99.4 94.1 5.3 2.0 3.4 0.6 25271 3(2) 10 247 99.6 93.5 6.1 5.7 0.4 0.4 20196 3(2) 11 357 98.9 89.4 9.5 4.8 4.8 1.1 22511 3(2) 12 204 100.0 98.5 1.5 0.5 1.0 0.0 22415 3(2) 13 399 99.7 95.0 4.8 1.3 3.5 0.3
Aggregate 2480 99.6 94.5 5.2 2.3 2.8 0.4 Note. NR = not released.
Validity: The Grade 9 Assessment of Mathematics (Academic and Applied)
Table 4.1.13 Validity Estimates for Grade 9 Applied Mathematics (English)
Administration Item Code
Sequence No. of Scores
% Exact- Plus-
Adjnt.
% Exact
% Adjnt.
% Adjnt.-
Low
% Adjnt.-High
% Non-Adjnt.
Winter
24808 18 115 100.0 89.6 10.4 2.6 7.8 0.0 24888 15 131 100.0 99.2 0.8 0.0 0.8 0.0 21569 14 123 100.0 98.4 1.6 0.8 0.8 0.0 21568 NR 135 98.5 89.6 8.9 1.5 7.4 1.5 24806 NR 114 99.1 90.4 8.8 6.1 2.6 0.9 21533 NR 121 100.0 97.5 2.5 1.7 0.8 0.0 24889 NR 114 100.0 95.6 4.4 0.9 3.5 0.0
Aggregate 853 99.6 94.4 5.3 1.9 3.4 0.4
Spring
24823 13 721 98.9 87.2 11.7 2.6 9.0 1.1 24870 16 509 99.8 95.9 3.9 2.8 1.2 0.2 19627 17 489 100.0 98.6 1.4 0.6 0.8 0.0 24805 NR 448 100.0 90.6 9.4 2.0 7.4 0.0 24843 NR 458 100.0 93.9 6.1 2.0 4.1 0.0 21514 NR 704 98.9 92.3 6.5 0.7 5.8 1.1 24827 NR 569 99.5 89.5 10.0 3.0 7.0 0.5
Aggregate 3989 99.5 92.2 7.3 1.9 5.3 0.5 Aggregate
Across Administrations
4842 99.6 93.3 6.3 1.9 4.4 0.5
Note. NR = not released.
93
Table 4.1.14 Validity Estimates for Grade 9 Academic Mathematics (English)
Administration Item Code SequenceNo. of Scores
% Exact- Plus-
Adjnt.
% Exact
% Adjnt.
% Adjnt.-
Low
% Adjnt.-
High
% Non-Adjnt.
Winter
24747 9 413 99.8 92.3 7.5 6.1 1.5 0.2 24730 12 470 99.6 88.9 10.6 7.7 3.0 0.4 12907 11 490 99.2 80.6 18.6 4.1 14.5 0.8 21681 NR 406 100.0 95.3 4.7 2.2 2.5 0.0 15702 NR 426 99.1 92.5 6.6 4.2 2.3 0.7 24787 NR 377 99.2 84.6 14.6 5.0 9.5 0.8 24770 NR 500 100.0 90.8 9.2 6.4 2.8 0.0
Aggregate 2082 99.5 89.2 10.4 5.2 5.2 0.4
Spring
26865 10 1492 99.7 82.8 16.9 10.9 6.0 0.3 24712 13 1291 99.8 89.5 10.4 7.3 3.1 0.2 24751 14 1575 99.9 98.2 1.7 1.0 0.7 0.1 24728 NR 1356 99.5 83.6 15.9 8.4 7.4 0.5 24711 NR 1436 99.6 80.2 19.4 10.9 8.6 0.4 24749 NR 1625 99.0 84.6 14.4 3.8 10.6 1.0 24750 NR 1006 99.7 83.8 15.9 10.0 5.9 0.3
Aggregate 3989 99.6 86.3 13.3 7.2 6.1 0.4 Aggregate
Across Administrations
6071 99.6 87.8 11.9 6.2 5.7 0.4
Note. NR = not released.
Table 4.1.15 Validity Estimates for Grade 9 Applied Mathematics (French)
Administration Item Code Sequence No. of Scores
% Exact- Plus-
Adjnt.
% Exact
% Adjnt.
% Adjnt.-
Low
% Adjnt.-High
% Non-Adjnt.
Winter
21775 12 18 94.4 88.9 5.6 0.0 5.6 5.6 26249 10 18 94.4 94.4 0.0 0.0 0.0 5.6 18496 13 17 100.0 100.0 0.0 0.0 0.0 0.0 21787 NR 15 100.0 100.0 0.0 0.0 0.0 0.0 15310 NR 17 100.0 100.0 0.0 0.0 0.0 0.0 26247 NR 21 81.0 81.0 0.0 0.0 0.0 19.0 15307 NR 17 100.0 100.0 0.0 0.0 0.0 0.0
Aggregate 123 95.1 94.3 0.8 0.0 0.8 4.9
Spring
20370 9 53 100.0 100.0 0.0 0.0 0.0 0.0 20449 11 48 100.0 100.0 0.0 0.0 0.0 0.0 12466 14 46 100.0 100.0 0.0 0.0 0.0 0.0 30654 NR 52 100.0 94.2 5.8 3.8 1.9 0.0 20426 NR 48 100.0 100.0 0.0 0.0 0.0 0.0 22020 NR 48 100.0 95.8 4.2 0.0 4.2 0.0 21787 NR 55 100.0 100.0 0.0 0.0 0.0 0.0
Aggregate 350 100.0 98.6 1.4 0.6 0.9 0.0 Aggregate
Across Administrations
473 97.6 96.5 1.1 0.3 0.9 2.5
Note. NR = not released.
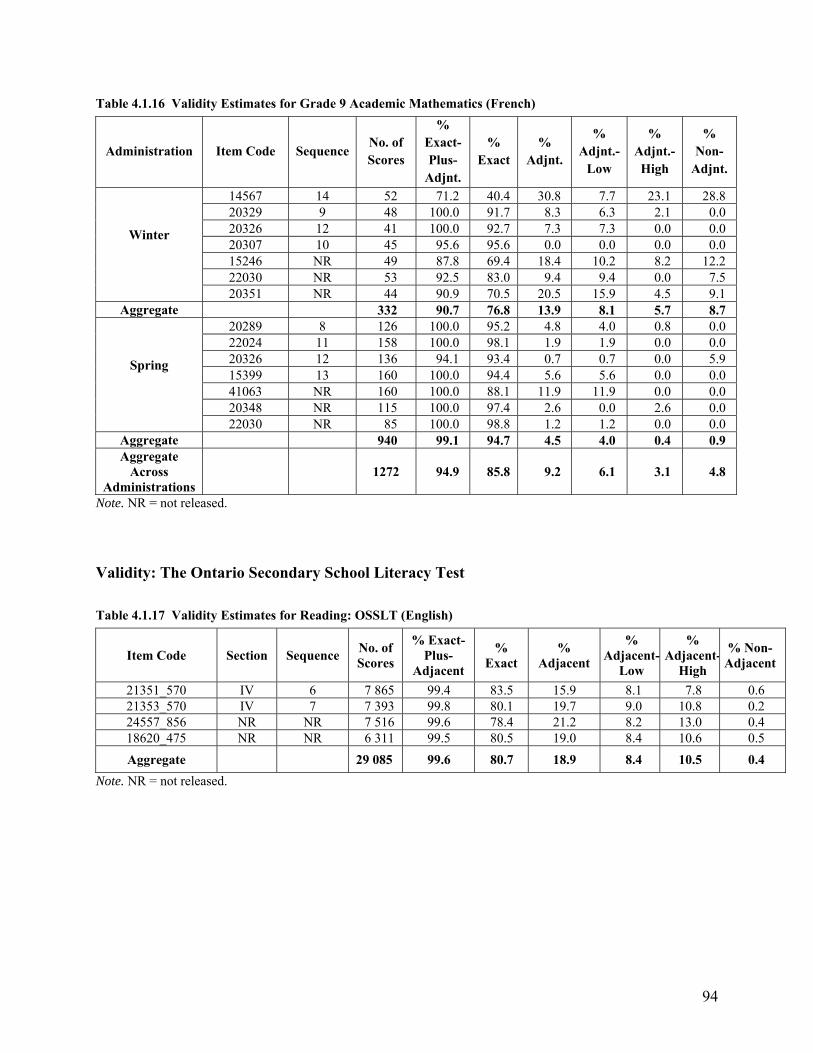
94
Table 4.1.16 Validity Estimates for Grade 9 Academic Mathematics (French)
Administration Item Code Sequence No. of Scores
% Exact- Plus-
Adjnt.
% Exact
% Adjnt.
% Adjnt.-
Low
% Adjnt.- High
% Non-
Adjnt.
Winter
14567 14 52 71.2 40.4 30.8 7.7 23.1 28.8 20329 9 48 100.0 91.7 8.3 6.3 2.1 0.0 20326 12 41 100.0 92.7 7.3 7.3 0.0 0.0 20307 10 45 95.6 95.6 0.0 0.0 0.0 0.0 15246 NR 49 87.8 69.4 18.4 10.2 8.2 12.2 22030 NR 53 92.5 83.0 9.4 9.4 0.0 7.5 20351 NR 44 90.9 70.5 20.5 15.9 4.5 9.1
Aggregate 332 90.7 76.8 13.9 8.1 5.7 8.7
Spring
20289 8 126 100.0 95.2 4.8 4.0 0.8 0.0 22024 11 158 100.0 98.1 1.9 1.9 0.0 0.0 20326 12 136 94.1 93.4 0.7 0.7 0.0 5.9 15399 13 160 100.0 94.4 5.6 5.6 0.0 0.0 41063 NR 160 100.0 88.1 11.9 11.9 0.0 0.0 20348 NR 115 100.0 97.4 2.6 0.0 2.6 0.0 22030 NR 85 100.0 98.8 1.2 1.2 0.0 0.0
Aggregate 940 99.1 94.7 4.5 4.0 0.4 0.9 Aggregate
Across Administrations
1272 94.9 85.8 9.2 6.1 3.1 4.8
Note. NR = not released.
Validity: The Ontario Secondary School Literacy Test
Table 4.1.17 Validity Estimates for Reading: OSSLT (English)
Item Code Section Sequence No. of Scores
% Exact-Plus-
Adjacent
% Exact
% Adjacent
% Adjacent-
Low
% Adjacent-
High
% Non-Adjacent
21351_570 IV 6 7 865 99.4 83.5 15.9 8.1 7.8 0.6 21353_570 IV 7 7 393 99.8 80.1 19.7 9.0 10.8 0.2 24557_856 NR NR 7 516 99.6 78.4 21.2 8.2 13.0 0.4 18620_475 NR NR 6 311 99.5 80.5 19.0 8.4 10.6 0.5
Aggregate 29 085 99.6 80.7 18.9 8.4 10.5 0.4
Note. NR = not released.
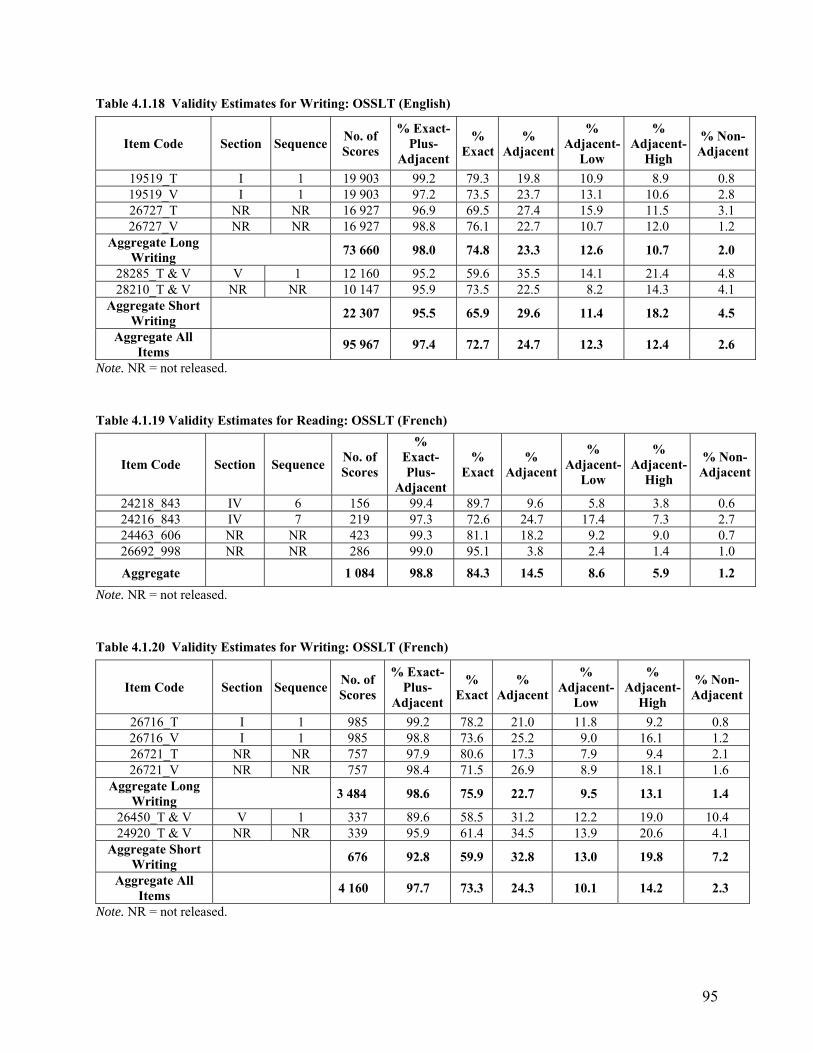
95
Table 4.1.18 Validity Estimates for Writing: OSSLT (English)
Item Code Section SequenceNo. of Scores
% Exact-Plus-
Adjacent
% Exact
% Adjacent
% Adjacent-
Low
% Adjacent-
High
% Non-Adjacent
19519_T I 1 19 903 99.2 79.3 19.8 10.9 8.9 0.8 19519_V I 1 19 903 97.2 73.5 23.7 13.1 10.6 2.8 26727_T NR NR 16 927 96.9 69.5 27.4 15.9 11.5 3.1 26727_V NR NR 16 927 98.8 76.1 22.7 10.7 12.0 1.2
Aggregate Long Writing
73 660 98.0 74.8 23.3 12.6 10.7 2.0
28285_T & V V 1 12 160 95.2 59.6 35.5 14.1 21.4 4.8 28210_T & V NR NR 10 147 95.9 73.5 22.5 8.2 14.3 4.1
Aggregate Short Writing
22 307 95.5 65.9 29.6 11.4 18.2 4.5
Aggregate All Items
95 967 97.4 72.7 24.7 12.3 12.4 2.6
Note. NR = not released.
Table 4.1.19 Validity Estimates for Reading: OSSLT (French)
Item Code Section Sequence No. of Scores
% Exact-Plus-
Adjacent
% Exact
% Adjacent
% Adjacent-
Low
% Adjacent-
High
% Non-Adjacent
24218_843 IV 6 156 99.4 89.7 9.6 5.8 3.8 0.6 24216_843 IV 7 219 97.3 72.6 24.7 17.4 7.3 2.7 24463_606 NR NR 423 99.3 81.1 18.2 9.2 9.0 0.7 26692_998 NR NR 286 99.0 95.1 3.8 2.4 1.4 1.0
Aggregate 1 084 98.8 84.3 14.5 8.6 5.9 1.2
Note. NR = not released.
Table 4.1.20 Validity Estimates for Writing: OSSLT (French)
Item Code Section SequenceNo. of Scores
% Exact-Plus-
Adjacent
% Exact
% Adjacent
% Adjacent-
Low
% Adjacent-
High
% Non-Adjacent
26716_T I 1 985 99.2 78.2 21.0 11.8 9.2 0.8 26716_V I 1 985 98.8 73.6 25.2 9.0 16.1 1.2 26721_T NR NR 757 97.9 80.6 17.3 7.9 9.4 2.1 26721_V NR NR 757 98.4 71.5 26.9 8.9 18.1 1.6
Aggregate Long Writing
3 484 98.6 75.9 22.7 9.5 13.1 1.4
26450_T & V V 1 337 89.6 58.5 31.2 12.2 19.0 10.4 24920_T & V NR NR 339 95.9 61.4 34.5 13.9 20.6 4.1
Aggregate Short Writing
676 92.8 59.9 32.8 13.0 19.8 7.2
Aggregate All Items
4 160 97.7 73.3 24.3 10.1 14.2 2.3
Note. NR = not released.
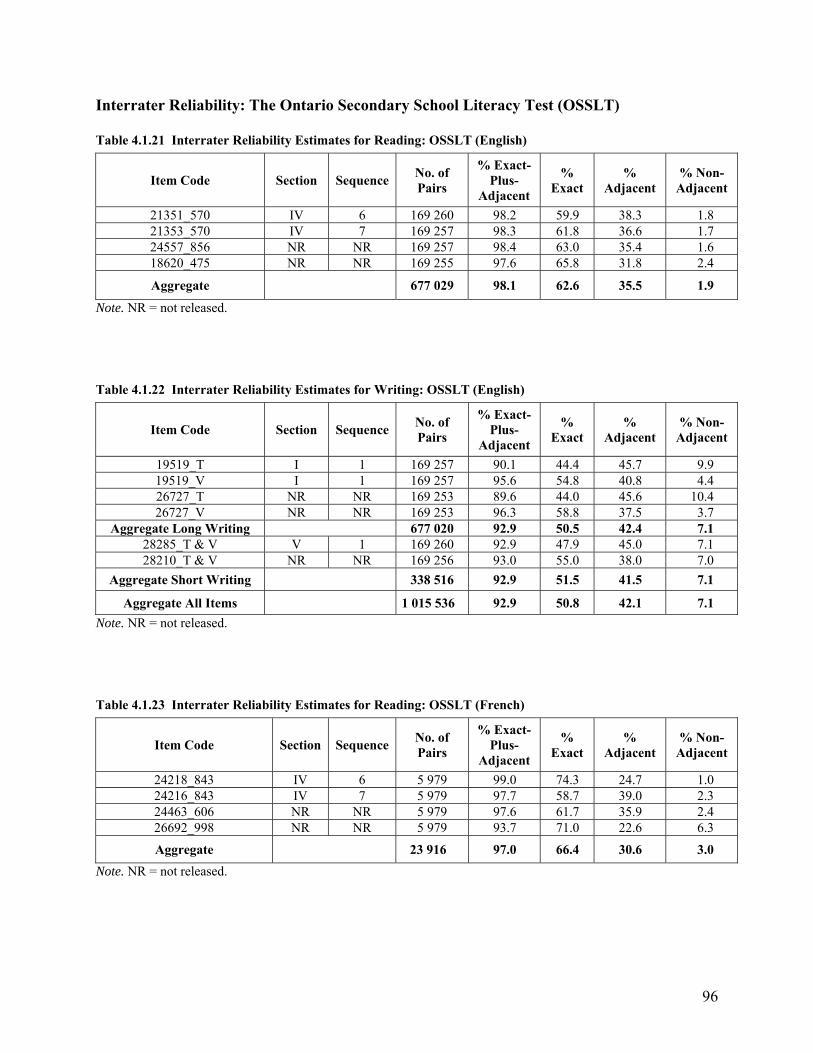
96
Interrater Reliability: The Ontario Secondary School Literacy Test (OSSLT) Table 4.1.21 Interrater Reliability Estimates for Reading: OSSLT (English)
Item Code Section Sequence No. of Pairs
% Exact-Plus-
Adjacent
% Exact
% Adjacent
% Non-Adjacent
21351_570 IV 6 169 260 98.2 59.9 38.3 1.8 21353_570 IV 7 169 257 98.3 61.8 36.6 1.7 24557_856 NR NR 169 257 98.4 63.0 35.4 1.6 18620_475 NR NR 169 255 97.6 65.8 31.8 2.4
Aggregate 677 029 98.1 62.6 35.5 1.9
Note. NR = not released.
Table 4.1.22 Interrater Reliability Estimates for Writing: OSSLT (English)
Item Code Section Sequence No. of Pairs
% Exact-Plus-
Adjacent
% Exact
% Adjacent
% Non-Adjacent
19519_T I 1 169 257 90.1 44.4 45.7 9.9 19519_V I 1 169 257 95.6 54.8 40.8 4.4 26727_T NR NR 169 253 89.6 44.0 45.6 10.4 26727_V NR NR 169 253 96.3 58.8 37.5 3.7
Aggregate Long Writing 677 020 92.9 50.5 42.4 7.1 28285_T & V V 1 169 260 92.9 47.9 45.0 7.1 28210_T & V NR NR 169 256 93.0 55.0 38.0 7.0
Aggregate Short Writing 338 516 92.9 51.5 41.5 7.1
Aggregate All Items 1 015 536 92.9 50.8 42.1 7.1
Note. NR = not released.
Table 4.1.23 Interrater Reliability Estimates for Reading: OSSLT (French)
Item Code Section Sequence No. of Pairs
% Exact-Plus-
Adjacent
% Exact
% Adjacent
% Non-Adjacent
24218_843 IV 6 5 979 99.0 74.3 24.7 1.0 24216_843 IV 7 5 979 97.7 58.7 39.0 2.3 24463_606 NR NR 5 979 97.6 61.7 35.9 2.4 26692_998 NR NR 5 979 93.7 71.0 22.6 6.3
Aggregate 23 916 97.0 66.4 30.6 3.0
Note. NR = not released.
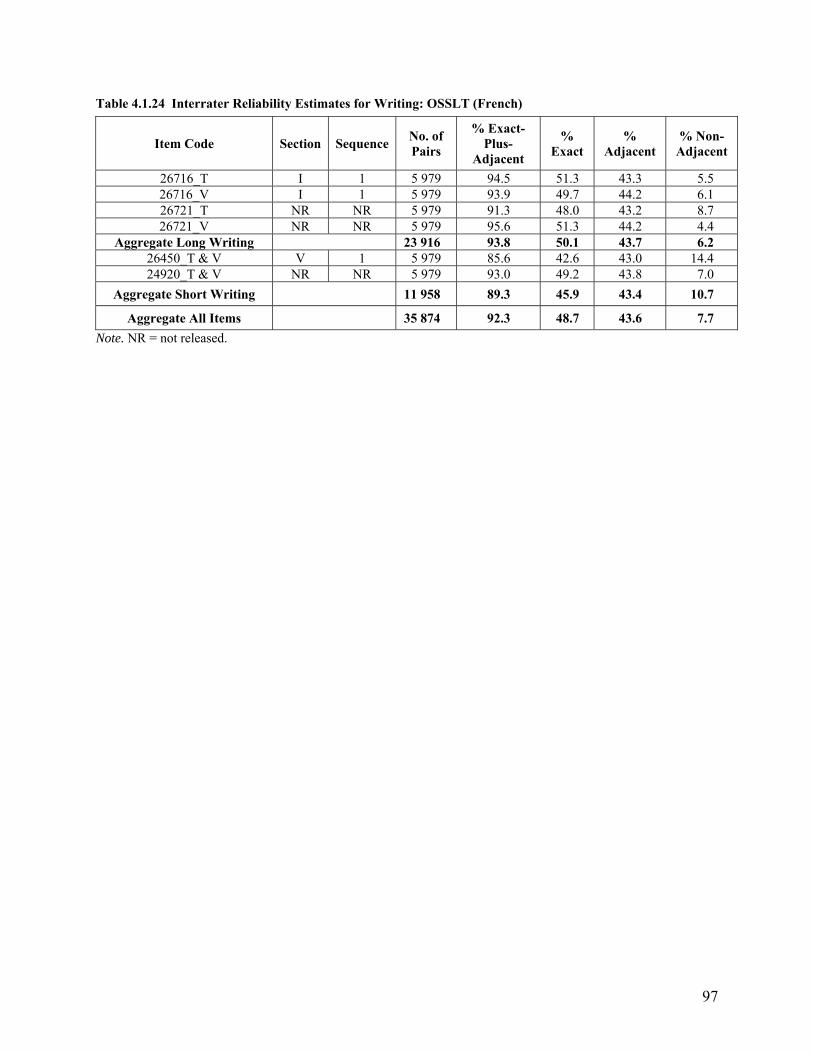
97
Table 4.1.24 Interrater Reliability Estimates for Writing: OSSLT (French)
Item Code Section Sequence No. of Pairs
% Exact-Plus-
Adjacent
% Exact
% Adjacent
% Non- Adjacent
26716_T I 1 5 979 94.5 51.3 43.3 5.5 26716_V I 1 5 979 93.9 49.7 44.2 6.1 26721_T NR NR 5 979 91.3 48.0 43.2 8.7 26721_V NR NR 5 979 95.6 51.3 44.2 4.4
Aggregate Long Writing 23 916 93.8 50.1 43.7 6.2 26450_T & V V 1 5 979 85.6 42.6 43.0 14.4 24920_T & V NR NR 5 979 93.0 49.2 43.8 7.0
Aggregate Short Writing 11 958 89.3 45.9 43.4 10.7
Aggregate All Items 35 874 92.3 48.7 43.6 7.7
Note. NR = not released.
98
APPENDIX 7.1: SCORE DISTRIBUTIONS AND ITEM STATISTICS This appendix presents the classical item statistics and IRT item parameter estimates for the operational items and the DIF statistics for individual items with respect to gender and students who are second-language learners (SLLs). For the French-language versions of the Grade 9 Assessment of Mathematics and the OSSLT, DIF analysis for SLLs was not conducted, due to the small number of students in the French-language SLL population. Classical item statistics and IRT item parameter estimates are combined into tables for each assessment: Tables 7.1.1–7.1.24 for the primary- and junior-division assessments, Tables 7.1.49–7.1.64 for the Grade 9 Assessment of Mathematics and Tables 7.1.77–7.1.82 for the OSSLT. The distribution of score points and the item-category difficulty estimates are also provided for open-response items. Note that the IRT model that was fit to EQAO open-response item data is the generalized partial credit model, so the step parameter estimates from PARSCALE calibration are intersection points of adjacent item-category response curves; for students with a theta value smaller than the intersection point of category 1 and category 2, for example, it is more likely that they will achieve score category 1, and vice versa. In order to convey the difficulties of various item categories (as in the graded response model), the step parameter estimates were transformed, by first obtaining the cumulative item-category response functions and then through each of these functions, locating the value on the theta scale that corresponds to a probability of 0.5. In this document, the resulting estimates are called item-category-difficulty parameter estimates. DIF statistics for individual items are shown in Tables 7.1.25a–7.1.48b for the primary- and junior-division assessments, Tables 7.1.65a–7.1.76b for the Grade 9 Assessment of Mathematics and Tables 7.1.83a–7.1.85b for the OSSLT.
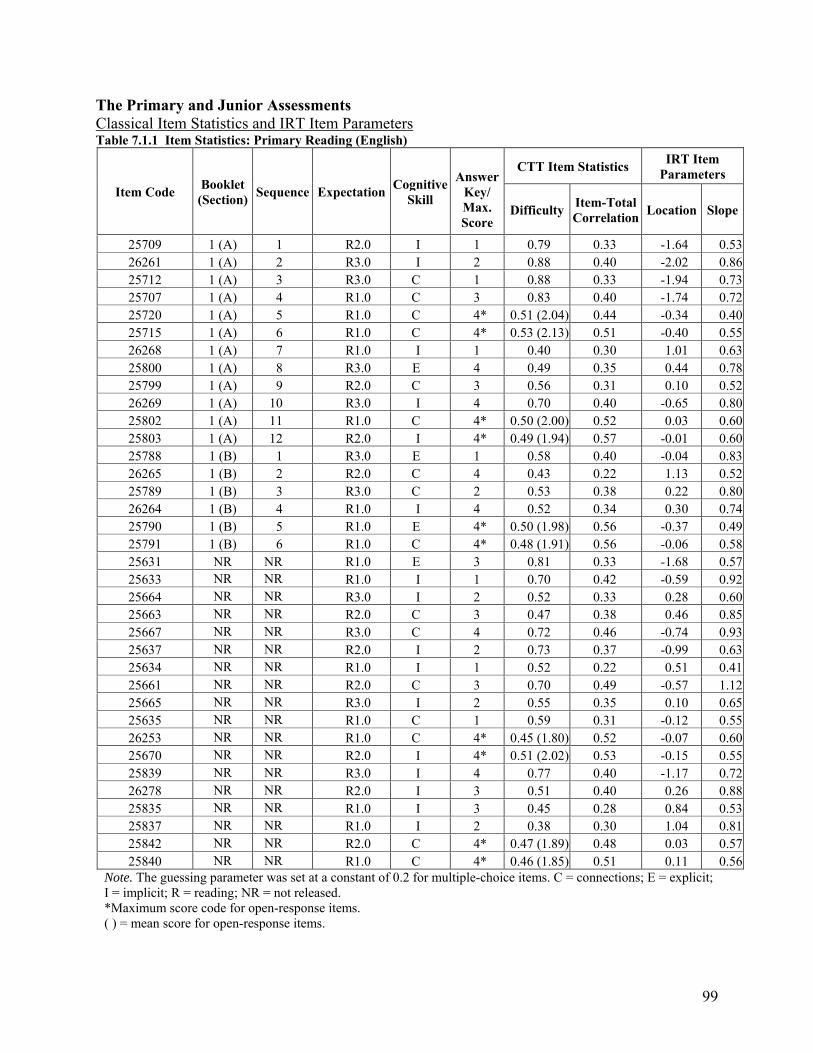
99
The Primary and Junior Assessments Classical Item Statistics and IRT Item Parameters Table 7.1.1 Item Statistics: Primary Reading (English)
Item Code Booklet (Section)
Sequence ExpectationCognitive
Skill
Answer
Key/ Max. Score
CTT Item Statistics IRT Item
Parameters
DifficultyItem-Total Correlation
Location Slope
25709 1 (A) 1 R2.0 I 1 0.79 0.33 -1.64 0.5326261 1 (A) 2 R3.0 I 2 0.88 0.40 -2.02 0.8625712 1 (A) 3 R3.0 C 1 0.88 0.33 -1.94 0.7325707 1 (A) 4 R1.0 C 3 0.83 0.40 -1.74 0.7225720 1 (A) 5 R1.0 C 4* 0.51 (2.04) 0.44 -0.34 0.4025715 1 (A) 6 R1.0 C 4* 0.53 (2.13) 0.51 -0.40 0.5526268 1 (A) 7 R1.0 I 1 0.40 0.30 1.01 0.6325800 1 (A) 8 R3.0 E 4 0.49 0.35 0.44 0.7825799 1 (A) 9 R2.0 C 3 0.56 0.31 0.10 0.5226269 1 (A) 10 R3.0 I 4 0.70 0.40 -0.65 0.8025802 1 (A) 11 R1.0 C 4* 0.50 (2.00) 0.52 0.03 0.6025803 1 (A) 12 R2.0 I 4* 0.49 (1.94) 0.57 -0.01 0.6025788 1 (B) 1 R3.0 E 1 0.58 0.40 -0.04 0.8326265 1 (B) 2 R2.0 C 4 0.43 0.22 1.13 0.5225789 1 (B) 3 R3.0 C 2 0.53 0.38 0.22 0.8026264 1 (B) 4 R1.0 I 4 0.52 0.34 0.30 0.7425790 1 (B) 5 R1.0 E 4* 0.50 (1.98) 0.56 -0.37 0.4925791 1 (B) 6 R1.0 C 4* 0.48 (1.91) 0.56 -0.06 0.5825631 NR NR R1.0 E 3 0.81 0.33 -1.68 0.5725633 NR NR R1.0 I 1 0.70 0.42 -0.59 0.9225664 NR NR R3.0 I 2 0.52 0.33 0.28 0.6025663 NR NR R2.0 C 3 0.47 0.38 0.46 0.8525667 NR NR R3.0 C 4 0.72 0.46 -0.74 0.9325637 NR NR R2.0 I 2 0.73 0.37 -0.99 0.6325634 NR NR R1.0 I 1 0.52 0.22 0.51 0.4125661 NR NR R2.0 C 3 0.70 0.49 -0.57 1.1225665 NR NR R3.0 I 2 0.55 0.35 0.10 0.6525635 NR NR R1.0 C 1 0.59 0.31 -0.12 0.5526253 NR NR R1.0 C 4* 0.45 (1.80) 0.52 -0.07 0.6025670 NR NR R2.0 I 4* 0.51 (2.02) 0.53 -0.15 0.5525839 NR NR R3.0 I 4 0.77 0.40 -1.17 0.7226278 NR NR R2.0 I 3 0.51 0.40 0.26 0.8825835 NR NR R1.0 I 3 0.45 0.28 0.84 0.5325837 NR NR R1.0 I 2 0.38 0.30 1.04 0.8125842 NR NR R2.0 C 4* 0.47 (1.89) 0.48 0.03 0.5725840 NR NR R1.0 C 4* 0.46 (1.85) 0.51 0.11 0.56
Note. The guessing parameter was set at a constant of 0.2 for multiple-choice items. C = connections; E = explicit; I = implicit; R = reading; NR = not released. *Maximum score code for open-response items. ( ) = mean score for open-response items.
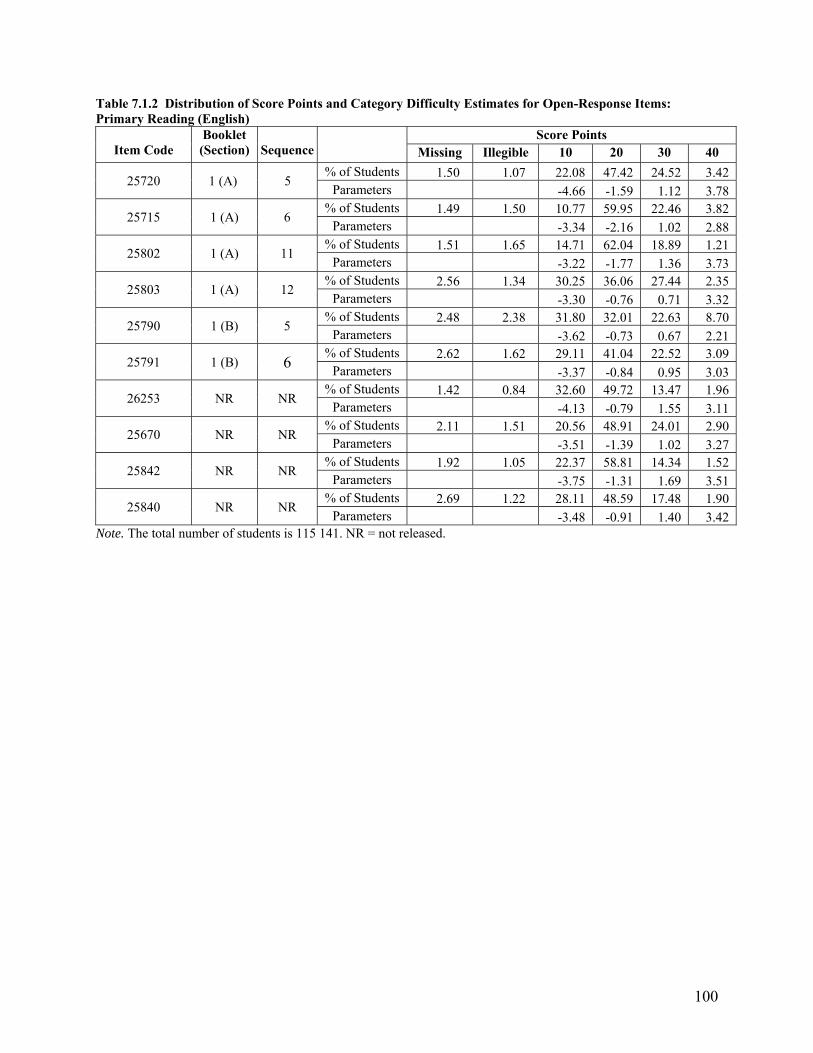
100
Table 7.1.2 Distribution of Score Points and Category Difficulty Estimates for Open-Response Items: Primary Reading (English)
Item Code
Booklet (Section)
Sequence
Score Points Missing Illegible 10 20 30 40
25720 1 (A) 5 % of Students 1.50 1.07 22.08 47.42 24.52 3.42
Parameters -4.66 -1.59 1.12 3.78
25715 1 (A) 6 % of Students 1.49 1.50 10.77 59.95 22.46 3.82
Parameters -3.34 -2.16 1.02 2.88
25802 1 (A) 11 % of Students 1.51 1.65 14.71 62.04 18.89 1.21
Parameters -3.22 -1.77 1.36 3.73
25803 1 (A) 12 % of Students 2.56 1.34 30.25 36.06 27.44 2.35
Parameters -3.30 -0.76 0.71 3.32
25790 1 (B) 5 % of Students 2.48 2.38 31.80 32.01 22.63 8.70
Parameters -3.62 -0.73 0.67 2.21
25791 1 (B) 6 % of Students 2.62 1.62 29.11 41.04 22.52 3.09
Parameters -3.37 -0.84 0.95 3.03
26253 NR NR % of Students 1.42 0.84 32.60 49.72 13.47 1.96
Parameters -4.13 -0.79 1.55 3.11
25670 NR NR % of Students 2.11 1.51 20.56 48.91 24.01 2.90
Parameters -3.51 -1.39 1.02 3.27
25842 NR NR % of Students 1.92 1.05 22.37 58.81 14.34 1.52
Parameters -3.75 -1.31 1.69 3.51
25840 NR NR % of Students 2.69 1.22 28.11 48.59 17.48 1.90
Parameters -3.48 -0.91 1.40 3.42 Note. The total number of students is 115 141. NR = not released.
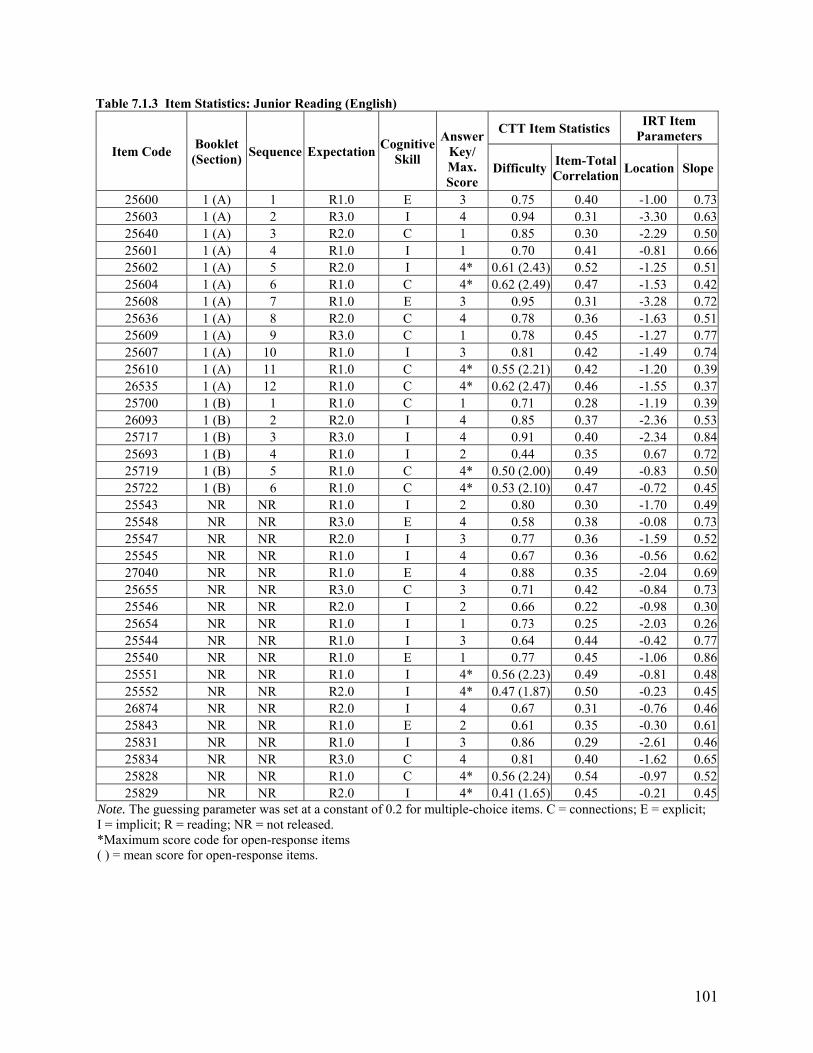
101
Table 7.1.3 Item Statistics: Junior Reading (English)
Item Code Booklet
(Section) Sequence Expectation
Cognitive Skill
Answer
Key/ Max. Score
CTT Item Statistics IRT Item
Parameters
DifficultyItem-Total Correlation
Location Slope
25600 1 (A) 1 R1.0 E 3 0.75 0.40 -1.00 0.7325603 1 (A) 2 R3.0 I 4 0.94 0.31 -3.30 0.6325640 1 (A) 3 R2.0 C 1 0.85 0.30 -2.29 0.5025601 1 (A) 4 R1.0 I 1 0.70 0.41 -0.81 0.6625602 1 (A) 5 R2.0 I 4* 0.61 (2.43) 0.52 -1.25 0.5125604 1 (A) 6 R1.0 C 4* 0.62 (2.49) 0.47 -1.53 0.4225608 1 (A) 7 R1.0 E 3 0.95 0.31 -3.28 0.7225636 1 (A) 8 R2.0 C 4 0.78 0.36 -1.63 0.5125609 1 (A) 9 R3.0 C 1 0.78 0.45 -1.27 0.7725607 1 (A) 10 R1.0 I 3 0.81 0.42 -1.49 0.7425610 1 (A) 11 R1.0 C 4* 0.55 (2.21) 0.42 -1.20 0.3926535 1 (A) 12 R1.0 C 4* 0.62 (2.47) 0.46 -1.55 0.3725700 1 (B) 1 R1.0 C 1 0.71 0.28 -1.19 0.3926093 1 (B) 2 R2.0 I 4 0.85 0.37 -2.36 0.5325717 1 (B) 3 R3.0 I 4 0.91 0.40 -2.34 0.8425693 1 (B) 4 R1.0 I 2 0.44 0.35 0.67 0.7225719 1 (B) 5 R1.0 C 4* 0.50 (2.00) 0.49 -0.83 0.5025722 1 (B) 6 R1.0 C 4* 0.53 (2.10) 0.47 -0.72 0.4525543 NR NR R1.0 I 2 0.80 0.30 -1.70 0.4925548 NR NR R3.0 E 4 0.58 0.38 -0.08 0.7325547 NR NR R2.0 I 3 0.77 0.36 -1.59 0.5225545 NR NR R1.0 I 4 0.67 0.36 -0.56 0.6227040 NR NR R1.0 E 4 0.88 0.35 -2.04 0.6925655 NR NR R3.0 C 3 0.71 0.42 -0.84 0.7325546 NR NR R2.0 I 2 0.66 0.22 -0.98 0.3025654 NR NR R1.0 I 1 0.73 0.25 -2.03 0.2625544 NR NR R1.0 I 3 0.64 0.44 -0.42 0.7725540 NR NR R1.0 E 1 0.77 0.45 -1.06 0.8625551 NR NR R1.0 I 4* 0.56 (2.23) 0.49 -0.81 0.4825552 NR NR R2.0 I 4* 0.47 (1.87) 0.50 -0.23 0.4526874 NR NR R2.0 I 4 0.67 0.31 -0.76 0.4625843 NR NR R1.0 E 2 0.61 0.35 -0.30 0.6125831 NR NR R1.0 I 3 0.86 0.29 -2.61 0.4625834 NR NR R3.0 C 4 0.81 0.40 -1.62 0.6525828 NR NR R1.0 C 4* 0.56 (2.24) 0.54 -0.97 0.5225829 NR NR R2.0 I 4* 0.41 (1.65) 0.45 -0.21 0.45
Note. The guessing parameter was set at a constant of 0.2 for multiple-choice items. C = connections; E = explicit; I = implicit; R = reading; NR = not released. *Maximum score code for open-response items ( ) = mean score for open-response items.

102
Table 7.1.4 Distribution of Score Points and Category Difficulty Estimates for Open-Response Items: Junior Reading (English)
Item Code
Booklet (Section)
Sequence
Score Points Missing Illegible 10 20 30 40
25602 1 (A) 5 % of Students 0.61 0.17 9.51 41.49 41.92 6.30
Parameters -5.00 -2.68 -0.14 2.82
25604 1 (A) 6 % of Students 0.70 0.24 8.13 41.30 40.53 9.09
Parameters -5.48 -3.15 -0.21 2.72
25610 1 (A) 11 % of Students 0.55 0.13 16.80 48.43 29.40 4.69
Parameters -6.75 -2.35 0.71 3.59
26535 1 (A) 12 % of Students 0.96 0.16 12.77 36.93 36.67 12.50
Parameters -5.82 -2.63 -0.14 2.40
25719 1 (B) 5 % of Students 0.60 0.22 23.64 54.26 17.51 3.78
Parameters -5.87 -1.65 1.29 2.92
25722 1 (B) 6 % of Students 1.31 0.31 23.08 45.18 24.28 5.83
Parameters -5.10 -1.52 0.85 2.90
25551 NR NR % of Students 0.80 0.26 13.00 50.88 32.08 2.98
Parameters -5.09 -2.47 0.60 3.73
25552 NR NR % of Students 1.93 0.64 36.38 34.96 23.19 2.90
Parameters -4.85 -0.69 0.99 3.63
25828 NR NR % of Students 1.05 0.29 20.07 39.24 31.77 7.58
Parameters -5.00 -1.59 0.28 2.43
25829 NR NR % of Students 1.55 0.54 48.00 35.10 12.18 2.63
Parameters -5.67 -0.15 1.68 3.32 Note. The total number of students is 120 530. NR = not released.
103
Table 7.1.5 Item Statistics: Primary Reading (French)
Item Code Booklet (Section)
Sequence ExpectationCognitive
Skill
Answer
Key/ Max. Score
CTT Item Statistics IRT Item
Parameters
DifficultyItem-Total Correlation
Location Slope
22728 1 (A) 1 C I 1 0.78 0.36 -1.26 0.6522638 1 (A) 2 B I 4 0.75 0.32 -1.08 0.5823767 1 (A) 3 C L 1 0.84 0.32 -2.23 0.4822637 1 (A) 4 A L 2 0.69 0.34 -0.73 0.5622730 1 (A) 5 A L 4* 0.59 (2.34) 0.54 -0.95 0.4722731 1 (A) 6 A L 4* 0.52 (2.08) 0.48 -0.46 0.6122757 1 (A) 7 B L 4 0.66 0.36 -0.49 0.6322761 1 (A) 8 C I 2 0.81 0.44 -1.09 1.0522759 1 (A) 9 C E 1 0.70 0.35 -0.75 0.5922756 1 (A) 10 A I 3 0.60 0.36 -0.12 0.7222762 1 (A) 11 A I 4* 0.47 (1.89) 0.44 -0.56 0.3822764 1 (A) 12 A L 4* 0.49 (1.97) 0.47 -0.04 0.5525461 1 (B) 1 B L 2 0.71 0.32 -0.91 0.5225463 1 (B) 2 C E 4 0.67 0.38 -0.49 0.7025459 1 (B) 3 A I 3 0.52 0.33 0.30 0.6925464 1 (B) 4 C L 4 0.39 0.22 1.40 0.5225465 1 (B) 5 A I 4* 0.46 (1.83) 0.54 -0.08 0.5425466 1 (B) 6 A L 4* 0.45 (1.79) 0.48 0.14 0.4825430 NR NR B I 1 0.48 0.27 0.67 0.5225437 NR NR C L 3 0.62 0.35 -0.32 0.5725436 NR NR C I 3 0.59 0.42 -0.10 0.8725433 NR NR C I 4 0.56 0.44 0.09 0.9525426 NR NR A E 2 0.68 0.48 -0.43 1.0725435 NR NR C I 4 0.72 0.38 -0.77 0.6925432 NR NR C L 4 0.70 0.48 -0.63 1.0025428 NR NR A I 1 0.69 0.44 -0.65 0.8026455 NR NR B L 2 0.72 0.37 -0.90 0.6425441 NR NR C L 2 0.61 0.24 -0.16 0.4125443 NR NR A I 4* 0.51 (2.02) 0.50 -0.61 0.6225444 NR NR A L 4* 0.49 (1.95) 0.53 -0.47 0.6125531 NR NR B I 2 0.78 0.46 -1.03 0.9425529 NR NR A I 1 0.81 0.40 -1.35 0.7925530 NR NR A I 4 0.76 0.46 -0.82 1.0525532 NR NR C I 3 0.54 0.48 0.13 1.2225533 NR NR A I 4* 0.55 (2.19) 0.50 -0.72 0.5625534 NR NR B L 4* 0.51 (2.03) 0.40 -0.14 0.43
Note. The guessing parameter was set at a constant of 0.2 for multiple-choice items. A = comprehension; B = organization; C = vocabulary and linguistic conventions; L = connections; E = explicit; I = implicit; NR = not released. *Maximum score code for open-response items ( ) = mean score for open-response items.

104
Table 7.1.6 Distribution of Score Points and Category Difficulty Estimates for Open-Response Items: Primary Reading (French)
Item Code
Booklet (Section)
Sequence
Score Points Missing Illegible 10 20 30 40
22730 1 (A) 5 % of Students 0.54 1.19 15.86 41.59 28.50 12.33
Parameters -4.15 -1.91 0.31 1.98
22731 1 (A) 6 % of Students 0.74 0.40 10.53 70.48 14.93 2.92
Parameters -3.82 -2.35 1.49 2.84
22762 1 (A) 11 % of Students 0.94 0.43 34.25 42.28 17.77 4.34
Parameters -6.13 -0.91 1.44 3.37
22764 1 (A) 12 % of Students 1.13 1.29 16.21 65.43 14.09 1.85
Parameters -3.57 -1.80 1.77 3.45
25465 1 (B) 5 % of Students 0.73 2.14 37.93 35.88 20.10 3.22
Parameters -4.02 -0.47 1.08 3.09
25466 1 (B) 6 % of Students 0.94 1.68 36.71 40.94 18.28 1.46
Parameters -4.45 -0.57 1.46 4.12
25443 NR NR % of Students 0.44 0.38 17.35 65.13 12.33 4.38
Parameters -4.56 -1.72 1.46 2.40
25444 NR NR % of Students 0.64 0.30 26.14 53.05 16.45 3.40
Parameters -4.70 -1.22 1.30 2.76
25533 NR NR % of Students 0.46 0.50 11.42 59.50 23.75 4.38
Parameters -4.30 -2.33 0.95 2.80
25534 NR NR % of Students 1.08 1.05 12.82 66.37 16.96 1.73
Parameters -4.25 -2.41 1.89 4.22 Note. The total number of students is 8230. NR = not released.
105
Table 7.1.7 Item Statistics: Junior Reading (French)
Item Code Booklet (Section)
Sequence ExpectationCognitive
Skill
Answer
Key/ Max. Score
CTT Item Statistics IRT Item
Parameters
DifficultyItem-Total Correlation
Location Slope
26036 1 (A) 1 A I 3 0.46 0.32 0.61 0.6126039 1 (A) 2 C I 1 0.79 0.37 -1.35 0.6626038 1 (A) 3 C I 3 0.75 0.37 -1.11 0.6326037 1 (A) 4 B L 2 0.62 0.35 -0.35 0.5926034 1 (A) 5 A I 4* 0.58 (2.32) 0.36 -1.46 0.4226035 1 (A) 6 A L 4* 0.52 (2.08) 0.46 -0.71 0.5026025 1 (A) 7 A I 2 0.69 0.39 -0.72 0.6726024 1 (A) 8 A E 1 0.92 0.28 -2.75 0.6226028 1 (A) 9 C L 3 0.59 0.29 -0.15 0.4726026 1 (A) 10 B L 2 0.54 0.18 0.48 0.2226023 1 (A) 11 A L 4* 0.42 (1.69) 0.44 -0.01 0.4826022 1 (A) 12 A L 4* 0.46 (1.85) 0.31 -0.93 0.2626054 1 (B) 1 A E 1 0.95 0.30 -2.72 0.8726057 1 (B) 2 B I 2 0.78 0.17 -2.82 0.2226058 1 (B) 3 C I 3 0.73 0.38 -0.86 0.7226055 1 (B) 4 A I 1 0.69 0.33 -0.74 0.5326052 1 (B) 5 A I 4* 0.68 (2.70) 0.52 -1.56 0.7526053 1 (B) 6 A L 4* 0.68 (2.72) 0.37 -1.90 0.3625959 NR NR A E 3 0.87 0.36 -1.87 0.7525965 NR NR B I 4 0.92 0.32 -2.75 0.6525967 NR NR C I 1 0.54 0.21 0.39 0.3325964 NR NR A I 2 0.66 0.37 -0.54 0.7125960 NR NR A E 4 0.91 0.41 -1.72 1.3125961 NR NR A I 2 0.71 0.47 -0.65 1.0726469 NR NR C I 3 0.79 0.36 -1.37 0.6625963 NR NR A I 4 0.61 0.34 -0.23 0.5425966 NR NR C L 4 0.56 0.32 0.07 0.5125962 NR NR A I 2 0.74 0.48 -0.83 1.0725958 NR NR A I 4* 0.52 (2.06) 0.56 -0.59 0.6525957 NR NR A L 4* 0.50 (2.01) 0.48 -0.48 0.5126031 NR NR A I 4 0.83 0.43 -1.47 0.8926033 NR NR C L 2 0.33 0.27 1.31 0.8526030 NR NR A L 1 0.50 0.29 0.49 0.5626032 NR NR B I 4 0.82 0.48 -1.31 1.0426029 NR NR B L 4* 0.50 (2.00) 0.42 -0.58 0.4226027 NR NR A I 4* 0.48 (1.91) 0.39 -0.82 0.33
Note. The guessing parameter was set at a constant of 0.2 for multiple-choice items. A = comprehension; B = organization; C = vocabulary and linguistic conventions; L = connections; E = explicit; I = implicit; NR = not released. *Maximum score code for open-response items. ( ) = mean score for open-response items.
106
Table 7.1.8 Distribution of Score Points and Category Difficulty Estimates for Open-Response Items: Junior Reading (French)
Item Code
Booklet (Section)
Sequence
Score Points Missing Illegible 10 20 30 40
26034 1 (A) 5 % of Students 0.15 0.05 3.45 63.72 29.54 3.09
Parameters -6.18 -4.49 0.89 3.93
26035 1 (A) 6 % of Students 0.37 0.26 17.61 57.77 20.94 3.05
Parameters -5.33 -2.02 1.21 3.30
26023 1 (A) 11 % of Students 0.74 0.52 42.71 43.17 11.64 1.22
Parameters -5.62 -0.43 1.99 4.03
26022 1 (A) 12 % of Students 0.23 0.07 34.37 46.35 18.24 0.73
Parameters -12.68 -1.43 2.46 7.92
26052 1 (B) 5 % of Students 0.12 0.03 3.05 25.73 69.05 2.02
Parameters -5.45 -3.13 -1.10 3.46
26053 1 (B) 6 % of Students 0.25 0.12 3.23 27.50 62.00 6.90
Parameters -6.01 -4.15 -1.43 3.96
25958 NR NR % of Students 0.38 0.60 19.76 54.29 21.93 3.04
Parameters -4.55 -1.67 0.97 2.88
25957 NR NR % of Students 0.44 0.81 20.87 55.86 19.44 2.58
Parameters -4.90 -1.75 1.33 3.39
26029 NR NR % of Students 0.49 0.84 15.50 67.36 13.94 1.87
Parameters -5.82 -2.60 2.06 4.04
26027 NR NR % of Students 0.84 0.30 33.42 43.81 16.50 5.12
Parameters -7.16 -1.11 1.59 3.41 Note. The total number of students is 7288. NR = not released.
107
Table 7.1.9 Item Statistics: Primary Writing (English)
Item Code Booklet (Section)
Sequence ExpectationCognitive
Skill
Answer
Key/ Max. Score
CTT Item Statistics IRT Item
Parameters
DifficultyItem-Total Correlation
Location Slope
25973_T 1(A) 13 W2.0 T 4* 0.52 (2.06) 0.58 -0.26 0.7325973_V 1(A) 13 W3.0 V 3* 0.67 (2.02) 0.59 -1.13 0.92
40335 1(A) 14 W3.0 V 3 0.66 0.42 -0.61 0.8126012 1(A) 15 W2.0 T 2 0.74 0.32 -1.30 0.5126017 1(A) 16 W3.0 V 1 0.47 0.28 0.62 0.5726003 1(A) 17 W1.0 T 2 0.8 0.38 -1.41 0.76
40251_T NR NR W2.0 T 4* 0.57 (2.26) 0.59 -0.48 0.7540251_V NR NR W3.0 V 3* 0.68 (2.05) 0.59 -1.30 0.90
26007 NR NR W2.0 T 2 0.65 0.37 -0.50 0.6326016 NR NR W3.0 V 4 0.66 0.40 -0.50 0.7925993 NR NR W2.0 T 3 0.63 0.33 -0.46 0.5125998 NR NR W2.0 T 2 0.66 0.35 -0.64 0.55
41824_T NR NR W2.0 T 4* 0.57 (2.28) 0.59 -0.80 0.7541824_V NR NR W2.0 V 3* 0.66 (1.99) 0.58 -1.33 0.90
Note. The guessing parameter was set at a constant of 0.2 for multiple-choice items. T = content; V = conventions; W = writing. *Maximum score code for open-response items. ( ) = mean score for open-response items. NR = not released. Table 7.1.10 Distribution of Score Points and Category Difficulty Estimates for Open-Response Items: Primary Writing (English)
Item Code
Booklet (Section)
Sequence
Score Points Missing Illegible 10 20 30 40
25973_T 1(A) 13 % of Students 1.53 1.69 25.69 39.31 25.64 6.15
Parameters -2.88 -0.82 0.57 2.09
25973_V 1(A) 13 % of Students 1.53 0.36 24.66 42.60 30.85
Parameters -3.06 -0.87 0.53
40251_T NR NR % of Students 1.17 2.05 15.81 41.03 31.22 8.71
Parameters -2.63 -1.40 0.29 1.82
40251_V NR NR % of Students 1.17 0.17 27.26 36.69 34.71
Parameters -3.53 -0.73 0.36
41824_T NR NR % of Students 0.90 0.35 19.01 39.89 30.16 9.70
Parameters -3.88 -1.30 0.28 1.70
41824_V NR NR % of Students 0.90 0.20 25.45 46.46 26.98
Parameters -3.82 -0.92 0.75 Note. The total number of students is 115 280. NR = not released.
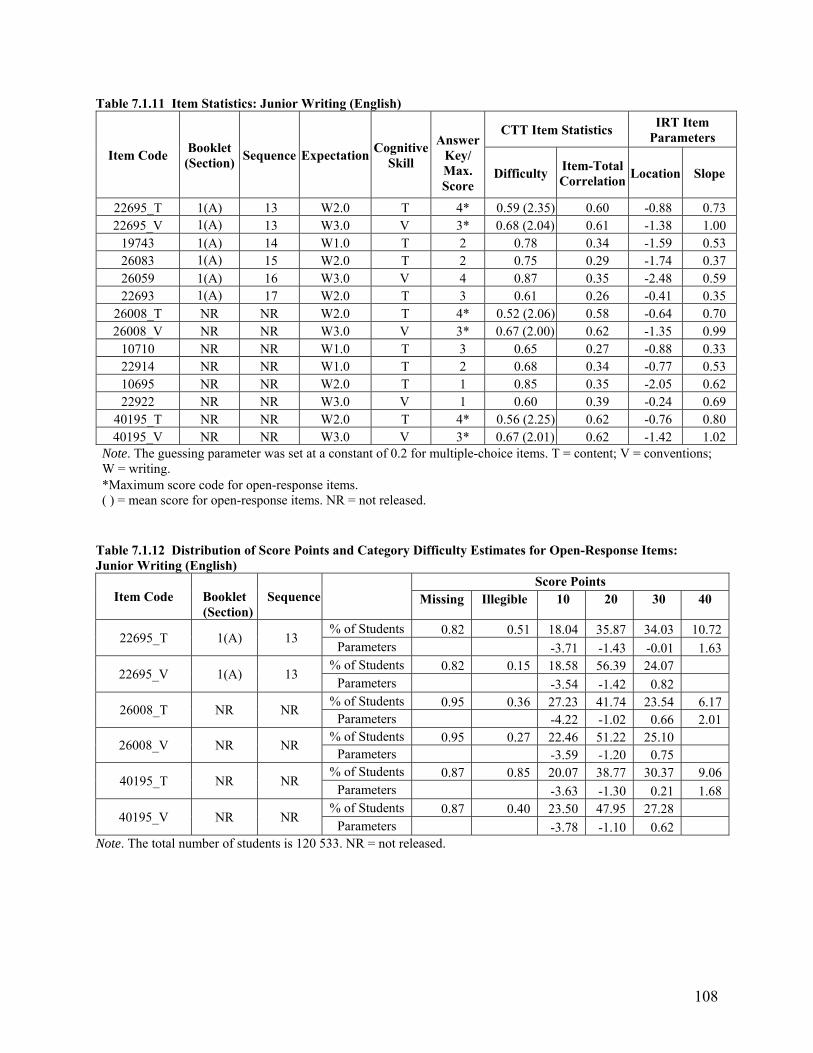
108
Table 7.1.11 Item Statistics: Junior Writing (English)
Item Code Booklet (Section)
Sequence ExpectationCognitive
Skill
Answer
Key/ Max. Score
CTT Item Statistics IRT Item
Parameters
Difficulty Item-Total Correlation
Location Slope
22695_T 1(A) 13 W2.0 T 4* 0.59 (2.35) 0.60 -0.88 0.73 22695_V 1(A) 13 W3.0 V 3* 0.68 (2.04) 0.61 -1.38 1.00
19743 1(A) 14 W1.0 T 2 0.78 0.34 -1.59 0.53 26083 1(A) 15 W2.0 T 2 0.75 0.29 -1.74 0.37 26059 1(A) 16 W3.0 V 4 0.87 0.35 -2.48 0.59 22693 1(A) 17 W2.0 T 3 0.61 0.26 -0.41 0.35
26008_T NR NR W2.0 T 4* 0.52 (2.06) 0.58 -0.64 0.70 26008_V NR NR W3.0 V 3* 0.67 (2.00) 0.62 -1.35 0.99
10710 NR NR W1.0 T 3 0.65 0.27 -0.88 0.33 22914 NR NR W1.0 T 2 0.68 0.34 -0.77 0.53 10695 NR NR W2.0 T 1 0.85 0.35 -2.05 0.62 22922 NR NR W3.0 V 1 0.60 0.39 -0.24 0.69
40195_T NR NR W2.0 T 4* 0.56 (2.25) 0.62 -0.76 0.80 40195_V NR NR W3.0 V 3* 0.67 (2.01) 0.62 -1.42 1.02
Note. The guessing parameter was set at a constant of 0.2 for multiple-choice items. T = content; V = conventions; W = writing. *Maximum score code for open-response items. ( ) = mean score for open-response items. NR = not released.
Table 7.1.12 Distribution of Score Points and Category Difficulty Estimates for Open-Response Items: Junior Writing (English)
Item Code Booklet (Section)
Sequence Score Points
Missing Illegible 10 20 30 40
22695_T 1(A) 13 % of Students 0.82 0.51 18.04 35.87 34.03 10.72
Parameters -3.71 -1.43 -0.01 1.63
22695_V 1(A) 13 % of Students 0.82 0.15 18.58 56.39 24.07
Parameters -3.54 -1.42 0.82
26008_T NR NR % of Students 0.95 0.36 27.23 41.74 23.54 6.17
Parameters -4.22 -1.02 0.66 2.01
26008_V NR NR % of Students 0.95 0.27 22.46 51.22 25.10
Parameters -3.59 -1.20 0.75
40195_T NR NR % of Students 0.87 0.85 20.07 38.77 30.37 9.06
Parameters -3.63 -1.30 0.21 1.68
40195_V NR NR % of Students 0.87 0.40 23.50 47.95 27.28
Parameters -3.78 -1.10 0.62 Note. The total number of students is 120 533. NR = not released.
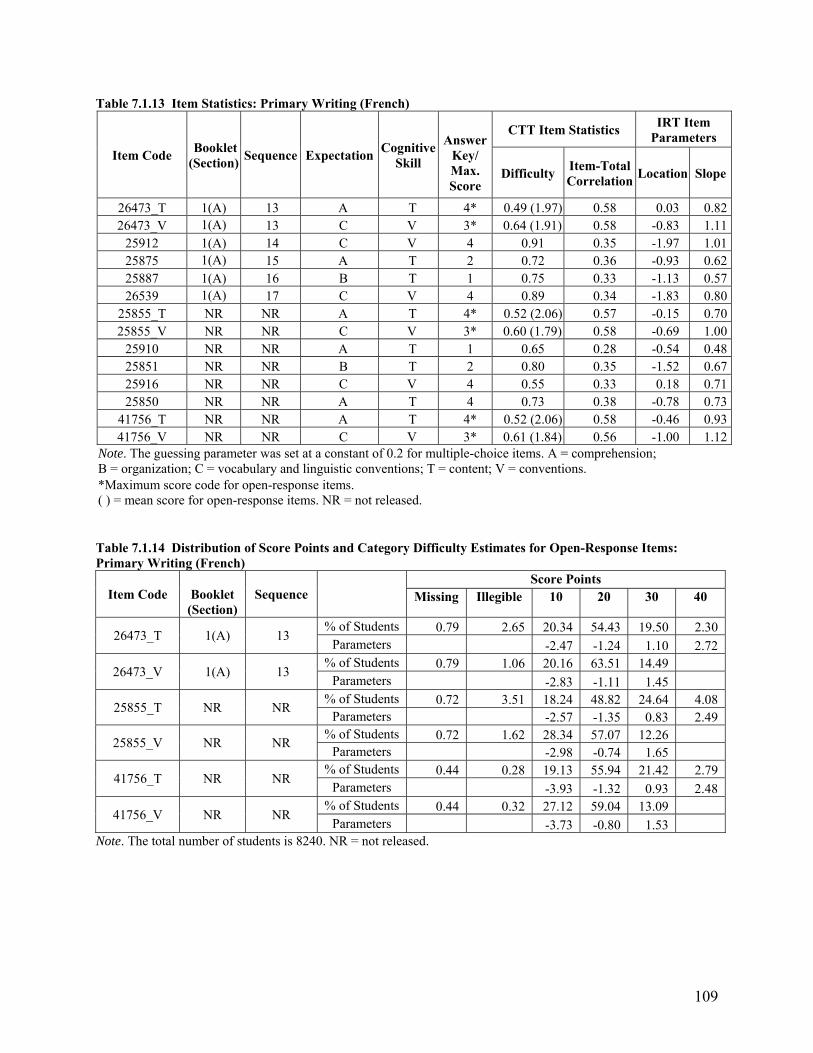
109
Table 7.1.13 Item Statistics: Primary Writing (French)
Item Code Booklet (Section)
Sequence ExpectationCognitive
Skill
Answer
Key/ Max. Score
CTT Item Statistics IRT Item
Parameters
Difficulty Item-Total Correlation
Location Slope
26473_T 1(A) 13 A T 4* 0.49 (1.97) 0.58 0.03 0.8226473_V 1(A) 13 C V 3* 0.64 (1.91) 0.58 -0.83 1.11
25912 1(A) 14 C V 4 0.91 0.35 -1.97 1.0125875 1(A) 15 A T 2 0.72 0.36 -0.93 0.6225887 1(A) 16 B T 1 0.75 0.33 -1.13 0.5726539 1(A) 17 C V 4 0.89 0.34 -1.83 0.80
25855_T NR NR A T 4* 0.52 (2.06) 0.57 -0.15 0.7025855_V NR NR C V 3* 0.60 (1.79) 0.58 -0.69 1.00
25910 NR NR A T 1 0.65 0.28 -0.54 0.4825851 NR NR B T 2 0.80 0.35 -1.52 0.6725916 NR NR C V 4 0.55 0.33 0.18 0.7125850 NR NR A T 4 0.73 0.38 -0.78 0.73
41756_T NR NR A T 4* 0.52 (2.06) 0.58 -0.46 0.9341756_V NR NR C V 3* 0.61 (1.84) 0.56 -1.00 1.12
Note. The guessing parameter was set at a constant of 0.2 for multiple-choice items. A = comprehension; B = organization; C = vocabulary and linguistic conventions; T = content; V = conventions. *Maximum score code for open-response items. ( ) = mean score for open-response items. NR = not released. Table 7.1.14 Distribution of Score Points and Category Difficulty Estimates for Open-Response Items: Primary Writing (French)
Item Code
Booklet (Section)
Sequence
Score Points Missing Illegible 10 20 30 40
26473_T 1(A) 13 % of Students 0.79 2.65 20.34 54.43 19.50 2.30
Parameters -2.47 -1.24 1.10 2.72
26473_V 1(A) 13 % of Students 0.79 1.06 20.16 63.51 14.49
Parameters -2.83 -1.11 1.45
25855_T NR NR % of Students 0.72 3.51 18.24 48.82 24.64 4.08
Parameters -2.57 -1.35 0.83 2.49
25855_V NR NR % of Students 0.72 1.62 28.34 57.07 12.26
Parameters -2.98 -0.74 1.65
41756_T NR NR % of Students 0.44 0.28 19.13 55.94 21.42 2.79
Parameters -3.93 -1.32 0.93 2.48
41756_V NR NR % of Students 0.44 0.32 27.12 59.04 13.09
Parameters -3.73 -0.80 1.53 Note. The total number of students is 8240. NR = not released.
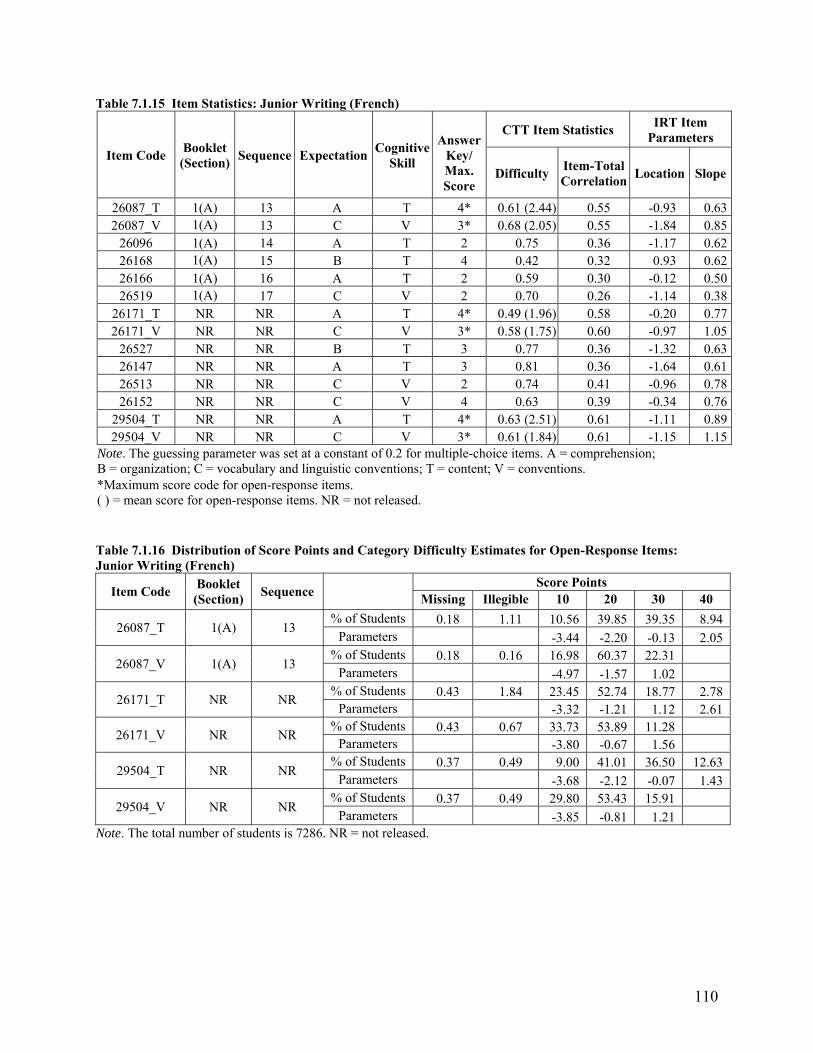
110
Table 7.1.15 Item Statistics: Junior Writing (French)
Item Code Booklet (Section)
Sequence ExpectationCognitive
Skill
Answer
Key/ Max. Score
CTT Item Statistics IRT Item
Parameters
Difficulty Item-Total Correlation
Location Slope
26087_T 1(A) 13 A T 4* 0.61 (2.44) 0.55 -0.93 0.6326087_V 1(A) 13 C V 3* 0.68 (2.05) 0.55 -1.84 0.85
26096 1(A) 14 A T 2 0.75 0.36 -1.17 0.6226168 1(A) 15 B T 4 0.42 0.32 0.93 0.6226166 1(A) 16 A T 2 0.59 0.30 -0.12 0.5026519 1(A) 17 C V 2 0.70 0.26 -1.14 0.38
26171_T NR NR A T 4* 0.49 (1.96) 0.58 -0.20 0.7726171_V NR NR C V 3* 0.58 (1.75) 0.60 -0.97 1.05
26527 NR NR B T 3 0.77 0.36 -1.32 0.6326147 NR NR A T 3 0.81 0.36 -1.64 0.6126513 NR NR C V 2 0.74 0.41 -0.96 0.7826152 NR NR C V 4 0.63 0.39 -0.34 0.76
29504_T NR NR A T 4* 0.63 (2.51) 0.61 -1.11 0.8929504_V NR NR C V 3* 0.61 (1.84) 0.61 -1.15 1.15
Note. The guessing parameter was set at a constant of 0.2 for multiple-choice items. A = comprehension; B = organization; C = vocabulary and linguistic conventions; T = content; V = conventions. *Maximum score code for open-response items. ( ) = mean score for open-response items. NR = not released.
Table 7.1.16 Distribution of Score Points and Category Difficulty Estimates for Open-Response Items: Junior Writing (French)
Item Code Booklet (Section)
Sequence Score Points
Missing Illegible 10 20 30 40
26087_T 1(A) 13 % of Students 0.18 1.11 10.56 39.85 39.35 8.94
Parameters -3.44 -2.20 -0.13 2.05
26087_V 1(A) 13 % of Students 0.18 0.16 16.98 60.37 22.31
Parameters -4.97 -1.57 1.02
26171_T NR NR % of Students 0.43 1.84 23.45 52.74 18.77 2.78
Parameters -3.32 -1.21 1.12 2.61
26171_V NR NR % of Students 0.43 0.67 33.73 53.89 11.28
Parameters -3.80 -0.67 1.56
29504_T NR NR % of Students 0.37 0.49 9.00 41.01 36.50 12.63
Parameters -3.68 -2.12 -0.07 1.43
29504_V NR NR % of Students 0.37 0.49 29.80 53.43 15.91
Parameters -3.85 -0.81 1.21 Note. The total number of students is 7286. NR = not released.
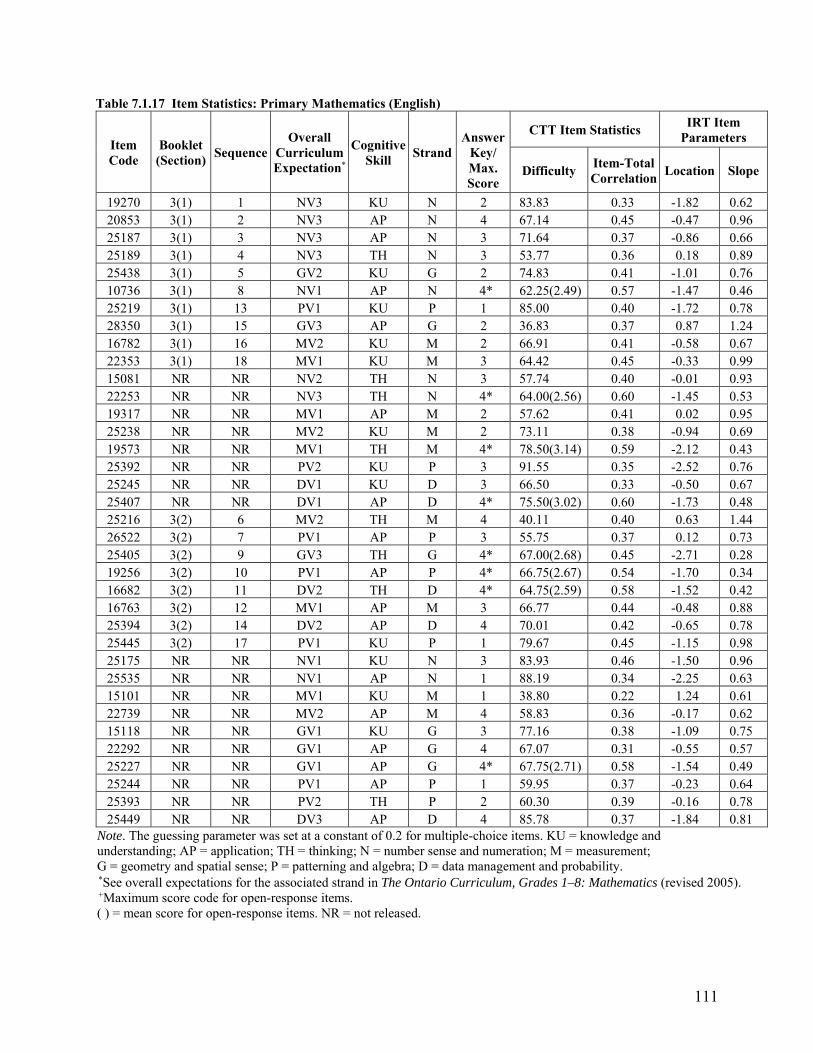
111
Table 7.1.17 Item Statistics: Primary Mathematics (English)
Item Code
Booklet (Section)
Sequence Overall
Curriculum Expectation*
Cognitive Skill
Strand
Answer
Key/ Max. Score
CTT Item Statistics IRT Item
Parameters
Difficulty Item-Total Correlation
Location Slope
19270 3(1) 1 NV3 KU N 2 83.83 0.33 -1.82 0.62 20853 3(1) 2 NV3 AP N 4 67.14 0.45 -0.47 0.96 25187 3(1) 3 NV3 AP N 3 71.64 0.37 -0.86 0.66 25189 3(1) 4 NV3 TH N 3 53.77 0.36 0.18 0.89 25438 3(1) 5 GV2 KU G 2 74.83 0.41 -1.01 0.76 10736 3(1) 8 NV1 AP N 4* 62.25(2.49) 0.57 -1.47 0.46 25219 3(1) 13 PV1 KU P 1 85.00 0.40 -1.72 0.78 28350 3(1) 15 GV3 AP G 2 36.83 0.37 0.87 1.24 16782 3(1) 16 MV2 KU M 2 66.91 0.41 -0.58 0.67 22353 3(1) 18 MV1 KU M 3 64.42 0.45 -0.33 0.99 15081 NR NR NV2 TH N 3 57.74 0.40 -0.01 0.93 22253 NR NR NV3 TH N 4* 64.00(2.56) 0.60 -1.45 0.53 19317 NR NR MV1 AP M 2 57.62 0.41 0.02 0.95 25238 NR NR MV2 KU M 2 73.11 0.38 -0.94 0.69 19573 NR NR MV1 TH M 4* 78.50(3.14) 0.59 -2.12 0.43 25392 NR NR PV2 KU P 3 91.55 0.35 -2.52 0.76 25245 NR NR DV1 KU D 3 66.50 0.33 -0.50 0.67 25407 NR NR DV1 AP D 4* 75.50(3.02) 0.60 -1.73 0.48 25216 3(2) 6 MV2 TH M 4 40.11 0.40 0.63 1.44 26522 3(2) 7 PV1 AP P 3 55.75 0.37 0.12 0.73 25405 3(2) 9 GV3 TH G 4* 67.00(2.68) 0.45 -2.71 0.28 19256 3(2) 10 PV1 AP P 4* 66.75(2.67) 0.54 -1.70 0.34 16682 3(2) 11 DV2 TH D 4* 64.75(2.59) 0.58 -1.52 0.42 16763 3(2) 12 MV1 AP M 3 66.77 0.44 -0.48 0.88 25394 3(2) 14 DV2 AP D 4 70.01 0.42 -0.65 0.78 25445 3(2) 17 PV1 KU P 1 79.67 0.45 -1.15 0.98 25175 NR NR NV1 KU N 3 83.93 0.46 -1.50 0.96 25535 NR NR NV1 AP N 1 88.19 0.34 -2.25 0.63 15101 NR NR MV1 KU M 1 38.80 0.22 1.24 0.61 22739 NR NR MV2 AP M 4 58.83 0.36 -0.17 0.62 15118 NR NR GV1 KU G 3 77.16 0.38 -1.09 0.75 22292 NR NR GV1 AP G 4 67.07 0.31 -0.55 0.57 25227 NR NR GV1 AP G 4* 67.75(2.71) 0.58 -1.54 0.49 25244 NR NR PV1 AP P 1 59.95 0.37 -0.23 0.64 25393 NR NR PV2 TH P 2 60.30 0.39 -0.16 0.78 25449 NR NR DV3 AP D 4 85.78 0.37 -1.84 0.81
Note. The guessing parameter was set at a constant of 0.2 for multiple-choice items. KU = knowledge and understanding; AP = application; TH = thinking; N = number sense and numeration; M = measurement; G = geometry and spatial sense; P = patterning and algebra; D = data management and probability. *See overall expectations for the associated strand in The Ontario Curriculum, Grades 1–8: Mathematics (revised 2005). +Maximum score code for open-response items. ( ) = mean score for open-response items. NR = not released.
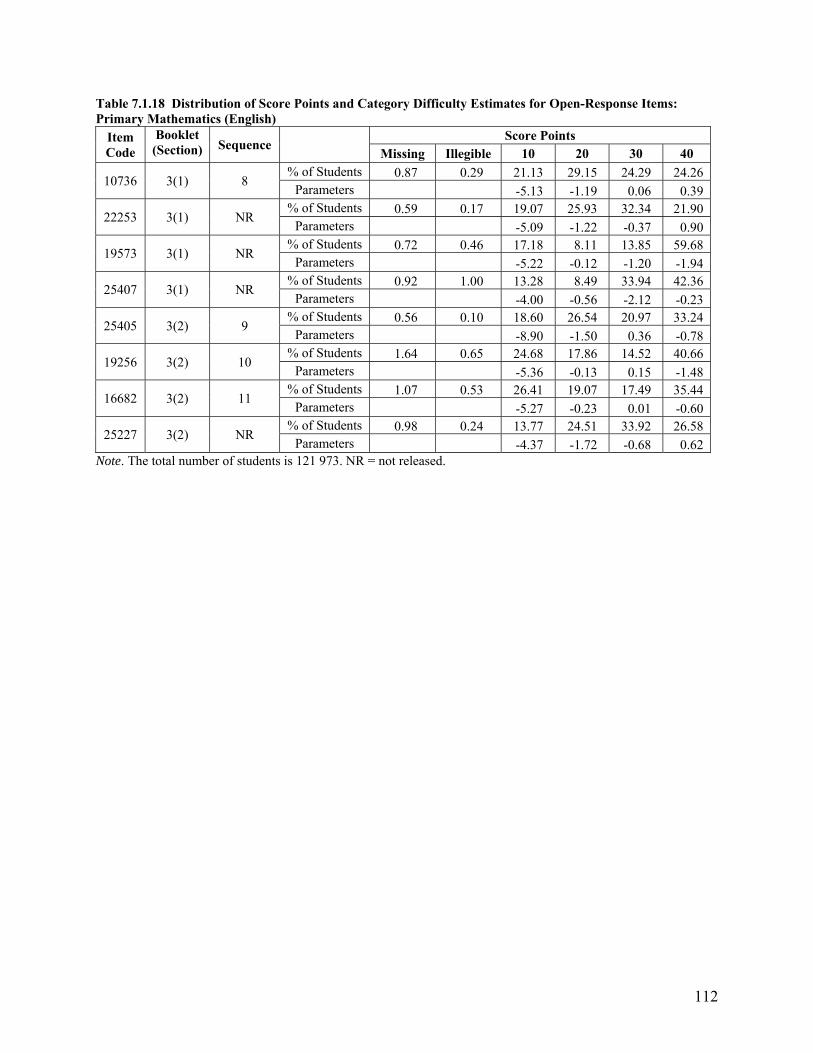
112
Table 7.1.18 Distribution of Score Points and Category Difficulty Estimates for Open-Response Items: Primary Mathematics (English)
Item Code
Booklet (Section) Sequence
Score Points Missing Illegible 10 20 30 40
10736 3(1) 8 % of Students 0.87 0.29 21.13 29.15 24.29 24.26
Parameters -5.13 -1.19 0.06 0.39
22253 3(1) NR % of Students 0.59 0.17 19.07 25.93 32.34 21.90
Parameters -5.09 -1.22 -0.37 0.90
19573 3(1) NR % of Students 0.72 0.46 17.18 8.11 13.85 59.68
Parameters -5.22 -0.12 -1.20 -1.94
25407 3(1) NR % of Students 0.92 1.00 13.28 8.49 33.94 42.36
Parameters -4.00 -0.56 -2.12 -0.23
25405 3(2) 9 % of Students 0.56 0.10 18.60 26.54 20.97 33.24
Parameters -8.90 -1.50 0.36 -0.78
19256 3(2) 10 % of Students 1.64 0.65 24.68 17.86 14.52 40.66
Parameters -5.36 -0.13 0.15 -1.48
16682 3(2) 11 % of Students 1.07 0.53 26.41 19.07 17.49 35.44
Parameters -5.27 -0.23 0.01 -0.60
25227 3(2) NR % of Students 0.98 0.24 13.77 24.51 33.92 26.58
Parameters -4.37 -1.72 -0.68 0.62 Note. The total number of students is 121 973. NR = not released.
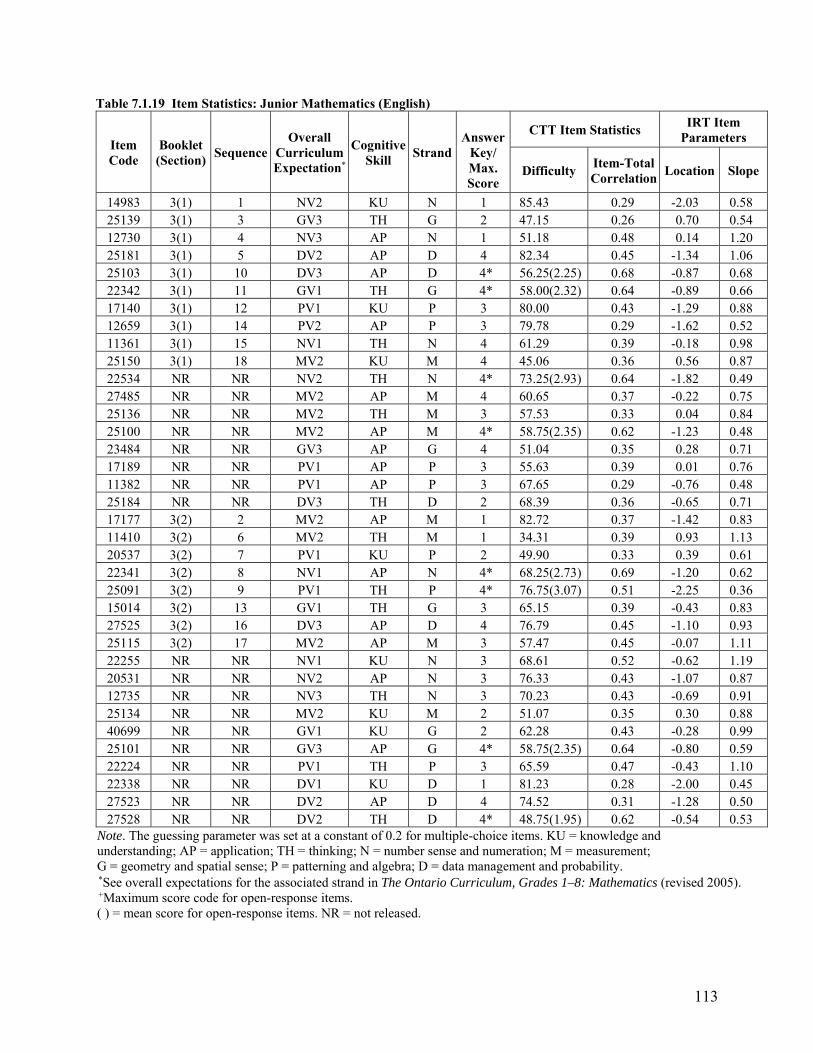
113
Table 7.1.19 Item Statistics: Junior Mathematics (English)
Item Code
Booklet (Section)
Sequence Overall
Curriculum Expectation*
Cognitive Skill
Strand
Answer
Key/ Max. Score
CTT Item Statistics IRT Item
Parameters
Difficulty Item-Total Correlation
Location Slope
14983 3(1) 1 NV2 KU N 1 85.43 0.29 -2.03 0.58 25139 3(1) 3 GV3 TH G 2 47.15 0.26 0.70 0.54 12730 3(1) 4 NV3 AP N 1 51.18 0.48 0.14 1.20 25181 3(1) 5 DV2 AP D 4 82.34 0.45 -1.34 1.06 25103 3(1) 10 DV3 AP D 4* 56.25(2.25) 0.68 -0.87 0.68 22342 3(1) 11 GV1 TH G 4* 58.00(2.32) 0.64 -0.89 0.66 17140 3(1) 12 PV1 KU P 3 80.00 0.43 -1.29 0.88 12659 3(1) 14 PV2 AP P 3 79.78 0.29 -1.62 0.52 11361 3(1) 15 NV1 TH N 4 61.29 0.39 -0.18 0.98 25150 3(1) 18 MV2 KU M 4 45.06 0.36 0.56 0.87 22534 NR NR NV2 TH N 4* 73.25(2.93) 0.64 -1.82 0.49 27485 NR NR MV2 AP M 4 60.65 0.37 -0.22 0.75 25136 NR NR MV2 TH M 3 57.53 0.33 0.04 0.84 25100 NR NR MV2 AP M 4* 58.75(2.35) 0.62 -1.23 0.48 23484 NR NR GV3 AP G 4 51.04 0.35 0.28 0.71 17189 NR NR PV1 AP P 3 55.63 0.39 0.01 0.76 11382 NR NR PV1 AP P 3 67.65 0.29 -0.76 0.48 25184 NR NR DV3 TH D 2 68.39 0.36 -0.65 0.71 17177 3(2) 2 MV2 AP M 1 82.72 0.37 -1.42 0.83 11410 3(2) 6 MV2 TH M 1 34.31 0.39 0.93 1.13 20537 3(2) 7 PV1 KU P 2 49.90 0.33 0.39 0.61 22341 3(2) 8 NV1 AP N 4* 68.25(2.73) 0.69 -1.20 0.62 25091 3(2) 9 PV1 TH P 4* 76.75(3.07) 0.51 -2.25 0.36 15014 3(2) 13 GV1 TH G 3 65.15 0.39 -0.43 0.83 27525 3(2) 16 DV3 AP D 4 76.79 0.45 -1.10 0.93 25115 3(2) 17 MV2 AP M 3 57.47 0.45 -0.07 1.11 22255 NR NR NV1 KU N 3 68.61 0.52 -0.62 1.19 20531 NR NR NV2 AP N 3 76.33 0.43 -1.07 0.87 12735 NR NR NV3 TH N 3 70.23 0.43 -0.69 0.91 25134 NR NR MV2 KU M 2 51.07 0.35 0.30 0.88 40699 NR NR GV1 KU G 2 62.28 0.43 -0.28 0.99 25101 NR NR GV3 AP G 4* 58.75(2.35) 0.64 -0.80 0.59 22224 NR NR PV1 TH P 3 65.59 0.47 -0.43 1.10 22338 NR NR DV1 KU D 1 81.23 0.28 -2.00 0.45 27523 NR NR DV2 AP D 4 74.52 0.31 -1.28 0.50 27528 NR NR DV2 TH D 4* 48.75(1.95) 0.62 -0.54 0.53
Note. The guessing parameter was set at a constant of 0.2 for multiple-choice items. KU = knowledge and understanding; AP = application; TH = thinking; N = number sense and numeration; M = measurement; G = geometry and spatial sense; P = patterning and algebra; D = data management and probability. *See overall expectations for the associated strand in The Ontario Curriculum, Grades 1–8: Mathematics (revised 2005). +Maximum score code for open-response items. ( ) = mean score for open-response items. NR = not released.
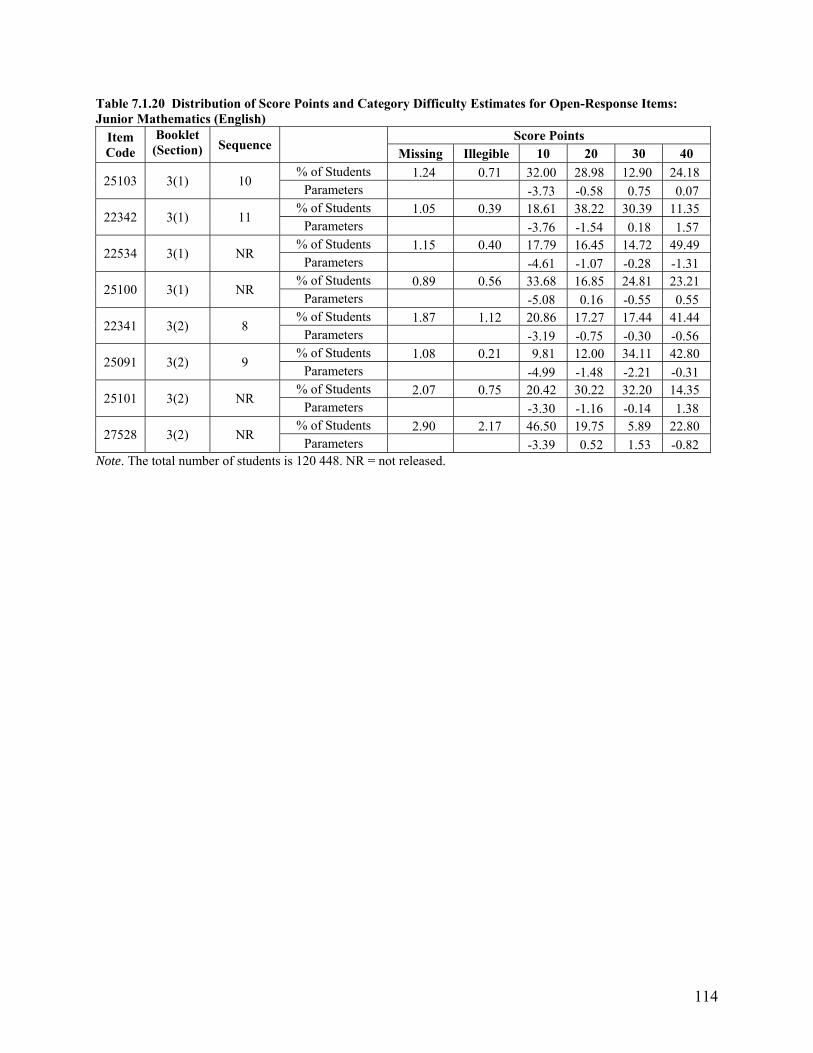
114
Table 7.1.20 Distribution of Score Points and Category Difficulty Estimates for Open-Response Items: Junior Mathematics (English)
Item Code
Booklet (Section) Sequence
Score Points Missing Illegible 10 20 30 40
25103 3(1) 10 % of Students 1.24 0.71 32.00 28.98 12.90 24.18
Parameters -3.73 -0.58 0.75 0.07
22342 3(1) 11 % of Students 1.05 0.39 18.61 38.22 30.39 11.35
Parameters -3.76 -1.54 0.18 1.57
22534 3(1) NR % of Students 1.15 0.40 17.79 16.45 14.72 49.49
Parameters -4.61 -1.07 -0.28 -1.31
25100 3(1) NR % of Students 0.89 0.56 33.68 16.85 24.81 23.21
Parameters -5.08 0.16 -0.55 0.55
22341 3(2) 8 % of Students 1.87 1.12 20.86 17.27 17.44 41.44
Parameters -3.19 -0.75 -0.30 -0.56
25091 3(2) 9 % of Students 1.08 0.21 9.81 12.00 34.11 42.80
Parameters -4.99 -1.48 -2.21 -0.31
25101 3(2) NR % of Students 2.07 0.75 20.42 30.22 32.20 14.35
Parameters -3.30 -1.16 -0.14 1.38
27528 3(2) NR % of Students 2.90 2.17 46.50 19.75 5.89 22.80
Parameters -3.39 0.52 1.53 -0.82 Note. The total number of students is 120 448. NR = not released.
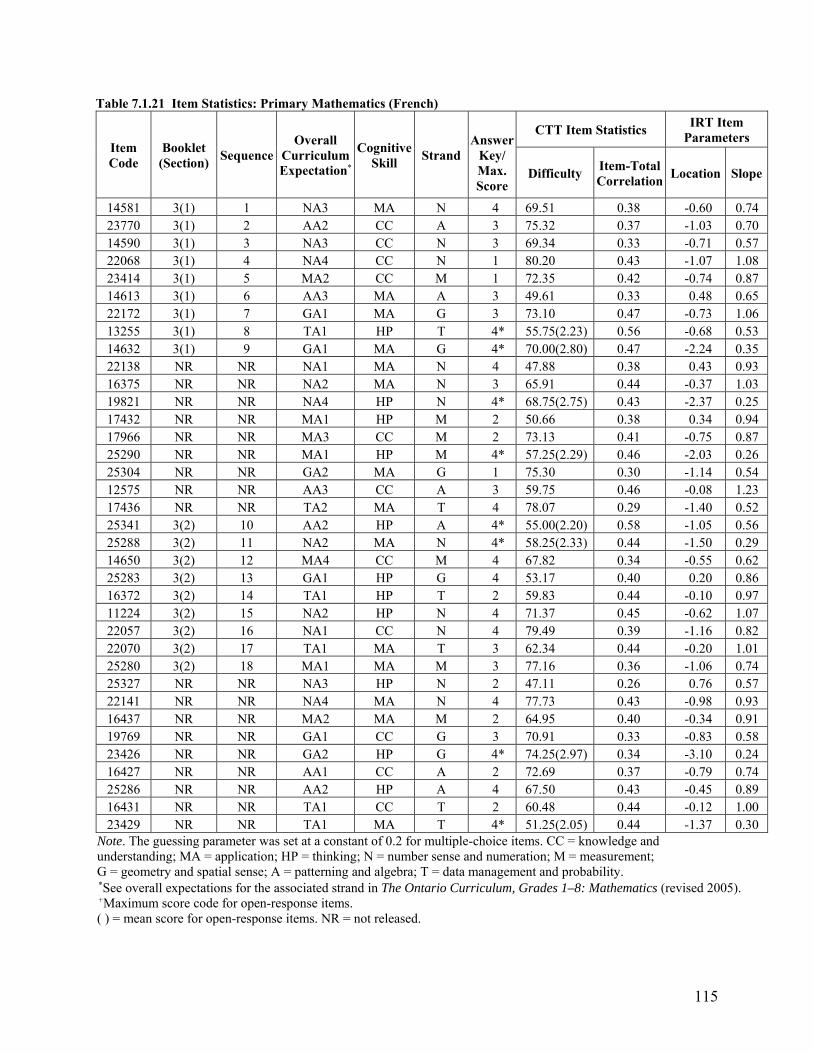
115
Table 7.1.21 Item Statistics: Primary Mathematics (French)
Item Code
Booklet (Section)
Sequence Overall
Curriculum Expectation*
Cognitive Skill
Strand
Answer
Key/ Max. Score
CTT Item Statistics IRT Item
Parameters
Difficulty Item-Total Correlation
Location Slope
14581 3(1) 1 NA3 MA N 4 69.51 0.38 -0.60 0.74 23770 3(1) 2 AA2 CC A 3 75.32 0.37 -1.03 0.70 14590 3(1) 3 NA3 CC N 3 69.34 0.33 -0.71 0.57 22068 3(1) 4 NA4 CC N 1 80.20 0.43 -1.07 1.08 23414 3(1) 5 MA2 CC M 1 72.35 0.42 -0.74 0.87 14613 3(1) 6 AA3 MA A 3 49.61 0.33 0.48 0.65 22172 3(1) 7 GA1 MA G 3 73.10 0.47 -0.73 1.06 13255 3(1) 8 TA1 HP T 4* 55.75(2.23) 0.56 -0.68 0.53 14632 3(1) 9 GA1 MA G 4* 70.00(2.80) 0.47 -2.24 0.35 22138 NR NR NA1 MA N 4 47.88 0.38 0.43 0.93 16375 NR NR NA2 MA N 3 65.91 0.44 -0.37 1.03 19821 NR NR NA4 HP N 4* 68.75(2.75) 0.43 -2.37 0.25 17432 NR NR MA1 HP M 2 50.66 0.38 0.34 0.94 17966 NR NR MA3 CC M 2 73.13 0.41 -0.75 0.87 25290 NR NR MA1 HP M 4* 57.25(2.29) 0.46 -2.03 0.26 25304 NR NR GA2 MA G 1 75.30 0.30 -1.14 0.54 12575 NR NR AA3 CC A 3 59.75 0.46 -0.08 1.23 17436 NR NR TA2 MA T 4 78.07 0.29 -1.40 0.52 25341 3(2) 10 AA2 HP A 4* 55.00(2.20) 0.58 -1.05 0.56 25288 3(2) 11 NA2 MA N 4* 58.25(2.33) 0.44 -1.50 0.29 14650 3(2) 12 MA4 CC M 4 67.82 0.34 -0.55 0.62 25283 3(2) 13 GA1 HP G 4 53.17 0.40 0.20 0.86 16372 3(2) 14 TA1 HP T 2 59.83 0.44 -0.10 0.97 11224 3(2) 15 NA2 HP N 4 71.37 0.45 -0.62 1.07 22057 3(2) 16 NA1 CC N 4 79.49 0.39 -1.16 0.82 22070 3(2) 17 TA1 MA T 3 62.34 0.44 -0.20 1.01 25280 3(2) 18 MA1 MA M 3 77.16 0.36 -1.06 0.74 25327 NR NR NA3 HP N 2 47.11 0.26 0.76 0.57 22141 NR NR NA4 MA N 4 77.73 0.43 -0.98 0.93 16437 NR NR MA2 MA M 2 64.95 0.40 -0.34 0.91 19769 NR NR GA1 CC G 3 70.91 0.33 -0.83 0.58 23426 NR NR GA2 HP G 4* 74.25(2.97) 0.34 -3.10 0.24 16427 NR NR AA1 CC A 2 72.69 0.37 -0.79 0.74 25286 NR NR AA2 HP A 4 67.50 0.43 -0.45 0.89 16431 NR NR TA1 CC T 2 60.48 0.44 -0.12 1.00 23429 NR NR TA1 MA T 4* 51.25(2.05) 0.44 -1.37 0.30
Note. The guessing parameter was set at a constant of 0.2 for multiple-choice items. CC = knowledge and understanding; MA = application; HP = thinking; N = number sense and numeration; M = measurement; G = geometry and spatial sense; A = patterning and algebra; T = data management and probability. *See overall expectations for the associated strand in The Ontario Curriculum, Grades 1–8: Mathematics (revised 2005). +Maximum score code for open-response items. ( ) = mean score for open-response items. NR = not released.

116
Table 7.1.22 Distribution of Score Points and Category Difficulty Estimates for Open-Response Items: Primary Mathematics (French)
Item Code
Booklet (Section) Sequence
Score Points Missing Illegible 10 20 30 40
13255 3(1) 8 % of Students 0.89 0.32 27.34 23.9 41.96 5.60
Parameters -4.63 -0.45 -0.58 2.94
14632 3(1) 9 % of Students 0.38 0.12 13.11 22.26 33.92 30.22
Parameters -6.65 -1.76 -0.98 0.42
19821 3(1) NR % of Students 0.99 0.38 22.10 14.84 23.33 38.37
Parameters -7.51 0.35 -1.30 -1.02
25290 3(1) NR % of Students 0.52 1.04 44.32 10.99 9.32 33.81
Parameters -8.65 2.67 0.48 -2.64
25341 3(2) 10 % of Students 0.56 0.15 28.64 36.86 17.18 16.62
Parameters -5.06 -0.76 0.93 0.70
25288 3(2) 11 % of Students 1.39 0.35 31.87 19.2 25.68 21.51
Parameters -6.82 0.56 -0.58 0.84
23426 3(2) NR % of Students 0.42 0.10 8.37 19.69 36.46 34.96
Parameters -8.04 -2.87 -1.80 0.29
23429 3(2) NR % of Students 0.93 0.78 40.34 25.42 16.70 15.82
Parameters -7.60 0.51 1.00 0.61 Note. The total number of students is 8247. NR = not released.
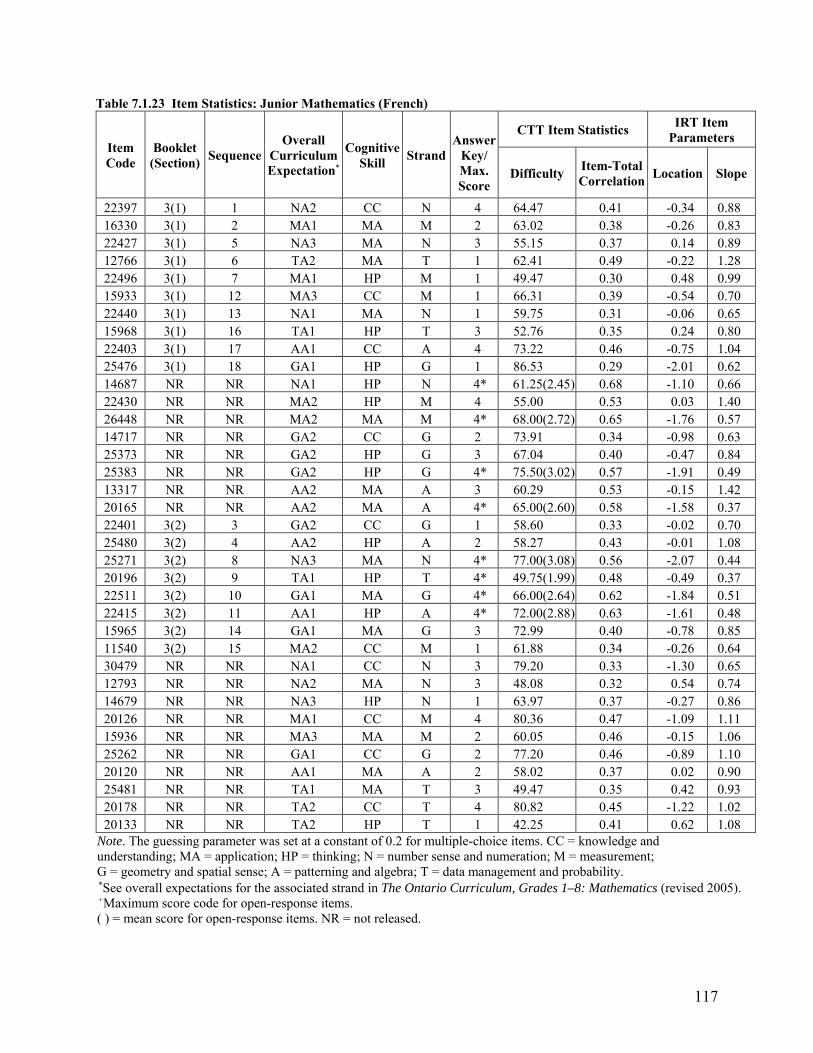
117
Table 7.1.23 Item Statistics: Junior Mathematics (French)
Item Code
Booklet (Section)
Sequence Overall
Curriculum Expectation*
Cognitive Skill
Strand
Answer
Key/ Max. Score
CTT Item Statistics IRT Item
Parameters
Difficulty Item-Total Correlation
Location Slope
22397 3(1) 1 NA2 CC N 4 64.47 0.41 -0.34 0.88 16330 3(1) 2 MA1 MA M 2 63.02 0.38 -0.26 0.83 22427 3(1) 5 NA3 MA N 3 55.15 0.37 0.14 0.89 12766 3(1) 6 TA2 MA T 1 62.41 0.49 -0.22 1.28 22496 3(1) 7 MA1 HP M 1 49.47 0.30 0.48 0.99 15933 3(1) 12 MA3 CC M 1 66.31 0.39 -0.54 0.70 22440 3(1) 13 NA1 MA N 1 59.75 0.31 -0.06 0.65 15968 3(1) 16 TA1 HP T 3 52.76 0.35 0.24 0.80 22403 3(1) 17 AA1 CC A 4 73.22 0.46 -0.75 1.04 25476 3(1) 18 GA1 HP G 1 86.53 0.29 -2.01 0.62 14687 NR NR NA1 HP N 4* 61.25(2.45) 0.68 -1.10 0.66 22430 NR NR MA2 HP M 4 55.00 0.53 0.03 1.40 26448 NR NR MA2 MA M 4* 68.00(2.72) 0.65 -1.76 0.57 14717 NR NR GA2 CC G 2 73.91 0.34 -0.98 0.63 25373 NR NR GA2 HP G 3 67.04 0.40 -0.47 0.84 25383 NR NR GA2 HP G 4* 75.50(3.02) 0.57 -1.91 0.49 13317 NR NR AA2 MA A 3 60.29 0.53 -0.15 1.42 20165 NR NR AA2 MA A 4* 65.00(2.60) 0.58 -1.58 0.37 22401 3(2) 3 GA2 CC G 1 58.60 0.33 -0.02 0.70 25480 3(2) 4 AA2 HP A 2 58.27 0.43 -0.01 1.08 25271 3(2) 8 NA3 MA N 4* 77.00(3.08) 0.56 -2.07 0.44 20196 3(2) 9 TA1 HP T 4* 49.75(1.99) 0.48 -0.49 0.37 22511 3(2) 10 GA1 MA G 4* 66.00(2.64) 0.62 -1.84 0.51 22415 3(2) 11 AA1 HP A 4* 72.00(2.88) 0.63 -1.61 0.48 15965 3(2) 14 GA1 MA G 3 72.99 0.40 -0.78 0.85 11540 3(2) 15 MA2 CC M 1 61.88 0.34 -0.26 0.64 30479 NR NR NA1 CC N 3 79.20 0.33 -1.30 0.65 12793 NR NR NA2 MA N 3 48.08 0.32 0.54 0.74 14679 NR NR NA3 HP N 1 63.97 0.37 -0.27 0.86 20126 NR NR MA1 CC M 4 80.36 0.47 -1.09 1.11 15936 NR NR MA3 MA M 2 60.05 0.46 -0.15 1.06 25262 NR NR GA1 CC G 2 77.20 0.46 -0.89 1.10 20120 NR NR AA1 MA A 2 58.02 0.37 0.02 0.90 25481 NR NR TA1 MA T 3 49.47 0.35 0.42 0.93 20178 NR NR TA2 CC T 4 80.82 0.45 -1.22 1.02 20133 NR NR TA2 HP T 1 42.25 0.41 0.62 1.08
Note. The guessing parameter was set at a constant of 0.2 for multiple-choice items. CC = knowledge and understanding; MA = application; HP = thinking; N = number sense and numeration; M = measurement; G = geometry and spatial sense; A = patterning and algebra; T = data management and probability. *See overall expectations for the associated strand in The Ontario Curriculum, Grades 1–8: Mathematics (revised 2005). +Maximum score code for open-response items. ( ) = mean score for open-response items. NR = not released.
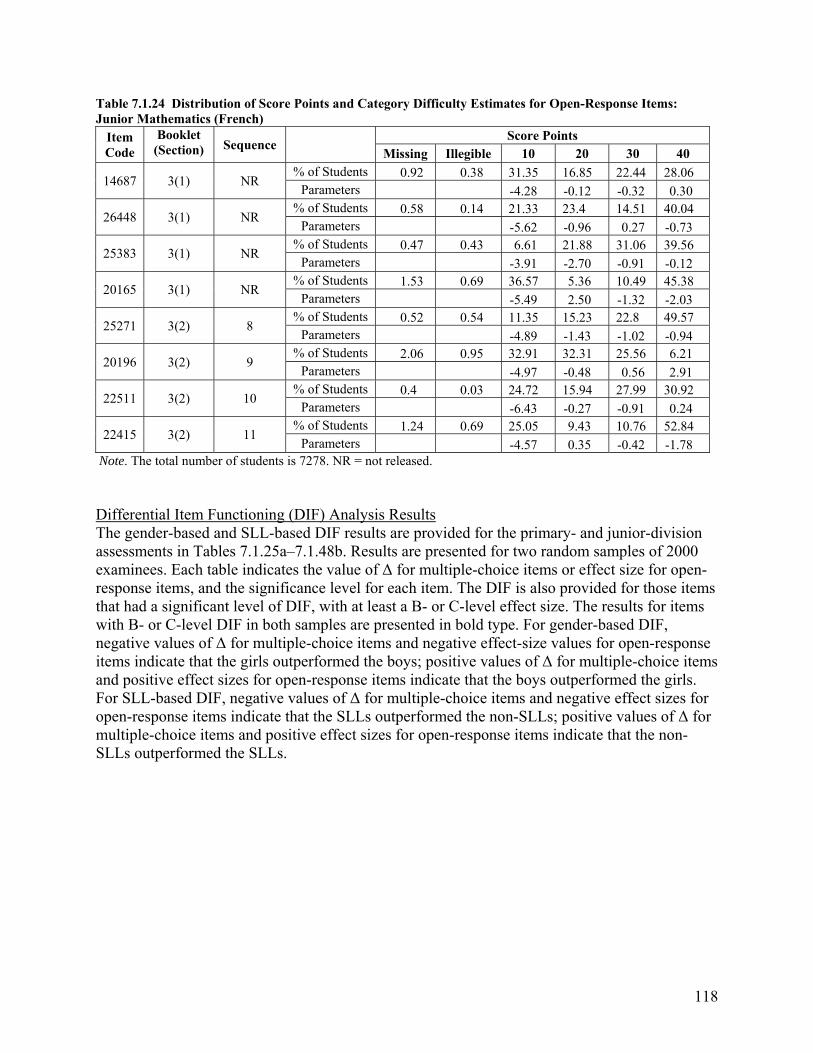
118
Table 7.1.24 Distribution of Score Points and Category Difficulty Estimates for Open-Response Items: Junior Mathematics (French)
Item Code
Booklet (Section) Sequence
Score Points Missing Illegible 10 20 30 40
14687 3(1) NR % of Students 0.92 0.38 31.35 16.85 22.44 28.06
Parameters -4.28 -0.12 -0.32 0.30
26448 3(1) NR % of Students 0.58 0.14 21.33 23.4 14.51 40.04
Parameters -5.62 -0.96 0.27 -0.73
25383 3(1) NR % of Students 0.47 0.43 6.61 21.88 31.06 39.56
Parameters -3.91 -2.70 -0.91 -0.12
20165 3(1) NR % of Students 1.53 0.69 36.57 5.36 10.49 45.38
Parameters -5.49 2.50 -1.32 -2.03
25271 3(2) 8 % of Students 0.52 0.54 11.35 15.23 22.8 49.57
Parameters -4.89 -1.43 -1.02 -0.94
20196 3(2) 9 % of Students 2.06 0.95 32.91 32.31 25.56 6.21
Parameters -4.97 -0.48 0.56 2.91
22511 3(2) 10 % of Students 0.4 0.03 24.72 15.94 27.99 30.92
Parameters -6.43 -0.27 -0.91 0.24
22415 3(2) 11 % of Students 1.24 0.69 25.05 9.43 10.76 52.84
Parameters -4.57 0.35 -0.42 -1.78 Note. The total number of students is 7278. NR = not released. Differential Item Functioning (DIF) Analysis Results The gender-based and SLL-based DIF results are provided for the primary- and junior-division assessments in Tables 7.1.25a–7.1.48b. Results are presented for two random samples of 2000 examinees. Each table indicates the value of Δ for multiple-choice items or effect size for open-response items, and the significance level for each item. The DIF is also provided for those items that had a significant level of DIF, with at least a B- or C-level effect size. The results for items with B- or C-level DIF in both samples are presented in bold type. For gender-based DIF, negative values of Δ for multiple-choice items and negative effect-size values for open-response items indicate that the girls outperformed the boys; positive values of Δ for multiple-choice items and positive effect sizes for open-response items indicate that the boys outperformed the girls. For SLL-based DIF, negative values of Δ for multiple-choice items and negative effect sizes for open-response items indicate that the SLLs outperformed the non-SLLs; positive values of Δ for multiple-choice items and positive effect sizes for open-response items indicate that the non-SLLs outperformed the SLLs.
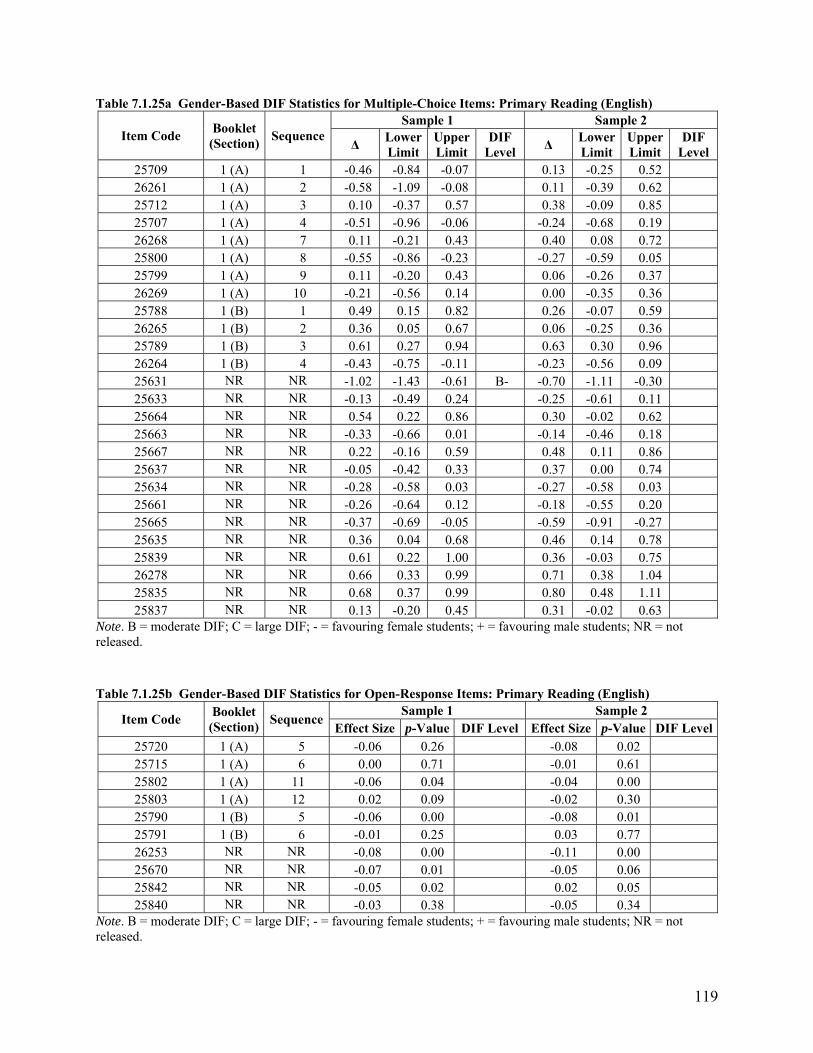
119
Table 7.1.25a Gender-Based DIF Statistics for Multiple-Choice Items: Primary Reading (English)
Item Code Booklet
(Section) Sequence
Sample 1 Sample 2
Δ LowerLimit
UpperLimit
DIF Level
Δ Lower Limit
UpperLimit
DIF Level
25709 1 (A) 1 -0.46 -0.84 -0.07 0.13 -0.25 0.52 26261 1 (A) 2 -0.58 -1.09 -0.08 0.11 -0.39 0.62 25712 1 (A) 3 0.10 -0.37 0.57 0.38 -0.09 0.85 25707 1 (A) 4 -0.51 -0.96 -0.06 -0.24 -0.68 0.19 26268 1 (A) 7 0.11 -0.21 0.43 0.40 0.08 0.72 25800 1 (A) 8 -0.55 -0.86 -0.23 -0.27 -0.59 0.05 25799 1 (A) 9 0.11 -0.20 0.43 0.06 -0.26 0.37 26269 1 (A) 10 -0.21 -0.56 0.14 0.00 -0.35 0.36 25788 1 (B) 1 0.49 0.15 0.82 0.26 -0.07 0.59 26265 1 (B) 2 0.36 0.05 0.67 0.06 -0.25 0.36 25789 1 (B) 3 0.61 0.27 0.94 0.63 0.30 0.96 26264 1 (B) 4 -0.43 -0.75 -0.11 -0.23 -0.56 0.09 25631 NR NR -1.02 -1.43 -0.61 B- -0.70 -1.11 -0.30 25633 NR NR -0.13 -0.49 0.24 -0.25 -0.61 0.11 25664 NR NR 0.54 0.22 0.86 0.30 -0.02 0.62 25663 NR NR -0.33 -0.66 0.01 -0.14 -0.46 0.18 25667 NR NR 0.22 -0.16 0.59 0.48 0.11 0.86 25637 NR NR -0.05 -0.42 0.33 0.37 0.00 0.74 25634 NR NR -0.28 -0.58 0.03 -0.27 -0.58 0.03 25661 NR NR -0.26 -0.64 0.12 -0.18 -0.55 0.20 25665 NR NR -0.37 -0.69 -0.05 -0.59 -0.91 -0.27 25635 NR NR 0.36 0.04 0.68 0.46 0.14 0.78 25839 NR NR 0.61 0.22 1.00 0.36 -0.03 0.75 26278 NR NR 0.66 0.33 0.99 0.71 0.38 1.04 25835 NR NR 0.68 0.37 0.99 0.80 0.48 1.11 25837 NR NR 0.13 -0.20 0.45 0.31 -0.02 0.63
Note. B = moderate DIF; C = large DIF; - = favouring female students; + = favouring male students; NR = not released. Table 7.1.25b Gender-Based DIF Statistics for Open-Response Items: Primary Reading (English)
Item Code Booklet
(Section) Sequence
Sample 1 Sample 2 Effect Size p-Value DIF Level Effect Size p-Value DIF Level
25720 1 (A) 5 -0.06 0.26 -0.08 0.02 25715 1 (A) 6 0.00 0.71 -0.01 0.61 25802 1 (A) 11 -0.06 0.04 -0.04 0.00 25803 1 (A) 12 0.02 0.09 -0.02 0.30 25790 1 (B) 5 -0.06 0.00 -0.08 0.01 25791 1 (B) 6 -0.01 0.25 0.03 0.77 26253 NR NR -0.08 0.00 -0.11 0.00 25670 NR NR -0.07 0.01 -0.05 0.06 25842 NR NR -0.05 0.02 0.02 0.05 25840 NR NR -0.03 0.38 -0.05 0.34
Note. B = moderate DIF; C = large DIF; - = favouring female students; + = favouring male students; NR = not released.
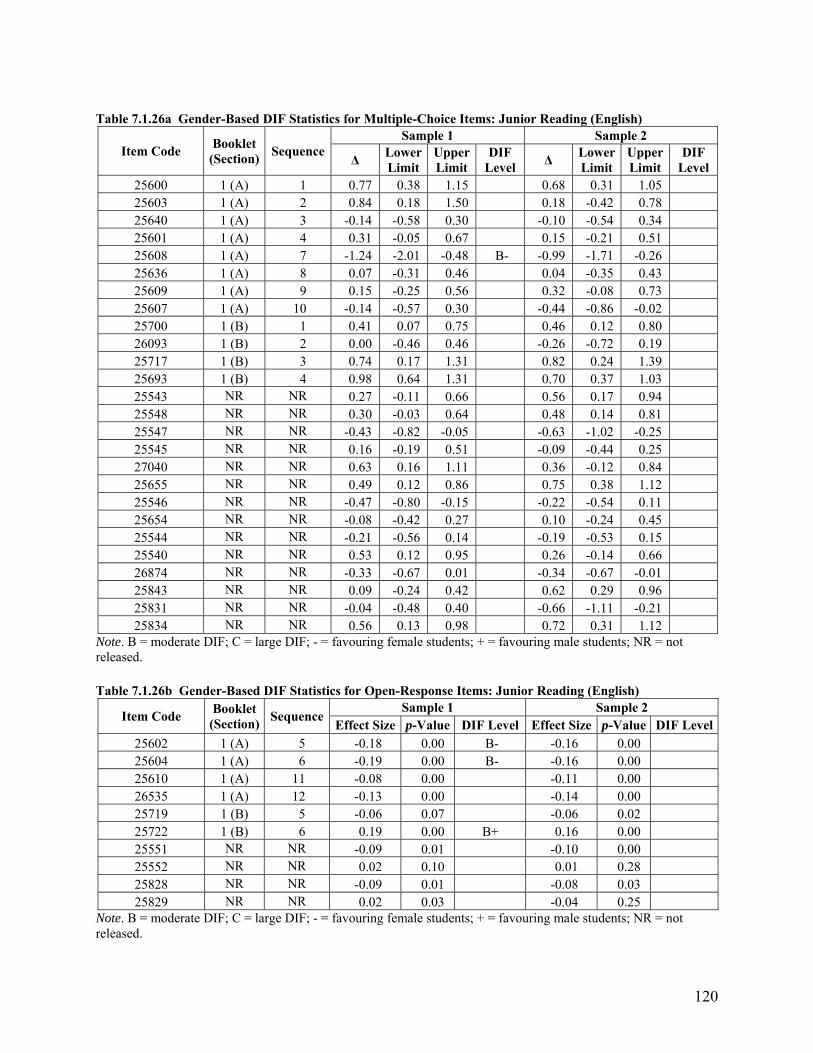
120
Table 7.1.26a Gender-Based DIF Statistics for Multiple-Choice Items: Junior Reading (English)
Item Code Booklet
(Section) Sequence
Sample 1 Sample 2
Δ LowerLimit
UpperLimit
DIF Level
Δ Lower Limit
UpperLimit
DIF Level
25600 1 (A) 1 0.77 0.38 1.15 0.68 0.31 1.05 25603 1 (A) 2 0.84 0.18 1.50 0.18 -0.42 0.78 25640 1 (A) 3 -0.14 -0.58 0.30 -0.10 -0.54 0.34 25601 1 (A) 4 0.31 -0.05 0.67 0.15 -0.21 0.51 25608 1 (A) 7 -1.24 -2.01 -0.48 B- -0.99 -1.71 -0.26 25636 1 (A) 8 0.07 -0.31 0.46 0.04 -0.35 0.43 25609 1 (A) 9 0.15 -0.25 0.56 0.32 -0.08 0.73 25607 1 (A) 10 -0.14 -0.57 0.30 -0.44 -0.86 -0.02 25700 1 (B) 1 0.41 0.07 0.75 0.46 0.12 0.80 26093 1 (B) 2 0.00 -0.46 0.46 -0.26 -0.72 0.19 25717 1 (B) 3 0.74 0.17 1.31 0.82 0.24 1.39 25693 1 (B) 4 0.98 0.64 1.31 0.70 0.37 1.03 25543 NR NR 0.27 -0.11 0.66 0.56 0.17 0.94 25548 NR NR 0.30 -0.03 0.64 0.48 0.14 0.81 25547 NR NR -0.43 -0.82 -0.05 -0.63 -1.02 -0.25 25545 NR NR 0.16 -0.19 0.51 -0.09 -0.44 0.25 27040 NR NR 0.63 0.16 1.11 0.36 -0.12 0.84 25655 NR NR 0.49 0.12 0.86 0.75 0.38 1.12 25546 NR NR -0.47 -0.80 -0.15 -0.22 -0.54 0.11 25654 NR NR -0.08 -0.42 0.27 0.10 -0.24 0.45 25544 NR NR -0.21 -0.56 0.14 -0.19 -0.53 0.15 25540 NR NR 0.53 0.12 0.95 0.26 -0.14 0.66 26874 NR NR -0.33 -0.67 0.01 -0.34 -0.67 -0.01 25843 NR NR 0.09 -0.24 0.42 0.62 0.29 0.96 25831 NR NR -0.04 -0.48 0.40 -0.66 -1.11 -0.21 25834 NR NR 0.56 0.13 0.98 0.72 0.31 1.12
Note. B = moderate DIF; C = large DIF; - = favouring female students; + = favouring male students; NR = not released. Table 7.1.26b Gender-Based DIF Statistics for Open-Response Items: Junior Reading (English)
Item Code Booklet
(Section) Sequence
Sample 1 Sample 2 Effect Size p-Value DIF Level Effect Size p-Value DIF Level
25602 1 (A) 5 -0.18 0.00 B- -0.16 0.00 25604 1 (A) 6 -0.19 0.00 B- -0.16 0.00 25610 1 (A) 11 -0.08 0.00 -0.11 0.00 26535 1 (A) 12 -0.13 0.00 -0.14 0.00 25719 1 (B) 5 -0.06 0.07 -0.06 0.02 25722 1 (B) 6 0.19 0.00 B+ 0.16 0.00 25551 NR NR -0.09 0.01 -0.10 0.00 25552 NR NR 0.02 0.10 0.01 0.28 25828 NR NR -0.09 0.01 -0.08 0.03 25829 NR NR 0.02 0.03 -0.04 0.25
Note. B = moderate DIF; C = large DIF; - = favouring female students; + = favouring male students; NR = not released.
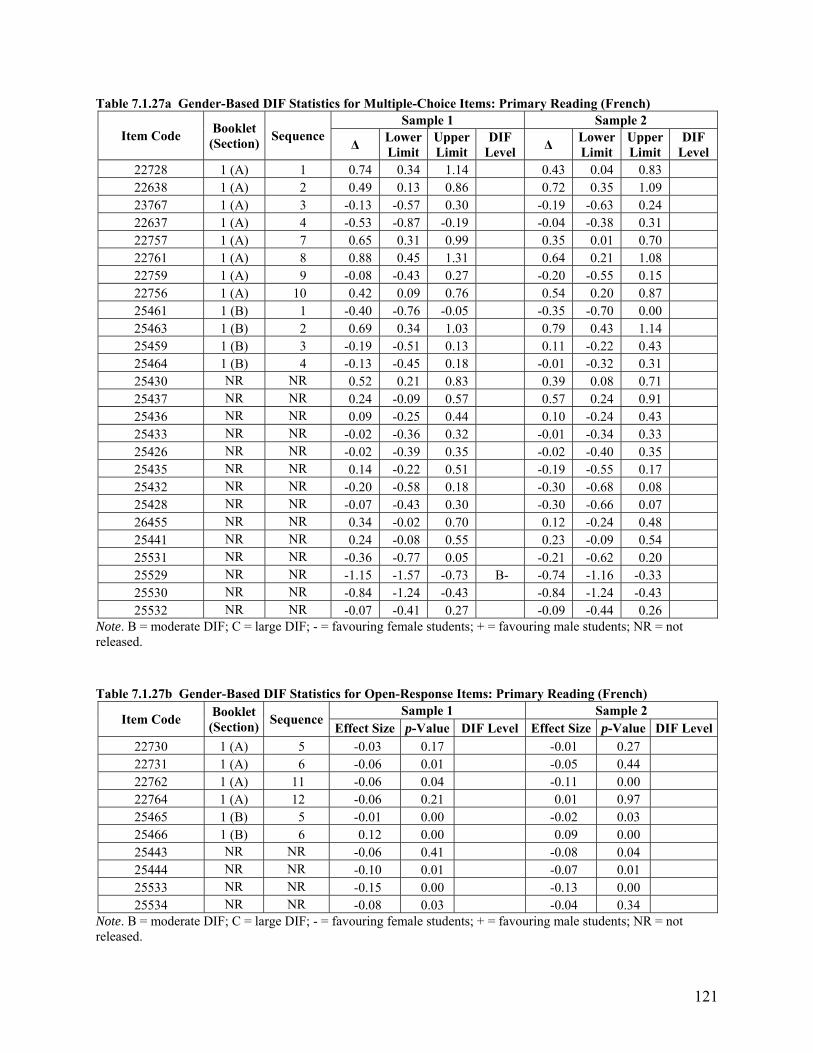
121
Table 7.1.27a Gender-Based DIF Statistics for Multiple-Choice Items: Primary Reading (French)
Item Code Booklet
(Section) Sequence
Sample 1 Sample 2
Δ LowerLimit
UpperLimit
DIF Level
Δ Lower Limit
UpperLimit
DIF Level
22728 1 (A) 1 0.74 0.34 1.14 0.43 0.04 0.83 22638 1 (A) 2 0.49 0.13 0.86 0.72 0.35 1.09 23767 1 (A) 3 -0.13 -0.57 0.30 -0.19 -0.63 0.24 22637 1 (A) 4 -0.53 -0.87 -0.19 -0.04 -0.38 0.31 22757 1 (A) 7 0.65 0.31 0.99 0.35 0.01 0.70 22761 1 (A) 8 0.88 0.45 1.31 0.64 0.21 1.08 22759 1 (A) 9 -0.08 -0.43 0.27 -0.20 -0.55 0.15 22756 1 (A) 10 0.42 0.09 0.76 0.54 0.20 0.87 25461 1 (B) 1 -0.40 -0.76 -0.05 -0.35 -0.70 0.00 25463 1 (B) 2 0.69 0.34 1.03 0.79 0.43 1.14 25459 1 (B) 3 -0.19 -0.51 0.13 0.11 -0.22 0.43 25464 1 (B) 4 -0.13 -0.45 0.18 -0.01 -0.32 0.31 25430 NR NR 0.52 0.21 0.83 0.39 0.08 0.71 25437 NR NR 0.24 -0.09 0.57 0.57 0.24 0.91 25436 NR NR 0.09 -0.25 0.44 0.10 -0.24 0.43 25433 NR NR -0.02 -0.36 0.32 -0.01 -0.34 0.33 25426 NR NR -0.02 -0.39 0.35 -0.02 -0.40 0.35 25435 NR NR 0.14 -0.22 0.51 -0.19 -0.55 0.17 25432 NR NR -0.20 -0.58 0.18 -0.30 -0.68 0.08 25428 NR NR -0.07 -0.43 0.30 -0.30 -0.66 0.07 26455 NR NR 0.34 -0.02 0.70 0.12 -0.24 0.48 25441 NR NR 0.24 -0.08 0.55 0.23 -0.09 0.54 25531 NR NR -0.36 -0.77 0.05 -0.21 -0.62 0.20 25529 NR NR -1.15 -1.57 -0.73 B- -0.74 -1.16 -0.33 25530 NR NR -0.84 -1.24 -0.43 -0.84 -1.24 -0.43 25532 NR NR -0.07 -0.41 0.27 -0.09 -0.44 0.26
Note. B = moderate DIF; C = large DIF; - = favouring female students; + = favouring male students; NR = not released. Table 7.1.27b Gender-Based DIF Statistics for Open-Response Items: Primary Reading (French)
Item Code Booklet
(Section) Sequence
Sample 1 Sample 2 Effect Size p-Value DIF Level Effect Size p-Value DIF Level
22730 1 (A) 5 -0.03 0.17 -0.01 0.27 22731 1 (A) 6 -0.06 0.01 -0.05 0.44 22762 1 (A) 11 -0.06 0.04 -0.11 0.00 22764 1 (A) 12 -0.06 0.21 0.01 0.97 25465 1 (B) 5 -0.01 0.00 -0.02 0.03 25466 1 (B) 6 0.12 0.00 0.09 0.00 25443 NR NR -0.06 0.41 -0.08 0.04 25444 NR NR -0.10 0.01 -0.07 0.01 25533 NR NR -0.15 0.00 -0.13 0.00 25534 NR NR -0.08 0.03 -0.04 0.34
Note. B = moderate DIF; C = large DIF; - = favouring female students; + = favouring male students; NR = not released.

122
Table 7.1.28a Gender-Based DIF Statistics for Multiple-Choice Items: Junior Reading (French)
Item Code Booklet
(Section) Sequence
Sample 1 Sample 2
Δ LowerLimit
UpperLimit
DIF Level
Δ Lower Limit
UpperLimit
DIF Level
26036 1 (A) 1 0.08 -0.25 0.40 0.10 -0.22 0.43 26039 1 (A) 2 0.35 -0.06 0.75 0.30 -0.09 0.69 26038 1 (A) 3 -0.04 -0.42 0.33 0.10 -0.27 0.47 26037 1 (A) 4 0.71 0.37 1.05 0.77 0.43 1.11 26025 1 (A) 7 1.23 0.86 1.60 B+ 1.00 0.63 1.36 26024 1 (A) 8 0.76 0.18 1.34 0.51 -0.07 1.09 26028 1 (A) 9 0.25 -0.07 0.58 0.07 -0.26 0.39 26026 1 (A) 10 -0.29 -0.59 0.02 -0.35 -0.65 -0.04 26054 1 (B) 1 0.14 -0.59 0.87 0.02 -0.69 0.72 26057 1 (B) 2 0.10 -0.27 0.46 0.15 -0.21 0.51 26058 1 (B) 3 1.33 0.95 1.71 B+ 1.19 0.81 1.56 B+ 26055 1 (B) 4 0.86 0.51 1.21 1.15 0.80 1.51 B+ 25959 NR NR -0.92 -1.41 -0.43 -0.87 -1.35 -0.39 25965 NR NR -0.56 -1.17 0.04 -0.53 -1.13 0.06 25967 NR NR 0.22 -0.09 0.53 0.21 -0.10 0.52 25964 NR NR -0.38 -0.73 -0.03 -1.03 -1.37 -0.69 B- 25960 NR NR -0.69 -1.29 -0.09 -0.83 -1.41 -0.24 25961 NR NR -0.03 -0.41 0.36 -0.03 -0.41 0.35 26469 NR NR -0.54 -0.94 -0.14 -0.73 -1.12 -0.33 25963 NR NR 0.35 0.01 0.68 0.25 -0.08 0.58 25966 NR NR -0.34 -0.66 -0.02 -0.32 -0.64 -0.01 25962 NR NR -0.19 -0.59 0.21 -0.32 -0.72 0.08 26031 NR NR 1.09 0.64 1.55 B+ 0.72 0.26 1.18 26033 NR NR 0.13 -0.21 0.46 -0.05 -0.39 0.29 26030 NR NR 0.48 0.16 0.80 0.50 0.18 0.82 26032 NR NR 0.39 -0.07 0.85 0.53 0.07 0.99
Note. B = moderate DIF; C = large DIF; - = favouring female students; + = favouring male students; NR = not released. Table 7.1.28b Gender-Based DIF Statistics for Open-Response Items: Junior Reading (French)
Item Code Booklet
(Section) Sequence
Sample 1 Sample 2 Effect Size p-Value DIF Level Effect Size p-Value DIF Level
26034 1 (A) 5 -0.11 0.00 -0.10 0.02 26035 1 (A) 6 -0.03 0.48 -0.04 0.11 26023 1 (A) 11 -0.04 0.13 -0.05 0.22 26022 1 (A) 12 -0.12 0.00 -0.12 0.00 26052 1 (B) 5 -0.05 0.21 -0.02 0.77 26053 1 (B) 6 -0.07 0.12 -0.06 0.03 25958 NR NR -0.14 0.00 -0.12 0.00 25957 NR NR -0.13 0.00 -0.08 0.00 26029 NR NR -0.07 0.01 -0.02 0.06 26027 NR NR -0.02 0.48 -0.03 0.80
Note. B = moderate DIF; C = large DIF; - = favouring female students; + = favouring male students; NR = not released.

123
Table 7.1.29a SLL-Based DIF Statistics for Multiple-Choice Items: Primary Reading (English)
Item Code Booklet
(Section) Sequence
Sample 1 Sample 2
Δ LowerLimit
UpperLimit
DIF Level
Δ Lower Limit
UpperLimit
DIF Level
25709 1 (A) 1 0.30 -0.07 0.68 0.56 0.18 0.94 26261 1 (A) 2 0.10 -0.39 0.59 -0.34 -0.83 0.15 25712 1 (A) 3 0.76 0.29 1.23 -0.02 -0.48 0.44 25707 1 (A) 4 0.02 -0.41 0.45 0.06 -0.38 0.49 26268 1 (A) 7 -0.52 -0.84 -0.20 -0.41 -0.72 -0.10 25800 1 (A) 8 0.93 0.61 1.24 1.07 0.74 1.39 B+ 25799 1 (A) 9 0.00 -0.31 0.32 -0.16 -0.47 0.16 26269 1 (A) 10 0.02 -0.33 0.37 -0.08 -0.43 0.28 25788 1 (B) 1 0.13 -0.19 0.46 0.36 0.03 0.69 26265 1 (B) 2 0.42 0.11 0.73 0.55 0.24 0.86 25789 1 (B) 3 0.48 0.15 0.80 0.31 -0.01 0.63 26264 1 (B) 4 0.27 -0.04 0.59 0.37 0.05 0.68 25631 NR NR 0.37 -0.03 0.76 0.01 -0.39 0.41 25633 NR NR 0.79 0.43 1.14 0.99 0.64 1.35 25664 NR NR 0.64 0.33 0.96 0.67 0.36 0.99 25663 NR NR 0.07 -0.26 0.40 0.02 -0.31 0.35 25667 NR NR 0.38 0.02 0.73 0.84 0.48 1.21 25637 NR NR -0.27 -0.63 0.09 0.08 -0.28 0.44 25634 NR NR -0.22 -0.52 0.08 -0.26 -0.56 0.04 25661 NR NR 0.13 -0.23 0.49 0.33 -0.04 0.71 25665 NR NR 0.66 0.35 0.98 0.74 0.42 1.06 25635 NR NR 0.11 -0.20 0.43 0.28 -0.03 0.60 25839 NR NR -0.20 -0.58 0.18 0.02 -0.36 0.40 26278 NR NR 0.25 -0.08 0.59 0.04 -0.29 0.37 25835 NR NR -0.20 -0.51 0.11 -0.27 -0.58 0.04 25837 NR NR 0.16 -0.16 0.49 -0.26 -0.59 0.07
Note. B = moderate DIF; C = large DIF; - = favouring SLLs; + = favouring non-SLLs; NR = not released. Table 7.1.29b SLL-Based DIF Statistics for Open-Response Items: Primary Reading (English)
Item Code Booklet
(Section) Sequence
Sample 1 Sample 2 Effect Size p-Value DIF Level Effect Size p-Value DIF Level
25720 1 (A) 5 -0.03 0.10 -0.05 0.29 25715 1 (A) 6 0.02 0.44 0.00 0.12 25802 1 (A) 11 -0.04 0.12 -0.03 0.15 25803 1 (A) 12 0.09 0.00 0.09 0.00 25790 1 (B) 5 -0.12 0.00 -0.10 0.00 25791 1 (B) 6 0.01 0.75 -0.01 0.67 26253 NR NR -0.13 0.00 -0.09 0.01 25670 NR NR -0.06 0.00 -0.07 0.00 25842 NR NR -0.08 0.03 -0.04 0.28 25840 NR NR -0.11 0.00 -0.09 0.01
Note. B = moderate DIF; C = large DIF; - = favouring SLLs; + = favouring non-SLLs; NR = not released.
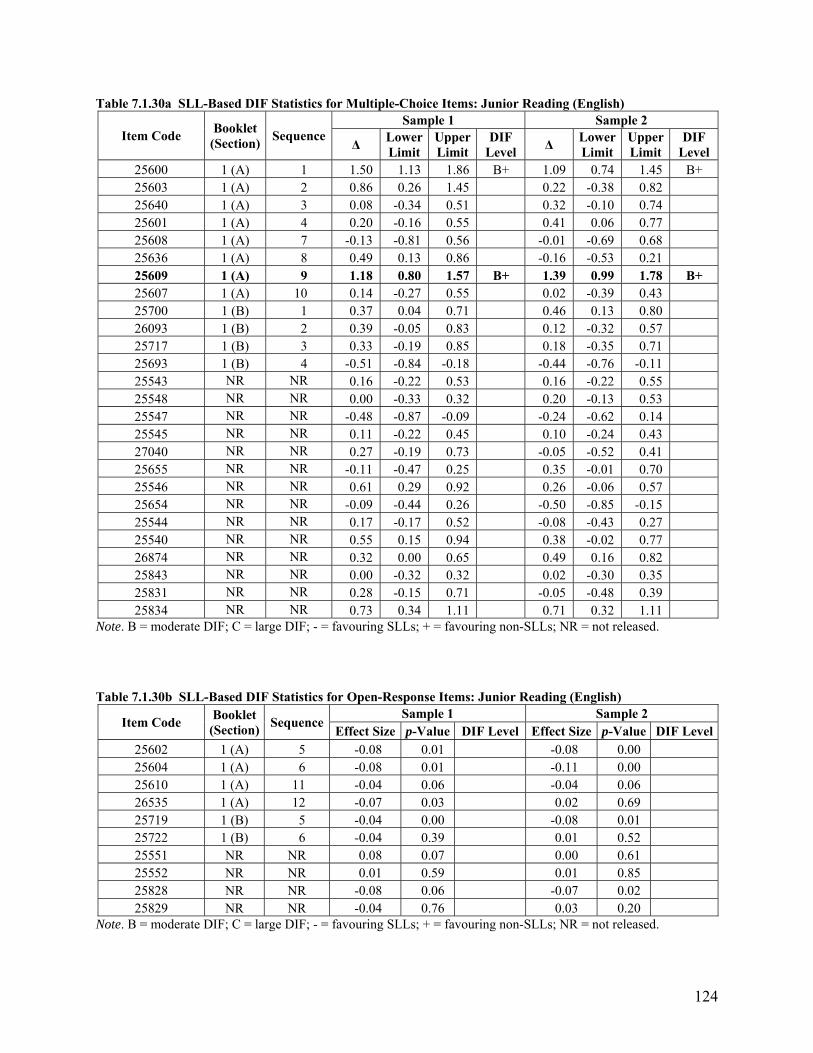
124
Table 7.1.30a SLL-Based DIF Statistics for Multiple-Choice Items: Junior Reading (English)
Item Code Booklet
(Section) Sequence
Sample 1 Sample 2
Δ LowerLimit
UpperLimit
DIF Level
Δ Lower Limit
UpperLimit
DIF Level
25600 1 (A) 1 1.50 1.13 1.86 B+ 1.09 0.74 1.45 B+ 25603 1 (A) 2 0.86 0.26 1.45 0.22 -0.38 0.82 25640 1 (A) 3 0.08 -0.34 0.51 0.32 -0.10 0.74 25601 1 (A) 4 0.20 -0.16 0.55 0.41 0.06 0.77 25608 1 (A) 7 -0.13 -0.81 0.56 -0.01 -0.69 0.68 25636 1 (A) 8 0.49 0.13 0.86 -0.16 -0.53 0.21 25609 1 (A) 9 1.18 0.80 1.57 B+ 1.39 0.99 1.78 B+ 25607 1 (A) 10 0.14 -0.27 0.55 0.02 -0.39 0.43 25700 1 (B) 1 0.37 0.04 0.71 0.46 0.13 0.80 26093 1 (B) 2 0.39 -0.05 0.83 0.12 -0.32 0.57 25717 1 (B) 3 0.33 -0.19 0.85 0.18 -0.35 0.71 25693 1 (B) 4 -0.51 -0.84 -0.18 -0.44 -0.76 -0.11 25543 NR NR 0.16 -0.22 0.53 0.16 -0.22 0.55 25548 NR NR 0.00 -0.33 0.32 0.20 -0.13 0.53 25547 NR NR -0.48 -0.87 -0.09 -0.24 -0.62 0.14 25545 NR NR 0.11 -0.22 0.45 0.10 -0.24 0.43 27040 NR NR 0.27 -0.19 0.73 -0.05 -0.52 0.41 25655 NR NR -0.11 -0.47 0.25 0.35 -0.01 0.70 25546 NR NR 0.61 0.29 0.92 0.26 -0.06 0.57 25654 NR NR -0.09 -0.44 0.26 -0.50 -0.85 -0.15 25544 NR NR 0.17 -0.17 0.52 -0.08 -0.43 0.27 25540 NR NR 0.55 0.15 0.94 0.38 -0.02 0.77 26874 NR NR 0.32 0.00 0.65 0.49 0.16 0.82 25843 NR NR 0.00 -0.32 0.32 0.02 -0.30 0.35 25831 NR NR 0.28 -0.15 0.71 -0.05 -0.48 0.39 25834 NR NR 0.73 0.34 1.11 0.71 0.32 1.11
Note. B = moderate DIF; C = large DIF; - = favouring SLLs; + = favouring non-SLLs; NR = not released. Table 7.1.30b SLL-Based DIF Statistics for Open-Response Items: Junior Reading (English)
Item Code Booklet
(Section) Sequence
Sample 1 Sample 2 Effect Size p-Value DIF Level Effect Size p-Value DIF Level
25602 1 (A) 5 -0.08 0.01 -0.08 0.00 25604 1 (A) 6 -0.08 0.01 -0.11 0.00 25610 1 (A) 11 -0.04 0.06 -0.04 0.06 26535 1 (A) 12 -0.07 0.03 0.02 0.69 25719 1 (B) 5 -0.04 0.00 -0.08 0.01 25722 1 (B) 6 -0.04 0.39 0.01 0.52 25551 NR NR 0.08 0.07 0.00 0.61 25552 NR NR 0.01 0.59 0.01 0.85 25828 NR NR -0.08 0.06 -0.07 0.02 25829 NR NR -0.04 0.76 0.03 0.20
Note. B = moderate DIF; C = large DIF; - = favouring SLLs; + = favouring non-SLLs; NR = not released.
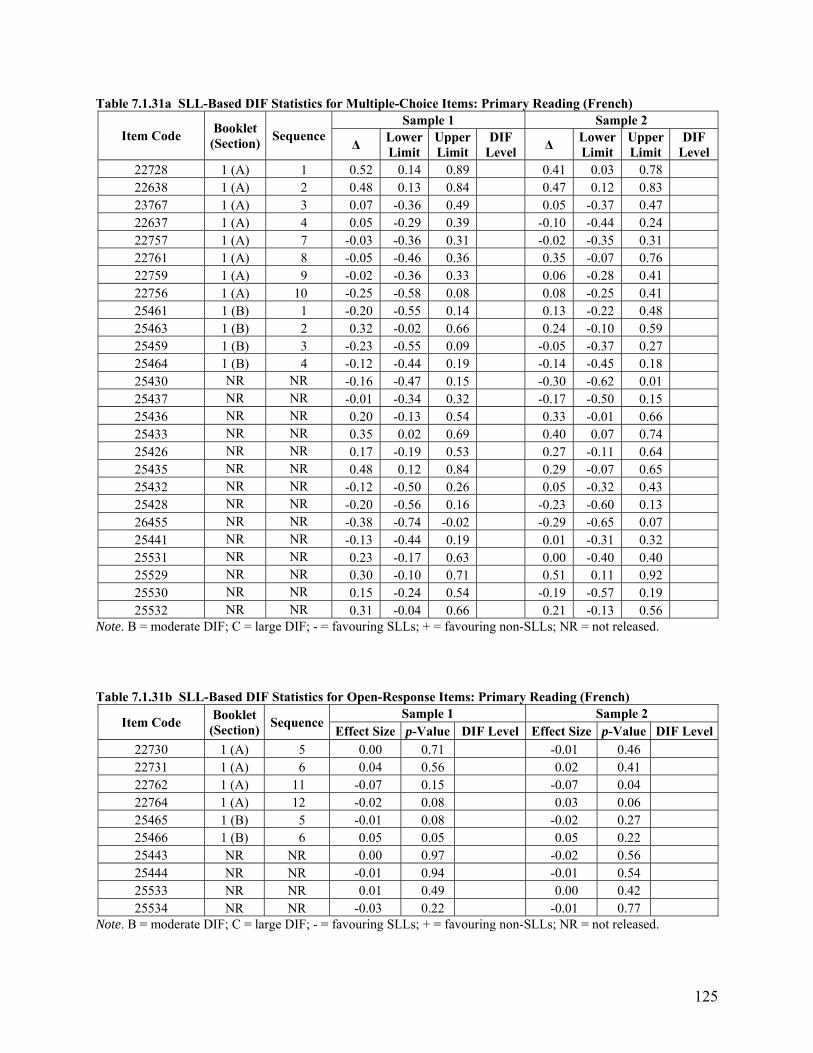
125
Table 7.1.31a SLL-Based DIF Statistics for Multiple-Choice Items: Primary Reading (French)
Item Code Booklet
(Section) Sequence
Sample 1 Sample 2
Δ LowerLimit
UpperLimit
DIF Level
Δ Lower Limit
UpperLimit
DIF Level
22728 1 (A) 1 0.52 0.14 0.89 0.41 0.03 0.78 22638 1 (A) 2 0.48 0.13 0.84 0.47 0.12 0.83 23767 1 (A) 3 0.07 -0.36 0.49 0.05 -0.37 0.47 22637 1 (A) 4 0.05 -0.29 0.39 -0.10 -0.44 0.24 22757 1 (A) 7 -0.03 -0.36 0.31 -0.02 -0.35 0.31 22761 1 (A) 8 -0.05 -0.46 0.36 0.35 -0.07 0.76 22759 1 (A) 9 -0.02 -0.36 0.33 0.06 -0.28 0.41 22756 1 (A) 10 -0.25 -0.58 0.08 0.08 -0.25 0.41 25461 1 (B) 1 -0.20 -0.55 0.14 0.13 -0.22 0.48 25463 1 (B) 2 0.32 -0.02 0.66 0.24 -0.10 0.59 25459 1 (B) 3 -0.23 -0.55 0.09 -0.05 -0.37 0.27 25464 1 (B) 4 -0.12 -0.44 0.19 -0.14 -0.45 0.18 25430 NR NR -0.16 -0.47 0.15 -0.30 -0.62 0.01 25437 NR NR -0.01 -0.34 0.32 -0.17 -0.50 0.15 25436 NR NR 0.20 -0.13 0.54 0.33 -0.01 0.66 25433 NR NR 0.35 0.02 0.69 0.40 0.07 0.74 25426 NR NR 0.17 -0.19 0.53 0.27 -0.11 0.64 25435 NR NR 0.48 0.12 0.84 0.29 -0.07 0.65 25432 NR NR -0.12 -0.50 0.26 0.05 -0.32 0.43 25428 NR NR -0.20 -0.56 0.16 -0.23 -0.60 0.13 26455 NR NR -0.38 -0.74 -0.02 -0.29 -0.65 0.07 25441 NR NR -0.13 -0.44 0.19 0.01 -0.31 0.32 25531 NR NR 0.23 -0.17 0.63 0.00 -0.40 0.40 25529 NR NR 0.30 -0.10 0.71 0.51 0.11 0.92 25530 NR NR 0.15 -0.24 0.54 -0.19 -0.57 0.19 25532 NR NR 0.31 -0.04 0.66 0.21 -0.13 0.56
Note. B = moderate DIF; C = large DIF; - = favouring SLLs; + = favouring non-SLLs; NR = not released. Table 7.1.31b SLL-Based DIF Statistics for Open-Response Items: Primary Reading (French)
Item Code Booklet
(Section) Sequence
Sample 1 Sample 2 Effect Size p-Value DIF Level Effect Size p-Value DIF Level
22730 1 (A) 5 0.00 0.71 -0.01 0.46 22731 1 (A) 6 0.04 0.56 0.02 0.41 22762 1 (A) 11 -0.07 0.15 -0.07 0.04 22764 1 (A) 12 -0.02 0.08 0.03 0.06 25465 1 (B) 5 -0.01 0.08 -0.02 0.27 25466 1 (B) 6 0.05 0.05 0.05 0.22 25443 NR NR 0.00 0.97 -0.02 0.56 25444 NR NR -0.01 0.94 -0.01 0.54 25533 NR NR 0.01 0.49 0.00 0.42 25534 NR NR -0.03 0.22 -0.01 0.77
Note. B = moderate DIF; C = large DIF; - = favouring SLLs; + = favouring non-SLLs; NR = not released.
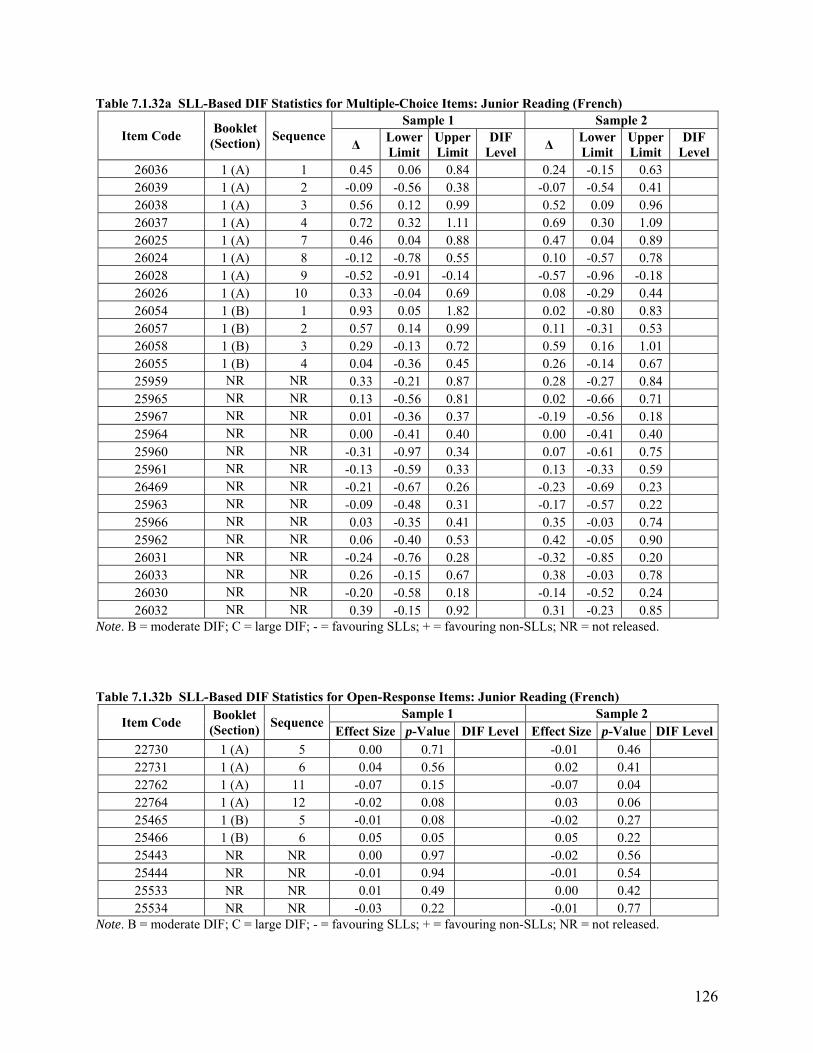
126
Table 7.1.32a SLL-Based DIF Statistics for Multiple-Choice Items: Junior Reading (French)
Item Code Booklet
(Section) Sequence
Sample 1 Sample 2
Δ LowerLimit
UpperLimit
DIF Level
Δ Lower Limit
UpperLimit
DIF Level
26036 1 (A) 1 0.45 0.06 0.84 0.24 -0.15 0.63 26039 1 (A) 2 -0.09 -0.56 0.38 -0.07 -0.54 0.41 26038 1 (A) 3 0.56 0.12 0.99 0.52 0.09 0.96 26037 1 (A) 4 0.72 0.32 1.11 0.69 0.30 1.09 26025 1 (A) 7 0.46 0.04 0.88 0.47 0.04 0.89 26024 1 (A) 8 -0.12 -0.78 0.55 0.10 -0.57 0.78 26028 1 (A) 9 -0.52 -0.91 -0.14 -0.57 -0.96 -0.18 26026 1 (A) 10 0.33 -0.04 0.69 0.08 -0.29 0.44 26054 1 (B) 1 0.93 0.05 1.82 0.02 -0.80 0.83 26057 1 (B) 2 0.57 0.14 0.99 0.11 -0.31 0.53 26058 1 (B) 3 0.29 -0.13 0.72 0.59 0.16 1.01 26055 1 (B) 4 0.04 -0.36 0.45 0.26 -0.14 0.67 25959 NR NR 0.33 -0.21 0.87 0.28 -0.27 0.84 25965 NR NR 0.13 -0.56 0.81 0.02 -0.66 0.71 25967 NR NR 0.01 -0.36 0.37 -0.19 -0.56 0.18 25964 NR NR 0.00 -0.41 0.40 0.00 -0.41 0.40 25960 NR NR -0.31 -0.97 0.34 0.07 -0.61 0.75 25961 NR NR -0.13 -0.59 0.33 0.13 -0.33 0.59 26469 NR NR -0.21 -0.67 0.26 -0.23 -0.69 0.23 25963 NR NR -0.09 -0.48 0.31 -0.17 -0.57 0.22 25966 NR NR 0.03 -0.35 0.41 0.35 -0.03 0.74 25962 NR NR 0.06 -0.40 0.53 0.42 -0.05 0.90 26031 NR NR -0.24 -0.76 0.28 -0.32 -0.85 0.20 26033 NR NR 0.26 -0.15 0.67 0.38 -0.03 0.78 26030 NR NR -0.20 -0.58 0.18 -0.14 -0.52 0.24 26032 NR NR 0.39 -0.15 0.92 0.31 -0.23 0.85
Note. B = moderate DIF; C = large DIF; - = favouring SLLs; + = favouring non-SLLs; NR = not released. Table 7.1.32b SLL-Based DIF Statistics for Open-Response Items: Junior Reading (French)
Item Code Booklet
(Section) Sequence
Sample 1 Sample 2 Effect Size p-Value DIF Level Effect Size p-Value DIF Level
22730 1 (A) 5 0.00 0.71 -0.01 0.46 22731 1 (A) 6 0.04 0.56 0.02 0.41 22762 1 (A) 11 -0.07 0.15 -0.07 0.04 22764 1 (A) 12 -0.02 0.08 0.03 0.06 25465 1 (B) 5 -0.01 0.08 -0.02 0.27 25466 1 (B) 6 0.05 0.05 0.05 0.22 25443 NR NR 0.00 0.97 -0.02 0.56 25444 NR NR -0.01 0.94 -0.01 0.54 25533 NR NR 0.01 0.49 0.00 0.42 25534 NR NR -0.03 0.22 -0.01 0.77
Note. B = moderate DIF; C = large DIF; - = favouring SLLs; + = favouring non-SLLs; NR = not released.
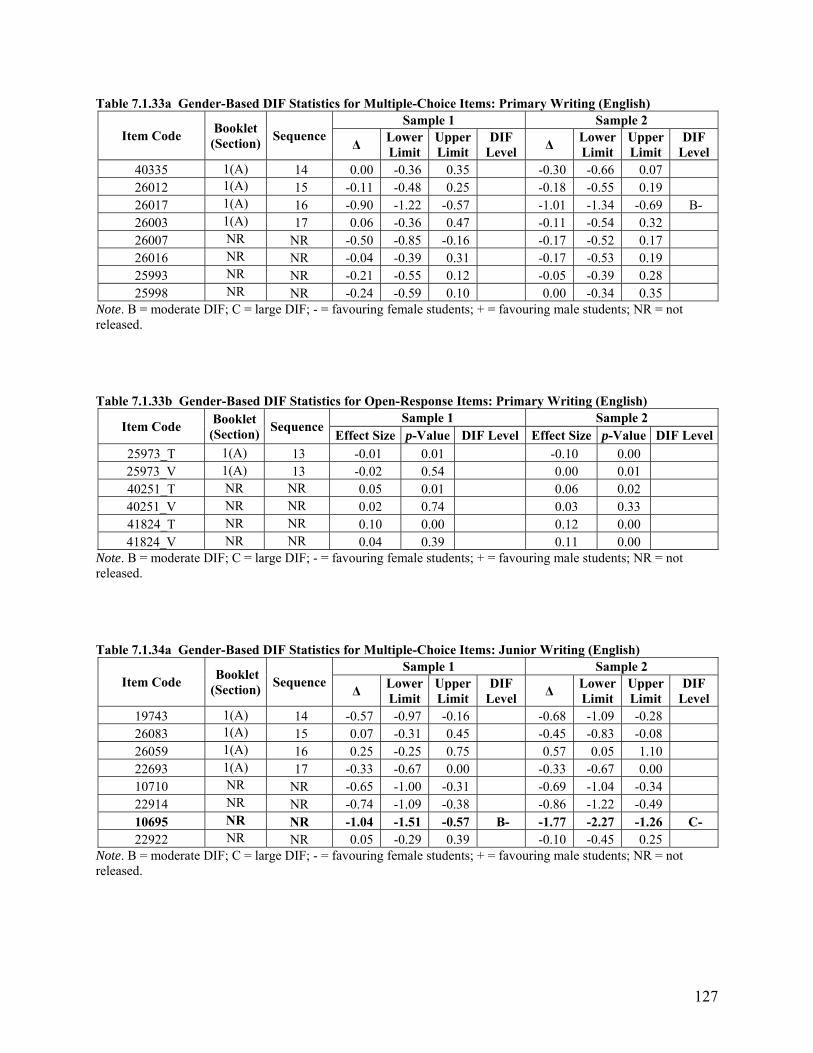
127
Table 7.1.33a Gender-Based DIF Statistics for Multiple-Choice Items: Primary Writing (English)
Item Code Booklet (Section)
Sequence Sample 1 Sample 2
Δ LowerLimit
UpperLimit
DIF Level
Δ Lower Limit
UpperLimit
DIF Level
40335 1(A) 14 0.00 -0.36 0.35 -0.30 -0.66 0.07 26012 1(A) 15 -0.11 -0.48 0.25 -0.18 -0.55 0.19 26017 1(A) 16 -0.90 -1.22 -0.57 -1.01 -1.34 -0.69 B- 26003 1(A) 17 0.06 -0.36 0.47 -0.11 -0.54 0.32 26007 NR NR -0.50 -0.85 -0.16 -0.17 -0.52 0.17 26016 NR NR -0.04 -0.39 0.31 -0.17 -0.53 0.19 25993 NR NR -0.21 -0.55 0.12 -0.05 -0.39 0.28 25998 NR NR -0.24 -0.59 0.10 0.00 -0.34 0.35
Note. B = moderate DIF; C = large DIF; - = favouring female students; + = favouring male students; NR = not released.
Table 7.1.33b Gender-Based DIF Statistics for Open-Response Items: Primary Writing (English)
Item Code Booklet
(Section) Sequence
Sample 1 Sample 2 Effect Size p-Value DIF Level Effect Size p-Value DIF Level
25973_T 1(A) 13 -0.01 0.01 -0.10 0.00 25973_V 1(A) 13 -0.02 0.54 0.00 0.01 40251_T NR NR 0.05 0.01 0.06 0.02 40251_V NR NR 0.02 0.74 0.03 0.33 41824_T NR NR 0.10 0.00 0.12 0.00 41824_V NR NR 0.04 0.39 0.11 0.00
Note. B = moderate DIF; C = large DIF; - = favouring female students; + = favouring male students; NR = not released. Table 7.1.34a Gender-Based DIF Statistics for Multiple-Choice Items: Junior Writing (English)
Item Code Booklet (Section)
Sequence Sample 1 Sample 2
Δ LowerLimit
UpperLimit
DIF Level
Δ Lower Limit
UpperLimit
DIF Level
19743 1(A) 14 -0.57 -0.97 -0.16 -0.68 -1.09 -0.28 26083 1(A) 15 0.07 -0.31 0.45 -0.45 -0.83 -0.08 26059 1(A) 16 0.25 -0.25 0.75 0.57 0.05 1.10 22693 1(A) 17 -0.33 -0.67 0.00 -0.33 -0.67 0.00 10710 NR NR -0.65 -1.00 -0.31 -0.69 -1.04 -0.34 22914 NR NR -0.74 -1.09 -0.38 -0.86 -1.22 -0.49 10695 NR NR -1.04 -1.51 -0.57 B- -1.77 -2.27 -1.26 C- 22922 NR NR 0.05 -0.29 0.39 -0.10 -0.45 0.25
Note. B = moderate DIF; C = large DIF; - = favouring female students; + = favouring male students; NR = not released.
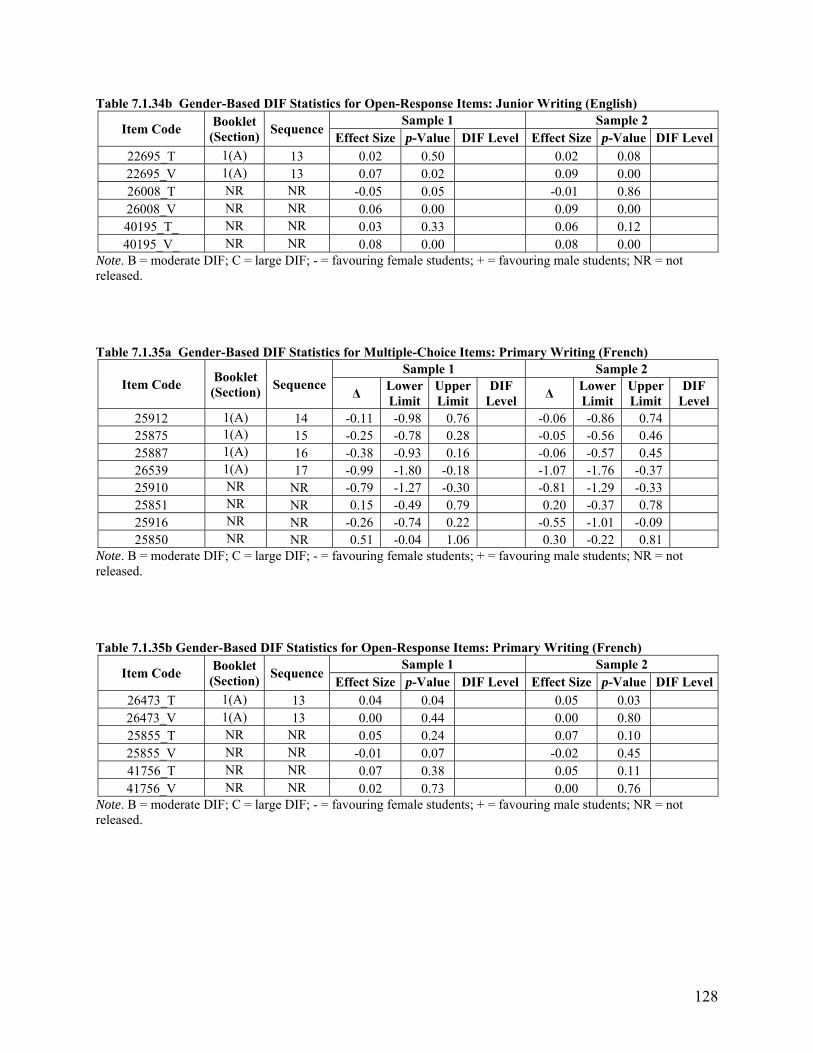
128
Table 7.1.34b Gender-Based DIF Statistics for Open-Response Items: Junior Writing (English)
Item Code Booklet
(Section) Sequence
Sample 1 Sample 2 Effect Size p-Value DIF Level Effect Size p-Value DIF Level
22695_T 1(A) 13 0.02 0.50 0.02 0.08 22695_V 1(A) 13 0.07 0.02 0.09 0.00 26008_T NR NR -0.05 0.05 -0.01 0.86 26008_V NR NR 0.06 0.00 0.09 0.00 40195_T_ NR NR 0.03 0.33 0.06 0.12 40195_V_ NR NR 0.08 0.00 0.08 0.00
Note. B = moderate DIF; C = large DIF; - = favouring female students; + = favouring male students; NR = not released. Table 7.1.35a Gender-Based DIF Statistics for Multiple-Choice Items: Primary Writing (French)
Item Code Booklet (Section)
Sequence Sample 1 Sample 2
Δ LowerLimit
UpperLimit
DIF Level
Δ Lower Limit
UpperLimit
DIF Level
25912 1(A) 14 -0.11 -0.98 0.76 -0.06 -0.86 0.74 25875 1(A) 15 -0.25 -0.78 0.28 -0.05 -0.56 0.46 25887 1(A) 16 -0.38 -0.93 0.16 -0.06 -0.57 0.45 26539 1(A) 17 -0.99 -1.80 -0.18 -1.07 -1.76 -0.37 25910 NR NR -0.79 -1.27 -0.30 -0.81 -1.29 -0.33 25851 NR NR 0.15 -0.49 0.79 0.20 -0.37 0.78 25916 NR NR -0.26 -0.74 0.22 -0.55 -1.01 -0.09 25850 NR NR 0.51 -0.04 1.06 0.30 -0.22 0.81
Note. B = moderate DIF; C = large DIF; - = favouring female students; + = favouring male students; NR = not released. Table 7.1.35b Gender-Based DIF Statistics for Open-Response Items: Primary Writing (French)
Item Code Booklet
(Section) Sequence
Sample 1 Sample 2 Effect Size p-Value DIF Level Effect Size p-Value DIF Level
26473_T 1(A) 13 0.04 0.04 0.05 0.03 26473_V 1(A) 13 0.00 0.44 0.00 0.80 25855_T NR NR 0.05 0.24 0.07 0.10 25855_V NR NR -0.01 0.07 -0.02 0.45 41756_T NR NR 0.07 0.38 0.05 0.11 41756_V NR NR 0.02 0.73 0.00 0.76
Note. B = moderate DIF; C = large DIF; - = favouring female students; + = favouring male students; NR = not released.
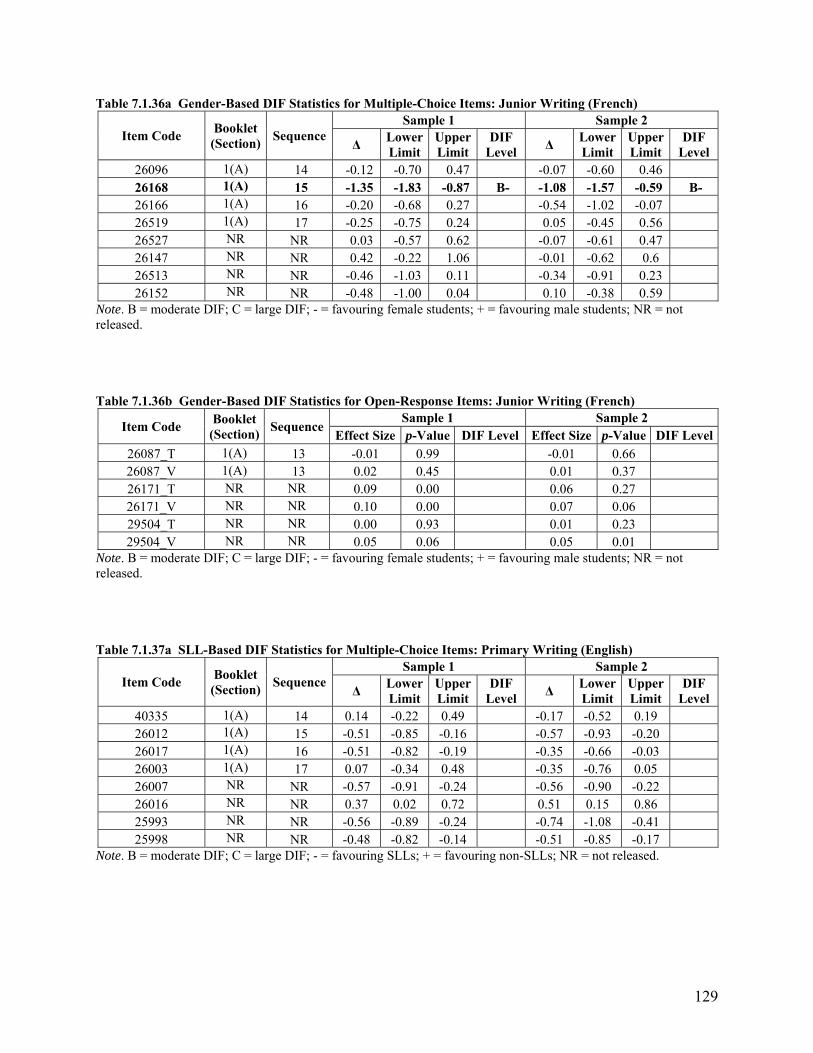
129
Table 7.1.36a Gender-Based DIF Statistics for Multiple-Choice Items: Junior Writing (French)
Item Code Booklet (Section)
Sequence Sample 1 Sample 2
Δ LowerLimit
UpperLimit
DIF Level
Δ Lower Limit
UpperLimit
DIF Level
26096 1(A) 14 -0.12 -0.70 0.47 -0.07 -0.60 0.46 26168 1(A) 15 -1.35 -1.83 -0.87 B- -1.08 -1.57 -0.59 B- 26166 1(A) 16 -0.20 -0.68 0.27 -0.54 -1.02 -0.07 26519 1(A) 17 -0.25 -0.75 0.24 0.05 -0.45 0.56 26527 NR NR 0.03 -0.57 0.62 -0.07 -0.61 0.47 26147 NR NR 0.42 -0.22 1.06 -0.01 -0.62 0.6 26513 NR NR -0.46 -1.03 0.11 -0.34 -0.91 0.23 26152 NR NR -0.48 -1.00 0.04 0.10 -0.38 0.59
Note. B = moderate DIF; C = large DIF; - = favouring female students; + = favouring male students; NR = not released. Table 7.1.36b Gender-Based DIF Statistics for Open-Response Items: Junior Writing (French)
Item Code Booklet
(Section) Sequence
Sample 1 Sample 2 Effect Size p-Value DIF Level Effect Size p-Value DIF Level
26087_T 1(A) 13 -0.01 0.99 -0.01 0.66 26087_V 1(A) 13 0.02 0.45 0.01 0.37 26171_T NR NR 0.09 0.00 0.06 0.27 26171_V NR NR 0.10 0.00 0.07 0.06 29504_T NR NR 0.00 0.93 0.01 0.23 29504_V NR NR 0.05 0.06 0.05 0.01
Note. B = moderate DIF; C = large DIF; - = favouring female students; + = favouring male students; NR = not released. Table 7.1.37a SLL-Based DIF Statistics for Multiple-Choice Items: Primary Writing (English)
Item Code Booklet (Section)
Sequence Sample 1 Sample 2
Δ LowerLimit
UpperLimit
DIF Level
Δ Lower Limit
UpperLimit
DIF Level
40335 1(A) 14 0.14 -0.22 0.49 -0.17 -0.52 0.19 26012 1(A) 15 -0.51 -0.85 -0.16 -0.57 -0.93 -0.20 26017 1(A) 16 -0.51 -0.82 -0.19 -0.35 -0.66 -0.03 26003 1(A) 17 0.07 -0.34 0.48 -0.35 -0.76 0.05 26007 NR NR -0.57 -0.91 -0.24 -0.56 -0.90 -0.22 26016 NR NR 0.37 0.02 0.72 0.51 0.15 0.86 25993 NR NR -0.56 -0.89 -0.24 -0.74 -1.08 -0.41 25998 NR NR -0.48 -0.82 -0.14 -0.51 -0.85 -0.17
Note. B = moderate DIF; C = large DIF; - = favouring SLLs; + = favouring non-SLLs; NR = not released.
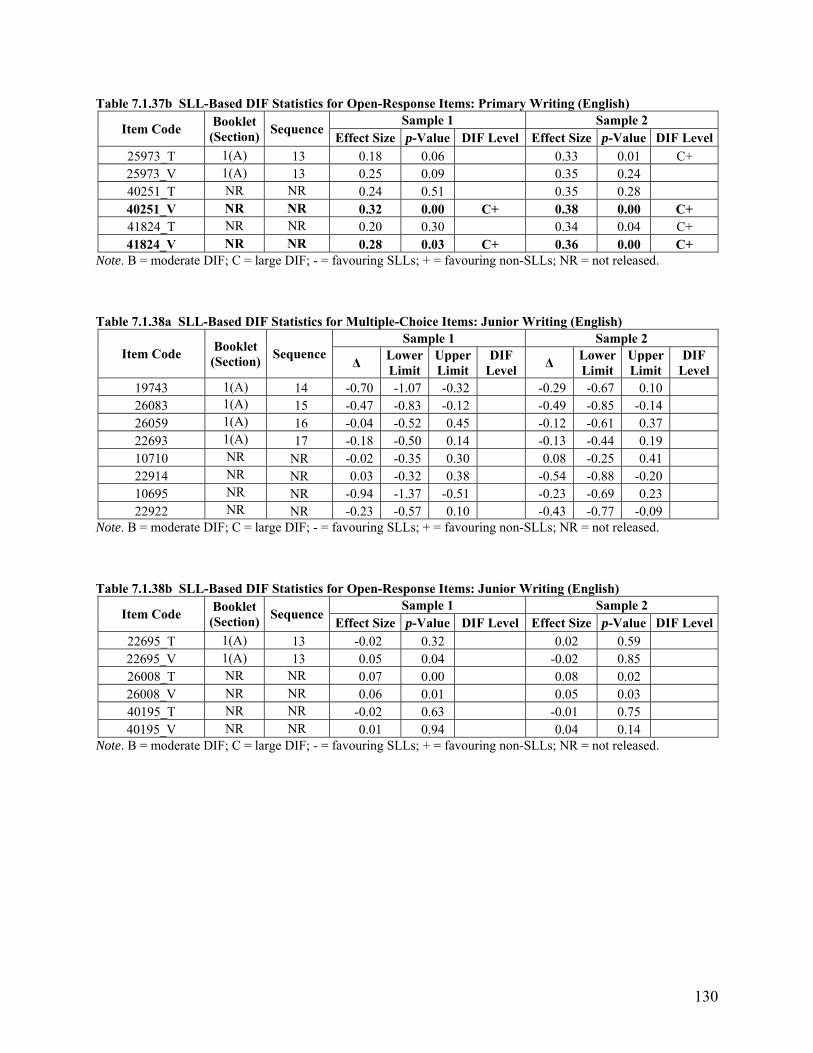
130
Table 7.1.37b SLL-Based DIF Statistics for Open-Response Items: Primary Writing (English)
Item Code Booklet
(Section) Sequence
Sample 1 Sample 2 Effect Size p-Value DIF Level Effect Size p-Value DIF Level
25973_T 1(A) 13 0.18 0.06 0.33 0.01 C+ 25973_V 1(A) 13 0.25 0.09 0.35 0.24 40251_T NR NR 0.24 0.51 0.35 0.28 40251_V NR NR 0.32 0.00 C+ 0.38 0.00 C+ 41824_T NR NR 0.20 0.30 0.34 0.04 C+ 41824_V NR NR 0.28 0.03 C+ 0.36 0.00 C+
Note. B = moderate DIF; C = large DIF; - = favouring SLLs; + = favouring non-SLLs; NR = not released. Table 7.1.38a SLL-Based DIF Statistics for Multiple-Choice Items: Junior Writing (English)
Item Code Booklet (Section)
Sequence Sample 1 Sample 2
Δ LowerLimit
UpperLimit
DIF Level
Δ Lower Limit
UpperLimit
DIF Level
19743 1(A) 14 -0.70 -1.07 -0.32 -0.29 -0.67 0.10 26083 1(A) 15 -0.47 -0.83 -0.12 -0.49 -0.85 -0.14 26059 1(A) 16 -0.04 -0.52 0.45 -0.12 -0.61 0.37 22693 1(A) 17 -0.18 -0.50 0.14 -0.13 -0.44 0.19 10710 NR NR -0.02 -0.35 0.30 0.08 -0.25 0.41 22914 NR NR 0.03 -0.32 0.38 -0.54 -0.88 -0.20 10695 NR NR -0.94 -1.37 -0.51 -0.23 -0.69 0.23 22922 NR NR -0.23 -0.57 0.10 -0.43 -0.77 -0.09
Note. B = moderate DIF; C = large DIF; - = favouring SLLs; + = favouring non-SLLs; NR = not released. Table 7.1.38b SLL-Based DIF Statistics for Open-Response Items: Junior Writing (English)
Item Code Booklet
(Section) Sequence
Sample 1 Sample 2 Effect Size p-Value DIF Level Effect Size p-Value DIF Level
22695_T 1(A) 13 -0.02 0.32 0.02 0.59 22695_V 1(A) 13 0.05 0.04 -0.02 0.85 26008_T NR NR 0.07 0.00 0.08 0.02 26008_V NR NR 0.06 0.01 0.05 0.03 40195_T NR NR -0.02 0.63 -0.01 0.75 40195_V NR NR 0.01 0.94 0.04 0.14
Note. B = moderate DIF; C = large DIF; - = favouring SLLs; + = favouring non-SLLs; NR = not released.
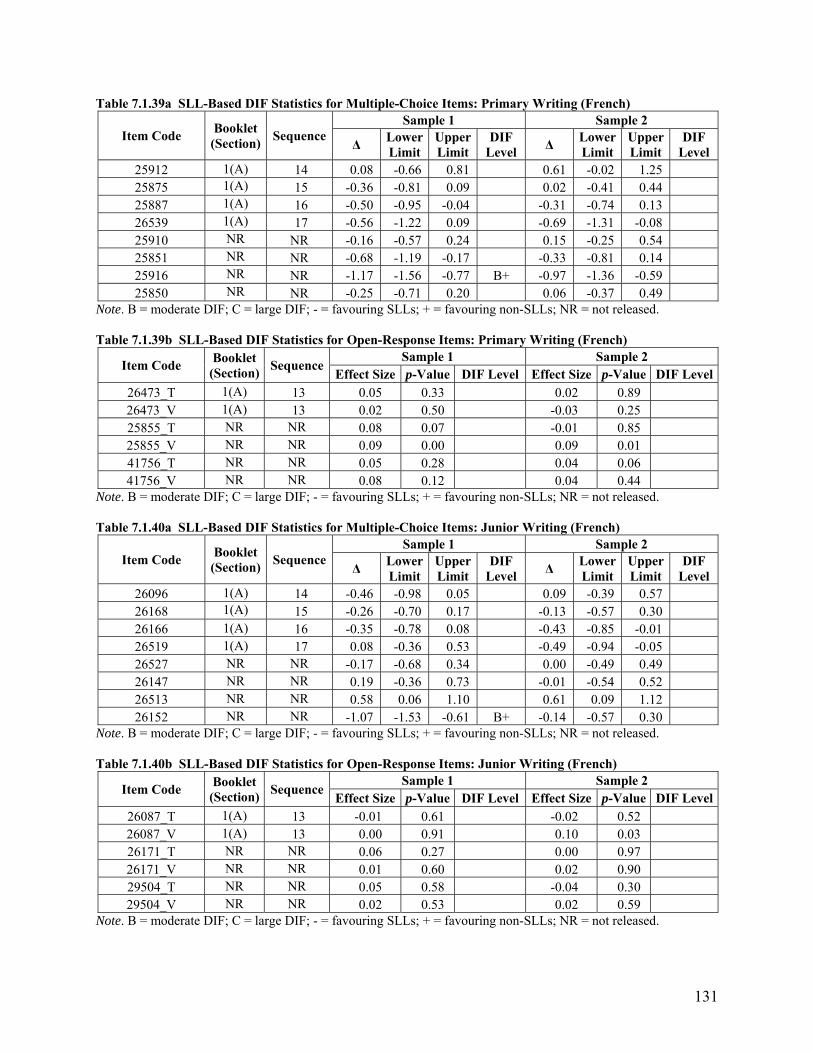
131
Table 7.1.39a SLL-Based DIF Statistics for Multiple-Choice Items: Primary Writing (French)
Item Code Booklet (Section)
Sequence Sample 1 Sample 2
Δ LowerLimit
UpperLimit
DIF Level
Δ Lower Limit
UpperLimit
DIF Level
25912 1(A) 14 0.08 -0.66 0.81 0.61 -0.02 1.25 25875 1(A) 15 -0.36 -0.81 0.09 0.02 -0.41 0.44 25887 1(A) 16 -0.50 -0.95 -0.04 -0.31 -0.74 0.13 26539 1(A) 17 -0.56 -1.22 0.09 -0.69 -1.31 -0.08 25910 NR NR -0.16 -0.57 0.24 0.15 -0.25 0.54 25851 NR NR -0.68 -1.19 -0.17 -0.33 -0.81 0.14 25916 NR NR -1.17 -1.56 -0.77 B+ -0.97 -1.36 -0.59 25850 NR NR -0.25 -0.71 0.20 0.06 -0.37 0.49
Note. B = moderate DIF; C = large DIF; - = favouring SLLs; + = favouring non-SLLs; NR = not released. Table 7.1.39b SLL-Based DIF Statistics for Open-Response Items: Primary Writing (French)
Item Code Booklet
(Section) Sequence
Sample 1 Sample 2 Effect Size p-Value DIF Level Effect Size p-Value DIF Level
26473_T 1(A) 13 0.05 0.33 0.02 0.89 26473_V 1(A) 13 0.02 0.50 -0.03 0.25 25855_T NR NR 0.08 0.07 -0.01 0.85 25855_V NR NR 0.09 0.00 0.09 0.01 41756_T NR NR 0.05 0.28 0.04 0.06 41756_V NR NR 0.08 0.12 0.04 0.44
Note. B = moderate DIF; C = large DIF; - = favouring SLLs; + = favouring non-SLLs; NR = not released. Table 7.1.40a SLL-Based DIF Statistics for Multiple-Choice Items: Junior Writing (French)
Item Code Booklet (Section)
Sequence Sample 1 Sample 2
Δ LowerLimit
UpperLimit
DIF Level
Δ Lower Limit
UpperLimit
DIF Level
26096 1(A) 14 -0.46 -0.98 0.05 0.09 -0.39 0.57 26168 1(A) 15 -0.26 -0.70 0.17 -0.13 -0.57 0.30 26166 1(A) 16 -0.35 -0.78 0.08 -0.43 -0.85 -0.01 26519 1(A) 17 0.08 -0.36 0.53 -0.49 -0.94 -0.05 26527 NR NR -0.17 -0.68 0.34 0.00 -0.49 0.49 26147 NR NR 0.19 -0.36 0.73 -0.01 -0.54 0.52 26513 NR NR 0.58 0.06 1.10 0.61 0.09 1.12 26152 NR NR -1.07 -1.53 -0.61 B+ -0.14 -0.57 0.30
Note. B = moderate DIF; C = large DIF; - = favouring SLLs; + = favouring non-SLLs; NR = not released. Table 7.1.40b SLL-Based DIF Statistics for Open-Response Items: Junior Writing (French)
Item Code Booklet
(Section) Sequence
Sample 1 Sample 2 Effect Size p-Value DIF Level Effect Size p-Value DIF Level
26087_T 1(A) 13 -0.01 0.61 -0.02 0.52 26087_V 1(A) 13 0.00 0.91 0.10 0.03 26171_T NR NR 0.06 0.27 0.00 0.97 26171_V NR NR 0.01 0.60 0.02 0.90 29504_T NR NR 0.05 0.58 -0.04 0.30 29504_V NR NR 0.02 0.53 0.02 0.59
Note. B = moderate DIF; C = large DIF; - = favouring SLLs; + = favouring non-SLLs; NR = not released.
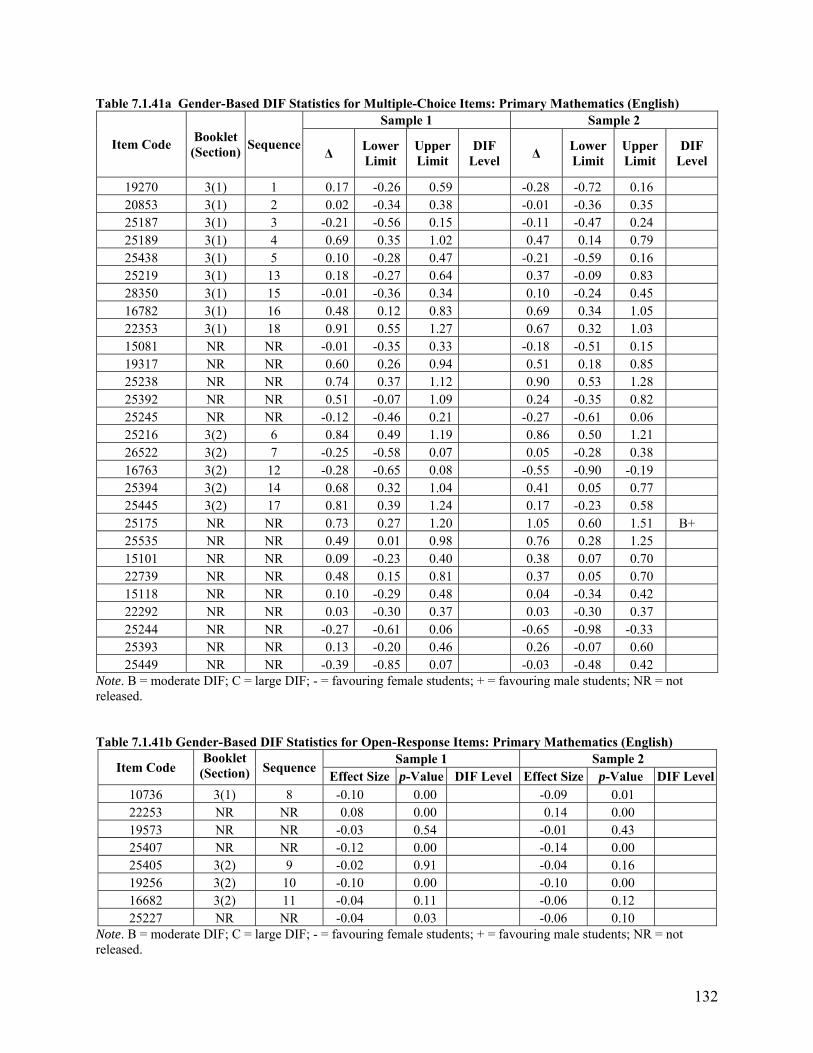
132
Table 7.1.41a Gender-Based DIF Statistics for Multiple-Choice Items: Primary Mathematics (English)
Item Code Booklet
(Section) Sequence
Sample 1 Sample 2
Δ Lower Limit
Upper Limit
DIF Level
Δ Lower Limit
Upper Limit
DIF Level
19270 3(1) 1 0.17 -0.26 0.59 -0.28 -0.72 0.16 20853 3(1) 2 0.02 -0.34 0.38 -0.01 -0.36 0.35 25187 3(1) 3 -0.21 -0.56 0.15 -0.11 -0.47 0.24 25189 3(1) 4 0.69 0.35 1.02 0.47 0.14 0.79 25438 3(1) 5 0.10 -0.28 0.47 -0.21 -0.59 0.16 25219 3(1) 13 0.18 -0.27 0.64 0.37 -0.09 0.83 28350 3(1) 15 -0.01 -0.36 0.34 0.10 -0.24 0.45 16782 3(1) 16 0.48 0.12 0.83 0.69 0.34 1.05 22353 3(1) 18 0.91 0.55 1.27 0.67 0.32 1.03 15081 NR NR -0.01 -0.35 0.33 -0.18 -0.51 0.15 19317 NR NR 0.60 0.26 0.94 0.51 0.18 0.85 25238 NR NR 0.74 0.37 1.12 0.90 0.53 1.28 25392 NR NR 0.51 -0.07 1.09 0.24 -0.35 0.82 25245 NR NR -0.12 -0.46 0.21 -0.27 -0.61 0.06 25216 3(2) 6 0.84 0.49 1.19 0.86 0.50 1.21 26522 3(2) 7 -0.25 -0.58 0.07 0.05 -0.28 0.38 16763 3(2) 12 -0.28 -0.65 0.08 -0.55 -0.90 -0.19 25394 3(2) 14 0.68 0.32 1.04 0.41 0.05 0.77 25445 3(2) 17 0.81 0.39 1.24 0.17 -0.23 0.58 25175 NR NR 0.73 0.27 1.20 1.05 0.60 1.51 B+ 25535 NR NR 0.49 0.01 0.98 0.76 0.28 1.25 15101 NR NR 0.09 -0.23 0.40 0.38 0.07 0.70 22739 NR NR 0.48 0.15 0.81 0.37 0.05 0.70 15118 NR NR 0.10 -0.29 0.48 0.04 -0.34 0.42 22292 NR NR 0.03 -0.30 0.37 0.03 -0.30 0.37 25244 NR NR -0.27 -0.61 0.06 -0.65 -0.98 -0.33 25393 NR NR 0.13 -0.20 0.46 0.26 -0.07 0.60 25449 NR NR -0.39 -0.85 0.07 -0.03 -0.48 0.42
Note. B = moderate DIF; C = large DIF; - = favouring female students; + = favouring male students; NR = not released. Table 7.1.41b Gender-Based DIF Statistics for Open-Response Items: Primary Mathematics (English)
Item Code Booklet (Section) Sequence
Sample 1 Sample 2 Effect Size p-Value DIF Level Effect Size p-Value DIF Level
10736 3(1) 8 -0.10 0.00 -0.09 0.01 22253 NR NR 0.08 0.00 0.14 0.00 19573 NR NR -0.03 0.54 -0.01 0.43 25407 NR NR -0.12 0.00 -0.14 0.00 25405 3(2) 9 -0.02 0.91 -0.04 0.16 19256 3(2) 10 -0.10 0.00 -0.10 0.00 16682 3(2) 11 -0.04 0.11 -0.06 0.12 25227 NR NR -0.04 0.03 -0.06 0.10
Note. B = moderate DIF; C = large DIF; - = favouring female students; + = favouring male students; NR = not released.
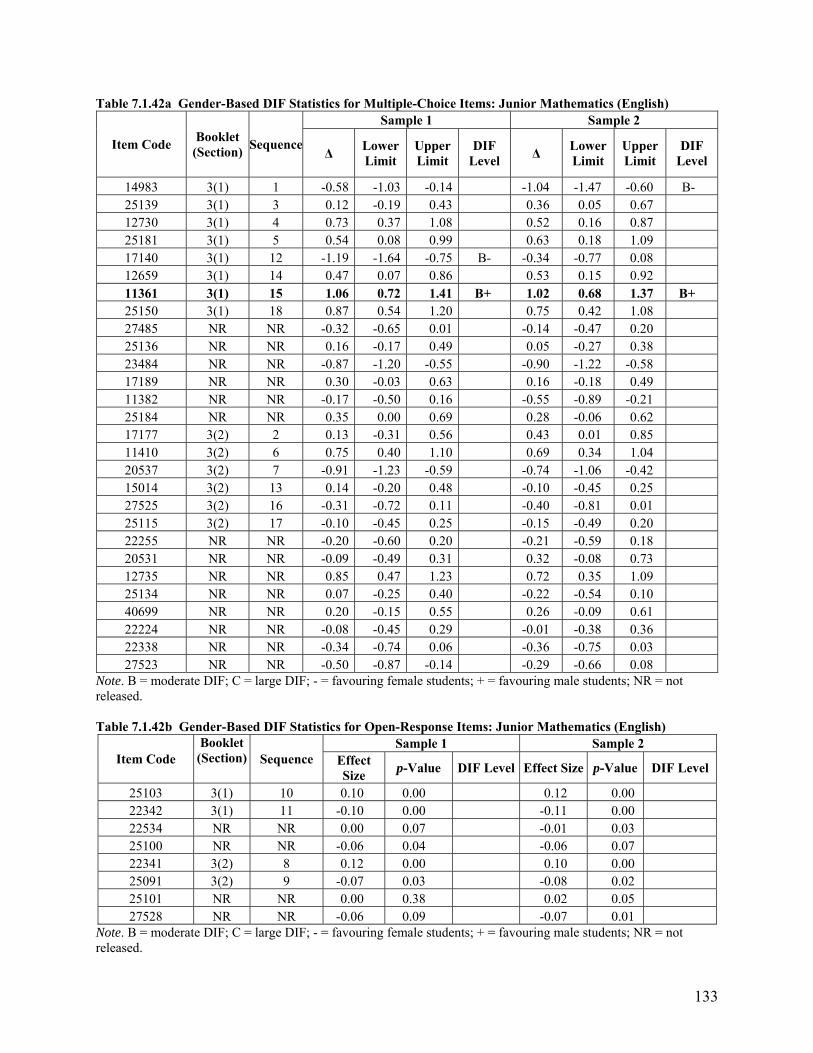
133
Table 7.1.42a Gender-Based DIF Statistics for Multiple-Choice Items: Junior Mathematics (English)
Item Code Booklet
(Section) Sequence
Sample 1 Sample 2
Δ Lower Limit
Upper Limit
DIF Level
Δ Lower Limit
Upper Limit
DIF Level
14983 3(1) 1 -0.58 -1.03 -0.14 -1.04 -1.47 -0.60 B- 25139 3(1) 3 0.12 -0.19 0.43 0.36 0.05 0.67 12730 3(1) 4 0.73 0.37 1.08 0.52 0.16 0.87 25181 3(1) 5 0.54 0.08 0.99 0.63 0.18 1.09 17140 3(1) 12 -1.19 -1.64 -0.75 B- -0.34 -0.77 0.08 12659 3(1) 14 0.47 0.07 0.86 0.53 0.15 0.92 11361 3(1) 15 1.06 0.72 1.41 B+ 1.02 0.68 1.37 B+ 25150 3(1) 18 0.87 0.54 1.20 0.75 0.42 1.08 27485 NR NR -0.32 -0.65 0.01 -0.14 -0.47 0.20 25136 NR NR 0.16 -0.17 0.49 0.05 -0.27 0.38 23484 NR NR -0.87 -1.20 -0.55 -0.90 -1.22 -0.58 17189 NR NR 0.30 -0.03 0.63 0.16 -0.18 0.49 11382 NR NR -0.17 -0.50 0.16 -0.55 -0.89 -0.21 25184 NR NR 0.35 0.00 0.69 0.28 -0.06 0.62 17177 3(2) 2 0.13 -0.31 0.56 0.43 0.01 0.85 11410 3(2) 6 0.75 0.40 1.10 0.69 0.34 1.04 20537 3(2) 7 -0.91 -1.23 -0.59 -0.74 -1.06 -0.42 15014 3(2) 13 0.14 -0.20 0.48 -0.10 -0.45 0.25 27525 3(2) 16 -0.31 -0.72 0.11 -0.40 -0.81 0.01 25115 3(2) 17 -0.10 -0.45 0.25 -0.15 -0.49 0.20 22255 NR NR -0.20 -0.60 0.20 -0.21 -0.59 0.18 20531 NR NR -0.09 -0.49 0.31 0.32 -0.08 0.73 12735 NR NR 0.85 0.47 1.23 0.72 0.35 1.09 25134 NR NR 0.07 -0.25 0.40 -0.22 -0.54 0.10 40699 NR NR 0.20 -0.15 0.55 0.26 -0.09 0.61 22224 NR NR -0.08 -0.45 0.29 -0.01 -0.38 0.36 22338 NR NR -0.34 -0.74 0.06 -0.36 -0.75 0.03 27523 NR NR -0.50 -0.87 -0.14 -0.29 -0.66 0.08
Note. B = moderate DIF; C = large DIF; - = favouring female students; + = favouring male students; NR = not released. Table 7.1.42b Gender-Based DIF Statistics for Open-Response Items: Junior Mathematics (English)
Item Code Booklet(Section) Sequence
Sample 1 Sample 2 Effect Size
p-Value DIF Level Effect Size p-Value DIF Level
25103 3(1) 10 0.10 0.00 0.12 0.00 22342 3(1) 11 -0.10 0.00 -0.11 0.00 22534 NR NR 0.00 0.07 -0.01 0.03 25100 NR NR -0.06 0.04 -0.06 0.07 22341 3(2) 8 0.12 0.00 0.10 0.00 25091 3(2) 9 -0.07 0.03 -0.08 0.02 25101 NR NR 0.00 0.38 0.02 0.05 27528 NR NR -0.06 0.09 -0.07 0.01
Note. B = moderate DIF; C = large DIF; - = favouring female students; + = favouring male students; NR = not released.
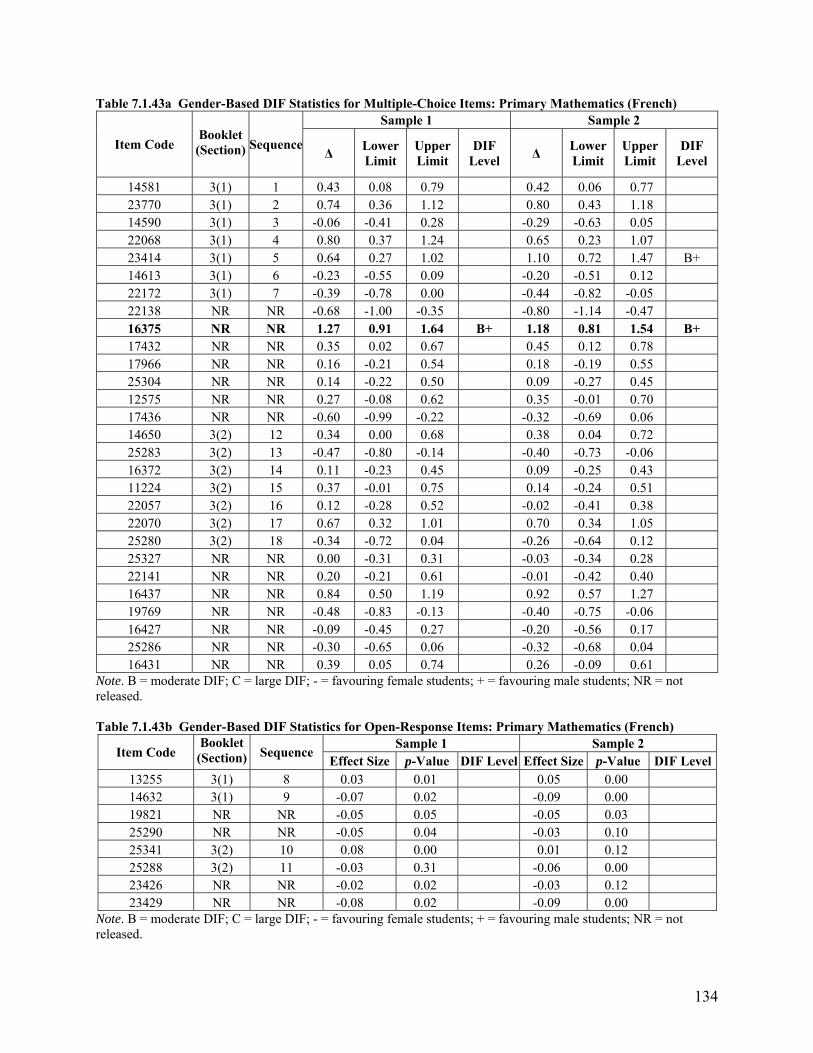
134
Table 7.1.43a Gender-Based DIF Statistics for Multiple-Choice Items: Primary Mathematics (French)
Item Code
Booklet (Section) Sequence
Sample 1 Sample 2
Δ Lower Limit
Upper Limit
DIF Level
Δ Lower Limit
Upper Limit
DIF Level
14581 3(1) 1 0.43 0.08 0.79 0.42 0.06 0.77 23770 3(1) 2 0.74 0.36 1.12 0.80 0.43 1.18 14590 3(1) 3 -0.06 -0.41 0.28 -0.29 -0.63 0.05 22068 3(1) 4 0.80 0.37 1.24 0.65 0.23 1.07 23414 3(1) 5 0.64 0.27 1.02 1.10 0.72 1.47 B+ 14613 3(1) 6 -0.23 -0.55 0.09 -0.20 -0.51 0.12 22172 3(1) 7 -0.39 -0.78 0.00 -0.44 -0.82 -0.05 22138 NR NR -0.68 -1.00 -0.35 -0.80 -1.14 -0.47 16375 NR NR 1.27 0.91 1.64 B+ 1.18 0.81 1.54 B+ 17432 NR NR 0.35 0.02 0.67 0.45 0.12 0.78 17966 NR NR 0.16 -0.21 0.54 0.18 -0.19 0.55 25304 NR NR 0.14 -0.22 0.50 0.09 -0.27 0.45 12575 NR NR 0.27 -0.08 0.62 0.35 -0.01 0.70 17436 NR NR -0.60 -0.99 -0.22 -0.32 -0.69 0.06 14650 3(2) 12 0.34 0.00 0.68 0.38 0.04 0.72 25283 3(2) 13 -0.47 -0.80 -0.14 -0.40 -0.73 -0.06 16372 3(2) 14 0.11 -0.23 0.45 0.09 -0.25 0.43 11224 3(2) 15 0.37 -0.01 0.75 0.14 -0.24 0.51 22057 3(2) 16 0.12 -0.28 0.52 -0.02 -0.41 0.38 22070 3(2) 17 0.67 0.32 1.01 0.70 0.34 1.05 25280 3(2) 18 -0.34 -0.72 0.04 -0.26 -0.64 0.12 25327 NR NR 0.00 -0.31 0.31 -0.03 -0.34 0.28 22141 NR NR 0.20 -0.21 0.61 -0.01 -0.42 0.40 16437 NR NR 0.84 0.50 1.19 0.92 0.57 1.27 19769 NR NR -0.48 -0.83 -0.13 -0.40 -0.75 -0.06 16427 NR NR -0.09 -0.45 0.27 -0.20 -0.56 0.17 25286 NR NR -0.30 -0.65 0.06 -0.32 -0.68 0.04 16431 NR NR 0.39 0.05 0.74 0.26 -0.09 0.61
Note. B = moderate DIF; C = large DIF; - = favouring female students; + = favouring male students; NR = not released. Table 7.1.43b Gender-Based DIF Statistics for Open-Response Items: Primary Mathematics (French)
Item Code Booklet(Section) Sequence
Sample 1 Sample 2 Effect Size p-Value DIF Level Effect Size p-Value DIF Level
13255 3(1) 8 0.03 0.01 0.05 0.00 14632 3(1) 9 -0.07 0.02 -0.09 0.00 19821 NR NR -0.05 0.05 -0.05 0.03 25290 NR NR -0.05 0.04 -0.03 0.10 25341 3(2) 10 0.08 0.00 0.01 0.12 25288 3(2) 11 -0.03 0.31 -0.06 0.00 23426 NR NR -0.02 0.02 -0.03 0.12 23429 NR NR -0.08 0.02 -0.09 0.00
Note. B = moderate DIF; C = large DIF; - = favouring female students; + = favouring male students; NR = not released.
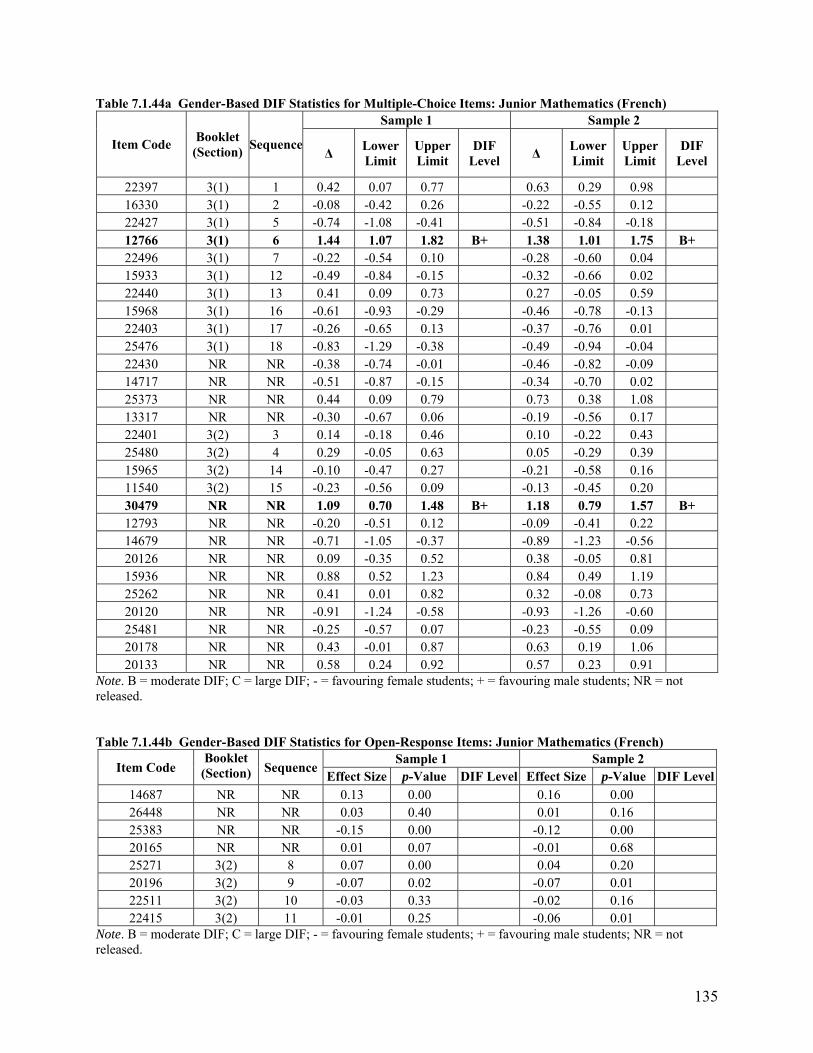
135
Table 7.1.44a Gender-Based DIF Statistics for Multiple-Choice Items: Junior Mathematics (French)
Item Code Booklet
(Section) Sequence
Sample 1 Sample 2
Δ Lower Limit
Upper Limit
DIF Level
Δ Lower Limit
Upper Limit
DIF Level
22397 3(1) 1 0.42 0.07 0.77 0.63 0.29 0.98 16330 3(1) 2 -0.08 -0.42 0.26 -0.22 -0.55 0.12 22427 3(1) 5 -0.74 -1.08 -0.41 -0.51 -0.84 -0.18 12766 3(1) 6 1.44 1.07 1.82 B+ 1.38 1.01 1.75 B+ 22496 3(1) 7 -0.22 -0.54 0.10 -0.28 -0.60 0.04 15933 3(1) 12 -0.49 -0.84 -0.15 -0.32 -0.66 0.02 22440 3(1) 13 0.41 0.09 0.73 0.27 -0.05 0.59 15968 3(1) 16 -0.61 -0.93 -0.29 -0.46 -0.78 -0.13 22403 3(1) 17 -0.26 -0.65 0.13 -0.37 -0.76 0.01 25476 3(1) 18 -0.83 -1.29 -0.38 -0.49 -0.94 -0.04 22430 NR NR -0.38 -0.74 -0.01 -0.46 -0.82 -0.09 14717 NR NR -0.51 -0.87 -0.15 -0.34 -0.70 0.02 25373 NR NR 0.44 0.09 0.79 0.73 0.38 1.08 13317 NR NR -0.30 -0.67 0.06 -0.19 -0.56 0.17 22401 3(2) 3 0.14 -0.18 0.46 0.10 -0.22 0.43 25480 3(2) 4 0.29 -0.05 0.63 0.05 -0.29 0.39 15965 3(2) 14 -0.10 -0.47 0.27 -0.21 -0.58 0.16 11540 3(2) 15 -0.23 -0.56 0.09 -0.13 -0.45 0.20 30479 NR NR 1.09 0.70 1.48 B+ 1.18 0.79 1.57 B+ 12793 NR NR -0.20 -0.51 0.12 -0.09 -0.41 0.22 14679 NR NR -0.71 -1.05 -0.37 -0.89 -1.23 -0.56 20126 NR NR 0.09 -0.35 0.52 0.38 -0.05 0.81 15936 NR NR 0.88 0.52 1.23 0.84 0.49 1.19 25262 NR NR 0.41 0.01 0.82 0.32 -0.08 0.73 20120 NR NR -0.91 -1.24 -0.58 -0.93 -1.26 -0.60 25481 NR NR -0.25 -0.57 0.07 -0.23 -0.55 0.09 20178 NR NR 0.43 -0.01 0.87 0.63 0.19 1.06 20133 NR NR 0.58 0.24 0.92 0.57 0.23 0.91
Note. B = moderate DIF; C = large DIF; - = favouring female students; + = favouring male students; NR = not released. Table 7.1.44b Gender-Based DIF Statistics for Open-Response Items: Junior Mathematics (French)
Item Code Booklet (Section) Sequence
Sample 1 Sample 2 Effect Size p-Value DIF Level Effect Size p-Value DIF Level
14687 NR NR 0.13 0.00 0.16 0.00 26448 NR NR 0.03 0.40 0.01 0.16 25383 NR NR -0.15 0.00 -0.12 0.00 20165 NR NR 0.01 0.07 -0.01 0.68 25271 3(2) 8 0.07 0.00 0.04 0.20 20196 3(2) 9 -0.07 0.02 -0.07 0.01 22511 3(2) 10 -0.03 0.33 -0.02 0.16 22415 3(2) 11 -0.01 0.25 -0.06 0.01
Note. B = moderate DIF; C = large DIF; - = favouring female students; + = favouring male students; NR = not released.
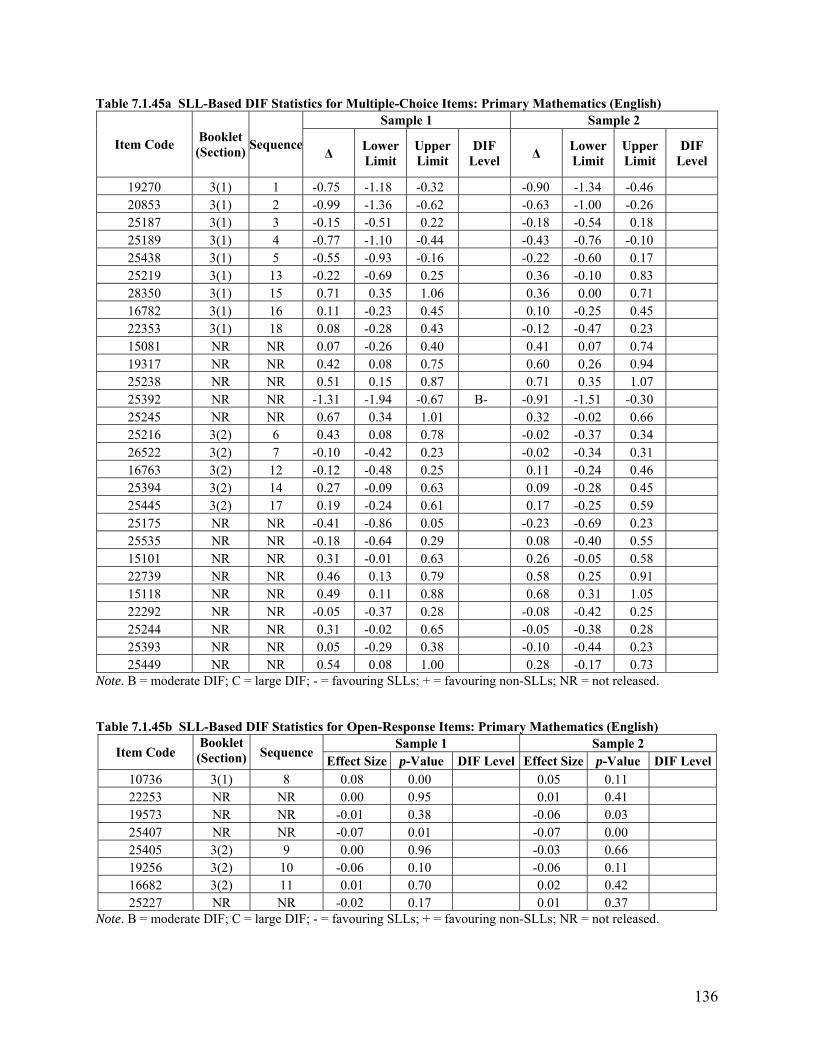
136
Table 7.1.45a SLL-Based DIF Statistics for Multiple-Choice Items: Primary Mathematics (English)
Item Code Booklet (Section)
Sequence
Sample 1 Sample 2
Δ Lower Limit
Upper Limit
DIF Level
Δ Lower Limit
Upper Limit
DIF Level
19270 3(1) 1 -0.75 -1.18 -0.32 -0.90 -1.34 -0.46 20853 3(1) 2 -0.99 -1.36 -0.62 -0.63 -1.00 -0.26 25187 3(1) 3 -0.15 -0.51 0.22 -0.18 -0.54 0.18 25189 3(1) 4 -0.77 -1.10 -0.44 -0.43 -0.76 -0.10 25438 3(1) 5 -0.55 -0.93 -0.16 -0.22 -0.60 0.17 25219 3(1) 13 -0.22 -0.69 0.25 0.36 -0.10 0.83 28350 3(1) 15 0.71 0.35 1.06 0.36 0.00 0.71 16782 3(1) 16 0.11 -0.23 0.45 0.10 -0.25 0.45 22353 3(1) 18 0.08 -0.28 0.43 -0.12 -0.47 0.23 15081 NR NR 0.07 -0.26 0.40 0.41 0.07 0.74 19317 NR NR 0.42 0.08 0.75 0.60 0.26 0.94 25238 NR NR 0.51 0.15 0.87 0.71 0.35 1.07 25392 NR NR -1.31 -1.94 -0.67 B- -0.91 -1.51 -0.30 25245 NR NR 0.67 0.34 1.01 0.32 -0.02 0.66 25216 3(2) 6 0.43 0.08 0.78 -0.02 -0.37 0.34 26522 3(2) 7 -0.10 -0.42 0.23 -0.02 -0.34 0.31 16763 3(2) 12 -0.12 -0.48 0.25 0.11 -0.24 0.46 25394 3(2) 14 0.27 -0.09 0.63 0.09 -0.28 0.45 25445 3(2) 17 0.19 -0.24 0.61 0.17 -0.25 0.59 25175 NR NR -0.41 -0.86 0.05 -0.23 -0.69 0.23 25535 NR NR -0.18 -0.64 0.29 0.08 -0.40 0.55 15101 NR NR 0.31 -0.01 0.63 0.26 -0.05 0.58 22739 NR NR 0.46 0.13 0.79 0.58 0.25 0.91 15118 NR NR 0.49 0.11 0.88 0.68 0.31 1.05 22292 NR NR -0.05 -0.37 0.28 -0.08 -0.42 0.25 25244 NR NR 0.31 -0.02 0.65 -0.05 -0.38 0.28 25393 NR NR 0.05 -0.29 0.38 -0.10 -0.44 0.23 25449 NR NR 0.54 0.08 1.00 0.28 -0.17 0.73
Note. B = moderate DIF; C = large DIF; - = favouring SLLs; + = favouring non-SLLs; NR = not released. Table 7.1.45b SLL-Based DIF Statistics for Open-Response Items: Primary Mathematics (English)
Item Code Booklet
(Section) Sequence Sample 1 Sample 2
Effect Size p-Value DIF Level Effect Size p-Value DIF Level10736 3(1) 8 0.08 0.00 0.05 0.11 22253 NR NR 0.00 0.95 0.01 0.41 19573 NR NR -0.01 0.38 -0.06 0.03 25407 NR NR -0.07 0.01 -0.07 0.00 25405 3(2) 9 0.00 0.96 -0.03 0.66 19256 3(2) 10 -0.06 0.10 -0.06 0.11 16682 3(2) 11 0.01 0.70 0.02 0.42 25227 NR NR -0.02 0.17 0.01 0.37
Note. B = moderate DIF; C = large DIF; - = favouring SLLs; + = favouring non-SLLs; NR = not released.
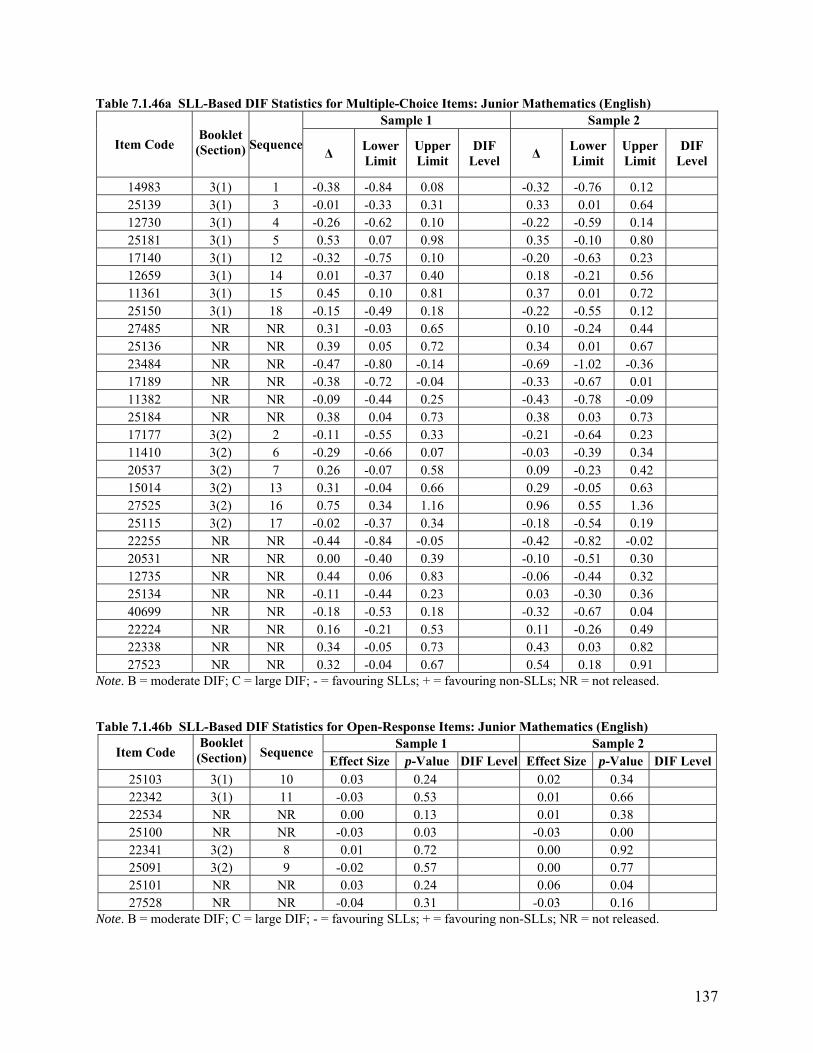
137
Table 7.1.46a SLL-Based DIF Statistics for Multiple-Choice Items: Junior Mathematics (English)
Item Code
Booklet (Section) Sequence
Sample 1 Sample 2
Δ Lower Limit
Upper Limit
DIF Level
Δ Lower Limit
Upper Limit
DIF Level
14983 3(1) 1 -0.38 -0.84 0.08 -0.32 -0.76 0.12 25139 3(1) 3 -0.01 -0.33 0.31 0.33 0.01 0.64 12730 3(1) 4 -0.26 -0.62 0.10 -0.22 -0.59 0.14 25181 3(1) 5 0.53 0.07 0.98 0.35 -0.10 0.80 17140 3(1) 12 -0.32 -0.75 0.10 -0.20 -0.63 0.23 12659 3(1) 14 0.01 -0.37 0.40 0.18 -0.21 0.56 11361 3(1) 15 0.45 0.10 0.81 0.37 0.01 0.72 25150 3(1) 18 -0.15 -0.49 0.18 -0.22 -0.55 0.12 27485 NR NR 0.31 -0.03 0.65 0.10 -0.24 0.44 25136 NR NR 0.39 0.05 0.72 0.34 0.01 0.67 23484 NR NR -0.47 -0.80 -0.14 -0.69 -1.02 -0.36 17189 NR NR -0.38 -0.72 -0.04 -0.33 -0.67 0.01 11382 NR NR -0.09 -0.44 0.25 -0.43 -0.78 -0.09 25184 NR NR 0.38 0.04 0.73 0.38 0.03 0.73 17177 3(2) 2 -0.11 -0.55 0.33 -0.21 -0.64 0.23 11410 3(2) 6 -0.29 -0.66 0.07 -0.03 -0.39 0.34 20537 3(2) 7 0.26 -0.07 0.58 0.09 -0.23 0.42 15014 3(2) 13 0.31 -0.04 0.66 0.29 -0.05 0.63 27525 3(2) 16 0.75 0.34 1.16 0.96 0.55 1.36 25115 3(2) 17 -0.02 -0.37 0.34 -0.18 -0.54 0.19 22255 NR NR -0.44 -0.84 -0.05 -0.42 -0.82 -0.02 20531 NR NR 0.00 -0.40 0.39 -0.10 -0.51 0.30 12735 NR NR 0.44 0.06 0.83 -0.06 -0.44 0.32 25134 NR NR -0.11 -0.44 0.23 0.03 -0.30 0.36 40699 NR NR -0.18 -0.53 0.18 -0.32 -0.67 0.04 22224 NR NR 0.16 -0.21 0.53 0.11 -0.26 0.49 22338 NR NR 0.34 -0.05 0.73 0.43 0.03 0.82 27523 NR NR 0.32 -0.04 0.67 0.54 0.18 0.91
Note. B = moderate DIF; C = large DIF; - = favouring SLLs; + = favouring non-SLLs; NR = not released. Table 7.1.46b SLL-Based DIF Statistics for Open-Response Items: Junior Mathematics (English)
Item Code Booklet (Section) Sequence
Sample 1 Sample 2 Effect Size p-Value DIF Level Effect Size p-Value DIF Level
25103 3(1) 10 0.03 0.24 0.02 0.34 22342 3(1) 11 -0.03 0.53 0.01 0.66 22534 NR NR 0.00 0.13 0.01 0.38 25100 NR NR -0.03 0.03 -0.03 0.00 22341 3(2) 8 0.01 0.72 0.00 0.92 25091 3(2) 9 -0.02 0.57 0.00 0.77 25101 NR NR 0.03 0.24 0.06 0.04 27528 NR NR -0.04 0.31 -0.03 0.16
Note. B = moderate DIF; C = large DIF; - = favouring SLLs; + = favouring non-SLLs; NR = not released.
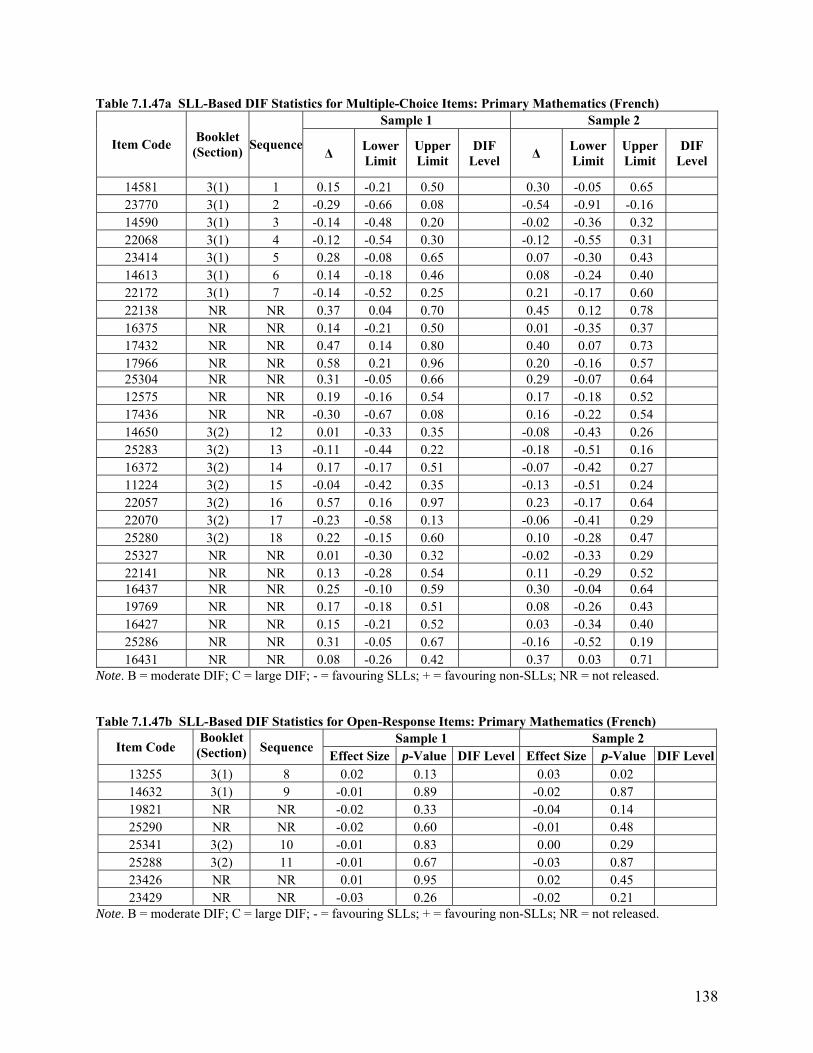
138
Table 7.1.47a SLL-Based DIF Statistics for Multiple-Choice Items: Primary Mathematics (French)
Item Code Booklet
(Section) Sequence
Sample 1 Sample 2
Δ Lower Limit
Upper Limit
DIF Level
Δ Lower Limit
Upper Limit
DIF Level
14581 3(1) 1 0.15 -0.21 0.50 0.30 -0.05 0.65 23770 3(1) 2 -0.29 -0.66 0.08 -0.54 -0.91 -0.16 14590 3(1) 3 -0.14 -0.48 0.20 -0.02 -0.36 0.32 22068 3(1) 4 -0.12 -0.54 0.30 -0.12 -0.55 0.31 23414 3(1) 5 0.28 -0.08 0.65 0.07 -0.30 0.43 14613 3(1) 6 0.14 -0.18 0.46 0.08 -0.24 0.40 22172 3(1) 7 -0.14 -0.52 0.25 0.21 -0.17 0.60 22138 NR NR 0.37 0.04 0.70 0.45 0.12 0.78 16375 NR NR 0.14 -0.21 0.50 0.01 -0.35 0.37 17432 NR NR 0.47 0.14 0.80 0.40 0.07 0.73 17966 NR NR 0.58 0.21 0.96 0.20 -0.16 0.57 25304 NR NR 0.31 -0.05 0.66 0.29 -0.07 0.64 12575 NR NR 0.19 -0.16 0.54 0.17 -0.18 0.52 17436 NR NR -0.30 -0.67 0.08 0.16 -0.22 0.54 14650 3(2) 12 0.01 -0.33 0.35 -0.08 -0.43 0.26 25283 3(2) 13 -0.11 -0.44 0.22 -0.18 -0.51 0.16 16372 3(2) 14 0.17 -0.17 0.51 -0.07 -0.42 0.27 11224 3(2) 15 -0.04 -0.42 0.35 -0.13 -0.51 0.24 22057 3(2) 16 0.57 0.16 0.97 0.23 -0.17 0.64 22070 3(2) 17 -0.23 -0.58 0.13 -0.06 -0.41 0.29 25280 3(2) 18 0.22 -0.15 0.60 0.10 -0.28 0.47 25327 NR NR 0.01 -0.30 0.32 -0.02 -0.33 0.29 22141 NR NR 0.13 -0.28 0.54 0.11 -0.29 0.52 16437 NR NR 0.25 -0.10 0.59 0.30 -0.04 0.64 19769 NR NR 0.17 -0.18 0.51 0.08 -0.26 0.43 16427 NR NR 0.15 -0.21 0.52 0.03 -0.34 0.40 25286 NR NR 0.31 -0.05 0.67 -0.16 -0.52 0.19 16431 NR NR 0.08 -0.26 0.42 0.37 0.03 0.71
Note. B = moderate DIF; C = large DIF; - = favouring SLLs; + = favouring non-SLLs; NR = not released. Table 7.1.47b SLL-Based DIF Statistics for Open-Response Items: Primary Mathematics (French)
Item Code Booklet
(Section) Sequence Sample 1 Sample 2
Effect Size p-Value DIF Level Effect Size p-Value DIF Level13255 3(1) 8 0.02 0.13 0.03 0.02 14632 3(1) 9 -0.01 0.89 -0.02 0.87 19821 NR NR -0.02 0.33 -0.04 0.14 25290 NR NR -0.02 0.60 -0.01 0.48 25341 3(2) 10 -0.01 0.83 0.00 0.29 25288 3(2) 11 -0.01 0.67 -0.03 0.87 23426 NR NR 0.01 0.95 0.02 0.45 23429 NR NR -0.03 0.26 -0.02 0.21
Note. B = moderate DIF; C = large DIF; - = favouring SLLs; + = favouring non-SLLs; NR = not released.
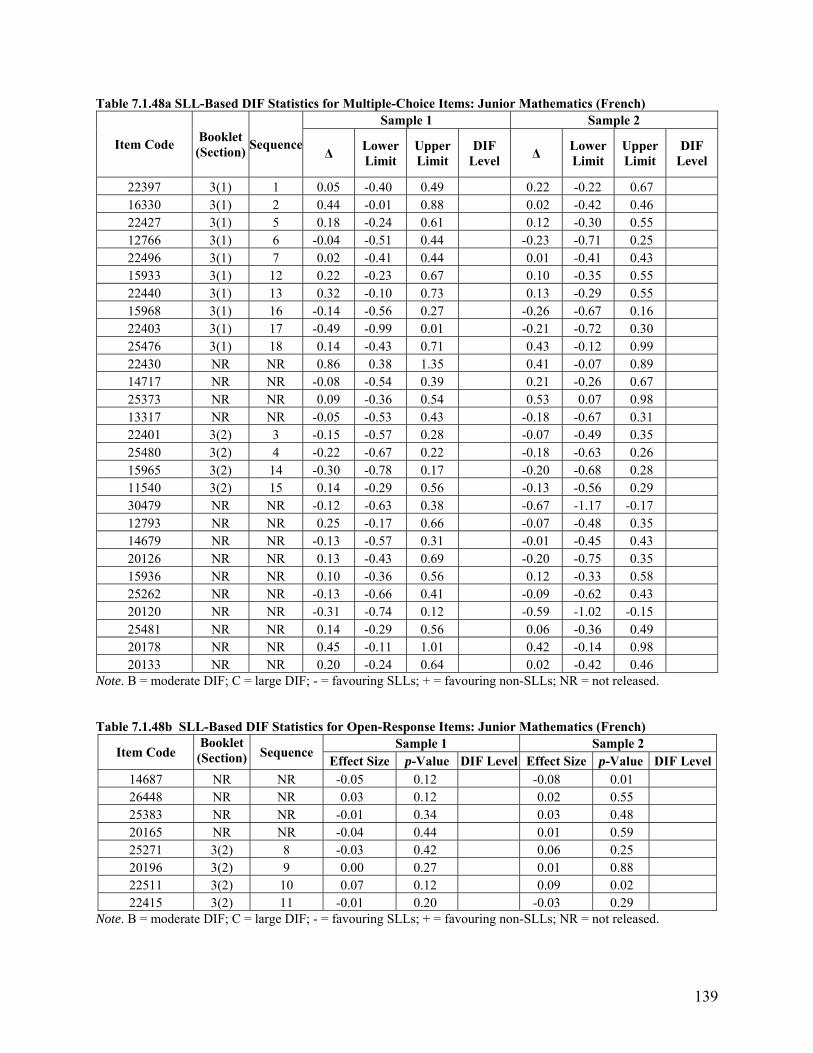
139
Table 7.1.48a SLL-Based DIF Statistics for Multiple-Choice Items: Junior Mathematics (French)
Item Code Booklet (Section)
Sequence
Sample 1 Sample 2
Δ Lower Limit
Upper Limit
DIF Level
Δ Lower Limit
Upper Limit
DIF Level
22397 3(1) 1 0.05 -0.40 0.49 0.22 -0.22 0.67 16330 3(1) 2 0.44 -0.01 0.88 0.02 -0.42 0.46 22427 3(1) 5 0.18 -0.24 0.61 0.12 -0.30 0.55 12766 3(1) 6 -0.04 -0.51 0.44 -0.23 -0.71 0.25 22496 3(1) 7 0.02 -0.41 0.44 0.01 -0.41 0.43 15933 3(1) 12 0.22 -0.23 0.67 0.10 -0.35 0.55 22440 3(1) 13 0.32 -0.10 0.73 0.13 -0.29 0.55 15968 3(1) 16 -0.14 -0.56 0.27 -0.26 -0.67 0.16 22403 3(1) 17 -0.49 -0.99 0.01 -0.21 -0.72 0.30 25476 3(1) 18 0.14 -0.43 0.71 0.43 -0.12 0.99 22430 NR NR 0.86 0.38 1.35 0.41 -0.07 0.89 14717 NR NR -0.08 -0.54 0.39 0.21 -0.26 0.67 25373 NR NR 0.09 -0.36 0.54 0.53 0.07 0.98 13317 NR NR -0.05 -0.53 0.43 -0.18 -0.67 0.31 22401 3(2) 3 -0.15 -0.57 0.28 -0.07 -0.49 0.35 25480 3(2) 4 -0.22 -0.67 0.22 -0.18 -0.63 0.26 15965 3(2) 14 -0.30 -0.78 0.17 -0.20 -0.68 0.28 11540 3(2) 15 0.14 -0.29 0.56 -0.13 -0.56 0.29 30479 NR NR -0.12 -0.63 0.38 -0.67 -1.17 -0.17 12793 NR NR 0.25 -0.17 0.66 -0.07 -0.48 0.35 14679 NR NR -0.13 -0.57 0.31 -0.01 -0.45 0.43 20126 NR NR 0.13 -0.43 0.69 -0.20 -0.75 0.35 15936 NR NR 0.10 -0.36 0.56 0.12 -0.33 0.58 25262 NR NR -0.13 -0.66 0.41 -0.09 -0.62 0.43 20120 NR NR -0.31 -0.74 0.12 -0.59 -1.02 -0.15 25481 NR NR 0.14 -0.29 0.56 0.06 -0.36 0.49 20178 NR NR 0.45 -0.11 1.01 0.42 -0.14 0.98 20133 NR NR 0.20 -0.24 0.64 0.02 -0.42 0.46
Note. B = moderate DIF; C = large DIF; - = favouring SLLs; + = favouring non-SLLs; NR = not released. Table 7.1.48b SLL-Based DIF Statistics for Open-Response Items: Junior Mathematics (French)
Item Code Booklet(Section) Sequence
Sample 1 Sample 2 Effect Size p-Value DIF Level Effect Size p-Value DIF Level
14687 NR NR -0.05 0.12 -0.08 0.01 26448 NR NR 0.03 0.12 0.02 0.55 25383 NR NR -0.01 0.34 0.03 0.48 20165 NR NR -0.04 0.44 0.01 0.59 25271 3(2) 8 -0.03 0.42 0.06 0.25 20196 3(2) 9 0.00 0.27 0.01 0.88 22511 3(2) 10 0.07 0.12 0.09 0.02 22415 3(2) 11 -0.01 0.20 -0.03 0.29
Note. B = moderate DIF; C = large DIF; - = favouring SLLs; + = favouring non-SLLs; NR = not released.
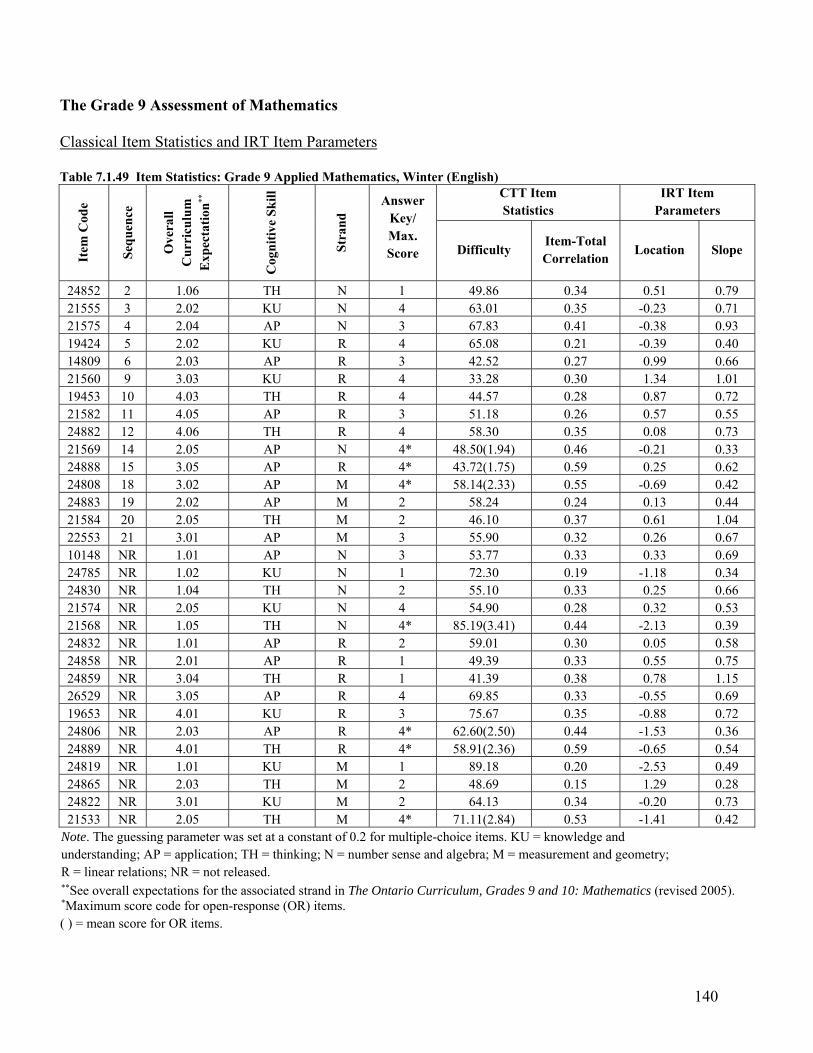
140
The Grade 9 Assessment of Mathematics
Classical Item Statistics and IRT Item Parameters
Table 7.1.49 Item Statistics: Grade 9 Applied Mathematics, Winter (English)
Item
Cod
e
Seq
uen
ce
Ove
rall
Cu
rric
ulu
m
Exp
ecta
tion
**
Cog
nit
ive
Sk
ill
Str
and
Answer Key/ Max. Score
CTT Item Statistics
IRT Item Parameters
Difficulty Item-Total Correlation
Location Slope
24852 2 1.06 TH N 1 49.86 0.34 0.51 0.79 21555 3 2.02 KU N 4 63.01 0.35 -0.23 0.71 21575 4 2.04 AP N 3 67.83 0.41 -0.38 0.93 19424 5 2.02 KU R 4 65.08 0.21 -0.39 0.40 14809 6 2.03 AP R 3 42.52 0.27 0.99 0.66 21560 9 3.03 KU R 4 33.28 0.30 1.34 1.01 19453 10 4.03 TH R 4 44.57 0.28 0.87 0.72 21582 11 4.05 AP R 3 51.18 0.26 0.57 0.55 24882 12 4.06 TH R 4 58.30 0.35 0.08 0.73 21569 14 2.05 AP N 4* 48.50(1.94) 0.46 -0.21 0.33 24888 15 3.05 AP R 4* 43.72(1.75) 0.59 0.25 0.62 24808 18 3.02 AP M 4* 58.14(2.33) 0.55 -0.69 0.42 24883 19 2.02 AP M 2 58.24 0.24 0.13 0.44 21584 20 2.05 TH M 2 46.10 0.37 0.61 1.04 22553 21 3.01 AP M 3 55.90 0.32 0.26 0.67 10148 NR 1.01 AP N 3 53.77 0.33 0.33 0.69 24785 NR 1.02 KU N 1 72.30 0.19 -1.18 0.34 24830 NR 1.04 TH N 2 55.10 0.33 0.25 0.66 21574 NR 2.05 KU N 4 54.90 0.28 0.32 0.53 21568 NR 1.05 TH N 4* 85.19(3.41) 0.44 -2.13 0.39 24832 NR 1.01 AP R 2 59.01 0.30 0.05 0.58 24858 NR 2.01 AP R 1 49.39 0.33 0.55 0.75 24859 NR 3.04 TH R 1 41.39 0.38 0.78 1.15 26529 NR 3.05 AP R 4 69.85 0.33 -0.55 0.69 19653 NR 4.01 KU R 3 75.67 0.35 -0.88 0.72 24806 NR 2.03 AP R 4* 62.60(2.50) 0.44 -1.53 0.36 24889 NR 4.01 TH R 4* 58.91(2.36) 0.59 -0.65 0.54 24819 NR 1.01 KU M 1 89.18 0.20 -2.53 0.49 24865 NR 2.03 TH M 2 48.69 0.15 1.29 0.28 24822 NR 3.01 KU M 2 64.13 0.34 -0.20 0.73 21533 NR 2.05 TH M 4* 71.11(2.84) 0.53 -1.41 0.42
Note. The guessing parameter was set at a constant of 0.2 for multiple-choice items. KU = knowledge and understanding; AP = application; TH = thinking; N = number sense and algebra; M = measurement and geometry; R = linear relations; NR = not released. **See overall expectations for the associated strand in The Ontario Curriculum, Grades 9 and 10: Mathematics (revised 2005). *Maximum score code for open-response (OR) items. ( ) = mean score for OR items.

141
Table 7.1.50 Distribution of Score Points and Category Difficulty Estimates for Open-Response Items: Grade 9 Applied Mathematics, Winter (English)
Item Code Sequence Score Points
Missing Illegible 10 20 30 40
21569 14
% of Students 7.72 2.50 28.99 34.42 9.31 17.06 Parameters -2.48 -0.49 2.59 -0.47
24888 15
% of Students 8.06 1.30 36.60 29.80 18.25 5.98 Parameters -2.07 0.05 0.92 2.10
24808 18
% of Students 4.98 0.85 30.51 16.00 20.58 27.08 Parameters -3.15 0.53 -0.29 0.13
21568 NR
% of Students 0.98 0.44 9.41 8.55 8.21 72.40 Parameters -4.13 -0.74 -0.40 -3.23
24806 NR
% of Students 0.86 0.06 16.20 35.27 26.76 20.85 Parameters -5.67 -1.76 0.45 0.87
24889 NR
% of Students 4.09 0.76 21.05 33.16 15.54 25.41 Parameters -2.59 -0.95 0.89 0.05
21533 NR
% of Students 1.83 0.63 14.70 23.99 13.62 45.23 Parameters -3.56 -1.31 0.60 -1.37
Note. The total number of students is 14 425; NR = not released.
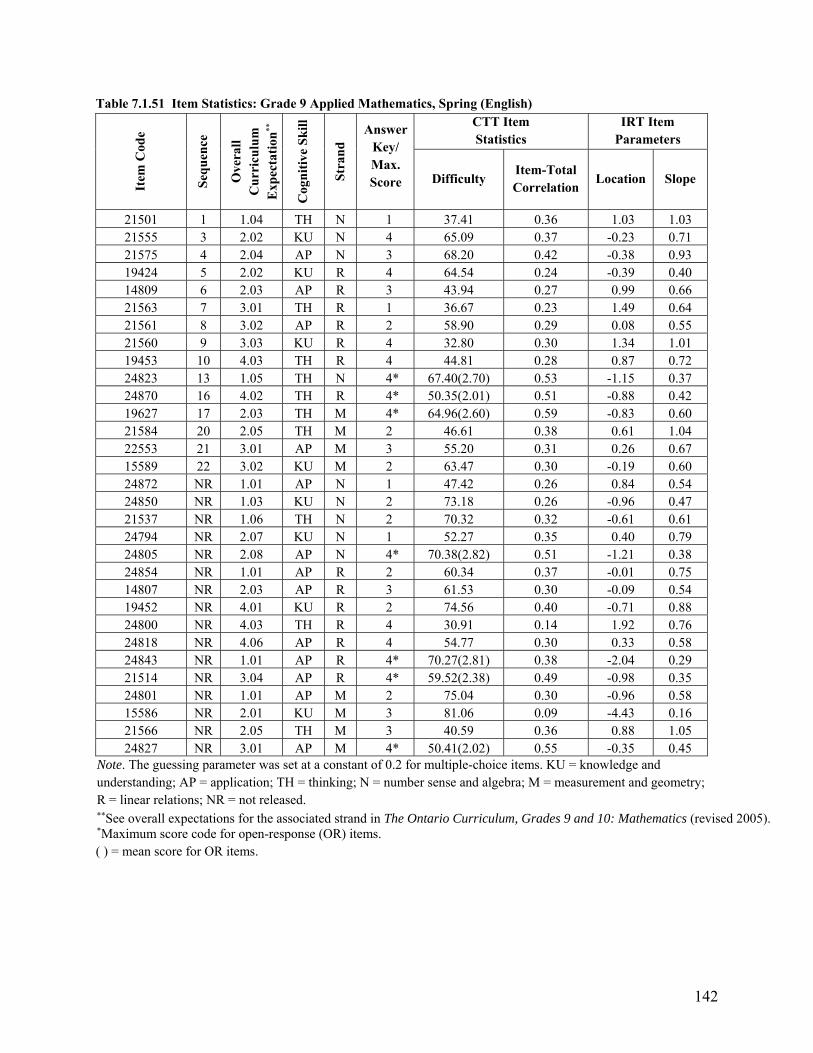
142
Table 7.1.51 Item Statistics: Grade 9 Applied Mathematics, Spring (English)
Item
Cod
e
Seq
uen
ce
Ove
rall
Cu
rric
ulu
m
Exp
ecta
tion
**
Cog
nit
ive
Sk
ill
Str
and
Answer Key/ Max. Score
CTT Item Statistics
IRT Item Parameters
Difficulty Item-Total Correlation
Location Slope
21501 1 1.04 TH N 1 37.41 0.36 1.03 1.03 21555 3 2.02 KU N 4 65.09 0.37 -0.23 0.71 21575 4 2.04 AP N 3 68.20 0.42 -0.38 0.93 19424 5 2.02 KU R 4 64.54 0.24 -0.39 0.40 14809 6 2.03 AP R 3 43.94 0.27 0.99 0.66 21563 7 3.01 TH R 1 36.67 0.23 1.49 0.64 21561 8 3.02 AP R 2 58.90 0.29 0.08 0.55 21560 9 3.03 KU R 4 32.80 0.30 1.34 1.01 19453 10 4.03 TH R 4 44.81 0.28 0.87 0.72 24823 13 1.05 TH N 4* 67.40(2.70) 0.53 -1.15 0.37 24870 16 4.02 TH R 4* 50.35(2.01) 0.51 -0.88 0.42 19627 17 2.03 TH M 4* 64.96(2.60) 0.59 -0.83 0.60 21584 20 2.05 TH M 2 46.61 0.38 0.61 1.04 22553 21 3.01 AP M 3 55.20 0.31 0.26 0.67 15589 22 3.02 KU M 2 63.47 0.30 -0.19 0.60 24872 NR 1.01 AP N 1 47.42 0.26 0.84 0.54 24850 NR 1.03 KU N 2 73.18 0.26 -0.96 0.47 21537 NR 1.06 TH N 2 70.32 0.32 -0.61 0.61 24794 NR 2.07 KU N 1 52.27 0.35 0.40 0.79 24805 NR 2.08 AP N 4* 70.38(2.82) 0.51 -1.21 0.38 24854 NR 1.01 AP R 2 60.34 0.37 -0.01 0.75 14807 NR 2.03 AP R 3 61.53 0.30 -0.09 0.54 19452 NR 4.01 KU R 2 74.56 0.40 -0.71 0.88 24800 NR 4.03 TH R 4 30.91 0.14 1.92 0.76 24818 NR 4.06 AP R 4 54.77 0.30 0.33 0.58 24843 NR 1.01 AP R 4* 70.27(2.81) 0.38 -2.04 0.29 21514 NR 3.04 AP R 4* 59.52(2.38) 0.49 -0.98 0.35 24801 NR 1.01 AP M 2 75.04 0.30 -0.96 0.58 15586 NR 2.01 KU M 3 81.06 0.09 -4.43 0.16 21566 NR 2.05 TH M 3 40.59 0.36 0.88 1.05 24827 NR 3.01 AP M 4* 50.41(2.02) 0.55 -0.35 0.45
Note. The guessing parameter was set at a constant of 0.2 for multiple-choice items. KU = knowledge and understanding; AP = application; TH = thinking; N = number sense and algebra; M = measurement and geometry; R = linear relations; NR = not released. **See overall expectations for the associated strand in The Ontario Curriculum, Grades 9 and 10: Mathematics (revised 2005). *Maximum score code for open-response (OR) items. ( ) = mean score for OR items.

143
Table 7.1.52 Distribution of Score Points and Category Difficulty Estimates for Open-Response Items: Grade 9 Applied Mathematics, Spring (English)
Item Code Sequence Score Points
Missing Illegible 10 20 30 40
24823 13
% of Students 3.86 1.33 21.95 15.38 13.04 44.44 Parameters -3.23 0.08 0.19 -1.63
24870 16
% of Students 0.96 0.09 46.28 15.49 24.57 12.61 Parameters -6.08 1.30 -0.39 1.66
19627 17
% of Students 2.46 0.50 17.49 17.59 40.67 21.28 Parameters -2.97 -0.65 -0.89 1.17
24805 NR
% of Students 3.84 1.07 16.17 15.40 19.50 44.02 Parameters -2.86 -0.49 -0.51 -0.97
24843 NR
% of Students 0.91 0.06 10.98 23.33 35.41 29.30 Parameters -5.84 -2.05 -0.96 0.67
21514 NR
% of Students 3.04 0.66 23.77 29.48 16.79 26.24 Parameters -3.93 -0.73 1.00 -0.25
24827 NR
% of Students 5.37 0.87 40.49 16.74 18.45 18.08 Parameters -3.20 0.93 0.13 0.74
Note. The total number of students is 17 609; NR = not released.
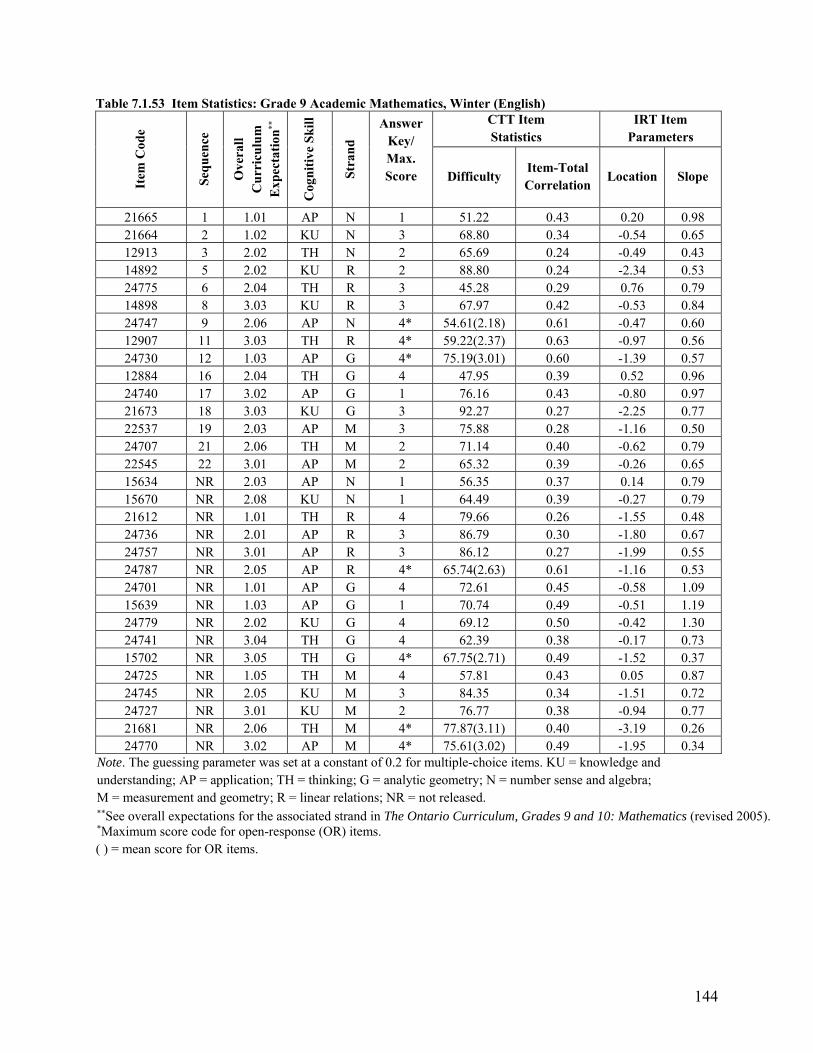
144
Table 7.1.53 Item Statistics: Grade 9 Academic Mathematics, Winter (English)
Item
Cod
e
Seq
uen
ce
Ove
rall
Cu
rric
ulu
m
Exp
ecta
tion
**
Cog
nit
ive
Sk
ill
Str
and
Answer Key/ Max. Score
CTT Item Statistics
IRT Item Parameters
Difficulty Item-Total Correlation
Location Slope
21665 1 1.01 AP N 1 51.22 0.43 0.20 0.98 21664 2 1.02 KU N 3 68.80 0.34 -0.54 0.65 12913 3 2.02 TH N 2 65.69 0.24 -0.49 0.43 14892 5 2.02 KU R 2 88.80 0.24 -2.34 0.53 24775 6 2.04 TH R 3 45.28 0.29 0.76 0.79 14898 8 3.03 KU R 3 67.97 0.42 -0.53 0.84 24747 9 2.06 AP N 4* 54.61(2.18) 0.61 -0.47 0.60 12907 11 3.03 TH R 4* 59.22(2.37) 0.63 -0.97 0.56 24730 12 1.03 AP G 4* 75.19(3.01) 0.60 -1.39 0.57 12884 16 2.04 TH G 4 47.95 0.39 0.52 0.96 24740 17 3.02 AP G 1 76.16 0.43 -0.80 0.97 21673 18 3.03 KU G 3 92.27 0.27 -2.25 0.77 22537 19 2.03 AP M 3 75.88 0.28 -1.16 0.50 24707 21 2.06 TH M 2 71.14 0.40 -0.62 0.79 22545 22 3.01 AP M 2 65.32 0.39 -0.26 0.65 15634 NR 2.03 AP N 1 56.35 0.37 0.14 0.79 15670 NR 2.08 KU N 1 64.49 0.39 -0.27 0.79 21612 NR 1.01 TH R 4 79.66 0.26 -1.55 0.48 24736 NR 2.01 AP R 3 86.79 0.30 -1.80 0.67 24757 NR 3.01 AP R 3 86.12 0.27 -1.99 0.55 24787 NR 2.05 AP R 4* 65.74(2.63) 0.61 -1.16 0.53 24701 NR 1.01 AP G 4 72.61 0.45 -0.58 1.09 15639 NR 1.03 AP G 1 70.74 0.49 -0.51 1.19 24779 NR 2.02 KU G 4 69.12 0.50 -0.42 1.30 24741 NR 3.04 TH G 4 62.39 0.38 -0.17 0.73 15702 NR 3.05 TH G 4* 67.75(2.71) 0.49 -1.52 0.37 24725 NR 1.05 TH M 4 57.81 0.43 0.05 0.87 24745 NR 2.05 KU M 3 84.35 0.34 -1.51 0.72 24727 NR 3.01 KU M 2 76.77 0.38 -0.94 0.77 21681 NR 2.06 TH M 4* 77.87(3.11) 0.40 -3.19 0.26 24770 NR 3.02 AP M 4* 75.61(3.02) 0.49 -1.95 0.34
Note. The guessing parameter was set at a constant of 0.2 for multiple-choice items. KU = knowledge and understanding; AP = application; TH = thinking; G = analytic geometry; N = number sense and algebra; M = measurement and geometry; R = linear relations; NR = not released. **See overall expectations for the associated strand in The Ontario Curriculum, Grades 9 and 10: Mathematics (revised 2005). *Maximum score code for open-response (OR) items. ( ) = mean score for OR items.
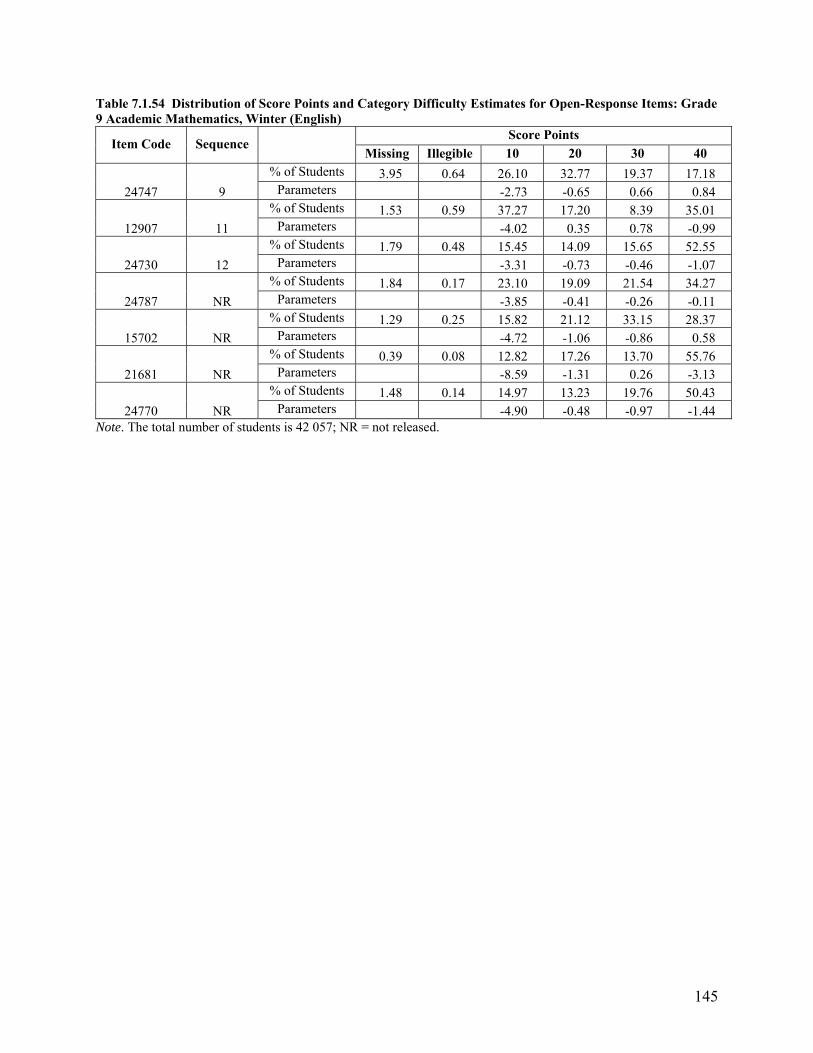
145
Table 7.1.54 Distribution of Score Points and Category Difficulty Estimates for Open-Response Items: Grade 9 Academic Mathematics, Winter (English)
Item Code Sequence Score Points
Missing Illegible 10 20 30 40
24747 9
% of Students 3.95 0.64 26.10 32.77 19.37 17.18 Parameters -2.73 -0.65 0.66 0.84
12907 11
% of Students 1.53 0.59 37.27 17.20 8.39 35.01 Parameters -4.02 0.35 0.78 -0.99
24730 12
% of Students 1.79 0.48 15.45 14.09 15.65 52.55 Parameters -3.31 -0.73 -0.46 -1.07
24787 NR
% of Students 1.84 0.17 23.10 19.09 21.54 34.27 Parameters -3.85 -0.41 -0.26 -0.11
15702 NR
% of Students 1.29 0.25 15.82 21.12 33.15 28.37 Parameters -4.72 -1.06 -0.86 0.58
21681 NR
% of Students 0.39 0.08 12.82 17.26 13.70 55.76 Parameters -8.59 -1.31 0.26 -3.13
24770 NR
% of Students 1.48 0.14 14.97 13.23 19.76 50.43 Parameters -4.90 -0.48 -0.97 -1.44
Note. The total number of students is 42 057; NR = not released.
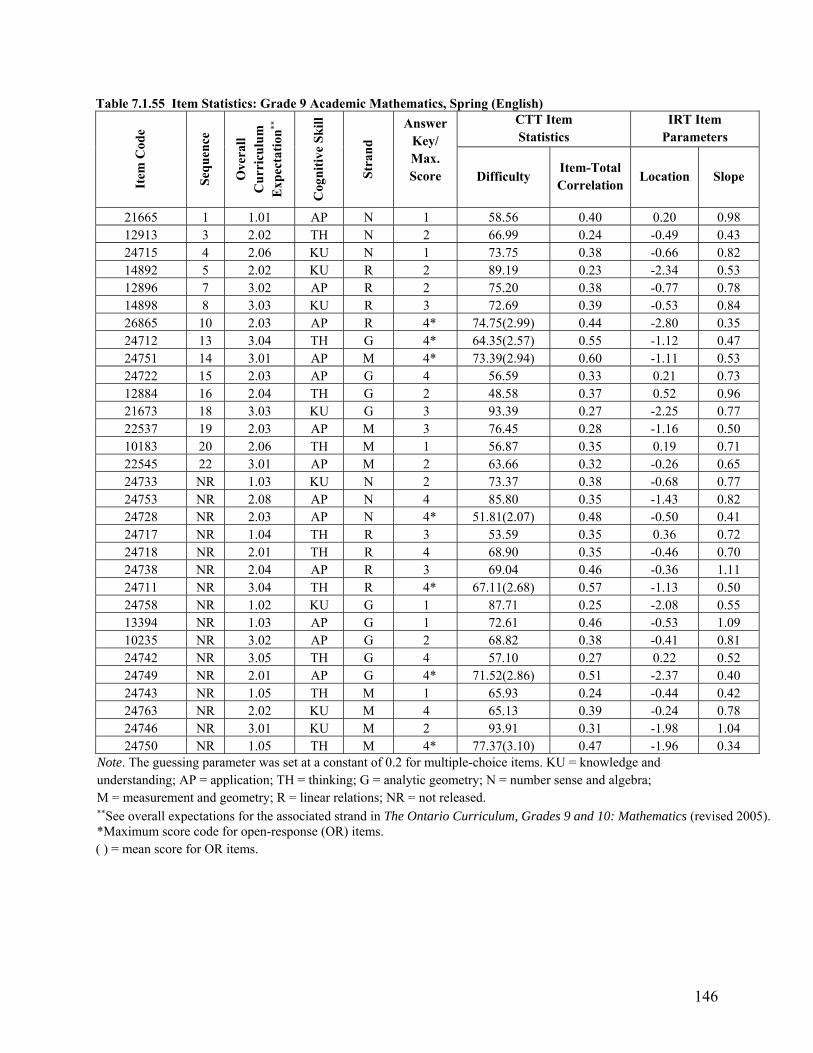
146
Table 7.1.55 Item Statistics: Grade 9 Academic Mathematics, Spring (English)
Item
Cod
e
Seq
uen
ce
Ove
rall
Cu
rric
ulu
m
Exp
ecta
tion
**
Cog
nit
ive
Sk
ill
Str
and
Answer Key/ Max. Score
CTT Item Statistics
IRT Item Parameters
Difficulty Item-Total Correlation
Location Slope
21665 1 1.01 AP N 1 58.56 0.40 0.20 0.98 12913 3 2.02 TH N 2 66.99 0.24 -0.49 0.43 24715 4 2.06 KU N 1 73.75 0.38 -0.66 0.82 14892 5 2.02 KU R 2 89.19 0.23 -2.34 0.53 12896 7 3.02 AP R 2 75.20 0.38 -0.77 0.78 14898 8 3.03 KU R 3 72.69 0.39 -0.53 0.84 26865 10 2.03 AP R 4* 74.75(2.99) 0.44 -2.80 0.35 24712 13 3.04 TH G 4* 64.35(2.57) 0.55 -1.12 0.47 24751 14 3.01 AP M 4* 73.39(2.94) 0.60 -1.11 0.53 24722 15 2.03 AP G 4 56.59 0.33 0.21 0.73 12884 16 2.04 TH G 2 48.58 0.37 0.52 0.96 21673 18 3.03 KU G 3 93.39 0.27 -2.25 0.77 22537 19 2.03 AP M 3 76.45 0.28 -1.16 0.50 10183 20 2.06 TH M 1 56.87 0.35 0.19 0.71 22545 22 3.01 AP M 2 63.66 0.32 -0.26 0.65 24733 NR 1.03 KU N 2 73.37 0.38 -0.68 0.77 24753 NR 2.08 AP N 4 85.80 0.35 -1.43 0.82 24728 NR 2.03 AP N 4* 51.81(2.07) 0.48 -0.50 0.41 24717 NR 1.04 TH R 3 53.59 0.35 0.36 0.72 24718 NR 2.01 TH R 4 68.90 0.35 -0.46 0.70 24738 NR 2.04 AP R 3 69.04 0.46 -0.36 1.11 24711 NR 3.04 TH R 4* 67.11(2.68) 0.57 -1.13 0.50 24758 NR 1.02 KU G 1 87.71 0.25 -2.08 0.55 13394 NR 1.03 AP G 1 72.61 0.46 -0.53 1.09 10235 NR 3.02 AP G 2 68.82 0.38 -0.41 0.81 24742 NR 3.05 TH G 4 57.10 0.27 0.22 0.52 24749 NR 2.01 AP G 4* 71.52(2.86) 0.51 -2.37 0.40 24743 NR 1.05 TH M 1 65.93 0.24 -0.44 0.42 24763 NR 2.02 KU M 4 65.13 0.39 -0.24 0.78 24746 NR 3.01 KU M 2 93.91 0.31 -1.98 1.04 24750 NR 1.05 TH M 4* 77.37(3.10) 0.47 -1.96 0.34
Note. The guessing parameter was set at a constant of 0.2 for multiple-choice items. KU = knowledge and understanding; AP = application; TH = thinking; G = analytic geometry; N = number sense and algebra; M = measurement and geometry; R = linear relations; NR = not released. **See overall expectations for the associated strand in The Ontario Curriculum, Grades 9 and 10: Mathematics (revised 2005). *Maximum score code for open-response (OR) items. ( ) = mean score for OR items.
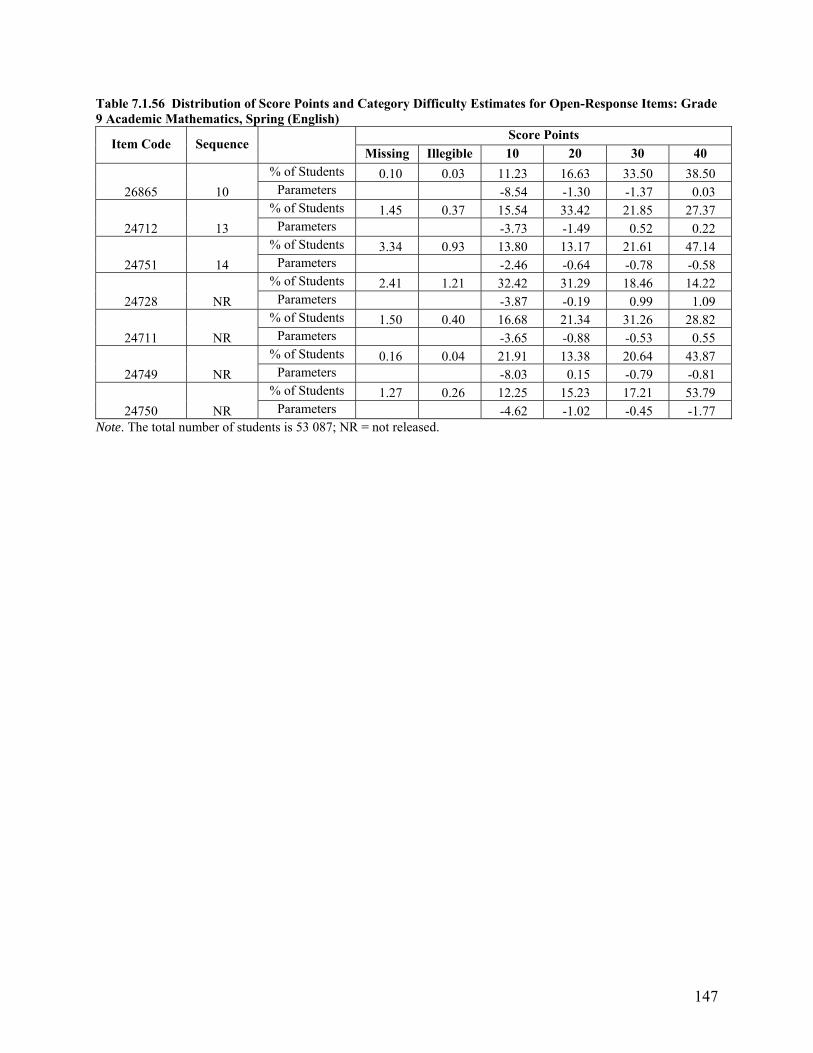
147
Table 7.1.56 Distribution of Score Points and Category Difficulty Estimates for Open-Response Items: Grade 9 Academic Mathematics, Spring (English)
Item Code Sequence Score Points
Missing Illegible 10 20 30 40
26865 10
% of Students 0.10 0.03 11.23 16.63 33.50 38.50 Parameters -8.54 -1.30 -1.37 0.03
24712 13
% of Students 1.45 0.37 15.54 33.42 21.85 27.37 Parameters -3.73 -1.49 0.52 0.22
24751 14
% of Students 3.34 0.93 13.80 13.17 21.61 47.14 Parameters -2.46 -0.64 -0.78 -0.58
24728 NR
% of Students 2.41 1.21 32.42 31.29 18.46 14.22 Parameters -3.87 -0.19 0.99 1.09
24711 NR
% of Students 1.50 0.40 16.68 21.34 31.26 28.82 Parameters -3.65 -0.88 -0.53 0.55
24749 NR
% of Students 0.16 0.04 21.91 13.38 20.64 43.87 Parameters -8.03 0.15 -0.79 -0.81
24750 NR
% of Students 1.27 0.26 12.25 15.23 17.21 53.79 Parameters -4.62 -1.02 -0.45 -1.77
Note. The total number of students is 53 087; NR = not released.
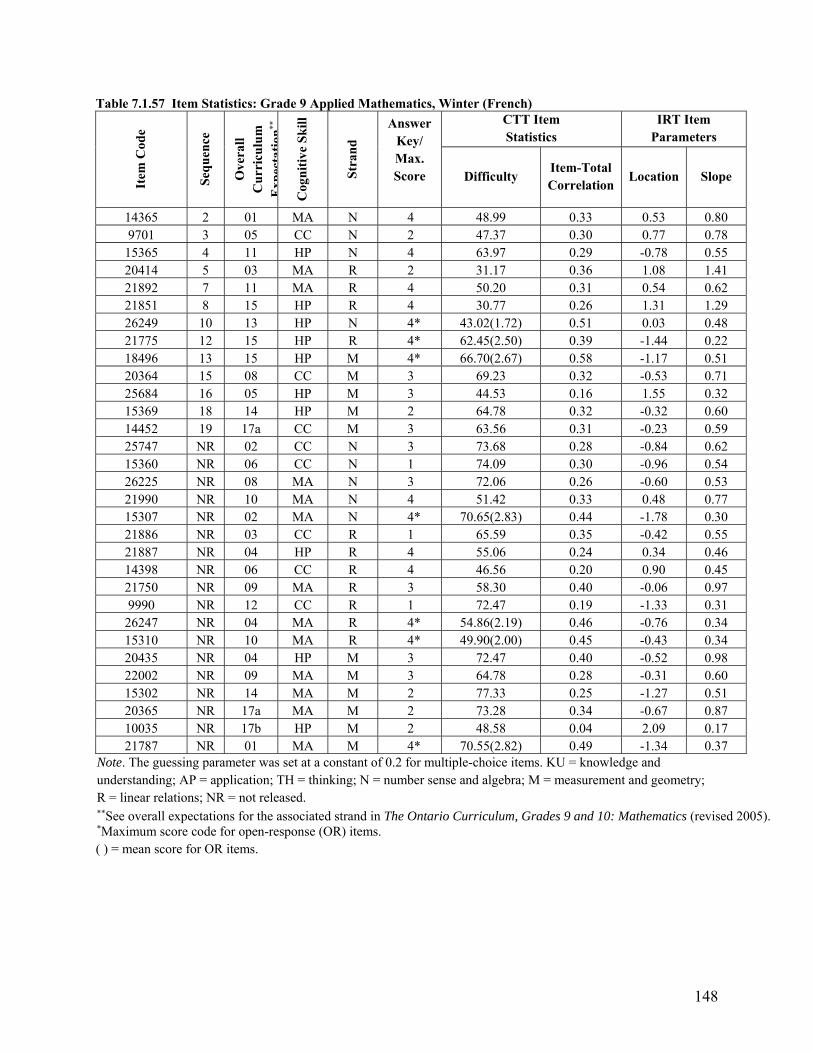
148
Table 7.1.57 Item Statistics: Grade 9 Applied Mathematics, Winter (French)
Item
Cod
e
Seq
uen
ce
Ove
rall
Cu
rric
ulu
m
Exp
ecta
tion
**
Cog
nit
ive
Sk
ill
Str
and
Answer Key/ Max. Score
CTT Item Statistics
IRT Item Parameters
Difficulty Item-Total Correlation
Location Slope
14365 2 01 MA N 4 48.99 0.33 0.53 0.80 9701 3 05 CC N 2 47.37 0.30 0.77 0.78
15365 4 11 HP N 4 63.97 0.29 -0.78 0.55 20414 5 03 MA R 2 31.17 0.36 1.08 1.41 21892 7 11 MA R 4 50.20 0.31 0.54 0.62 21851 8 15 HP R 4 30.77 0.26 1.31 1.29 26249 10 13 HP N 4* 43.02(1.72) 0.51 0.03 0.48 21775 12 15 HP R 4* 62.45(2.50) 0.39 -1.44 0.22 18496 13 15 HP M 4* 66.70(2.67) 0.58 -1.17 0.51 20364 15 08 CC M 3 69.23 0.32 -0.53 0.71 25684 16 05 HP M 3 44.53 0.16 1.55 0.32 15369 18 14 HP M 2 64.78 0.32 -0.32 0.60 14452 19 17a CC M 3 63.56 0.31 -0.23 0.59 25747 NR 02 CC N 3 73.68 0.28 -0.84 0.62 15360 NR 06 CC N 1 74.09 0.30 -0.96 0.54 26225 NR 08 MA N 3 72.06 0.26 -0.60 0.53 21990 NR 10 MA N 4 51.42 0.33 0.48 0.77 15307 NR 02 MA N 4* 70.65(2.83) 0.44 -1.78 0.30 21886 NR 03 CC R 1 65.59 0.35 -0.42 0.55 21887 NR 04 HP R 4 55.06 0.24 0.34 0.46 14398 NR 06 CC R 4 46.56 0.20 0.90 0.45 21750 NR 09 MA R 3 58.30 0.40 -0.06 0.97 9990 NR 12 CC R 1 72.47 0.19 -1.33 0.31
26247 NR 04 MA R 4* 54.86(2.19) 0.46 -0.76 0.34 15310 NR 10 MA R 4* 49.90(2.00) 0.45 -0.43 0.34 20435 NR 04 HP M 3 72.47 0.40 -0.52 0.98 22002 NR 09 MA M 3 64.78 0.28 -0.31 0.60 15302 NR 14 MA M 2 77.33 0.25 -1.27 0.51 20365 NR 17a MA M 2 73.28 0.34 -0.67 0.87 10035 NR 17b HP M 2 48.58 0.04 2.09 0.17 21787 NR 01 MA M 4* 70.55(2.82) 0.49 -1.34 0.37
Note. The guessing parameter was set at a constant of 0.2 for multiple-choice items. KU = knowledge and understanding; AP = application; TH = thinking; N = number sense and algebra; M = measurement and geometry; R = linear relations; NR = not released. **See overall expectations for the associated strand in The Ontario Curriculum, Grades 9 and 10: Mathematics (revised 2005). *Maximum score code for open-response (OR) items. ( ) = mean score for OR items.

149
Table 7.1.58 Distribution of Score Points and Category Difficulty Estimates for Open-Response Items: Grade 9 Applied Mathematics, Winter (French)
Item Code Sequence Score Points
Missing Illegible 10 20 30 40
26249 10
% of Students 2.83 4.05 42.91 30.36 10.93 8.91 Parameters -2.97 0.30 1.66 1.13
21775 12
% of Students 4.05 0.81 22.67 21.86 19.03 31.58 Parameters -4.79 -0.24 0.35 -1.08
18496 13
% of Students 1.62 0.81 15.79 32.39 11.34 38.06 Parameters -3.31 -1.45 1.09 -0.99
15307 27
% of Students 1.62 0.40 13.77 21.46 25.10 37.65 Parameters -4.68 -1.42 -0.46 -0.55
26247 NR
% of Students 3.24 1.62 32.79 21.86 19.03 21.46 Parameters -4.08 0.40 0.35 0.29
15310 NR
% of Students 5.26 2.43 32.39 31.98 8.50 19.43 Parameters -3.17 -0.20 2.50 -0.85
21787 NR
% of Students 1.21 3.24 17.00 16.60 15.79 46.15 Parameters -3.16 -0.93 0.02 -1.30
Note. The total number of students is 247; NR = not released.

150
Table 7.1.59 Item Statistics: Grade 9 Applied Mathematics, Spring (French)
Item
Cod
e
Seq
uen
ce
Ove
rall
Cu
rric
ulu
m
Exp
ecta
tion
**
Cog
nit
ive
Sk
ill
Str
and
Answer Key/ Max. Score
CTT Item Statistics
IRT Item Parameters
Difficulty Item-Total Correlation
Location Slope
25723 1 01 CC N 2 89.96 0.18 -2.88 0.44 9701 3 05 CC N 2 45.03 0.33 0.77 0.78
15365 4 11 HP N 4 74.22 0.27 -0.78 0.55 20414 5 03 MA R 2 33.75 0.36 1.08 1.41 25739 6 04 HP R 4 37.47 0.25 1.35 0.68 21851 8 15 HP R 4 29.30 0.36 1.31 1.29 20370 9 01 MA N 4* 53.44(2.14) 0.44 -0.55 0.34 20449 11 09 MA R 4* 51.35(2.05) 0.53 -0.71 0.42 12466 14 15 HP M 4* 67.24(2.69) 0.52 -1.30 0.44 20364 15 08 CC M 3 69.57 0.39 -0.53 0.71 25765 17 14 MA M 2 63.35 0.25 -0.23 0.47 15369 18 14 HP M 2 65.42 0.32 -0.32 0.60 14454 20 17a HP M 4 51.66 0.38 0.40 0.93 15292 NR 02 MA N 4 48.55 0.32 0.67 0.62 21835 NR 05 CC N 1 75.57 0.22 -1.36 0.39 26225 NR 08 MA N 3 68.43 0.29 -0.60 0.53 21990 NR 10 MA N 4 49.69 0.38 0.48 0.77 30654 NR 09 HP N 4* 66.30(2.65) 0.46 -1.41 0.31 21886 NR 03 CC R 1 66.87 0.27 -0.42 0.55 14398 NR 06 CC R 4 48.34 0.24 0.90 0.45 21750 NR 09 MA R 3 62.42 0.43 -0.06 0.97 21751 NR 13 CC R 3 62.11 0.22 -0.16 0.39 21875 NR 12 MA R 2 46.07 0.31 0.76 0.77 20426 NR 03 MA R 4* 49.20(1.97) 0.55 -0.71 0.49 22020 NR 15 HP R 4* 51.84(2.07) 0.55 -0.48 0.44 20435 NR 04 HP M 3 71.12 0.43 -0.52 0.98 26234 NR 06 MA M 2 67.91 0.31 -0.50 0.57 21879 NR 05 HP M 1 63.35 0.31 -0.17 0.65 26289 NR 17a CC M 2 73.60 0.36 -0.69 0.78 20365 NR 17a MA M 2 73.91 0.39 -0.67 0.87 21787 NR 01 MA M 4* 71.40(2.86) 0.49 -1.34 0.37
Note. The guessing parameter was set at a constant of 0.2 for multiple-choice items. KU = knowledge and understanding; AP = application; TH = thinking; N = number sense and algebra; M = measurement and geometry; R = linear relations; NR = not released. **See overall expectations for the associated strand in The Ontario Curriculum, Grades 9 and 10: Mathematics (revised 2005). *Maximum score code for open-response (OR) items. ( ) = mean score for OR items.
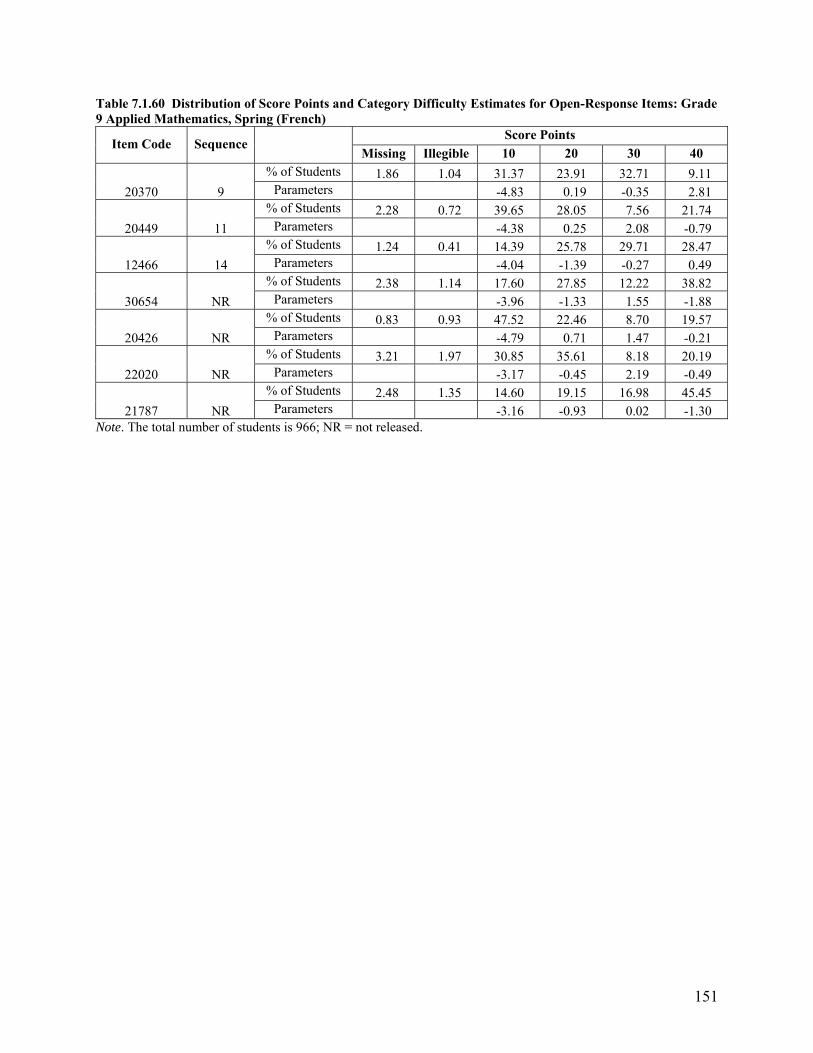
151
Table 7.1.60 Distribution of Score Points and Category Difficulty Estimates for Open-Response Items: Grade 9 Applied Mathematics, Spring (French)
Item Code Sequence Score Points
Missing Illegible 10 20 30 40
20370 9
% of Students 1.86 1.04 31.37 23.91 32.71 9.11 Parameters -4.83 0.19 -0.35 2.81
20449 11
% of Students 2.28 0.72 39.65 28.05 7.56 21.74 Parameters -4.38 0.25 2.08 -0.79
12466 14
% of Students 1.24 0.41 14.39 25.78 29.71 28.47 Parameters -4.04 -1.39 -0.27 0.49
30654 NR
% of Students 2.38 1.14 17.60 27.85 12.22 38.82 Parameters -3.96 -1.33 1.55 -1.88
20426 NR
% of Students 0.83 0.93 47.52 22.46 8.70 19.57 Parameters -4.79 0.71 1.47 -0.21
22020 NR
% of Students 3.21 1.97 30.85 35.61 8.18 20.19 Parameters -3.17 -0.45 2.19 -0.49
21787 NR
% of Students 2.48 1.35 14.60 19.15 16.98 45.45 Parameters -3.16 -0.93 0.02 -1.30
Note. The total number of students is 966; NR = not released.
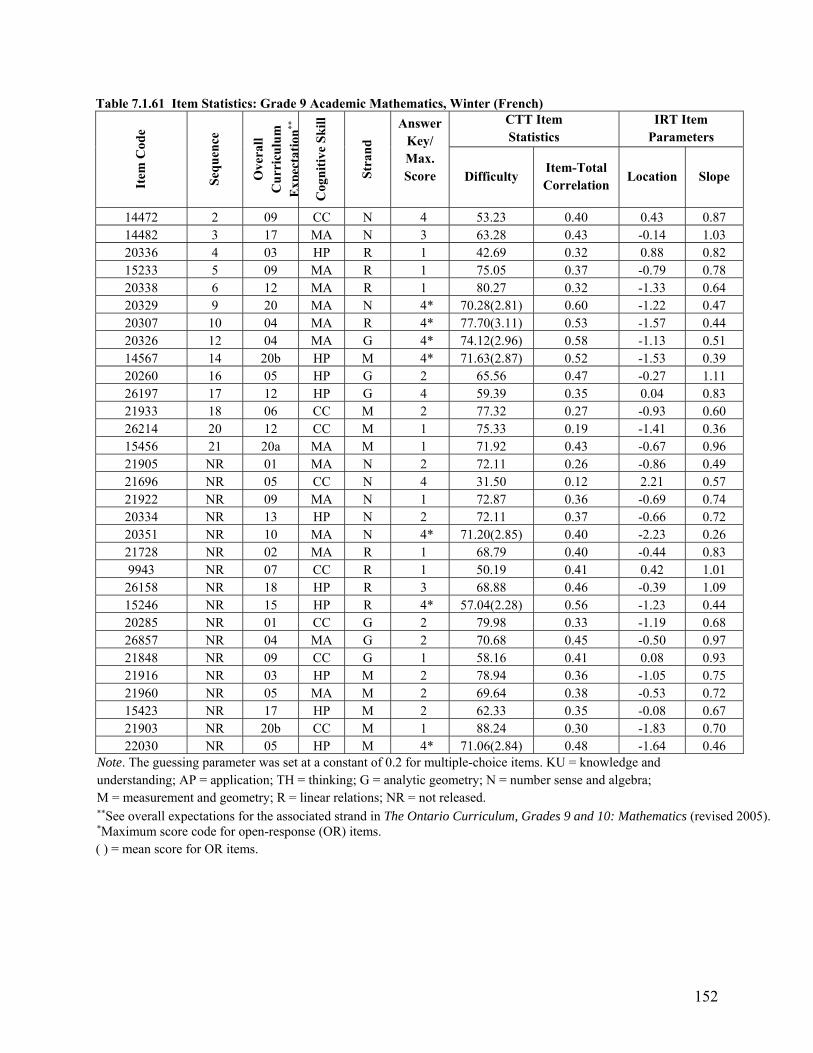
152
Table 7.1.61 Item Statistics: Grade 9 Academic Mathematics, Winter (French)
Item
Cod
e
Seq
uen
ce
Ove
rall
Cu
rric
ulu
m
Exp
ecta
tion
**
Cog
nit
ive
Sk
ill
Str
and
Answer Key/ Max. Score
CTT Item Statistics
IRT Item Parameters
Difficulty Item-Total Correlation
Location Slope
14472 2 09 CC N 4 53.23 0.40 0.43 0.87 14482 3 17 MA N 3 63.28 0.43 -0.14 1.03 20336 4 03 HP R 1 42.69 0.32 0.88 0.82 15233 5 09 MA R 1 75.05 0.37 -0.79 0.78 20338 6 12 MA R 1 80.27 0.32 -1.33 0.64 20329 9 20 MA N 4* 70.28(2.81) 0.60 -1.22 0.47 20307 10 04 MA R 4* 77.70(3.11) 0.53 -1.57 0.44 20326 12 04 MA G 4* 74.12(2.96) 0.58 -1.13 0.51 14567 14 20b HP M 4* 71.63(2.87) 0.52 -1.53 0.39 20260 16 05 HP G 2 65.56 0.47 -0.27 1.11 26197 17 12 HP G 4 59.39 0.35 0.04 0.83 21933 18 06 CC M 2 77.32 0.27 -0.93 0.60 26214 20 12 CC M 1 75.33 0.19 -1.41 0.36 15456 21 20a MA M 1 71.92 0.43 -0.67 0.96 21905 NR 01 MA N 2 72.11 0.26 -0.86 0.49 21696 NR 05 CC N 4 31.50 0.12 2.21 0.57 21922 NR 09 MA N 1 72.87 0.36 -0.69 0.74 20334 NR 13 HP N 2 72.11 0.37 -0.66 0.72 20351 NR 10 MA N 4* 71.20(2.85) 0.40 -2.23 0.26 21728 NR 02 MA R 1 68.79 0.40 -0.44 0.83 9943 NR 07 CC R 1 50.19 0.41 0.42 1.01
26158 NR 18 HP R 3 68.88 0.46 -0.39 1.09 15246 NR 15 HP R 4* 57.04(2.28) 0.56 -1.23 0.44 20285 NR 01 CC G 2 79.98 0.33 -1.19 0.68 26857 NR 04 MA G 2 70.68 0.45 -0.50 0.97 21848 NR 09 CC G 1 58.16 0.41 0.08 0.93 21916 NR 03 HP M 2 78.94 0.36 -1.05 0.75 21960 NR 05 MA M 2 69.64 0.38 -0.53 0.72 15423 NR 17 HP M 2 62.33 0.35 -0.08 0.67 21903 NR 20b CC M 1 88.24 0.30 -1.83 0.70 22030 NR 05 HP M 4* 71.06(2.84) 0.48 -1.64 0.46
Note. The guessing parameter was set at a constant of 0.2 for multiple-choice items. KU = knowledge and understanding; AP = application; TH = thinking; G = analytic geometry; N = number sense and algebra; M = measurement and geometry; R = linear relations; NR = not released. **See overall expectations for the associated strand in The Ontario Curriculum, Grades 9 and 10: Mathematics (revised 2005). *Maximum score code for open-response (OR) items. ( ) = mean score for OR items.
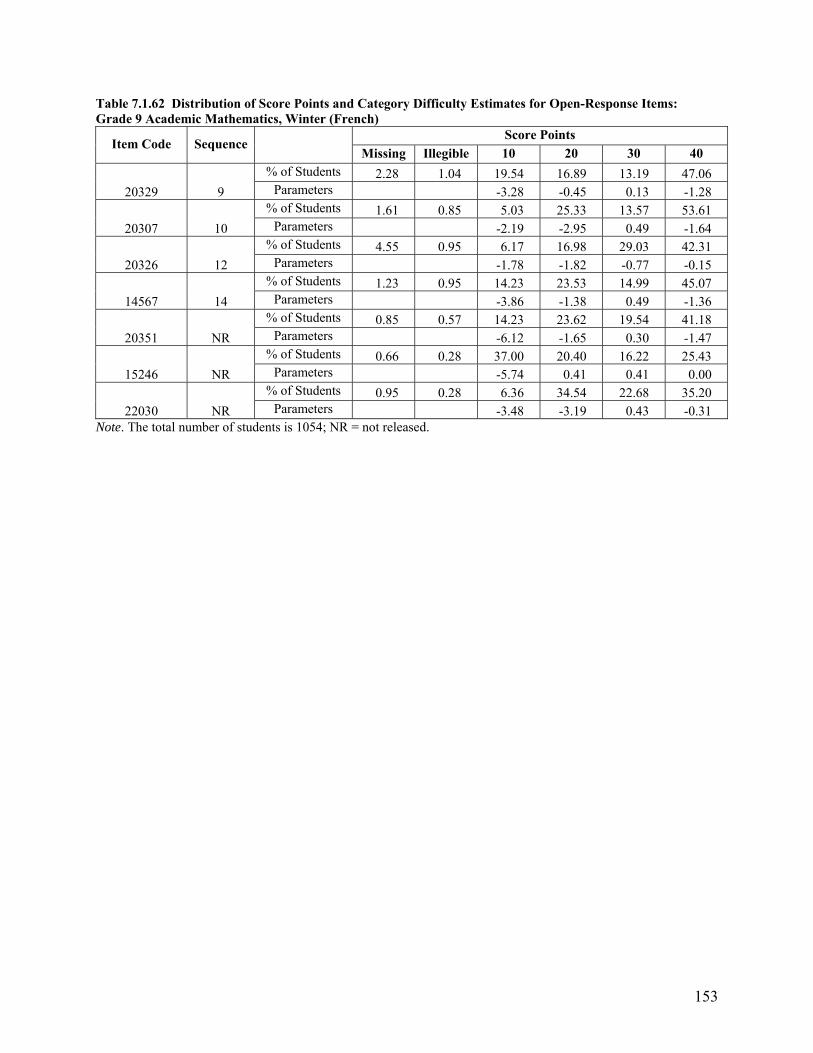
153
Table 7.1.62 Distribution of Score Points and Category Difficulty Estimates for Open-Response Items: Grade 9 Academic Mathematics, Winter (French)
Item Code Sequence Score Points
Missing Illegible 10 20 30 40
20329 9
% of Students 2.28 1.04 19.54 16.89 13.19 47.06 Parameters -3.28 -0.45 0.13 -1.28
20307 10
% of Students 1.61 0.85 5.03 25.33 13.57 53.61 Parameters -2.19 -2.95 0.49 -1.64
20326 12
% of Students 4.55 0.95 6.17 16.98 29.03 42.31 Parameters -1.78 -1.82 -0.77 -0.15
14567 14
% of Students 1.23 0.95 14.23 23.53 14.99 45.07 Parameters -3.86 -1.38 0.49 -1.36
20351 NR
% of Students 0.85 0.57 14.23 23.62 19.54 41.18 Parameters -6.12 -1.65 0.30 -1.47
15246 NR
% of Students 0.66 0.28 37.00 20.40 16.22 25.43 Parameters -5.74 0.41 0.41 0.00
22030 NR
% of Students 0.95 0.28 6.36 34.54 22.68 35.20 Parameters -3.48 -3.19 0.43 -0.31
Note. The total number of students is 1054; NR = not released.
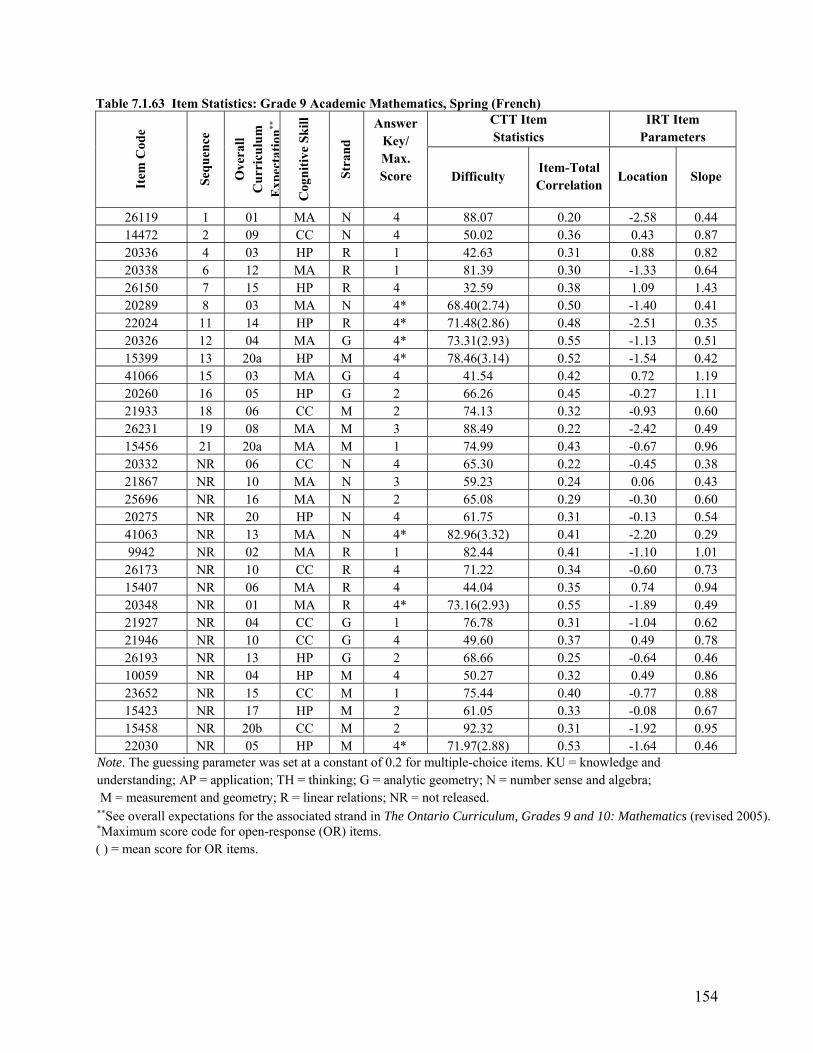
154
Table 7.1.63 Item Statistics: Grade 9 Academic Mathematics, Spring (French)
Item
Cod
e
Seq
uen
ce
Ove
rall
Cu
rric
ulu
m
Exp
ecta
tion
**
Cog
nit
ive
Sk
ill
Str
and
Answer Key/ Max. Score
CTT Item Statistics
IRT Item Parameters
Difficulty Item-Total Correlation
Location Slope
26119 1 01 MA N 4 88.07 0.20 -2.58 0.44 14472 2 09 CC N 4 50.02 0.36 0.43 0.87 20336 4 03 HP R 1 42.63 0.31 0.88 0.82 20338 6 12 MA R 1 81.39 0.30 -1.33 0.64 26150 7 15 HP R 4 32.59 0.38 1.09 1.43 20289 8 03 MA N 4* 68.40(2.74) 0.50 -1.40 0.41 22024 11 14 HP R 4* 71.48(2.86) 0.48 -2.51 0.35 20326 12 04 MA G 4* 73.31(2.93) 0.55 -1.13 0.51 15399 13 20a HP M 4* 78.46(3.14) 0.52 -1.54 0.42 41066 15 03 MA G 4 41.54 0.42 0.72 1.19 20260 16 05 HP G 2 66.26 0.45 -0.27 1.11 21933 18 06 CC M 2 74.13 0.32 -0.93 0.60 26231 19 08 MA M 3 88.49 0.22 -2.42 0.49 15456 21 20a MA M 1 74.99 0.43 -0.67 0.96 20332 NR 06 CC N 4 65.30 0.22 -0.45 0.38 21867 NR 10 MA N 3 59.23 0.24 0.06 0.43 25696 NR 16 MA N 2 65.08 0.29 -0.30 0.60 20275 NR 20 HP N 4 61.75 0.31 -0.13 0.54 41063 NR 13 MA N 4* 82.96(3.32) 0.41 -2.20 0.29 9942 NR 02 MA R 1 82.44 0.41 -1.10 1.01
26173 NR 10 CC R 4 71.22 0.34 -0.60 0.73 15407 NR 06 MA R 4 44.04 0.35 0.74 0.94 20348 NR 01 MA R 4* 73.16(2.93) 0.55 -1.89 0.49 21927 NR 04 CC G 1 76.78 0.31 -1.04 0.62 21946 NR 10 CC G 4 49.60 0.37 0.49 0.78 26193 NR 13 HP G 2 68.66 0.25 -0.64 0.46 10059 NR 04 HP M 4 50.27 0.32 0.49 0.86 23652 NR 15 CC M 1 75.44 0.40 -0.77 0.88 15423 NR 17 HP M 2 61.05 0.33 -0.08 0.67 15458 NR 20b CC M 2 92.32 0.31 -1.92 0.95 22030 NR 05 HP M 4* 71.97(2.88) 0.53 -1.64 0.46
Note. The guessing parameter was set at a constant of 0.2 for multiple-choice items. KU = knowledge and understanding; AP = application; TH = thinking; G = analytic geometry; N = number sense and algebra; M = measurement and geometry; R = linear relations; NR = not released. **See overall expectations for the associated strand in The Ontario Curriculum, Grades 9 and 10: Mathematics (revised 2005). *Maximum score code for open-response (OR) items. ( ) = mean score for OR items.
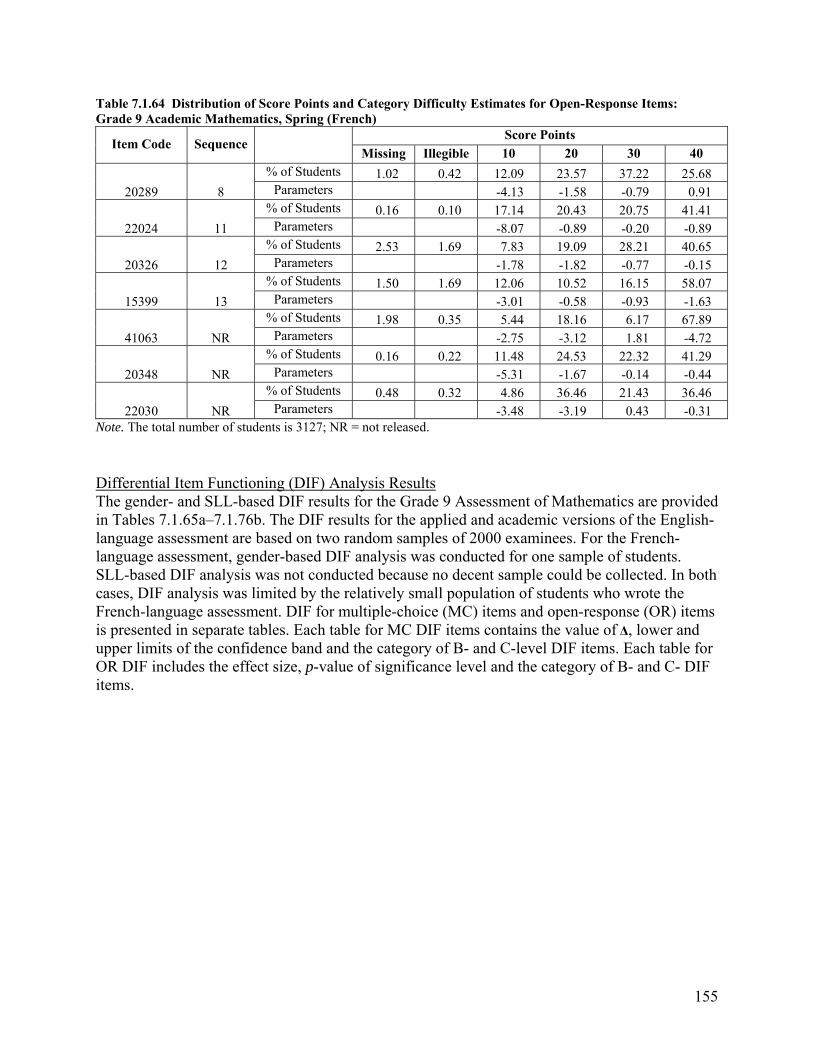
155
Table 7.1.64 Distribution of Score Points and Category Difficulty Estimates for Open-Response Items: Grade 9 Academic Mathematics, Spring (French)
Item Code Sequence Score Points
Missing Illegible 10 20 30 40
20289 8
% of Students 1.02 0.42 12.09 23.57 37.22 25.68 Parameters -4.13 -1.58 -0.79 0.91
22024 11
% of Students 0.16 0.10 17.14 20.43 20.75 41.41 Parameters -8.07 -0.89 -0.20 -0.89
20326 12
% of Students 2.53 1.69 7.83 19.09 28.21 40.65 Parameters -1.78 -1.82 -0.77 -0.15
15399 13
% of Students 1.50 1.69 12.06 10.52 16.15 58.07 Parameters -3.01 -0.58 -0.93 -1.63
41063 NR
% of Students 1.98 0.35 5.44 18.16 6.17 67.89 Parameters -2.75 -3.12 1.81 -4.72
20348 NR
% of Students 0.16 0.22 11.48 24.53 22.32 41.29 Parameters -5.31 -1.67 -0.14 -0.44
22030 NR
% of Students 0.48 0.32 4.86 36.46 21.43 36.46 Parameters -3.48 -3.19 0.43 -0.31
Note. The total number of students is 3127; NR = not released.
Differential Item Functioning (DIF) Analysis Results The gender- and SLL-based DIF results for the Grade 9 Assessment of Mathematics are provided in Tables 7.1.65a–7.1.76b. The DIF results for the applied and academic versions of the English-language assessment are based on two random samples of 2000 examinees. For the French-language assessment, gender-based DIF analysis was conducted for one sample of students. SLL-based DIF analysis was not conducted because no decent sample could be collected. In both cases, DIF analysis was limited by the relatively small population of students who wrote the French-language assessment. DIF for multiple-choice (MC) items and open-response (OR) items is presented in separate tables. Each table for MC DIF items contains the value of Δ, lower and upper limits of the confidence band and the category of B- and C-level DIF items. Each table for OR DIF includes the effect size, p-value of significance level and the category of B- and C- DIF items.
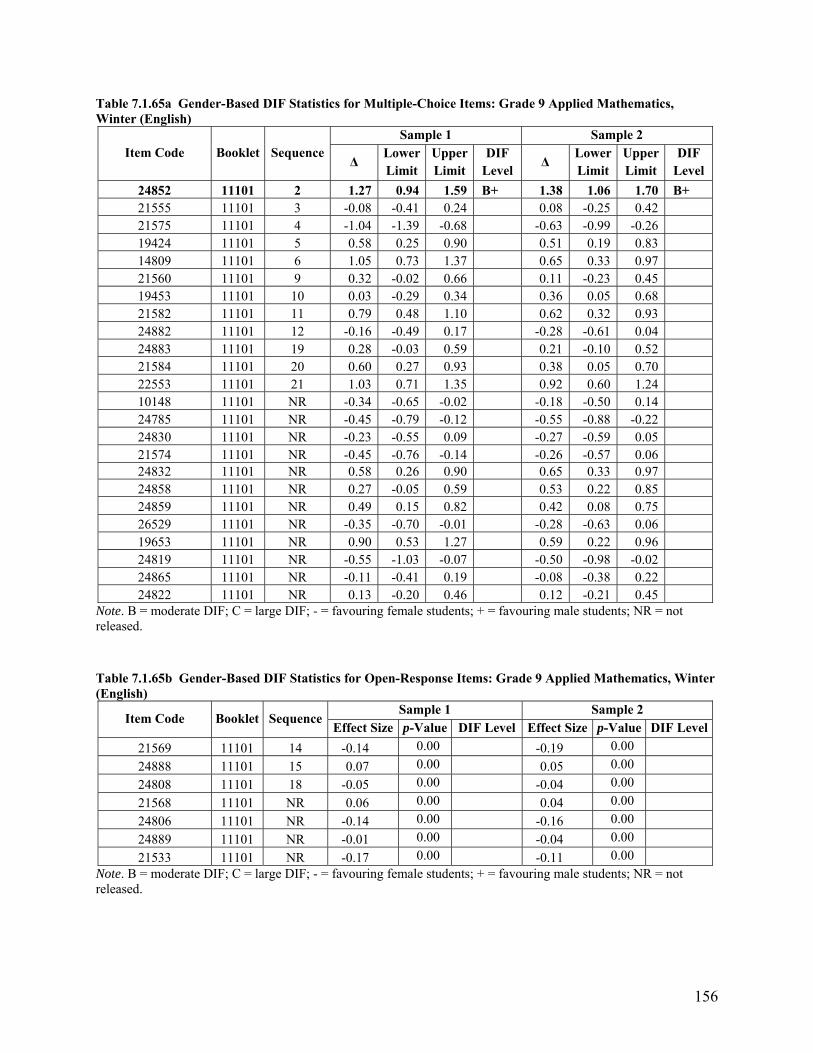
156
Table 7.1.65a Gender-Based DIF Statistics for Multiple-Choice Items: Grade 9 Applied Mathematics, Winter (English)
Item Code Booklet Sequence Sample 1 Sample 2
Δ LowerLimit
UpperLimit
DIF Level
Δ Lower Limit
UpperLimit
DIF Level
24852 11101 2 1.27 0.94 1.59 B+ 1.38 1.06 1.70 B+ 21555 11101 3 -0.08 -0.41 0.24 0.08 -0.25 0.42 21575 11101 4 -1.04 -1.39 -0.68 -0.63 -0.99 -0.26 19424 11101 5 0.58 0.25 0.90 0.51 0.19 0.83 14809 11101 6 1.05 0.73 1.37 0.65 0.33 0.97 21560 11101 9 0.32 -0.02 0.66 0.11 -0.23 0.45 19453 11101 10 0.03 -0.29 0.34 0.36 0.05 0.68 21582 11101 11 0.79 0.48 1.10 0.62 0.32 0.93 24882 11101 12 -0.16 -0.49 0.17 -0.28 -0.61 0.04 24883 11101 19 0.28 -0.03 0.59 0.21 -0.10 0.52 21584 11101 20 0.60 0.27 0.93 0.38 0.05 0.70 22553 11101 21 1.03 0.71 1.35 0.92 0.60 1.24 10148 11101 NR -0.34 -0.65 -0.02 -0.18 -0.50 0.14 24785 11101 NR -0.45 -0.79 -0.12 -0.55 -0.88 -0.22 24830 11101 NR -0.23 -0.55 0.09 -0.27 -0.59 0.05 21574 11101 NR -0.45 -0.76 -0.14 -0.26 -0.57 0.06 24832 11101 NR 0.58 0.26 0.90 0.65 0.33 0.97 24858 11101 NR 0.27 -0.05 0.59 0.53 0.22 0.85 24859 11101 NR 0.49 0.15 0.82 0.42 0.08 0.75 26529 11101 NR -0.35 -0.70 -0.01 -0.28 -0.63 0.06 19653 11101 NR 0.90 0.53 1.27 0.59 0.22 0.96 24819 11101 NR -0.55 -1.03 -0.07 -0.50 -0.98 -0.02 24865 11101 NR -0.11 -0.41 0.19 -0.08 -0.38 0.22 24822 11101 NR 0.13 -0.20 0.46 0.12 -0.21 0.45
Note. B = moderate DIF; C = large DIF; - = favouring female students; + = favouring male students; NR = not released. Table 7.1.65b Gender-Based DIF Statistics for Open-Response Items: Grade 9 Applied Mathematics, Winter (English)
Item Code Booklet Sequence Sample 1 Sample 2
Effect Size p-Value DIF Level Effect Size p-Value DIF Level
21569 11101 14 -0.14 0.00 -0.19 0.00 24888 11101 15 0.07 0.00 0.05 0.00 24808 11101 18 -0.05 0.00 -0.04 0.00 21568 11101 NR 0.06 0.00 0.04 0.00 24806 11101 NR -0.14 0.00 -0.16 0.00 24889 11101 NR -0.01 0.00 -0.04 0.00 21533 11101 NR -0.17 0.00 -0.11 0.00
Note. B = moderate DIF; C = large DIF; - = favouring female students; + = favouring male students; NR = not released.
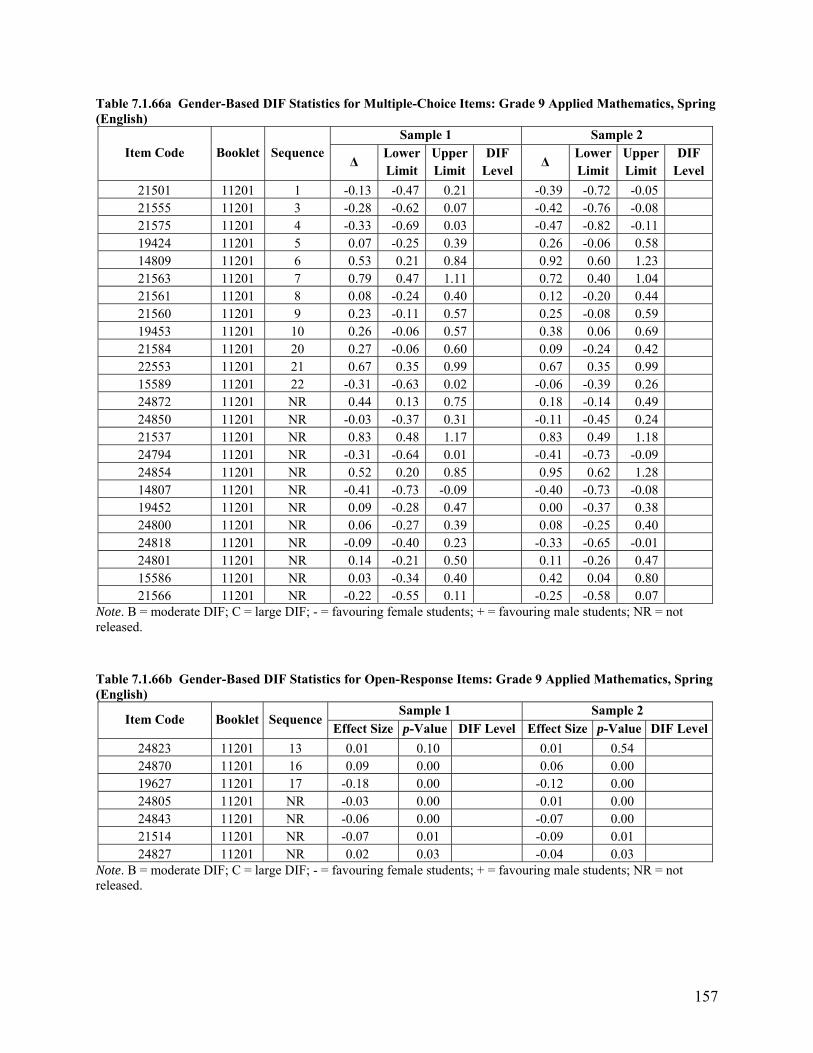
157
Table 7.1.66a Gender-Based DIF Statistics for Multiple-Choice Items: Grade 9 Applied Mathematics, Spring (English)
Item Code Booklet Sequence Sample 1 Sample 2
Δ LowerLimit
UpperLimit
DIF Level
Δ Lower Limit
UpperLimit
DIF Level
21501 11201 1 -0.13 -0.47 0.21 -0.39 -0.72 -0.05 21555 11201 3 -0.28 -0.62 0.07 -0.42 -0.76 -0.08 21575 11201 4 -0.33 -0.69 0.03 -0.47 -0.82 -0.11 19424 11201 5 0.07 -0.25 0.39 0.26 -0.06 0.58 14809 11201 6 0.53 0.21 0.84 0.92 0.60 1.23 21563 11201 7 0.79 0.47 1.11 0.72 0.40 1.04 21561 11201 8 0.08 -0.24 0.40 0.12 -0.20 0.44 21560 11201 9 0.23 -0.11 0.57 0.25 -0.08 0.59 19453 11201 10 0.26 -0.06 0.57 0.38 0.06 0.69 21584 11201 20 0.27 -0.06 0.60 0.09 -0.24 0.42 22553 11201 21 0.67 0.35 0.99 0.67 0.35 0.99 15589 11201 22 -0.31 -0.63 0.02 -0.06 -0.39 0.26 24872 11201 NR 0.44 0.13 0.75 0.18 -0.14 0.49 24850 11201 NR -0.03 -0.37 0.31 -0.11 -0.45 0.24 21537 11201 NR 0.83 0.48 1.17 0.83 0.49 1.18 24794 11201 NR -0.31 -0.64 0.01 -0.41 -0.73 -0.09 24854 11201 NR 0.52 0.20 0.85 0.95 0.62 1.28 14807 11201 NR -0.41 -0.73 -0.09 -0.40 -0.73 -0.08 19452 11201 NR 0.09 -0.28 0.47 0.00 -0.37 0.38 24800 11201 NR 0.06 -0.27 0.39 0.08 -0.25 0.40 24818 11201 NR -0.09 -0.40 0.23 -0.33 -0.65 -0.01 24801 11201 NR 0.14 -0.21 0.50 0.11 -0.26 0.47 15586 11201 NR 0.03 -0.34 0.40 0.42 0.04 0.80 21566 11201 NR -0.22 -0.55 0.11 -0.25 -0.58 0.07
Note. B = moderate DIF; C = large DIF; - = favouring female students; + = favouring male students; NR = not released. Table 7.1.66b Gender-Based DIF Statistics for Open-Response Items: Grade 9 Applied Mathematics, Spring (English)
Item Code Booklet Sequence Sample 1 Sample 2
Effect Size p-Value DIF Level Effect Size p-Value DIF Level
24823 11201 13 0.01 0.10 0.01 0.54 24870 11201 16 0.09 0.00 0.06 0.00 19627 11201 17 -0.18 0.00 -0.12 0.00 24805 11201 NR -0.03 0.00 0.01 0.00 24843 11201 NR -0.06 0.00 -0.07 0.00 21514 11201 NR -0.07 0.01 -0.09 0.01 24827 11201 NR 0.02 0.03 -0.04 0.03
Note. B = moderate DIF; C = large DIF; - = favouring female students; + = favouring male students; NR = not released.
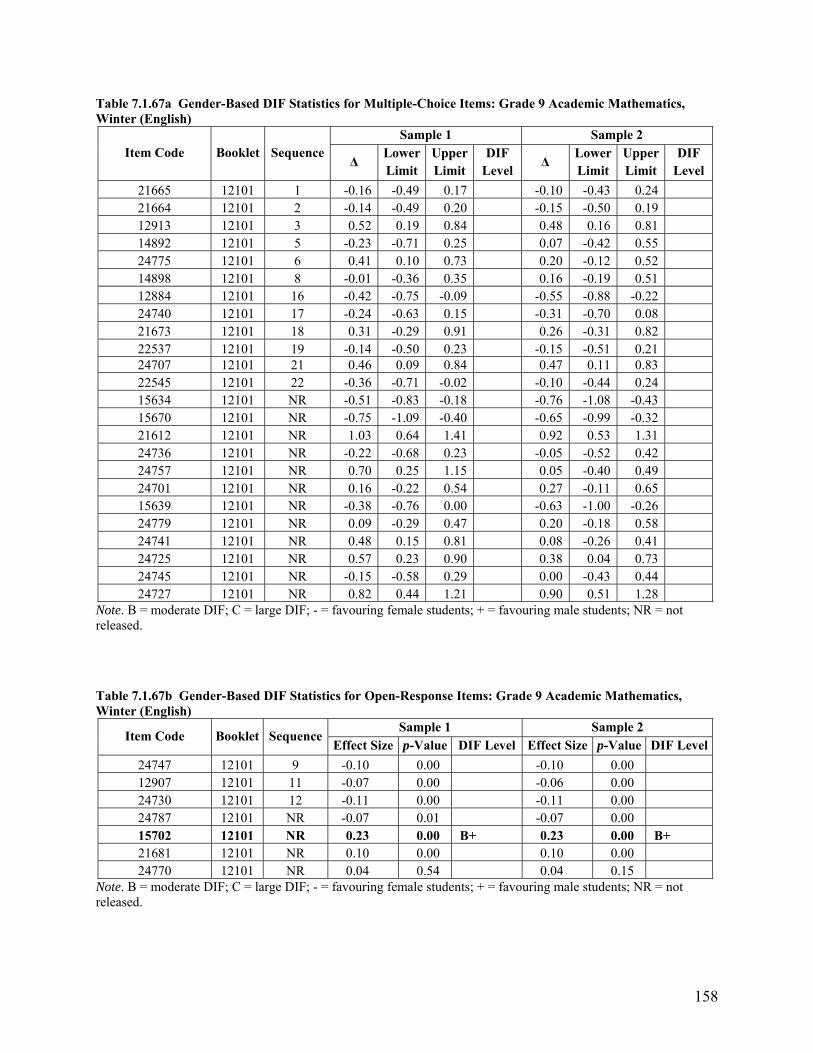
158
Table 7.1.67a Gender-Based DIF Statistics for Multiple-Choice Items: Grade 9 Academic Mathematics, Winter (English)
Item Code Booklet Sequence Sample 1 Sample 2
Δ LowerLimit
UpperLimit
DIF Level
Δ Lower Limit
UpperLimit
DIF Level
21665 12101 1 -0.16 -0.49 0.17 -0.10 -0.43 0.24 21664 12101 2 -0.14 -0.49 0.20 -0.15 -0.50 0.19 12913 12101 3 0.52 0.19 0.84 0.48 0.16 0.81 14892 12101 5 -0.23 -0.71 0.25 0.07 -0.42 0.55 24775 12101 6 0.41 0.10 0.73 0.20 -0.12 0.52 14898 12101 8 -0.01 -0.36 0.35 0.16 -0.19 0.51 12884 12101 16 -0.42 -0.75 -0.09 -0.55 -0.88 -0.22 24740 12101 17 -0.24 -0.63 0.15 -0.31 -0.70 0.08 21673 12101 18 0.31 -0.29 0.91 0.26 -0.31 0.82 22537 12101 19 -0.14 -0.50 0.23 -0.15 -0.51 0.21 24707 12101 21 0.46 0.09 0.84 0.47 0.11 0.83 22545 12101 22 -0.36 -0.71 -0.02 -0.10 -0.44 0.24 15634 12101 NR -0.51 -0.83 -0.18 -0.76 -1.08 -0.43 15670 12101 NR -0.75 -1.09 -0.40 -0.65 -0.99 -0.32 21612 12101 NR 1.03 0.64 1.41 0.92 0.53 1.31 24736 12101 NR -0.22 -0.68 0.23 -0.05 -0.52 0.42 24757 12101 NR 0.70 0.25 1.15 0.05 -0.40 0.49 24701 12101 NR 0.16 -0.22 0.54 0.27 -0.11 0.65 15639 12101 NR -0.38 -0.76 0.00 -0.63 -1.00 -0.26 24779 12101 NR 0.09 -0.29 0.47 0.20 -0.18 0.58 24741 12101 NR 0.48 0.15 0.81 0.08 -0.26 0.41 24725 12101 NR 0.57 0.23 0.90 0.38 0.04 0.73 24745 12101 NR -0.15 -0.58 0.29 0.00 -0.43 0.44 24727 12101 NR 0.82 0.44 1.21 0.90 0.51 1.28
Note. B = moderate DIF; C = large DIF; - = favouring female students; + = favouring male students; NR = not released. Table 7.1.67b Gender-Based DIF Statistics for Open-Response Items: Grade 9 Academic Mathematics, Winter (English)
Item Code Booklet Sequence Sample 1 Sample 2
Effect Size p-Value DIF Level Effect Size p-Value DIF Level
24747 12101 9 -0.10 0.00 -0.10 0.00 12907 12101 11 -0.07 0.00 -0.06 0.00 24730 12101 12 -0.11 0.00 -0.11 0.00 24787 12101 NR -0.07 0.01 -0.07 0.00 15702 12101 NR 0.23 0.00 B+ 0.23 0.00 B+ 21681 12101 NR 0.10 0.00 0.10 0.00 24770 12101 NR 0.04 0.54 0.04 0.15
Note. B = moderate DIF; C = large DIF; - = favouring female students; + = favouring male students; NR = not released.
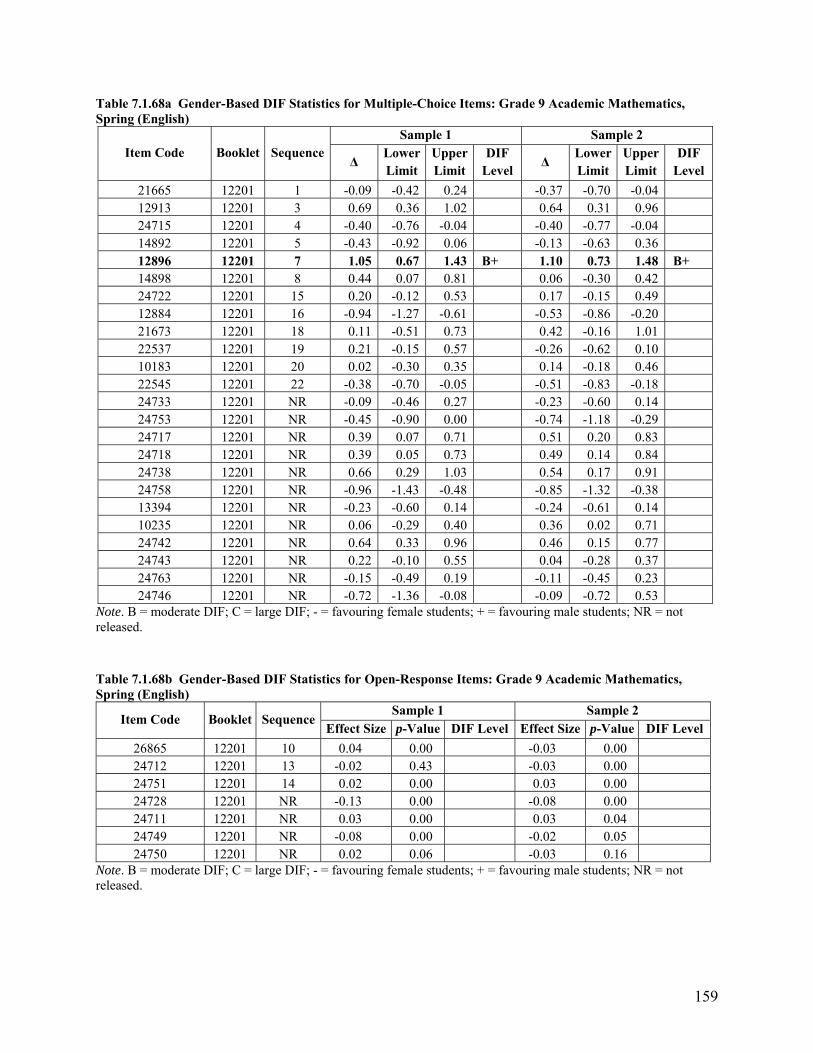
159
Table 7.1.68a Gender-Based DIF Statistics for Multiple-Choice Items: Grade 9 Academic Mathematics, Spring (English)
Item Code Booklet Sequence Sample 1 Sample 2
Δ LowerLimit
UpperLimit
DIF Level
Δ Lower Limit
UpperLimit
DIF Level
21665 12201 1 -0.09 -0.42 0.24 -0.37 -0.70 -0.04 12913 12201 3 0.69 0.36 1.02 0.64 0.31 0.96 24715 12201 4 -0.40 -0.76 -0.04 -0.40 -0.77 -0.04 14892 12201 5 -0.43 -0.92 0.06 -0.13 -0.63 0.36 12896 12201 7 1.05 0.67 1.43 B+ 1.10 0.73 1.48 B+ 14898 12201 8 0.44 0.07 0.81 0.06 -0.30 0.42 24722 12201 15 0.20 -0.12 0.53 0.17 -0.15 0.49 12884 12201 16 -0.94 -1.27 -0.61 -0.53 -0.86 -0.20 21673 12201 18 0.11 -0.51 0.73 0.42 -0.16 1.01 22537 12201 19 0.21 -0.15 0.57 -0.26 -0.62 0.10 10183 12201 20 0.02 -0.30 0.35 0.14 -0.18 0.46 22545 12201 22 -0.38 -0.70 -0.05 -0.51 -0.83 -0.18 24733 12201 NR -0.09 -0.46 0.27 -0.23 -0.60 0.14 24753 12201 NR -0.45 -0.90 0.00 -0.74 -1.18 -0.29 24717 12201 NR 0.39 0.07 0.71 0.51 0.20 0.83 24718 12201 NR 0.39 0.05 0.73 0.49 0.14 0.84 24738 12201 NR 0.66 0.29 1.03 0.54 0.17 0.91 24758 12201 NR -0.96 -1.43 -0.48 -0.85 -1.32 -0.38 13394 12201 NR -0.23 -0.60 0.14 -0.24 -0.61 0.14 10235 12201 NR 0.06 -0.29 0.40 0.36 0.02 0.71 24742 12201 NR 0.64 0.33 0.96 0.46 0.15 0.77 24743 12201 NR 0.22 -0.10 0.55 0.04 -0.28 0.37 24763 12201 NR -0.15 -0.49 0.19 -0.11 -0.45 0.23 24746 12201 NR -0.72 -1.36 -0.08 -0.09 -0.72 0.53
Note. B = moderate DIF; C = large DIF; - = favouring female students; + = favouring male students; NR = not released. Table 7.1.68b Gender-Based DIF Statistics for Open-Response Items: Grade 9 Academic Mathematics, Spring (English)
Item Code Booklet Sequence Sample 1 Sample 2
Effect Size p-Value DIF Level Effect Size p-Value DIF Level
26865 12201 10 0.04 0.00 -0.03 0.00 24712 12201 13 -0.02 0.43 -0.03 0.00 24751 12201 14 0.02 0.00 0.03 0.00 24728 12201 NR -0.13 0.00 -0.08 0.00 24711 12201 NR 0.03 0.00 0.03 0.04 24749 12201 NR -0.08 0.00 -0.02 0.05 24750 12201 NR 0.02 0.06 -0.03 0.16
Note. B = moderate DIF; C = large DIF; - = favouring female students; + = favouring male students; NR = not released.
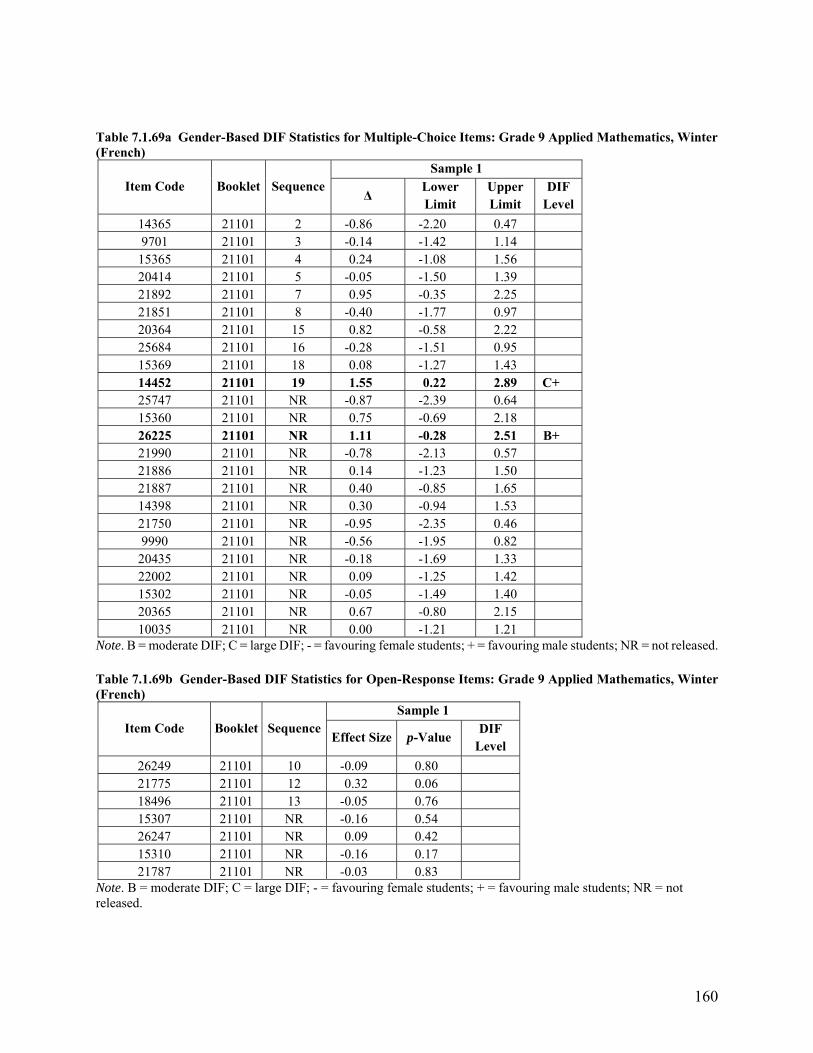
160
Table 7.1.69a Gender-Based DIF Statistics for Multiple-Choice Items: Grade 9 Applied Mathematics, Winter (French)
Item Code Booklet Sequence Sample 1
Δ Lower Limit
Upper Limit
DIF Level
14365 21101 2 -0.86 -2.20 0.47 9701 21101 3 -0.14 -1.42 1.14
15365 21101 4 0.24 -1.08 1.56 20414 21101 5 -0.05 -1.50 1.39 21892 21101 7 0.95 -0.35 2.25 21851 21101 8 -0.40 -1.77 0.97 20364 21101 15 0.82 -0.58 2.22 25684 21101 16 -0.28 -1.51 0.95 15369 21101 18 0.08 -1.27 1.43 14452 21101 19 1.55 0.22 2.89 C+ 25747 21101 NR -0.87 -2.39 0.64 15360 21101 NR 0.75 -0.69 2.18 26225 21101 NR 1.11 -0.28 2.51 B+ 21990 21101 NR -0.78 -2.13 0.57 21886 21101 NR 0.14 -1.23 1.50 21887 21101 NR 0.40 -0.85 1.65 14398 21101 NR 0.30 -0.94 1.53 21750 21101 NR -0.95 -2.35 0.46 9990 21101 NR -0.56 -1.95 0.82
20435 21101 NR -0.18 -1.69 1.33 22002 21101 NR 0.09 -1.25 1.42 15302 21101 NR -0.05 -1.49 1.40 20365 21101 NR 0.67 -0.80 2.15 10035 21101 NR 0.00 -1.21 1.21
Note. B = moderate DIF; C = large DIF; - = favouring female students; + = favouring male students; NR = not released. Table 7.1.69b Gender-Based DIF Statistics for Open-Response Items: Grade 9 Applied Mathematics, Winter (French)
Item Code Booklet Sequence Sample 1
Effect Size p-Value DIF
Level
26249 21101 10 -0.09 0.80 21775 21101 12 0.32 0.06 18496 21101 13 -0.05 0.76 15307 21101 NR -0.16 0.54 26247 21101 NR 0.09 0.42 15310 21101 NR -0.16 0.17 21787 21101 NR -0.03 0.83
Note. B = moderate DIF; C = large DIF; - = favouring female students; + = favouring male students; NR = not released.
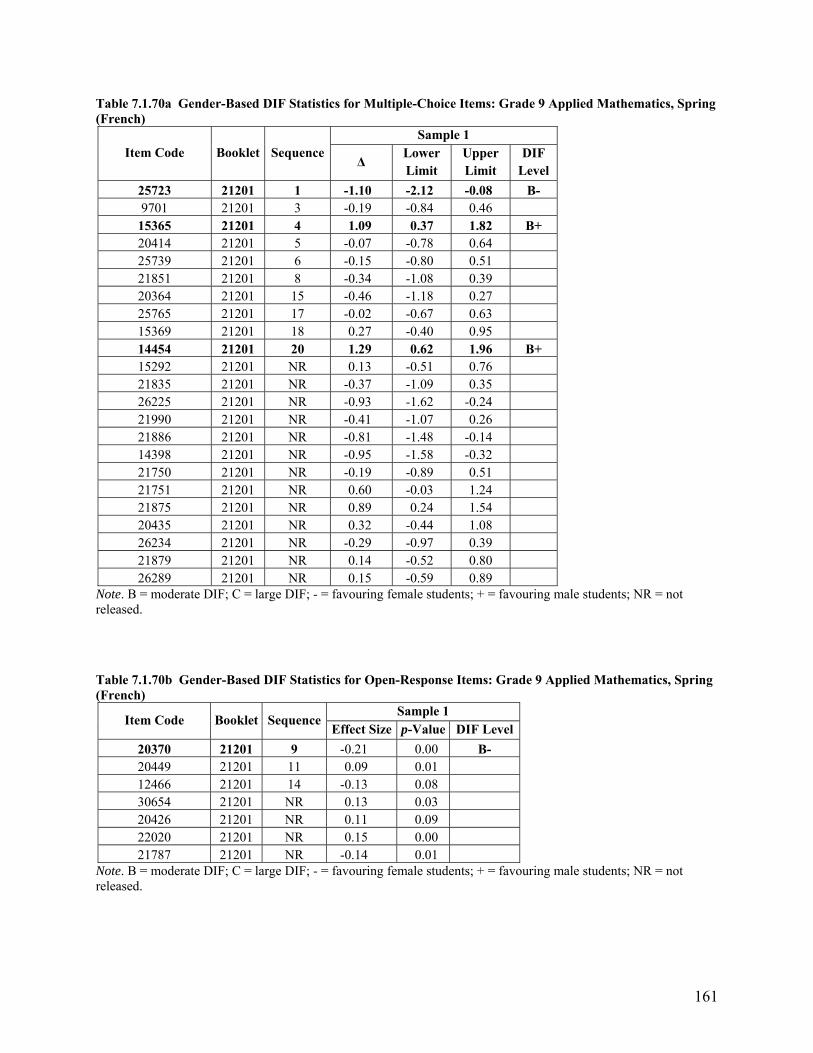
161
Table 7.1.70a Gender-Based DIF Statistics for Multiple-Choice Items: Grade 9 Applied Mathematics, Spring (French)
Item Code Booklet Sequence Sample 1
Δ Lower Limit
Upper Limit
DIF Level
25723 21201 1 -1.10 -2.12 -0.08 B- 9701 21201 3 -0.19 -0.84 0.46
15365 21201 4 1.09 0.37 1.82 B+ 20414 21201 5 -0.07 -0.78 0.64 25739 21201 6 -0.15 -0.80 0.51 21851 21201 8 -0.34 -1.08 0.39 20364 21201 15 -0.46 -1.18 0.27 25765 21201 17 -0.02 -0.67 0.63 15369 21201 18 0.27 -0.40 0.95 14454 21201 20 1.29 0.62 1.96 B+ 15292 21201 NR 0.13 -0.51 0.76 21835 21201 NR -0.37 -1.09 0.35 26225 21201 NR -0.93 -1.62 -0.24 21990 21201 NR -0.41 -1.07 0.26 21886 21201 NR -0.81 -1.48 -0.14 14398 21201 NR -0.95 -1.58 -0.32 21750 21201 NR -0.19 -0.89 0.51 21751 21201 NR 0.60 -0.03 1.24 21875 21201 NR 0.89 0.24 1.54 20435 21201 NR 0.32 -0.44 1.08 26234 21201 NR -0.29 -0.97 0.39 21879 21201 NR 0.14 -0.52 0.80 26289 21201 NR 0.15 -0.59 0.89
Note. B = moderate DIF; C = large DIF; - = favouring female students; + = favouring male students; NR = not released. Table 7.1.70b Gender-Based DIF Statistics for Open-Response Items: Grade 9 Applied Mathematics, Spring (French)
Item Code Booklet Sequence Sample 1
Effect Size p-Value DIF Level
20370 21201 9 -0.21 0.00 B- 20449 21201 11 0.09 0.01 12466 21201 14 -0.13 0.08 30654 21201 NR 0.13 0.03 20426 21201 NR 0.11 0.09 22020 21201 NR 0.15 0.00 21787 21201 NR -0.14 0.01
Note. B = moderate DIF; C = large DIF; - = favouring female students; + = favouring male students; NR = not released.
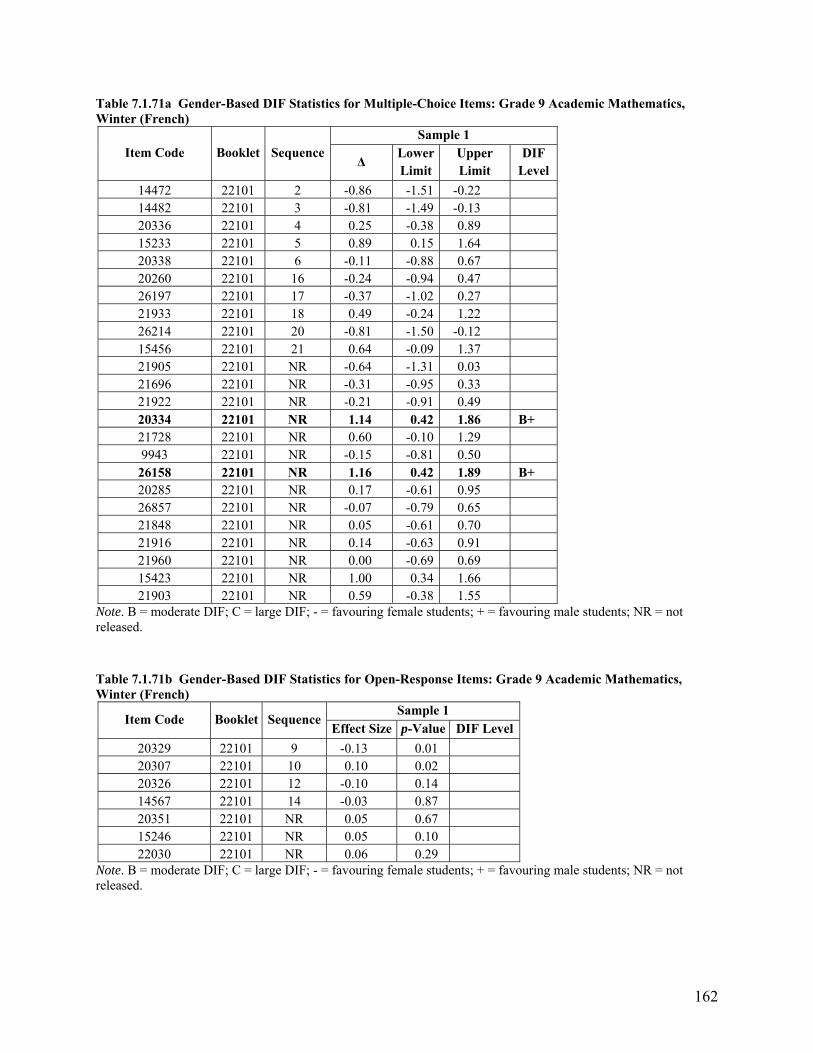
162
Table 7.1.71a Gender-Based DIF Statistics for Multiple-Choice Items: Grade 9 Academic Mathematics, Winter (French)
Item Code Booklet Sequence Sample 1
Δ LowerLimit
Upper Limit
DIF Level
14472 22101 2 -0.86 -1.51 -0.22 14482 22101 3 -0.81 -1.49 -0.13 20336 22101 4 0.25 -0.38 0.89 15233 22101 5 0.89 0.15 1.64 20338 22101 6 -0.11 -0.88 0.67 20260 22101 16 -0.24 -0.94 0.47 26197 22101 17 -0.37 -1.02 0.27 21933 22101 18 0.49 -0.24 1.22 26214 22101 20 -0.81 -1.50 -0.12 15456 22101 21 0.64 -0.09 1.37 21905 22101 NR -0.64 -1.31 0.03 21696 22101 NR -0.31 -0.95 0.33 21922 22101 NR -0.21 -0.91 0.49 20334 22101 NR 1.14 0.42 1.86 B+ 21728 22101 NR 0.60 -0.10 1.29 9943 22101 NR -0.15 -0.81 0.50
26158 22101 NR 1.16 0.42 1.89 B+ 20285 22101 NR 0.17 -0.61 0.95 26857 22101 NR -0.07 -0.79 0.65 21848 22101 NR 0.05 -0.61 0.70 21916 22101 NR 0.14 -0.63 0.91 21960 22101 NR 0.00 -0.69 0.69 15423 22101 NR 1.00 0.34 1.66 21903 22101 NR 0.59 -0.38 1.55
Note. B = moderate DIF; C = large DIF; - = favouring female students; + = favouring male students; NR = not released. Table 7.1.71b Gender-Based DIF Statistics for Open-Response Items: Grade 9 Academic Mathematics, Winter (French)
Item Code Booklet Sequence Sample 1
Effect Size p-Value DIF Level
20329 22101 9 -0.13 0.01 20307 22101 10 0.10 0.02 20326 22101 12 -0.10 0.14 14567 22101 14 -0.03 0.87 20351 22101 NR 0.05 0.67 15246 22101 NR 0.05 0.10 22030 22101 NR 0.06 0.29
Note. B = moderate DIF; C = large DIF; - = favouring female students; + = favouring male students; NR = not released.
163
Table 7.1.72a Gender-Based DIF Statistics for Multiple-Choice Items: Grade 9 Academic Mathematics, Spring (French)
Item Code Booklet Sequence Sample 1
Δ Lower Limit
Upper Limit
DIF Level
26119 22201 1 -0.26 -0.79 0.26 14472 22201 2 -0.67 -1.04 -0.30 20336 22201 4 -0.01 -0.37 0.35 20338 22201 6 -0.79 -1.25 -0.33 26150 22201 7 0.58 0.18 0.99 41066 22201 15 -0.79 -1.19 -0.40 20260 22201 16 -0.20 -0.61 0.21 21933 22201 18 -0.21 -0.62 0.20 26231 22201 19 0.30 -0.24 0.85 15456 22201 21 0.05 -0.39 0.49 20332 22201 NR 0.33 -0.03 0.69 21867 22201 NR 0.26 -0.09 0.62 25696 22201 NR 0.12 -0.25 0.50 20275 22201 NR 0.37 0.00 0.73 9942 22201 NR -0.19 -0.68 0.30
26173 22201 NR -0.47 -0.88 -0.07 15407 22201 NR -0.06 -0.43 0.31 21927 22201 NR -0.90 -1.33 -0.48 21946 22201 NR -0.21 -0.57 0.16 26193 22201 NR -0.33 -0.71 0.05 10059 22201 NR -0.01 -0.37 0.36 23652 22201 NR -0.47 -0.90 -0.03 15423 22201 NR 0.46 0.09 0.83 15458 22201 NR 0.44 -0.25 1.14
Note. B = moderate DIF; C = large DIF; - = favouring female students; + = favouring male students; NR = not released. Table 7.1.72b Gender-Based DIF Statistics for Open-Response Items: Grade 9 Academic Mathematics, Spring (French)
Item Code Booklet Sequence Sample 1
Effect Size p-Value DIF Level
20289 22201 8 0.15 0.00 22024 22201 11 0.13 0.00 20326 22201 12 -0.12 0.00 15399 22201 13 -0.12 0.00 41063 22201 NR 0.15 0.00 20348 22201 NR -0.04 0.00 22030 22201 NR 0.05 0.00
Note. B = moderate DIF; C = large DIF; - = favouring female students; + = favouring male students; NR = not released.
164
Table 7.1.73a SLL-Based DIF Statistics for Multiple-Choice Items: Grade 9 Applied Mathematics, Winter (English)
Item Code Booklet Sequence Sample 1 Sample 2
Δ LowerLimit
UpperLimit
DIF Level
Δ Lower Limit
UpperLimit
DIF Level
24852 11101 2 -0.12 -0.58 0.34 -0.54 -1.00 -0.08 21555 11101 3 0.38 -0.09 0.84 0.30 -0.16 0.77 21575 11101 4 -0.82 -1.33 -0.31 -0.67 -1.19 -0.16 19424 11101 5 1.39 0.95 1.82 B+ 1.71 1.27 2.15 C+ 14809 11101 6 0.21 -0.24 0.67 -0.02 -0.47 0.44 21560 11101 9 -0.50 -0.97 -0.03 -0.77 -1.25 -0.30 19453 11101 10 -0.71 -1.16 -0.27 -0.86 -1.31 -0.41 21582 11101 11 0.94 0.51 1.38 0.71 0.27 1.15 24882 11101 12 1.10 0.64 1.56 B+ 1.06 0.59 1.52 B+ 24883 11101 19 -0.17 -0.61 0.27 -0.07 -0.51 0.37 21584 11101 20 0.25 -0.22 0.72 0.23 -0.24 0.71 22553 11101 21 0.91 0.45 1.36 0.77 0.32 1.23 10148 11101 NR 0.22 -0.24 0.68 0.27 -0.19 0.73 24785 11101 NR -0.59 -1.08 -0.11 -0.63 -1.11 -0.15 24830 11101 NR -0.46 -0.92 0.00 -0.14 -0.60 0.33 21574 11101 NR -1.16 -1.61 -0.71 B- -1.46 -1.91 -1.00 B- 24832 11101 NR 1.02 0.57 1.47 B+ 1.27 0.82 1.72 B+ 24858 11101 NR -0.07 -0.54 0.39 -0.25 -0.71 0.21 24859 11101 NR -0.73 -1.21 -0.25 -0.53 -1.02 -0.04 26529 11101 NR 0.31 -0.17 0.79 0.14 -0.34 0.63 19653 11101 NR -0.31 -0.84 0.22 -0.32 -0.84 0.20 24819 11101 NR 0.75 0.07 1.43 0.30 -0.33 0.94 24865 11101 NR 0.57 0.14 1.00 0.64 0.21 1.07 24822 11101 NR -0.44 -0.91 0.03 -0.49 -0.95 -0.02
Note. B = moderate DIF; C = large DIF; - = favouring SLLs; + = favouring non-SLLs; NR = not released.
Table 7.1.73b SLL-Based DIF Statistics for Open-Response Items: Grade 9 Applied Mathematics, Winter (English)
Item Code Booklet Sequence Sample 1 Sample 2
Effect Size p-Value DIF Level Effect Size p-Value DIF Level
21569 11101 14 -0.22 0.00 B- -0.23 0.00 B- 24888 11101 15 -0.03 0.46 0.00 0.18 24808 11101 18 -0.12 0.00 -0.12 0.00 21568 11101 NR 0.09 0.01 0.13 0.00 24806 11101 NR 0.09 0.12 0.10 0.05 24889 11101 NR 0.10 0.01 0.08 0.03 21533 11101 NR -0.03 0.06 -0.03 0.05
Note. B = moderate DIF; C = large DIF; - = favouring SLLs; + = favouring non-SLLs; NR = not released.
165
Table 7.1.74a SLL-Based DIF Statistics for Multiple-Choice Items: Grade 9 Applied Mathematics, Spring (English)
Item Code Booklet Sequence Sample 1 Sample 2
Δ LowerLimit
UpperLimit
DIF Level
Δ Lower Limit
UpperLimit
DIF Level
21501 11201 1 -1.19 -1.67 -0.71 -0.97 -1.45 -0.49 21555 11201 3 0.07 -0.41 0.54 0.02 -0.46 0.50 21575 11201 4 -0.93 -1.44 -0.42 -0.96 -1.49 -0.43 19424 11201 5 1.20 0.76 1.64 0.74 0.30 1.18 14809 11201 6 -0.01 -0.46 0.44 0.29 -0.16 0.75 21563 11201 7 0.41 -0.06 0.89 0.97 0.51 1.42 21561 11201 8 0.66 0.20 1.11 0.16 -0.30 0.61 21560 11201 9 -0.40 -0.88 0.07 -0.88 -1.36 -0.39 19453 11201 10 -0.94 -1.39 -0.48 -0.81 -1.26 -0.36 21584 11201 20 0.06 -0.42 0.53 -0.21 -0.68 0.27 22553 11201 21 0.25 -0.20 0.70 0.12 -0.35 0.58 15589 11201 22 0.25 -0.21 0.70 -0.05 -0.51 0.41 24872 11201 NR 0.34 -0.11 0.79 0.27 -0.17 0.72 24850 11201 NR -0.94 -1.44 -0.44 -0.98 -1.48 -0.48 21537 11201 NR 0.28 -0.21 0.76 -0.01 -0.50 0.48 24794 11201 NR -0.94 -1.40 -0.48 -0.96 -1.42 -0.51 24854 11201 NR 1.50 1.05 1.96 C+ 1.77 1.30 2.24 C+ 14807 11201 NR -0.40 -0.85 0.06 -0.38 -0.84 0.07 19452 11201 NR -0.44 -0.98 0.10 -0.39 -0.94 0.15 24800 11201 NR -1.30 -1.76 -0.83 B- -1.28 -1.75 -0.82 B- 24818 11201 NR 0.12 -0.32 0.57 0.10 -0.34 0.55 24801 11201 NR 0.89 0.40 1.37 0.58 0.10 1.06 15586 11201 NR -0.03 -0.55 0.49 -0.12 -0.65 0.40 21566 11201 NR 0.22 -0.26 0.70 0.51 0.03 0.98
Note. B = moderate DIF; C = large DIF; - = favouring SLLs; + = favouring non-SLLs; NR = not released.
Table 7.1.74b SLL-Based DIF Statistics for Open-Response Items: Grade 9 Applied Mathematics, Spring (English)
Item Code Booklet Sequence Sample 1 Sample 2
Effect Size p-Value DIF Level Effect Size p-Value DIF Level
24823 11201 13 -0.02 0.00 0.06 0.00 24870 11201 16 -0.06 0.04 0.00 0.35 19627 11201 17 0.09 0.01 0.08 0.02 24805 11201 NR -0.07 0.00 -0.11 0.00 24843 11201 NR 0.10 0.00 0.08 0.01 21514 11201 NR 0.05 0.00 0.08 0.02 24827 11201 NR -0.06 0.08 -0.07 0.07
Note. B = moderate DIF; C = large DIF; - = favouring SLLs; + = favouring non-SLLs; NR = not released.
166
Table 7.1.75a SLL-Based DIF Statistics for Multiple-Choice Items: Grade 9 Academic Mathematics, Winter (English)
Item Code Booklet Sequence Sample 1 Sample 2
Δ LowerLimit
UpperLimit
DIF Level
Δ Lower Limit
UpperLimit
DIF Level
21665 12101 1 -1.01 -1.50 -0.53 B- -1.10 -1.58 -0.61 B- 21664 12101 2 -0.03 -0.53 0.47 -0.45 -0.95 0.05 12913 12101 3 0.69 0.23 1.15 0.52 0.07 0.98 14892 12101 5 -0.11 -0.77 0.56 0.07 -0.60 0.74 24775 12101 6 -0.07 -0.53 0.39 -0.26 -0.71 0.20 14898 12101 8 -0.29 -0.80 0.22 -0.48 -0.99 0.03 12884 12101 16 -0.20 -0.66 0.26 0.13 -0.32 0.59 24740 12101 17 0.02 -0.53 0.58 0.28 -0.28 0.84 21673 12101 18 0.97 0.18 1.77 0.33 -0.43 1.09 22537 12101 19 0.78 0.27 1.30 0.46 -0.04 0.96 24707 12101 21 -0.03 -0.54 0.48 -0.04 -0.56 0.48 22545 12101 22 -0.22 -0.70 0.26 -0.17 -0.65 0.32 15634 12101 NR -0.51 -0.98 -0.04 -0.71 -1.19 -0.24 15670 12101 NR -0.85 -1.34 -0.36 -0.64 -1.14 -0.13 21612 12101 NR 1.08 0.57 1.60 B+ 1.30 0.77 1.82 B+ 24736 12101 NR 0.72 0.07 1.37 0.36 -0.28 1.00 24757 12101 NR 0.07 -0.54 0.68 0.38 -0.24 1.01 24701 12101 NR -0.04 -0.58 0.50 -0.31 -0.85 0.23 15639 12101 NR -1.11 -1.66 -0.56 -0.58 -1.13 -0.02 24779 12101 NR -0.07 -0.61 0.46 -0.23 -0.77 0.32 24741 12101 NR 0.34 -0.14 0.82 0.15 -0.33 0.62 24725 12101 NR 1.47 0.97 1.96 B+ 1.15 0.67 1.64 B+ 24745 12101 NR 0.09 -0.53 0.70 0.03 -0.60 0.66 24727 12101 NR -0.43 -0.97 0.12 -0.19 -0.75 0.36
Note. B = moderate DIF; C = large DIF; - = favouring SLLs; + = favouring non-SLLs; NR = not released.
Table 7.1.75b SLL-Based DIF Statistics for Open-Response Items: Grade 9 Academic Mathematics, Winter (English)
Item Code Booklet Sequence Sample 1 Sample 2
Effect Size p-Value DIF Level Effect Size p-Value DIF Level
24747 12101 9 -0.18 0.00 B- -0.18 0.00 B- 12907 12101 11 -0.09 0.05 -0.08 0.00 24730 12101 12 -0.09 0.05 -0.14 0.00 24787 12101 NR -0.07 0.01 -0.01 0.00 15702 12101 NR 0.17 0.00 0.12 0.00 21681 12101 NR 0.26 0.00 C+ 0.27 0.00 C+ 24770 12101 NR 0.12 0.00 0.11 0.00
Note. B = moderate DIF; C = large DIF; - = favouring SLLs; + = favouring non-SLLs; NR = not released.
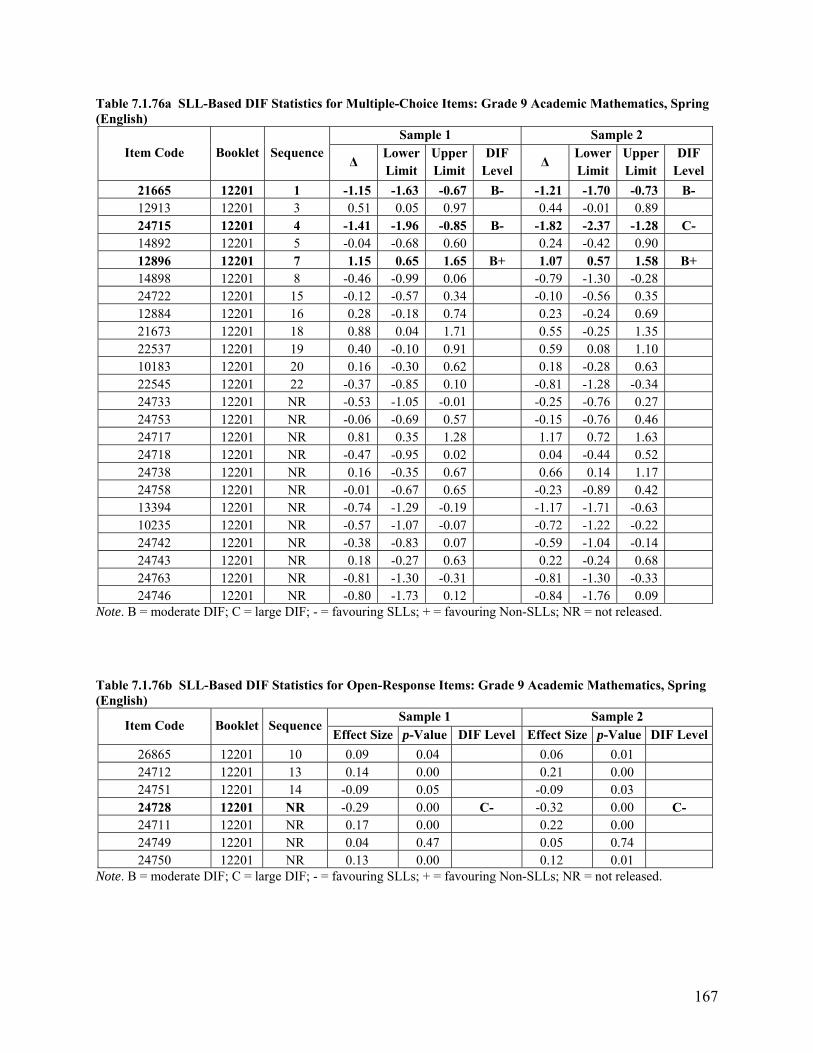
167
Table 7.1.76a SLL-Based DIF Statistics for Multiple-Choice Items: Grade 9 Academic Mathematics, Spring (English)
Item Code Booklet Sequence Sample 1 Sample 2
Δ LowerLimit
UpperLimit
DIF Level
Δ Lower Limit
UpperLimit
DIF Level
21665 12201 1 -1.15 -1.63 -0.67 B- -1.21 -1.70 -0.73 B- 12913 12201 3 0.51 0.05 0.97 0.44 -0.01 0.89 24715 12201 4 -1.41 -1.96 -0.85 B- -1.82 -2.37 -1.28 C- 14892 12201 5 -0.04 -0.68 0.60 0.24 -0.42 0.90 12896 12201 7 1.15 0.65 1.65 B+ 1.07 0.57 1.58 B+ 14898 12201 8 -0.46 -0.99 0.06 -0.79 -1.30 -0.28 24722 12201 15 -0.12 -0.57 0.34 -0.10 -0.56 0.35 12884 12201 16 0.28 -0.18 0.74 0.23 -0.24 0.69 21673 12201 18 0.88 0.04 1.71 0.55 -0.25 1.35 22537 12201 19 0.40 -0.10 0.91 0.59 0.08 1.10 10183 12201 20 0.16 -0.30 0.62 0.18 -0.28 0.63 22545 12201 22 -0.37 -0.85 0.10 -0.81 -1.28 -0.34 24733 12201 NR -0.53 -1.05 -0.01 -0.25 -0.76 0.27 24753 12201 NR -0.06 -0.69 0.57 -0.15 -0.76 0.46 24717 12201 NR 0.81 0.35 1.28 1.17 0.72 1.63 24718 12201 NR -0.47 -0.95 0.02 0.04 -0.44 0.52 24738 12201 NR 0.16 -0.35 0.67 0.66 0.14 1.17 24758 12201 NR -0.01 -0.67 0.65 -0.23 -0.89 0.42 13394 12201 NR -0.74 -1.29 -0.19 -1.17 -1.71 -0.63 10235 12201 NR -0.57 -1.07 -0.07 -0.72 -1.22 -0.22 24742 12201 NR -0.38 -0.83 0.07 -0.59 -1.04 -0.14 24743 12201 NR 0.18 -0.27 0.63 0.22 -0.24 0.68 24763 12201 NR -0.81 -1.30 -0.31 -0.81 -1.30 -0.33 24746 12201 NR -0.80 -1.73 0.12 -0.84 -1.76 0.09
Note. B = moderate DIF; C = large DIF; - = favouring SLLs; + = favouring Non-SLLs; NR = not released.
Table 7.1.76b SLL-Based DIF Statistics for Open-Response Items: Grade 9 Academic Mathematics, Spring (English)
Item Code Booklet Sequence Sample 1 Sample 2
Effect Size p-Value DIF Level Effect Size p-Value DIF Level
26865 12201 10 0.09 0.04 0.06 0.01 24712 12201 13 0.14 0.00 0.21 0.00 24751 12201 14 -0.09 0.05 -0.09 0.03 24728 12201 NR -0.29 0.00 C- -0.32 0.00 C-24711 12201 NR 0.17 0.00 0.22 0.00 24749 12201 NR 0.04 0.47 0.05 0.74 24750 12201 NR 0.13 0.00 0.12 0.01
Note. B = moderate DIF; C = large DIF; - = favouring SLLs; + = favouring Non-SLLs; NR = not released.
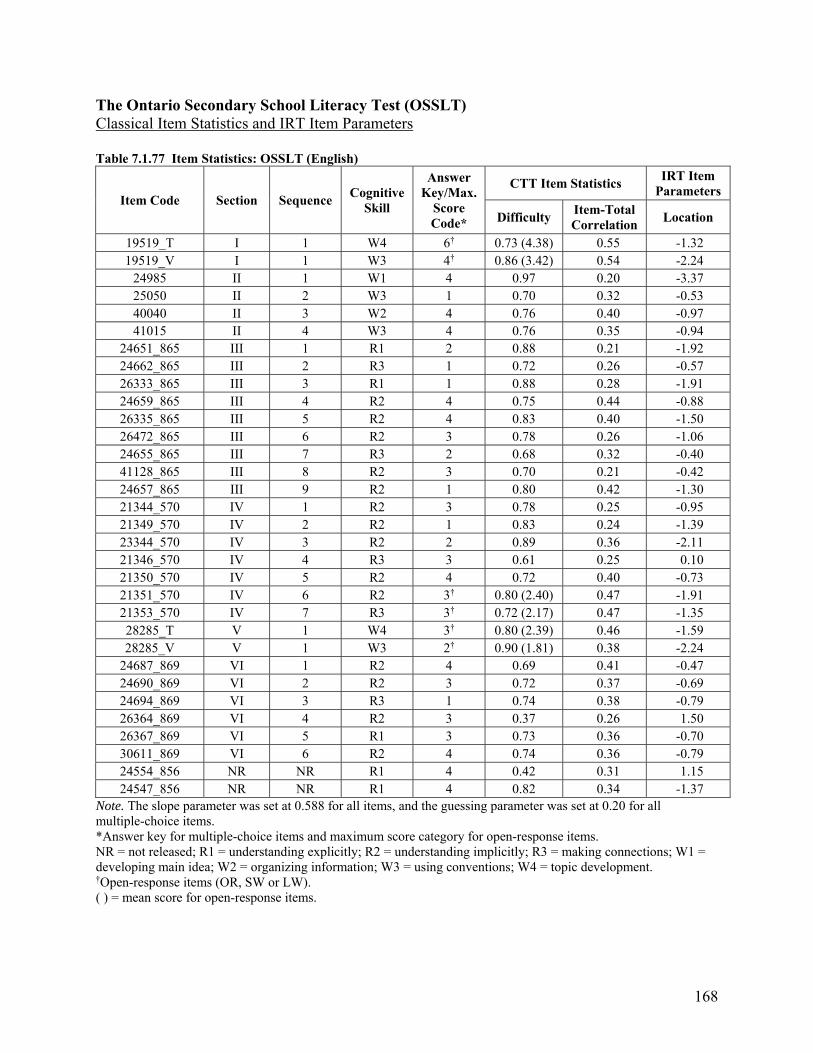
168
The Ontario Secondary School Literacy Test (OSSLT) Classical Item Statistics and IRT Item Parameters Table 7.1.77 Item Statistics: OSSLT (English)
Item Code Section Sequence Cognitive
Skill
Answer Key/Max.
Score Code*
CTT Item Statistics IRT Item
Parameters
Difficulty Item-Total Correlation
Location
19519_T I 1 W4 6† 0.73 (4.38) 0.55 -1.32 19519_V I 1 W3 4† 0.86 (3.42) 0.54 -2.24
24985 II 1 W1 4 0.97 0.20 -3.37 25050 II 2 W3 1 0.70 0.32 -0.53 40040 II 3 W2 4 0.76 0.40 -0.97 41015 II 4 W3 4 0.76 0.35 -0.94
24651_865 III 1 R1 2 0.88 0.21 -1.92 24662_865 III 2 R3 1 0.72 0.26 -0.57 26333_865 III 3 R1 1 0.88 0.28 -1.91 24659_865 III 4 R2 4 0.75 0.44 -0.88 26335_865 III 5 R2 4 0.83 0.40 -1.50 26472_865 III 6 R2 3 0.78 0.26 -1.06 24655_865 III 7 R3 2 0.68 0.32 -0.40 41128_865 III 8 R2 3 0.70 0.21 -0.42 24657_865 III 9 R2 1 0.80 0.42 -1.30 21344_570 IV 1 R2 3 0.78 0.25 -0.95 21349_570 IV 2 R2 1 0.83 0.24 -1.39 23344_570 IV 3 R2 2 0.89 0.36 -2.11 21346_570 IV 4 R3 3 0.61 0.25 0.10 21350_570 IV 5 R2 4 0.72 0.40 -0.73 21351_570 IV 6 R2 3† 0.80 (2.40) 0.47 -1.91 21353_570 IV 7 R3 3† 0.72 (2.17) 0.47 -1.35 28285_T V 1 W4 3† 0.80 (2.39) 0.46 -1.59 28285_V V 1 W3 2† 0.90 (1.81) 0.38 -2.24
24687_869 VI 1 R2 4 0.69 0.41 -0.47 24690_869 VI 2 R2 3 0.72 0.37 -0.69 24694_869 VI 3 R3 1 0.74 0.38 -0.79 26364_869 VI 4 R2 3 0.37 0.26 1.50 26367_869 VI 5 R1 3 0.73 0.36 -0.70 30611_869 VI 6 R2 4 0.74 0.36 -0.79 24554_856 NR NR R1 4 0.42 0.31 1.15 24547_856 NR NR R1 4 0.82 0.34 -1.37
Note. The slope parameter was set at 0.588 for all items, and the guessing parameter was set at 0.20 for all multiple-choice items. *Answer key for multiple-choice items and maximum score category for open-response items. NR = not released; R1 = understanding explicitly; R2 = understanding implicitly; R3 = making connections; W1 = developing main idea; W2 = organizing information; W3 = using conventions; W4 = topic development. †Open-response items (OR, SW or LW). ( ) = mean score for open-response items.
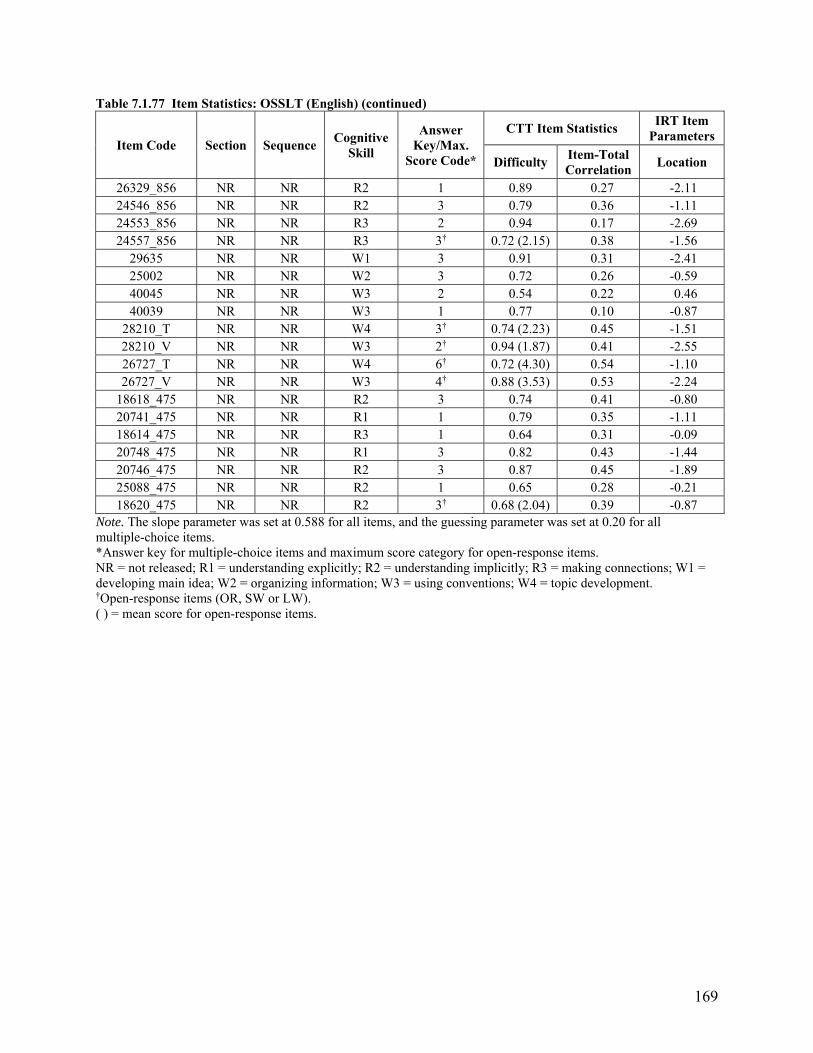
169
Table 7.1.77 Item Statistics: OSSLT (English) (continued)
Item Code Section Sequence Cognitive
Skill
Answer Key/Max.
Score Code*
CTT Item Statistics IRT Item
Parameters
Difficulty Item-Total Correlation
Location
26329_856 NR NR R2 1 0.89 0.27 -2.11 24546_856 NR NR R2 3 0.79 0.36 -1.11 24553_856 NR NR R3 2 0.94 0.17 -2.69 24557_856 NR NR R3 3† 0.72 (2.15) 0.38 -1.56
29635 NR NR W1 3 0.91 0.31 -2.41 25002 NR NR W2 3 0.72 0.26 -0.59 40045 NR NR W3 2 0.54 0.22 0.46 40039 NR NR W3 1 0.77 0.10 -0.87
28210_T NR NR W4 3† 0.74 (2.23) 0.45 -1.51 28210_V NR NR W3 2† 0.94 (1.87) 0.41 -2.55 26727_T NR NR W4 6† 0.72 (4.30) 0.54 -1.10 26727_V NR NR W3 4† 0.88 (3.53) 0.53 -2.24
18618_475 NR NR R2 3 0.74 0.41 -0.80 20741_475 NR NR R1 1 0.79 0.35 -1.11 18614_475 NR NR R3 1 0.64 0.31 -0.09 20748_475 NR NR R1 3 0.82 0.43 -1.44 20746_475 NR NR R2 3 0.87 0.45 -1.89 25088_475 NR NR R2 1 0.65 0.28 -0.21 18620_475 NR NR R2 3† 0.68 (2.04) 0.39 -0.87
Note. The slope parameter was set at 0.588 for all items, and the guessing parameter was set at 0.20 for all multiple-choice items. *Answer key for multiple-choice items and maximum score category for open-response items. NR = not released; R1 = understanding explicitly; R2 = understanding implicitly; R3 = making connections; W1 = developing main idea; W2 = organizing information; W3 = using conventions; W4 = topic development. †Open-response items (OR, SW or LW). ( ) = mean score for open-response items.
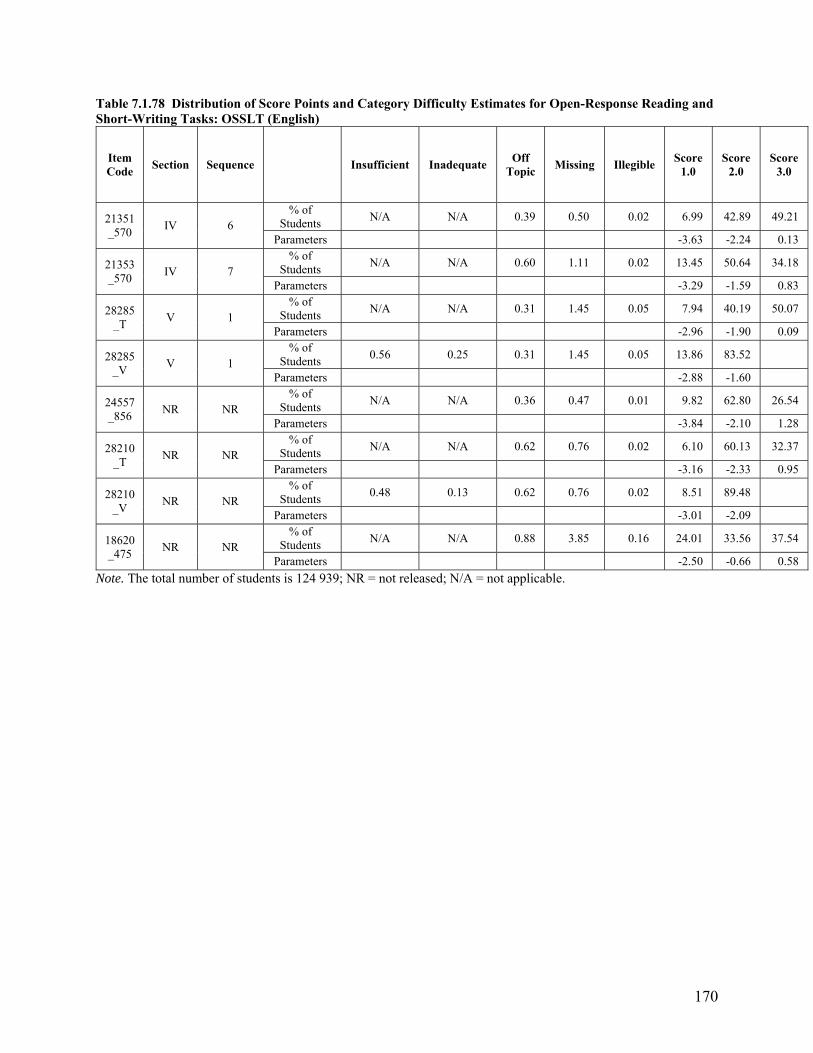
170
Table 7.1.78 Distribution of Score Points and Category Difficulty Estimates for Open-Response Reading and Short-Writing Tasks: OSSLT (English)
Item Code
Section Sequence Insufficient Inadequate Off
Topic Missing Illegible
Score 1.0
Score 2.0
Score 3.0
21351_570
IV 6 % of
Students N/A N/A 0.39 0.50 0.02 6.99 42.89 49.21
Parameters -3.63 -2.24 0.13
21353_570
IV 7 % of
Students N/A N/A 0.60 1.11 0.02 13.45 50.64 34.18
Parameters -3.29 -1.59 0.83
28285_T
V 1 % of
Students N/A N/A 0.31 1.45 0.05 7.94 40.19 50.07
Parameters -2.96 -1.90 0.09
28285_V
V 1 % of
Students 0.56 0.25 0.31 1.45 0.05 13.86 83.52
Parameters -2.88 -1.60
24557_856
NR NR % of
Students N/A N/A 0.36 0.47 0.01 9.82 62.80 26.54
Parameters -3.84 -2.10 1.28
28210_T
NR NR % of
Students N/A N/A 0.62 0.76 0.02 6.10 60.13 32.37
Parameters -3.16 -2.33 0.95
28210_V
NR NR % of
Students 0.48 0.13 0.62 0.76 0.02 8.51 89.48
Parameters -3.01 -2.09
18620_475
NR NR % of
Students N/A N/A 0.88 3.85 0.16 24.01 33.56 37.54
Parameters -2.50 -0.66 0.58
Note. The total number of students is 124 939; NR = not released; N/A = not applicable.
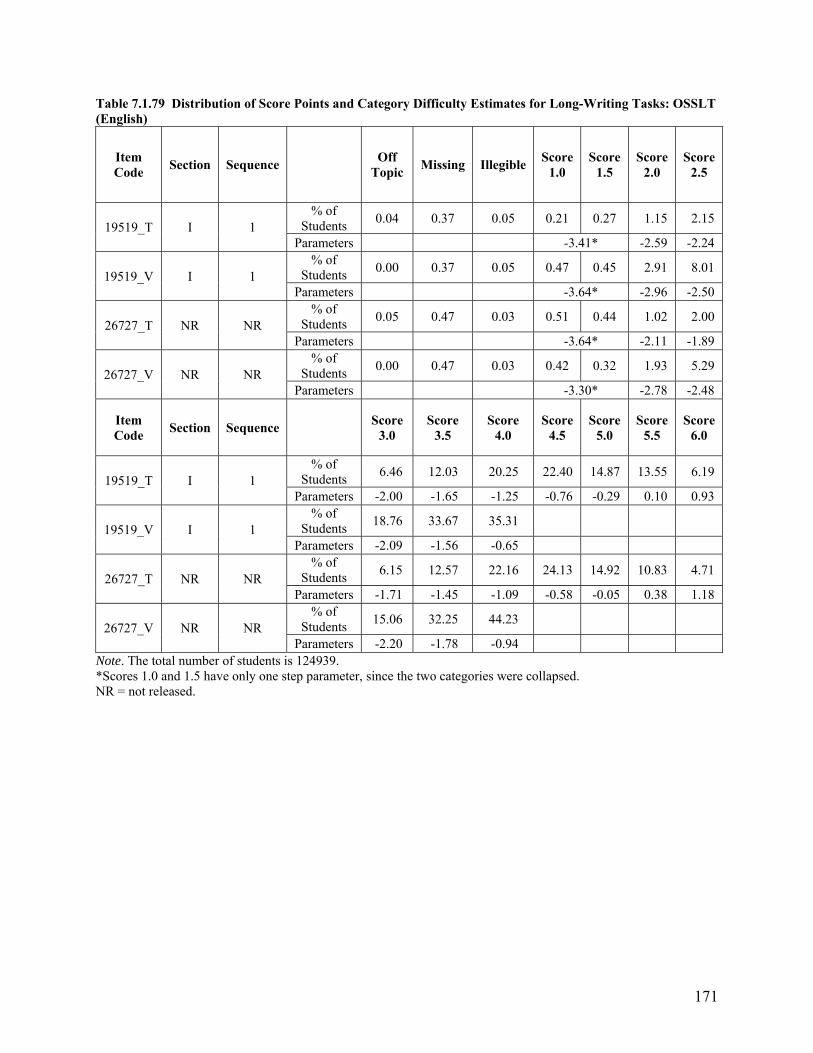
171
Table 7.1.79 Distribution of Score Points and Category Difficulty Estimates for Long-Writing Tasks: OSSLT (English)
Item Code
Section Sequence Off
Topic Missing Illegible
Score 1.0
Score 1.5
Score 2.0
Score 2.5
19519_T I 1 % of
Students 0.04 0.37 0.05 0.21 0.27 1.15 2.15
Parameters -3.41* -2.59 -2.24
19519_V I 1 % of
Students 0.00 0.37 0.05 0.47 0.45 2.91 8.01
Parameters -3.64* -2.96 -2.50
26727_T NR NR % of
Students 0.05 0.47 0.03 0.51 0.44 1.02 2.00
Parameters -3.64* -2.11 -1.89
26727_V NR NR % of
Students 0.00 0.47 0.03 0.42 0.32 1.93 5.29
Parameters -3.30* -2.78 -2.48
Item Code
Section Sequence Score
3.0 Score
3.5 Score
4.0 Score
4.5 Score
5.0 Score
5.5 Score
6.0
19519_T I 1 % of
Students 6.46 12.03 20.25 22.40 14.87 13.55 6.19
Parameters -2.00 -1.65 -1.25 -0.76 -0.29 0.10 0.93
19519_V I 1 % of
Students 18.76 33.67 35.31
Parameters -2.09 -1.56 -0.65
26727_T NR NR % of
Students 6.15 12.57 22.16 24.13 14.92 10.83 4.71
Parameters -1.71 -1.45 -1.09 -0.58 -0.05 0.38 1.18
26727_V NR NR % of
Students 15.06 32.25 44.23
Parameters -2.20 -1.78 -0.94 Note. The total number of students is 124939. *Scores 1.0 and 1.5 have only one step parameter, since the two categories were collapsed. NR = not released.
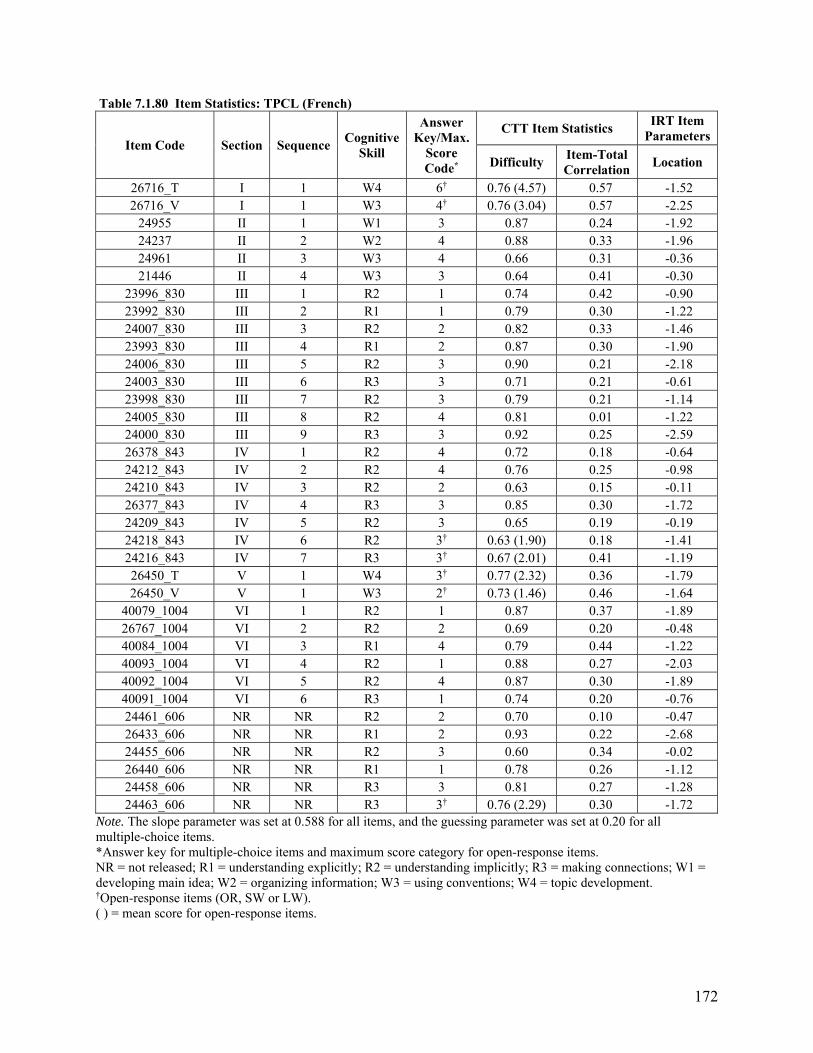
172
Table 7.1.80 Item Statistics: TPCL (French)
Item Code Section Sequence Cognitive
Skill
Answer Key/Max.
Score Code*
CTT Item Statistics IRT Item
Parameters
Difficulty Item-Total Correlation
Location
26716_T I 1 W4 6† 0.76 (4.57) 0.57 -1.52 26716_V I 1 W3 4† 0.76 (3.04) 0.57 -2.25
24955 II 1 W1 3 0.87 0.24 -1.92 24237 II 2 W2 4 0.88 0.33 -1.96 24961 II 3 W3 4 0.66 0.31 -0.36 21446 II 4 W3 3 0.64 0.41 -0.30
23996_830 III 1 R2 1 0.74 0.42 -0.90 23992_830 III 2 R1 1 0.79 0.30 -1.22 24007_830 III 3 R2 2 0.82 0.33 -1.46 23993_830 III 4 R1 2 0.87 0.30 -1.90 24006_830 III 5 R2 3 0.90 0.21 -2.18 24003_830 III 6 R3 3 0.71 0.21 -0.61 23998_830 III 7 R2 3 0.79 0.21 -1.14 24005_830 III 8 R2 4 0.81 0.01 -1.22 24000_830 III 9 R3 3 0.92 0.25 -2.59 26378_843 IV 1 R2 4 0.72 0.18 -0.64 24212_843 IV 2 R2 4 0.76 0.25 -0.98 24210_843 IV 3 R2 2 0.63 0.15 -0.11 26377_843 IV 4 R3 3 0.85 0.30 -1.72 24209_843 IV 5 R2 3 0.65 0.19 -0.19 24218_843 IV 6 R2 3† 0.63 (1.90) 0.18 -1.41 24216_843 IV 7 R3 3† 0.67 (2.01) 0.41 -1.19 26450_T V 1 W4 3† 0.77 (2.32) 0.36 -1.79 26450_V V 1 W3 2† 0.73 (1.46) 0.46 -1.64
40079_1004 VI 1 R2 1 0.87 0.37 -1.89 26767_1004 VI 2 R2 2 0.69 0.20 -0.48 40084_1004 VI 3 R1 4 0.79 0.44 -1.22 40093_1004 VI 4 R2 1 0.88 0.27 -2.03 40092_1004 VI 5 R2 4 0.87 0.30 -1.89 40091_1004 VI 6 R3 1 0.74 0.20 -0.76 24461_606 NR NR R2 2 0.70 0.10 -0.47 26433_606 NR NR R1 2 0.93 0.22 -2.68 24455_606 NR NR R2 3 0.60 0.34 -0.02 26440_606 NR NR R1 1 0.78 0.26 -1.12 24458_606 NR NR R3 3 0.81 0.27 -1.28 24463_606 NR NR R3 3† 0.76 (2.29) 0.30 -1.72
Note. The slope parameter was set at 0.588 for all items, and the guessing parameter was set at 0.20 for all multiple-choice items. *Answer key for multiple-choice items and maximum score category for open-response items. NR = not released; R1 = understanding explicitly; R2 = understanding implicitly; R3 = making connections; W1 = developing main idea; W2 = organizing information; W3 = using conventions; W4 = topic development. †Open-response items (OR, SW or LW). ( ) = mean score for open-response items.
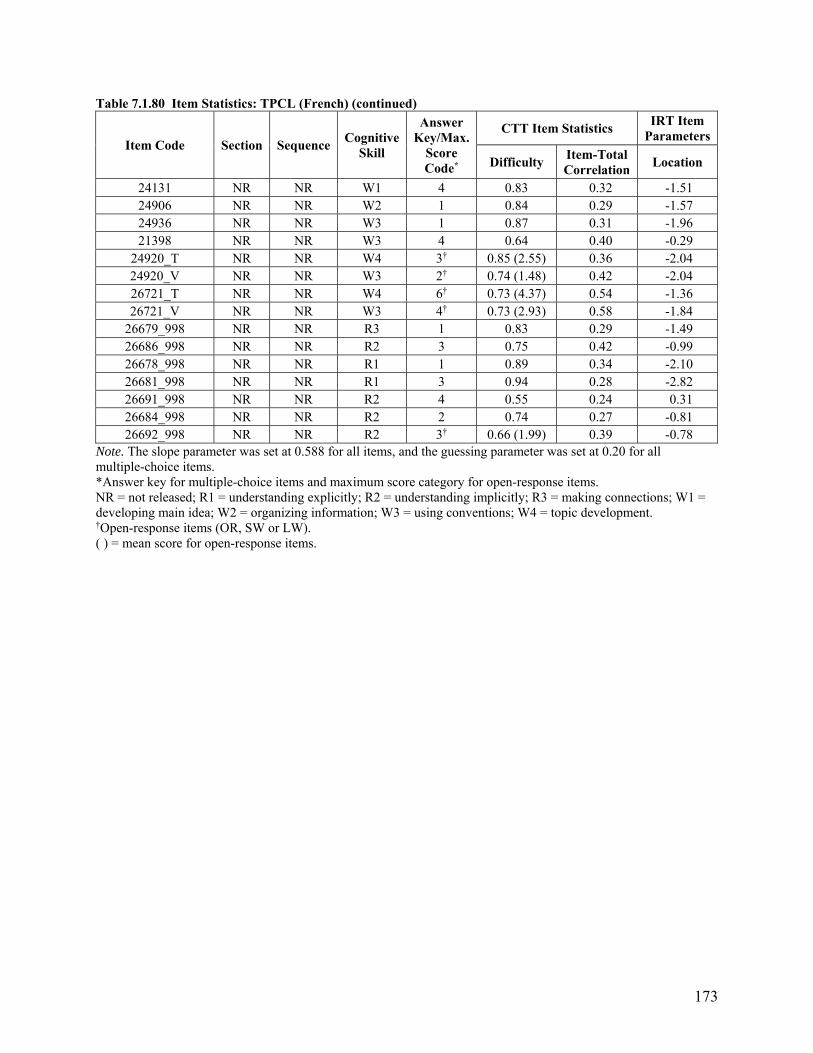
173
Table 7.1.80 Item Statistics: TPCL (French) (continued)
Item Code Section Sequence Cognitive
Skill
Answer Key/Max.
Score Code*
CTT Item Statistics IRT Item
Parameters
Difficulty Item-Total Correlation
Location
24131 NR NR W1 4 0.83 0.32 -1.51 24906 NR NR W2 1 0.84 0.29 -1.57 24936 NR NR W3 1 0.87 0.31 -1.96 21398 NR NR W3 4 0.64 0.40 -0.29
24920_T NR NR W4 3† 0.85 (2.55) 0.36 -2.04 24920_V NR NR W3 2† 0.74 (1.48) 0.42 -2.04 26721_T NR NR W4 6† 0.73 (4.37) 0.54 -1.36 26721_V NR NR W3 4† 0.73 (2.93) 0.58 -1.84
26679_998 NR NR R3 1 0.83 0.29 -1.49 26686_998 NR NR R2 3 0.75 0.42 -0.99 26678_998 NR NR R1 1 0.89 0.34 -2.10 26681_998 NR NR R1 3 0.94 0.28 -2.82 26691_998 NR NR R2 4 0.55 0.24 0.31 26684_998 NR NR R2 2 0.74 0.27 -0.81 26692_998 NR NR R2 3† 0.66 (1.99) 0.39 -0.78
Note. The slope parameter was set at 0.588 for all items, and the guessing parameter was set at 0.20 for all multiple-choice items. *Answer key for multiple-choice items and maximum score category for open-response items. NR = not released; R1 = understanding explicitly; R2 = understanding implicitly; R3 = making connections; W1 = developing main idea; W2 = organizing information; W3 = using conventions; W4 = topic development. †Open-response items (OR, SW or LW). ( ) = mean score for open-response items.
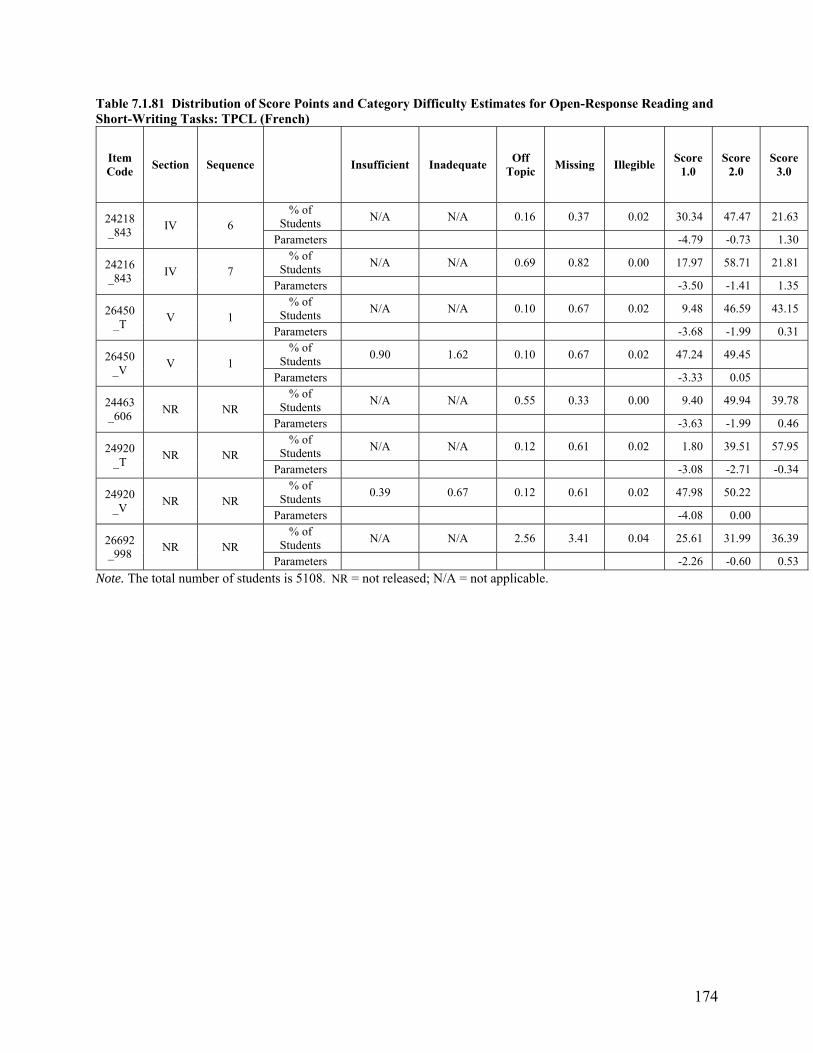
174
Table 7.1.81 Distribution of Score Points and Category Difficulty Estimates for Open-Response Reading and Short-Writing Tasks: TPCL (French)
Item Code
Section Sequence Insufficient Inadequate Off
Topic Missing Illegible
Score 1.0
Score 2.0
Score 3.0
24218_843
IV 6 % of
Students N/A N/A 0.16 0.37 0.02 30.34 47.47 21.63
Parameters -4.79 -0.73 1.30
24216_843
IV 7 % of
Students N/A N/A 0.69 0.82 0.00 17.97 58.71 21.81
Parameters -3.50 -1.41 1.35
26450_T
V 1 % of
Students N/A N/A 0.10 0.67 0.02 9.48 46.59 43.15
Parameters -3.68 -1.99 0.31
26450_V
V 1 % of
Students 0.90 1.62 0.10 0.67 0.02 47.24 49.45
Parameters -3.33 0.05
24463_606
NR NR % of
Students N/A N/A 0.55 0.33 0.00 9.40 49.94 39.78
Parameters -3.63 -1.99 0.46
24920_T
NR NR % of
Students N/A N/A 0.12 0.61 0.02 1.80 39.51 57.95
Parameters -3.08 -2.71 -0.34
24920_V
NR NR % of
Students 0.39 0.67 0.12 0.61 0.02 47.98 50.22
Parameters -4.08 0.00
26692_998
NR NR % of
Students N/A N/A 2.56 3.41 0.04 25.61 31.99 36.39
Parameters -2.26 -0.60 0.53
Note. The total number of students is 5108. NR = not released; N/A = not applicable.
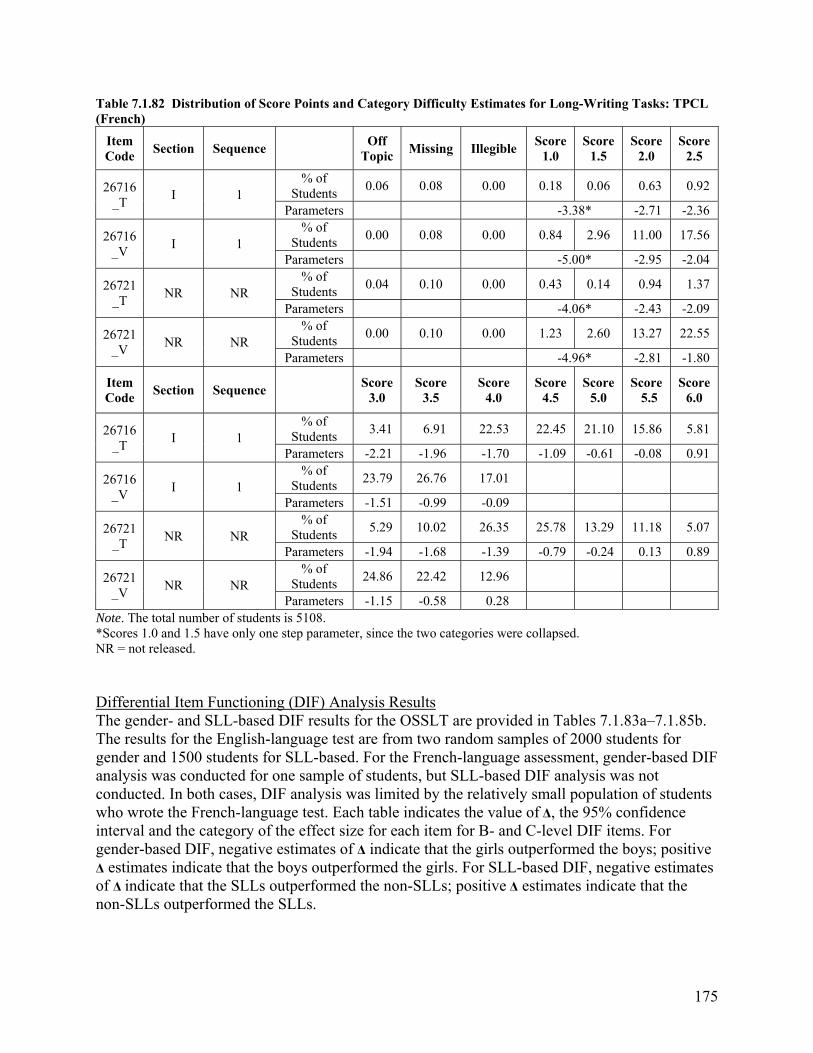
175
Table 7.1.82 Distribution of Score Points and Category Difficulty Estimates for Long-Writing Tasks: TPCL (French)
Item Code
Section Sequence Off
Topic Missing Illegible
Score 1.0
Score 1.5
Score 2.0
Score 2.5
26716_T
I 1 % of
Students 0.06 0.08 0.00 0.18 0.06 0.63 0.92
Parameters -3.38* -2.71 -2.36
26716_V
I 1 % of
Students 0.00 0.08 0.00 0.84 2.96 11.00 17.56
Parameters -5.00* -2.95 -2.04
26721_T
NR NR % of
Students 0.04 0.10 0.00 0.43 0.14 0.94 1.37
Parameters -4.06* -2.43 -2.09
26721_V
NR NR % of
Students 0.00 0.10 0.00 1.23 2.60 13.27 22.55
Parameters -4.96* -2.81 -1.80
Item Code
Section Sequence Score
3.0 Score
3.5 Score
4.0 Score
4.5 Score
5.0 Score
5.5 Score
6.0
26716_T
I 1 % of
Students 3.41 6.91 22.53 22.45 21.10 15.86 5.81
Parameters -2.21 -1.96 -1.70 -1.09 -0.61 -0.08 0.91
26716_V
I 1 % of
Students 23.79 26.76 17.01
Parameters -1.51 -0.99 -0.09
26721_T
NR NR % of
Students 5.29 10.02 26.35 25.78 13.29 11.18 5.07
Parameters -1.94 -1.68 -1.39 -0.79 -0.24 0.13 0.89
26721_V
NR NR % of
Students 24.86 22.42 12.96
Parameters -1.15 -0.58 0.28 Note. The total number of students is 5108. *Scores 1.0 and 1.5 have only one step parameter, since the two categories were collapsed. NR = not released. Differential Item Functioning (DIF) Analysis Results The gender- and SLL-based DIF results for the OSSLT are provided in Tables 7.1.83a–7.1.85b. The results for the English-language test are from two random samples of 2000 students for gender and 1500 students for SLL-based. For the French-language assessment, gender-based DIF analysis was conducted for one sample of students, but SLL-based DIF analysis was not conducted. In both cases, DIF analysis was limited by the relatively small population of students who wrote the French-language test. Each table indicates the value of Δ, the 95% confidence interval and the category of the effect size for each item for B- and C-level DIF items. For gender-based DIF, negative estimates of Δ indicate that the girls outperformed the boys; positive Δ estimates indicate that the boys outperformed the girls. For SLL-based DIF, negative estimates of Δ indicate that the SLLs outperformed the non-SLLs; positive Δ estimates indicate that the non-SLLs outperformed the SLLs.
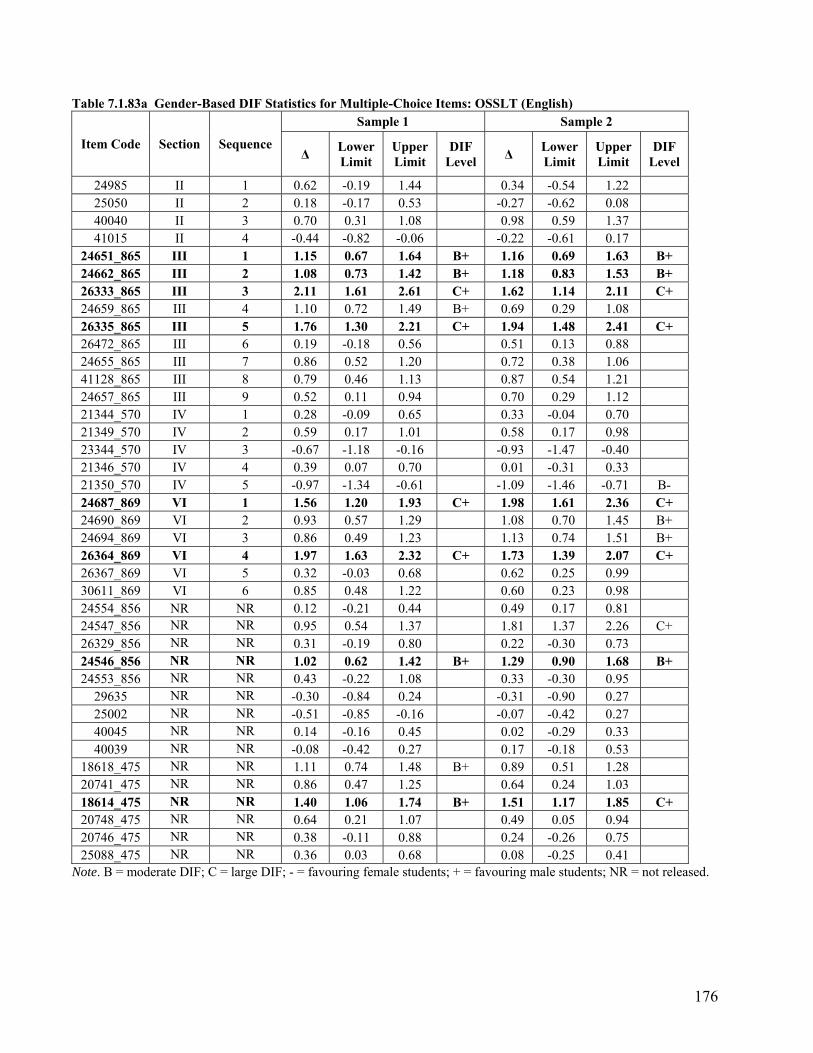
176
Table 7.1.83a Gender-Based DIF Statistics for Multiple-Choice Items: OSSLT (English)
Item Code Section Sequence
Sample 1 Sample 2
Δ Lower Limit
Upper Limit
DIF Level
Δ Lower Limit
Upper Limit
DIF Level
24985 II 1 0.62 -0.19 1.44 0.34 -0.54 1.22 25050 II 2 0.18 -0.17 0.53 -0.27 -0.62 0.08 40040 II 3 0.70 0.31 1.08 0.98 0.59 1.37 41015 II 4 -0.44 -0.82 -0.06 -0.22 -0.61 0.17
24651_865 III 1 1.15 0.67 1.64 B+ 1.16 0.69 1.63 B+ 24662_865 III 2 1.08 0.73 1.42 B+ 1.18 0.83 1.53 B+ 26333_865 III 3 2.11 1.61 2.61 C+ 1.62 1.14 2.11 C+ 24659_865 III 4 1.10 0.72 1.49 B+ 0.69 0.29 1.08 26335_865 III 5 1.76 1.30 2.21 C+ 1.94 1.48 2.41 C+ 26472_865 III 6 0.19 -0.18 0.56 0.51 0.13 0.88 24655_865 III 7 0.86 0.52 1.20 0.72 0.38 1.06 41128_865 III 8 0.79 0.46 1.13 0.87 0.54 1.21 24657_865 III 9 0.52 0.11 0.94 0.70 0.29 1.12 21344_570 IV 1 0.28 -0.09 0.65 0.33 -0.04 0.70 21349_570 IV 2 0.59 0.17 1.01 0.58 0.17 0.98 23344_570 IV 3 -0.67 -1.18 -0.16 -0.93 -1.47 -0.40 21346_570 IV 4 0.39 0.07 0.70 0.01 -0.31 0.33 21350_570 IV 5 -0.97 -1.34 -0.61 -1.09 -1.46 -0.71 B- 24687_869 VI 1 1.56 1.20 1.93 C+ 1.98 1.61 2.36 C+ 24690_869 VI 2 0.93 0.57 1.29 1.08 0.70 1.45 B+ 24694_869 VI 3 0.86 0.49 1.23 1.13 0.74 1.51 B+ 26364_869 VI 4 1.97 1.63 2.32 C+ 1.73 1.39 2.07 C+ 26367_869 VI 5 0.32 -0.03 0.68 0.62 0.25 0.99 30611_869 VI 6 0.85 0.48 1.22 0.60 0.23 0.98 24554_856 NR NR 0.12 -0.21 0.44 0.49 0.17 0.81 24547_856 NR NR 0.95 0.54 1.37 1.81 1.37 2.26 C+ 26329_856 NR NR 0.31 -0.19 0.80 0.22 -0.30 0.73 24546_856 NR NR 1.02 0.62 1.42 B+ 1.29 0.90 1.68 B+ 24553_856 NR NR 0.43 -0.22 1.08 0.33 -0.30 0.95
29635 NR NR -0.30 -0.84 0.24 -0.31 -0.90 0.27 25002 NR NR -0.51 -0.85 -0.16 -0.07 -0.42 0.27 40045 NR NR 0.14 -0.16 0.45 0.02 -0.29 0.33 40039 NR NR -0.08 -0.42 0.27 0.17 -0.18 0.53
18618_475 NR NR 1.11 0.74 1.48 B+ 0.89 0.51 1.28 20741_475 NR NR 0.86 0.47 1.25 0.64 0.24 1.03 18614_475 NR NR 1.40 1.06 1.74 B+ 1.51 1.17 1.85 C+ 20748_475 NR NR 0.64 0.21 1.07 0.49 0.05 0.94 20746_475 NR NR 0.38 -0.11 0.88 0.24 -0.26 0.75 25088_475 NR NR 0.36 0.03 0.68 0.08 -0.25 0.41
Note. B = moderate DIF; C = large DIF; - = favouring female students; + = favouring male students; NR = not released.
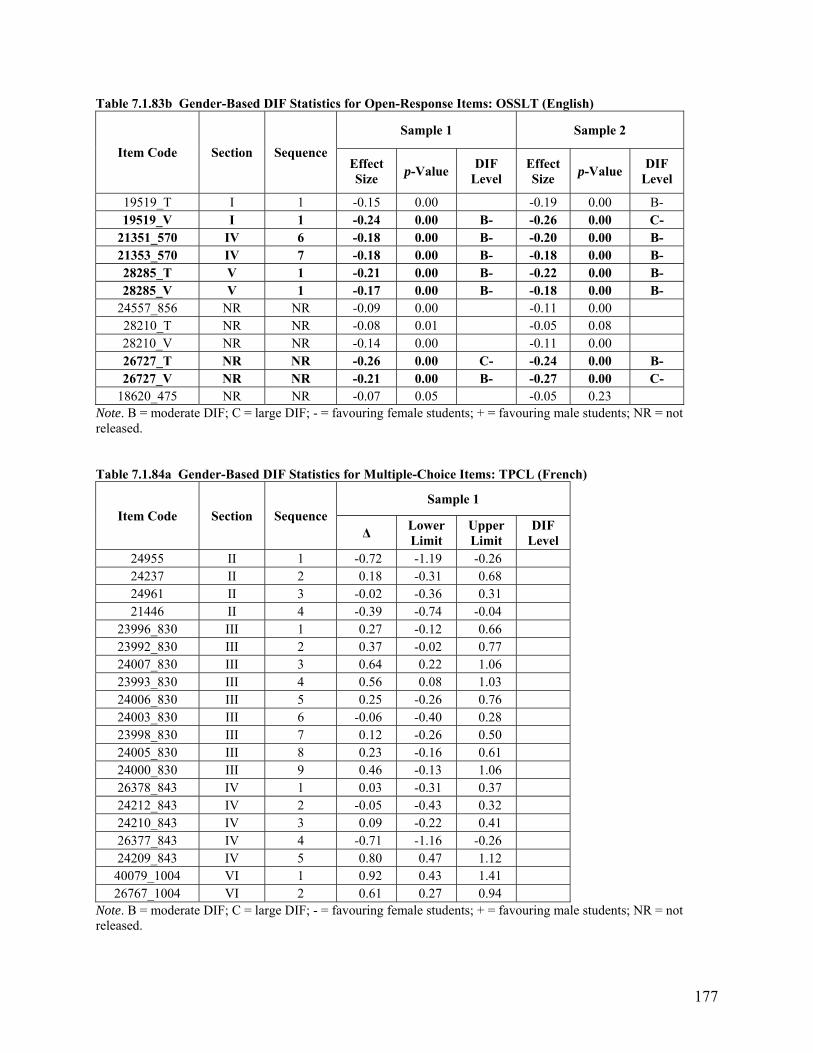
177
Table 7.1.83b Gender-Based DIF Statistics for Open-Response Items: OSSLT (English)
Item Code Section Sequence
Sample 1 Sample 2
Effect Size
p-Value DIF
Level Effect Size
p-Value DIF
Level
19519_T I 1 -0.15 0.00 -0.19 0.00 B- 19519_V I 1 -0.24 0.00 B- -0.26 0.00 C-
21351_570 IV 6 -0.18 0.00 B- -0.20 0.00 B- 21353_570 IV 7 -0.18 0.00 B- -0.18 0.00 B- 28285_T V 1 -0.21 0.00 B- -0.22 0.00 B- 28285_V V 1 -0.17 0.00 B- -0.18 0.00 B-
24557_856 NR NR -0.09 0.00 -0.11 0.00 28210_T NR NR -0.08 0.01 -0.05 0.08 28210_V NR NR -0.14 0.00 -0.11 0.00 26727_T NR NR -0.26 0.00 C- -0.24 0.00 B- 26727_V NR NR -0.21 0.00 B- -0.27 0.00 C-
18620_475 NR NR -0.07 0.05 -0.05 0.23 Note. B = moderate DIF; C = large DIF; - = favouring female students; + = favouring male students; NR = not released. Table 7.1.84a Gender-Based DIF Statistics for Multiple-Choice Items: TPCL (French)
Item Code Section Sequence Sample 1
Δ Lower Limit
Upper Limit
DIF Level
24955 II 1 -0.72 -1.19 -0.26 24237 II 2 0.18 -0.31 0.68 24961 II 3 -0.02 -0.36 0.31 21446 II 4 -0.39 -0.74 -0.04
23996_830 III 1 0.27 -0.12 0.66 23992_830 III 2 0.37 -0.02 0.77 24007_830 III 3 0.64 0.22 1.06 23993_830 III 4 0.56 0.08 1.03 24006_830 III 5 0.25 -0.26 0.76 24003_830 III 6 -0.06 -0.40 0.28 23998_830 III 7 0.12 -0.26 0.50 24005_830 III 8 0.23 -0.16 0.61 24000_830 III 9 0.46 -0.13 1.06 26378_843 IV 1 0.03 -0.31 0.37 24212_843 IV 2 -0.05 -0.43 0.32 24210_843 IV 3 0.09 -0.22 0.41 26377_843 IV 4 -0.71 -1.16 -0.26 24209_843 IV 5 0.80 0.47 1.12
40079_1004 VI 1 0.92 0.43 1.41 26767_1004 VI 2 0.61 0.27 0.94
Note. B = moderate DIF; C = large DIF; - = favouring female students; + = favouring male students; NR = not released.
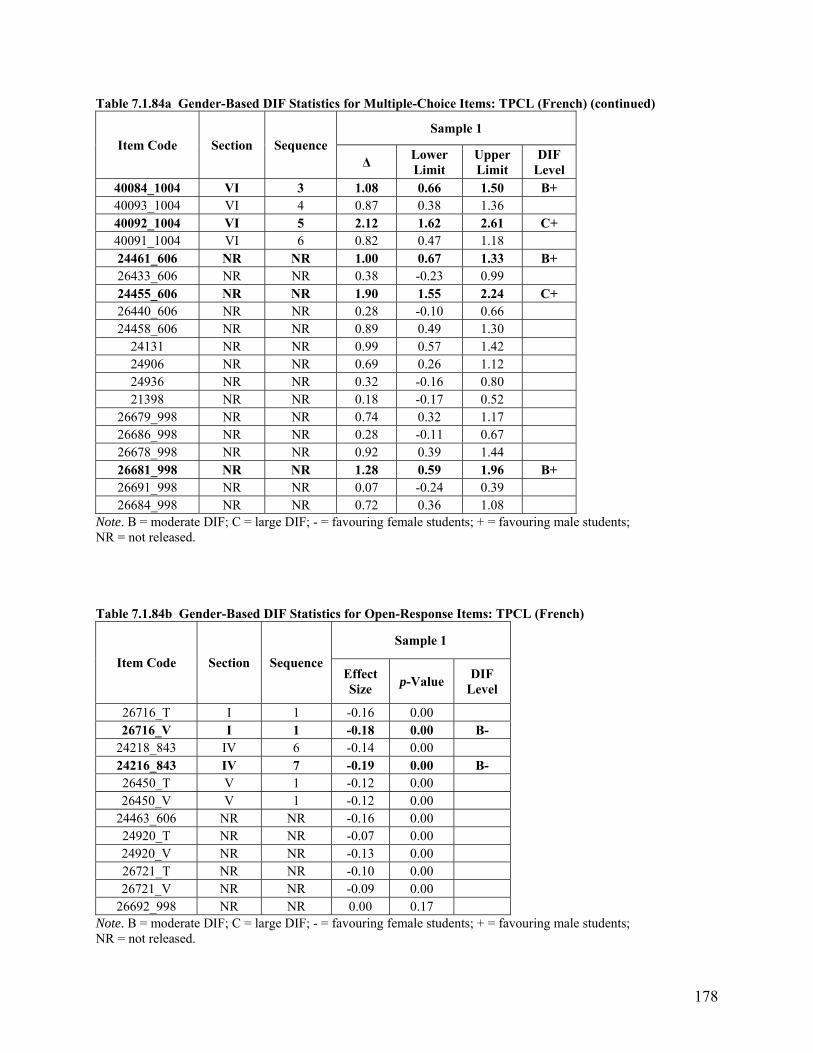
178
Table 7.1.84a Gender-Based DIF Statistics for Multiple-Choice Items: TPCL (French) (continued)
Item Code Section Sequence Sample 1
Δ Lower Limit
Upper Limit
DIF Level
40084_1004 VI 3 1.08 0.66 1.50 B+ 40093_1004 VI 4 0.87 0.38 1.36 40092_1004 VI 5 2.12 1.62 2.61 C+ 40091_1004 VI 6 0.82 0.47 1.18 24461_606 NR NR 1.00 0.67 1.33 B+ 26433_606 NR NR 0.38 -0.23 0.99 24455_606 NR NR 1.90 1.55 2.24 C+ 26440_606 NR NR 0.28 -0.10 0.66 24458_606 NR NR 0.89 0.49 1.30
24131 NR NR 0.99 0.57 1.42 24906 NR NR 0.69 0.26 1.12 24936 NR NR 0.32 -0.16 0.80 21398 NR NR 0.18 -0.17 0.52
26679_998 NR NR 0.74 0.32 1.17 26686_998 NR NR 0.28 -0.11 0.67 26678_998 NR NR 0.92 0.39 1.44 26681_998 NR NR 1.28 0.59 1.96 B+ 26691_998 NR NR 0.07 -0.24 0.39 26684_998 NR NR 0.72 0.36 1.08
Note. B = moderate DIF; C = large DIF; - = favouring female students; + = favouring male students; NR = not released. Table 7.1.84b Gender-Based DIF Statistics for Open-Response Items: TPCL (French)
Item Code Section Sequence
Sample 1
Effect Size
p-Value DIF
Level
26716_T I 1 -0.16 0.00 26716_V I 1 -0.18 0.00 B-
24218_843 IV 6 -0.14 0.00 24216_843 IV 7 -0.19 0.00 B- 26450_T V 1 -0.12 0.00 26450_V V 1 -0.12 0.00
24463_606 NR NR -0.16 0.00 24920_T NR NR -0.07 0.00 24920_V NR NR -0.13 0.00 26721_T NR NR -0.10 0.00 26721_V NR NR -0.09 0.00
26692_998 NR NR 0.00 0.17 Note. B = moderate DIF; C = large DIF; - = favouring female students; + = favouring male students; NR = not released.
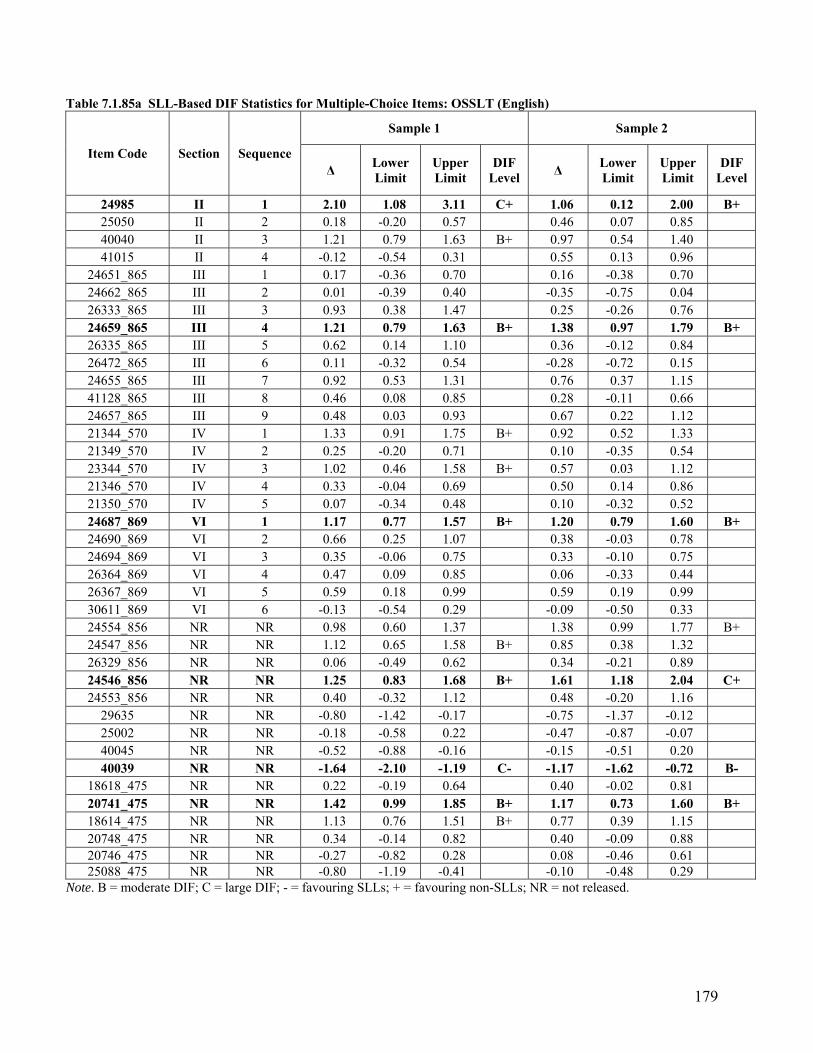
179
Table 7.1.85a SLL-Based DIF Statistics for Multiple-Choice Items: OSSLT (English)
Item Code Section Sequence
Sample 1 Sample 2
Δ Lower Limit
Upper Limit
DIF Level
Δ Lower Limit
Upper Limit
DIF Level
24985 II 1 2.10 1.08 3.11 C+ 1.06 0.12 2.00 B+ 25050 II 2 0.18 -0.20 0.57 0.46 0.07 0.85 40040 II 3 1.21 0.79 1.63 B+ 0.97 0.54 1.40 41015 II 4 -0.12 -0.54 0.31 0.55 0.13 0.96
24651_865 III 1 0.17 -0.36 0.70 0.16 -0.38 0.70 24662_865 III 2 0.01 -0.39 0.40 -0.35 -0.75 0.04 26333_865 III 3 0.93 0.38 1.47 0.25 -0.26 0.76 24659_865 III 4 1.21 0.79 1.63 B+ 1.38 0.97 1.79 B+ 26335_865 III 5 0.62 0.14 1.10 0.36 -0.12 0.84 26472_865 III 6 0.11 -0.32 0.54 -0.28 -0.72 0.15 24655_865 III 7 0.92 0.53 1.31 0.76 0.37 1.15 41128_865 III 8 0.46 0.08 0.85 0.28 -0.11 0.66 24657_865 III 9 0.48 0.03 0.93 0.67 0.22 1.12 21344_570 IV 1 1.33 0.91 1.75 B+ 0.92 0.52 1.33 21349_570 IV 2 0.25 -0.20 0.71 0.10 -0.35 0.54 23344_570 IV 3 1.02 0.46 1.58 B+ 0.57 0.03 1.12 21346_570 IV 4 0.33 -0.04 0.69 0.50 0.14 0.86 21350_570 IV 5 0.07 -0.34 0.48 0.10 -0.32 0.52 24687_869 VI 1 1.17 0.77 1.57 B+ 1.20 0.79 1.60 B+ 24690_869 VI 2 0.66 0.25 1.07 0.38 -0.03 0.78 24694_869 VI 3 0.35 -0.06 0.75 0.33 -0.10 0.75 26364_869 VI 4 0.47 0.09 0.85 0.06 -0.33 0.44 26367_869 VI 5 0.59 0.18 0.99 0.59 0.19 0.99 30611_869 VI 6 -0.13 -0.54 0.29 -0.09 -0.50 0.33 24554_856 NR NR 0.98 0.60 1.37 1.38 0.99 1.77 B+ 24547_856 NR NR 1.12 0.65 1.58 B+ 0.85 0.38 1.32 26329_856 NR NR 0.06 -0.49 0.62 0.34 -0.21 0.89 24546_856 NR NR 1.25 0.83 1.68 B+ 1.61 1.18 2.04 C+ 24553_856 NR NR 0.40 -0.32 1.12 0.48 -0.20 1.16
29635 NR NR -0.80 -1.42 -0.17 -0.75 -1.37 -0.12 25002 NR NR -0.18 -0.58 0.22 -0.47 -0.87 -0.07 40045 NR NR -0.52 -0.88 -0.16 -0.15 -0.51 0.20 40039 NR NR -1.64 -2.10 -1.19 C- -1.17 -1.62 -0.72 B-
18618_475 NR NR 0.22 -0.19 0.64 0.40 -0.02 0.81 20741_475 NR NR 1.42 0.99 1.85 B+ 1.17 0.73 1.60 B+ 18614_475 NR NR 1.13 0.76 1.51 B+ 0.77 0.39 1.15 20748_475 NR NR 0.34 -0.14 0.82 0.40 -0.09 0.88 20746_475 NR NR -0.27 -0.82 0.28 0.08 -0.46 0.61 25088_475 NR NR -0.80 -1.19 -0.41 -0.10 -0.48 0.29
Note. B = moderate DIF; C = large DIF; - = favouring SLLs; + = favouring non-SLLs; NR = not released.
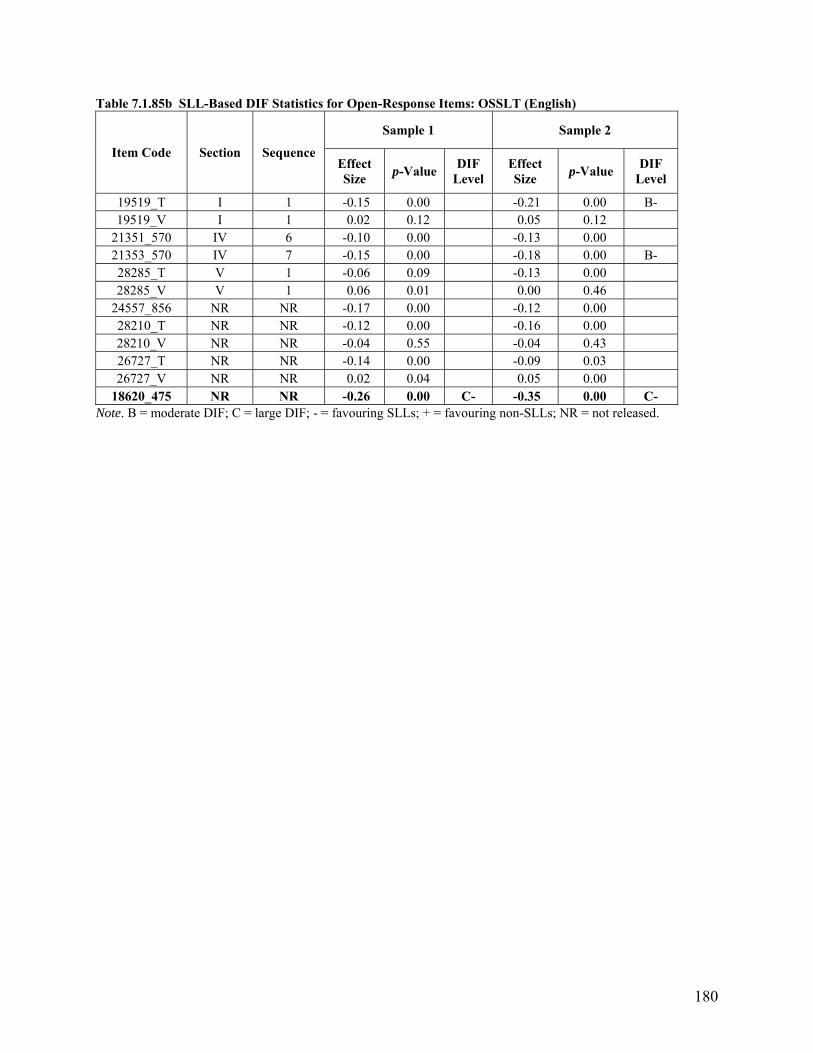
180
Table 7.1.85b SLL-Based DIF Statistics for Open-Response Items: OSSLT (English)
Item Code Section Sequence
Sample 1 Sample 2
Effect Size
p-Value DIF
Level Effect Size
p-Value DIF
Level
19519_T I 1 -0.15 0.00 -0.21 0.00 B- 19519_V I 1 0.02 0.12 0.05 0.12
21351_570 IV 6 -0.10 0.00 -0.13 0.00 21353_570 IV 7 -0.15 0.00 -0.18 0.00 B- 28285_T V 1 -0.06 0.09 -0.13 0.00 28285_V V 1 0.06 0.01 0.00 0.46
24557_856 NR NR -0.17 0.00 -0.12 0.00 28210_T NR NR -0.12 0.00 -0.16 0.00 28210_V NR NR -0.04 0.55 -0.04 0.43 26727_T NR NR -0.14 0.00 -0.09 0.03 26727_V NR NR 0.02 0.04 0.05 0.00
18620_475 NR NR -0.26 0.00 C- -0.35 0.00 C- Note. B = moderate DIF; C = large DIF; - = favouring SLLs; + = favouring non-SLLs; NR = not released.

2 Carlton Street, Suite 1200, Toronto ON M5B 2M9
Telephone: 1-888-327-7377 Web site: www.eqao.com
© 2017 Queen’s Printer for Ontario I Ctrc_report_ne_0617