Embed Size (px)
Citation preview
Equal Access to Education: An Evaluationof the Roma Teaching Assistant Programmein Serbia
M. Battaglia and L. Lebedinski
Discussion Paper 2014-21
Equal Access to Education: An Evaluation of the
Roma Teaching Assistant Programme in Serbia∗
Marianna Battaglia† Lara Lebedinski‡
July 7, 2014
Abstract
This paper investigates the effects of a remedial education pro-gramme - the Roma Teaching Assistant Programme - targeting thesocially excluded and marginalised Roma ethnic minority in Serbia.By using first-hand collected data, we find evidence that children ex-posed to the programme went more to school. We do not find an effecton dropouts or marks for all grades. An examination of heterogenouseffects suggest that children in the first grade benefitted more from theprogramme as compared to their older peers through lower dropoutsand better grades. Overall, our results suggest that well-targeted re-medial education programmes can be successful in boosting outcomesof low performers.
Keywords: primary education, remedial education, Roma, ethnic mi-nority, absences, dropouts
JEL classification codes: I21, J15, D04
∗We would like to thank Tito Boeri, Matz Dahlberg, Eliana La Ferrara, AndreasMadestam, Michele Pellizzari, Petra Thielmann and participants at AMID summer school2010, Bocconi University 2011 Development Reading Group, Bocconi University PhD sem-inar 2011, Spring Meeting of the Young Economists 2012, Third International Workshopon Applied Economics of Education 2012 and CESifo Economic Studies 2012 conference.We are grateful to the personnel of the Serbian Ministry of Education, especially to BozidarJovanovic and Tunde Kovacs-Cerovic, for giving us the authorisation for this project andfor answering all our questions. We are indebted to Nikola Duvnjak from OSCE foranswering all our questions about the pilot phase of the programme. This paper is pro-duced as part of the project Actors, Markets, and Institutions in Developing Countries: Amicro-empirical approach (AMID), a Marie Curie Initial Training Network (ITN) fundedby the European Commission under its Seventh Framework Programme Contract Number214705 PITN-GA-2008-214705. The usual disclaimer applies.†Departamento de Fundamentos del Analisis Economico, University of Alicante, 03690
San Vicente del Raspeig, Alicante, Spain, Tel: +34 965 90 32 18, Email: [email protected]‡Corrsponding author, IRES, Universite catholique de Louvain, Department of Eco-
nomics, 3 Place Montesquieu, 1348 Louvain-la-Neuve, Belgium, Tel: +32 104 74 337,Email: [email protected]
1
1 Introduction
Roma are mainly located in South Eastern Europe and with a population ofapproximately 6 million people they constitute the largest ethnic minority inthe continent (Open Society Institute, 2008).1 They experience severe socialexclusion in terms of high poverty and unemployment levels, low educationalattainments and no participation in the political and cultural life. Romapeople are poorer than other population groups and more likely to fall intopoverty and remain poor. They have persistent disadvantages in education,including low school attendance and overrepresentation in special schoolsand schools for adult education.2 Roma are often employed in low skilledjobs where they earn below average wages. They often lack access to creditand property ownership and are overdependent on social benefits.
The problems of the Roma minority have become evident with the ex-pansion of the European Union. The visa liberalisation and the adhesionto the Union of countries like Romania and Bulgaria - where the percent-age of Roma population is high - have indirectly led to migration flows to-wards Western Europe. The receiving countries encountered new problems:increased number of asylum requests, appearance of informal settlements,increased number of unemployed and inadequacy of the education system toaccommodate new foreign pupils. The extraordinariness of the phenomenonled to hot discussions within the European countries and civil society. Itincreased the interest of the EU in the EU candidate countries with a highpercentage of Roma population, e.g. Serbia. Understanding the impact ofprogrammes targeting Roma is useful not only for the sending countries, butalso for the receiving ones.
Schooling has always been considered a needed measure to improve livingconditions of Roma people and to foster their integration: higher enrolmentrates and better achievement at school are expected to lead to persistenteffects in the labour market and in the reduction of poverty in the long-run.The goal of this paper is to evaluate the impact of the main programmetargeting Roma inclusion in education in South Eastern Europe in the firstyear of its introduction: the Roma Teaching Assistant Programme (RTA).3
1The number of Roma and the subsequent numbers refer to the following countries:Albania, Bosnia and Herzegovina, Bulgaria, Croatia, Czech Republic, Estonia, Hungary,Kosovo, Latvia, Lithuania, Republic of Macedonia, Moldova, Montenegro, Poland, Roma-nia, Serbia, Slovakia, Slovenia and Ukraine.
2The net enrolment rate of Roma in primary education varies among the countries andit is still low, in the range of 40% to 60%. Moreover, students may enrol at the beginningof the year, but may not actually attend school: the percentage of completion rates ofprimary school is in the range of only 30% to 40% in most countries in 2008 (Open SocietyInstitute, 2008). Special schools are schools for children with special educational needs.Schools for adult education were initially introduced with the idea to provide basic literacyknowledge to adult pupils. Nowadays, however, they are mainly attended by pupils whoenrolled at school late and by pupils who decided to return to school after dropping out.
3The Serbian name of the programme is Romski Asistenti - Pomoc u Nastavi. The Ser-
2
Roma assistants - one per each school - participate in regular lessons wherethey provide additional help to Roma pupils who have difficulties in followingclasses. They organise additional lessons, help them with their homeworkand assignments and once per week they visit their parents. We examine ifthis remedial education programme reduces dropouts, raises attendance andimproves the marks of Roma pupils. This study uses primary collected dataduring 5 months in the Summer-Autumn 2010. We employ two differenteconometric strategies and their combination. First, we exploit the gradualimplementation and the intensity of the programme in order to base theevaluation of its impact on a comparison of Early and Late Enrollees. Sec-ond, we compare children exposed to the programme to older cohorts lessexposed to it. There is evidence that all children exposed to the programmewent on average more to school. We also find evidence that marks improvedin mathematics and Serbian for first graders. Higher impacts are obtainedin schools with a lower number of Roma: the higher is their number, thelower the impact of the programme on the outcomes of interest. This isespecially the case for girls, for whom being in a school with a lower numberof Roma turns out to be more favourable. Boys respond to the programmewith fewer absences in schools with fewer Roma.
Two main mechanisms may help to explain the empirical evidence. First,the intervention alters the inputs in the education production function byproviding more instruction time to pupils. The second potential mechanismworks through cultural transmission of preferences for education. For anethnic group which has extremely low educational outcomes in differentcountries, it is possible that this fact can be, at least partly, explained bypreferences for education. In the case of RTA, the provision of a role model, aperson with the same Roma background, can affect preferences for educationof both children and parents and induce children to reduce absences andexert more effort at school.
There are no studies in economic literature that investigate how to im-prove life circumstances of Roma, in general, and Roma kids, in particular.This paper contributes to the existing literature by providing an accurateoverview of the attainments of Roma pupils in Serbian schools, for whichso far there were no data available, and by contrasting their achievementto the average Non Roma pupils. More importantly, it adds evidence onshort-term effects of remedial education targeting a stigmatised minoritygroup and suggests replicable examples in contexts where minorities suffer
bian Government - together with Montenegro, Croatia, Macedonia, Hungary, Romania,Bulgaria, the Czech Republic and Slovakia - is participating in the Decade of Roma Inclu-sion, an international initiative running from 2005 to 2015 in Central and South-EasternEurope. The initiative brings together governments, international and non-governmentalorganizations to improve the welfare of the Roma population, focusing on healthcare, ed-ucation, employment and housing. Examples of other programmes which introduce Romaschool assistants can be found in Czech Republic, Slovakia, Bulgaria and Croatia.
3
low attainment rates and social exclusion. For Roma people this is the casein many other European countries.
Related Literature This paper adds to the literature on remedial educa-tion programmes. Policies targeting low-performing students are generallydifficult to evaluate because children with learning difficulties are not ran-domly assigned to programmes. Their characteristics affect both the selec-tion into the programme and its success, making it difficult to distinguishbetween the two effects, especially because the selection mechanism is nottypically fully observable. A few studies are able to overcome the iden-tification problem and they find support for the effectiveness of remedialeducation in the short run.4 Aside from short term-effects, there are twovery important questions for policy makers. Does the effect fade out afterthe programme? Is the effect of remedial education cumulative? Banerjeeet al (2007) find that only a year after the end of a remedial education pro-gramme, its effect faded largely out. In contrast, children participating inthe programme for two consecutive years, could accumulate knowledge andincreased their test scores in both years. This suggests that gaps can bereduced, but policy makers should aim at long-term interventions.
This study speaks also to the literature on programmes aiming at im-proving schooling outcomes of minority communities and at narrowing dif-ferences between racial groups. The black-white achievement gap and itsevolution has been intensively investigated in the United States.5 Fryer(2010) demonstrates that today’s racial differences in social and economicoutcomes are greatly reduced when one accounts for educational achieve-
4See for instance Lavy and Schlosser (2005); Jacob and Lefgren (2004); Hanushek,Kain, and Rivkin (2002); Banerjee, Cole, Duflo, and Linden (2007).
5The first and most known programme attempting to close the racial gap is the PerryPreschool programme introduced in 1962: it targeted children from disadvantaged socio-economic backgrounds and consisted of a 2-5-hour daily preschool programme for childrenaged three years old and weekly home visits by teachers. Schweinhart, Barnes, and Weikart(1993) find that students in the programme had higher marks between the ages of 5 to27, 21% less grade retention or special services required and 21% higher graduation rates.Other interventions for disadvantaged families followed such as the Abecedarian Projectin the ’70s, which provided childcare services for four cohorts of children from infancythrough age five, and the Early Training Project, consisting in summertime experiencesand weekly home visits during the three summers before entering first grade. Attemptshave been also made during the primary school through the introduction of after-schoolprogrammes (Lauer, Akiba, Wilkerson, Apthorp, Snow, and Martin-Glenn, 2006), meritpay for principals, teachers, and students (Podgursky and Springer, 2007; Fryer, 2010),professional development for teachers (Boyd, Grossman, Lankford, Loeb, and Wyckoff,2009), and getting parents to be more involved (Domina, 2005), placing disadvantagedstudents in better schools through desegregation busing (Angrist and Lang, 2004) or al-tering the neighborhoods in which they live (Jacob, 2004; Sanbonmatsu, Kling, Duncan,and Brooks-Gunn, 2006). The evidence on the efficacy of these interventions is mixed:certain programmes have left the racial achievement gap essentially unchanged. A goodoverview of the evolution of the black-white gap is given in Neal (2006).
4
ment and poverty levels. This points to the fact that there is little empiricalevidence for discrimination in the recent data. A similar finding emerges inthe study of Kertesi and Kezdi (2011) on Roma educational achievement inHungary. They find that the gap between Roma and Non Roma is substan-tially larger than the gap between African Americans and whites in UnitedStates, but that accounting for health, parenting, school and class fixed ef-fects, and family background, the achievement gap disappears in readingand decreases by 85% in mathematics.
The third relevant strand of the literature is on programmes aiming atachieving better schooling outcomes of the poor. Recent intervention tar-geting children with low socio-economic background have tried to affect thedemand for education. A prominent type of demand side programmes areconditional cash transfers which raised enrolment and attendance in manydeveloping countries. However, policies that promote school enrolment maynot promote learning: early contributions indicate that programmes whichare effective at reducing absence from school often do not have an impacton achievements of the average student (Schultz, 2004; Miguel and Kremer,2004). Analogously, Fryer (2011a), through school-based randomized trialsin schools designed to test the impact of incentives on student achievement,shows that incentives can raise achievement among even the poorest mi-nority students in the lowest performing schools only if the incentives aregiven for certain inputs, such as reading books. Providing incentives forachievement in marks is much less effective. Finally, only providing schoolbooks and other school material or subsidised school meals does not seem toimprove students achievements in the case of students with weaker academicbackgrounds (Glewwe, Kremer, and Moulin, 2009; Vermeersch and Kremer,2005).
The rest of the paper is organised as follow. Section 2 summarises theRoma Teaching Assistant Programme and describes our data. Sections 3explains our empirical strategy and presents our results. Section 4 discussesthe findings and concludes.
2 Description of the programme and preliminaryanalysis
2.1 The Roma Teaching Assistant Programme
The Roma Teaching Assistant Programme started as a pilot programmeimplemented by various NGOs in 2002. In 2007 the OSCE took over its co-ordination and financing. In 2009 the programme started to have a countrywide coverage and it is under the coordination of the Ministry of Education.In the scholastic year 2009/2010 48 primary schools had a Roma assistant:22 schools started with the programme at different points of time between
5
2002 and 2007; 26 schools started in 2009. The Ministry expanded theprogramme to other 77 schools starting from November 2010.
Based on when the programme started in a school, the schools can bedivided in two groups: schools entering the programme in September 2009(Early Enrollees) and schools entering the programme in September 2010(Late Enrollees). The 22 schools, which joined the programme between 2002and 2007, are excluded from our analysis. The selection of these schools wasnot centralised; they were chosen by NGOs based on the share of Romapupils. For our analysis we will consider only 26 Early Enrollees and 77Late Enrollees.
Both schools and potential Roma assistants had to apply to participate inthe programme. Among 78 schools that applied in 2009, a commission rep-resenting the government institutions together with OSCE representatives,chose 26 Early Enrollee schools based on the percentage of Roma students(between 5% and 40%) and preferably, the availability of preschool pro-gramme in the school.6 The requirements for Roma assistants were knowl-edge of Romani, secondary school diploma and experience in working withchildren. 158 candidates applied for 26 assistant positions.7 In 2010 theprogramme was renamed to Education for all and starting with the scholas-tic year 2010/2011 Roma teaching assistants were renamed to pedagogicalassistants. In year 2010, 252 schools applied for 77 assistants. Similar to thefirst round, schools were eligible only if they had between 5% and 40% ofRoma. The only difference between the two rounds was that in the secondround the availability of a preschool programme was not considered. Thereason is that in 2010/2011 pedagogical assistants started to work in 50kindergartens offering compulsory preschool programme. Schools not offer-ing the preschool programme could have then been close to kindergartensoffering it. The Roma pupil would have been helped by an assistant fromher entry in the school anyhow. One could argue that this small change inrequirements could lead to a selection bias in the two rounds, but our datado not support this claim.8 Selection criteria for now pedagogical assistantsremained unchanged and out of the 329 applications for the position, 77 were
664 out of 78 schools that applied had a percentage of Roma between 5% and 40%.Among these 64, OSCE selected 19 schools (out of 26) with a preschool programme, 5schools (out of 36) with no preschool programme and 2 schools (out of 2) for which noinformation is available.
7The following criteria were taken into account for the ranking of the assistants’ appli-cations: highest level of education completed or enrolled (from 10 to 30 points), experiencein working with Roma children (0 to 10 points), experience in working on projects relatedto education (0 to 10 points), motivation (0 to 10 points), attendance of relevant seminarsand/or courses (0 to 10 points), experience as Roma teaching assistant (0 to 10 points),knowledge of Romani (0 to 10 points) and additional points (0 to 10 points).
8Unfortunately we do not have information on the availability of a preschool programmefor schools applying in 2010/2011. Nonetheless, it is worthy to recall that some schoolswithout the compulsory preschool programme have also been selected in the previous year.
6
accepted to work at schools and another 50 were accepted for kindergartens.
Schools got to know that they would receive an assistant in early June.They did not inform parents about the presence of the RTAs. The pro-gramme did not receive publicity from TV and radio. This leads us tobelieve that parents were not aware of the existence of the RTA before en-rolling their children at school. Data also confirm that Early Enrollees didnot attract more Roma students than Late Enrollees in the first year of theprogramme.9 There is not selection of children into schools.
Every school received only one assistant. Schools received from the Min-istry a description of her duties, but they were free to decide how to allocatethe time of the assistant depending on the needs of the school.10 Activitiesat school involve both working during regular classes and after-school work.Work with local communities comprises duties such as collecting informationabout children who did not enrol or who left school, gathering documentsfor school enrolment, visiting families,11 cooperation with Roma NGOs, etc.The assistants were advised to work mainly with lower grades, especially thefirst. Their objectives were to ensure that children go to school, to preventthem from dropping out and to help them to succeed at school. In 2009the Ministry of Education organised a series of seminars with the goal ofproviding the necessary knowledge and skills to Roma teaching assistants.12
2.2 Preliminary Analysis
2.2.1 Data and Trends of the Variables
We use primary data collected during 5 months in the summer/autumn 2010.School data was not available in a digital format and we visited schools andcollected in person data from administrative records. Our dataset containsinformation on 23 schools (out of 26) among Early Enrollees and 15 schools(out of 77) among Late Enrollees.13 Given that the data collection process
9Roma pupils joining Early Enrollees schools in the pretreatment year - 2008/2009- corresponded to 2.4% of all Roma enrolled in these schools. In Late Enrollees theywere 2.1%. In the first year of the programme - 2009/2010 - these percentages were 1.6%and 1.3%. The number of Roma pupils enrolling at school for the first time reducedproportionally between the two years in both types of schools.
10There was a suggested time allocation. The 30 weekly hours of the assistant could bedistributed in the following way: work at school (19 hours), work with the local community(8 hours) and writing reports and documentation (3 hours).
11In most cases Roma live in segregated settlements so that assistants can go to thesettlement and visit several families at once.
12In total, the assistants attended 22 working days of seminars and courses in thescholastic year 2009/2010. Regular seminars provided the opportunity to the Ministry tounderstand the problems of the assistants and guide them through the initial difficulties.In 2010/2011 a set of 9 modules, which all assistants had to attend in their first year ofservice, was devised.
13In total, there were 26 schools which got an assistant in 2009/2010. In 3 schools wewere not allowed to collect data. These schools do not differ from the other schools either
7
was costly, our dataset consists only of a subsample of Late Enrollees. Weselected 15 Late Enrollees schools according to the following criteria: first,they had to be in the same district of an Early Enrollees school;14 second,they had to be in a rural/urban municipality as the nearby Early Enrolleesschool; third, they had to share a similar school size to the nearby EarlyEnrollees school and finally, a similar percentage of Roma pupils.15
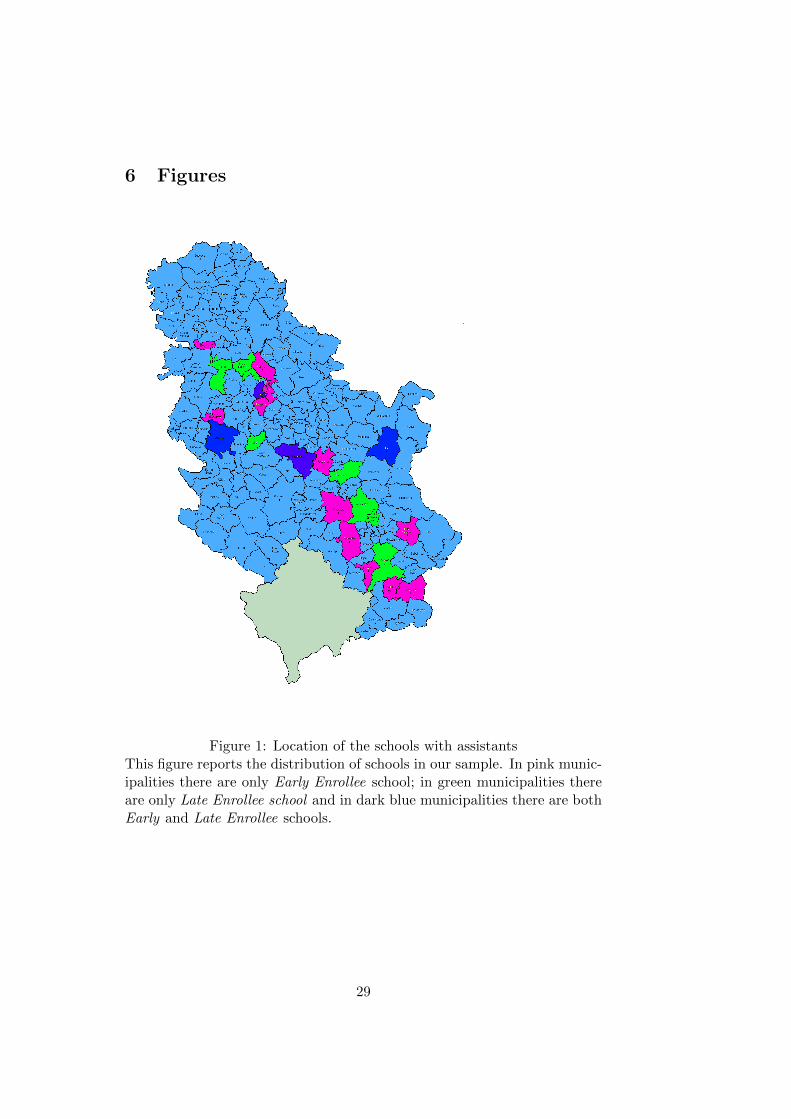
Schools are mainly in Belgrade/Central Serbia and in the South/South-Eastern part of the country, and they are equally distributed in rural andurban areas.16 Figure 1 reports the distribution of schools in our sample.
The data set contains information on 4 scholastic years − from 2006/2007to 2009/2010 − for the lower four grades of primary school for 18,268 Romaand Non Roma children. It contains for each year and for each pupil thefinal mark in mathematics, final mark in Serbian and number of hours ofabsences in a year. The data set contains individual characteristics, such asgender, year of birth, month of birth and place of birth.17 School specificdata include school size, number of Roma - in both school and class - andwhether the school is in an urban setting.
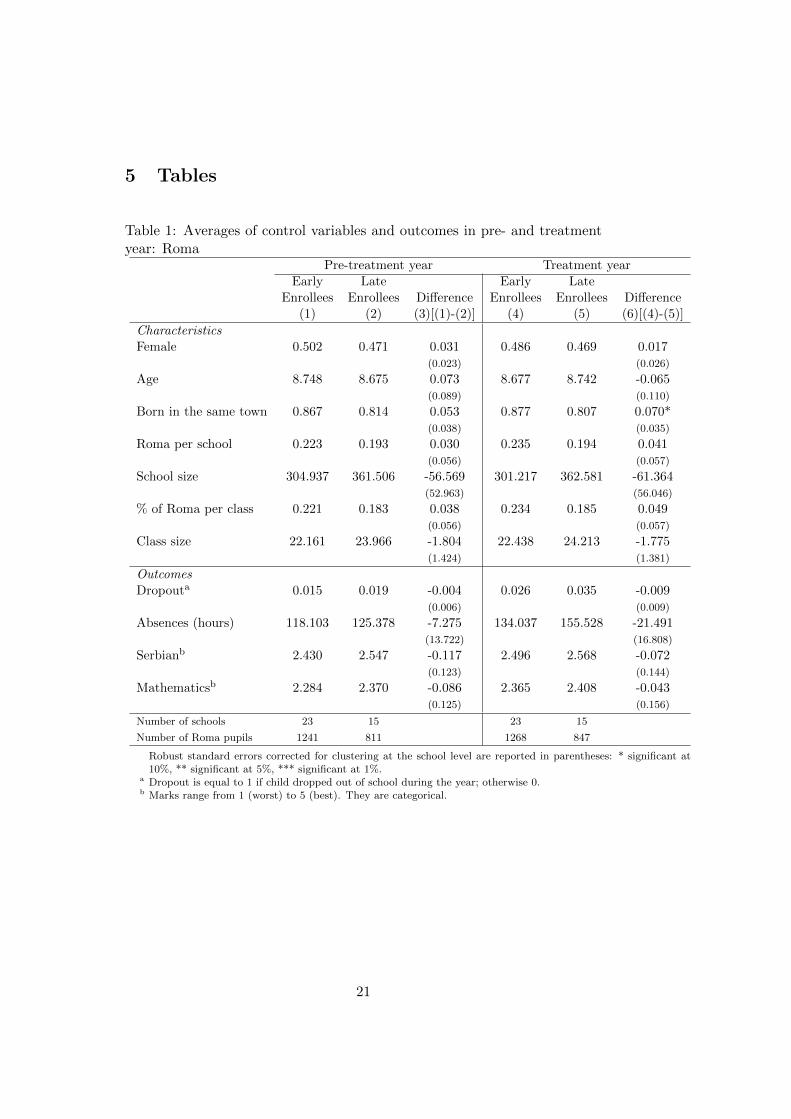
Roma children Table 1 shows summary statistics of the control variablesand main outcomes of interest for Roma children in the pre- and treatmentyear. In the pre-treatment year the mean characteristics of the schools thatwere enrolled in the programme later (column (2), table 1) resemble thoseof the schools that enrolled first (column (1), table 1). Boys and girls areequally distributed in both groups of schools and pupils were mainly bornin the same town where they attend school. A fifth of all students in theschools are Roma. The number of Roma per class is roughly 4-5 children andthe class size is 22.161 in Early Enrollees and 23.966 in Late Enrollees. Thetable shows no statistically significant differences between Early Enrolleesand Late Enrollees nor in the student’s and school characteristics nor inthe outcomes of interest. This similarity between Early Enrollees and Late
in the number of pupils or in the percentage of Roma children and they are located indifferent areas: one in Belgrade, one in Central Serbia and one in the South.
14A district is made up by more municipalities. In Serbia there are 24 districts and 160municipalities.
15In few cases the school chosen was not available and we needed to select the secondoption.
1610 schools are located in Belgrade; 8 schools in the central area of the country (5schools in the municipality of Valjevo and 3 in the municipality of Novi Sad); 12 schoolsin South-Eastern Serbia (3 schools in the municipality of Jagodina, 2 in Kragujevac, 3in Krusevac, 3 in Zajecar and 1 in Pozarevac); 8 schools in the South of the country (6schools in the municipality of Leskovac and 2 in the municipality of Nis). We define urbanarea a municipality with more than 35,000 inhabitants.
17Roma in Serbia are mainly sedentary: they do not move much within the country.Nonetheless, there is a substantial out-migration, especially towards the European Union,and in the last years in-migration has increased due to the wars in Ex-Yugoslavia. ManyRoma refugees in Serbia come from Kosovo.
8
Enrollees schools is also found in the treatment year, providing support forour claim that Early Enrollees and Late Enrollees are comparable.18
By simply comparing average outcomes in the two types of schools, wesee that dropouts almost double in the last year in both types of school andabsences increase in 2009/2010 in both Early Enrollees and Late Enrollees,but they increase by less in Early Enrollee schools. We believe that boththe increase in dropouts and the increases in absences is related to theliberalisation of the visa regime with the European Union. This regimechange induced a considerable number of Roma families to migrate to theEU. Finally, we see a minor improvement in all marks from pre- to treatmentyear. This effect is larger in Early Enrollees than in Late Enrollees.
Non Roma children In our analysis we focus on Roma children and weuse for all of our estimations only the sample of Roma children.19 Table2 shows summary statistics of the control variables and main outcomes ofinterest for Non Roma children in the pre- and treatment year. No statisti-cally significant differences are found neither in the pre- nor in the treatmentyear in the pupils’ characteristics or outcomes. The only statistically signif-icant difference is in the dropout rate, which however is close to zero andnot problematic in the lower primary school grades.
The differences between Roma and Non Roma children are striking.Three important aspects need to be stressed when comparing them. First,dropouts are almost exclusively of Roma children. Moreover, Roma chil-dren are absent from school approximately three to four times more thanNon Roma children. Lastly, on a grading scale of 1 to 5, the differenceof almost two marks between Roma and Non Roma pupils in Serbian andmathematics is substantial.
3 Econometric Strategy
We want to examine the impact of the Roma Teaching Assistant Programmeon dropouts, attendance and marks of Roma pupils in the first year of itsimplementation. In the analysis we use only Roma children. We exploitthe gradual implementation of the programme. Our treatment group con-sists of schools which started to implement the programme in September2009 (Early Enrollees), whereas the control group is a subsample of schoolswhich got the assistants starting from November 2010 (Late Enrollees).Weargue that the selection of schools to enter the programme earlier/later canbe treated “as if random” for several reasons. First, the selection criteria
18The only significant difference is found for the place of birth: there are less migrantchildren in treated schools.
19The only exception is section on spillover effects in the appendix.
9
remained almost the same in both rounds.20 Second, one could argue thatschools applying in the first round were more motivated, but schools whichapplied in the first year could also apply in the second year. However, someschools which applied in 2009 did not apply anymore in the year after.21
Thus, if they really were more motivated and of better quality, it is hardto understand why they did not want to be part of the programme any-more in 2010. Third, we do know that observable characteristics do notdiffer between schools applying in the first year and schools applying in thesecond year.22 Fourth, we are in possession of data for 3 years prior to theintroduction of the programme and the placebo tests for these years supportour claim of no systematic differences between the two groups of schools.Fifth, we do know that the committee for schools selection - composed ofthe Minister of Education and other representatives of the Ministry, repre-sentatives of National Council, OSCE and of the Ministry for Human andMinority Rights - rated schools based on their shown interest and motivation(application) in the same way, in both years.23
A second possible estimation strategy is to exploit the fact that oldercohorts were less exposed to the programme (control group) to youngercohorts (treated group) in Early Enrollees-treated schools.24
The main advantage of using as a control group schools which enrolledlater in the programme is that its impact would not be confounded withother government policies that took place in the year of its introduction. Forinstance, in 2009/2010 all first grade pupils got free text books and in the lastfew years the Ministry strongly suggests to schools to reduce repetition ratesespecially in the lower grades. The weakness of this control group is that wecannot be completely certain that unobservable characteristics are the samein Early Enrollee and Late Enrollee schools. In order to purge time-invariantschool characteristics, we can use older cohorts in the treatment schools asa control group. Nonetheless, this econometric strategy relies on the strongassumptions that there were no government interventions over the period -which is not exactly our case - and that the outcomes have a regular trend
20In both rounds the programme was advertised in newspapers Politika and ProsvetniPregled, the last being a newspaper for people working in the education sector; in ad-dition to the advertisement, in 2010/2011 schools’ directorates - one directorate may beresponsible for more than a municipality - informed schools directly.
2147% of schools which applied in 2009, and did not get selected, did it again in 2010and two thirds of them got selected in the second year (16 out of 26 schools applying inboth years). Among these schools, only 2 schools, corresponding to 12.5%, is present inour subsample.
22Schools which applied in 2010 are in the same areas of schools of 2009 and they havealmost the same percentage of Roma, on average 13.99% compared to 13.07%. They arenot statistically different (p-value=0.458). These are the only information we have onschools which applied and did not get selected.
23In both rounds the committee gave priority to schools in the poorest municipalitiesor with huge Roma settlements (Subotica, Novi Sad, Nis, Kragujevac, Belgrade).
24This method is similar in spirit to Duflo (2004).
10
over the years. By combining the Early - Late Enrollees analysis with thecohort specification we better take into account strengths and weaknessesof both approaches.
3.1 First Approach: Comparison of Early Enrollees vs. LateEnrollees
Our first econometric strategy exploits the fact that some schools receivedthe assistants prior to other schools. We compare Early Enrollee schoolswith Late Enrollee schools in the years 2008/2009 - year before the intro-duction of the programme - and 2009/2010 - year of the introduction of theprogramme.
3.1.1 Average treatment approach
Our specification (1) is a difference-in-difference model with school fixedeffects:
Yijt = β0 + δt + ρj + β1treatmentj ∗ postt + β2X′ijt + εijt (1)
The outcome variables Yijt are dropout, hours of absences and finalmarks in Serbian and mathematics of individual i, in school j at time t. δt is atime fixed effect, ρj corresponds to school fixed effects, and treatmentj∗posttis the interaction term between the dummies for treatment status of theschool and treatment year. Dropout is a dummy variable taking value oneif child i dropped out of school during year t, otherwise it is equal to zero.With school fixed effects we are able to control for time-invariant unobserv-able school characteristics as well as unobservable geographical characteris-tics. The control variables X ′ijt are school size, school size squared, numberof Roma in school, number of Roma in school squared, percentage of Romaper class, class size, class size squared, the gender of the child (=1 if the childis female), age, age squared, and whether the kid is a migrant (=1 if thechild was born in the same town where she attends school). The coefficientof interest (β1) is the difference-in-difference estimator of the interactionterm between treatment and time that captures the difference in outcomesbetween the treatment and control schools.
Results for the different outcomes of interest are reported in table 3. Forall outcomes we estimate the regressions without and with controls (columns(1) and (2)). We then split our sample by gender (columns (3) and (4)) toassess whether the impact of the intervention differs by gender.25
25There is vast evidence on gender gaps in education and their underlying causes. Buch-mann, DiPrete, and McDaniel (2008) give a very good review of the literature. For thisreason we also control for the gender of the assistant, but it does not turn out to besignificant in any specification.
11
Overall, results show that the programme had a statistically significantimpact only on hours of absences: pupils exposed to the programme wereon average almost 17 hours less absent from school (0.121 standard devia-tions).26 This is especially the case for male, whose reduction in absencesis of roughly 26 hours (5 days) or equivalently 0.176 standard deviations.Dropouts and marks in both subjects are unaffected by the programme.At first it could seem surprising that dropouts do not respond to the pro-gramme, but our preliminary data analysis has shown that dropouts are notproblematic in the lower 4 grades. The fact that the inclusion of controlvariables does not change the magnitude of our coefficients suggests thatour coefficients are very robustly estimated.
There are only three settlements where children from both control andtreatment schools live together and it is possible that in these settlementschildren in Early Enrollee and children in Late Enrollees schools interact.If one were to believe that there were spillover effects from treated childrenon children from control schools, this would imply that coefficients in ourregressions are underestimated.
Placebo Regressions The difference-in-difference approach relies on theparallel trends assumption. We assume that, in the absence of the pro-gramme, treatment and comparison schools would have had a parallel trendin the average outcomes of interest. An obvious way to examine the robust-ness of our results is to estimate the same regressions (specification (1)) forthe years 2006/2007 versus 2007/2008 and for the years 2007/2008 versus2008/2009. By estimating the same regressions for pretreatment years, wecan test if the outcomes in the two groups of schools were regular beforethe introduction of the programme. Significant difference-in-difference coef-ficients in placebo regressions would invalidate our estimation strategy andwould question the adequacy of our comparison group.
Placebo tests are summarised in table 4 and we do not find significantcoefficients. The diff-in-diff estimates for mathematics and Serbian are in-significant and negative for the period immediately preceding the introduc-tion of the programme (2007/2008 versus 2008/2009). Even if one were tobelieve that there was a trend prior to the programme, then our estimatesfor all outcomes are underestimating the effect of the programme in theaverage treatment approach.27 The placebo regressions support our claimthat Late Enrollees are a good counterfactual for Early Enrollees.
26On average, Roma pupils are absent from school 143 hours (28 days) in a year.27Remember that we expect the coefficient of treatment*post in our main regression to
be positive for marks (Serbian and mathematics).
12
3.1.2 Intensity of treatment approach
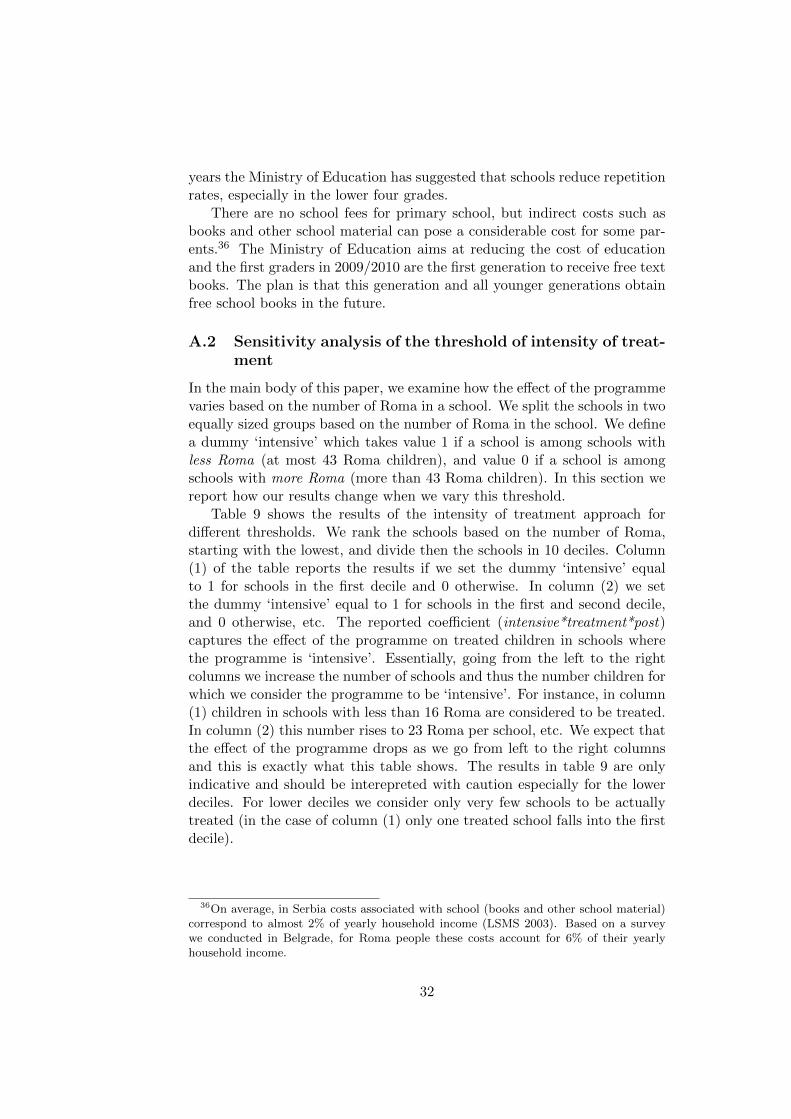
The design of the intervention permits us to investigate whether the effectof the programme varies with the number of Roma per school. Each schoolhas only one assistant: the higher the number of Roma per school, the lessintense is the programme. If the assistant has to help a high number ofstudents, she will help less each of them: she will be less present both inregular classes and in activities regarding their homework and assignments.
Our intensity specification is a variation of the previous approach; it stilluses within school variation of Roma, but now we exploit also the variationin the number of Roma between schools. We divide schools in two equallysized groups with 19 schools.28 The dummy intensive is equal to one forschools with fewer than 43 Roma.29 The main difference to the prior modelis that we interact the dummy intensive with treatment and time. Webelieve that differentiating the schools in groups helps to better understandthe role of the number of Roma on the impact of the programme. Thecoefficient of interest is now β6.
The intensity of treatment is modeled:
Yijt = β0 + δt + β1treatmentj + β2treatmentj ∗ postt + β3intensive Romajt+(2)
+ β4intensive Romajt ∗ postt + β5intensive Romajt ∗ treatmentj++ β6intensive Romajt ∗ treatmentj ∗ postt + εijt
Results with and without controls, and for both genders are reported intable 5. The intensity of the programme clearly plays a role in explainingits effects. The lower is the number of Roma in a school, and similarly themore the assistant can help them, the higher is the impact on the outcomesof interest. Absences, for instance, reduce on average by roughly 36 hours orequivalently 0.228 standard deviations in a year in schools with less Roma,compared to Late Enrollee schools. The fall in absences is driven by a re-duction in absences of boys, almost 60 hours less. The effects disappear inschools with a higher number of Roma. Marks in both mathematics andSerbian increase for pupils in Early Enrollee schools with a lower number ofRoma, but again these effects do not result in schools with a higher numberof Roma. The impacts are especially large for females, for whom being in aschool with a lower number of Roma seems to be more favourable: on aver-age, if exposed to the programme in a school with less Roma, their marks
28The average school number of Roma between the two years - pre- and treatment year- is used to define the two groups. The threshold is here 43 pupils in a school. Our balancetests for the pretreatment year are reported in the Appendix (table 10).
29In A.2 we vary the threshold and we find that the effect of the programme is stronger,the lower the threshold. This is exactly what we would expect. Remember that thisapproach delivers the effect of the programme on schools for which we define, based onthe threshold, that the programme is intensive. A lower threshold means that less Romaare in that school and for this reason the programme is more effective.
13
in mathematics and Serbian increase by 0.680 (0.581 standard deviations)and 0.499 (0.419 standard deviations). The improvement in test scores islarger in mathematics than in languages and this different response to in-terventions by subject has been found also in other studies (Fryer, 2011b).Possible explanations for the disparity in treatment effects by subject areaare offered in Fryer (2011b). One theory suggests that language skills de-velopment occurs at an earlier age than the development of higher cognitiveskills. Another prominent theory suggests that language acquisition andreading test scores are influenced by factors outside of the classroom. Thisis plausible because language skills are used more outside of the classroomthan mathematics skills.30
Placebo Regressions We estimate placebo regressions of estimation (2)for the years 2006/2007 versus 2007/2008 and for the years 2007/2008 ver-sus 2008/2009. Placebo tests are summarised in table 6. The coefficientsfor school grades are positive, but not significant for the period precedingthe programme (2007/2008 versus 2008/2009). The coefficients we obtainfor the treatment year are much larger than coefficients from our placeboregressions. For instance, in mathematics (Serbian) we obtain an increaseof 0.417 (0.307) in marks in treatment year, and this number is only -0.011(0.113) for the pretreatment placebo regression. Similarly, for absences thecoefficient is negative, but with -7.490 hours much smaller than the coef-ficient -36.390 from the main regression. Again, the placebo regressionsconfirm that Late Enrollees are a good counterfactual for Early Enrollees.
3.2 Second approach: Cohort regressions and triple differ-ence
We know that assistants worked mostly with the first grade31 and in thesecond approach we compare kids in the first grade (young cohorts) withkids in older grades - second, third and fourth - (old cohorts) in the pre-and treatment year in treated schools. Here we assume that the differencein marks between first graders’ and second, third and fourth graders’ wouldhave been constant over time, in the absence of the programme. We alsoimplicitly assume the absence of policies targeting specific grades. With thiseconometrics strategy, we are able to purge time-invariant school character-istics.
The specification in this section informs us whether the programme was
30For the corresponding references from the education literature see Fryer (2011b).31We know this fact from informal discussions with assistants. We have also confirmed
this fact with survey data for Belgrade schools (only a subsample of schools) for which wehave collected additional data. In treated schools, the children with whom the assistantactually worked were, on average, 9.73 years old, whereas children with whom the assistantdid not work, were 10.44 years old (Battaglia and Lebedinski, 2013).
14
successful for the children enrolled in the first grade. We first estimate thefollowing regression for Early Enrollees:
Yijt = β0 + β1youngi + β2postt + β3youngi ∗ postt + εijt (3)
where Yijt are again dropout, hours of absences and final marks in Ser-bian and mathematics of individual i, in school j and at time t ; youngt isequal to 1 when the child is at the first grade; postt is equal to 1 in the yearof the treatment (2009/2010). The coefficient of interest is now β3 whichtells us how the first graders have performed compared to the older grades.
The same regression (3) is then estimated for Late Enrollees and thetriple difference between treated and control schools and cohorts is capturedby γ3 in the following specification:
Yijt = β0 + β1youngi + β2postt + β3youngi ∗ postt + γ1treatmentj ∗ postt +(4)
+γ2youngi ∗ treatmentj + γ3youngi ∗ postt ∗ treatmentj + εijt
Unlike estimation (3), regression (4) does not control for possible selec-tion bias. By estimating cohort regressions on a pooled sample of Earlyand Late Enrollees, we can control for government policies targeting specificgrades.32
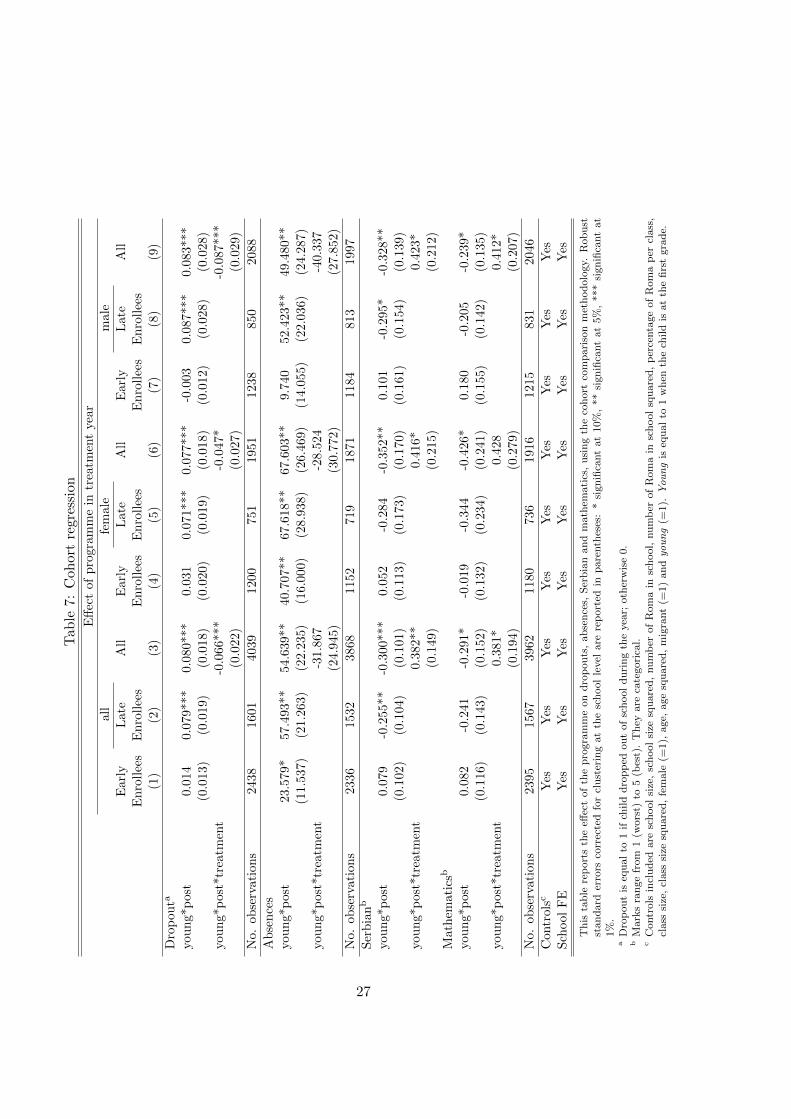
The regressions are estimated with controls and we also inspect the im-pacts by gender. Results are in table 7.
When comparing first graders with older pupils in only Early Enrolleeschools (column (1)), our coefficients of interest have, with the exceptionof absences, the correct sign, but are not statistically significant. We arenot overly concerned that absences increase, because we observe a similarpattern also in control schools (see column (2) in table 7). We believe thatthe reason for the overall increase is that dropouts rise in 2009/2010 as aconsequence of visa liberalisation because some families have migrated to EUcountries.33 Results of the triple interaction for the full sample are reportedin column (3) in table 7. Dropouts are statistically significant. Absencesdecrease for the young cohort, but they do not reach statistical significance.Pupils exposed to the programme in the first grade get higher marks thanfirst graders in control schools (with respect to their older mates). Thiseffect is partly driven by the worse outcomes of first grade pupils in controlschools. We speculate that this happens, because first graders are overallworse than first graders in the preceding year. On average, being in a EarlyEnrollee school increases marks in mathematics and Serbian by 0.284 and0.296 standard deviations for first graders.
32For instance, free schools books for first grade or lower repetition rates in general.33Dropouts are included in our regressions and have a high number of absences.
15
Placebo Regressions We test the robustness of our results by estimat-ing placebo regressions (regression (3), (4)) for the years 2006/2007 versus2007/2008 and for the years 2007/2008 versus 2008/2009 (see table 8). Noneof the relevant coefficients is significant. The size of the coefficient for Ser-bian for 2007/2008 versus 2008/2009 is insignificant, but not completelynegligible. Absences for the two placebo tests are positive, but we obtaina reduction in absences for the treatment year. Similarly, the sign of thecoefficient suggests a worsening of marks for Serbian for younger cohorts,exactly the opposite of what we find for the year of treatment.
4 Conclusion
In this paper we estimate the impact of the Roma Teaching Assistant Pro-gramme in its first year of implementation on schooling outcomes. We usea difference-in-difference approach by exploiting the gradual introductionof the programme. We argue that the assignment to enter the programmeearlier/later can be treated as if random. As an additional check, we usea second econometric strategy. We compare pupils of the first grade fromtreated schools with older cohorts from the same schools. This econometricstrategy controls well for school specific characteristics, but we are not ableto control for government interventions over the observed period. We cancombine the two approaches (Early - Late Enrollees with cohort analysis)and estimate the triple difference between young and old cohorts in treatedand control schools.
Results of our analysis show that the programme had a positive effectand started to reduce the gap between Roma and Non Roma students bothin school achievements and attendance. There is evidence that absencesfell by 0.121 standard deviations in treated schools (17 hours, i.e. 3 to 4days). The remedial education part of the programme targeted mainly firstgraders. Our analysis suggests that, for this group, marks have improvedby almost 0.284 standard deviations in mathematics and 0.296 standarddeviations in Serbian. For the lower primary school grades, dropouts arelow in both Early and Late Enrollee and are not a major problem. Higherimpacts are obtained in schools with a lower number of Roma: the higheris their number, the less the assistant can help them, and the lower is theimpact of the programme on the outcomes of interest in schools with fewerRoma. Girls seem to benefit more from the programme in terms of bettermarks, whereas boys exhibit lower absences. With our data it is not possibleto explain this differential impact of the programme. We do not know ifassistants worked more with girls (boys) or if girls (boys) responded betterto the programme in the case of marks (absences).
While first graders in treated schools perform better than their oldercolleagues, overall the programme does not seem to have a significant im-
16
pact on pupils’ achievement. This is likely the case because assistants workmainly with lower grades and young cohorts are those really exposed tothem. Therefore, the general modest effects should not be interpreted as afailure of the programme. Moreover, this study looks only at its impact inthe first year. It is possible that assistants and schools need some time toadjust to the new role of the assistant and that the full benefit from themwill come at a later stage. This idea is also supported by the literature onthe importance of the experience of teachers which emphasises that gains inteaching skills are largest in the initial years of teaching (Rivkin, Hanushek,and Kain, 2005). Still, our results suggest that the programme is more ef-fective in schools with less Roma. We are aware that it is possible that thereare systematic differences between schools with a lower and a higher shareof Roma. One could argue, for instance, that Roma in schools with a lowershare are more willing to adapt and assimilate to the majority population.We cannot be certain that the same effects could be attained in schools withhigher percentage of Roma if more assistants were assigned to these schools.It still seems plausible that if the goal of the policy maker is to close thegap in schooling outcomes, then more Roma teaching assistants should beassigned to schools with more Roma students.
We are not able to delve into the mechanism which drives our results andour estimates are derived from reduced form regressions. Still, our resultscould and probably are driven by two main mechanisms. First, the RTAinterventions alters the inputs of the education productions function. Theinput of teaching is augmented and this can explain better marks of firstgrade students. A second mechanism possibly at play is the cultural trans-mission of preferences for education. The presence of a person coming fromthe same Roma ethnic background could alter the preferences for educationand beliefs of Roma pupils, which induces them to attend more school andto exert more effort at school.
17
References
Angrist JD, Krueger AB (1991) Does Compulsory School Attendance AffectSchooling and Earnings? The Quarterly Journal of Economics 106(4):979–1014
Angrist JD, Lang K (2004) Does School Integration Generate Peer Effects?Evidence from Boston’s Metco Program. The American Economic Review94(5):1613–1634
Banerjee AV, Cole S, Duflo E, Linden L (2007) Remedying Education: Evi-dence from Two Randomized Experiments in India. The Quarterly Jour-nal of Economics 122(3):1235–1264
Battaglia M, Lebedinski L (2013) The Curse of Low Aspirations: RemedialEducation and Perceived Returns to Education of Roma People. Mimeo
Baucal A (2009) Development of Mathematical and Language Literacyamong Roma Students. Psihologija 39(2):207–227
Boyd D, Grossman P, Lankford H, Loeb S, Wyckoff J (2009) Teacher Prepa-ration and Student Achievement:. Education Evaluation and Policy Anal-ysis 31(4):416–440
Buchmann C, DiPrete T, McDaniel A (2008) Gender Inequalities in Educa-tion. Annual Review of Sociology 34:319–337
Currie J, Thomas D (1999) Early Test Scores, Socioeconomic Status andFuture Outcomes. NBER Working Paper 6943, National Bureau of Eco-nomic Research, Inc.
Domina T (2005) Leveling the Home Advantage: Assessing the Effectivenessof Parental Involvement in Elementary School. Sociology of Education78(3):233–249
Duflo E (2004) Schooling and Labor Market Consequences of School Con-struction in Indonesia Evidence from an Unusual Policy Experiment. Jour-nal of Development Economics 74(1):199–250
Fryer RG (2010) Racial Inequality in the 21st Century: The Declining Sig-nificance of Discrimination. Handbook of Labor Economics 4:855–971
Fryer RG (2011a) Financial Incentives and Student Achievement: Evi-dence from Randomized Trials. The Quarterly Journal of Economics126(4):1755–1798
Fryer RG (2011b) Injecting Successful Charter School Strategies into Tra-ditional Public Schools: Early Results from an Experiment in Houston.
18
NBER Working Papers 17494, National Bureau of Economic Research,Inc
Glewwe P, Kremer M, Moulin S (2009) Many Children Left Behind? Text-books and Test Scores in Kenya. American Economic Journal: AppliedEconomics 1(1):112–135
Hanushek EA, Kain JF, Rivkin SG (2002) Inferring Program Effects forSpecialized Populations: Does Special Education Raise Achievement forStudents with Disabilities. Review of Economics and Statistics 84(4):584–599
Hoxby CM (2000) The Effects of Class Size on Student Achievement: NewEvidence from Population Variation. The Quarterly Journal of Economics115(4):1239–1285
Jacob BA (2004) Public Housing, Housing Vouchers, and Student Achieve-ment: Evidence from Public Housing Demolitions in Chicago. AmericanEconomic Review 94(1):233–258
Jacob BA, Lefgren L (2004) Remedial Education and Student Achievement:A Regression Discontinuity Analysis. Review of Economics and Statistics86(1):226–244
Kertesi G, Kezdi G (2011) The Roma/Non-Roma Test Score Gap in Hun-gary. American Economic Review: Papers & Proceedings 101:3:519–525
Lauer PA, Akiba M, Wilkerson SB, Apthorp HS, Snow D, Martin-GlennML (2006) Out-of-School-Time Programs: A Meta-Analysis of Effects forAt-Risk Students. Review of Educational Research 76(2):275–313
Lavy V, Schlosser A (2005) Targeted Remedial Education for Underper-forming Teenagers: Costs and Benefits. Journal of Labour Economics23(4):839–874
Miguel E, Kremer M (2004) Worms: Identifying Impacts on Educationand Health in the Presence of Treatment Externalities. Econometrica72(1):159–217
Murnane RJ, Willett JB, Levy F (1995) The Growing Importance of Cogni-tive Skills in Wage Determination. The Review of Economics and Statis-tics 77(2):251–66
Neal D (2006) Why Has Black-White Skill Convergence Stopped?, Hand-book of the Economics of Education, vol 1, Elsevier, chap 9, pp 511–576
Neal DA, Johnson WR (1996) The Role of Premarket Factors in Black-White Wage Differences. Journal of Political Economy 104(5):869–95
19
Open Society Institute (2007) Equal Access to Quality Education For Roma.Technical report, Open Society Foundation
Open Society Institute (2008) International Comparative Data Set. Techni-cal report, Open Society Foundation
Podgursky MJ, Springer MG (2007) Teacher Performance Pay: A Review.Journal of Policy Analysis and Management 26(4):909–949
Rivkin SG, Hanushek EA, Kain JF (2005) Teachers, Schools, and AcademicAchievement. Econometrica 73(2):417–458
Sanbonmatsu L, Kling JR, Duncan GJ, Brooks-Gunn J (2006) Neighbor-hoods and Academic Achievement: Results from the Moving to Oppor-tunity Experiment. The Journal of Human Resources 41(4):649–691
Schultz PT (2004) School Subsidies for the Poor: Evaluating the MexicanProgresa Poverty Program. Journal of Development Economics 74(1):199–250
Schweinhart LJ, Barnes HV, Weikart DP (1993) Significant Benefits: TheHigh/Scope Perry Preschool Study Through Age 27. High Scope Press,Ypsilanti, MI
Vermeersch C, Kremer M (2005) Schools Meals, Educational Achievementand School Competition: Evidence from a Randomized Evaluation. PolicyResearch Working Paper Series 3523, The World Bank
20
5 Tables
Table 1: Averages of control variables and outcomes in pre- and treatmentyear: Roma
Pre-treatment year Treatment yearEarly Late Early Late
Enrollees Enrollees Difference Enrollees Enrollees Difference(1) (2) (3)[(1)-(2)] (4) (5) (6)[(4)-(5)]
CharacteristicsFemale 0.502 0.471 0.031 0.486 0.469 0.017
(0.023) (0.026)
Age 8.748 8.675 0.073 8.677 8.742 -0.065(0.089) (0.110)
Born in the same town 0.867 0.814 0.053 0.877 0.807 0.070*(0.038) (0.035)
Roma per school 0.223 0.193 0.030 0.235 0.194 0.041(0.056) (0.057)
School size 304.937 361.506 -56.569 301.217 362.581 -61.364(52.963) (56.046)
% of Roma per class 0.221 0.183 0.038 0.234 0.185 0.049(0.056) (0.057)
Class size 22.161 23.966 -1.804 22.438 24.213 -1.775(1.424) (1.381)
OutcomesDropouta 0.015 0.019 -0.004 0.026 0.035 -0.009
(0.006) (0.009)
Absences (hours) 118.103 125.378 -7.275 134.037 155.528 -21.491(13.722) (16.808)
Serbianb 2.430 2.547 -0.117 2.496 2.568 -0.072(0.123) (0.144)
Mathematicsb 2.284 2.370 -0.086 2.365 2.408 -0.043(0.125) (0.156)
Number of schools 23 15 23 15
Number of Roma pupils 1241 811 1268 847
Robust standard errors corrected for clustering at the school level are reported in parentheses: * significant at10%, ** significant at 5%, *** significant at 1%.
a Dropout is equal to 1 if child dropped out of school during the year; otherwise 0.b Marks range from 1 (worst) to 5 (best). They are categorical.
21
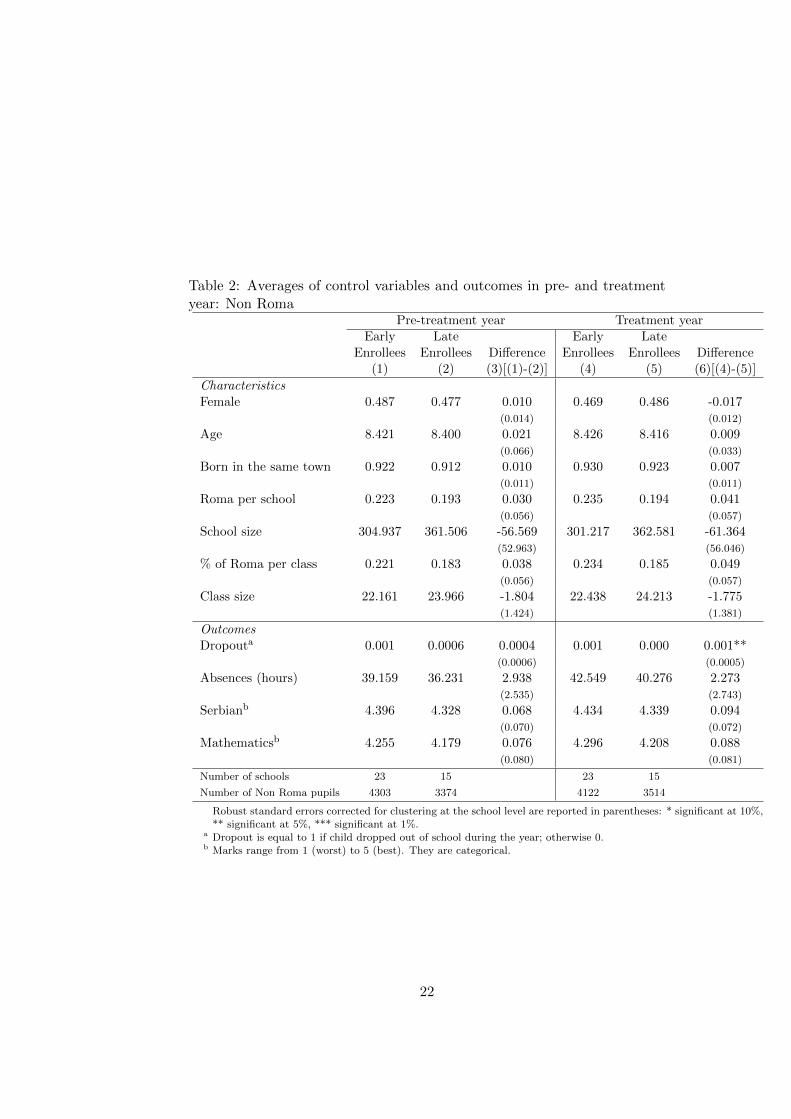
Table 2: Averages of control variables and outcomes in pre- and treatmentyear: Non Roma
Pre-treatment year Treatment yearEarly Late Early Late
Enrollees Enrollees Difference Enrollees Enrollees Difference(1) (2) (3)[(1)-(2)] (4) (5) (6)[(4)-(5)]
CharacteristicsFemale 0.487 0.477 0.010 0.469 0.486 -0.017
(0.014) (0.012)
Age 8.421 8.400 0.021 8.426 8.416 0.009(0.066) (0.033)
Born in the same town 0.922 0.912 0.010 0.930 0.923 0.007(0.011) (0.011)
Roma per school 0.223 0.193 0.030 0.235 0.194 0.041(0.056) (0.057)
School size 304.937 361.506 -56.569 301.217 362.581 -61.364(52.963) (56.046)
% of Roma per class 0.221 0.183 0.038 0.234 0.185 0.049(0.056) (0.057)
Class size 22.161 23.966 -1.804 22.438 24.213 -1.775(1.424) (1.381)
OutcomesDropouta 0.001 0.0006 0.0004 0.001 0.000 0.001**
(0.0006) (0.0005)
Absences (hours) 39.159 36.231 2.938 42.549 40.276 2.273(2.535) (2.743)
Serbianb 4.396 4.328 0.068 4.434 4.339 0.094(0.070) (0.072)
Mathematicsb 4.255 4.179 0.076 4.296 4.208 0.088(0.080) (0.081)
Number of schools 23 15 23 15
Number of Non Roma pupils 4303 3374 4122 3514
Robust standard errors corrected for clustering at the school level are reported in parentheses: * significant at 10%,** significant at 5%, *** significant at 1%.
a Dropout is equal to 1 if child dropped out of school during the year; otherwise 0.b Marks range from 1 (worst) to 5 (best). They are categorical.
22
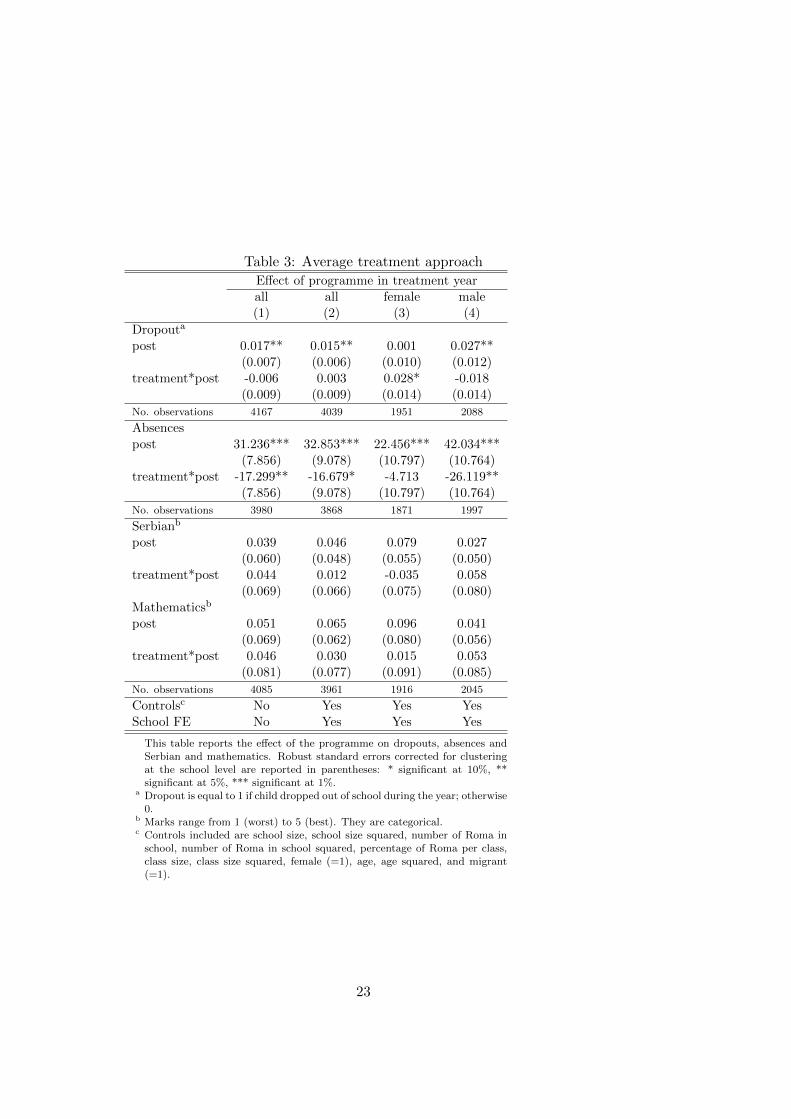
Table 3: Average treatment approach
Effect of programme in treatment yearall all female male(1) (2) (3) (4)
Dropouta
post 0.017** 0.015** 0.001 0.027**(0.007) (0.006) (0.010) (0.012)
treatment*post -0.006 0.003 0.028* -0.018(0.009) (0.009) (0.014) (0.014)
No. observations 4167 4039 1951 2088
Absencespost 31.236*** 32.853*** 22.456*** 42.034***
(7.856) (9.078) (10.797) (10.764)treatment*post -17.299** -16.679* -4.713 -26.119**
(7.856) (9.078) (10.797) (10.764)
No. observations 3980 3868 1871 1997
Serbianb
post 0.039 0.046 0.079 0.027(0.060) (0.048) (0.055) (0.050)
treatment*post 0.044 0.012 -0.035 0.058(0.069) (0.066) (0.075) (0.080)
Mathematicsb
post 0.051 0.065 0.096 0.041(0.069) (0.062) (0.080) (0.056)
treatment*post 0.046 0.030 0.015 0.053(0.081) (0.077) (0.091) (0.085)
No. observations 4085 3961 1916 2045
Controlsc No Yes Yes YesSchool FE No Yes Yes Yes
This table reports the effect of the programme on dropouts, absences andSerbian and mathematics. Robust standard errors corrected for clusteringat the school level are reported in parentheses: * significant at 10%, **significant at 5%, *** significant at 1%.
a Dropout is equal to 1 if child dropped out of school during the year; otherwise0.
b Marks range from 1 (worst) to 5 (best). They are categorical.c Controls included are school size, school size squared, number of Roma in
school, number of Roma in school squared, percentage of Roma per class,class size, class size squared, female (=1), age, age squared, and migrant(=1).
23
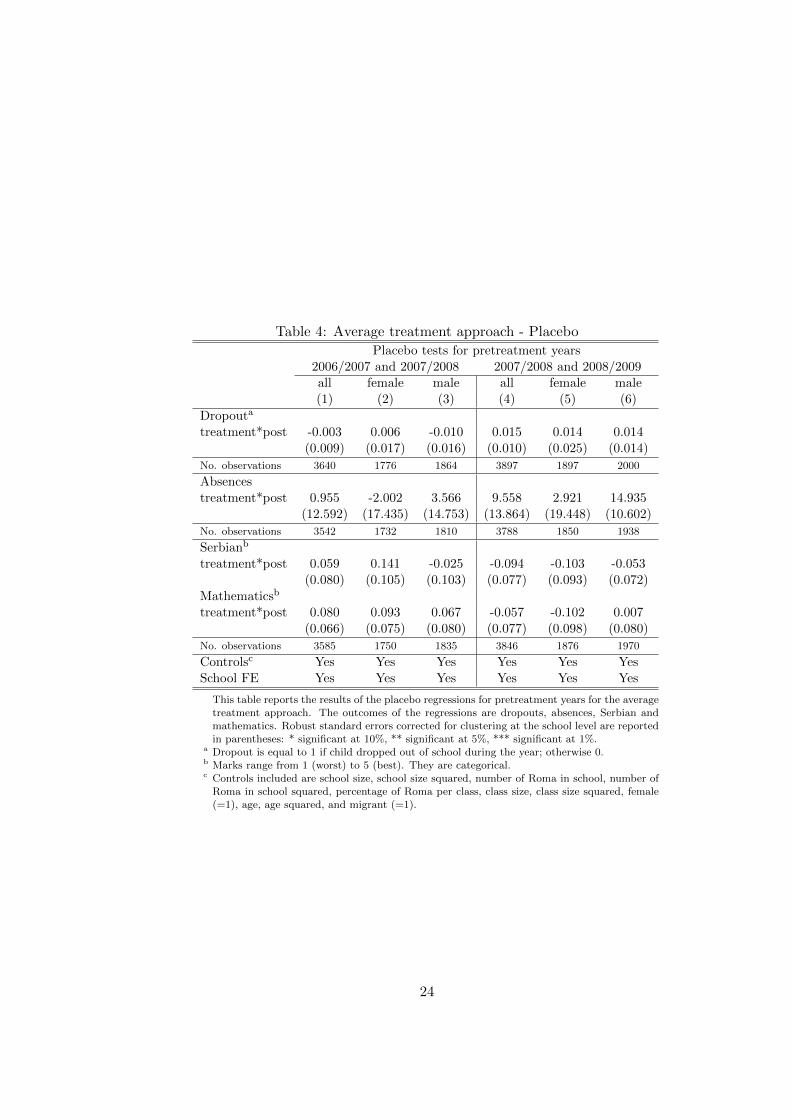
Table 4: Average treatment approach - Placebo
Placebo tests for pretreatment years2006/2007 and 2007/2008 2007/2008 and 2008/2009all female male all female male(1) (2) (3) (4) (5) (6)
Dropouta
treatment*post -0.003 0.006 -0.010 0.015 0.014 0.014(0.009) (0.017) (0.016) (0.010) (0.025) (0.014)
No. observations 3640 1776 1864 3897 1897 2000
Absencestreatment*post 0.955 -2.002 3.566 9.558 2.921 14.935
(12.592) (17.435) (14.753) (13.864) (19.448) (10.602)
No. observations 3542 1732 1810 3788 1850 1938
Serbianb
treatment*post 0.059 0.141 -0.025 -0.094 -0.103 -0.053(0.080) (0.105) (0.103) (0.077) (0.093) (0.072)
Mathematicsb
treatment*post 0.080 0.093 0.067 -0.057 -0.102 0.007(0.066) (0.075) (0.080) (0.077) (0.098) (0.080)
No. observations 3585 1750 1835 3846 1876 1970
Controlsc Yes Yes Yes Yes Yes YesSchool FE Yes Yes Yes Yes Yes Yes
This table reports the results of the placebo regressions for pretreatment years for the averagetreatment approach. The outcomes of the regressions are dropouts, absences, Serbian andmathematics. Robust standard errors corrected for clustering at the school level are reportedin parentheses: * significant at 10%, ** significant at 5%, *** significant at 1%.
a Dropout is equal to 1 if child dropped out of school during the year; otherwise 0.b Marks range from 1 (worst) to 5 (best). They are categorical.c Controls included are school size, school size squared, number of Roma in school, number of
Roma in school squared, percentage of Roma per class, class size, class size squared, female(=1), age, age squared, and migrant (=1).
24
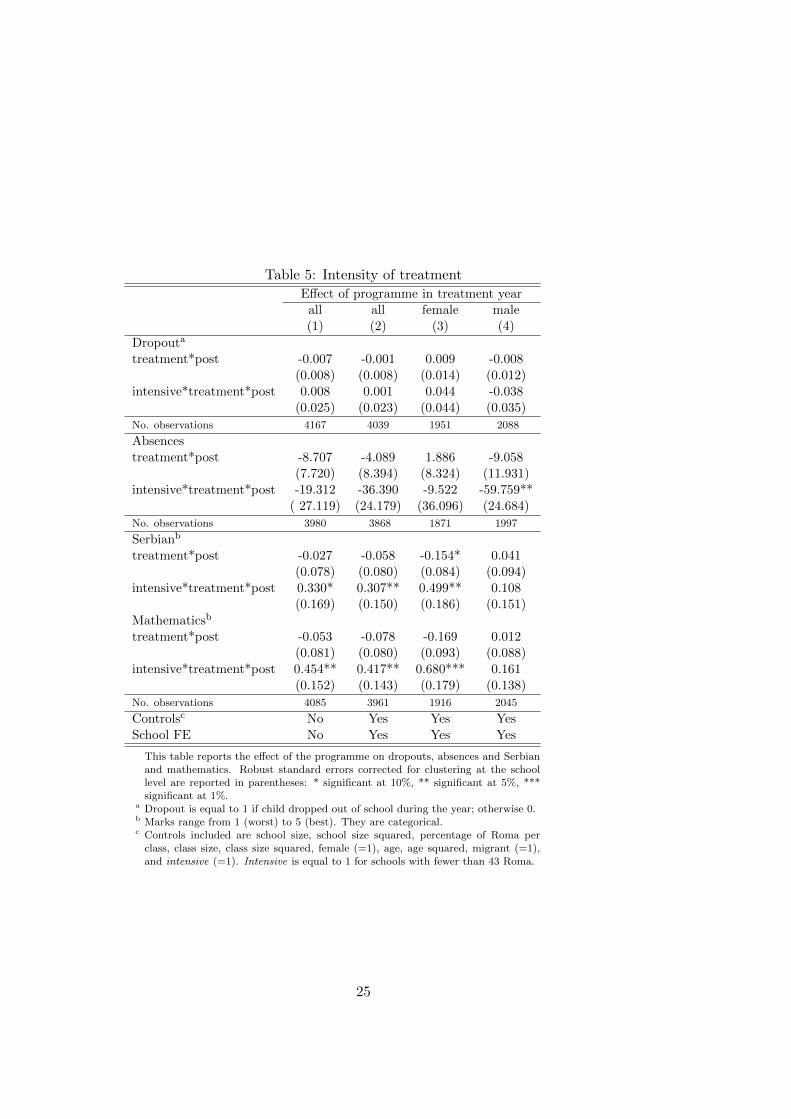
Table 5: Intensity of treatment
Effect of programme in treatment yearall all female male(1) (2) (3) (4)
Dropouta
treatment*post -0.007 -0.001 0.009 -0.008(0.008) (0.008) (0.014) (0.012)
intensive*treatment*post 0.008 0.001 0.044 -0.038(0.025) (0.023) (0.044) (0.035)
No. observations 4167 4039 1951 2088
Absencestreatment*post -8.707 -4.089 1.886 -9.058
(7.720) (8.394) (8.324) (11.931)intensive*treatment*post -19.312 -36.390 -9.522 -59.759**
( 27.119) (24.179) (36.096) (24.684)
No. observations 3980 3868 1871 1997
Serbianb
treatment*post -0.027 -0.058 -0.154* 0.041(0.078) (0.080) (0.084) (0.094)
intensive*treatment*post 0.330* 0.307** 0.499** 0.108(0.169) (0.150) (0.186) (0.151)
Mathematicsb
treatment*post -0.053 -0.078 -0.169 0.012(0.081) (0.080) (0.093) (0.088)
intensive*treatment*post 0.454** 0.417** 0.680*** 0.161(0.152) (0.143) (0.179) (0.138)
No. observations 4085 3961 1916 2045
Controlsc No Yes Yes YesSchool FE No Yes Yes Yes
This table reports the effect of the programme on dropouts, absences and Serbianand mathematics. Robust standard errors corrected for clustering at the schoollevel are reported in parentheses: * significant at 10%, ** significant at 5%, ***significant at 1%.
a Dropout is equal to 1 if child dropped out of school during the year; otherwise 0.b Marks range from 1 (worst) to 5 (best). They are categorical.c Controls included are school size, school size squared, percentage of Roma per
class, class size, class size squared, female (=1), age, age squared, migrant (=1),and intensive (=1). Intensive is equal to 1 for schools with fewer than 43 Roma.
25
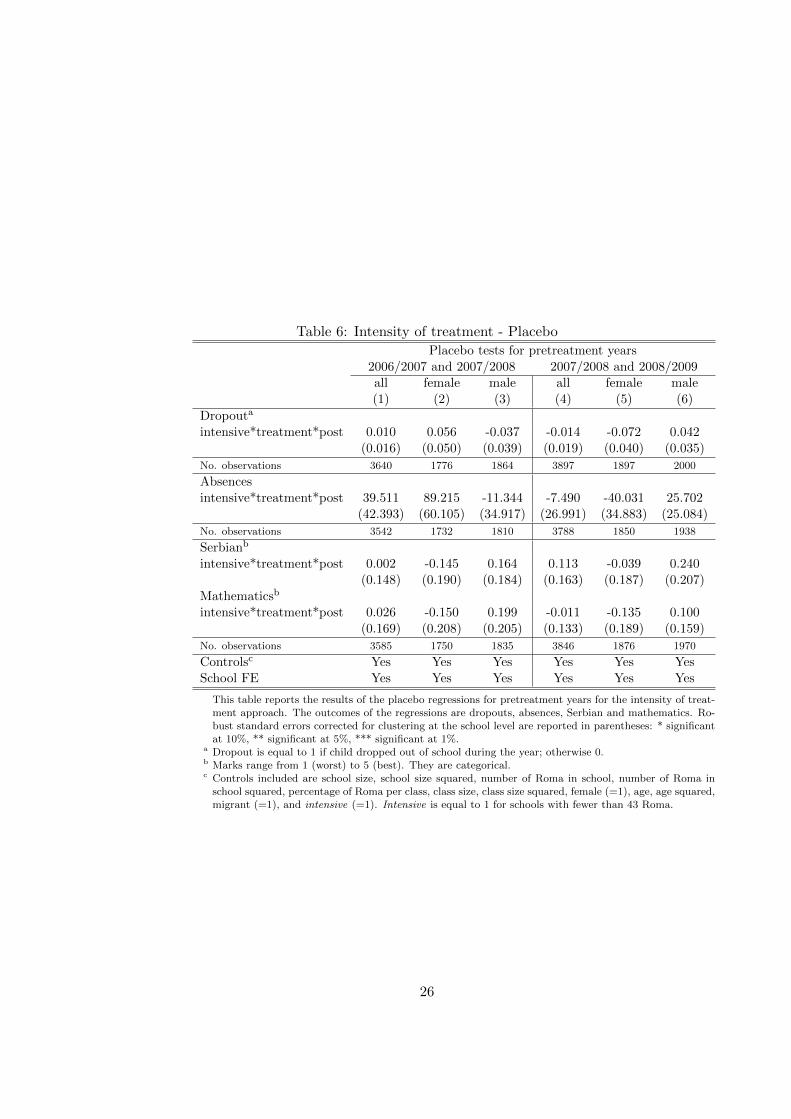
Table 6: Intensity of treatment - Placebo
Placebo tests for pretreatment years2006/2007 and 2007/2008 2007/2008 and 2008/2009all female male all female male(1) (2) (3) (4) (5) (6)
Dropouta
intensive*treatment*post 0.010 0.056 -0.037 -0.014 -0.072 0.042(0.016) (0.050) (0.039) (0.019) (0.040) (0.035)
No. observations 3640 1776 1864 3897 1897 2000
Absencesintensive*treatment*post 39.511 89.215 -11.344 -7.490 -40.031 25.702
(42.393) (60.105) (34.917) (26.991) (34.883) (25.084)
No. observations 3542 1732 1810 3788 1850 1938
Serbianb
intensive*treatment*post 0.002 -0.145 0.164 0.113 -0.039 0.240(0.148) (0.190) (0.184) (0.163) (0.187) (0.207)
Mathematicsb
intensive*treatment*post 0.026 -0.150 0.199 -0.011 -0.135 0.100(0.169) (0.208) (0.205) (0.133) (0.189) (0.159)
No. observations 3585 1750 1835 3846 1876 1970
Controlsc Yes Yes Yes Yes Yes YesSchool FE Yes Yes Yes Yes Yes Yes
This table reports the results of the placebo regressions for pretreatment years for the intensity of treat-ment approach. The outcomes of the regressions are dropouts, absences, Serbian and mathematics. Ro-bust standard errors corrected for clustering at the school level are reported in parentheses: * significantat 10%, ** significant at 5%, *** significant at 1%.
a Dropout is equal to 1 if child dropped out of school during the year; otherwise 0.b Marks range from 1 (worst) to 5 (best). They are categorical.c Controls included are school size, school size squared, number of Roma in school, number of Roma in
school squared, percentage of Roma per class, class size, class size squared, female (=1), age, age squared,migrant (=1), and intensive (=1). Intensive is equal to 1 for schools with fewer than 43 Roma.
26
Tab
le7:
Coh
ort
regr
essi
on
Eff
ect
ofp
rogr
amm
ein
trea
tmen
tye
ar
all
fem
ale
mal
eE
arly
Lat
eA
llE
arly
Lat
eA
llE
arly
Late
All
Enro
llee
sE
nro
llee
sE
nro
llee
sE
nro
llee
sE
nro
llee
sE
nro
llee
s(1
)(2
)(3
)(4
)(5
)(6
)(7
)(8
)(9
)
Dro
pou
ta
young*
pos
t0.
014
0.07
9***
0.0
80***
0.031
0.07
1**
*0.
077
***
-0.0
030.
087**
*0.0
83***
(0.0
13)
(0.0
19)
(0.0
18)
(0.0
20)
(0.0
19)
(0.0
18)
(0.0
12)
(0.0
28)
(0.0
28)
young*
pos
t*tr
eatm
ent
-0.0
66***
-0.0
47*
-0.0
87***
(0.0
22)
(0.0
27)
(0.0
29)
No.
obse
rvat
ions
2438
1601
4039
1200
751
195
112
38850
208
8
Abse
nce
syo
ung*
pos
t23
.579
*57
.493
**54.
639**
40.
707**
67.6
18*
*67.
603**
9.74
052
.423
**
49.4
80*
*(1
1.53
7)(2
1.26
3)(2
2.23
5)
(16.
000)
(28.
938)
(26.
469
)(1
4.055
)(2
2.03
6)(2
4.287
)yo
ung*
pos
t*tr
eatm
ent
-31.
867
-28.
524
-40.
337
(24.
945
)(3
0.77
2)
(27.
852)
No.
obse
rvat
ions
2336
1532
3868
1152
719
187
111
84813
199
7
Ser
bia
nb
young*
pos
t0.
079
-0.2
55**
-0.3
00**
*0.0
52-0
.284
-0.3
52**
0.10
1-0
.295
*-0
.328*
*(0
.102
)(0
.104
)(0
.101)
(0.1
13)
(0.1
73)
(0.1
70)
(0.1
61)
(0.1
54)
(0.1
39)
young*
pos
t*tr
eatm
ent
0.3
82**
0.41
6*
0.4
23*
(0.1
49)
(0.2
15)
(0.2
12)
Mat
hem
atic
sb
young*
pos
t0.
082
-0.2
41-0
.291*
-0.0
19
-0.3
44
-0.4
26*
0.1
80-0
.205
-0.2
39*
(0.1
16)
(0.1
43)
(0.1
52)
(0.1
32)
(0.2
34)
(0.2
41)
(0.1
55)
(0.1
42)
(0.1
35)
young*
pos
t*tr
eatm
ent
0.38
1*
0.4
280.4
12*
(0.1
94)
(0.2
79)
(0.2
07)
No.
obse
rvat
ions
2395
1567
3962
1180
736
191
612
15831
204
6
Con
trol
scY
esY
esY
esY
esY
esY
esY
esY
esY
esSch
ool
FE
Yes
Yes
Yes
Yes
Yes
Yes
Yes
Yes
Yes
This
table
rep
ort
sth
eeff
ect
of
the
pro
gra
mm
eon
dro
pouts
,abse
nce
s,Ser
bia
nand
math
emati
cs,
usi
ng
the
cohort
com
pari
son
met
hodolo
gy.
Robust
standard
erro
rsco
rrec
ted
for
clust
erin
gat
the
school
level
are
rep
ort
edin
pare
nth
eses
:*
signifi
cant
at
10%
,**
signifi
cant
at
5%
,***
signifi
cant
at
1%
.a
Dro
pout
iseq
ual
to1
ifch
ild
dro
pp
edout
of
school
duri
ng
the
yea
r;oth
erw
ise
0.
bM
ark
sra
nge
from
1(w
ors
t)to
5(b
est)
.T
hey
are
cate
gori
cal.
cC
ontr
ols
incl
uded
are
school
size
,sc
hool
size
square
d,
num
ber
of
Rom
ain
school,
num
ber
of
Rom
ain
school
square
d,
per
centa
ge
of
Rom
ap
ercl
ass
,cl
ass
size
,cl
ass
size
square
d,
fem
ale
(=1),
age,
age
square
d,
mig
rant
(=1)
and
you
ng
(=1).
Yo
un
gis
equal
to1
when
the
child
isat
the
firs
tgra
de.
27
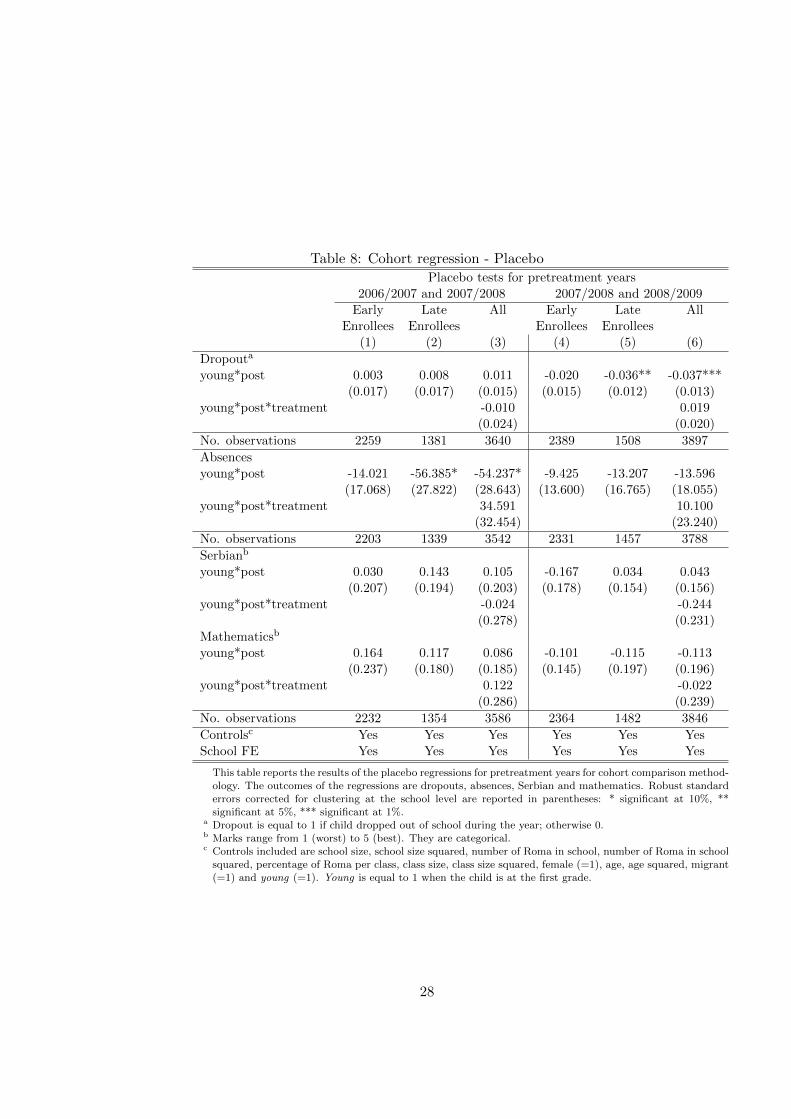
Table 8: Cohort regression - Placebo
Placebo tests for pretreatment years2006/2007 and 2007/2008 2007/2008 and 2008/2009
Early Late All Early Late AllEnrollees Enrollees Enrollees Enrollees
(1) (2) (3) (4) (5) (6)
Dropouta
young*post 0.003 0.008 0.011 -0.020 -0.036** -0.037***(0.017) (0.017) (0.015) (0.015) (0.012) (0.013)
young*post*treatment -0.010 0.019(0.024) (0.020)
No. observations 2259 1381 3640 2389 1508 3897
Absencesyoung*post -14.021 -56.385* -54.237* -9.425 -13.207 -13.596
(17.068) (27.822) (28.643) (13.600) (16.765) (18.055)young*post*treatment 34.591 10.100
(32.454) (23.240)
No. observations 2203 1339 3542 2331 1457 3788
Serbianb
young*post 0.030 0.143 0.105 -0.167 0.034 0.043(0.207) (0.194) (0.203) (0.178) (0.154) (0.156)
young*post*treatment -0.024 -0.244(0.278) (0.231)
Mathematicsb
young*post 0.164 0.117 0.086 -0.101 -0.115 -0.113(0.237) (0.180) (0.185) (0.145) (0.197) (0.196)
young*post*treatment 0.122 -0.022(0.286) (0.239)
No. observations 2232 1354 3586 2364 1482 3846
Controlsc Yes Yes Yes Yes Yes YesSchool FE Yes Yes Yes Yes Yes Yes
This table reports the results of the placebo regressions for pretreatment years for cohort comparison method-ology. The outcomes of the regressions are dropouts, absences, Serbian and mathematics. Robust standarderrors corrected for clustering at the school level are reported in parentheses: * significant at 10%, **significant at 5%, *** significant at 1%.
a Dropout is equal to 1 if child dropped out of school during the year; otherwise 0.b Marks range from 1 (worst) to 5 (best). They are categorical.c Controls included are school size, school size squared, number of Roma in school, number of Roma in school
squared, percentage of Roma per class, class size, class size squared, female (=1), age, age squared, migrant(=1) and young (=1). Young is equal to 1 when the child is at the first grade.
28
6 Figures
Figure 1: Location of the schools with assistantsThis figure reports the distribution of schools in our sample. In pink munic-ipalities there are only Early Enrollee school; in green municipalities thereare only Late Enrollee school and in dark blue municipalities there are bothEarly and Late Enrollee schools.
29
A Appendix
A.1 Institutional Setting
A.1.1 Living conditions of Roma in Serbia
Data on Roma in Serbia are inaccurate and scarce. Surveys often lack infor-mation about ethnic identity of the respondents. More importantly, whenasked about their ethnicity, some Roma people do not declare themselves asRoma. Most of them consider themselves both Roma and Serbian and thequestion of nationality allows only one answer.
The official 2002 census counts 108,000 Roma, while estimates put for-ward a number between 350,000 and 500,000 or approximately 5-7% of theoverall population (Open Society Institute, 2007). Most Roma live in seg-regated settlements and have different demographic characteristics from therest of the population. According to the World Bank Living Standard Mea-surement Survey (LSMS) 2003 - which provides a boosted sample of Romain Serbia - their households are more numerous than the average household,they have more children and their population is younger. The percentage ofmale Roma who declare to have worked over the last week is similar to thenational average (69%). Contrary to men, the participation of females is34% and considerably lower than the national average (53%). Overall, ap-proximately 60% of Roma have a consumption below the poverty line andweekly consumption of food per household member in Roma households ishalf the national average.
Turning to education, 60% of Roma younger than 18 years old have notcompleted primary education. In contrast, only 20% of overall populationdo not have a primary school diploma. Out of all children of primary school-age, 30% of Roma do not attend school whereas this is the case for only 1% ofthe overall population of primary school-age. Using data from the NationalAssessment Study conducted with third grade students, Baucal (2009) findsthat after the first 3 years of school Roma pupils lag 2.2 - 2.5 years behindthe average student. Also, children from Roma ethnic minority performedworse on standardised tests than Non Roma children with the same socio-economic background.
The main barriers of access to education for Roma are absence of doc-uments, financial constraints, parents’ low educational background, childlabour, discrimination from teachers and pupils and language barriers (OpenSociety Institute, 2008). In the recent years Serbian schools started enrollingchildren with incomplete documents, but there is still a minor number ofchildren not able to enrol due to lack of documents. According to the law,the local government should inform schools and parents that children whoreach the school-age in the municipality have to enrol at school. But Romaare often not regularly registered as residents in the municipality and thelocal government is not able to reach out to them. School books and addi-
30
tional school material are a significant burden for the budget of poor familiesand the most poor among Roma children do not even own adequate clothingfor winter months and live in overcrowded homes where they do not haveadequate conditions to pursue their studies. A majority of Roma parentshas low educational attainment and this implies that they often cannot helptheir children with their school work. In addition, some parents attach littlevalue to schooling and education. These reasons together imply that theperceived benefits of going to school are lower than respective costs. More-over, in some cases Roma children help their parents in their work. Also,Roma pupils can face discrimination from teachers and other pupils. Thereis anecdotal evidence that they are often seated in the last row in classrooms,that teachers do not read their homework and that teachers do not encour-age them in their studies. Another problematic issue is that a considerableshare of them is sent to special schools. Finally, in a survey conducted byUNICEF - Multiple Indicator Cluster Survey, 2006 - only 10% of Roma de-clare Serbian to be their mother tongue. Children may face difficulties atschool due to limited knowledge of Serbian.34
A.1.2 Primary Education System in Serbia
In Serbia, school is compulsory until age 15. Children enrol at primaryschool if they are aged at least 6.5 years at the start of the scholastic yearin September. Since 2007 the attendance of at least 6 months of a cost-freepreschool programme is compulsory; in 2010 the length of the compulsorypreschool has been extended to 9 months.35
Primary school consists of 8 years. In the first four grades pupils getone teacher who teaches all compulsory subjects except English, while inthe upper four years pupils have one teacher per subject. In the first gradeteachers use descriptive marks; from the second grade on, the range of marksis 1 to 5 with 1 being the insufficient and worst mark. The marks arecategorical. During each semester, a child gets 4 marks for each subject.Out of the 4 marks, at least 2 marks are derived from written tests. Theteacher can decide what to use as assessment for the remaining two marks.He could give additional written tests, give marks based on oral examination,homework or class participation. The final mark at the end of the year isthe arithmetic mean of 8 marks. If a pupil gets at least one insufficient markat the end of the year, her teacher can decide whether to let her pass to theupper grade or to ask her to take the retake exam in August. In the last few
34With few exceptions, the rest declare Romani to be their mother tongue.35The obligatory preschool programme has been introduced in order to facilitate the
transition to school for children from lower socio-economic backgrounds. In the initialyears the capacities of preschool institutions were not sufficient to enrol all preschoolchildren. Hence, some children, mainly from poorer families or in rural areas, could notbe enrolled in preschool. However, due to the lack in the enforcement of the law, they werelet to enrol in school also without having attended the compulsory preschool programme.
31
years the Ministry of Education has suggested that schools reduce repetitionrates, especially in the lower four grades.
There are no school fees for primary school, but indirect costs such asbooks and other school material can pose a considerable cost for some par-ents.36 The Ministry of Education aims at reducing the cost of educationand the first graders in 2009/2010 are the first generation to receive free textbooks. The plan is that this generation and all younger generations obtainfree school books in the future.
A.2 Sensitivity analysis of the threshold of intensity of treat-ment
In the main body of this paper, we examine how the effect of the programmevaries based on the number of Roma in a school. We split the schools in twoequally sized groups based on the number of Roma in the school. We definea dummy ‘intensive’ which takes value 1 if a school is among schools withless Roma (at most 43 Roma children), and value 0 if a school is amongschools with more Roma (more than 43 Roma children). In this section wereport how our results change when we vary this threshold.
Table 9 shows the results of the intensity of treatment approach fordifferent thresholds. We rank the schools based on the number of Roma,starting with the lowest, and divide then the schools in 10 deciles. Column(1) of the table reports the results if we set the dummy ‘intensive’ equalto 1 for schools in the first decile and 0 otherwise. In column (2) we setthe dummy ‘intensive’ equal to 1 for schools in the first and second decile,and 0 otherwise, etc. The reported coefficient (intensive*treatment*post)captures the effect of the programme on treated children in schools wherethe programme is ‘intensive’. Essentially, going from the left to the rightcolumns we increase the number of schools and thus the number children forwhich we consider the programme to be ‘intensive’. For instance, in column(1) children in schools with less than 16 Roma are considered to be treated.In column (2) this number rises to 23 Roma per school, etc. We expect thatthe effect of the programme drops as we go from left to the right columnsand this is exactly what this table shows. The results in table 9 are onlyindicative and should be interepreted with caution especially for the lowerdeciles. For lower deciles we consider only very few schools to be actuallytreated (in the case of column (1) only one treated school falls into the firstdecile).
36On average, in Serbia costs associated with school (books and other school material)correspond to almost 2% of yearly household income (LSMS 2003). Based on a surveywe conducted in Belgrade, for Roma people these costs account for 6% of their yearlyhousehold income.
32
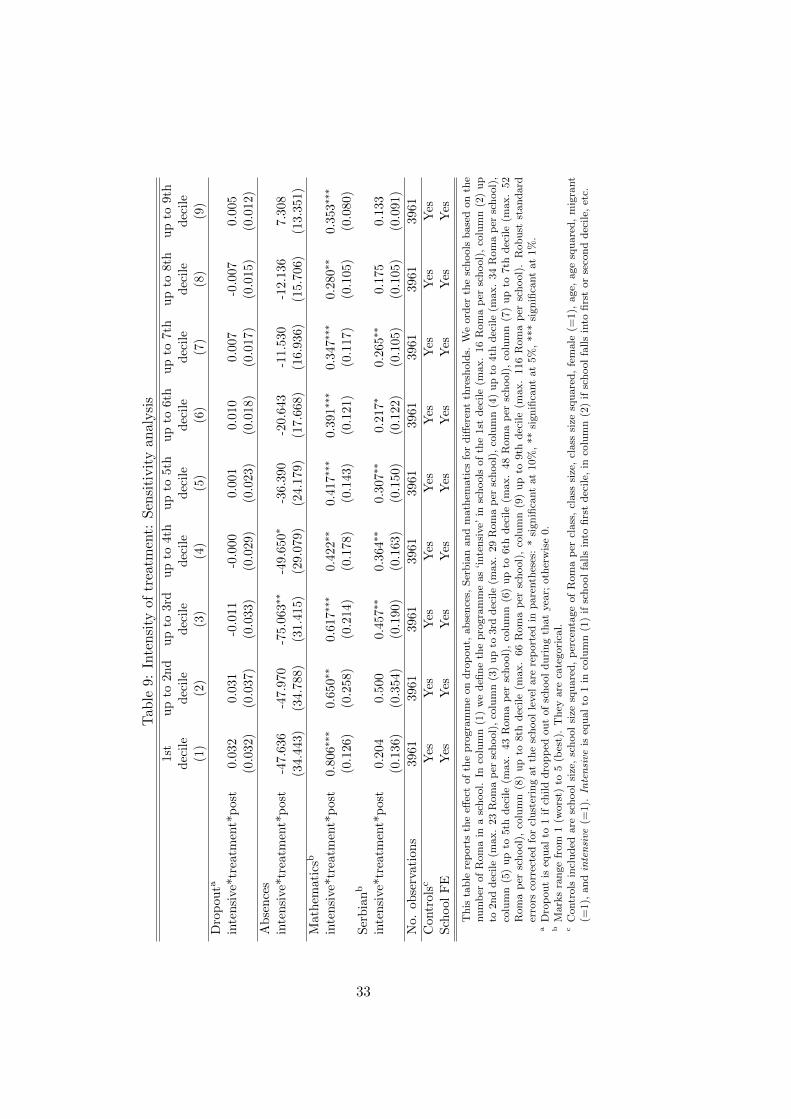
Tab
le9:
Inte
nsi
tyof
trea
tmen
t:S
ensi
tivit
yan
alysi
s
1st
up
to2n
dup
to3r
du
pto
4th
up
to5t
hup
to6t
hup
to7th
up
to8th
up
to9th
dec
ile
dec
ile
dec
ile
dec
ile
dec
ile
dec
ile
dec
ile
dec
ile
dec
ile
(1)
(2)
(3)
(4)
(5)
(6)
(7)
(8)
(9)
Dro
pouta
inte
nsi
ve*t
reat
men
t*p
ost
0.03
20.
031
-0.0
11-0
.000
0.00
10.
010
0.00
7-0
.007
0.00
5(0
.032
)(0
.037
)(0
.033
)(0
.029
)(0
.023
)(0
.018
)(0
.017)
(0.0
15)
(0.0
12)
Abse
nce
sin
tensi
ve*t
reat
men
t*p
ost
-47.
636
-47.9
70-7
5.06
3∗∗
-49.
650∗
-36.
390
-20.
643
-11.5
30-1
2.13
67.3
08(3
4.44
3)(3
4.78
8)(3
1.41
5)(2
9.0
79)
(24.
179)
(17.
668)
(16.
936)
(15.7
06)
(13.
351)
Mat
hem
atic
sb
inte
nsi
ve*t
reat
men
t*p
ost
0.80
6∗∗∗
0.65
0∗∗
0.61
7∗∗∗
0.42
2∗∗
0.41
7∗∗∗
0.39
1∗∗∗
0.34
7∗∗∗
0.28
0∗∗
0.3
53∗∗∗
(0.1
26)
(0.2
58)
(0.2
14)
(0.1
78)
(0.1
43)
(0.1
21)
(0.1
17)
(0.1
05)
(0.0
80)
Ser
bia
nb
inte
nsi
ve*tr
eatm
ent*
pos
t0.
204
0.50
00.
457∗∗
0.36
4∗∗
0.30
7∗∗
0.21
7∗0.
265∗∗
0.17
50.
133
(0.1
36)
(0.3
54)
(0.1
90)
(0.1
63)
(0.1
50)
(0.1
22)
(0.1
05)
(0.1
05)
(0.0
91)
No.
obse
rvat
ions
3961
396
139
6139
6139
6139
6139
6139
6139
61
Con
trol
scY
esY
esY
esY
esY
esY
esY
esY
esY
esSch
ool
FE
Yes
Yes
Yes
Yes
Yes
Yes
Yes
Yes
Yes
This
table
rep
ort
sth
eeff
ect
of
the
pro
gra
mm
eon
dro
pout,
abse
nce
s,Ser
bia
nand
math
emati
csfo
rdiff
eren
tth
resh
old
s.W
eord
erth
esc
hools
base
don
the
num
ber
of
Rom
ain
asc
hool.
Inco
lum
n(1
)w
edefi
ne
the
pro
gra
mm
eas
‘inte
nsi
ve’
insc
hools
of
the
1st
dec
ile
(max.
16
Rom
ap
ersc
hool)
,co
lum
n(2
)up
to2nd
dec
ile
(max.
23
Rom
ap
ersc
hool)
,co
lum
n(3
)up
to3rd
dec
ile
(max.
29
Rom
ap
ersc
hool)
,co
lum
n(4
)up
to4th
dec
ile
(max.
34
Rom
ap
ersc
hool)
,co
lum
n(5
)up
to5th
dec
ile
(max.
43
Rom
ap
ersc
hool)
,co
lum
n(6
)up
to6th
dec
ile
(max.
48
Rom
ap
ersc
hool)
,co
lum
n(7
)up
to7th
dec
ile
(max.
52
Rom
ap
ersc
hool)
,co
lum
n(8
)up
to8th
dec
ile
(max.
66
Rom
ap
ersc
hool)
,co
lum
n(9
)up
to9th
dec
ile
(max.
116
Rom
ap
ersc
hool)
.R
obust
standard
erro
rsco
rrec
ted
for
clust
erin
gat
the
school
level
are
rep
ort
edin
pare
nth
eses
:*
signifi
cant
at
10%
,**
signifi
cant
at
5%
,***
signifi
cant
at
1%
.a
Dro
pout
iseq
ual
to1
ifch
ild
dro
pp
edout
of
school
duri
ng
that
yea
r;oth
erw
ise
0.
bM
ark
sra
nge
from
1(w
ors
t)to
5(b
est)
.T
hey
are
cate
gori
cal.
cC
ontr
ols
incl
uded
are
school
size
,sc
hool
size
square
d,
per
centa
ge
of
Rom
ap
ercl
ass
,cl
ass
size
,cl
ass
size
square
d,
fem
ale
(=1),
age,
age
square
d,
mig
rant
(=1),
and
inte
nsi
ve(=
1).
Inte
nsi
veis
equal
to1
inco
lum
n(1
)if
school
falls
into
firs
tdec
ile,
inco
lum
n(2
)if
school
falls
into
firs
tor
seco
nd
dec
ile,
etc.
33
Tab
le10:
Balan
cing
tables
forin
tensity
oftream
ent
app
roachfor
pre-
and
treatmen
tyear
Pre-treatm
ent
yearT
reatmen
tyear
Early
Late
Diff
erence
Early
Late
Diff
erence
Enrollees
(1)
En
rollees(2)
(1-2)(3
)E
nrollees
(1)E
nrollees
(2)(1-2)
(3)
Dro
pou
ta:
Less
Rom
a0.01
50.0
26-0.011
0.035
0.0
440.009
(0.016)
(0.026)M
ore
Rom
a0.02
10.0
19
-0.0020.02
30.0
33-0.010
(0.007)
(0.010)A
bsen
ces(h
ours):
Less
Rom
a143
.691
146.39
9-2.708
141.22
0171
.947
-30.727(33.53
0)(39.283
)M
oreR
om
a10
9.8
0012
0.637-10
.837
131.58
3151
.127
-19.544(13.64
8)(18.262)
Serb
ianb:
Less
Rom
a2.52
92.6
13-0.084
2.680
2.4
610.219
(0.234)
(0.212)M
ore
Rom
a2.39
72.5
31
-0.1352.43
62.5
98-0.162
(0.147)
(0.167)M
ath
ematics
b:L
essR
om
a2.38
02.5
13-0.133
2.549
2.2
810.268
(0.219)
(0.213)M
ore
Rom
a2.25
22.3
37
-0.0852.30
52.4
43-0.138
(0.151)
(0.182)
This
table
reports
the
results
ofbala
ncin
gtests
for
pretrea
tmen
tand
treatm
ent
yea
rfo
rth
ein
tensity
oftrea
tmen
tappro
ach
.R
obust
standard
errors
corrected
for
clusterin
gat
the
school
level
are
reported
inparen
theses:
*sig
nifi
cant
at
10%
,**
signifi
cant
at
5%
,***
signifi
cant
at
1%
.a
Dro
pout
iseq
ual
to1
ifch
ilddro
pp
edout
of
school
durin
gth
at
yea
r;oth
erwise
0.
bM
ark
sra
nge
from
1(w
orst)
to5
(best).
They
are
categ
orica
l.
34
A.3 Cost of the programme
This section aims to give an estimate of the cost of the programme and tocontrast this programme to alternative interventions available to the gov-ernment. At this early stage of the programme it is not possible to pro-vide an estimate of the monetary benefits. Still, we discuss two possiblechannels through which this programme could affect future labour marketoutcomes and thus, could have a monetary gain. First, the programmecould raise completion rates of primary school and consequently, the aver-age educational attainment of treated Roma children. Higher educationalattainment implies higher earnings (Angrist and Krueger, 1991). We donot find that dropout rates fall, because in the lower 4 grades of primaryschool the dropout rates are already low. Primary school lasts 8 years andwe believe that dropout rates in the higher grade (from 5th to 8th) are theones actually affected by the programme. A second channel through whichthe programme could affect children’s labour market outcomes is throughbetter grades. Several studies (Murnane, Willett, and Levy, 1995; Nealand Johnson, 1996; Currie and Thomas, 1999) have demonstrated a posi-tive relationship between pupils’ test scores at school and their subsequentearnings.
The main cost of the programme are the (gross) wages of the assistantswhich amount to 450 Euros per month. In addition to that, in 2009/2010,assistants attended 7 trainings totalling up to 22 days. Our estimationsuggests that the training per assistant had a cost of approximately 1,200Euros.37 The turnover of the assistants in the first year was very low withonly two people quitting in that period. This is especially important becauseit indicates that training costs will not be bore each year. Not taking intoaccount the training costs, we calculate that the programme costed 100Euros per Roma student per year.38 We know that in Belgrade 53% of Romachildren were actually treated (Battaglia and Lebedinski, 2013), assumingthat the take up rate was the same also in the whole of Serbia, this yields acost of 200 Euros per treated child.
There are no cost estimates of other programmes in Serbia to which thisprogramme could be directly compared. We still discuss two other mea-sures which we consider alternatives to the RTA programme. One possible
37We calculate the cost for accommodation and stay during the training to be 40 Eurosper day plus transport costs of 10 Euros for 7 travels. This amounts to 950 Euros. Therewere 22 days of training and we add additional 14 days for preparation of training andreporting. The cost of trainers is 150 Euros per day and the wage cost is 5,400 Euros.Accommodation, stay and travel costs of trainers are 1,510 Euros (22 days*40 Euros+ 7 travels *10 Euros). Therefore, the total costs for trainers including their stay andaccommodation is 6,910. Dividing this sum with 26 (number of assistants) gives 265Euros per assistant. The cost of accommodation per assistant (950 Euros) plus trainingper assistant (265 Euros) adds up to a total cost of the training of 1,215 Euros.
38450 Euros *12 month [wages]* 23 schools /1268 Roma students = 97,95 Euros.
35
alternative would be to use professional teachers to give remedial educationclasses. The gross wage of teachers is in the range of 900 to 1,200 Eurosdepending on the experience and thus twice the amount paid to the assis-tants. Assuming that two assistants have at least the same performance asone teacher, the RTA programme is more cost effective. Aside from beingless costly, an additional advantage of RTAs is that they act as role modelsfor Roma children and this cannot be easily quantified in monetary terms.A second option available to the policy maker would be class size reduc-tion, but this intervention did not yield satisfactory results in some settings(Hoxby, 2000) and is a very costly intervention. Another disadvantage ofthe class size reduction is that it does not specifically target disadvantagedchildren.
All of these facts, taken together, indicate that the programme is with200 Euros per child per year not overly costly and that it also performs wellwith respect to its alternatives.
A.4 Spillover effects - Non Roma pupils
We can investigate whether this programme also affects Non Roma pupils.We employ both econometric strategies and their combination and find thatneither absences reduced nor marks improved for Non Roma students. Thepresence of a Roma assistant do not improve Non Roma schooling outcomes.Results are reported in tables 11 and 12.
These results, combined together with the previous ones, provide someevidence that the programme is succeeding in reducing the gap betweenRoma and Non Roma children, both in school achievements and attendance.
36
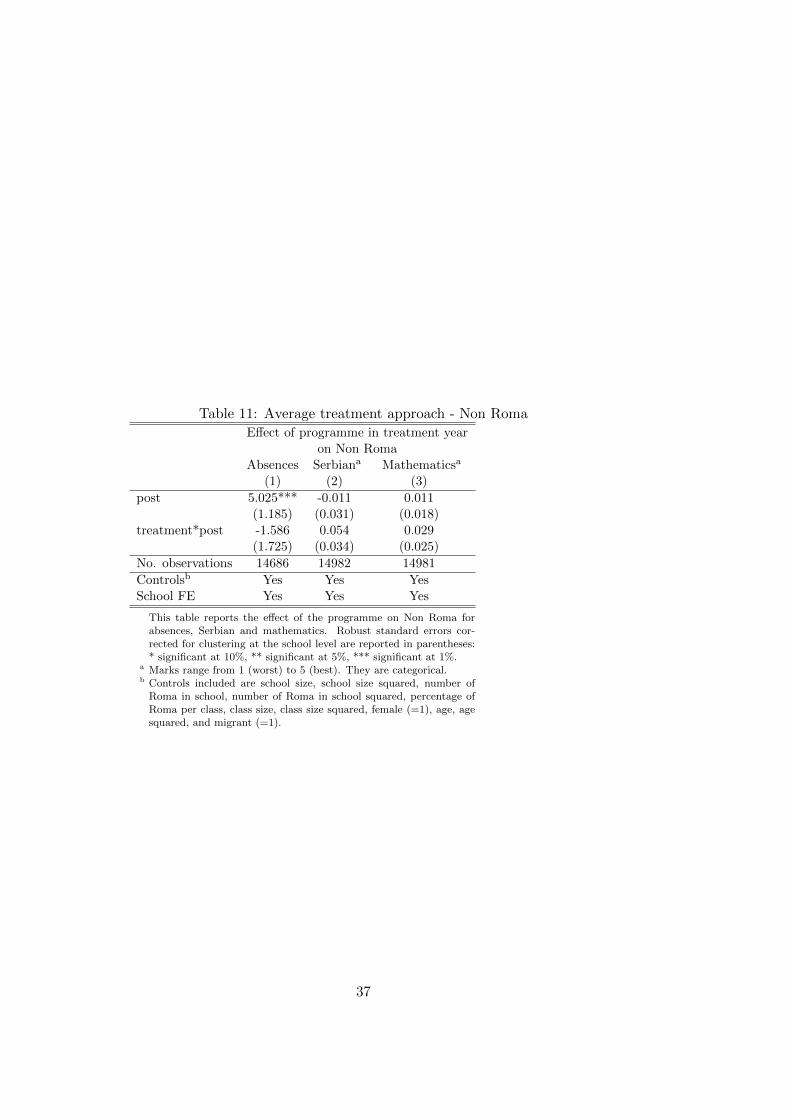
Table 11: Average treatment approach - Non Roma
Effect of programme in treatment yearon Non Roma
Absences Serbiana Mathematicsa
(1) (2) (3)
post 5.025*** -0.011 0.011(1.185) (0.031) (0.018)
treatment*post -1.586 0.054 0.029(1.725) (0.034) (0.025)
No. observations 14686 14982 14981
Controlsb Yes Yes YesSchool FE Yes Yes Yes
This table reports the effect of the programme on Non Roma forabsences, Serbian and mathematics. Robust standard errors cor-rected for clustering at the school level are reported in parentheses:* significant at 10%, ** significant at 5%, *** significant at 1%.
a Marks range from 1 (worst) to 5 (best). They are categorical.b Controls included are school size, school size squared, number of
Roma in school, number of Roma in school squared, percentage ofRoma per class, class size, class size squared, female (=1), age, agesquared, and migrant (=1).
37
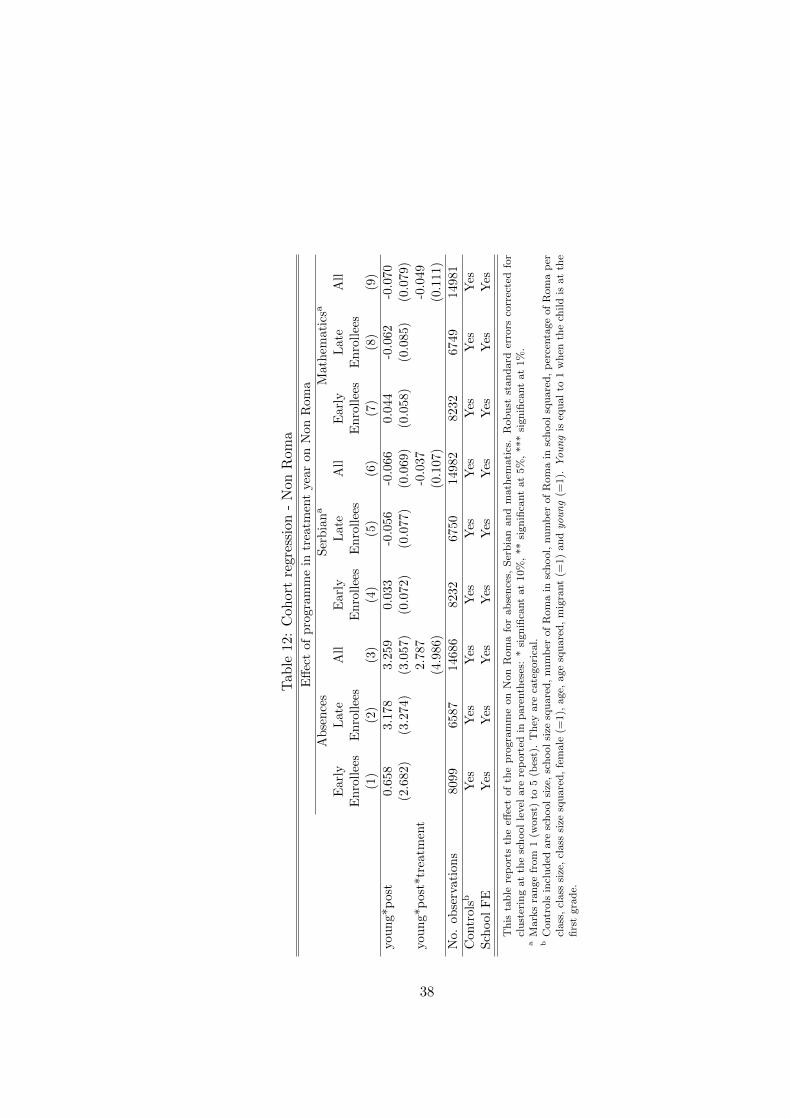
Tab
le12
:C
ohor
tre
gres
sion
-N
onR
oma
Eff
ect
ofp
rogra
mm
ein
trea
tmen
tye
aron
Non
Rom
aA
bse
nce
sS
erbia
na
Mat
hem
atic
sa
Ear
lyL
ate
All
Earl
yL
ate
All
Ear
lyL
ate
All
Enro
llee
sE
nro
llee
sE
nro
llee
sE
nro
llee
sE
nro
llee
sE
nro
llee
s(1
)(2
)(3
)(4
)(5
)(6
)(7
)(8
)(9
)
young*
pos
t0.
658
3.17
83.
259
0.03
3-0
.056
-0.0
660.
044
-0.0
62
-0.0
70(2
.682
)(3
.274
)(3
.057
)(0
.072
)(0
.077
)(0
.069
)(0
.058)
(0.0
85)
(0.0
79)
young*
pos
t*tr
eatm
ent
2.78
7-0
.037
-0.0
49(4
.986)
(0.1
07)
(0.1
11)
No.
obse
rvat
ions
8099
6587
14686
823
2675
014
982
823
267
49149
81
Con
trol
sbY
esY
esY
esY
esY
esY
esY
esY
esY
esSch
ool
FE
Yes
Yes
Yes
Yes
Yes
Yes
Yes
Yes
Yes
This
table
rep
ort
sth
eeff
ect
of
the
pro
gra
mm
eon
Non
Rom
afo
rabse
nce
s,Ser
bia
nand
math
emati
cs.
Robust
standard
erro
rsco
rrec
ted
for
clust
erin
gat
the
school
level
are
rep
ort
edin
pare
nth
eses
:*
signifi
cant
at
10%
,**
signifi
cant
at
5%
,***
signifi
cant
at
1%
.a
Mark
sra
nge
from
1(w
ors
t)to
5(b
est)
.T
hey
are
cate
gori
cal.
bC
ontr
ols
incl
uded
are
school
size
,sc
hool
size
square
d,
num
ber
of
Rom
ain
school,
num
ber
of
Rom
ain
school
square
d,
per
centa
ge
of
Rom
ap
ercl
ass
,cl
ass
size
,cl
ass
size
square
d,
fem
ale
(=1),
age,
age
square
d,
mig
rant
(=1)
and
you
ng
(=1).
Yo
un
gis
equal
to1
when
the
child
isat
the
firs
tgra
de.
38
ISSN 1379-244X D/2014/3082/21